financial strategies to improve operational performance€“ housekeeping, maintenance - square...
TRANSCRIPT
Financial Strategies to Improve Operational Performance
February 21, 2014
Kevin T Stringer – Assistant Vice President
HealthTech Management Services
Presentation Outline
• Productivity Monitoring – Achieving Results – Template Buy vs. Build
• Controlling Non-Salary Expenses – Supplies, Capital Costs
• Performance Improvement Plans – Developing, Implementing, Monitoring – Template Example
One area in hospital operations that has gone largely untouched is reducing the cost of delivering safe, quality health care.
This is where new thinking about workforce
productivity, case management, and lean processes and policies can reduce the cost of running a hospital. Hospital leaders can transform their organizations into leaner, faster and better organizations—with sustainable improvements.
Source: How to Make Productivity Gains Possible and Profitable Shawna O'Neill and Cary Gutbezahl, M.D. - June 28, 2010 in HHN Magazine online site.
PRODUCTIVITY MONITORING AND
IMPROVEMENT
Hospital leaders often fear that efforts to improve productivity will alienate staff or lessen quality.
Including all stakeholders, redesigning processes
and working toward national benchmarks will ensure that productivity improvements stick.
Source: How to Make Productivity Gains Possible and Profitable Shawna O'Neill and Cary Gutbezahl, M.D. - June 28, 2010 in HHN Magazine online site.
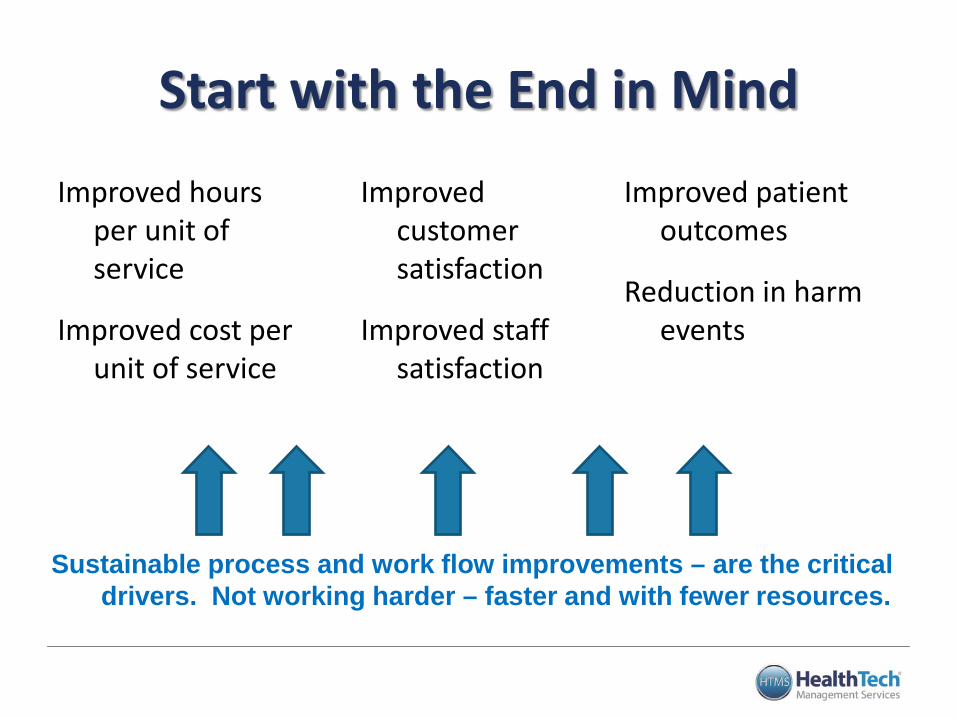
Start with the End in Mind
Improved hours per unit of service
Improved cost per unit of service
Improved patient outcomes
Reduction in harm events
Improved customer satisfaction
Improved staff satisfaction
Sustainable process and work flow improvements – are the critical drivers. Not working harder – faster and with fewer resources.
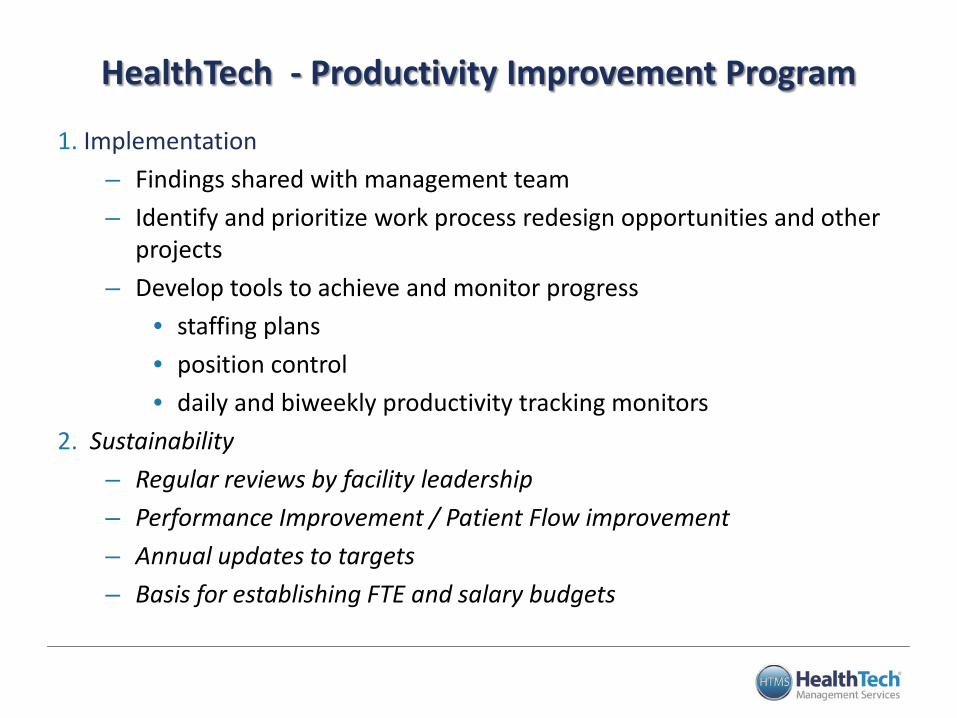
HealthTech - Productivity Improvement Program
1. Implementation – Findings shared with management team – Identify and prioritize work process redesign opportunities and other
projects – Develop tools to achieve and monitor progress
• staffing plans • position control • daily and biweekly productivity tracking monitors
2. Sustainability – Regular reviews by facility leadership – Performance Improvement / Patient Flow improvement – Annual updates to targets – Basis for establishing FTE and salary budgets
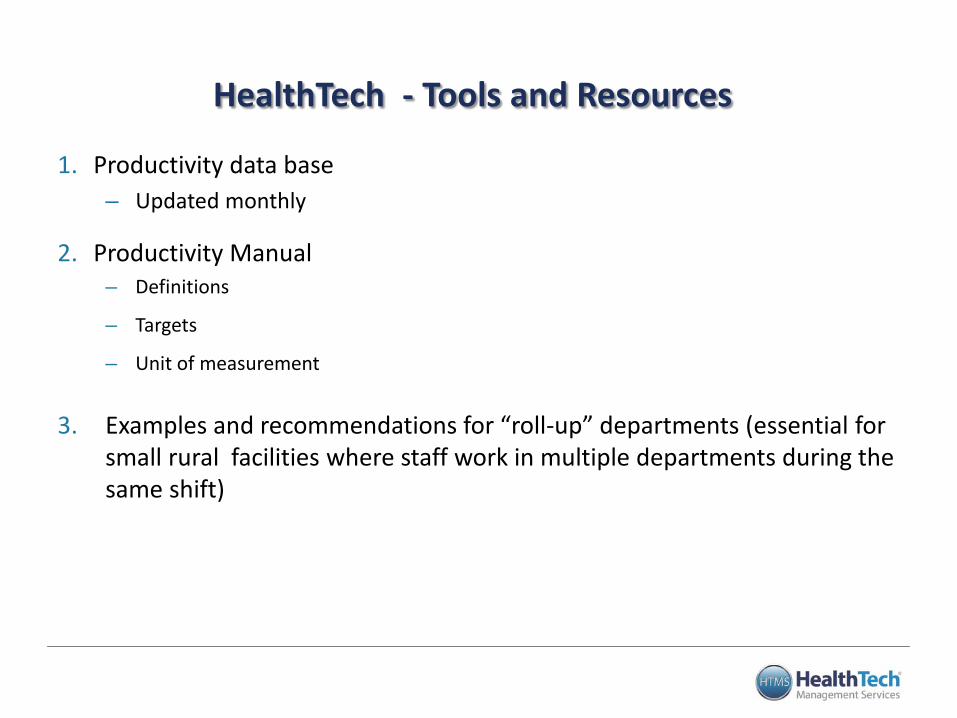
HealthTech - Tools and Resources
1. Productivity data base – Updated monthly
2. Productivity Manual – Definitions
– Targets
– Unit of measurement
3. Examples and recommendations for “roll-up” departments (essential for small rural facilities where staff work in multiple departments during the same shift)
Causes of Poor Productivity
• Waste of time • Waste of ideas • Waste of machinery /
equipment • Waste of manpower • Waste of space
What are some examples of each?
Which ones are occurring at your facility?
Strategy 1 – Effective Leadership 1. Invest / provide education and support for
department managers/directors, charge nurses, shift supervisors, department leads/supervisors
2. Ensure that leaders / managers are knowledgeable and understand concepts of staffing management
3. Provide regular information and feedback to staff and key stakeholders
10
Strategy 2 - Collaborate
1. Work collaboratively with other departments
2. Don’t make changes that improve your productivity but decrease that in another department’s without agreement
11
Strategy 3 – Reduce Overtime
12
Types of Overtime
• Planned • Incidental • Emergent
Expensive!
13
Overtime Reduction
• Look at overtime every pay period • Look for hours – dollars – percent • Drill down to understand WHY Your Strategy will depend on the “reason” for
incurring overtime
14
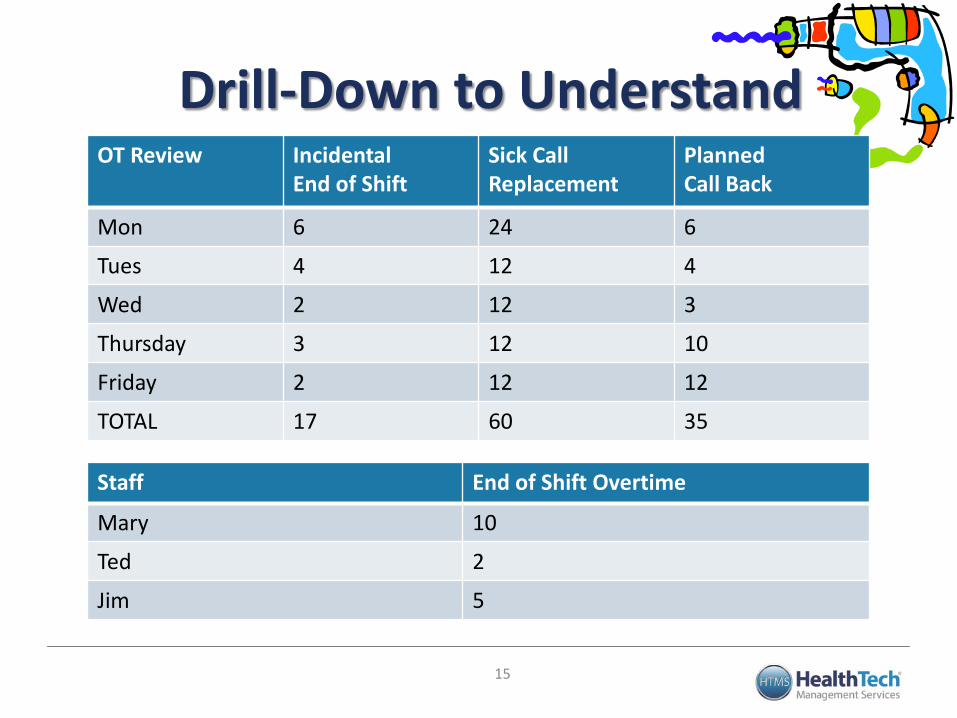
Drill-Down to Understand
Staff End of Shift Overtime
Mary 10
Ted 2
Jim 5
15
OT Review Incidental End of Shift
Sick Call Replacement
Planned Call Back
Mon 6 24 6
Tues 4 12 4
Wed 2 12 3
Thursday 3 12 10
Friday 2 12 12
TOTAL 17 60 35
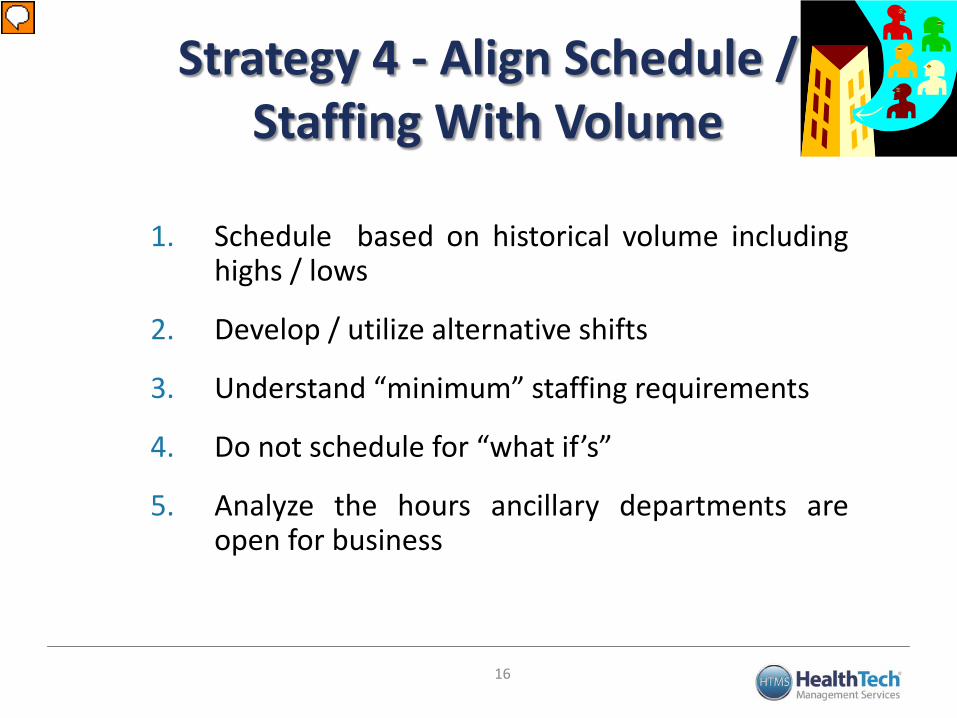
Strategy 4 - Align Schedule / Staffing With Volume
1. Schedule based on historical volume including highs / lows
2. Develop / utilize alternative shifts
3. Understand “minimum” staffing requirements
4. Do not schedule for “what if’s”
5. Analyze the hours ancillary departments are open for business
16
Strategy 5 – Develop Flexible Labor Pool
1. Utilize on-call / per-diem / part-time / float pool to fill in during periods of peak census, cover sick calls, etc.
2. Consider “in-house registry” ─ Caution! – can easily be
abused if you don’t have “rules”
17
Strategy 6 - Monitor and Adjust
Staffing “Real Time”
1. Review staffing compared to budget each shift and make changes as needed
2. Utilize shift supervisors / charge nurses to monitor and reassign workload throughout the day – ensure they know what the targets are and that they are accountable
18
Research has demonstrated that lower quality of care occurs as a result of both being over and under staffed
Strategy 7 – Right Staff Mix
1. Review and adjust delivery model and skill mix to most effectively and efficiently meet the needs of patients / facility
19
Strategy 8 – Invest in Cross-Training
1. Invest in cross-training as a “requirement” of employment ─ Easier when requirement of all staff
to cross-train to at least one other area
─ You must provide education
20
Strategy 9 - Develop Staffing Rules
1. Develop staffing rules to ensure there is staff coverage when it is needed – Vacation
– Requested days off
– Number of staff who can be off at any one time
21
Strategy 10 - Eliminate Contract Labor
1. Invest in local colleges / schools to “grow your own”
2. Measure contract labor utilization and staff vacancy rate and set improvement targets – you will only improve what is important enough to measure
22
Strategy 11 - Benchmark 1. Benchmark with other facilities of
similar size / complexity ─ Identify not only what they are doing
but “how” they are doing it
─ Don’t expect a “perfect match”
2. Benchmark with yourself
23
Strategy 12: Invest in
Work Redesign
1. Invest in work redesign – Evaluate how work is done – look at processes – Remove rework / redundancy from the system – Utilize technology
2. Invest in clinical improvement – Use clinical protocols – Focus on prevention of complications – Focus on error prevention and patient safety
3. Invest in people – Team training – Performance Improvement skills – Reward efforts
4. Measure – Utilize measurement methodologies
24
Work redesign and process improvement are not “theoretical” but an essential component of effective staffing management
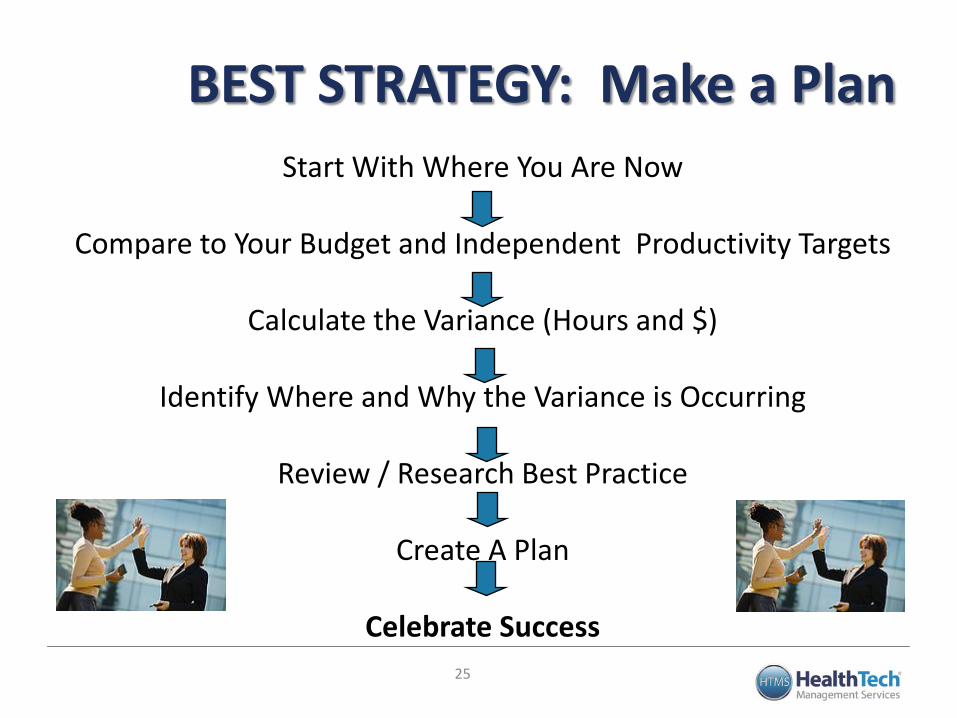
BEST STRATEGY: Make a Plan
25
Start With Where You Are Now
Compare to Your Budget and Independent Productivity Targets
Calculate the Variance (Hours and $)
Identify Where and Why the Variance is Occurring
Review / Research Best Practice
Create A Plan
Celebrate Success

Productivity Tools Buy vs. Build
26
Productivity Tool Components • Unit of Measure • Service Units • Worked Hours (Productive Hours) • Overtime Hours • Paid Hours • Contract Hours • Salary Expense • Contract Labor Expense • Actual vs. Budget
27
Productivity Desired Outputs • Hours Worked per Unit of Service • Worked FTE’s • Paid FTE’s • Overtime % • Worked to Paid Ratio • Salary Expense per Unit of Service • Comparison to Budgeted Targets • Comparison to External Benchmarking Targets
28
Buying Advantages and Disadvantages • Advantages
– Template built and ready to go – Units of Service and Definitions established – External benchmark data available – Staff education available – Multiple vendors to choose from – Definitions and benchmarks constantly updated
• Disadvantages – Up front cash outlay required with possible annual
renewal fees – Various options and price levels to choose from
29
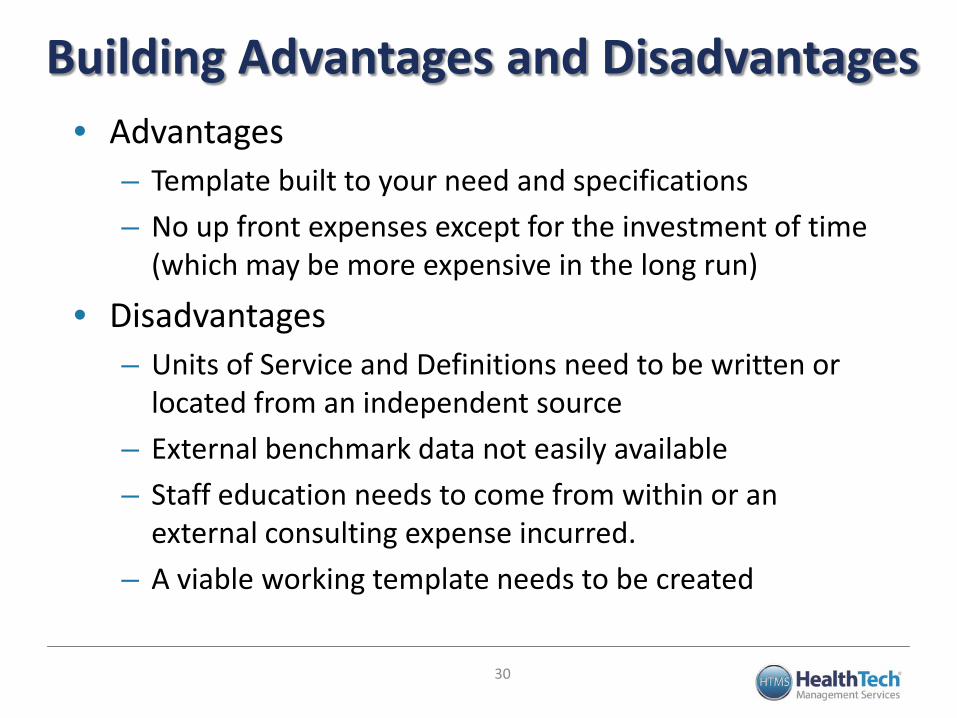
Building Advantages and Disadvantages • Advantages
– Template built to your need and specifications – No up front expenses except for the investment of time
(which may be more expensive in the long run)
• Disadvantages – Units of Service and Definitions need to be written or
located from an independent source – External benchmark data not easily available – Staff education needs to come from within or an
external consulting expense incurred. – A viable working template needs to be created
30
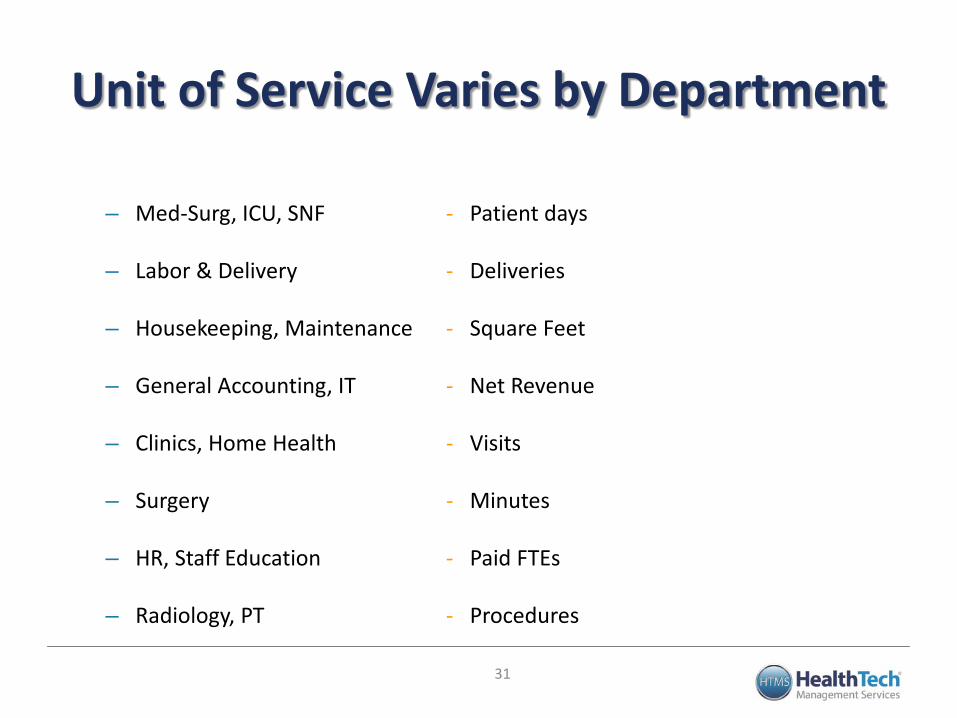
Unit of Service Varies by Department
– Med-Surg, ICU, SNF - Patient days – Labor & Delivery - Deliveries – Housekeeping, Maintenance - Square Feet – General Accounting, IT - Net Revenue – Clinics, Home Health - Visits – Surgery - Minutes – HR, Staff Education - Paid FTEs – Radiology, PT - Procedures
31
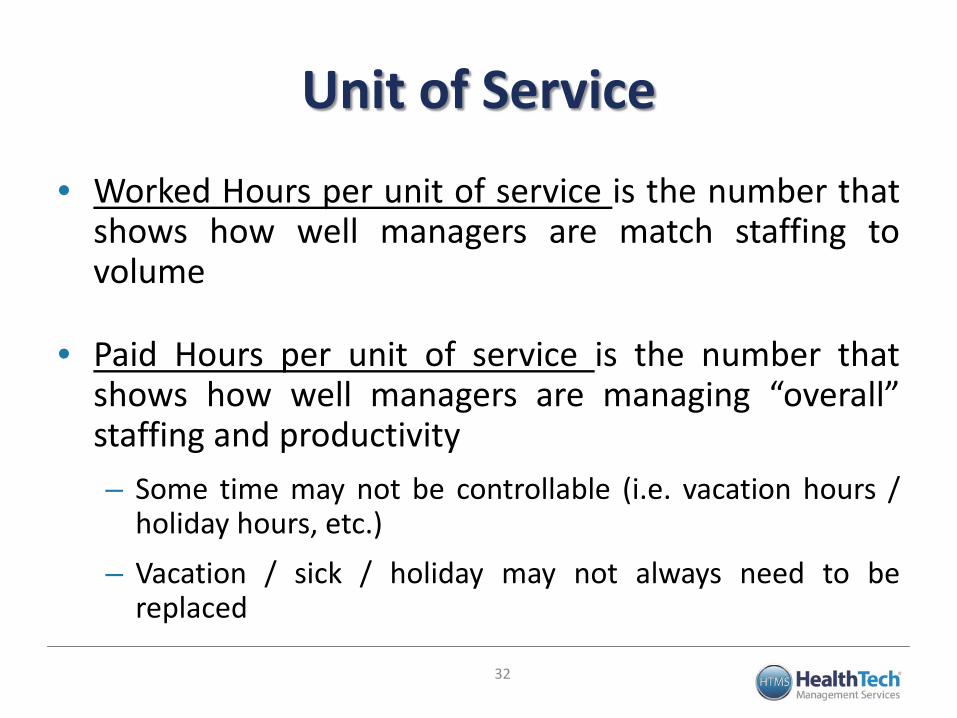
Unit of Service
• Worked Hours per unit of service is the number that shows how well managers are match staffing to volume
• Paid Hours per unit of service is the number that shows how well managers are managing “overall” staffing and productivity – Some time may not be controllable (i.e. vacation hours /
holiday hours, etc.) – Vacation / sick / holiday may not always need to be
replaced
32
Critical Questions How do I compare to my budget?
How do I compare to external benchmarks?
Am I improving?
33
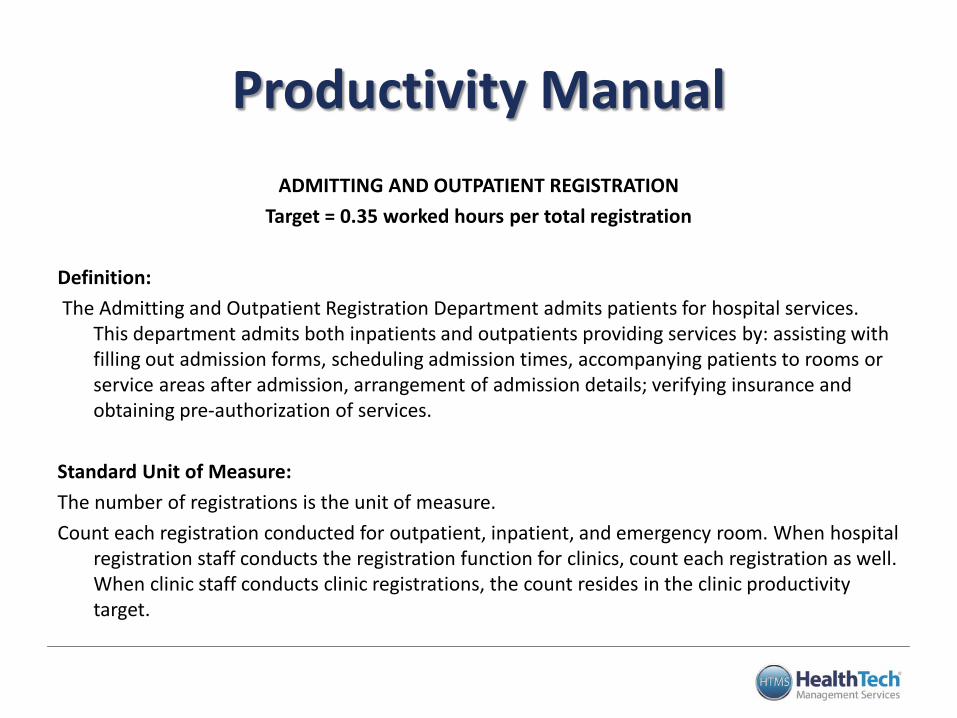
Productivity Manual ADMITTING AND OUTPATIENT REGISTRATION
Target = 0.35 worked hours per total registration Definition: The Admitting and Outpatient Registration Department admits patients for hospital services.
This department admits both inpatients and outpatients providing services by: assisting with filling out admission forms, scheduling admission times, accompanying patients to rooms or service areas after admission, arrangement of admission details; verifying insurance and obtaining pre-authorization of services.
Standard Unit of Measure: The number of registrations is the unit of measure. Count each registration conducted for outpatient, inpatient, and emergency room. When hospital
registration staff conducts the registration function for clinics, count each registration as well. When clinic staff conducts clinic registrations, the count resides in the clinic productivity target.
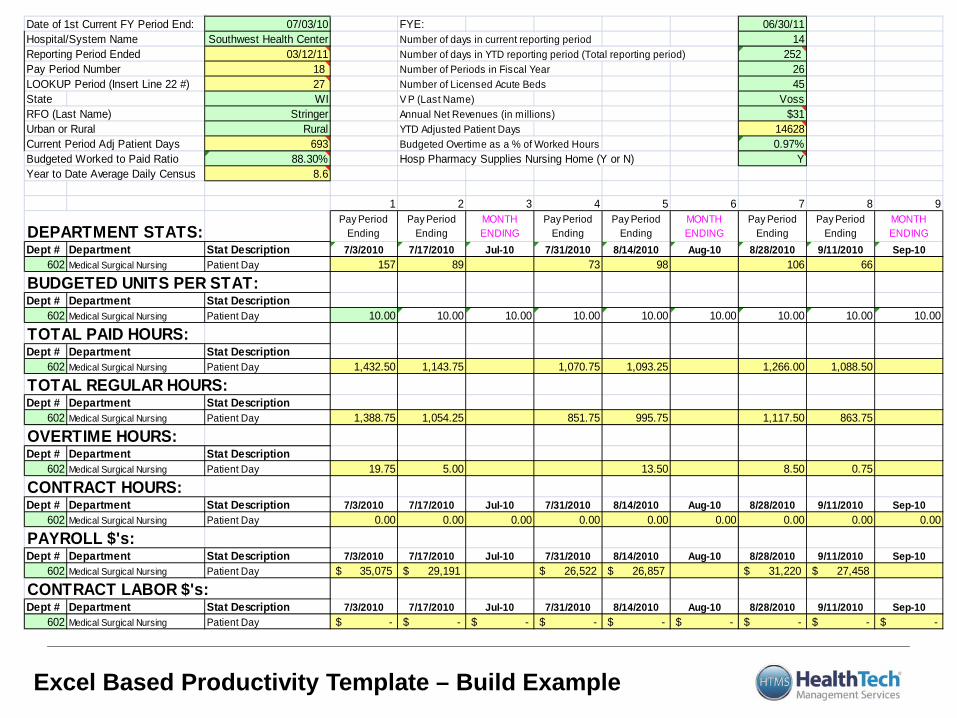
Excel Based Productivity Template – Build Example
Date of 1st Current FY Period End: 07/03/10 FYE: 06/30/11Hospital/System Name Southwest Health Center Number of days in current reporting period 14Reporting Period Ended 03/12/11 Number of days in YTD reporting period (Total reporting period) 252 Pay Period Number 18 Number of Periods in Fiscal Year 26LOOKUP Period (Insert Line 22 #) 27 Number of Licensed Acute Beds 45State WI V P (Last Name) VossRFO (Last Name) Stringer Annual Net Revenues (in millions) $31Urban or Rural Rural YTD Adjusted Patient Days 14628Current Period Adj Patient Days 693 Budgeted Overtime as a % of Worked Hours 0.97%Budgeted Worked to Paid Ratio 88.30% Hosp Pharmacy Supplies Nursing Home (Y or N) YYear to Date Average Daily Census 8.6
1 2 3 4 5 6 7 8 9
DEPARTMENT STATS:Pay Period
EndingPay Period
EndingMONTH ENDING
Pay Period Ending
Pay Period Ending
MONTH ENDING
Pay Period Ending
Pay Period Ending
MONTH ENDING
Dept # Department Stat Description 7/3/2010 7/17/2010 Jul-10 7/31/2010 8/14/2010 Aug-10 8/28/2010 9/11/2010 Sep-10602 Medical Surgical Nursing Patient Day 157 89 73 98 106 66
BUDGETED UNITS PER STAT:Dept # Department Stat Description
602 Medical Surgical Nursing Patient Day 10.00 10.00 10.00 10.00 10.00 10.00 10.00 10.00 10.00
TOTAL PAID HOURS:Dept # Department Stat Description
602 Medical Surgical Nursing Patient Day 1,432.50 1,143.75 1,070.75 1,093.25 1,266.00 1,088.50
TOTAL REGULAR HOURS:Dept # Department Stat Description
602 Medical Surgical Nursing Patient Day 1,388.75 1,054.25 851.75 995.75 1,117.50 863.75
OVERTIME HOURS:Dept # Department Stat Description
602 Medical Surgical Nursing Patient Day 19.75 5.00 13.50 8.50 0.75
CONTRACT HOURS:Dept # Department Stat Description 7/3/2010 7/17/2010 Jul-10 7/31/2010 8/14/2010 Aug-10 8/28/2010 9/11/2010 Sep-10
602 Medical Surgical Nursing Patient Day 0.00 0.00 0.00 0.00 0.00 0.00 0.00 0.00 0.00
PAYROLL $'s:Dept # Department Stat Description 7/3/2010 7/17/2010 Jul-10 7/31/2010 8/14/2010 Aug-10 8/28/2010 9/11/2010 Sep-10
602 Medical Surgical Nursing Patient Day 35,075$ 29,191$ 26,522$ 26,857$ 31,220$ 27,458$
CONTRACT LABOR $'s:Dept # Department Stat Description 7/3/2010 7/17/2010 Jul-10 7/31/2010 8/14/2010 Aug-10 8/28/2010 9/11/2010 Sep-10
602 Medical Surgical Nursing Patient Day -$ -$ -$ -$ -$ -$ -$ -$ -$
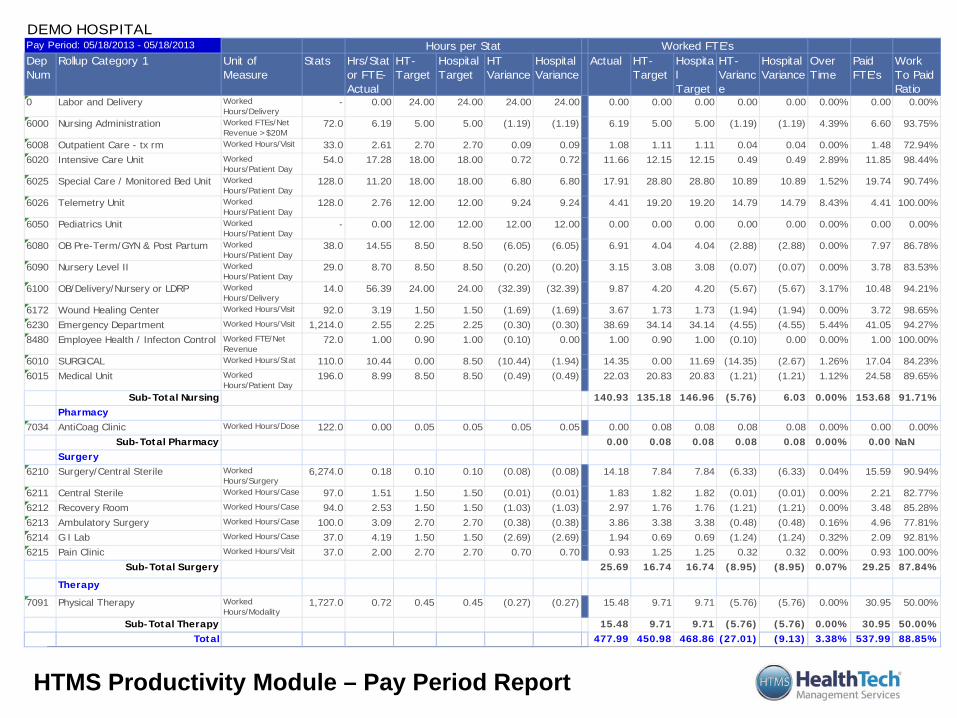
HTMS Productivity Module – Pay Period Report
Dep Num
Rollup Category 1 Stats Hrs/Stat or FTE-Actual
HT-Target
Hospital Target
HT Variance
Hospital Variance
Actual HT-Target
Hospital Target
HT-Variance
Hospital Variance
Over Time
Paid FTE's
Work To Paid Ratio
0 Labor and Delivery - 0.00 24.00 24.00 24.00 24.00 0.00 0.00 0.00 0.00 0.00 0.00% 0.00 0.00%
6000 Nursing Administration 72.0 6.19 5.00 5.00 (1.19) (1.19) 6.19 5.00 5.00 (1.19) (1.19) 4.39% 6.60 93.75%
6008 Outpatient Care - tx rm 33.0 2.61 2.70 2.70 0.09 0.09 1.08 1.11 1.11 0.04 0.04 0.00% 1.48 72.94%6020 Intensive Care Unit 54.0 17.28 18.00 18.00 0.72 0.72 11.66 12.15 12.15 0.49 0.49 2.89% 11.85 98.44%
6025 Special Care / Monitored Bed Unit 128.0 11.20 18.00 18.00 6.80 6.80 17.91 28.80 28.80 10.89 10.89 1.52% 19.74 90.74%
6026 Telemetry Unit 128.0 2.76 12.00 12.00 9.24 9.24 4.41 19.20 19.20 14.79 14.79 8.43% 4.41 100.00%
6050 Pediatrics Unit - 0.00 12.00 12.00 12.00 12.00 0.00 0.00 0.00 0.00 0.00 0.00% 0.00 0.00%
6080 OB Pre-Term/GYN & Post Partum 38.0 14.55 8.50 8.50 (6.05) (6.05) 6.91 4.04 4.04 (2.88) (2.88) 0.00% 7.97 86.78%
6090 Nursery Level II 29.0 8.70 8.50 8.50 (0.20) (0.20) 3.15 3.08 3.08 (0.07) (0.07) 0.00% 3.78 83.53%
6100 OB/Delivery/Nursery or LDRP 14.0 56.39 24.00 24.00 (32.39) (32.39) 9.87 4.20 4.20 (5.67) (5.67) 3.17% 10.48 94.21%
6172 Wound Healing Center 92.0 3.19 1.50 1.50 (1.69) (1.69) 3.67 1.73 1.73 (1.94) (1.94) 0.00% 3.72 98.65%6230 Emergency Department 1,214.0 2.55 2.25 2.25 (0.30) (0.30) 38.69 34.14 34.14 (4.55) (4.55) 5.44% 41.05 94.27%8480 Employee Health / Infecton Control 72.0 1.00 0.90 1.00 (0.10) 0.00 1.00 0.90 1.00 (0.10) 0.00 0.00% 1.00 100.00%
6010 SURGICAL 110.0 10.44 0.00 8.50 (10.44) (1.94) 14.35 0.00 11.69 (14.35) (2.67) 1.26% 17.04 84.23%6015 Medical Unit 196.0 8.99 8.50 8.50 (0.49) (0.49) 22.03 20.83 20.83 (1.21) (1.21) 1.12% 24.58 89.65%
Sub-Total Nursing 140.93 135.18 146.96 (5.76) 6.03 0.00% 153.68 91.71%Pharmacy
7034 AntiCoag Clinic 122.0 0.00 0.05 0.05 0.05 0.05 0.00 0.08 0.08 0.08 0.08 0.00% 0.00 0.00%Sub-Total Pharmacy 0.00 0.08 0.08 0.08 0.08 0.00% 0.00 NaN
Surgery6210 Surgery/Central Sterile 6,274.0 0.18 0.10 0.10 (0.08) (0.08) 14.18 7.84 7.84 (6.33) (6.33) 0.04% 15.59 90.94%
6211 Central Sterile 97.0 1.51 1.50 1.50 (0.01) (0.01) 1.83 1.82 1.82 (0.01) (0.01) 0.00% 2.21 82.77%6212 Recovery Room 94.0 2.53 1.50 1.50 (1.03) (1.03) 2.97 1.76 1.76 (1.21) (1.21) 0.00% 3.48 85.28%6213 Ambulatory Surgery 100.0 3.09 2.70 2.70 (0.38) (0.38) 3.86 3.38 3.38 (0.48) (0.48) 0.16% 4.96 77.81%6214 G I Lab 37.0 4.19 1.50 1.50 (2.69) (2.69) 1.94 0.69 0.69 (1.24) (1.24) 0.32% 2.09 92.81%6215 Pain Clinic 37.0 2.00 2.70 2.70 0.70 0.70 0.93 1.25 1.25 0.32 0.32 0.00% 0.93 100.00%
Sub-Total Surgery 25.69 16.74 16.74 (8.95) (8.95) 0.07% 29.25 87.84%
Therapy
7091 Physical Therapy 1,727.0 0.72 0.45 0.45 (0.27) (0.27) 15.48 9.71 9.71 (5.76) (5.76) 0.00% 30.95 50.00%
Sub-Total Therapy 15.48 9.71 9.71 (5.76) (5.76) 0.00% 30.95 50.00%Total 477.99 450.98 468.86 (27.01) (9.13) 3.38% 537.99 88.85%
Worked Hours/Modality
Worked Hours/Case
Worked Hours/Case
Worked Hours/Case
Worked Hours/Case
Worked Hours/Visit
Worked Hours/Surgery
Worked Hours/Dose
Worked Hours/Visit
Worked FTE/Net RevenueWorked Hours/Stat
Worked Hours/Patient Day
Worked Hours/Patient DayWorked Hours/Patient Day Worked Hours/Patient DayWorked Hours/DeliveryWorked Hours/Visit
Worked FTEs/Net Revenue >$20MWorked Hours/Visit
Worked Hours/Patient DayWorked Hours/Patient DayWorked Hours/Patient Day
Worked Hours/Delivery
Unit of Measure
DEMO HOSPITALPay Period: 05/18/2013 - 05/18/2013 Hours per Stat Worked FTE's
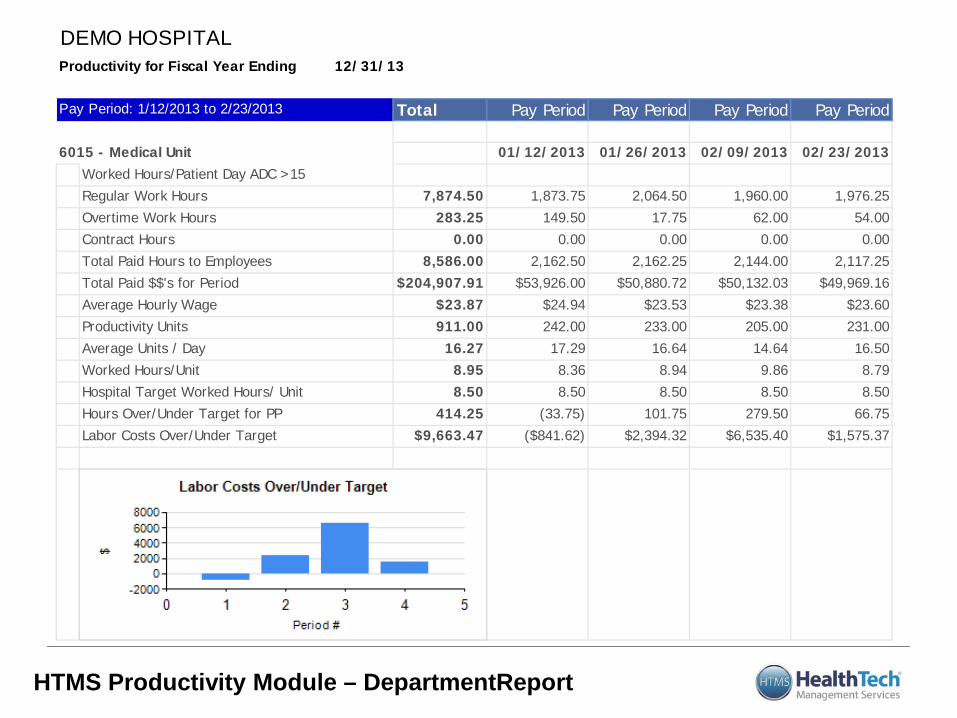
HTMS Productivity Module – DepartmentReport
Total Pay Period Pay Period Pay Period
01/12/2013 02/09/2013 02/23/2013
7,874.50 1,873.75 1,960.00 1,976.25283.25 149.50 62.00 54.00
0.00 0.00 0.00 0.008,586.00 2,162.50 2,144.00 2,117.25
$204,907.91 $53,926.00 $50,132.03 $49,969.16$23.87 $24.94 $23.38 $23.60911.00 242.00 205.00 231.00
16.27 17.29 14.64 16.508.95 8.36 9.86 8.798.50 8.50 8.50 8.50
414.25 (33.75) 279.50 66.75$9,663.47 ($841.62) $6,535.40 $1,575.37
Hospital Target Worked Hours/ Unit 8.50Hours Over/Under Target for PP 101.75Labor Costs Over/Under Target $2,394.32
Productivity Units 233.00Average Units / Day 16.64Worked Hours/Unit 8.94
Total Paid Hours to Employees 2,162.25Total Paid $$'s for Period $50,880.72Average Hourly Wage $23.53
Regular Work Hours 2,064.50Overtime Work Hours 17.75Contract Hours 0.00
6015 - Medical Unit 01/26/2013Worked Hours/Patient Day ADC >15
DEMO HOSPITALProductivity for Fiscal Year Ending 12/31/13
Pay Period: 1/12/2013 to 2/23/2013 Pay Period
Non-Salary Expense Control
• Supplies • Purchased Services • Physician Fees • Repairs & Mainteneance • Utilities • Insurance • All Other Operating Expenses • Capital Costs
38
Supply Expense
• Excluding salaries and benefits usually the next highest expense line item
• GPO Participation – MedAssets, Premier, Amerinet, Etc. • Supply standardization policy • Benchmarking supply cost
– Facility wide – By department – By procedure
39
Purchased Services
• Evaluate annually for continued need • Periodic cost benefit analysis on high cost items • Periodic RFP’s on high cost items • Do not allow contracts to just roll over • Explore collaborative arrangements with other
providers
40
Other Operating Expenses
• Physician Fees – Not much opportunity • Repairs & Maintenance – Depends on age of plant • Utilities – opportunities but usually small • Insurance – shop around • All other expenses – a number of small items if you
are willing to put in the time
41
Capital Expenses • If you belong to a GPO – use them!!! • Get competitive bids • Don’t just look at price
– Add-ons – Warranties/Extended Warranties – Ongoing service costs – Customer service responsiveness – Physician preference – sometimes overrated
• Continually evaluate the market for potential interest savings on current debt
42
Performance Improvement Plans
• Developing
• Implementing
• Monitoring
43
Performance Improvement Plan Components
• Goal statement • Detailed listing of expense savings and revenue
enhancements • Designated responsible party for completion • Implementation Date • Current fiscal year impact to bottom line • Annualized bottom line impact • Status update/comment section
44
Performance Improvement Plan Implementation
• Be realistic in setting a goal. • Be even more realistic in the setting of
objectives • Get input from every employee on potential
objectives • You need visible buy in from everyone; from
the CEO to the lowest paid employee • Make sure the entire organization is involved
45
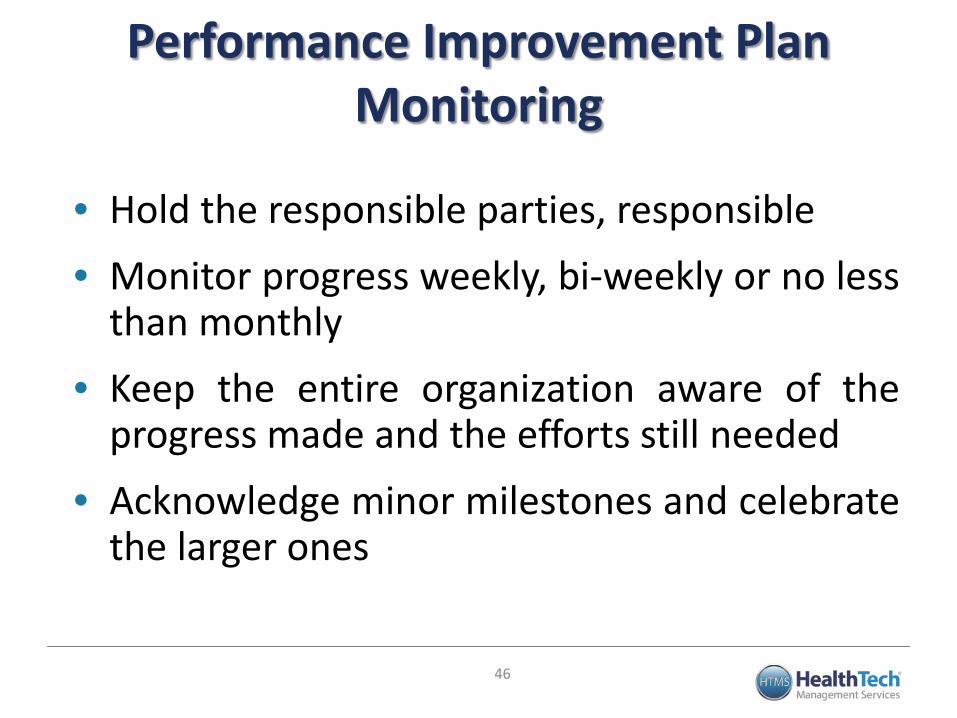
Performance Improvement Plan Monitoring
• Hold the responsible parties, responsible • Monitor progress weekly, bi-weekly or no less
than monthly • Keep the entire organization aware of the
progress made and the efforts still needed • Acknowledge minor milestones and celebrate
the larger ones 46
47
RECOMMENDATION RESPONSIBLE PARTYEFFECTIVE
DATE2013 CHANGE TO
NET INCOME
ANNUALIZED CHANGE TO NET INCOME
STATUS/COMMENTS
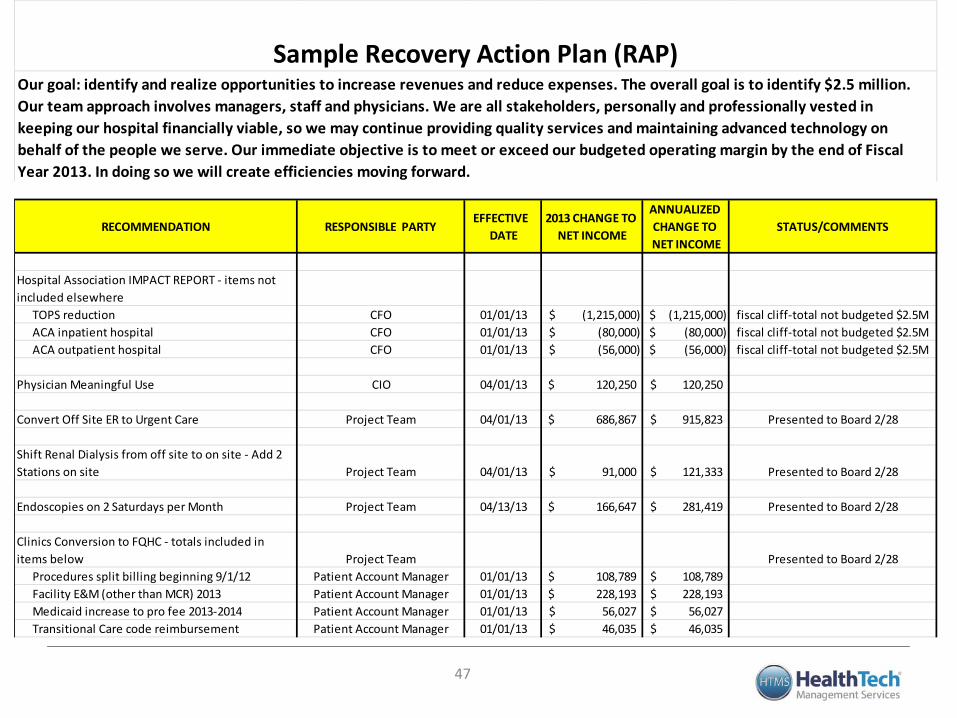
Hospital Association IMPACT REPORT - items not included elsewhere
TOPS reduction CFO 01/01/13 (1,215,000)$ (1,215,000)$ fiscal cliff-total not budgeted $2.5MACA inpatient hospital CFO 01/01/13 (80,000)$ (80,000)$ fiscal cliff-total not budgeted $2.5MACA outpatient hospital CFO 01/01/13 (56,000)$ (56,000)$ fiscal cliff-total not budgeted $2.5M
Physician Meaningful Use CIO 04/01/13 120,250$ 120,250$
Convert Off Site ER to Urgent Care Project Team 04/01/13 686,867$ 915,823$ Presented to Board 2/28
Shift Renal Dialysis from off site to on site - Add 2 Stations on site Project Team 04/01/13 91,000$ 121,333$ Presented to Board 2/28
Endoscopies on 2 Saturdays per Month Project Team 04/13/13 166,647$ 281,419$ Presented to Board 2/28
Clinics Conversion to FQHC - totals included in items below Project Team Presented to Board 2/28
Procedures split billing beginning 9/1/12 Patient Account Manager 01/01/13 108,789$ 108,789$ Facility E&M (other than MCR) 2013 Patient Account Manager 01/01/13 228,193$ 228,193$ Medicaid increase to pro fee 2013-2014 Patient Account Manager 01/01/13 56,027$ 56,027$ Transitional Care code reimbursement Patient Account Manager 01/01/13 46,035$ 46,035$
Our goal: identify and realize opportunities to increase revenues and reduce expenses. The overall goal is to identify $2.5 million. Our team approach involves managers, staff and physicians. We are all stakeholders, personally and professionally vested in keeping our hospital financially viable, so we may continue providing quality services and maintaining advanced technology on behalf of the people we serve. Our immediate objective is to meet or exceed our budgeted operating margin by the end of Fiscal Year 2013. In doing so we will create efficiencies moving forward.
Sample Recovery Action Plan (RAP)

QUESTIONS THOUGHTS
GREAT IDEAS
48
Contact Data
49
Kevin T. Stringer – Assistant Vice President HealthTech Management Services [email protected]