financial statements of - s2.q4cdn.com following discussion and analysis summarizes significant...
TRANSCRIPT
Ritchie Bros. 46
ITEM 7: MANAGEMENT’S DISCUSSION AND ANALYSIS OF FINANCIAL CONDITION AND RESULTS OF OPERATIONS
About Us Ritchie Bros. Auctioneers Incorporated (“Ritchie Bros.”, the “Company”, “we”, or “us”) (NYSE & TSX: RBA) is one of the world’s largest industrial auctioneers and used equipment distributors, selling more than $4.3 billion of used equipment and other assets during 2016. Our expertise, global reach, market insight and trusted brand provide us with a unique position in the used equipment market. We primarily sell used equipment for our customers through live unreserved auctions at 45 auction sites worldwide, which are simulcast online to reach a global bidding audience. During 2013, we added to our sales channels by launching EquipmentOne, an online-only used equipment marketplace, in order to reach a broader customer base. These two complementary used equipment brand solutions provide different value propositions to equipment owners and allow us to meet the needs and preferences of a wide spectrum of equipment sellers. In the past two years, we have also added a private brokerage service and an online listing service. Through our unreserved auctions, online marketplaces, and private brokerage services, we sell a broad range of used and unused equipment, including trucks and other assets. Construction and heavy machinery comprise the majority of the equipment sold through our multiple brand solutions. Customers selling equipment through our sales channels include end users (such as construction companies), equipment dealers, and other equipment owners (such as rental companies). Our customers participate in a variety of sectors, including heavy construction, transportation, agriculture, energy, and mining. Approximately half of what we sold during 2016 transacted online; through either online simulcast auction participation, or through EquipmentOne. In 2016, of the $4.3 billion of all items sold by us, $2.1 billion were sold to online buyers through these online solutions. We operate worldwide with locations in more than 15 countries, including the United States, Canada, Australia, the United Arab Emirates, and the Netherlands. Our corporate headquarters are located near Vancouver, Canada. We are a public company listed on both the New York Stock Exchange (“NYSE”) and Toronto Stock Exchange (“TSX”) under the ticker symbol “RBA” and, as of December 31, 2016, we had total equity market capitalization of approximately $3.6 billion. On November 4, 2015, we acquired a 75% interest in Xcira LLC (“Xcira”), a Florida-based company specializing in software and technology solutions related to online auction bidding and sales. Ritchie Bros. was one of Xcira’s first customers, and has worked very closely with Xcira over the past 14 years to customize Xcira’s solutions to meet our needs. Xcira primarily operates in the industrial auction space, but also offers solutions to auto, art, and other luxury item auctioneers. On February 19, 2016, we acquired a 100% interest in Mascus International Holding BV (“Mascus”), an Amsterdam-based company that operates a global online portal for the sale and purchase of heavy equipment and vehicles, with the largest online market presence in Europe for heavy machinery and trucks. Mascus offers subscriptions to equipment dealers, brokers, exporters, and equipment manufacturers to list equipment available for sale. In addition to online listing services, they also provide online advertising services, business tools, and other software solutions to many of the world’s leading equipment dealerships and equipment manufacturers. Founded in Scandinavia, Mascus has expanded over the past several years and now includes operations across Europe, Asia, Africa, and North America, catering to the construction, transport, agriculture, material handling, forestry, and grounds-care industries. On July 12, 2016, we completed our acquisition of the 49% non-controlling interest in Ritchie Bros. Financial Services (“RBFS”). RBFS provides equipment buyers with the confidence to make offers on equipment, trucks and other industrial assets, with pre-approved loans and financing arrangements. The business finances all brands of equipment and provides equipment buyers with the option to purchase assets at Ritchie Bros. auctions, Ritchie Bros. EquipmentOne, or through other brand solutions.
Ritchie Bros. 47
RBFS has arrangements with a diverse group of financial partners to provide lending solutions that meet the specific needs of equipment owners and dealers. Services offered include pre-approved commercial equipment financing, re-financing, and leasing, as well as equipment dealer financing. Also on July 12, 2016, we announced our minority investment in Machinio Corp. (“Machinio”), a global search engine for finding, buying, and selling used machinery and equipment. With more active listings than any other website, Machinio is the most comprehensive real-time database of for-sale listings. Machinio connects hundreds of thousands of buyers each month with thousands of used machinery dealers from all over the world. Having launched in late 2012, Machinio is now the fastest growing online platform for used machinery. On August 1, 2016, we acquired substantially all of the assets of Petrowsky Auctioneers (“Petrowsky”), a Connecticut-based company that sold nearly $50 million worth of equipment and other assets at auctions in 2015, mostly in the New England, United States region. On August 29, 2016, we entered into an Agreement and Plan of Merger (the “Merger Agreement”) pursuant to which Ritchie Bros. agreed to acquire a 100% interest in IronPlanet Holdings, Inc. (“IronPlanet”), a private company based in the United States, for approximately $740 million in cash plus the assumption of unvested equity interests in IronPlanet, subject to adjustment. Under the terms of the Merger Agreement, a wholly-owned subsidiary of the Company will merge with and into IronPlanet, with the latter surviving the Merger as a wholly-owned subsidiary of the Company (the “Merger”). IronPlanet sold approximately $787 million worth of equipment and other assets through its sales channels during 2015, and has achieved a 25.2% compounded growth rate in assets sold from 2013 through 2015. Consummation of the Merger is subject to customary conditions, including (i) the expiration or termination of the applicable waiting period under the Hart-Scott-Rodino Antitrust Improvements Act of 1976, as amended, and procurement of certain foreign antitrust clearances; (ii) the absence of a material adverse change with respect to IronPlanet since the date of the Merger Agreement, as described in the Merger Agreement; (iii) the Committee on Foreign Investment in the United States having provided written notice to the effect that review of the transactions contemplated by the Merger Agreement has been concluded and has terminated all action under Section 721 of the Defense Production Act of 1950, as amended; and (iv) absent termination of IronPlanet’s registrations or withdrawal of registrations under the International Traffic in Arms Regulations, the United States Department of State having concluded its review and not taken action to block or prevent the consummation of the Merger. On August 29, 2016, we entered into a Strategic Alliance and Remarketing Agreement (the “Alliance”) with IronPlanet, Inc. (“IronPlanet subsidiary”) and Caterpillar Inc. (“Caterpillar”). The Alliance is subject to, contingent upon, and will not be effective until consummation of the Merger. The Merger and Alliance are discussed further below under “strategy”. On November 15, 2016, we acquired substantially all of the assets of Kramer Auctions (“Kramer”), a leading Canadian agricultural auction company with exceptionally strong customer relationships in central Canada. Kramer operates approximately 75 on-the-farm auctions, four on site auctions, and eight livestock (bison) auctions each year, and sold more than 60 million Canadian dollars’ worth of agricultural equipment, real-estate, and other assets during the 12 months ended September 30, 2016. Overview The following discussion and analysis summarizes significant factors affecting our consolidated operating results and financial condition for the years ended December 31, 2016, 2015, and 2014. This discussion and analysis should be read in conjunction with the “Cautionary Note Regarding Forward-Looking Statements”, “Part II, Item 6: Selected Financial Data”, and the consolidated financial statements and the notes thereto included in “Part II, Item 8. Financial Statements and Supplementary Data” presented in our Annual Report on Form 10-K, which is available on our website at www.rbauction.com, on EDGAR at www.sec.gov, or on SEDAR at www.sedar.com. None of the information on our website, EDGAR, or SEDAR is incorporated by reference into this document by this or any other reference. This discussion and analysis contains forward-looking statements that involve risks and uncertainties.

Ritchie Bros. 48
Our actual results could differ materially from those expressed or implied in any forward-looking statements as a result of various factors, including those set forth under “Part I, Item 1A: Risk Factors” in our Annual Report on Form 10-K. The date of this discussion is as of February 21, 2017. We prepare our consolidated financial statements in accordance with United States generally accepted accounting principles (“US GAAP”). Except for Gross Auction Proceeds (“GAP”) and Gross Transaction Value (“GTV”) (both described below), which are measures of operational performance and not measures of financial performance, liquidity, or revenue, the amounts discussed below are based on our consolidated financial statements and are presented in United States (“U.S.”) dollars. Unless indicated otherwise, all tabular dollar amounts, including related footnotes, presented below are expressed in thousands of dollars. We make reference to various non-GAAP financial measures throughout this discussion and analysis. These measures do not have a standardized meaning, and are therefore unlikely to be comparable to similar measures presented by other companies. Consolidated Highlights Key fiscal year 2016 financial results include:
Record annual revenues grew 10% in 2016 compared to 2015
Record annual Revenue Rate (as described below) of 13.07% in 2016, an increase of 93 basis points (“bps”) over 2015, supported by growing fee-based revenue streams
$11.8 million of acquisition-related costs booked during 2016 (including costs related to impending acquisition of IronPlanet)
Impairment loss of $28.2 million recognized on EquipmentOne reporting unit goodwill and customer relationships
$6.8 million charge related to the early termination of pre-existing debt; replaced with new $1.0 billion of credit facilities completed with bank syndicate in the fourth quarter of 2016
Diluted earnings per share (“EPS”) attributable to stockholders of $0.85 in 2016, a 33% decrease relative to diluted EPS of $1.27 in 2015
$177.6 million of net cash provided by operating activities during 2016, a 10% decrease over 2015
Record annual GAP of $4.3 billion in 2016, a 2% increase over 2015
Strategy The following discussion highlights how we acted on the three main drivers to our strategy during 2016. GROW Revenues and Net Income
Our revenues are comprised of:
commissions earned at our auctions where we act as an agent for consignors of equipment and other assets, as well as commissions on online marketplace sales; and
fees earned in the process of conducting auctions through all our auction channels and from value-added service offerings, as well as subscription revenues from our listing and software services.
Commissions from sales at our auctions represent the percentage we earn on GAP. GAP represents the total proceeds from all items sold at our auctions and the GTV of all items sold through our online marketplaces2.
2 GAP and GTV are measures of operational performance and are not measures of our financial performance, liquidity or revenue. GAP and GTV
are not presented in our consolidated income statements. We believe that comparing GAP and GTV for different financial periods provides useful information about the growth or decline of our revenue and net income for the relevant financial period.

Ritchie Bros. 49
GTV represents total proceeds from all items sold at our online marketplaces, as well as a buyers’ premium component applicable only to our online marketplace transactions. The majority of commissions are earned as a pre-negotiated fixed rate of the gross selling price. Other commissions are earned from underwritten contracts, when we guarantee a certain level of proceeds to a consignor or purchase inventory to be sold at auction. We believe that revenues are best understood by considering their relationship to GAP. We use Revenue Rate, which is calculated by dividing revenues by GAP, to determine the amount of GAP changes that flow through to our revenues. We are committed to pursuing growth initiatives that will further enhance our sector reach, drive geographic depth, meet a broader set of customer needs, and add scale to our operations.
• On August 1, 2016, we acquired Petrowsky, significantly enhancing our market presence in the New England, United States region and providing Ritchie Bros. with a new live reserve auction platform. Petrowsky’s auction sales are well aligned with Ritchie Bros.’ sector focus as they cater largely to equipment sellers in the construction and transportation industries. Petrowsky also serves customers selling assets in the underground utility, waste recycling, marine, and commercial real estate industries. The business operates one permanent auction site, in North Franklin, United States, which will continue to hold auctions, and also specializes in off-site auctions held on the land of the consignor. All Petrowsky auctions are also simulcast live online, allowing online bidders to participate. The Petrowsky brand will be maintained as a brand extension within the Ritchie Bros. family of brands, given its strong and loyal customer base and its offering of reserve auction options.
• On August 29, 2016, we announced the Merger Agreement with IronPlanet. We believe that the Merger will accelerate our customer-centric, multi-channel diversification strategy by increasing customer choice, enhancing online offerings, and providing penetration into large, additional sectors. The Merger is expected to significantly increase revenue and net income by using the strength of our balance sheet. Founded in 1999, IronPlanet complements Ritchie Bros.’ primarily end-user customer base, as it focuses largely on the needs of corporate accounts, equipment manufacturers, dealers, and government entities in equipment disposition solutions. It conducts sales primarily through online-only platforms, with weekly online auctions and in other equipment marketplaces.
• On August 29, 2016, we entered into the Alliance, which provides that upon consummation of the Merger, Caterpillar shall designate Ritchie Bros. as a ‘preferred’ but nonexclusive provider of online and on-site auctions and marketplaces (including those of IronPlanet) in the countries where we do business. In exchange for this designation, Caterpillar will receive commission rate discounts to our standard rates, as well access to certain data and information. We believe the Alliance will significantly strengthen our relationship with Caterpillar dealers.
• On November 15, 2016, we acquired substantially all of the assets of Kramer. This acquisition is expected to significantly strengthen our penetration of Canada’s agricultural sector and add key talent to our Canadian Ag sales and operations teams. Operating for more than 65 years, Kramer has established a leading market position in Alberta, Saskatchewan, and Manitoba as a premier agricultural auctioneers, offering both on-the-farm and on site live auctions for customers selling equipment, livestock, and real-estate in the agricultural sector. The family-owned and operated business has developed deep, loyal customer relationships over three generations of management by the Kramer family. Like us, Kramer conducts its auctions on an unreserved basis.
EquipmentOne is a key part of a full-service offering to provide our customers with a menu of options that cater to their needs at different points of their asset disposition journey. The strategy of offering EquipmentOne and other sales channels alongside our core auction service is a key step in developing a truly multi-channel offering to our market.
• During 2016, GTV at EquipmentOne increased 23% compared to 2015.
• Our EquipmentOne marketplace was expanded into Canada in the third quarter of 2015, contributing full year revenues in 2016.
• EquipmentOne launched its Enterprise Software Solution (“ESS”) in 2016, which provides a portal for dealer-to-dealer equipment sales. Dealer-to-dealer sales accounted for $29.6 million of the total $148.0 million of GTV in 2016, generating revenues of $0.6 million.
Ritchie Bros. 50
The addition of Ritchie Bros. Private Treaty and Mascus (our listing service), as well as the acquisition of the minority interest in Ritchie Bros. Financial Services, will also contribute to revenue and earnings growth for the Company.
• On February 19, 2016, we acquired Mascus, a leading global online equipment listing service. The acquisition expands the breadth of equipment disposition and management solutions we can offer our customers. Mascus operates a vibrant online equipment listing service with over 360,000 items for sale and 3.3 million monthly website visits across 58 countries and in 42 languages. The business also provides equipment sellers with a turn-key suite of business tools and software solutions. Mascus customers will benefit from our deep equipment experience and extensive global buying audience, providing further global exposure for Mascus equipment listings.
• On July 12, 2016, we completed our acquisition of the 49% non-controlling interest in RBFS and announced our strategic investment in Machinio. In 2015, RBFS received more than $1 billion of credit applications and facilitated $222 million in equipment financing for Ritchie Bros. customers – representing 31% growth in funded loans compared to 2014, and 116% growth compared to 2013. RBFS acts as an intermediary with select lending partners to find financing solutions for customers purchasing equipment, including loans and lease-to-own programs. RBFS does not utilize Ritchie Bros. capital in its financing activities. These corporate development initiatives are expected to help position us for future growth and further extend our involvement in the digital innovation of the equipment industry.
We will also continue to focus on accelerating our strategic accounts growth and improving the overall performance and use of our underwritten contracts.
• Underwritten contract performance improved significantly in 2016 relative to 2015, with a year-over-year increase in Revenue Rate from underwritten contracts.
• During 2016, we continued to be diligent in our valuations and methodology as it pertains to sectors that continue to experience pressure, including oil and gas and mining, in order to compete effectively and grow the business in those sectors.
• New leadership was appointed to oversee the Strategic Accounts team in order drive better results from this area of the business.
DRIVE Efficiencies and Effectiveness We plan to take advantage of opportunities to improve the overall effectiveness of our organization by enhancing sales productivity, modernizing and integrating our legacy IT systems and optimizing business processes.
• During 2016 we implemented many technology and business process solutions to drive operational efficiency, which drove better auction site-to-head office data sharing, improved the customer payment and load-out experience, and enhanced our mobile bidding technology.
o As an example, during the second quarter of 2016, our first ‘quick win’ project was successfully launched. This project involved an integration of our auction site operational processes with our administrative office accounting procedures. By automating the post-sale customer receipt process, we were able to greatly reduce the amount of time and expense required to match customer receipts with sale invoices, thereby ensuring timely release of customer equipment purchased at auction. These time savings have enabled our personnel to focus on customer needs and improve the customer experience. The project qualified as a ‘quick win’ due to the minimal capital expenditure that was required, the short implementation timeframe, and the fact that it drove significant efficiencies in our post-sale processes.
• Also in early 2016, we implemented a new capital expenditure approval process, which included the establishment of a Capital Committee to review and approve all significant capital information technology projects. The primary goal of the Capital Committee is to continue to control our capital expenditure, maximizing returns on information technology investments and realizing ‘quick wins’ with respect to process and customer service improvements.
We are also implementing formal performance measurement metrics to gauge our effectiveness and progress, and will better align our executive compensation plans with our new strategy and key targets.
Ritchie Bros. 51
• Scorecards of key performance metrics are consistently measured and shared externally each quarter and internally more frequently.
• In early 2016, we initiated a revision to our short-term incentive plans for all management levels. This revision simplified the plans to focus on three rather than four financial measures. For directors and above, the revision prioritizes financial measures above individual goals, with a minimum of 70% of the short-term incentive based on financial results, as opposed to a 50% minimum. We believe that such a shift will better align employee incentives with our objective of increasing shareholder value.
We also continue to evaluate ways to most effectively structure our organization to enhance the agility of our business, and speed up our decision making processes, to better serve our customers.
• Direct income statement responsibility has been allocated to key leadership roles.
• A regional structure has provided enhanced agility to cater to the unique regional preferences and needs of our customers.
• In addition, we announced the following appointments, which improved the alignment of our organizational structure: Becky Alseth as Chief Marketing Officer effective January 4, 2016; and Marianne Marck as Chief Information Officer effective April 18, 2016.
OPTIMIZE our Balance Sheet Our business model provides us with the ability to generate strong cash flows. Cash flow represents our ability to convert revenue into cash, and provides a meaningful indication of the strength of our business. During 2016, we continued to focus not only on profit growth but also on enhancing cash flow and optimizing return on average invested capital by reviewing contract structures and evaluating auction site returns. We calculate the GAAP measure return on average invested capital directly from our consolidated financial statements by dividing net income attributable to stockholders by our average invested capital. During the fourth quarter of 2016, the Company closed its Beijing, China auction site by terminating the lease early. Ritchie Bros. will continue to conduct off-site auctions in China, which drive better returns than auctions that were held at the Beijing auction site. During 2016 we also adjusted our capital structure, securing additional long-term debt sufficient to finance the transactions contemplated by the Merger Agreement:
• On August 29 ,2016, in connection with the execution of the Merger Agreement, we obtained a financing commitment (the “Commitment Letter”) from Goldman Sachs Bank USA (“GS Bank”) pursuant to which GS Bank was committed to provide (i) a senior secured revolving credit facility in an aggregate principal amount of $150.0 million (the “Revolving Facility”), and (ii) a senior unsecured bridge loan facility in an aggregate principal amount of $850.0 million (the “Bridge Facility”, and together with the Revolving Facility, the “Facilities”).
• On October 27, 2016, we closed a new five-year credit agreement (the “Credit Agreement”) with a syndicate of lenders, including Bank of America, N.A. (“BofA”) and Royal Bank of Canada, which provides us with:
1) Multicurrency revolving facilities of up to $675.0 million (the “Multicurrency Facilities”);
2) A delayed-draw term loan facility of up to $325.0 million (the “Delayed-Draw Facility” and together, the “New Facilities”); and
3) At our election and subject to certain conditions, including receipt of related commitments, incremental term loan facilities and/or increases to the Multicurrency Facilities in an aggregate amount of up to $50 million.
• In conjunction with the closing of the Credit Agreement, we terminated the entire $150 million Revolving Facility and $350 million of the $850 million Bridge Facility. Debt from the Credit Agreement will initially be used to finance the Merger with IronPlanet.
• On December 21, 2016, the Company completed an offering of $500 million of senior unsecured notes (the “Notes”), due 2025. Proceeds from the sale of the Notes will be primarily used to finance the Acquisition. Funds from the Notes, a delayed-draw term loan under the Delayed-Draw Facility, the Multicurrency Facilities, as well as any cash on hand may also be used to pay transaction fees and expenses related the Acquisition.

Ritchie Bros. 52
The gross proceeds from the Notes offering, together with any prefunded accrued interest, will be held in an escrow account pending the consummation of the Acquisition. The Notes were issued at par with a maturity date of January 15, 2025. The Notes accrue interest at a rate of 5.375% per year, with interest to be paid semi-annually on each January 15 and July 15, commencing January 15, 2017.
• In conjunction with the issuance of the Notes, we terminated the remaining $500 million of the Bridge Facility.
• On March 1, 2016, we were granted approval of a new normal course issuer bid by the TSX to allow us to continue pursuing share repurchases through both the NYSE and the TSX. In March 2016, we repurchased 1.46 million of our common shares at a total cost of $36.7 million in order to address option dilution, consistent with our capital allocation priorities.
• Also during 2016, we paid dividends of $70.5 million to our stockholders. In total we returned $107.2 million to our stockholders as we executed on our capital allocation strategy during 2016. We also managed our net capital spending such that it remains well below our target of 10% of our revenues on a trailing 12-month basis. We calculate the GAAP measure net capital spending directly from our consolidated statement of cash flows by adding property, plant and equipment additions to intangible asset additions, and subtracting proceeds on disposition of property, plant and equipment.
Used Equipment Market Update The used equipment market remained stable until late in the third quarter of 2016. At the end of the third quarter of 2016, we saw a marginal improvement in pricing, which continued into the fourth quarter. However, pricing remained lower than the used equipment valuation peak that occurred in the first quarter of 2015. We continued to see performance vary among asset sectors and geographies. Sectors that had been under extreme downward pressure in previous quarters, including those tied to commodities such as the oil and gas and mining sectors, saw some positive movement in commodity pricing commencing late in the third quarter of 2016 and continuing into the fourth quarter. As a result, we started to see some assets that had been immobile since early 2015 slowly begin to be utilized in certain geographies. Comparatively, the transportation sector, especially in North America, has remained under pressure since early 2016 when there was an excess of transportation assets that came to market. We believe this excess fleet turnover was the source of some price deterioration for transportation assets in 2016. In terms of equipment values, North America continued to be our strongest geographical region for most of 2016, responding most favorably to changes in commodity pricing and the overall economic environment. In early 2016, uncertainty in the macro economic environment negatively impacted both demand for equipment as well as equipment values, particularly in North America. However, near the end of 2016, we saw some stabilization in that regard. Australia responded favorably to the commodity price improvement that occurred late in the third quarter and into the fourth quarter of 2016, experiencing some uplift in the value of assets tied to commodities. We also continued to see an improvement in the overall age of equipment coming to market relative to recent years; a trend that we believe results from the increase in OEM production that began in 2010 and is generating more transactions in the current used equipment marketplace, as well as creating larger pools of used equipment for future transactions. We continue to closely monitor new equipment production models, dealer and rental sales performance, and pricing actions in light of pressures in the broader industrial equipment sector.

Ritchie Bros. 53
Results of Operations
Financial overview Year ended December 31,
Change
(in U.S.$000's, except EPS) 2016 2015 2014
2016 over 2015
2015 over
2014
Revenues $ 566,395 $ 515,875 $ 481,097 10% 7%
Costs of services, excluding depreciation
and amortization 66,062 56,026 57,884 18% (3%)
Selling, general and administrative
expenses 283,529 254,389 248,220 11% 2%
Acquisition-related costs 11,829 601 - 1868% 100%
Depreciation and amortization expenses
40,861 42,032 44,536 (3%) (6%)
Gain on disposal of property, plant and
equipment (1,282) (9,691) (3,512) (87%) 176%
Impairment loss 28,243 - 8,084 100% (100%)
Foreign exchange loss (gain) 1,431 (2,322) (2,042) (162%) 14%
Operating income 135,722 174,840 127,927 (22%) 37%
Operating income margin 24.0% 33.9% 26.6% -990 bps 730 bps
Other income (expense) (5,228) 1,596 1,111 (428%) 44%
Income tax expense 36,982 37,861 36,475 (2%) 4%
Net income attributable to stockholders 91,832 136,214 90,981 (33%) 50%
Diluted EPS attributable to stockholders $ 0.85 $ 1.27 $ 0.85 (33%) 49%
Effective tax rate 28.3% 21.5% 28.3% 680 bps -680 bps
GAP $ 4,334,815 $ 4,247,635 $ 4,212,641 2% 1%
Revenue Rate 13.07% 12.14% 11.42% 93 bps 72 bps
Gross Auction Proceeds
2016 performance GAP was $4.3 billion for 2016, a 2% increase over 2015. Included in GAP for 2016 is $148.0 million of GTV from our online marketplaces, which represents a 23% increase over GTV of $120.0 million in 2015. 2016 GTV includes $29.6 million of assets that transacted on a dealer-to-dealer basis on EquipmentOne’s online marketplaces primarily due to the launch of EquipmentOne’s ESS in 2016. Revenues earned on these dealer-to-dealer transactions were $0.6 million in 2016. Dealer-to-dealer transactions on EquipmentOne’s online marketplaces were not significant prior to the introduction of ESS in 2016. The increase in GAP is primarily due to an increase in the number of core auction lots year-over-year. The total number of lots at industrial and agricultural auctions grew 12%, increasing to 437,300 in 2016 from 390,300 in 2015. However, core auction GAP decreased 9% on a per-lot basis to $9,600 in 2016 from $10,600 in 2015. This decrease is primarily due to the mix and age of equipment that came to market in 2016. We also believe the macro economic environment uncertainties, particularly in North America, negatively impacted equipment demand and pricing and contributed to the decrease in core auction GAP per lot year-over-year. We saw a peak in used equipment values in the first quarter of 2015 that did not recur in 2016.

Ritchie Bros. 54
GAP, on a U.S. dollar basis, grew in Canada and the United States in 2016 compared to 2015. However, this growth was partially offset by a reduction in GAP in Europe over the same comparative period. GAP in the rest of the world grew during 2016 compared to 2015. GAP in 2016 would have been $58.4 million higher, resulting in a 3% increase over 2015, if foreign exchange rates had remained consistent with those in 2015. This adverse effect on GAP is primarily due to the declining value of the Canadian dollar and the Euro relative to the U.S. dollar. During 2016, we continued to actively pursue the use of underwritten contracts from a strategic perspective, entering into such contracts only when the risk/reward profile of the terms were agreeable. The volume of underwritten contracts decreased to 25% of our GAP in 2016 from 29% in 2015, primarily due to the underwritten contracts associated with the Casper, Wyoming, offsite auction that was held on March 25, 2015. Straight commission contracts continue to account for the majority of our GAP. 2015 performance GAP was $4.2 billion for the year ended December 31, 2015, a 1% increase over 2014. Included in 2015 GAP is $120.0 million of GTV from our online marketplaces, which represents a 13% increase over GTV of $106.1 million in 2014. The increase in GAP is primarily due to an increase in the number of core auction lots year-over-year. The total number of lots at industrial and agricultural auctions grew 10%, increasing to 390,300 in 2015 from 355,200 in 2014. However, core auction GAP decreased 9% on a per-lot basis to $10,600 in 2015 from $11,600 in 2014. GAP, on a U.S. dollar basis, grew in the United States and Canada in 2015 compared to 2014. However, this growth was partially offset by reductions in GAP in Europe and the rest of the world year-over-year. 2015 GAP would have been $319.4 million higher, resulting in an 8% increase over 2014, if foreign exchange rates had remained consistent with those in 2014. This adverse effect on GAP is primarily due to the declining value of the Canadian dollar and the Euro relative to the U.S. dollar. The volume of underwritten contracts decreased to 29% of our GAP in 2015 from 31% in 2014. Revenues and Revenue Rate
(in U.S. $000's) Year ended December 31, Better/(Worse)
2016 2015 2014 2016 over
2015 2015 over
2014
United States $ 278,198 $ 257,824 $ 223,770 8% 15% Canada 187,699 166,528 154,392 13% 8% Europe 52,809 48,419 58,782 9% (18%) Other 47,689 43,104 44,153 11% (2%) Revenues $ 566,395 $ 515,875 $ 481,097 10% 7%

Ritchie Bros. 55
Our commission rate and overall Revenue Rate are presented in the graph below:
The distribution of our revenues across the geographic regions in which we operate was as follows, where the geographic location of revenues corresponds to the location in which the sale occurred, or in the case of online sales, where the company earning the revenues is incorporated:
Revenue distribution Canada Outside of
Canada United States Europe Other
Year ended December 31, 2016 33% 67% 49% 9% 9% Year ended December 31, 2015 32% 68% 50% 9% 9% Year ended December 31, 2014 32% 68% 47% 12% 9%
2016 performance Revenues increased 10% in 2016 compared to 2015, primarily due to a strong Revenue Rate and volume increases in GAP. Included in 2016 revenues were $16.5 million of revenues from EquipmentOne, which represents a 9% increase over EquipmentOne revenues of $15.1 million in 2015. Our Revenue Rate increased 93 bps to an annual record 13.07% in 2016 compared to 12.14% in 2015. This increase is primarily due to our underwritten contract performance combined with an increase in fee revenue, which is not directly linked to GAP. Our overall average commission rate was 9.78% in 2016, compared to 9.54% in 2015. This increase is primarily due to the performance of our underwritten business. While our underwritten contract volume decreased during 2016 compared to 2015, our underwritten contract commission rates increased over the same comparative period. Our fee revenue earned in 2016 represented 3.28% of GAP compared to 2.60% of GAP in 2015. The increase was primarily due to an increase in financing and other fees resulting from the improved performance of our value-added service offerings, combined with the mix of equipment sold at our auctions. Financing fees from RBFS increased 30% to $12.8 million in 2016 from $9.8 million in 2015. Mascus contributed $7.5 million of subscription, license, and other fee revenues in 2016. Xcira contributed $4.6 million of technology service fees in 2016, compared to $0.9 million on 2015. Revenue grew in Canada, the United States, Europe, and the rest of the world in 2016 compared to 2015, primarily as a result of increases in GAP, Revenue Rates, and the acquisition of new businesses.
8.25%
9.00%
9.75%
10.50%
11.25%
12.00%
12.75%
13.50%
14.25%2
01
2Q
1
20
12
Q2
20
12
Q3
20
12
Q4
20
13
Q1
20
13
Q2
20
13
Q3
20
13
Q4
20
14
Q1
20
14
Q2
20
14
Q3
20
14
Q4
20
15
Q1
20
15
Q2
20
15
Q3
20
15
Q4
20
16
Q1
20
16
Q2
20
16
Q3
20
16
Q4
Quarterly commission rate and Revenue Rate five-year history
Quarterly commission rate Quarterly Revenue Rate
Ritchie Bros. 56
Foreign exchange rates had a negative impact on revenues in 2016 as a significant portion of revenues are in Canada and the Netherlands. Refer to the table under “Translational impact of foreign exchange rates” below for details of the foreign exchange rate impact. 2015 performance Revenues increased 7% in 2015 over 2014 primarily due to an improved commission rate, increased fees, and volume increases in GAP. Included in 2015 revenues is $15.1 million of revenues from our online marketplaces, which represents a 15% increase over revenues from online marketplaces of $13.2 million in 2014. Our Revenue Rate increased 72 bps to 12.14% in 2015 compared to 11.42% in 2014, and our overall average commission rate was 9.54% in 2015 compared to 9.00% in 2014. These increases are primarily due to the disciplined execution of our underwritten contracts. Our underwritten contract commission rates and volume increased in 2015 compared to 2014. Our fee income earned in 2015 was 2.60% of GAP compared to 2.42% of GAP in 2014. The increase was primarily due to the mix of equipment sold at our auctions combined with an increase in financing fees resulting from the improved performance of our value-added services. Financing fees from RBFS increased 33% to $9.8 million in 2015 from $7.4 million in 2014. Xcira contributed $0.9 million of technology service fees to 2015 fee income. Revenue grew in the United States in 2015 compared to 2014, primarily as a result of increases in GAP and Revenue Rate in that region. Foreign exchange rates had a negative impact on revenues in 2015. Refer to the table under “Translational impact of foreign exchange rates” below for details of the foreign exchange rate impact. Costs of services Costs of services are comprised of expenses incurred in direct relation to conducting auctions, earning online marketplace revenues, and earning other fee revenues. Costs incurred in direct relation to conducting our auctions include labour, buildings, facilities and technology expenses, and travel, advertising and promotion expenses. Typically, agricultural auctions and auctions located in frontier regions are costlier than auctions held at our permanent and regional auction sites as they do not benefit from economies of scale and frequency. Costs of services incurred to earn online marketplace revenues include inventory management, referral, inspection, sampling, and appraisal fees. Costs of services incurred in earning other fee revenues include labour, commissions on sales, software maintenance fees, and materials. 2016 performance Costs of services increased $10.0 million or 18% in 2016 compared to 2015. Costs of services related to our Core Auction reportable segment were $63.6 million, or 1.47% of GAP, in 2016 compared to $56.0 million, or 1.32% of GAP, in 2015. This $7.5 million increase is primarily due to the increase in number of lots at our auctions, the increase in the number of agricultural auctions and auctions located in frontier regions, the recognition of costs of services from Xcira of $2.8 million, and a strategic increase in advertising and promotional expenditure targeted at our larger auctions, including our five-day, premier global auction in Orlando, United States. We believe the targeted increase in advertising and promotional expenditure contributed to the increase in GAP. During 2016, 87% of our GAP was attributable to auctions held at our permanent and regional auction sites, including those located in frontier regions, compared to 85% in 2015. We held 356 auctions in 2016, compared to 345 in 2015. The proportion of GAP earned at those sites decreased over the same comparative period. EquipmentOne and Mascus contributed $1.7 million and $0.8 million, respectively, to our total costs of services in 2016. Prior to fiscal 2016, costs of services generated by EquipmentOne were insignificant and recorded within SG&A expenses.
Ritchie Bros. 57
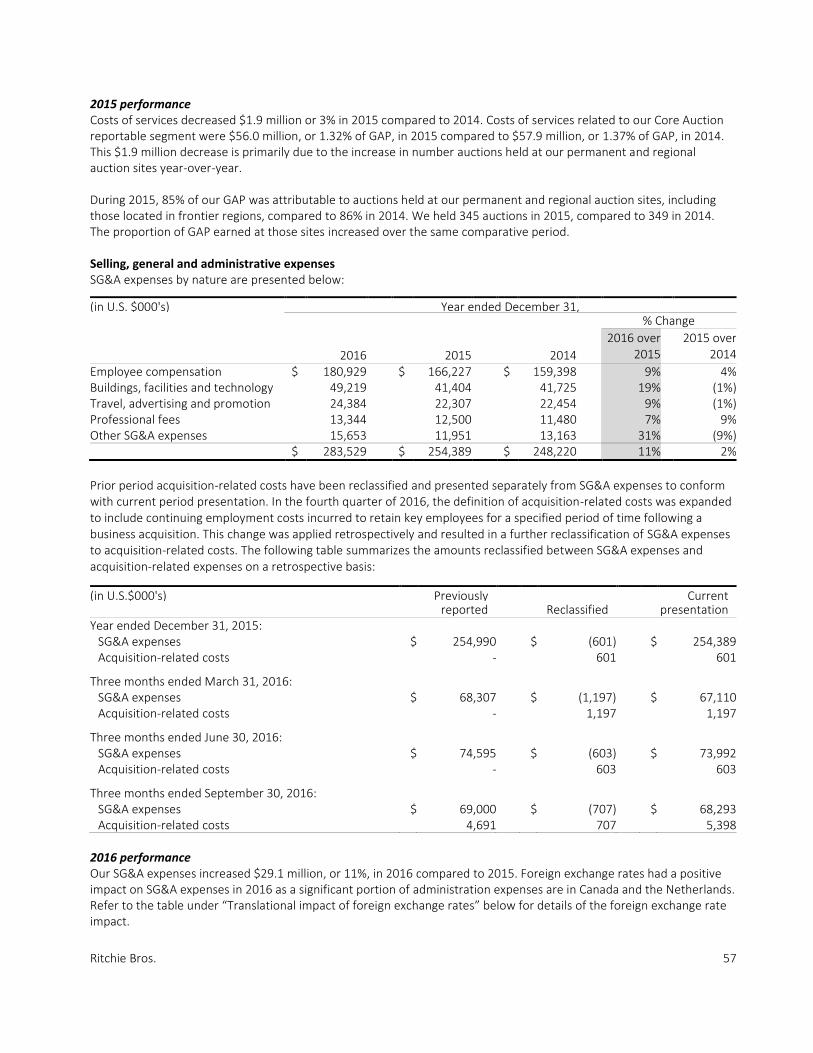
2015 performance Costs of services decreased $1.9 million or 3% in 2015 compared to 2014. Costs of services related to our Core Auction reportable segment were $56.0 million, or 1.32% of GAP, in 2015 compared to $57.9 million, or 1.37% of GAP, in 2014. This $1.9 million decrease is primarily due to the increase in number auctions held at our permanent and regional auction sites year-over-year. During 2015, 85% of our GAP was attributable to auctions held at our permanent and regional auction sites, including those located in frontier regions, compared to 86% in 2014. We held 345 auctions in 2015, compared to 349 in 2014. The proportion of GAP earned at those sites increased over the same comparative period. Selling, general and administrative expenses SG&A expenses by nature are presented below:
(in U.S. $000's) Year ended December 31, % Change
2016 2015 2014
2016 over
2015
2015 over 2014
Employee compensation $ 180,929 $ 166,227 $ 159,398 9% 4% Buildings, facilities and technology 49,219 41,404 41,725 19% (1%) Travel, advertising and promotion 24,384 22,307 22,454 9% (1%) Professional fees 13,344 12,500 11,480 7% 9% Other SG&A expenses 15,653 11,951 13,163 31% (9%) $ 283,529 $ 254,389 $ 248,220 11% 2%
Prior period acquisition-related costs have been reclassified and presented separately from SG&A expenses to conform with current period presentation. In the fourth quarter of 2016, the definition of acquisition-related costs was expanded to include continuing employment costs incurred to retain key employees for a specified period of time following a business acquisition. This change was applied retrospectively and resulted in a further reclassification of SG&A expenses to acquisition-related costs. The following table summarizes the amounts reclassified between SG&A expenses and acquisition-related expenses on a retrospective basis:
(in U.S.$000's) Previously Current
reported Reclassified presentation Year ended December 31, 2015:
SG&A expenses $ 254,990 $ (601) $ 254,389 Acquisition-related costs - 601 601
Three months ended March 31, 2016: SG&A expenses $ 68,307 $ (1,197) $ 67,110 Acquisition-related costs - 1,197 1,197
Three months ended June 30, 2016: SG&A expenses $ 74,595 $ (603) $ 73,992 Acquisition-related costs - 603 603
Three months ended September 30, 2016: SG&A expenses $ 69,000 $ (707) $ 68,293 Acquisition-related costs 4,691 707 5,398
2016 performance Our SG&A expenses increased $29.1 million, or 11%, in 2016 compared to 2015. Foreign exchange rates had a positive impact on SG&A expenses in 2016 as a significant portion of administration expenses are in Canada and the Netherlands. Refer to the table under “Translational impact of foreign exchange rates” below for details of the foreign exchange rate impact.

Ritchie Bros. 58
Employee compensation expenses increased $14.7 million 2016 compared to 2015. This increase included a positive effect from foreign exchange rates of $2.6 million. Removing foreign exchange impacts, the primary drivers of the increase in employee compensation were the 8% net growth of our headcount (excluding Mascus and Xcira), $6.3 million mark-to-market fair value changes in our liability-classified share units, $3.1 million from Mascus, and $2.1 million from Xcira, and $0.7 million from Petrowsky. The overall increase in the fair value of our liability-classified share units in 2016 compared to 2015 is related to the performance of our common share price. Our share price closed at $34.00 per common share on December 31, 2016 compared to $24.11 per common share on December 31, 2015. Employee compensation expenses in 2016 included $0.7 million in termination benefits resulting from the Separation Agreement with our former President, US & LATAM, which compares to $2.1 million in termination benefits in 2015 resulting from the Separation Agreement with our former Chief Sales Officer. Buildings, facilities and technology costs increased $7.8 million in 2016 compared to 2015. This increase is primarily attributable to our value-added service offerings, and in particular, the costs required to support the growing fee revenues generated by that business. Mascus, Petrowsky, and Xcira contributed $0.7 million, $0.2 million, and $0.2 million, respectively, in 2016. Travel, advertising and promotion increased $2.1 million in 2016 compared to 2015, primarily due to an increase in rental fees as a result of a replacement of our aged and retired company vehicles with new vehicles under operating leases. Mascus contributed $0.6 million of the increase, and we also participated in more tradeshows in 2016 compared to 2015. Other SG&A increased $3.7 million in 2016 compared to 2015, primarily attributable to our value-added service offerings, and in particular, the costs required to support the growing fee revenues generated by that business. During 2016, we also incurred higher value-added tax and surtaxes in Beijing, China, as well as greater bank charges associated with the New Facilities and the Notes. Included in SG&A expenses for 2016 are $12.9 million of SG&A expenses from EquipmentOne, which decreased 6% over EquipmentOne SG&A expenses of $13.7 million in 2015. 2015 performance Our SG&A expenses increased $6.2 million, or 2%, in 2015 compared to 2014, less than half the rate of our revenue growth. Foreign exchange rates had a positive impact on SG&A expenses in 2015 as a significant portion of administration expenses are in Canada and the Netherlands. Refer to the table under “Translational impact of foreign exchange rates” below for details of the foreign exchange rate impact. Employee compensation expenses increased $6.8 million 2015 compared to 2014. This increase included a positive effect from foreign exchange rates of $14.5 million. Removing foreign exchange impacts, the primary drivers of the increase in employee compensation were $12.0 million higher incentive compensation, 4% net growth of our headcount (excluding Xcira), annual merit increases, $2.1 million in termination benefits resulting from the Separation Agreement with our former Chief Sales Officer, $0.7 million higher stock option compensation and share unit expenses, and $0.6 million from Xcira. These increases were partially offset by $5.5 million of management reorganization costs in 2014. The increase in incentive compensation in 2015 over 2014 is a direct result of the improved performance of the business and achievement of key performance metrics targets. The majority of this impact was realized in the fourth quarter of 2015 due to the fact that as a result of the seasonality of our business, we accrue for incentive compensation at target levels during the first three quarters of the year, adjusting for actual performance in the fourth quarter. This adjustment accounted for an increase in the quarterly incentive compensation accrual during the fourth quarter of 2015 of approximately $3.2 million compared to the first, second, and third quarters of 2015.

Ritchie Bros. 59
Comparatively, the adjustment in the fourth quarter of 2014 accounted for a decrease in the quarterly incentive compensation accrual of approximately $0.7 million compared to the preceding three quarters of 2014. The increase in share-based payment expenses over the same period is primarily due to increased grants related to certain new executives and the accelerated vesting of stock options and share units related to executive departures in 2015. The increase was partially offset by a decrease in the fair value of our share units related to the performance of our share price, which closed at $24.11 per common share on December 31, 2015 compared to $26.89 per common share on December 31, 2014. Included in 2015 SG&A expense is $13.7 million of SG&A expenses from EquipmentOne, which decreased 7% over EquipmentOne SG&A expenses of $14.8 million in 2014. Acquisition-related costs Acquisition-related costs consist of operating expenses directly incurred as part of a business combination, due diligence and integration planning related to the Acquisition, and continuing employment costs that are recognized separately from our business combinations. Business combination, due diligence, and integration operating expenses include advisory, legal, accounting, valuation, and other professional or consulting fees, as well as travel and securities filing fees. 2016 performance Acquisition-related costs for 2016 consisted of $8.2 million, $1.7 million, $1.1 million, $0.6 million, and $0.2 million associated with IronPlanet, Mascus, Xcira, Petrowsky, and Kramer, respectively. 2015 performance Acquisition-related costs for the 2015 consisted of $0.6 million associated with Xcira. Depreciation and amortization expenses
2016 performance Our depreciation and amortization expenses decreased $1.2 million, or 3%, in 2016 compared to 2015, primarily due to the positive impact of foreign exchange rate changes. Included in 2016 depreciation and amortization expenses are $2.6 million of depreciation and amortization expenses from EquipmentOne, which represents a 12% decrease over depreciation and amortization expenses from online marketplaces of $3.0 million in 2015. 2015 performance Our depreciation and amortization expenses decreased $2.5 million, or 6%, in 2015 compared to 2014, primarily due to the positive impact of foreign exchange rate changes combined with assets related to our website development becoming fully depreciated in 2015. The positive impact from foreign exchange is primarily due to the declining value of the Canadian dollar and the Euro relative to the U.S. dollar. Included in 2015 depreciation and amortization expenses are $3.0 million of depreciation and amortization expenses from EquipmentOne, which represents an 18% decrease over depreciation and amortization expenses from online marketplaces of $3.7 million in 2014. Gain on disposal of property, plant and equipment
2016 performance Gains on disposal of property, plant and equipment primarily consist of $0.7 million in gains on the disposal of Company vehicles and yard equipment throughout 2016, as well as a $0.5 million gain on the sale of excess land in Denver, United States, that was realized the third quarter of 2016.

Ritchie Bros. 60
2015 performance Gains on disposal of property, plant and equipment primarily consist of an $8.4 million gain on sale of excess land in Edmonton, Canada in the fourth quarter of 2015, a $3.4 million gain on the sale of our former auction site in Grande Prairie, Canada in the third quarter of 2014, and a $9.2 million gain on the sale of excess land in Prince Rupert, Canada in the fourth quarter of 2013. Due to their significance and the fact that they are non-recurring, these gains have been presented as adjusting items and excluded from our adjusted results, where applicable. Impairment loss
2016 performance During the third quarter of 2016, we identified an indicator of impairment on our EquipmentOne reporting unit. The indicator consisted of a decline in actual and forecasted revenue and operating income compared with previously projected results, which was primarily due to the recent performance of the EquipmentOne reporting unit. Accordingly, we performed an impairment test that resulted in the recognition of an impairment loss of $28.2 million on our EquipmentOne reporting unit goodwill and customer relationships as at September 30, 2016. Refer to “Critical Accounting Policies, Judgments, Estimates and Assumptions” below for details of the EquipmentOne reporting unit impairment testing. This impairment loss has been presented as an adjusting item and excluded from our adjusted results, where applicable. 2015 performance There was no impairment loss in 2015. In 2014, we recognized an $8.1 million impairment loss on our property in Japan. This impairment loss has been presented as an adjusting item and excluded from our adjusted results, where applicable. Operating income
2016 performance Operating income decreased $39.1 million, or 22% to $135.7 million in 2016 compared to $174.8 million in 2015. This decrease is primarily due to the impairment loss recognized on the EquipmentOne reporting unit goodwill and customer relationships during the third quarter of 2016, combined with increases in SG&A expenses, acquisition-related costs, and costs of services, as well as a decrease in gains on disposal of property, plant and equipment. This decrease is partially offset by the increase in revenues year-over-year. Adjusted operating income3 (non-GAAP measure) decreased $2.5 million, or 1%, to $164.0 million in 2016 compared to $166.5 million in 2015. Operating income margin, which is our operating income divided by revenues, decreased 990 bps to 24.0% in 2016 compared to 33.9% in 2015. This decrease is primarily due to the impairment loss recognized on the EquipmentOne reporting unit goodwill and customer relationships during the third quarter of 2016, combined with increases in SG&A expenses, acquisition-related costs, and costs of services, as well as a decrease in gains on disposal of property, plant and equipment. This decrease is partially offset by the increase in revenues year-over-year. Adjusted operating income margin4 (non-GAAP measure) decreased 340 bps to 28.9% in 2016 from 32.3% in 2015.
3 Adjusted operating income is a non-GAAP measure. We use income statement and balance sheet performance scorecards to align our
operations with our strategic priorities. We concentrate on a limited number of metrics to ensure focus and to facilitate quarterly performance discussions. Our income statement scorecard includes the performance metric, adjusted operating income. We believe that comparing adjusted operating income for different financial periods provides useful information about the growth or decline of operating income for the relevant financial period. We calculate adjusted operating income by eliminating from operating income the pre-tax effects of significant non-recurring items that we do not consider to be part of our normal operating results, such as management reorganization costs, severance, gains/losses on sale of certain property, plant and equipment, impairment losses, and certain other items, which we refer to as ‘adjusting items’. Adjusted operating income is reconciled to the most directly comparable GAAP measures in our consolidated financial statements under “Non-GAAP Measures” below.
4 Our income statement scorecard includes the performance metric, adjusted operating income margin, which is a non-GAAP measure. We believe that comparing adjusted operating income margin for different financial periods provides useful information about the growth or decline of our operating income for the relevant financial period. We calculate adjusted operating income margin by dividing adjusted operating income (non-GAAP measure) by revenues. Adjusted operating income margin is reconciled to the most directly comparable GAAP measures in our consolidated financial statements under “Non-GAAP Measures” below.

Ritchie Bros. 61
Foreign exchange rates had a negative impact on operating income in 2016. Refer to the table under “Translational impact of foreign exchange rates” below for details of the foreign exchange rate impact. 2015 performance Operating income increased 37% to $174.8 million in 2015 compared to $127.9 million in 2014. This increase is primarily due to the GAP and revenue increases year-over-year, the pre-tax gain on disposal of excess property in Edmonton, Canada, of $8.4 million in 2015, and the $8.1 million impairment loss on our property in Japan in 2014. The increase is partially offset by increases in SG&A expenses in 2015 compared to 2014. Adjusted operating income (non-GAAP measure) increased $28.3 million, or 20%, to $166.5 million in 2015 compared to $138.2 million in 2014. Operating income margin, which is our operating income divided by revenues, increased to 33.9% in 2015 compared to 26.6% in 2014. This increase is primarily due to the GAP and revenue increases year-over-year, the pre-tax gain on disposal of excess property in Edmonton, Canada, of $8.4 million in 2015, and the $8.1 million impairment loss on our property in Japan in 2014. The increase is partially offset by increases in SG&A expenses in 2015 compared to 2014. Adjusted operating income margin (non-GAAP measure) increased 360 bps to 32.3% in 2015 from 28.7% in 2014. Foreign exchange rates had a negative impact on operating income in 2015. Refer to the table under “Translational impact of foreign exchange rates” below for details of the foreign exchange rate impact. Other income (expense) Other income (expense) is comprised of the following:
(in U.S. $000's) Year ended December 31, % Change
2016 2015 2014
2016 over 2015
2015 over 2014
Interest income $ 1,863 $ 2,660 $ 2,222 (30%) 20% Interest expense (5,564) (4,962) (5,277) (12%) 6% Equity income 1,028 916 458 12% 100% Debt extinguishment costs (6,787) - - (100%) - Other, net 4,232 2,982 3,708 42% (20%) Other income (expense) $ (5,228) $ 1,596 $ 1,111 (428%) 44%
Debt extinguishment costs were incurred in the fourth quarter of 2016 in association with the early termination of pre-existing long-term debt due in May 2022. 2016 interest expense includes $0.8 million of interest on the Notes from December 21, 2016 through December 31, 2016. The Notes bear interest at a fixed rate of 5.375% per annum on a principal balance of $500.0 million, which compares to the fixed rates of 4.225% and 3.59% per annum that were associated with the early-terminated Canadian dollar 34 million term loan and $30 million term loan, respectively. Income tax expense and effective tax rate At the end of each interim period, we make our best estimate of the effective tax rate expected to be applicable for the full fiscal year. The estimate reflects, among other items, our best estimate of operating results. It does not include the estimated impact of foreign exchange rates or unusual and/or infrequent items, which may cause significant variations in the customary relationship between income tax expense and income before income taxes. 2016 performance Income tax expense was $37.0 million in 2016, compared to an income tax expense of $37.9 million in 2015. Our effective tax rate was 28.3% in 2016, compared to 21.5% in 2015. The increase in the effective tax rate was primarily due to the higher estimate of non-deductible goodwill impairment loss and acquisition-related costs, partially offset by a greater estimated proportion of annual earnings taxed in jurisdictions with lower tax rates for fiscal 2016 compared to fiscal 2015.

Ritchie Bros. 62
2015 performance For the year ended December 31, 2015, income tax expense was $37.9 million, compared to an income tax expense of $36.5 million in 2014 and $40.3 million in 2013. The 4% increase in income tax expense from 2014 to 2015 is partly a result of the 37% increase in income before income taxes over the same period. Our effective tax rate was 21.5% in 2015 compared to 28.3% in 2014. The decrease in effective tax rate in 2015 over 2014 was primarily due to a decrease in the valuation allowance on our tax assets, which resulted from a change in our assessment of our ability to realize deferred tax assets in light of new information that arose during our tax planning initiatives in the fourth quarter of 2015. This new information allowed us to recognize tax losses that had been carried forward from certain historical tax years. The utilization of these tax losses has been presented as an adjusting item and excluded from our adjusted results, where applicable. Net income
2016 performance Net income attributable to stockholders decreased $44.4 million, or 33%, to $91.8 million in 2016 compared to $136.2 million in 2015. This decrease is primarily due to the impairment loss recognized on the EquipmentOne reporting unit goodwill and customer relationships during the third quarter of 2016, combined with increases in SG&A expenses, acquisition-related costs, and costs of services, as well as a decrease in gains on disposal of property, plant and equipment and the incurrence of debt extinguishment costs in the fourth quarter of 2016. This decrease is partially offset by the increase in revenues year-over-year. Adjusted net income attributable to stockholders5 (non-GAAP measure) increased $2.2 million, or 2%, to $123.3 million in 2016 from $121.1 million in 2015. Primarily for the same reasons noted above, net income decreased $45.1 million, or 33%, to $93.5 million in 2016 from $138.6 million in 2015. Adjusted Earnings Before Interest, Taxes, Depreciation and Amortization (“EBITDA”)6 (non-GAAP measure) decreased $2.3 million, or 1%, to $210.1 million in 2016 from $212.4 million in 2015. Net income margin decreased 1040 bps to 16.5% in 2016 from 26.9% in 2015. This decrease is primarily due to the impairment loss recognized on the EquipmentOne reporting unit goodwill and customer relationships during the third quarter of 2016, combined with increases in SG&A expenses, acquisition-related costs, and costs of services, as well as a decrease in gains on disposal of property, plant and equipment and the incurrence of debt extinguishment costs in the fourth quarter of 2016. This decrease is partially offset by the increase in revenues year-over-year. Adjusted EBITDA margin7 (non-GAAP measure) decreased 410 bps to 37.1% in 2016 from 41.2% in 2015.
5 Adjusted net income attributable to stockholders is a non-GAAP financial measure. We believe that comparing adjusted net income attributable
to stockholders for different financial periods provides useful information about the growth or decline of our net income attributable to stockholders for the relevant financial period, and eliminates the financial impact of adjusting items we do not consider to be part of our normal operating results. Adjusted net income attributable to stockholders represents net income attributable to stockholders excluding the effects of adjusting items and is reconciled to the most directly comparable GAAP measures in our consolidated financial statements under “Non-GAAP Measures” below.
6 Adjusted EBITDA is a non-GAAP financial measure that we believe provides useful information about the growth or decline of our net income when compared between different financial periods. Adjusted EBITDA is also an element of the performance criteria for certain performance share units we granted to our employees and officers in 2013 and 2014. Adjusted EBITDA is calculated by adding back depreciation and amortization expenses, interest expense, and current income tax expense, and subtracting interest income and deferred income tax recovery from net income excluding the pre-tax effects of adjusting items. Adjusted EBITDA is reconciled to the most directly comparable GAAP measures in our consolidated financial statements under “Non-GAAP Measures” below.
7 Adjusted EBITDA margin is a non-GAAP financial measure that we believe provides useful information about the growth or decline of our net income when compared between different financial periods. Adjusted EBITDA margin presents adjusted EBITDA (non-GAAP measure) as a multiple of revenues. Adjusted EBITDA margin is reconciled to the most directly comparable GAAP measures in our consolidated financial statements under “Non-GAAP Measures” below.

Ritchie Bros. 63
Debt at December 31, 2016 represented 6.6 times net income as at and for the year ended December 31, 2016. This compares to debt at December 31, 2015, which represented 0.8 times net income as at and for the year ended December 31, 2015. The increase in this debt/net income multiplier is primarily due to a net increase in long-term debt from December 31, 2015 to December 31, 2016, combined with the decrease in net income for the year ended December 31, 2016 compared to the year ended December 31, 2015, as discussed above. The increase in debt is primarily due to the issuance of the Notes for a principal amount of $500.0 million in December 2016. Adjusted debt/adjusted EBITDA8 (non-GAAP measure) was 0.6 as at and for the year ended December 31, 2016 compared to 0.5 as at and for the year ended December 31, 2015. 2015 performance Net income attributable to stockholders increased $45.2 million, or 50%, to $136.2 million in 2015 compared to $91.0 million in 2014. This increase is primarily due to the GAP and revenue increases year-over-year, the pre-tax gain on disposal of excess property in Edmonton, Canada, of $8.4 million in 2015, and the $8.1 million impairment loss on our property in Japan in 2014. The increase is partially offset by increases in SG&A expenses in 2015 compared to 2014. Adjusted net income attributable to stockholders (non-GAAP measure) increased $20.7 million, or 21%, to $121.1 million in 2015 from $100.3 million in 2014. Primarily for the same reasons noted above, net income increased $46.0 million, or 50%, to $138.6 million in 2015 from $92.6 million in 2014. Adjusted EBITDA (non-GAAP measure) decreased $25.5 million, or 14%, to $212.4 million in 2015 from $186.9 million in 2014. Net income margin increased 770 bps to 26.9% in 2015 from 19.2% in 2014. This increase is primarily due to the GAP and revenue increases year-over-year, the pre-tax gain on disposal of excess property in Edmonton, Canada, of $8.4 million in 2015, and the $8.1 million impairment loss on our property in Japan in 2014. The increase is partially offset by increases in SG&A expenses in 2015 compared to 2014. Adjusted EBITDA margin (non-GAAP measure) increased 240 bps to 41.2% in 2015 from 38.8% in 2014. Debt at December 31, 2015 represented 0.8 times net income as at and for the year ended December 31, 2015. This compares to debt at December 31, 2014, which represented 1.3 times net income as at and for the year ended December 31, 2014. The decrease in this debt/net income multiplier is primarily due to the increase net income for the year ended December 31, 2015 compared to the year ended December 31, 2014, as discussed above, combined with a net decrease in long-term debt at December 31, 2015 compared to December 31, 2014. Debt/adjusted EBITDA (non-GAAP measure) was 0.5 as at and for the year ended December 31, 2015 compared to 0.6 as at and for the year ended December 31, 2014.
8 Our balance sheet scorecard includes the performance metric, adjusted debt/adjusted EBITDA, which is a non-GAAP financial measure. We
believe that comparing adjusted debt/adjusted EBIDTA on a trailing 12-month basis for different financial periods provides useful information about the performance of our operations, and in particular, it is an indicator of the amount of time it would take for us to settle both our short and long-term debt. We do not consider this to be a measure of our liquidity, which is our ability to settle only short-term obligations, but rather a measure of how well we fund liquidity. Measures of liquidity are discussed further below under “liquidity and capital resources”. We calculate adjusted debt/adjusted EBITDA by dividing adjusted debt (non-GAAP measure) by adjusted EBITDA (non-GAAP measure). Adjusted debt (non-GAAP measure) is calculated as debt as reported in our consolidated financial statements reduced by long-term debt held in escrow. Adjusted debt/adjusted EBITDA is reconciled to the most directly comparable GAAP measures in our consolidated financial statements under “Non-GAAP Measures” below. In prior periods, we calculated this metric as debt divided by adjusted EBITDA and called it ‘debt/adjusted EBITDA (non-GAAP measure)’. In the current period, we changed the title, definition, and calculation of this non-GAAP measure as a result of the issue of the Notes, which are currently held in escrow and not currently accessible by us and, therefore, not contributing to the generation of net income. There was no impact on previously reported results of this metric since we have not historically been subject to our debt being held in escrow. We believe that by adjusting debt to remove funds we do not have access to, we are more accurately measuring our ability to fund liquidity. We anticipate reverting back to the original title, definition, and calculation of this metric when we no longer have debt in escrow.

Ritchie Bros. 64
Diluted EPS
2016 performance Diluted EPS attributable to stockholders decreased 33% to $0.85 per share in 2016 from $1.27 per share in 2015. This decrease is primarily due to the decrease in net income attributable to stockholders, combined with a 25,320 increase in the weighted average number of dilutive shares outstanding over the same comparative period. Diluted adjusted EPS attributable to stockholders9 (non-GAAP measure) increased 2% to $1.15 per share in 2016 from $1.13 per share in 2015. 2015 performance Diluted EPS attributable to stockholders increased 49% to $1.27 per share in 2015 from $0.85 per share in 2014. This increase is primarily due to the increase in net income attributable to stockholders, combined with a 222,354 decrease in the weighted average number of dilutive shares outstanding over the same comparative period. Diluted adjusted EPS attributable to stockholders (non-GAAP measure) increased 22% to $1.13 per share in 2015 from $0.93 per share in 2014. Foreign exchange loss and effect of exchange rate movement on income statement components We conduct operations around the world in a number of different currencies, but our presentation currency is the U.S. dollar. In 2016, approximately 48% of our revenues and 58% of our operating expenses were denominated in currencies other than the U.S. dollar, compared to 45% and 58%, respectively in 2015. Transactional impact of foreign exchange rates We recognized $1.4 million of transactional foreign exchange losses in 2016, compared to $2.3 million of transactional foreign exchange gains during 2015. Foreign exchange losses and gains are primarily the result of settlement of foreign-denominated monetary assets and liabilities. Translational impact of foreign exchange rates Since late 2014, there has been significant weakening of the Canadian dollar and the Euro relative to the U.S. dollar. This weakening of the Canadian dollar and Euro has affected our reported operating income when non-U.S. dollar amounts were translated into U.S. dollars for financial statement reporting purposes. Constant Currency amounts and Translational FX Impact are non-GAAP financial measures. We calculate our Constant Currency amounts by applying prior period foreign exchange rates to current period transactional currency amounts. We define Translational FX Impact as the amounts we report under GAAP, less Constant Currency amounts. We believe that presenting Constant Currency amounts and Translational FX Impact, and comparing Constant Currency amounts to prior period results, provides useful information regarding the potential effect of changes in foreign exchange rates on our performance and the growth or decline in our operating income by eliminating the financial impact of items we do not consider to be part of our normal operating results.
9 Diluted adjusted EPS attributable to stockholders is a non-GAAP financial measure. We believe that comparing diluted adjusted EPS attributable
to stockholders for different financial periods provides useful information about the growth or decline of our diluted EPS attributable to stockholders for the relevant financial period, and eliminates the financial impact of adjusting items we do not consider to be part of our normal operating results. Diluted adjusted EPS attributable to stockholders is calculated by dividing adjusted net income attributable to stockholders (non-GAAP measure) by the weighted average number of dilutive shares outstanding. Diluted adjusted EPS attributable to stockholders is reconciled to the most directly comparable GAAP measures in our consolidated financial statements under “Non-GAAP Measures” below.

Ritchie Bros. 65
The following tables present our Constant Currency results and Translational FX Impact for the years ended December 31, 2016, 2015, and 2014, as well as reconcile those metrics to revenues, costs of services, SG&A expenses, acquisition-related costs, depreciation and amortization expenses, gain on disposition of property, plant and equipment, impairment loss, foreign exchange loss/gain, and operating income, which are the most directly comparable GAAP measures in our consolidated financial statements:
(in U.S. $000's) Year ended December 31, 2016 over 2015 Constant
2016 reported Currency
Translational Constant 2015 change change
As reported FX Impact Currency as reported $ % $ %
GAP $ 4,334,815 $ 58,421 $ 4,393,236 $ 4,247,635 $ 87,180 2% $ 145,601 3%
Revenues 566,395 6,775 573,170 $ 515,875 $ 50,520 10% $ 57,295 11%
Costs of services, excluding
depreciation and amortization 66,062 579 66,641 56,026 10,036 18% 10,615 19%
SG&A expenses 283,529 4,256 287,785 254,389 29,140 11% 33,396 13%
Acquisition-related costs 11,829 - 11,829 601 11,228 1868% 11,228 1868%
Depreciation and amortization
expenses 40,861 658 41,519 42,032 (1,171) (3%) (513) (1%)
Gain on disposition of property, -
plant and equipment (1,282) - (1,282) (9,691) 8,409 (87%) 8,409 (87%)
Impairment loss 28,243 - 28,243 - 28,243 100% 28,243 100%
Foreign exchange loss (gain) 1,431 414 1,845 (2,322) 3,753 (162%) 4,167 (179%)
Operating income $ 135,722 $ 868 $ 136,590 $ 174,840 $ (39,118) (22%) $ (38,250) (22%)
(in U.S. $000's) Year ended December 31, 2015 over 2014 Constant
2015 reported Currency
Translational Constant 2014 change change
As reported FX Impact Currency as reported $ % $ %
GAP $ 4,247,635 $ 319,420 $ 4,567,055 $ 4,212,641 $ 34,994 1% $ 354,414 8%
Revenues 515,875 40,455 556,330 $ 481,097 $ 34,778 7% $ 75,233 16%
Costs of services, excluding -
depreciation and amortization 56,026 4,537 60,563 57,884 (1,858) (3%) 2,679 5%
SG&A expenses 254,389 22,362 276,751 248,220 6,169 2% 28,531 11%
Acquisition-related costs 601 - 601 - 601 100% 601 100%
Depreciation and amortization -
expenses 42,032 3,788 45,820 44,536 (2,504) (6%) 1,284 3%
Gain on disposition of property,
plant and equipment (9,691) (2,191) (11,882) (3,512) (6,179) 176% (8,370) 238%
Impairment loss - - - 8,084 (8,084) (100%) (8,084) (100%)
Foreign exchange gain (2,322) (143) (2,465) (2,042) (280) 14% (423) 21%
Operating income $ 174,840 $ 12,102 $ 186,942 $ 127,927 $ 46,913 37% $ 59,015 46%
Ritchie Bros. 66
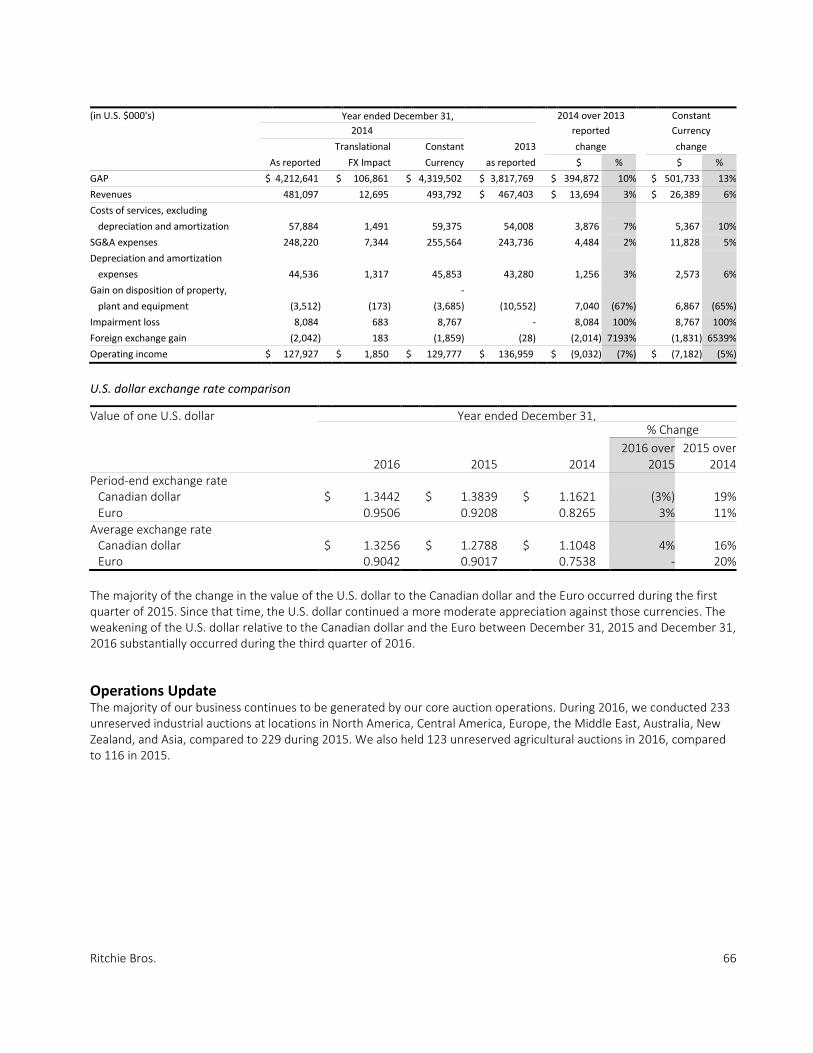
(in U.S. $000's) Year ended December 31, 2014 over 2013 Constant
2014 reported Currency
Translational Constant 2013 change change
As reported FX Impact Currency as reported $ % $ %
GAP $ 4,212,641 $ 106,861 $ 4,319,502 $ 3,817,769 $ 394,872 10% $ 501,733 13%
Revenues 481,097 12,695 493,792 $ 467,403 $ 13,694 3% $ 26,389 6%
Costs of services, excluding
depreciation and amortization 57,884 1,491 59,375 54,008 3,876 7% 5,367 10%
SG&A expenses 248,220 7,344 255,564 243,736 4,484 2% 11,828 5%
Depreciation and amortization
expenses 44,536 1,317 45,853 43,280 1,256 3% 2,573 6%
Gain on disposition of property, -
plant and equipment (3,512) (173) (3,685) (10,552) 7,040 (67%) 6,867 (65%)
Impairment loss 8,084 683 8,767 - 8,084 100% 8,767 100%
Foreign exchange gain (2,042) 183 (1,859) (28) (2,014) 7193% (1,831) 6539%
Operating income $ 127,927 $ 1,850 $ 129,777 $ 136,959 $ (9,032) (7%) $ (7,182) (5%)
U.S. dollar exchange rate comparison
Value of one U.S. dollar Year ended December 31, % Change
2016 2015 2014
2016 over 2015
2015 over 2014
Period-end exchange rate Canadian dollar $ 1.3442 $ 1.3839 $ 1.1621 (3%) 19% Euro 0.9506 0.9208 0.8265 3% 11%
Average exchange rate Canadian dollar $ 1.3256 $ 1.2788 $ 1.1048 4% 16% Euro 0.9042 0.9017 0.7538 - 20%
The majority of the change in the value of the U.S. dollar to the Canadian dollar and the Euro occurred during the first quarter of 2015. Since that time, the U.S. dollar continued a more moderate appreciation against those currencies. The weakening of the U.S. dollar relative to the Canadian dollar and the Euro between December 31, 2015 and December 31, 2016 substantially occurred during the third quarter of 2016. Operations Update The majority of our business continues to be generated by our core auction operations. During 2016, we conducted 233 unreserved industrial auctions at locations in North America, Central America, Europe, the Middle East, Australia, New Zealand, and Asia, compared to 229 during 2015. We also held 123 unreserved agricultural auctions in 2016, compared to 116 in 2015.
Ritchie Bros. 67
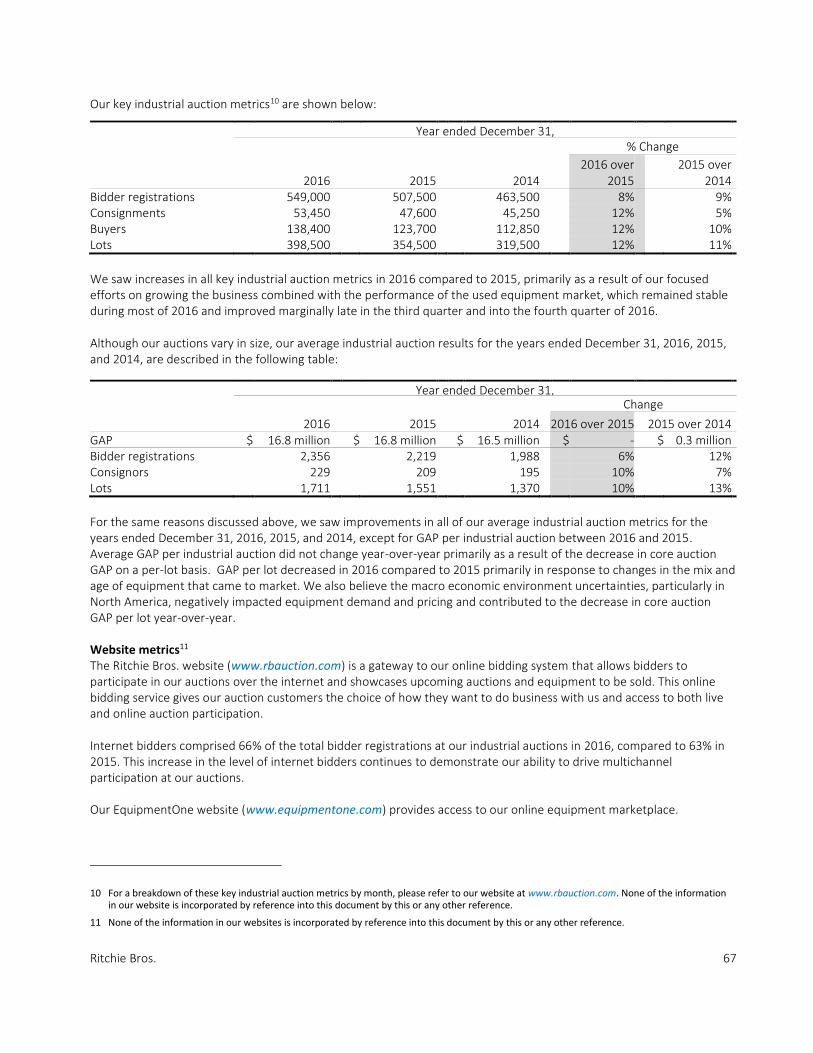
Our key industrial auction metrics10 are shown below:
Year ended December 31, % Change
2016
2015
2014
2016 over
2015
2015 over 2014
Bidder registrations 549,000 507,500 463,500 8% 9% Consignments 53,450 47,600 45,250 12% 5% Buyers 138,400 123,700 112,850 12% 10% Lots 398,500 354,500 319,500 12% 11%
We saw increases in all key industrial auction metrics in 2016 compared to 2015, primarily as a result of our focused efforts on growing the business combined with the performance of the used equipment market, which remained stable during most of 2016 and improved marginally late in the third quarter and into the fourth quarter of 2016. Although our auctions vary in size, our average industrial auction results for the years ended December 31, 2016, 2015, and 2014, are described in the following table:
Year ended December 31, Change
2016 2015 2014 2016 over 2015 2015 over 2014
GAP $ 16.8 million $ 16.8 million $ 16.5 million $ - $ 0.3 million Bidder registrations 2,356 2,219 1,988 6% 12% Consignors 229 209 195 10% 7% Lots 1,711 1,551 1,370 10% 13%
For the same reasons discussed above, we saw improvements in all of our average industrial auction metrics for the years ended December 31, 2016, 2015, and 2014, except for GAP per industrial auction between 2016 and 2015. Average GAP per industrial auction did not change year-over-year primarily as a result of the decrease in core auction GAP on a per-lot basis. GAP per lot decreased in 2016 compared to 2015 primarily in response to changes in the mix and age of equipment that came to market. We also believe the macro economic environment uncertainties, particularly in North America, negatively impacted equipment demand and pricing and contributed to the decrease in core auction GAP per lot year-over-year. Website metrics11 The Ritchie Bros. website (www.rbauction.com) is a gateway to our online bidding system that allows bidders to participate in our auctions over the internet and showcases upcoming auctions and equipment to be sold. This online bidding service gives our auction customers the choice of how they want to do business with us and access to both live and online auction participation. Internet bidders comprised 66% of the total bidder registrations at our industrial auctions in 2016, compared to 63% in 2015. This increase in the level of internet bidders continues to demonstrate our ability to drive multichannel participation at our auctions. Our EquipmentOne website (www.equipmentone.com) provides access to our online equipment marketplace.
10 For a breakdown of these key industrial auction metrics by month, please refer to our website at www.rbauction.com. None of the information
in our website is incorporated by reference into this document by this or any other reference.
11 None of the information in our websites is incorporated by reference into this document by this or any other reference.
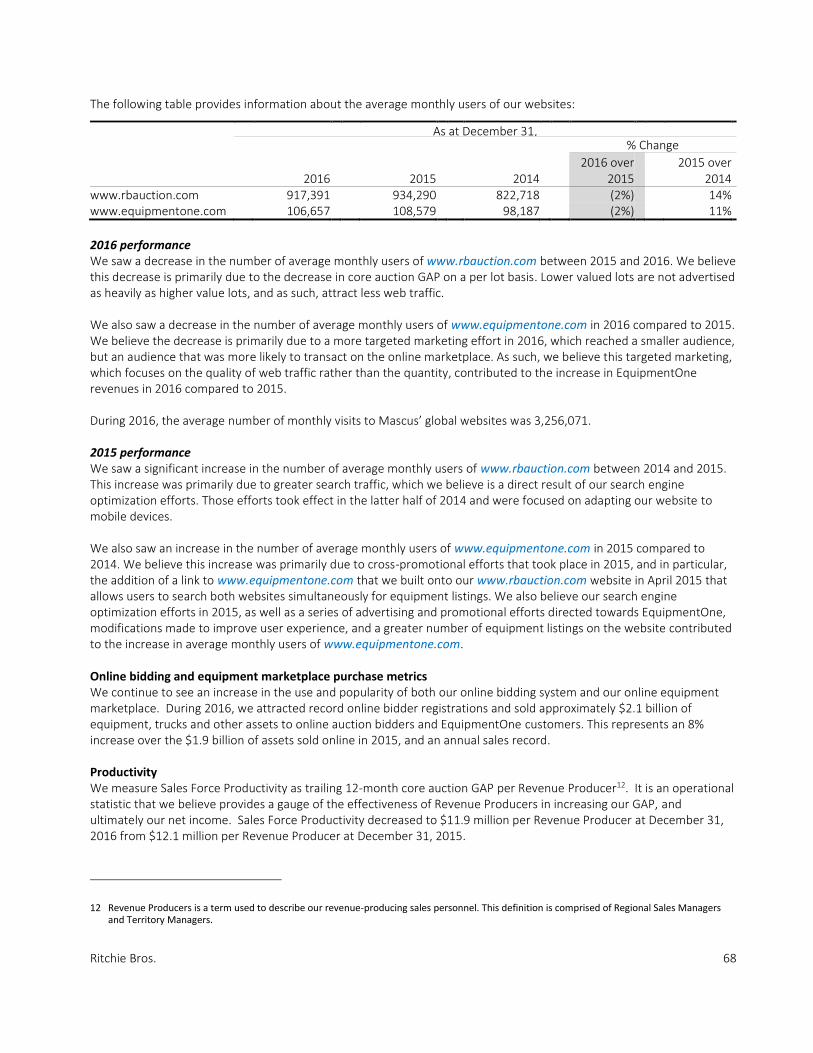
Ritchie Bros. 68
The following table provides information about the average monthly users of our websites:
As at December 31, % Change
2016
2015
2014
2016 over
2015
2015 over 2014
www.rbauction.com 917,391 934,290 822,718 (2%) 14% www.equipmentone.com 106,657 108,579 98,187 (2%) 11%
2016 performance We saw a decrease in the number of average monthly users of www.rbauction.com between 2015 and 2016. We believe this decrease is primarily due to the decrease in core auction GAP on a per lot basis. Lower valued lots are not advertised as heavily as higher value lots, and as such, attract less web traffic. We also saw a decrease in the number of average monthly users of www.equipmentone.com in 2016 compared to 2015. We believe the decrease is primarily due to a more targeted marketing effort in 2016, which reached a smaller audience, but an audience that was more likely to transact on the online marketplace. As such, we believe this targeted marketing, which focuses on the quality of web traffic rather than the quantity, contributed to the increase in EquipmentOne revenues in 2016 compared to 2015. During 2016, the average number of monthly visits to Mascus’ global websites was 3,256,071. 2015 performance We saw a significant increase in the number of average monthly users of www.rbauction.com between 2014 and 2015. This increase was primarily due to greater search traffic, which we believe is a direct result of our search engine optimization efforts. Those efforts took effect in the latter half of 2014 and were focused on adapting our website to mobile devices. We also saw an increase in the number of average monthly users of www.equipmentone.com in 2015 compared to 2014. We believe this increase was primarily due to cross-promotional efforts that took place in 2015, and in particular, the addition of a link to www.equipmentone.com that we built onto our www.rbauction.com website in April 2015 that allows users to search both websites simultaneously for equipment listings. We also believe our search engine optimization efforts in 2015, as well as a series of advertising and promotional efforts directed towards EquipmentOne, modifications made to improve user experience, and a greater number of equipment listings on the website contributed to the increase in average monthly users of www.equipmentone.com. Online bidding and equipment marketplace purchase metrics We continue to see an increase in the use and popularity of both our online bidding system and our online equipment marketplace. During 2016, we attracted record online bidder registrations and sold approximately $2.1 billion of equipment, trucks and other assets to online auction bidders and EquipmentOne customers. This represents an 8% increase over the $1.9 billion of assets sold online in 2015, and an annual sales record. Productivity We measure Sales Force Productivity as trailing 12-month core auction GAP per Revenue Producer12. It is an operational statistic that we believe provides a gauge of the effectiveness of Revenue Producers in increasing our GAP, and ultimately our net income. Sales Force Productivity decreased to $11.9 million per Revenue Producer at December 31, 2016 from $12.1 million per Revenue Producer at December 31, 2015.
12 Revenue Producers is a term used to describe our revenue-producing sales personnel. This definition is comprised of Regional Sales Managers
and Territory Managers.

Ritchie Bros. 69
The decrease was primarily attributable to the addition of three Revenue Producers from Kramer and one from Petrowsky, that were only contributing to our GAP for the portion of 2016 that was post-acquisition. Our headcount statistics, which exclude Xcira and Mascus employees, as at the end of each period are presented below:
Q4 2016 Q3 2016 Q2 2016 Q1 2016 Q4 2015 Q3 2015 Q2 2015 Q1 2015
Total full-time employees 1,649 1,641 1,600 1,559 1,522 1,513 1,515 1,479 Regional Sales Managers 51 50 45 49 46 48 46 45
Territory Managers 301 304 304 296 296 307 307 308
Revenue Producers 352 354 349 345 342 355 353 353
Trainee Territory Managers 23 22 28 26 31 26 24 30
Other sales personnel 109 110 103 99 95 88 87 79
Sales personnel 484 486 480 470 468 469 464 462
Total headcount (excluding Xcira and Mascus employees) increased by net 127 between December 31, 2015 and December 31, 2016, which consisted of increases of net 16 sales personnel and net 111 administrative and operational personnel. Included in the administrative and operational personnel increase was an increase of net 23 equipment inspectors, yard staff, and other personnel at our Edmonton, Canada, auction site to support growth in that region. While some of this increase came from the addition of new employees, a portion of the headcount increase in Edmonton was also the result of the conversion of part time employees to full time employees. The increase in administrative and operational personnel also included net 18 from RBFS13 and net five from EquipmentOne to support growth of those businesses, as well as net nine and net eight as a result of our acquisition of Petrowsky and Kramer, respectively. In addition, between December 31, 2015 and December 31, 2016, our finance team increased by net 13 as a result of a restructure of the finance department for the strategic purpose of partnering finance personnel with the leaders responsible for driving growth in the business. Between December 31, 2015 and December 31, 2016, the number of Revenue Producers increased by net 10 and the number of Trainee Territory Managers and other sales personnel increased by net six, resulting in the overall net 16 increase in total sales personnel. The increase in Revenue Producers during that period includes an increase in the number of Territory Managers by net five. Xcira had a total headcount of 52 full time employees at December 31, 2016, which has increased by net two since December 31, 2015. Mascus had a total headcount of 49 at December 31, 2016. Outstanding Share Data We are a public company and our common shares are listed under the symbol “RBA” on the NYSE and the TSX. On February 17, 2017, we had 106,822,475 common shares issued and outstanding, 555,028 share units awarded under our senior executive and employee performance share unit (“PSU”) plans, and stock options outstanding to purchase a total of 3,364,903 common shares. No preferred shares have been issued or are outstanding. The outstanding stock options had a weighted average exercise price of $24.02 per share and a weighted average remaining term of 7.4 years.
13 RBFS account managers generate financing fee revenue but do not produce GAP. As such, they are excluded from our definition of Revenue
Producers and the measurement of Sales Force Productivity, which is based on core auction GAP.
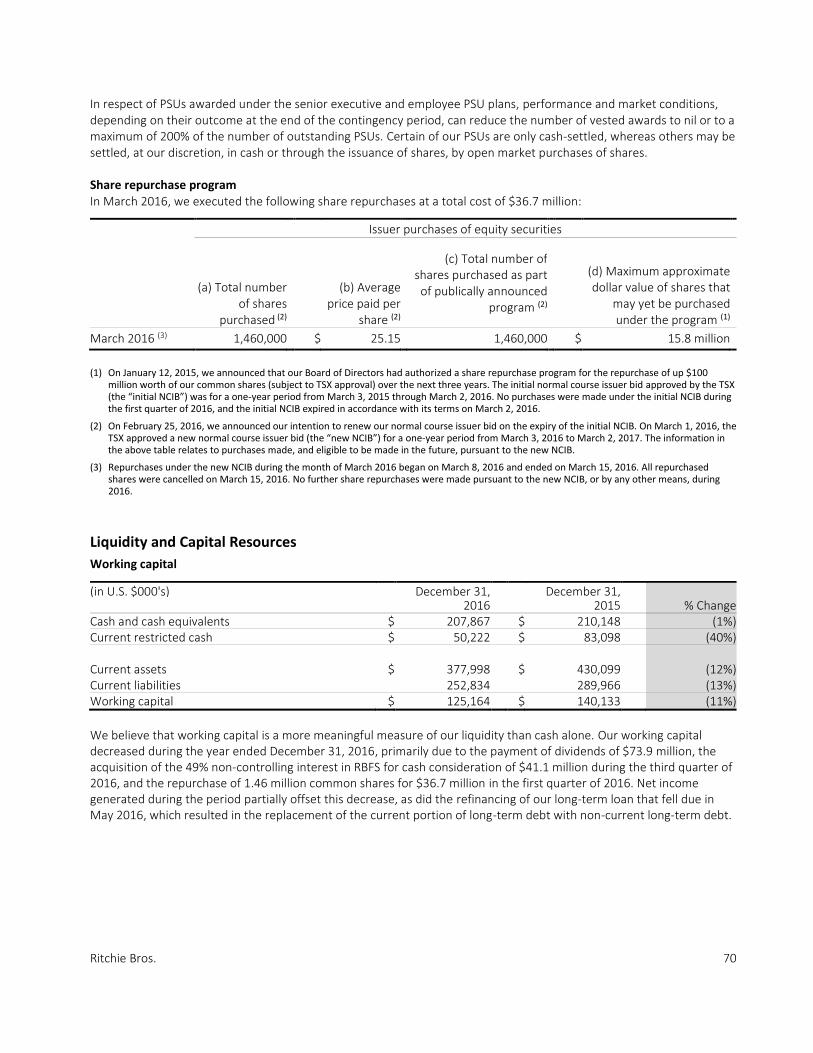
Ritchie Bros. 70
In respect of PSUs awarded under the senior executive and employee PSU plans, performance and market conditions, depending on their outcome at the end of the contingency period, can reduce the number of vested awards to nil or to a maximum of 200% of the number of outstanding PSUs. Certain of our PSUs are only cash-settled, whereas others may be settled, at our discretion, in cash or through the issuance of shares, by open market purchases of shares. Share repurchase program In March 2016, we executed the following share repurchases at a total cost of $36.7 million:
Issuer purchases of equity securities
(a) Total number of shares
purchased (2)
(b) Average price paid per
share (2)
(c) Total number of shares purchased as part of publically announced
program (2)
(d) Maximum approximate dollar value of shares that
may yet be purchased under the program (1)
March 2016 (3) 1,460,000 $ 25.15 1,460,000 $ 15.8 million
(1) On January 12, 2015, we announced that our Board of Directors had authorized a share repurchase program for the repurchase of up $100
million worth of our common shares (subject to TSX approval) over the next three years. The initial normal course issuer bid approved by the TSX (the “initial NCIB”) was for a one-year period from March 3, 2015 through March 2, 2016. No purchases were made under the initial NCIB during the first quarter of 2016, and the initial NCIB expired in accordance with its terms on March 2, 2016.
(2) On February 25, 2016, we announced our intention to renew our normal course issuer bid on the expiry of the initial NCIB. On March 1, 2016, the TSX approved a new normal course issuer bid (the “new NCIB”) for a one-year period from March 3, 2016 to March 2, 2017. The information in the above table relates to purchases made, and eligible to be made in the future, pursuant to the new NCIB.
(3) Repurchases under the new NCIB during the month of March 2016 began on March 8, 2016 and ended on March 15, 2016. All repurchased shares were cancelled on March 15, 2016. No further share repurchases were made pursuant to the new NCIB, or by any other means, during 2016.
Liquidity and Capital Resources
Working capital
(in U.S. $000's) December 31, December 31, 2016 2015 % Change Cash and cash equivalents $ 207,867 $ 210,148 (1%) Current restricted cash $ 50,222 $ 83,098 (40%) Current assets $ 377,998 $ 430,099 (12%) Current liabilities 252,834 289,966 (13%) Working capital $ 125,164 $ 140,133 (11%)
We believe that working capital is a more meaningful measure of our liquidity than cash alone. Our working capital decreased during the year ended December 31, 2016, primarily due to the payment of dividends of $73.9 million, the acquisition of the 49% non-controlling interest in RBFS for cash consideration of $41.1 million during the third quarter of 2016, and the repurchase of 1.46 million common shares for $36.7 million in the first quarter of 2016. Net income generated during the period partially offset this decrease, as did the refinancing of our long-term loan that fell due in May 2016, which resulted in the replacement of the current portion of long-term debt with non-current long-term debt.
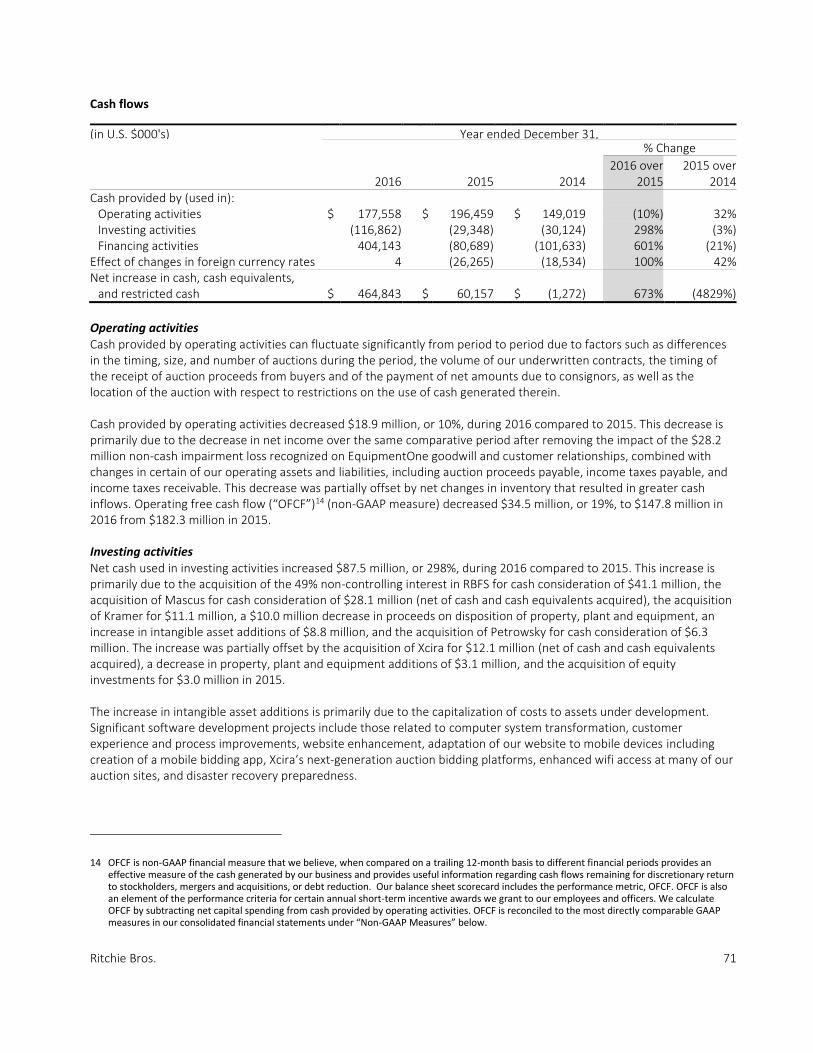
Ritchie Bros. 71
Cash flows
(in U.S. $000's) Year ended December 31, % Change
2016 2015 2014
2016 over 2015
2015 over 2014
Cash provided by (used in): Operating activities $ 177,558 $ 196,459 $ 149,019 (10%) 32% Investing activities (116,862) (29,348) (30,124) 298% (3%) Financing activities 404,143 (80,689) (101,633) 601% (21%)
Effect of changes in foreign currency rates 4 (26,265) (18,534) 100% 42% Net increase in cash, cash equivalents,
and restricted cash $ 464,843 $ 60,157 $ (1,272) 673% (4829%)
Operating activities Cash provided by operating activities can fluctuate significantly from period to period due to factors such as differences in the timing, size, and number of auctions during the period, the volume of our underwritten contracts, the timing of the receipt of auction proceeds from buyers and of the payment of net amounts due to consignors, as well as the location of the auction with respect to restrictions on the use of cash generated therein. Cash provided by operating activities decreased $18.9 million, or 10%, during 2016 compared to 2015. This decrease is primarily due to the decrease in net income over the same comparative period after removing the impact of the $28.2 million non-cash impairment loss recognized on EquipmentOne goodwill and customer relationships, combined with changes in certain of our operating assets and liabilities, including auction proceeds payable, income taxes payable, and income taxes receivable. This decrease was partially offset by net changes in inventory that resulted in greater cash inflows. Operating free cash flow (“OFCF”)14 (non-GAAP measure) decreased $34.5 million, or 19%, to $147.8 million in 2016 from $182.3 million in 2015. Investing activities Net cash used in investing activities increased $87.5 million, or 298%, during 2016 compared to 2015. This increase is primarily due to the acquisition of the 49% non-controlling interest in RBFS for cash consideration of $41.1 million, the acquisition of Mascus for cash consideration of $28.1 million (net of cash and cash equivalents acquired), the acquisition of Kramer for $11.1 million, a $10.0 million decrease in proceeds on disposition of property, plant and equipment, an increase in intangible asset additions of $8.8 million, and the acquisition of Petrowsky for cash consideration of $6.3 million. The increase was partially offset by the acquisition of Xcira for $12.1 million (net of cash and cash equivalents acquired), a decrease in property, plant and equipment additions of $3.1 million, and the acquisition of equity investments for $3.0 million in 2015. The increase in intangible asset additions is primarily due to the capitalization of costs to assets under development. Significant software development projects include those related to computer system transformation, customer experience and process improvements, website enhancement, adaptation of our website to mobile devices including creation of a mobile bidding app, Xcira’s next-generation auction bidding platforms, enhanced wifi access at many of our auction sites, and disaster recovery preparedness.
14 OFCF is non-GAAP financial measure that we believe, when compared on a trailing 12-month basis to different financial periods provides an
effective measure of the cash generated by our business and provides useful information regarding cash flows remaining for discretionary return to stockholders, mergers and acquisitions, or debt reduction. Our balance sheet scorecard includes the performance metric, OFCF. OFCF is also an element of the performance criteria for certain annual short-term incentive awards we grant to our employees and officers. We calculate OFCF by subtracting net capital spending from cash provided by operating activities. OFCF is reconciled to the most directly comparable GAAP measures in our consolidated financial statements under “Non-GAAP Measures” below.

Ritchie Bros. 72
CAPEX Intensity presents net capital spending as a percentage of revenue. We believe that comparing CAPEX Intensity on a trailing 12-month basis for different financial periods provides useful information as to the amount of capital expenditure that we require to generate revenues.
(in U.S. $ millions) Year ended December 31, Change
2016
2015
2014
2016 over
2015
2015 over 2014
Property, plant and equipment additions $ 18.9 $ 22.1 $ 25.0 (14%) (12%)
Intangible asset additions 17.6 8.8 13.9 100% (37%)
Proceeds on disposition of property
plant and equipment (6.7) (16.7) (9.3) (60%) 80%
Net capital spending $ 29.8 $ 14.2 $ 29.6 110% (52%)
Revenues $ 566.4 $ 515.9 $ 481.1 10% 7%
CAPEX intensity 5.3% 2.8% 6.2% 250 bps -340 bps
CAPEX Intensity increased in 2016 compared to 2015, primarily due to the fact that the net capital spending increase of 110% exceeded the revenue increase of 10% year-over-year. The net capital spending increase was primarily the result of a $10.0 million, or 60%, decrease in proceeds on disposition of property, plant and equipment, combined with an $8.8 million increase in intangible asset additions, as discussed above. The decrease in proceeds on disposition of property, plant and equipment year-over-year is primarily due to the $8.4 million gain on sale of excess land in Edmonton, Canada in the fourth quarter of 2015. Financing activities Net cash provided by financing activities increased $484.8 million, or 601%, in 2016 compared to 2015, primarily due to gross proceeds of $500.0 million received in exchange for the issue of the Notes in December 2016. This increase was partially offset by the payment of $10.6 million in debt issue costs also in 2016. The net increase in cash provided by financing activities was also the result of $147.1 million in proceeds from our drawings on the Multicurrency Facilities to refinance pre-existing long-term debt. The increase was offset by the use of the proceeds to repay existing indebtedness in the fourth quarter of 2016, which included $55.9 million of pre-existing long-term debt due in May 2022 and $45.7 million of debt that was being refinanced on a long-term basis under the pre-existing credit facilities. The increase was also offset by the repayment of long-term debt of $46.6 million in the second quarter of 2016 related to the Canadian dollar 60 million term loan that fell due in May 2016, as well as payment of $6.8 million in debt extinguishment costs in the fourth quarter of 2016 associated with the early termination of the $55.9 million of long-term debt. We declared and paid regular cash dividends of $0.16 per common share for the quarters ended December 31, 2015 and March 31, 2016, and we declared and paid regular cash dividends of $0.17 per common share for the quarters ended June 30, 2016 and September 30, 2016. We have declared, but not yet paid, a dividend of $0.17 per common share for the quarter ended December 31, 2016. Total dividend payments during 2016 were $70.5 million to stockholders and $3.4 million to non-controlling interests. This compares to total dividend payments of $64.3 million to stockholders and $1.3 million to non-controlling interests during 2015. All dividends we pay are “eligible dividends” for Canadian income tax purposes unless indicated otherwise. Our dividend payout ratio, which we calculate as dividends paid to stockholders divided by net income attributable to stockholders, increased 2960 bps to 76.8% for the year ended December 31, 2016 from 47.2% for the year ended December 31, 2015. This increase is primarily the result of the decrease in net income attributable to stockholders combined with the increase in our dividends paid to stockholders over the same comparative period.
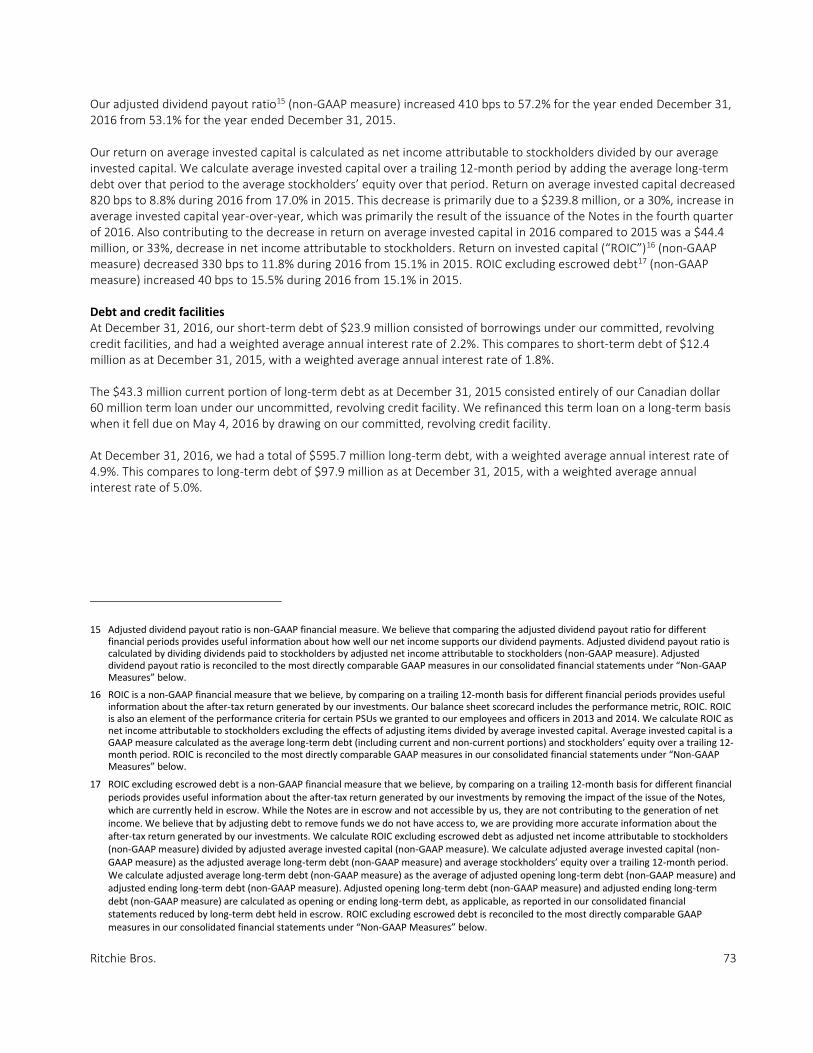
Ritchie Bros. 73
Our adjusted dividend payout ratio15 (non-GAAP measure) increased 410 bps to 57.2% for the year ended December 31, 2016 from 53.1% for the year ended December 31, 2015. Our return on average invested capital is calculated as net income attributable to stockholders divided by our average invested capital. We calculate average invested capital over a trailing 12-month period by adding the average long-term debt over that period to the average stockholders’ equity over that period. Return on average invested capital decreased 820 bps to 8.8% during 2016 from 17.0% in 2015. This decrease is primarily due to a $239.8 million, or a 30%, increase in average invested capital year-over-year, which was primarily the result of the issuance of the Notes in the fourth quarter of 2016. Also contributing to the decrease in return on average invested capital in 2016 compared to 2015 was a $44.4 million, or 33%, decrease in net income attributable to stockholders. Return on invested capital (“ROIC”)16 (non-GAAP measure) decreased 330 bps to 11.8% during 2016 from 15.1% in 2015. ROIC excluding escrowed debt17 (non-GAAP measure) increased 40 bps to 15.5% during 2016 from 15.1% in 2015. Debt and credit facilities At December 31, 2016, our short-term debt of $23.9 million consisted of borrowings under our committed, revolving credit facilities, and had a weighted average annual interest rate of 2.2%. This compares to short-term debt of $12.4 million as at December 31, 2015, with a weighted average annual interest rate of 1.8%. The $43.3 million current portion of long-term debt as at December 31, 2015 consisted entirely of our Canadian dollar 60 million term loan under our uncommitted, revolving credit facility. We refinanced this term loan on a long-term basis when it fell due on May 4, 2016 by drawing on our committed, revolving credit facility. At December 31, 2016, we had a total of $595.7 million long-term debt, with a weighted average annual interest rate of 4.9%. This compares to long-term debt of $97.9 million as at December 31, 2015, with a weighted average annual interest rate of 5.0%.
15 Adjusted dividend payout ratio is non-GAAP financial measure. We believe that comparing the adjusted dividend payout ratio for different
financial periods provides useful information about how well our net income supports our dividend payments. Adjusted dividend payout ratio is calculated by dividing dividends paid to stockholders by adjusted net income attributable to stockholders (non-GAAP measure). Adjusted dividend payout ratio is reconciled to the most directly comparable GAAP measures in our consolidated financial statements under “Non-GAAP Measures” below.
16 ROIC is a non-GAAP financial measure that we believe, by comparing on a trailing 12-month basis for different financial periods provides useful information about the after-tax return generated by our investments. Our balance sheet scorecard includes the performance metric, ROIC. ROIC is also an element of the performance criteria for certain PSUs we granted to our employees and officers in 2013 and 2014. We calculate ROIC as net income attributable to stockholders excluding the effects of adjusting items divided by average invested capital. Average invested capital is a GAAP measure calculated as the average long-term debt (including current and non-current portions) and stockholders’ equity over a trailing 12-month period. ROIC is reconciled to the most directly comparable GAAP measures in our consolidated financial statements under “Non-GAAP Measures” below.
17 ROIC excluding escrowed debt is a non-GAAP financial measure that we believe, by comparing on a trailing 12-month basis for different financial periods provides useful information about the after-tax return generated by our investments by removing the impact of the issue of the Notes, which are currently held in escrow. While the Notes are in escrow and not accessible by us, they are not contributing to the generation of net income. We believe that by adjusting debt to remove funds we do not have access to, we are providing more accurate information about the after-tax return generated by our investments. We calculate ROIC excluding escrowed debt as adjusted net income attributable to stockholders (non-GAAP measure) divided by adjusted average invested capital (non-GAAP measure). We calculate adjusted average invested capital (non-GAAP measure) as the adjusted average long-term debt (non-GAAP measure) and average stockholders’ equity over a trailing 12-month period. We calculate adjusted average long-term debt (non-GAAP measure) as the average of adjusted opening long-term debt (non-GAAP measure) and adjusted ending long-term debt (non-GAAP measure). Adjusted opening long-term debt (non-GAAP measure) and adjusted ending long-term debt (non-GAAP measure) are calculated as opening or ending long-term debt, as applicable, as reported in our consolidated financial statements reduced by long-term debt held in escrow. ROIC excluding escrowed debt is reconciled to the most directly comparable GAAP measures in our consolidated financial statements under “Non-GAAP Measures” below.

Ritchie Bros. 74
Our long-term debt and available credit facilities at December 31, 2016 and 2015 were as follows:
(in U.S. $000's) Year ended December 31, 2016 2015 % Change Long-term debt $ 595,706 $ 97,915 508% Committed
Revolving credit facilities 687,000 312,693 120% Revolving credit facilities available 548,649 300,358 83% Delayed draw facility 325,000 - 100% Delayed draw facility available 325,000 - 100%
Uncommitted Revolving credit facilities - 64,533 (100%) Revolving credit facilities available - 42,973 (100%) Non-revolving credit facilities - 225,000 (100%) Non-revolving credit facilities available - 127,076 (100%)
Total credit facilities $ 1,012,000 $ 602,226 68% Total credit facilities available 873,649 470,407 86%
Syndicated credit facility As noted under “Strategy” above, on October 27, 2016, we closed the new five-year Credit Agreement with a syndicate of lenders, including BofA and Royal Bank of Canada, which provides us with:
1) The $675.0 million Multicurrency Facilities; 2) The $325.0 million Delayed-Draw Facility; and 3) At our election and subject to certain conditions, including receipt of related commitments, incremental term loan
facilities and/or increases to the Multicurrency Facilities in an aggregate amount of up to $50 million.
We may use the proceeds from the Multicurrency Facilities to refinance certain existing indebtedness and for other general corporate purposes. Proceeds from the Delayed-Draw Facility can only be used to finance transactions contemplated by the Merger Agreement. The Multicurrency Facilities remain in place and outstanding even if the Merger Agreement is terminated and the Merger is not consummated. The New Facilities will remain unsecured until the closing of the Merger, after which the New Facilities will be secured by various of our assets. The New Facilities may become unsecured again after the Merger is consummated, subject to Ritchie Bros. meeting specified credit rating or leverage ratio conditions. The New Facilities will mature five years after the closing date of the Credit Agreement. The Delayed-Draw Facility will amortize in equal quarterly installments in an annual amount of 5% for the first two years after the closing of the Merger, and 10% in the third through fifth years after the closing of the Merger, with the balance payable at maturity. Borrowings under the Credit Agreement will bear floating rates of interest, which, at our option, will be based on either a base rate (or Canadian prime rate for certain Canadian dollar borrowings) or LIBOR (or such customary floating rate customarily used by BofA for currencies other than U.S. dollars). In either case, an applicable margin is added to the rate. The applicable margin ranges from 0.25% to 1.50% for base rate loans, and 1.25% to 2.50% for LIBOR (or the equivalent of such currency) loans, depending on our leverage ratio at the time of borrowing. We must also pay quarterly in arrears a commitment fee equal to the daily amount of the unused commitments under the New Facilities multiplied by an applicable percentage per annum (which ranges from 0.25% to 0.50% depending on our leverage ratio). We incurred debt issuance costs of $6.4 million in connection with the Credit Agreement. At December 31, 2016, we had unamortized deferred debt issuance costs relating to the Credit Agreement of $6.2 million.
Ritchie Bros. 75
On October 27, 2016, we terminated our pre-existing revolving bi-lateral credit facilities, which consisted of $313.0 million of committed revolving credit facilities and $292.2 million of uncommitted credit facilities, as well as the $50.0 million bulge credit facility (the “Old Credit Facilities”). On the same day, we also prepaid all outstanding debt issued under the Old Credit Facilities using funds from the New Facilities, which resulted in the fixed rate long-term debt being replaced by floating rate long-term debt and $6.8 million in early termination fees, which were recognized in net income as debt extinguishment costs on the transaction date. Senior unsecured notes On December 21, 2016, we completed the offering of $500.0 million aggregate principal amount of 5.375% Notes due January 15, 2025. The Notes were offered only to qualified institutional buyers in reliance on Rule 144A under the Securities Act of 1933, as amended (the “Securities Act”), and outside the United States, only to non-U.S. investors pursuant to Regulation S under the Securities Act. The Notes have not been registered under the Securities Act or any state securities laws and may not be offered or sold in the United States absent an effective registration statement or an applicable exemption from registration requirements or a transaction not subject to the registration requirements of the Securities Act or any state securities laws. We will use the proceeds of the offering to finance the transactions contemplated by the Merger Agreement. Upon the closing of the offering, the gross proceeds from the offering together with certain additional amounts including prepaid interest were deposited in to an escrow account. The funds will be held in escrow until the completion of the transactions contemplated by the Merger Agreement. If the acquisition is not consummated on or before October 31, 2017, or the Merger Agreement is terminated prior to such date, we will redeem all of the outstanding Notes at a redemption price equal to 100% of the original offering price of the Notes, plus accrued and unpaid interest. Until the release of the proceeds in the escrow account, the Notes will be secured by a first priority security interest in the escrow account. Upon the completion of the Acquisition, the Notes will be senior unsecured obligations. The Notes will be jointly and severally guaranteed on an unsecured, unsubordinated basis, subject to certain exceptions, by each of our subsidiaries, which guarantees the obligations under the Credit Agreement. We incurred debt issuance costs of $4.2 million in connection with the offering of the Notes. At December 31, 2016, we had unamortized deferred debt issuance costs relating to the Notes of $4.2 million. GS Bank Facilities As noted under “Strategy” above, on August 29 ,2016, we obtained the Commitment Letter from GS Bank pursuant to which GS Bank was committed to provide the $150.0 million Revolving Facility and the $850.0 million Bridge Facility. No draws were made against these Facilities in 2016. In conjunction with the closing of the Credit Agreement in October 2016, we terminated the $150.0 million Revolving Facility and $350.0 million of the $850.0 million Bridge Facility with GS Bank. In conjunction with the issuance of the Notes in December 2016, we terminated the remaining $500.0 million of the $850.0 million Bridge Facility with GS Bank. Other credit facilities As at December 31, 2016, we also have $12.0 million in committed, revolving credit facilities, in certain foreign jurisdictions, which expire on May 31, 2018. Debt covenants The Credit Agreement contains certain covenants that could limit the ability of the Company and certain of its subsidiaries to, among other things and subject to certain significant exceptions: (i) incur, assume or guarantee additional indebtedness; (ii) declare or pay dividends or make other distributions with respect to, or purchase or otherwise acquire or retire for value, equity interests; (iii) make loans, advances or other investments; (iv) incur liens; (v) sell or otherwise dispose of assets; and (vi) enter into transactions with affiliates. The Credit Agreement also provides for certain events of default, which, if any of them occurs, would permit or require the principal, premium, if any, interest and any other monetary obligations on all the then outstanding under the Credit Agreement to be declared immediately due and payable.

Ritchie Bros. 76
The Notes were issued pursuant to an indenture, dated December 21, 2016, with U.S. Bank National Association, as trustee (the “Indenture”). The Indenture contains covenants that limit our ability, and the ability of certain of our subsidiaries to, among other things and subject to certain significant exceptions: (i) incur, assume or guarantee additional indebtedness; (ii) declare or pay dividends or make other distributions with respect to, or purchase or otherwise acquire or retire for value, equity interests; (iii) make any principal payment on, or redeem or repurchase, subordinated debt; (iv) make loans, advances or other investments; (v) incur liens; (vi) sell or otherwise dispose of assets; and (vii) enter into transactions with affiliates. The Indenture also provides for certain events of default, which, if any of them occurs, would permit or require the principal, premium, if any, interest and any other monetary obligations on all the then outstanding Notes under the applicable indenture to be declared immediately due and payable. We were in compliance with all financial and other covenants applicable to our credit facilities at December 31, 2016. Contractual obligations at December 31, 2016
(in U.S. $000's) Payments due by period Less than 1 to 3 3 to 5 More than
Total 1 year years years 5 years Long-term debt obligations:
Principal $ 623,838 $ 23,912 $ - $ 99,926 $ 500,000 Interest 220,812 10,205 58,482 58,062 94,063
Capital lease obligations 4,241 1,484 2,366 391 - Operating lease obligations 105,436 12,664 21,433 14,623 56,716 Purchase obligations 3,197 3,197 - - - Share unit liabilities 14,665 10,422 4,243 - - Other non-current liabilities 7,344 - 5,485 - 1,859
Total contractual obligations $ 979,533 $ 61,884 $ 92,009 $ 173,002 $ 652,638
Our long-term debt obligations included in the table above consist of draws under the New Facilities and our Notes. Our finance leases relate primarily to computer, automotive, and yard equipment. Our operating leases relate primarily to land on which we operate regional auction sites and administrative buildings, located in North America, Central America, Europe, the Middle East, and Asia. Other operating leases include leases of automotive, yard, and office equipment. Purchase obligations relate to capital expenditure commitments we have made with respect to property, plant and equipment and intangible assets. Share unit liabilities reflect the amounts of the future cash-settlement obligations of share units earned that are expected to vest as at December 31, 2016. In the normal course of our business, we may guarantee a minimum level of proceeds in connection with the sale at auction of a consignor’s equipment. Our total exposure as at December 31, 2016 from these guarantee contracts was $15.2 million, compared to $55.8 million at December 31, 2015, which we anticipate will be fully covered by the proceeds that we will receive from the sale at auction of the related equipment, plus our commission. We do not record any liability in our financial statements in respect of these guarantee contracts, and they are not reflected in the contractual obligations table above. Going concern assessment We believe our existing working capital and availability under our credit facilities, including the New Facilities, the Notes, and our other credit facilities, are sufficient to satisfy our present operating requirements and contractual obligations (detailed above), as well as to fund future growth including, but not limited to, mergers and acquisitions, development of EquipmentOne and Mascus, and other growth opportunities.

Ritchie Bros. 77
Off-Balance Sheet Arrangements We have no off-balance sheet arrangements that have or are reasonably likely to have a current or future material effect on our financial condition, changes in financial condition, revenues or expenses, financial performance, liquidity, capital expenditures or capital resources. Critical Accounting Policies, Judgments, Estimates and Assumptions In preparing our consolidated financial statements in conformity with US GAAP, we must make decisions that impact the reported amounts and related disclosures. Such decisions include the selection of the appropriate accounting principles to be applied and the assumptions on which to base accounting estimates. In reaching such decisions, we apply judgments based on our understanding and analysis of the relevant circumstances and historical experience. On an ongoing basis, we evaluate these judgments and estimates, including:
recognition of revenue from inventory sales net of cost of inventory sold;
valuation of consignors’ equipment and other assets subject to guarantee contracts;
consolidation of variable interest entities;
the grant date fair value of stock option and share unit awards;
the identification of reporting units and recoverability of goodwill;
recoverability of long-lived assets; and
recoverability of deferred income tax assets.
Actual amounts could differ materially from those estimated by us at the time our consolidated financial statements are prepared. The following discussion of critical accounting policies and estimates is intended to supplement the significant accounting policies presented in the notes to our consolidated financial statements included in “Part II, Item 8: Financial Statements and Supplementary Data” presented in our Annual Report on Form 10-K, which summarize the accounting policies and methods used in the preparation of those consolidated financial statements. The policies and the estimates discussed below are included here because they require more significant judgments and estimates in the preparation and presentation of our consolidated financial statements than other policies and estimates. Recognition of revenue from inventory sales net of cost of inventory sold We record revenues from inventory sales net of costs of inventory sold within commission revenue on the consolidated income statement. This commission revenue, as well as commission revenues earned on straight commission and guarantee contracts, is classified as revenues from the rendering of services as opposed to revenues from the sale of goods. All of the equipment sold at our auctions is sold to the highest bidder on an unreserved basis. Although we take title to the equipment we sell under inventory contracts, the period of direct ownership is relatively short, and the equipment is processed in the same manner as other consigned equipment such that the risks and rewards of ownership are not substantially different from those in our guarantee contracts. As such, we have determined that we are acting as an agent when we sell inventory, not as a principal. And in that capacity, we record revenue from inventory sales on a net basis, as opposed to a gross basis. We value each inventory contract at the lower of cost and net realizable value. In addition, we monitor the results from the sale of this inventory at auction after the balance sheet date up to the release of our financial statements and record any losses realized on inventory contracts.
Ritchie Bros. 78
Consolidation of variable interest entities When we acquire a variable interest entity (“VIE”), we must determine whether we are the primary beneficiary. If we determine that we are the primary beneficiary, we are required to consolidate the VIE. The primary beneficiary determination requires us to make assumptions as to which activities most significantly impact the VIE’s economic performance, identify the existence of any de facto related parties, and make an assessment as to whether we have the power to direct the activities determined to most significantly impact the VIE’s economic performance. Valuation of performance share units subject to market conditions We initially measure the cost of share units that are subject to market vesting conditions using a binomial model to determine the fair value of the liability incurred. Estimating fair value for share-based payment transactions requires determination of the most appropriate valuation model, which is dependent on the terms and conditions of the grant. This estimate also requires determination of the most appropriate inputs to the valuation model, including the expected life of the share unit, volatility and dividend yield, as well as making assumptions about them. For cash-settled share-based payment transactions, the liability needs to be re-measured at the end of each reporting period up to the date of settlement. This requires a reassessment of the estimates used at the end of each reporting period. Identification of reporting units and recoverability of goodwill We perform impairment tests on goodwill on an annual basis in accordance with US GAAP, or more frequently if events or changes in circumstances indicate that those assets might be impaired. As permitted by US GAAP, we performed a Step 0 qualitative assessment during our annual impairment test on December 31, 2016. We determined that it was not more likely than not that the fair value of each reporting unit was less than its carrying amount, and, therefore, the two-step impairment test (described below) was not required. Impairment testing involves determination of reporting units, which we determined to be at the same level as our reportable operating segment for core auction, and one below for EquipmentOne and Mascus, which are included in our other reportable operating segment. One of the key judgments made in arriving at this determination was that the business components of the core auction operating segment could be aggregated into a single reporting unit on the basis of similarity in the nature of their services, the type of class of customer for their services, and the methods used to provide their services. Goodwill related to the acquisition of auction businesses and Xcira, the provider of our online auction bidding technology, have been assigned to the core auction reporting unit. Goodwill arising from the acquisition of AssetNation, the provider of our online marketplaces, has been assigned to the EquipmentOne reporting unit. Where Step 0 indicates that it is more likely than not that a reporting unit’s fair value is less than its carrying amount, a two-step impairment test is performed. The first step of the two-step impairment test prescribed by US GAAP is to identify potential impairment by comparing the reporting unit fair value with its carrying amount, including goodwill. If the carrying amount of the reporting unit exceeds its fair value, the second step of the impairment test is performed, wherein the carrying amount of the goodwill in the reporting unit is compared to its implied fair value. The implied fair value is calculated by performing a hypothetical purchase price allocation in the same manner as if the reporting unit was being acquired in a business combination. An impairment loss is recognized for the excess of the goodwill’s carrying amount over its implied fair value. We measure the fair value of our reporting units using a blended analysis of the earnings approach, which employs a discounted cash flow methodology, and the market approach, which employs a multiple of earnings methodology. We believe that using a blended approach compensates for the inherent risks associated with each model if used on a stand-alone basis. In applying these approaches, management is required to make significant estimates and assumptions about the timing and amount of future cash flows, revenue growth rates, and discount rates, which requires a significant amount of judgment. As a result, actual results may differ from those used in the two-step goodwill impairment test.

Ritchie Bros. 79
Core Auction reporting unit Significant estimates used in the earnings approach valuation of our Core Auction reporting unit are our discount rate of 10%, which reflects the risk premium on this reporting unit based on assessments of risks related to projected cash flows, and our long-term growth rate of 2%, which is used to extrapolate cash flows beyond the five-year forecast. EquipmentOne reporting unit goodwill Goodwill arising from the acquisition of AssetNation, the provider of our online marketplaces, forms part of the EquipmentOne reporting unit. During the three months ended September 30, 2016, an indicator of impairment was identified with respect to the EquipmentOne reporting unit. The indicator consisted of a decline in actual and forecasted revenue and operating income compared with previously projected results, which was primarily due to the recent performance of the EquipmentOne reporting unit. As a result of the identification of an indicator of impairment of the EquipmentOne reporting unit, we performed the US GAAP two-step goodwill impairment test at September 30, 2016. Consistent with our policy noted above, we measured the fair value of the EquipmentOne reporting unit using a blended analysis of the earnings approach and the market approach, giving equal weighting to both. Using the cash flow methodology of the earnings approach, the fair value of the EquipmentOne reporting unit was measured based on the present value of the cash flows that we expect the reporting unit to generate in the future. The earnings approach valuation was most sensitive to the following assumptions:
(i) Revenue growth rate
Cash flow forecasts estimate a compound annual growth rate of 5.5% in fiscal 2017, 10% in each of fiscal 2018 through 2021, 8.3% in fiscal 2022, 6.5% in fiscal 2023, and 4.8% in fiscal 2023. The estimated growth rate used in determining the EquipmentOne reporting unit’s future cash flows is based on our expectation of future growth rates resulting from application of our business strategy.
(ii) Discount rate
We applied a discount rate of 12% based on the revenue growth rate for the EquipmentOne reporting unit, with this discount rate reflecting the risk premium based on an assessment of risk related to projected cash flows. We have exercised significant judgment in determining that the discount rate reflects investors’ expectations and takes into consideration market rates of return, capital structure, company size, and industry risk.
Cash flows beyond the five-year period were extrapolated using a long-term growth rate estimated to be 3.0%. The most significant estimates used in the market approach were (i) the determination of the most comparable publicly-traded firms in terms of the nature, size, growth, and profitability of the business, (ii) the risk and return on the investment, and (iii) an assessment of comparable revenue and operating income multiples. As step one of the goodwill impairment test indicated that the carrying amount (including goodwill) of the EquipmentOne reporting unit exceeded its fair value, we proceeded to step two, wherein the step one fair value of the EquipmentOne reporting unit was used to estimate the implied fair value of the goodwill.

Ritchie Bros. 80
The second step of the goodwill impairment test involved allocating the EquipmentOne reporting unit fair value to all the assets and liabilities of that reporting unit, including identifiable intangible assets, deferred tax assets, and deferred tax liabilities, based on their estimated fair values. Based on the results of the goodwill impairment test, we recorded an impairment loss on the EquipmentOne reporting unit goodwill of $23.6 million during the quarter ended September 30, 2016. Management performed a qualitative assessment of impairment on the EquipmentOne reporting unit as part of the annual goodwill test on December 31, 2016, and concluded that there were no indicators of impairment that would require completion of the two-step quantitative impairment test at that date. Mascus reporting unit Significant estimates used in the earnings approach valuation of our Mascus reporting unit are our discount rate of 12%, which reflects the risk premium on this reporting unit based on assessments of risks related to projected cash flows, and our long-term growth rate of 3.5%, which is used to extrapolate cash flows beyond the five-year forecast. Recoverability of long-lived assets Long-lived assets, which are comprised of property, plant and equipment and definite-lived intangible assets, are assessed for impairment whenever events or circumstances indicate that their carrying amounts may not be recoverable, or earlier when the asset is classified as held for sale. For the purpose of impairment testing, long-lived assets are grouped and tested for recoverability at the lowest level that generates independent cash flows from another asset group. The carrying amount of the long-lived asset group is not recoverable if it exceeds the sum of the future undiscounted cash flows expected to result from the long-lived asset group’s use and eventual disposition. In order to determine the future undiscounted cash flows, we are required to estimate the useful lives of the long-lived asset groups, as well as form expectations of future revenues and expenses, including costs to maintain the long-lived asset groups over their respective useful lives. Forming such expectations involves the use of significant judgments and estimates, which can vary depending on our intention with respect to the future use of the long-lived asset group, the past performance of the asset group, and availability of approved budgets and forecasts. Where the carrying amount of the long-lived asset group is not recoverable because it exceeds the sum of the future undiscounted cash flows, the fair value of the long-lived asset group is determined in order to calculate any impairment loss. An impairment loss is measured as the excess of the long-lived asset group’s carrying amount over its fair value. Fair value is based on valuation techniques or third party appraisals. Significant judgments and estimates used in determining fair value vary depending on the valuation approach adopted, but can include an assessment of who the comparable market participants are, which recent events impact the market the long-lived asset group operates in, planned future use of the long-lived asset group, our experience with similar long-lived asset group sales and related selling fees, as well as costs to prepare the long-lived asset group for sale. At September 30, 2016, for the same reason noted above under the goodwill impairment test, management determined that there was an indicator that the carrying amount of the long-lived assets arising from our acquisition of AssetNation (the “EquipmentOne long-lived assets”) might not have been recoverable. As such, we performed the recoverability test, for which purpose management determined that the asset group to which the EquipmentOne long-lived assets belonged was the EquipmentOne reporting unit. The results of the recoverability test indicated that the EquipmentOne reporting unit carrying amount (including goodwill but excluding deferred tax assets, deferred tax liabilities, and income taxes payable) exceeded the sum of its future undiscounted cash flows. As such, management then used an earnings approach to estimate the fair values of the EquipmentOne long-lived assets and compared those fair values to their carrying amounts.

Ritchie Bros. 81
Based on the results of the long-lived asset impairment test, we recorded a pre-tax impairment loss on the EquipmentOne reporting unit customer relationships of $4.7 million on September 30, 2016. In connection with this impairment loss, we recorded a deferred tax benefit of $1.8 million to the income tax provision. The result of this impairment test was reflected in the carrying value of the EquipmentOne reporting unit prior to the completion of the goodwill impairment test described above. Recoverability of indefinite-lived intangible assets We perform impairment tests on indefinite-lived intangible assets on an annual basis in accordance with US GAAP, or more frequently if events or changes in circumstances indicate that it is more likely than not that those assets are impaired. Generally, a qualitative assessment is performed first and where there is an indication that it is more likely than not that the asset is impaired, then a quantitative impairment test is performed. The quantitative impairment test compares the fair value of the asset to its carrying amount. If the carrying amount exceeds the fair value, then an impairment loss is recognized in an amount equal to that excess. Management performed a qualitative assessment at September 30, 2016 on the trade names and trademarks arising from our acquisition of AssetNation (the “EquipmentOne trade names and trademarks”). Referencing the same indicator of impairment identified as part of the goodwill impairment test described above, management determined that it was more likely than not that the EquipmentOne trade names and trademarks were impaired at September 30, 2016 and proceeded to the quantitative impairment test. Management used an income approach to determine the fair value of the EquipmentOne trade names and trademarks for purposes of conducting the quantitative impairment test. Based on the results of this test, the fair value was determined to exceed the carrying amount at September 30, 2016, and accordingly, no impairment loss was recognized. Subsequent to performing this impairment test, management concluded that an indefinite life for these assets could no longer be supported. Commencing September 30, 2016, we began amortizing the EquipmentOne trade names and trademarks over their useful lives, which management has estimated to be 15 years. Management performed the annual impairment test on indefinite-lived intangible assets at December 31, 2016, and concluded that there were no indicators of impairment at that date. Accounting for income taxes Income taxes are accounted for using the asset and liability method. Deferred income tax assets and liabilities are based on temporary differences (differences between the accounting basis and the tax basis of the assets and liabilities) and non-capital loss, capital loss, and tax credits carryforwards are measured using the enacted tax rates and laws expected to apply when these differences reverse. Deferred tax benefits, including non-capital loss, capital loss, and tax credits carry-forwards, are recognized to the extent that realization of such benefits is considered more likely than not. The effect on deferred tax assets and liabilities of a change in tax rates is recognized in earnings in the period that enactment occurs. When realization of deferred income tax assets does not meet the more-likely-than-not criterion for recognition, a valuation allowance is provided. Liabilities for uncertain tax positions are recorded based on a two-step process. The first step is to evaluate the tax position for recognition by determining if the weight of available evidence indicates that it is more likely than not that the position will be sustained on audit, including resolution of related appeals or litigation processes, if any. The second step is to measure the tax benefit as the largest amount that is more than 50% likely of being realized upon settlement. We regularly assess the potential outcomes of examinations by tax authorities in determining the adequacy of our provision for income taxes. We also continually assess the likelihood and amount of potential adjustments and adjust the income tax provision, income taxes payable and deferred taxes in the period in which the facts that give rise to a revision become known.

Ritchie Bros. 82
Recent Accounting Pronouncements Recent accounting pronouncements that significantly impact our accounting policies or the presentation of our consolidated financial position or performance have been disclosed in the notes to our consolidated financial statements included in “Part II, Item 8: Financial Statements and Supplementary Data” presented elsewhere in this Annual Report on Form 10-K.
Non-GAAP Measures We make reference to various non-GAAP measures throughout this Annual Report on Form 10-K. These measures do not have a standardized meaning and are, therefore, unlikely to be comparable to similar measures presented by other companies. The presentation of this financial information, which is not prepared under any comprehensive set of accounting rules or principles, is not intended to be considered in isolation of, or as a substitute for, the financial information prepared and presented in accordance with generally accepted accounting principles. The following tables present our adjusted operating income (non-GAAP measure) and adjusted operating income margin (non-GAAP measure) results for the years ended December 31, 2016, 2015, and 2014, as well as reconcile those metrics to operating income, revenues, and operating income margin, which are the most directly comparable GAAP measures in, or calculated from, our consolidated income statements:
(in U.S. $ thousands) Year ended December 31, Change
2016
2015
2014
2016 over
2015
2015 over 2014
Operating income $ 135,722 $ 174,840 $ 127,927 (22%) 37%
Pre-tax adjusting items:
Management reorganization - - 5,533 - (100%)
Gain on sale of excess property - (8,384) (3,386) 100% (148%)
Impairment loss 28,243 - 8,084 100% (100%)
Adjusted operating income
(non-GAAP measure) 163,965 166,456 138,158 (1%) 20%
Revenues $ 566,395 $ 515,875 $ 481,097 10% 7%
Operating income margin 24.0% 33.9% 26.6% -990 bps 730 bps
Adjusted operating income margin
(non-GAAP measure) 28.9% 32.3% 28.7% -340 bps 360 bps
The 2016 adjusting item was a $28.2 million ($26.4 million after tax, or $0.25 per diluted share) impairment loss on the Company’s EquipmentOne reporting unit goodwill and customer relationships recognized in the third quarter. The 2015 adjusting item was an $8.4 million ($7.3 million after tax, or $0.07 per diluted share) gain on the sale of excess property in Edmonton, Canada, recognized in the fourth quarter. The 2014 adjusting items were a $5.5 million ($4.2 million after tax, or $0.04 per diluted share) charge recorded in the fourth quarter to recognize termination benefits relating to the Company's management reorganization, a $3.4 million ($2.9 million after tax, or $0.03 per diluted share) gain on the sale of the Company's former permanent auction site in Grande Prairie, Canada, recognized in the third quarter, and an $8.1 million ($8.1 million after tax, or $0.08 per diluted share) impairment loss recorded in the third quarter against the Company's land and improvements and auction building in Narita, Japan.

Ritchie Bros. 83
The following tables present our adjusted net income attributable to stockholders (non-GAAP measure) and diluted adjusted EPS attributable to stockholders (non-GAAP measure) results for the years ended December 31, 2016, 2015, and 2014, as well as reconcile those metrics to net income (loss) attributable to stockholders, the weighted average number of dilutive shares outstanding, and diluted EPS (loss per share) attributable to stockholders, which are the most directly comparable GAAP measures in our consolidated income statements:
(in U.S. $ thousands, except share and Year ended December 31, per share data) Change
2016
2015
2014
2016 over
2015
2015 over 2014
Net income attributable to stockholders $ 91,832 $ 136,214 $ 90,981 (33%) 50%
Pre-tax adjusting items:
Management reorganization - - 5,533 - (100%)
Debt extinguishment costs 6,787 - - 100% -
Gain on sale of excess property - (8,384) (3,386) (100%) 148%
Impairment loss 28,243 - 8,084 100% (100%)
Current income tax effect of adjusting
items:
Management reorganization - - (1,321) - (100%)
Debt extinguishment costs (1,787) - - (100%) -
Gain on sale of excess property - 1,090 440 (100%) 148%
Deferred income tax effect of adjusting
items:
Impairment loss (1,798) - - (100%) -
Deferred tax adjusting item:
Tax loss utilization - (7,862) - 100% (100%)
Adjusted net income attributable to
stockholders (non-GAAP measure) $ 123,277 $ 121,058 $ 100,331 2% 21%
Weighted average number of
dilutive shares outstanding 107,457,794 107,432,474 107,654,828 - -
Diluted EPS attributable to stockholders $ 0.85 $ 1.27 $ 0.85 (33%) 49%
Diluted adjusted EPS attributable to
stockholders (non-GAAP measure) $ 1.15 $ 1.13 $ 0.93 2% 22%
The 2016 adjusting items were a $5.0 million ($6.8 million before tax, or $0.05 per diluted share) charge related to the early termination of pre-existing debt recognized in the fourth quarter, and a $26.4 million ($28.2 million before tax, or $0.25 per diluted share) impairment loss on the Company’s EquipmentOne reporting unit goodwill and customer relationships recognized in the third quarter. The 2015 adjusting items were a $7.3 million ($8.4 million before tax, or $0.07 per diluted share) gain on the sale of excess property in Edmonton, Canada, recognized in the fourth quarter, and $7.9 million ($7.9 million before tax, or $0.07 per diluted share) of tax savings generated by tax loss utilization recognized in the fourth quarter. The 2014 adjusting items were a $4.2 million ($5.5 million before tax, or $0.04 per diluted share) charge recorded in the fourth quarter to recognize termination benefits relating to the Company's management reorganization, a $2.9 million ($3.4 million before tax, or $0.03 per diluted share) gain on the sale of the Company's former permanent auction site in Grande Prairie, Canada, recognized in the third quarter, and an $8.1 million ($8.1 million before tax, or $0.08 per diluted share) impairment loss recorded in the third quarter against the Company's land and improvements and auction building in Narita, Japan.

Ritchie Bros. 84
The following tables present our adjusted EBITDA (non-GAAP measure) and adjusted EBITDA margin (non-GAAP measure) results for the years ended December 31, 2016, 2015, and 2014, as well as reconcile those metrics to net income (loss), revenues, and net income margin, which are the most directly comparable GAAP measures in, or calculated from, our consolidated income statements:
(in U.S. $ thousands) Year ended December 31, Change
2016 2015 2014
2016 over 2015
2015 over
2014
Net income $ 93,512 $ 138,575 $ 92,563 (33%) 50%
Add: depreciation and
amortization expenses 40,861 42,032 44,536 (3%) (6%)
Less: interest income (1,863) (2,660) (2,222) (30%) 20%
Add: interest expense 5,564 4,962 5,277 12% (6%)
Add: current income tax expense 40,341 42,420 33,321 (5%) 27%
Add: deferred income tax
expense (recovery) (3,359) (4,559) 3,154 (26%) (245%)
Pre-tax adjusting items:
Management reorganization - - 5,533 - (100%)
Debt extinguishment costs 6,787 - - 100% -
Gain on sale of excess property - (8,384) (3,386) (100%) 148%
Impairment loss 28,243 - 8,084 100% (100%)
Adjusted EBITDA 210,086 212,386 186,860 (1%) 14%
Revenues $ 566,395 $ 515,875 $ 481,097 10% 7%
Net income margin 16.5% 26.9% 19.2% -1040 bps 770 bps
Adjusted EBITDA margin (non-GAAP
measure) 37.1% 41.2% 38.8% -410 bps 240 bps
The 2016 adjusting items were a $6.8 million ($5.0 million after tax, or $0.05 per diluted share) charge related to the early termination of pre-existing debt recognized in the fourth quarter, and a $28.2 million ($26.4 million after tax, or $0.25 per diluted share) impairment loss on the Company’s EquipmentOne reporting unit goodwill and customer relationships recognized in the third quarter. The 2015 adjusting item was an $8.4 million ($7.3 million after tax, or $0.07 per diluted share) gain on the sale of excess property in Edmonton, Canada, recognized in the fourth quarter. The 2014 adjusting items were a $5.5 million ($4.2 million after tax, or $0.04 per diluted share) charge recorded in the fourth quarter to recognize termination benefits relating to the Company's management reorganization, a $3.4 million ($2.9 million after tax, or $0.03 per diluted share) gain on the sale of the Company's former permanent auction site in Grande Prairie, Canada, recognized in the third quarter, and an $8.1 million ($8.1 million after tax, or $0.08 per diluted share) impairment loss recorded in the third quarter against the Company's land and improvements and auction building in Narita, Japan.
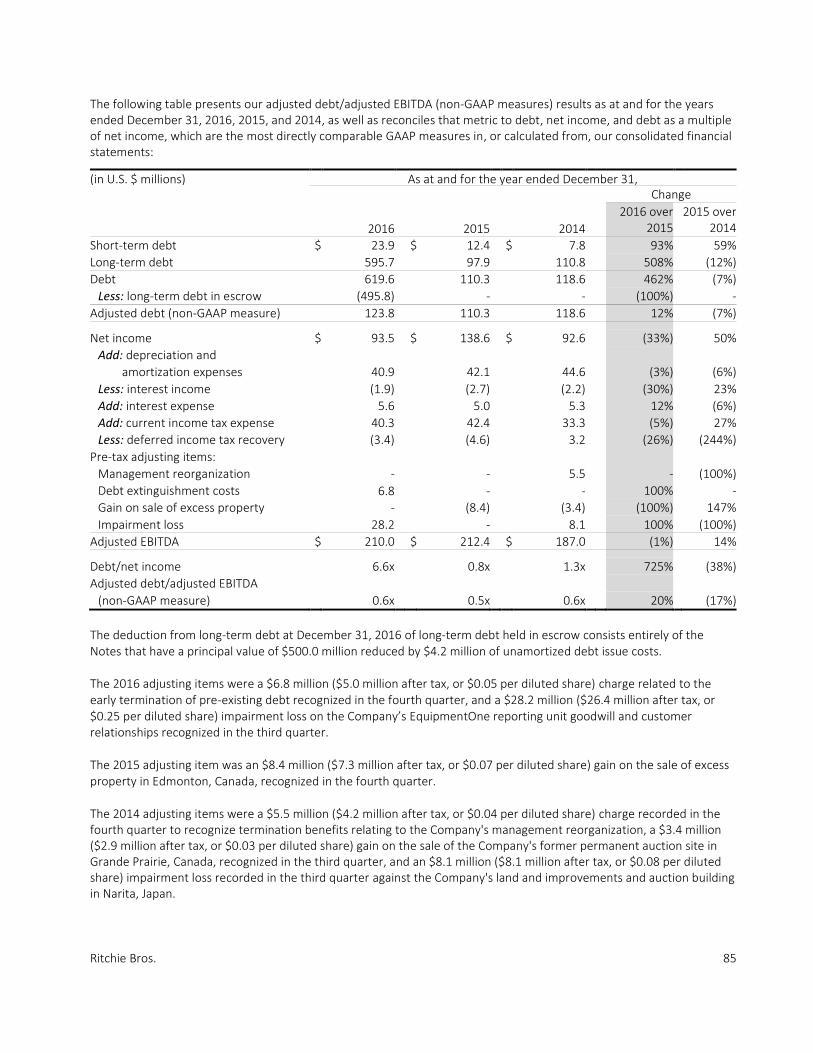
Ritchie Bros. 85
The following table presents our adjusted debt/adjusted EBITDA (non-GAAP measures) results as at and for the years ended December 31, 2016, 2015, and 2014, as well as reconciles that metric to debt, net income, and debt as a multiple of net income, which are the most directly comparable GAAP measures in, or calculated from, our consolidated financial statements:
(in U.S. $ millions) As at and for the year ended December 31, Change
2016 2015 2014
2016 over 2015
2015 over
2014
Short-term debt $ 23.9 $ 12.4 $ 7.8 93% 59%
Long-term debt 595.7 97.9 110.8 508% (12%)
Debt 619.6 110.3 118.6 462% (7%)
Less: long-term debt in escrow (495.8) - - (100%) -
Adjusted debt (non-GAAP measure) 123.8 110.3 118.6 12% (7%)
Net income $ 93.5 $ 138.6 $ 92.6 (33%) 50%
Add: depreciation and
amortization expenses 40.9 42.1 44.6 (3%) (6%)
Less: interest income (1.9) (2.7) (2.2) (30%) 23%
Add: interest expense 5.6 5.0 5.3 12% (6%)
Add: current income tax expense 40.3 42.4 33.3 (5%) 27%
Less: deferred income tax recovery (3.4) (4.6) 3.2 (26%) (244%)
Pre-tax adjusting items:
Management reorganization - - 5.5 - (100%)
Debt extinguishment costs 6.8 - - 100% -
Gain on sale of excess property - (8.4) (3.4) (100%) 147%
Impairment loss 28.2 - 8.1 100% (100%)
Adjusted EBITDA $ 210.0 $ 212.4 $ 187.0 (1%) 14%
Debt/net income 6.6x 0.8x 1.3x 725% (38%)
Adjusted debt/adjusted EBITDA
(non-GAAP measure) 0.6x 0.5x 0.6x 20% (17%)
The deduction from long-term debt at December 31, 2016 of long-term debt held in escrow consists entirely of the Notes that have a principal value of $500.0 million reduced by $4.2 million of unamortized debt issue costs. The 2016 adjusting items were a $6.8 million ($5.0 million after tax, or $0.05 per diluted share) charge related to the early termination of pre-existing debt recognized in the fourth quarter, and a $28.2 million ($26.4 million after tax, or $0.25 per diluted share) impairment loss on the Company’s EquipmentOne reporting unit goodwill and customer relationships recognized in the third quarter. The 2015 adjusting item was an $8.4 million ($7.3 million after tax, or $0.07 per diluted share) gain on the sale of excess property in Edmonton, Canada, recognized in the fourth quarter. The 2014 adjusting items were a $5.5 million ($4.2 million after tax, or $0.04 per diluted share) charge recorded in the fourth quarter to recognize termination benefits relating to the Company's management reorganization, a $3.4 million ($2.9 million after tax, or $0.03 per diluted share) gain on the sale of the Company's former permanent auction site in Grande Prairie, Canada, recognized in the third quarter, and an $8.1 million ($8.1 million after tax, or $0.08 per diluted share) impairment loss recorded in the third quarter against the Company's land and improvements and auction building in Narita, Japan.
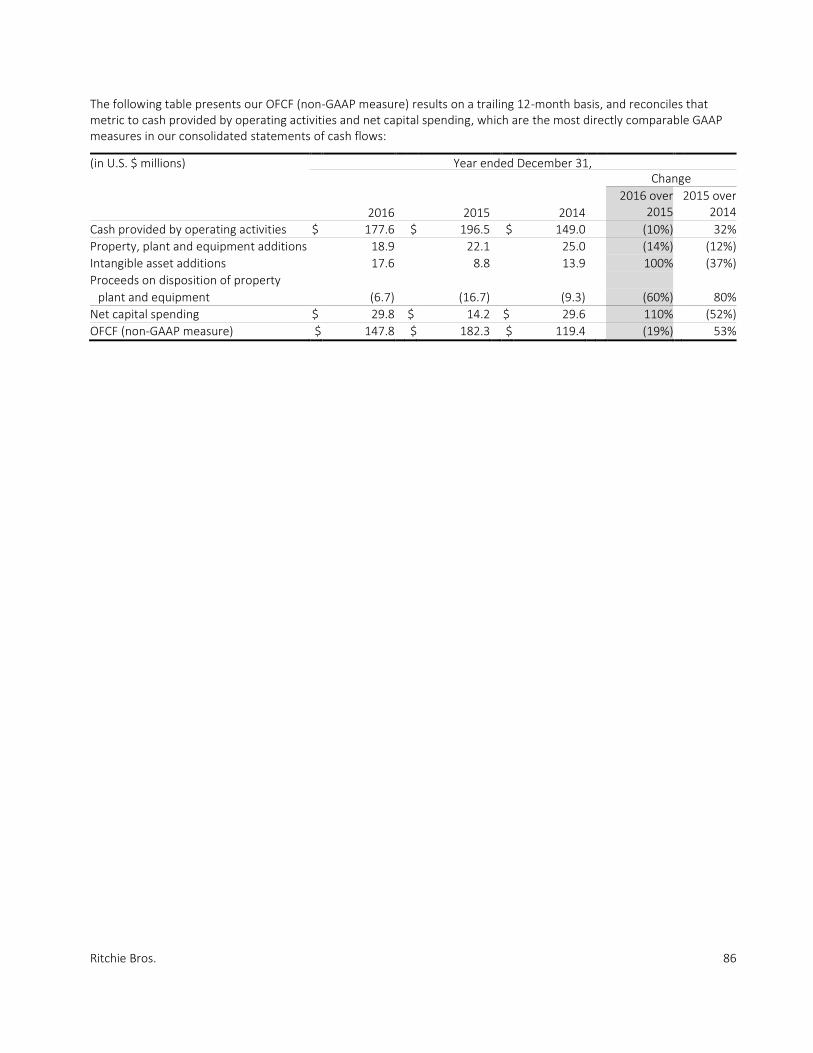
Ritchie Bros. 86
The following table presents our OFCF (non-GAAP measure) results on a trailing 12-month basis, and reconciles that metric to cash provided by operating activities and net capital spending, which are the most directly comparable GAAP measures in our consolidated statements of cash flows:
(in U.S. $ millions) Year ended December 31, Change
2016
2015
2014
2016 over
2015
2015 over 2014
Cash provided by operating activities $ 177.6 $ 196.5 $ 149.0 (10%) 32%
Property, plant and equipment additions 18.9 22.1 25.0 (14%) (12%)
Intangible asset additions 17.6 8.8 13.9 100% (37%)
Proceeds on disposition of property
plant and equipment (6.7) (16.7) (9.3) (60%) 80%
Net capital spending $ 29.8 $ 14.2 $ 29.6 110% (52%)
OFCF (non-GAAP measure) $ 147.8 $ 182.3 $ 119.4 (19%) 53%

Ritchie Bros. 87
The following table presents our adjusted net income attributable to stockholders (non-GAAP measure) and adjusted dividend payout ratio (non-GAAP measure) results on a trailing 12-month basis, and reconciles those metrics to dividends paid to stockholders, net income attributable to stockholders, and dividend payout ratio, which are the most directly comparable GAAP measures in, or calculated from, our consolidated financial statements:
(in U.S. $ millions) Year ended December 31, Change
2016
2015
2014
2016 over
2015
2015 over 2014
Dividends paid to stockholders $ 70.5 $ 64.3 $ 57.9 10% 11%
Net income attributable to stockholders $ 91.8 $ 136.2 $ 91.0 (33%) 50%
Pre-tax adjusting items:
Management reorganization - - 5.5 - (100%)
Debt extinguishment costs 6.8 - - 100% -
Gain on sale of excess property - (8.4) (3.4) 100% (147%)
Impairment loss 28.2 - 8.1 100% (100%)
Current income tax effect of adjusting
items:
Management reorganization - - (1.3) - (100%)
Debt extinguishment costs (1.8) - - (100%) -
Gain on sale of excess property - 1.1 0.4 (100%) 175%
Deferred income tax effect of adjusting
items:
Impairment loss (1.8) - - (100%) -
Deferred tax adjusting item:
Tax loss utilization - (7.9) - 100% (100%)
Adjusted net income attributable to
stockholders (non-GAAP measure) $ 123.3 $ 121.1 $ 100.3 2% 21%
Dividend payout ratio 76.8% 47.2% 63.6% 2960 bps -1640 bps
Adjusted dividend payout ratio
(non-GAAP measure) 57.2% 53.1% 57.7% 410 bps -460 bps
The 2016 adjusting items were a $5.0 million ($6.8 million before tax, or $0.05 per diluted share) charge related to the early termination of pre-existing debt recognized in the fourth quarter, and a $26.4 million ($28.2 million before tax, or $0.25 per diluted share) impairment loss on the Company’s EquipmentOne reporting unit goodwill and customer relationships recognized in the third quarter. The 2015 adjusting items were a $7.3 million ($8.4 million before tax, or $0.07 per diluted share) gain on the sale of excess property in Edmonton, Canada, recognized in the fourth quarter, and $7.9 million ($7.9 million before tax, or $0.07 per diluted share) of tax savings generated by tax loss utilization recognized in the fourth quarter. The 2014 adjusting items were a $4.2 million ($5.5 million before tax, or $0.04 per diluted share) charge recorded in the fourth quarter to recognize termination benefits relating to the Company's management reorganization, a $2.9 million ($3.4 million before tax, or $0.03 per diluted share) gain on the sale of the Company's former permanent auction site in Grande Prairie, Canada, recognized in the third quarter, and an $8.1 million ($8.1 million before tax, or $0.08 per diluted share) impairment loss recorded in the third quarter against the Company's land and improvements and auction building in Narita, Japan.

Ritchie Bros. 88
The following table presents our ROIC (non-GAAP measure) and ROIC excluding escrowed debt (non-GAAP measure) results on a trailing 12-month basis, and reconciles those metrics to net income attributable to stockholders, long-term debt, stockholders’ equity, and return on average invested capital, which are the most directly comparable GAAP measures in, or calculated from, our consolidated financial statements. Adjusted opening long-term debt (non-GAAP measure) is not presented due to the lack of adjusting items during the relevant periods:
(in U.S. $ millions) Year ended December 31, Change
2016 2015 2014
2016 over
2015
2015 over 2014
Net income attributable to stockholders $ 91.8 $ 136.2 $ 91.0 (33%) 50%
Pre-tax adjusting items:
Management reorganization - - 5.5 - (100%)
Debt extinguishment costs 6.8 - - 100% -
Gain on sale of excess property - (8.4) (3.4) 100% (147%)
Impairment loss 28.2 - 8.1 100% (100%)
Current income tax effect of adjusting
items:
Management reorganization - - (1.3) - (100%)
Debt extinguishment costs (1.8) - - (100%) -
Gain on sale of excess property - 1.1 0.4 (100%) 175%
Deferred income tax effect of adjusting
items:
Impairment loss (1.8) - - (100%) -
Deferred tax adjusting item:
Tax loss utilization - (7.9) - 100% (100%)
Adjusted net income attributable to
stockholders (non-GAAP measure) $ 123.3 $ 121.1 $ 100.3 2% 21%
Opening long-term debt $ 97.9 $ 110.8 $ 177.2 (12%) (37%)
Ending long-term debt 595.7 97.9 110.8 508% (12%)
Less: long-term debt in escrow (495.8) - - (100%) -
Adjusted ending long-term debt
(non-GAAP measure) 99.9 97.9 110.8 2% (12%)
Average long-term debt $ 346.8 $ 104.4 $ 144.0 232% (28%)
Adjusted average long-term debt
(non-GAAP measure) 98.9 104.4 144.0 (5%) (28%)
Opening stockholders' equity $ 703.2 $ 691.9 $ 686.1 2% 1%
Ending stockholders' equity 687.1 703.2 691.9 (2%) 2%
Average stockholders' equity 695.2 697.6 689.0 - 1%
Average invested capital $ 1,042.0 $ 802.0 $ 833.0 30% (4%)
Adjusted average invested
capital (non-GAAP measure) 794.1 802.0 833.0 (1%) (4%)
Return on average invested capital(1) 8.8% 17.0% 10.9% -820 bps 610 bps
ROIC (non-GAAP measure)(2) 11.8% 15.1% 12.0% -330 bps 310 bps
ROIC excluding escrowed debt
(non-GAAP measure)(3) 15.5% 15.1% 12.0% 40 bps 310 bps

Ritchie Bros. 89
(1) Calculated as net income attributable to stockholders divided by average invested capital.
(2) Calculated as adjusted net income attributable to stockholders (non-GAAP measure) divided by average invested capital.
(3) Calculated as adjusted net income attributable to stockholders (non-GAAP measure) divided by adjusted average invested capital (non-GAAPmeasure).
The 2016 adjusting items were a $5.0 million ($6.8 million before tax, or $0.05 per diluted share) charge related to theearly termination of pre-existing debt recognized in the fourth quarter, and a $26.4 million ($28.2 million before tax, or$0.25 per diluted share) impairment loss on the Company’s EquipmentOne reporting unit goodwill and customerrelationships recognized in the third quarter.
The 2015 adjusting items were a $7.3 million ($8.4 million before tax, or $0.07 per diluted share) gain on the sale ofexcess property in Edmonton, Canada, recognized in the fourth quarter, and $7.9 million ($7.9 million before tax, or$0.07 per diluted share) of tax savings generated by tax loss utilization recognized in the fourth quarter.
The 2014 adjusting items were a $4.2 million ($5.5 million before tax, or $0.04 per diluted share) charge recorded in thefourth quarter to recognize termination benefits relating to the Company's management reorganization, a $2.9 million($3.4 million before tax, or $0.03 per diluted share) gain on the sale of the Company's former permanent auction site inGrande Prairie, Canada, recognized in the third quarter, and an $8.1 million ($8.1 million before tax, or $0.08 per dilutedshare) impairment loss recorded in the third quarter against the Company's land and improvements and auction buildingin Narita, Japan.
The deduction from ending long-term debt at December 31, 2016 of long-term debt held in escrow consists entirely ofthe Notes that have a principal value of $500.0 million reduced by $4.2 million of unamortized debt issue costs.
ITEM 7A: QUANTITATIVE AND QUALITATIVE DISCLOSURES ABOUT MARKET RISK
We conduct operations in local currencies in countries around the world, but we use the U.S. dollar as our presentationcurrency. As a result, we are exposed to currency fluctuations and exchange rate risk. We cannot accurately predict thefuture effects of foreign currency fluctuations on our financial condition or results of operations, or quantify their effectson the macroeconomic environment. The proportion of revenues denominated in currencies other than the U.S. dollarin a given period will differ from the annual proportion for the year ended December 31, 2016, which was 48%,depending on the size and location of auctions held during the period. On annual basis, we expect fluctuations inrevenues and operating expenses to largely offset and generally act as a natural hedge against exposure to fluctuationsin the value of the U.S. dollar. We have not adopted a long-term hedging strategy to protect against foreign currencyfluctuations associated with our operations denominated in currencies other than the U.S. dollar, but we may considerhedging specific transactions if we deem it appropriate in the future.
During 2016, we recorded a net decrease in our foreign currency translation adjustment balance of $9.8 million,compared to $40.8 million in 2015 and $35.8 million in 2014. Our foreign currency translation adjustment arises fromthe translation of our net assets denominated in currencies other than the U.S. dollar to the U.S. dollar for reportingpurposes. Based on our exposures to foreign currency transactions as at December 31, 2016, and assuming that all othervariables remain constant, a 100 basis point appreciation or depreciation of the Canadian dollar and Euro against theU.S. dollar would result in an increase/decrease of approximately $5.6 million in our consolidated comprehensiveincome.
We are not exposed to significant interest rate risk due to the fact that the Notes, which represented 83% of our long-term debt at December 31, 2016, bear interest at a fixed rate of 5.375% per annum. At December 31, 2016, our short-term debt and the remainder of our long-term debt consisted of revolving loans under the Multicurrency Facilities,which usually mature one to three months from inception.