financial statements - hsbc · pdf filefinancial statements ... 1 adjustment to bring changes...
TRANSCRIPT
H S B C B A N K P L C
Financial Statements
105
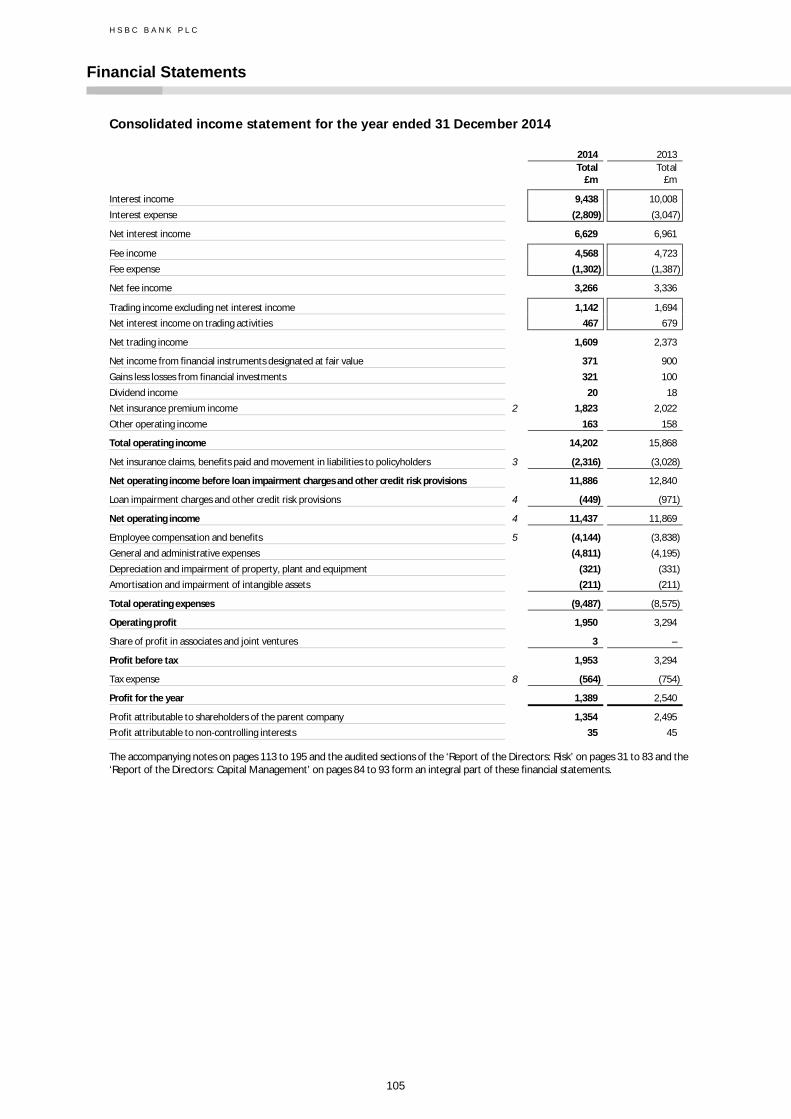
Consolidated income statement for the year ended 31 December 2014
2014 2013 Total Total £m £m Interest income 9,438 10,008 Interest expense (2,809) (3,047) Net interest income 6,629 6,961 Fee income 4,568 4,723 Fee expense (1,302) (1,387) Net fee income 3,266 3,336 Trading income excluding net interest income 1,142 1,694 Net interest income on trading activities 467 679 Net trading income 1,609 2,373 Net income from financial instruments designated at fair value 371 900 Gains less losses from financial investments 321 100 Dividend income 20 18 Net insurance premium income 2 1,823 2,022 Other operating income 163 158 Total operating income 14,202 15,868 Net insurance claims, benefits paid and movement in liabilities to policyholders 3 (2,316) (3,028) Net operating income before loan impairment charges and other credit risk provisions 11,886 12,840 4 Loan impairment charges and other credit risk provisions 4 (449) (971) Net operating income 4 11,437 11,869 Employee compensation and benefits 5 (4,144) (3,838) General and administrative expenses (4,811) (4,195) Depreciation and impairment of property, plant and equipment (321) (331) Amortisation and impairment of intangible assets (211) (211) Total operating expenses (9,487) (8,575) Operating profit 1,950 3,294 Share of profit in associates and joint ventures 3 – Profit before tax 1,953 3,294 Tax expense 8 (564) (754) Profit for the year 1,389 2,540 Profit attributable to shareholders of the parent company 1,354 2,495 Profit attributable to non-controlling interests 35 45
The accompanying notes on pages 113 to 195 and the audited sections of the ‘Report of the Directors: Risk’ on pages 31 to 83 and the ‘Report of the Directors: Capital Management’ on pages 84 to 93 form an integral part of these financial statements.

H S B C B A N K P L C
Financial Statements (continued)
106
Consolidated statement of comprehensive income for the year ended 31 December 2014
2014 2013 Total Total
£m £m Profit for the year 1,389 2,540 Other comprehensive income Items that will be reclassified subsequently to profit or loss when specific conditions are met Available-for-sale investments
– fair value gain 1,033 420 – fair value (gains)/losses transferred to the income statement on disposal (407) 223 – amounts transferred to the income statement in respect of impairment losses 36 115 – income taxes (218) 2
Cash flow hedges – fair value gains 838 46 – fair value (gains) transferred to the income statement (575) (423) – income taxes (74) 109
Exchange differences and other (820) 39 Items that will not be reclassified subsequently to profit or loss Actuarial gains/(losses) on defined benefit plans
– before income taxes 1,638 (957) – income taxes (322) 251
Other comprehensive income for the year, net of tax 1,129 (175) Total comprehensive income for the year 2,518 2,365
Total comprehensive income for the year attributable to: – shareholders of the parent company 2,504 2,319 – non-controlling interests 14 46
2,518 2,365
The accompanying notes on pages 113 to 195 and the audited sections of the ‘Report of the Directors: Risk’ on pages 31 to 83 and the ‘Report of the Directors: Capital Management’ on pages 84 to 93 form an integral part of these financial statements.

H S B C B A N K P L C
Financial Statements (continued)
107
Consolidated statement of financial position at 31 December 2014
2014 2013 Notes £m £m Assets Cash and balances at central banks 42,853 67,584 Items in the course of collection from other banks 973 1,948 Trading assets 11 130,127 134,097 Financial assets designated at fair value 14 6,899 16,661 Derivatives 15 187,736 137,239 Loans and advances to banks 29 25,262 23,013 Loans and advances to customers 29 257,252 273,722 Reverse repurchase agreements – non-trading 16 41,945 61,525 Financial investments 17 76,194 75,030 Prepayments, accrued income and other assets 19 20,319 12,443 Current tax assets 190 210 Interests in associates and joint ventures 20 69 67 Goodwill and intangible assets 21 7,294 7,934 Deferred tax assets 8 176 222
Total assets 797,289 811,695 Liabilities and equity Liabilities Deposits by banks 29 27,590 28,769 Customer accounts 29 346,507 346,358 Repurchase agreements – non-trading 16 23,353 65,573 Items in the course of transmission to other banks 667 960 Trading liabilities 23 82,600 91,842 Financial liabilities designated at fair value 24 22,552 34,036 Derivatives 15 188,278 137,352 Debt securities in issue 29 27,921 32,895 Accruals, deferred income and other liabilities 25 12,417 9,158 Current tax liabilities 255 89 Liabilities under insurance contracts issued 26 17,522 19,228 Provisions 27 1,707 1,707 Deferred tax liabilities 8 364 24 Subordinated liabilities 28 8,858 10,785
Total liabilities 760,591 778,776 Equity Called up share capital 32 797 797 Share premium account 20,733 20,427 Other equity instruments 32 2,196 - Other reserves 772 921 Retained earnings 11,580 10,225
Total shareholders’ equity 36,078 32,370 Non-controlling interests 620 549
Total equity 36,698 32,919
Total equity and liabilities 797,289 811,695
The accompanying notes on pages 113 to 195 and the audited sections of the ‘Report of the Directors: Risk’ on pages 31 to 83 and the ‘Report of the Directors: Capital Management’ on pages 84 to 93 form an integral part of these financial statements.
A P S Simoes, Director 23 February 2015

H S B C B A N K P L C
Financial Statements (continued)
108
Consolidated cash flow statement for the year ended 31 December 2014
2014 2013 Notes £m £m Cash flows from operating activities Profit before tax 1,953 3,294 Adjustments for: – non-cash items included in profit before tax 33 2,918 2,684 – change in operating assets 33 19,031 (53,006) – change in operating liabilities 33 (58,960) 61,035 – elimination of exchange differences1 2,828 (623) – net gain from investing activities (359) (130) – share of profit in associates and joint ventures (3) – – contributions paid to defined benefit plans (254) (393) – tax paid (579) (363) Net cash (used in)/generated from operating activities (33,425) 12,498
Cash flows from investing activities Purchase of financial investments (26,890) (32,298) Proceeds from the sale and maturity of financial investments 26,132 32,472 Purchase of property, plant and equipment (411) (322) Proceeds from the sale of property, plant and equipment 414 14 Purchase of goodwill and intangible assets (231) (199) Proceeds from the sale of intangible assets 2 3 Net cash outflow from acquisition of businesses and subsidiaries (61) (406) Proceeds from disposal of subsidiaries 112 12 Proceeds from sale of associates 23 – Net cash disposed of on sale of subsidiaries (457) – Purchases of HSBC Holdings plc shares to satisfy share-based payment transactions (11) – Net cash used in investing activities (1,378) (724)
Cash flows from financing activities Issue of ordinary share capital 306 402 Issue of capital securities 2,196 – Subordinated liabilities issued 203 542 Subordinated liabilities repaid (2,242) (7) Net cash inflow from change in stake of subsidiaries 77 – Dividends paid to shareholders (1,274) (2,014) Dividends paid to non-controlling interests (16) (22) Net cash used in financing activities (750) (1,099)
Net (decrease)/increase in cash and cash equivalents (35,553) 10,675 Cash and cash equivalents at 1 January 108,769 98,158 Effect of exchange rate changes on cash and cash equivalents (1,716) (64) Cash and cash equivalents at 31 December 33 71,500 108,769
1 Adjustment to bring changes between opening and closing balance sheet amounts to average rates. This is not done on a line-by-line basis, as details cannot be determined without unreasonable expense.
The accompanying notes on pages 113 to 195 and the audited sections of the ‘Report of the Directors: Risk’ on pages 31 to 83 and the ‘Report of the Directors: Capital Management’ on pages 84 to 93 form an integral part of these financial statements.

H S B C B A N K P L C
Financial Statements (continued)
109
Consolidated statement of changes in equity for the year ended 31 December 2014
Other reserves
Called up Share
capital
Share premium
Other equity instru-ments
Retained earnings
Available- for-sale
fair value reserve
Cash flow hedging reserve2
Foreign exchange
reserve
Total share-
holders’ equity
Non-controlling
interests
Total equity
£m £m £m £m £m £m £m £m £m £m
At 1 January 2014 797 20,427 — 10,225 634 (13) 300 32,370 549 32,919 Profit for the year – – – 1,354 – – – 1,354 35 1,389 Other comprehensive income (net of
tax)
– – –
1,321 436 189 (796) 1,150 (21) 1,129 Available-for-sale investments – – – – 436 – – 436 8 444 Cash flow hedges – – – – – 189 – 189 – 189 Actuarial gains/(losses) on defined
benefit plans
– – –
1,321 – – – 1,321 (5) 1,316 Exchange differences and other – – – – – – (796) (796) (24) (820) Total comprehensive income for the
year
– – –
2,675 436 189 (796) 2,504 14 2,518 Share capital issued, net of costs1 – 306 – – – – – 306 – 306 Capital securities issued1 – – 2,196 – – – – 2,196 – 2,196 Dividends to shareholders – – – (1,274) – – – (1,274) (16) (1,290) Net impact of equity-settled share-
based payments
– – –
15 – – – 15 – 15 Acquisitions and disposals – – – – – – 22 22 – 22 Change in business combinations and
other movements
– – –
(61) – – – (61) 73 12 Tax on items taken directly to equity – – – – – – – – – – At 31 December 2014 797 20,733 2,196 11,580 1,070 176 (474) 36,078 620 36,698
At 1 January 2013 797 20,025 — 10,459 (131) 259 266 31,675 525 32,200 Profit for the year — — — 2,495 — — — 2,495 45 2,540 Other comprehensive income (net of
tax)
— — —
(707) 765 (268) 34 (176) 1 (175) Available-for-sale investments — — — — 765 — — 765 (5) 760 Cash flow hedges — — — — — (268) — (268) — (268) Actuarial gains/(losses) on defined
benefit plans
— — —
(707) — — — (707) 1 (706) Exchange differences and other — — — — — — 34 34 5 39 Total comprehensive income for the
year
— — —
1,788 765 (268) 34 2,319 46 2,365 Share capital issued, net of costs1 — 402 — — — — — 402 — 402 Dividends to shareholders — — (2,014) — — — (2,014) (22) (2,036) Net impact of equity-settled share-
based payments
— — —
4 — — — 4 — 4 Change in business combinations and
other movements
— — —
(11) — (4) — (15) — (15) Tax on items taken directly to equity — — — (1) — — — (1) — (1) At 31 December 2013 797 20,427 — 10,225 634 (13) 300 32,370 549 32,919
1 All new capital subscribed during the year was issued to HSBC Holdings plc. See Note 32 for further details. 2 Movements in the cash flow hedging reserve include amounts transferred to the income statement of £575 million (2013:£423 million)
comprising a £250 million loss (2013: £232 million loss) taken to ‘Net interest income’ and a £325 million loss (2013 £191 million loss) taken to ‘Net trading income’.
The accompanying notes on pages 113 to 195 and the audited sections of the ‘Report of the Directors: Risk’ on pages 31 to 83 and the ‘Report of the Directors: Capital Management’ on pages 84 to 93 form an integral part of these financial statements.

H S B C B A N K P L C
Financial Statements (continued)
110
HSBC Bank plc statement of financial position at 31 December 2014
2014 2013 Notes £m £m Assets Cash and balances at central banks 41,424 60,996 Items in the course of collection from other banks 630 1,374 Trading assets 11 97,757 101,287 Financial assets designated at fair value 14 9 3,983 Derivatives 15 160,232 112,623 Loans and advances to banks 29 18,776 16,332 Loans and advances to customers 29 201,671 217,567 Reverse repurchase agreements – non-trading 16 36,391 47,847 Financial investments 17 48,438 45,048 Prepayments, accrued income and other assets 19 12,908 8,201 Current tax assets 125 424 Interests in associates and joint ventures 20 62 62 Investments in subsidiary undertakings 22 11,339 11,206 Goodwill and intangible assets 21 948 891 Deferred tax assets 8 5 88 Total assets 630,715 627,929 Liabilities and equity Liabilities Deposits by banks 29 31,383 32,456 Customer accounts 29 282,687 280,940 Repurchase agreements – non-trading 16 18,293 51,198 Items in the course of transmission to other banks 336 422 Trading liabilities 23 59,039 62,414 Financial liabilities designated at fair value 24 16,127 22,006 Derivatives 15 161,442 114,710 Debt securities in issue 29 14,950 19,576 Accruals, deferred income and other liabilities 25 5,289 5,695 Current tax liabilities 160 142 Provisions 27 1,345 1,271 Deferred tax liabilities 8 345 2 Subordinated liabilities 28 7,854 9,903 Total liabilities 599,250 600,735 Equity Called up share capital 32 797 797 Share premium account 20,733 20,427 Other equity instruments 32 2,196 - Other reserves 389 (372) Retained earnings 7,350 6,342 Total equity 31,465 27,194 Total equity and liabilities 630,715 627,929
The accompanying notes on pages 113 to 195 and the audited sections of the ‘Report of the Directors: Risk’ on pages 31 to 83 and the ‘Report of the Directors: Capital Management’ on pages 84 to 93 form an integral part of these financial statements.
A P S Simoes, Director 23 February 2015
H S B C B A N K P L C
Financial Statements (continued)
111
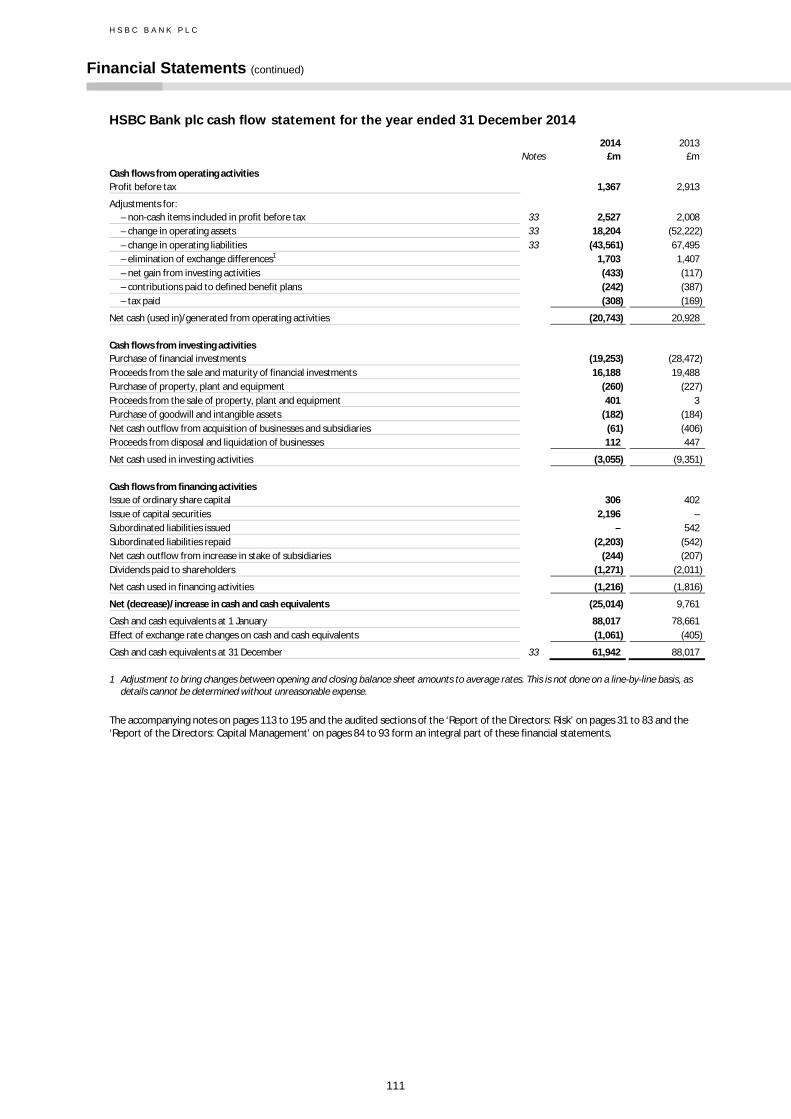
HSBC Bank plc cash flow statement for the year ended 31 December 2014
2014 2013 Notes £m £m Cash flows from operating activities Profit before tax 1,367 2,913 Adjustments for:
– non-cash items included in profit before tax 33 2,527 2,008 – change in operating assets 33 18,204 (52,222) – change in operating liabilities 33 (43,561) 67,495 – elimination of exchange differences1 1,703 1,407 – net gain from investing activities (433) (117) – contributions paid to defined benefit plans (242) (387) – tax paid (308) (169)
Net cash (used in)/generated from operating activities (20,743) 20,928 Cash flows from investing activities Purchase of financial investments (19,253) (28,472) Proceeds from the sale and maturity of financial investments 16,188 19,488 Purchase of property, plant and equipment (260) (227) Proceeds from the sale of property, plant and equipment 401 3 Purchase of goodwill and intangible assets (182) (184) Net cash outflow from acquisition of businesses and subsidiaries (61) (406) Proceeds from disposal and liquidation of businesses 112 447 Net cash used in investing activities (3,055) (9,351) Cash flows from financing activities Issue of ordinary share capital 306 402 Issue of capital securities 2,196 – Subordinated liabilities issued – 542 Subordinated liabilities repaid (2,203) (542) Net cash outflow from increase in stake of subsidiaries (244) (207) Dividends paid to shareholders (1,271) (2,011) Net cash used in financing activities (1,216) (1,816) Net (decrease)/increase in cash and cash equivalents (25,014) 9,761 Cash and cash equivalents at 1 January 88,017 78,661 Effect of exchange rate changes on cash and cash equivalents (1,061) (405) Cash and cash equivalents at 31 December 33 61,942 88,017
1 Adjustment to bring changes between opening and closing balance sheet amounts to average rates. This is not done on a line-by-line basis, as details cannot be determined without unreasonable expense.
The accompanying notes on pages 113 to 195 and the audited sections of the ‘Report of the Directors: Risk’ on pages 31 to 83 and the ‘Report of the Directors: Capital Management’ on pages 84 to 93 form an integral part of these financial statements.

H S B C B A N K P L C
Financial Statements (continued)
112
HSBC Bank plc statement of changes in equity for the year ended 31 December 2014
Other reserves
Called up share
capital
Share premium
Other equity
instruments
Retained earnings
Available- for-sale
fair value reserve
Cash flow
hedging reserve2
Foreign exchange
reserve
Total equity
£m £m £m £m £m £m £m £m
At 1 January 2014 797 20,427 – 6,342 (317) (8) (47) 27,194 Profit for the year – – – 975 – – – 975 Other comprehensive income (net of tax) – – – 1,353 656 108 (3) 2,114 Available-for-sale investments – – – – 656 – – 656 Cash flow hedges – – – – – 108 – 108 Actuarial gains on defined benefit plans – – – 1,353 – – – 1,353 Exchange differences and other – – – – – – (3) (3) Total comprehensive income for the year – – – 2,328 656 108 (3) 3,089 Share capital issued, net of costs1 – 306 – – – – – 306 Capital securities issued1 – – 2,196 – – – – 2,196 Dividends to shareholders – – – (1,271) – – – (1,271) Net impact of equity-settled share-based
payments
–
–
– 12 – – –
12 Change in business combinations and other
movements –
–
– (61) – – –
(61) Tax on items taken directly to equity – – – – – – – – At 31 December 2014 797 20,733 2,196 7,350 339 100 (50) 31,465 At 1 January 2013 797 20,025 – 6,588 (377) 167 (133) 27,067 Profit for the year – – – 2,485 – – – 2,485 Other comprehensive income (net of tax) – – – (709) 62 (175) 86 (736) Available-for-sale investments – – – – 62 – – 62 Cash flow hedges – – – – – (175) – (175) Actuarial gains on defined benefit plans – – – (709) – – – (709) Exchange differences and other – – – – – – 86 86 Total comprehensive income for the year – – – 1,776 62 (175) 86 1,749 Share capital issued, net of costs1 – 402 – – – – – 402 Dividends to shareholders – – – (2,011) – – – (2,011) Net impact of equity-settled share-based
payments
–
–
– (3) – – –
(3) Change in business combinations and other
movements –
–
– (8) (2) – –
(10) Tax on items taken directly to equity – – – – – – – – At 31 December 2013 797 20,427 – 6,342 (317) (8) (47) 27,194
1 All new capital subscribed during the year was issued to HSBC Holdings plc. See Note 32 for further details. 2 Movements in the cash flow hedging reserve include amounts transferred to the income statement of £496 million (2013:£317 million)
comprising a £213 million loss (2013: £181 million loss) taken to ‘Net interest income’ and a £283 million loss (2013 £131 million loss) taken to ‘Net trading income’.
The accompanying notes on pages 113 to 195 and the audited sections of the ‘Report of the Directors: Risk’ on pages 31 to 83 and the ‘Report of the Directors: Capital Management’ on pages 84 to 93 form an integral part of these financial statements.