financial statements - homepage - tesco plc · scope of the audit of the financial statements an...
TRANSCRIPT

STRATEGIC REVIEW PERFORMANCE REVIEW GOVERNANCE FINANCIAL STATEMENTSOVERVIEW
Financial statements
IN THIS SECTION
88 Statement of Directors’ responsibilities
89 Independent auditors’ report to the members of Tesco PLC
90 Group income statement
91 Group statement of comprehensive income
92 Group balance sheet
93 Group statement of changes in equity
94 Group cash flow statement
94 Reconciliation of net cash flow to movement in net debt note
95 Notes to the Group financial statements
142 Tesco PLC – Parent Company balance sheet
143 Notes to the Parent Company financial statements
151 Independent auditors’ report to the members of Tesco PLC
152 Five year record
IBC Financial calendar
IBC Glossary
This section contains our financial statements, as well as our five year record, financial calendar and glossary of financial KPI definitions.
Tesco PLC Annual Report and Financial Statements 2012 87

Statement of Directors’ responsibilities
The Directors are required by the Companies Act 2006 to prepare financial statements for each financial year which give a true and fair view of the state of affairs of the Group and the Company as at the end of the financial year and of the profit or loss of the Group for the financial year. Under that law the Directors are required to prepare the Group financial statements in accordance with International Financial Reporting Standards (‘IFRS’) as endorsed by the European Union (‘EU’) and have elected to prepare the Company financial statements in accordance with UK Accounting Standards.
In preparing the Group and Company financial statements, the Directors are required to:
select suitable accounting policies and then apply them consistently;
make reasonable and prudent judgements and estimates;
for the Group financial statements, state whether they have been prepared in accordance with IFRS, as endorsed by the EU;
for the Company financial statements state whether applicable UK Accounting Standards have been followed; and
prepare the financial statements on the going concern basis, unless it is inappropriate to presume that the Group and the Company will continue in business.
The Directors confirm that they have complied with the above requirements in preparing the financial statements.
The Directors are responsible for keeping proper accounting records, which disclose with reasonable accuracy at any time the financial position of the Group and the Company and which enable them to ensure that the financial statements and the Directors’ Remuneration Report comply with the Companies Act 2006 and, as regards the Group financial statements, Article 4 of the IAS Regulation.
The Business Review contained within this document includes a fair review of the business and important events impacting it, as well as a description of the principal risks and uncertainties faced by the business.
The Directors are responsible for the maintenance and integrity of the Annual Review and Summary Financial Statement and Annual Report and Financial Statements published on the Group’s corporate website. Legislation in the UK concerning the preparation and dissemination of financial statements may differ from legislation in other jurisdictions.
The Directors have general responsibility for taking such steps as are reasonably open to them to safeguard the assets of the Group and of the Company and to prevent and detect fraud and other irregularities.
88 Tesco PLC Annual Report and Financial Statements 2012

STRATEGIC REVIEW PERFORMANCE REVIEW GOVERNANCE FINANCIAL STATEMENTSOVERVIEW
Independent auditors’ report to the members of Tesco PLC
We have audited the Group financial statements of Tesco PLC for the 52 weeks ended 25 February 2012 which comprise the Group income statement, the Group statement of comprehensive income, the Group balance sheet, the Group statement of changes in equity, the Group cash flow statement and the related notes. The financial reporting framework that has been applied in their preparation is applicable law and International Financial Reporting Standards (‘IFRS’) as adopted by the European Union.
Respective responsibilities of directors and auditors As explained more fully in the Statement of Directors’ responsibilities set out on page 88, the Directors are responsible for the preparation of the Group financial statements and for being satisfied that they give a true and fair view. Our responsibility is to audit and express an opinion on the Group financial statements in accordance with applicable law and International Standards on Auditing (UK and Ireland). Those standards require us to comply with the Auditing Practices Board’s Ethical Standards for Auditors.
This report, including the opinions, has been prepared for and only for the Company’s members as a body in accordance with Chapter 3 of Part 16 of the Companies Act 2006 and for no other purpose. We do not, in giving these opinions, accept or assume responsibility for any other purpose or to any other person to whom this report is shown or into whose hands it may come save where expressly agreed by our prior consent in writing.
Scope of the audit of the financial statements An audit involves obtaining evidence about the amounts and disclosures in the financial statements sufficient to give reasonable assurance that the financial statements are free from material misstatement, whether caused by fraud or error. This includes an assessment of: whether the accounting policies are appropriate to the Group’s circumstances and have been consistently applied and adequately disclosed; the reasonableness of significant accounting estimates made by the Directors; and the overall presentation of the financial statements. In addition, we read all the financial and non-financial information in the Annual Report and Financial Statements to identify material inconsistencies with the audited financial statements. If we become aware of any apparent material misstatements or inconsistencies we consider the implications for our report.
Opinion on financial statements In our opinion the Group financial statements:
give a true and fair view of the state of the Group’s affairs as at 25 February 2012 and of its profit and cash flows for the 52 weeks then ended;
have been properly prepared in accordance with IFRS as adopted by the European Union; and
have been prepared in accordance with the requirements of the Companies Act 2006 and Article 4 of the lAS Regulation.
Opinion on other matter prescribed by the Companies Act 2006 In our opinion:
the information given in the Directors’ Report for the 52 weeks ended 25 February 2012 for which the Group financial statements are prepared is consistent with the Group financial statements.
Matters on which we are required to report by exception We have nothing to report in respect of the following:
Under the Companies Act 2006 we are required to report to you if, in our opinion:
certain disclosures of Directors’ remuneration specified by law are not made; or
we have not received all the information and explanations we require for our audit.
Under the Listing Rules we are required to review:
the Directors’ statement, set out on page 49, in relation to going concern;
the part of the Corporate Governance Statement relating to the Company’s compliance with the nine provisions of the UK Corporate Governance Code specified for our review; and
certain elements of the report to shareholders by the Board on Directors’ remuneration.
Other matter We have reported separately on the Parent Company financial statements of Tesco PLC for the 52 weeks ended 25 February 2012 and on the information in the Directors’ Remuneration Report that is described as having been audited.
Richard Winter (Senior Statutory Auditor)for and on behalf of PricewaterhouseCoopers LLP Chartered Accountants and Statutory Auditors London 4 May 2012
Tesco PLC Annual Report and Financial Statements 2012 89

Group income statement
Year ended 25 February 2012 notes
52 weeks2012
£m
52 weeks 2011*
£m
Continuing operationsRevenue 2 64,539 60,455 Cost of sales (59,278) (55,330)Gross profit 5,261 5,125 Administrative expenses (1,652) (1,640)Profits/losses arising on property-related items 376 432 Operating profit 3,985 3,917 Share of post-tax profits of joint ventures and associates 13 91 57 Finance income 5 176 150 Finance costs 5 (417) (483)Profit before tax 3 3,835 3,641 Taxation 6 (879) (864)Profit for the year from continuing operations 2,956 2,777 Discontinued operations Loss for the year from discontinued operations 7 (142) (106)Profit for the year 2,814 2,671 Attributable to:Owners of the parent 2,806 2,655 Non-controlling interests 8 16 2,814 2,671 Earnings per share from continuing and discontinued operationsBasic 9 34.98p 33.10pDiluted 9 34.88p 32.94p
Earnings per share from continuing operationsBasic 9 36.75p 34.43pDiluted 9 36.64p 34.25p
Non-GAAP measure: underlying profit before tax
notes
52 weeks2012
£m
52 weeks2011*
£m
Profit before tax from continuing operations 3,835 3,641Adjustments for:
IAS 32 and IAS 39 ‘Financial Instruments’ – fair value remeasurements 1/5 (44) (19)IAS 19 ‘Employee Benefits’ – non-cash Group Income Statement charge for pensions 1 17 113 IAS 17 ‘Leases’ – impact of annual uplifts in rent and rent-free periods 1 38 48IFRS 3 ‘Business Combinations’ – intangible asset amortisation charges and costs arising from acquisitions 1 22 42IFRIC 13 ‘Customer Loyalty Programmes’ – fair value of awards 1 17 8Restructuring and other one-off costs 1 30 20
Underlying profit before tax from continuing operations 1 3,915 3,853
* See Note 1 Accounting policies for details of reclassifications.
The notes on pages 95 to 141 form part of these financial statements.
90 Tesco PLC Annual Report and Financial Statements 2012

STRATEGIC REVIEW PERFORMANCE REVIEW GOVERNANCE FINANCIAL STATEMENTSOVERVIEW
Group statement of comprehensive income
Year ended 25 February 2012
notes
52 weeks2012
£m
52 weeks2011
£m
Change in fair value of available-for-sale financial assets and investments 13 2Currency translation differences (22) (344)Actuarial (losses)/gains on defined benefit pension schemes 26 (498) 595Gains/(losses) on cash flow hedges:
Net fair value gains/(losses) 241 (22) Reclassified and reported in the Group Income Statement (142) 8Tax relating to components of other comprehensive income for the year 6 73 (153)Total other comprehensive income for the year (335) 86Profit for the year 2,814 2,671Total comprehensive income for the year 2,479 2,757 Attributable to:Owners of the parent 2,466 2,746Non-controlling interests 13 11
2,479 2,757
Total comprehensive income attributable to equity shareholders arises from:
Continuing operations 2,607 2,851
Discontinued operations (141) (105)
2,466 2,746
The notes on pages 95 to 141 form part of these financial statements.
Tesco PLC Annual Report and Financial Statements 2012 91
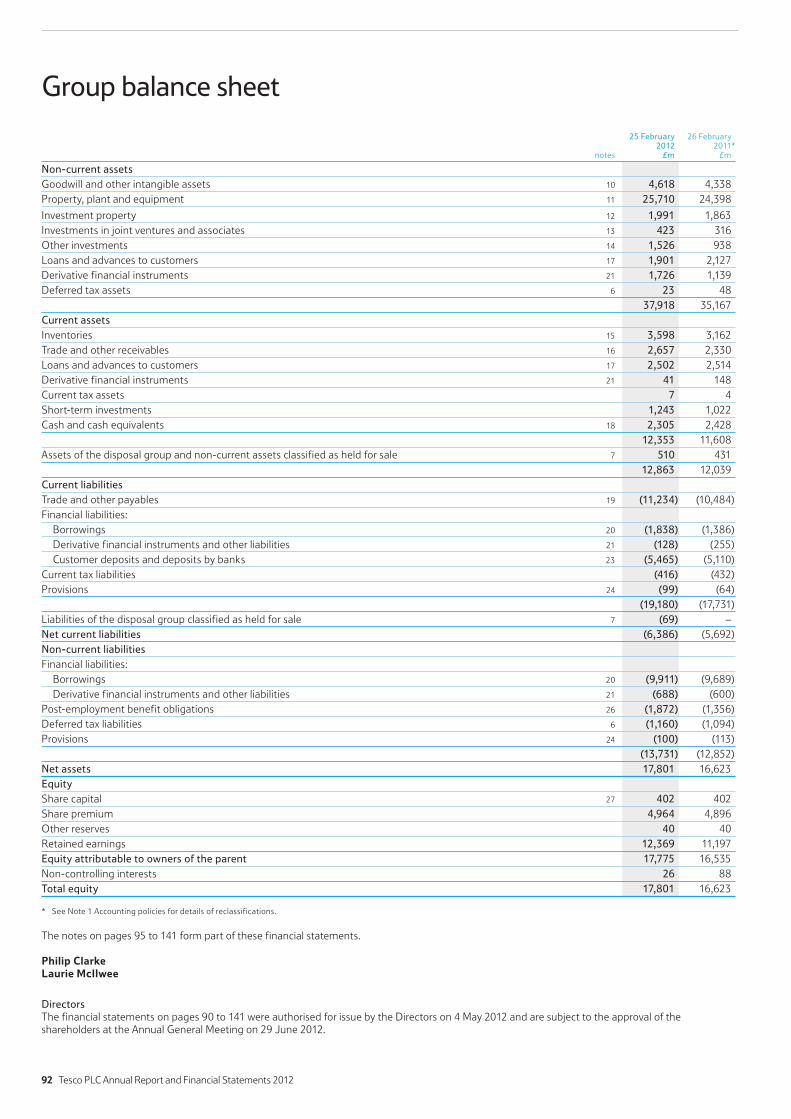
Group balance sheet
notes
25 February2012
£m
26 February2011*
£m
Non-current assetsGoodwill and other intangible assets 10 4,618 4,338Property, plant and equipment 11 25,710 24,398
Investment property 12 1,991 1,863Investments in joint ventures and associates 13 423 316Other investments 14 1,526 938Loans and advances to customers 17 1,901 2,127Derivative financial instruments 21 1,726 1,139Deferred tax assets 6 23 48 37,918 35,167Current assetsInventories 15 3,598 3,162Trade and other receivables 16 2,657 2,330Loans and advances to customers 17 2,502 2,514Derivative financial instruments 21 41 148Current tax assets 7 4Short-term investments 1,243 1,022Cash and cash equivalents 18 2,305 2,428 12,353 11,608Assets of the disposal group and non-current assets classified as held for sale 7 510 431 12,863 12,039Current liabilitiesTrade and other payables 19 (11,234) (10,484)Financial liabilities:
Borrowings 20 (1,838) (1,386)Derivative financial instruments and other liabilities 21 (128) (255)
Customer deposits and deposits by banks 23 (5,465) (5,110)Current tax liabilities (416) (432)Provisions 24 (99) (64)
(19,180) (17,731)Liabilities of the disposal group classified as held for sale 7 (69) –Net current liabilities (6,386) (5,692)Non-current liabilitiesFinancial liabilities:
Borrowings 20 (9,911) (9,689)Derivative financial instruments and other liabilities 21 (688) (600)
Post-employment benefit obligations 26 (1,872) (1,356)Deferred tax liabilities 6 (1,160) (1,094)Provisions 24 (100) (113) (13,731) (12,852)Net assets 17,801 16,623EquityShare capital 27 402 402Share premium 4,964 4,896Other reserves 40 40Retained earnings 12,369 11,197Equity attributable to owners of the parent 17,775 16,535Non-controlling interests 26 88Total equity 17,801 16,623
* See Note 1 Accounting policies for details of reclassifications.
The notes on pages 95 to 141 form part of these financial statements.
Philip Clarke Laurie McIlwee
Directors The financial statements on pages 90 to 141 were authorised for issue by the Directors on 4 May 2012 and are subject to the approval of the shareholders at the Annual General Meeting on 29 June 2012.
92 Tesco PLC Annual Report and Financial Statements 2012

STRATEGIC REVIEW PERFORMANCE REVIEW GOVERNANCE FINANCIAL STATEMENTSOVERVIEW
Group statement of changes in equity
Retained earnings
Issuedshare
capital£m
Sharepremium
£m
Otherreserves
£m
Capitalredemption
reserve £m
Hedging reserve
£m
Translationreserve
£m
Treasury shares
£m
Retained earnings
£mTotal
£m
Non-controlling
interests £m
Total equity
£m
At 26 February 2011 402 4,896 40 13 (1) 155 (141) 11,171 16,535 88 16,623Profit for the year – – – – – – – 2,806 2,806 8 2,814Other comprehensive incomeChange in fair value of available-for-sale
financial assets and investments – – – – – – – 13 13 – 13Currency translation differences – – – – – (27) – – (27) 5 (22)Actuarial losses on defined benefit
pension schemes – – – – – – – (498) (498) – (498)Gains on cash flow hedges – – – – 99 – – – 99 – 99Tax relating to components of other
comprehensive income – – – – 25 6 – 92 73 – 73Total other comprehensive income – – – – 74 (21) – (393) (340) 5 (335)Total comprehensive income – – – – 74 (21) – 2,413 2,466 13 2,479Transactions with ownersPurchase of treasury shares – – – – – – (13) – (13) – (13)Shares purchased for cancellation (3) – – 3 – – – (290) (290) – (290)Share-based payments 2 – – – – – 136 (13) 125 – 125Issue of shares 1 68 – – – – – – 69 – 69Purchase of non-controlling interests – – – – – – – 72 72 (72) –Future purchase of non-controlling
interests – – – – – – – (3) (3) – (3)Dividends paid to non-controlling
interests – – – – – – – – – (3) (3)Dividends authorised in the year – – – – – – – (1,180) (1,180) – (1,180)Tax on items charged to equity – – – – – – – (6) (6) – (6)Total transactions with owners – 68 – 3 – – 123 (1,420) (1,226) (75) (1,301)At 25 February 2012 402 4,964 40 16 73 134 (18) 12,164 17,775 26 17,801
Retained earnings
Issuedshare
capital£m
Sharepremium
£m
Otherreserves
£m
Capitalredemption
reserve £m
Hedging reserve
£m
Translationreserve
£m
Treasury shares
£m
Retained earnings
£mTotal
£m
Non- controlling
interests £m
Total equity
£m
At 27 February 2010 399 4,801 40 13 12 463 (180) 9,048 14,596 85 14,681Profit for the year – – – – – – – 2,655 2,655 16 2,671Other comprehensive incomeChange in fair value of available-for-sale
financial assets and investments – – – – – – – 2 2 – 2Currency translation differences – – – – – (339) – – (339) (5) (344)Actuarial gains on defined benefit
pension schemes – – – – – – – 595 595 – 595Losses on cash flow hedges – – – – (14) – – – (14) – (14)Tax relating to components of other
comprehensive income – – – – 1 31 – (185) (153) – (153)Total other comprehensive income – – – – (13) (308) – 412 91 (5) 86Total comprehensive income – – – – (13) (308) – 3,067 2,746 11 2,757Transactions with ownersPurchase of treasury shares – – – – – – (50) – (50) – (50)Share-based payments – – – – – – 89 131 220 – 220Issue of shares 3 95 – – – – – – 98 – 98Purchase of non-controlling interests – – – – – – – 6 6 (6) –Dividends paid to non-controlling interests – – – – – – – – – (2) (2)Dividends authorised in the year – – – – – – – (1,081) (1,081) – (1,081)Total transactions with owners 3 95 – – – – 39 (944) (807) (8) (815)At 26 February 2011 402 4,896 40 13 (1) 155 (141) 11,171 16,535 88 16,623
The notes on pages 95 to 141 form part of these financial statements.
Tesco PLC Annual Report and Financial Statements 2012 93
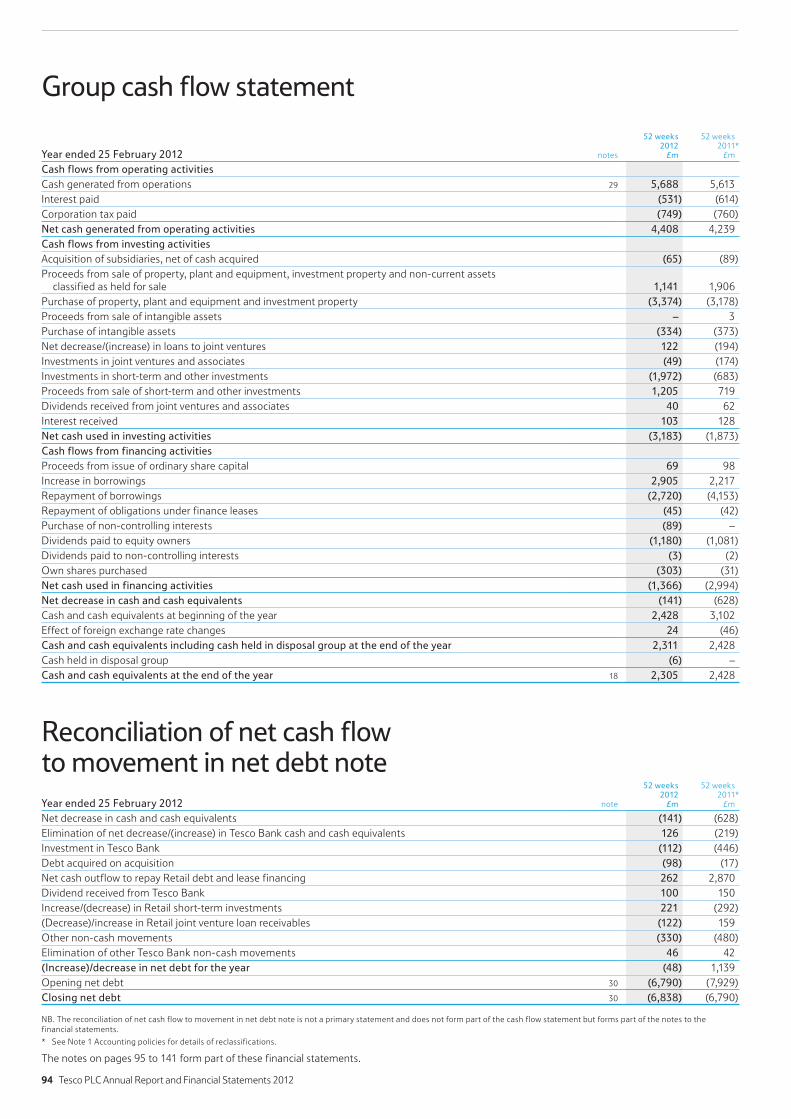
Group cash flow statement
Year ended 25 February 2012 notes
52 weeks2012
£m
52 weeks2011*
£m
Cash flows from operating activitiesCash generated from operations 29 5,688 5,613Interest paid (531) (614)Corporation tax paid (749) (760)Net cash generated from operating activities 4,408 4,239Cash flows from investing activities Acquisition of subsidiaries, net of cash acquired (65) (89)Proceeds from sale of property, plant and equipment, investment property and non-current assets
classified as held for sale 1,141 1,906Purchase of property, plant and equipment and investment property (3,374) (3,178)Proceeds from sale of intangible assets – 3Purchase of intangible assets (334) (373)Net decrease/(increase) in loans to joint ventures 122 (194)Investments in joint ventures and associates (49) (174)Investments in short-term and other investments (1,972) (683)Proceeds from sale of short-term and other investments 1,205 719Dividends received from joint ventures and associates 40 62Interest received 103 128Net cash used in investing activities (3,183) (1,873)Cash flows from financing activities Proceeds from issue of ordinary share capital 69 98Increase in borrowings 2,905 2,217Repayment of borrowings (2,720) (4,153)Repayment of obligations under finance leases (45) (42)Purchase of non-controlling interests (89) –Dividends paid to equity owners (1,180) (1,081)Dividends paid to non-controlling interests (3) (2)Own shares purchased (303) (31)Net cash used in financing activities (1,366) (2,994)Net decrease in cash and cash equivalents (141) (628)Cash and cash equivalents at beginning of the year 2,428 3,102Effect of foreign exchange rate changes 24 (46)Cash and cash equivalents including cash held in disposal group at the end of the year 2,311 2,428Cash held in disposal group (6) –Cash and cash equivalents at the end of the year 18 2,305 2,428
Reconciliation of net cash flow to movement in net debt noteYear ended 25 February 2012 note
52 weeks2012
£m
52 weeks 2011*
£m
Net decrease in cash and cash equivalents (141) (628)Elimination of net decrease/(increase) in Tesco Bank cash and cash equivalents 126 (219)Investment in Tesco Bank (112) (446)Debt acquired on acquisition (98) (17)Net cash outflow to repay Retail debt and lease financing 262 2,870Dividend received from Tesco Bank 100 150Increase/(decrease) in Retail short-term investments 221 (292)(Decrease)/increase in Retail joint venture loan receivables (122) 159Other non-cash movements (330) (480)Elimination of other Tesco Bank non-cash movements 46 42(Increase)/decrease in net debt for the year (48) 1,139Opening net debt 30 (6,790) (7,929)Closing net debt 30 (6,838) (6,790)
NB. The reconciliation of net cash flow to movement in net debt note is not a primary statement and does not form part of the cash flow statement but forms part of the notes to the financial statements.
* See Note 1 Accounting policies for details of reclassifications.
The notes on pages 95 to 141 form part of these financial statements.
94 Tesco PLC Annual Report and Financial Statements 2012

STRATEGIC REVIEW PERFORMANCE REVIEW GOVERNANCE FINANCIAL STATEMENTSOVERVIEW
Note 1 Accounting policies
Notes to the Group financial statements
General informationTesco PLC (‘the Company’) is a public limited company incorporated and domiciled in the United Kingdom under the Companies Act 2006 (Registration number 445790). The address of the registered office is Tesco House, Delamare Road, Cheshunt, Hertfordshire, EN8 9SL, UK.
The financial year represents the 52 weeks ended 25 February 2012 (prior financial year 52 weeks ended 26 February 2011). For the UK, the Republic of Ireland and the US, the results are for the 52 weeks ended 25 February 2012 (prior financial year 52 weeks ended 26 February 2011). For all other operations, the results are for the calendar year ended 29 February 2012 (year ended 28 February 2011).
The main activities of the Company and its subsidiaries (together, ‘the Group’) are those of retailing and retail banking.
Basis of preparationThe consolidated Group financial statements have been prepared in accordance with International Financial Reporting Standards (‘IFRS’) and IFRS Interpretations Committee (‘IFRIC’) interpretations as endorsed by the European Union, and those parts of the Companies Act 2006 applicable to companies reporting under IFRS. The consolidated Group financial statements are presented in Pounds Sterling, generally rounded to the nearest million. They are prepared on the historical cost basis, except for certain financial instruments, share-based payments, customer loyalty programmes and pensions that have been measured at fair value.
Discontinued operationsDuring the financial year, the Board approved a plan to dispose of its operations in Japan which is consistent with the Group’s long-term strategic priority to drive growth and improve returns by focusing on its larger businesses in the region. In accordance with IFRS 5 ‘Non-current Assets Held for Sale and Discontinued Operations’, the net results for the year are presented within discontinued operations in the Group Income Statement (for which the comparatives have been reclassified) and the assets and liabilities of the business are presented separately in the Group Balance Sheet. See Note 7 for further details.
Cash and cash equivalents reclassificationDuring the financial year, the Group identified certain assets held by Tesco Bank that had a maturity profile of less than three months that would be more appropriately classified as cash and cash equivalents in accordance with IAS 7 ‘Statement of Cash Flows’. The assets identified comprised loans and advances to banks, certificates of deposit (included within other investments) and other receivables. The amounts relating to these balances have accordingly been reclassified in the Group Balance Sheet and the Group Cash Flow Statement as cash and cash equivalents. The impact of these reclassifications, with no change to net assets, is to:
increase cash and cash equivalents by £558m and £283m at 26 February 2011 and 27 February 2010 respectively;
decrease other investments by £170m and £165m at 26 February 2011 and 27 February 2010 respectively, such that other investments were £698m at 27 February 2010;
decrease loans and advances to banks by £404m and £144m at 26 February 2011 and 27 February 2010 respectively, such that loans and advances to banks were £nil at 27 February 2010;
increase trade and other receivables by £16m and £26m at 26 February 2011 and 27 February 2010 respectively, such that trade and other receivables were £1,914m at 27 February 2010; and
increase cash flows from operating activities by £270m and increase net cash used in investing activities by £5m for the 52 weeks ended 26 February 2011.
The accounting policies set out below have been applied consistently to all periods presented in these consolidated financial statements.
Basis of consolidationThe consolidated Group financial statements consist of the financial statements of the ultimate Parent Company (‘Tesco PLC’), all entities controlled by the Company (its subsidiaries) and the Group’s share of its interests in joint ventures and associates.
SubsidiariesThe financial statements of subsidiaries are included in the consolidated financial statements from the date that control commences until the date that control ceases.
Intragroup balances and any unrealised gains and losses or income and expenses arising from intragroup transactions are eliminated in preparing the consolidated financial statements.
Joint ventures and associatesThe Group’s share of the results of joint ventures and associates is included in the Group Income Statement using the equity method of accounting. Investments in joint ventures and associates are carried in the Group Balance Sheet at cost plus post-acquisition changes in the Group’s share of the net assets of the entity, less any impairment in value. The carrying values of investments in joint ventures and associates include acquired goodwill.
If the Group’s share of losses in a joint venture or associate equals or exceeds its investment in the joint venture or associate, the Group does not recognise further losses, unless it has incurred obligations to do so or made payments on behalf of the joint venture or associate.
Unrealised gains arising from transactions with joint ventures and associates are eliminated to the extent of the Group’s interest in the entity.
Use of assumptions and estimatesThe preparation of the consolidated Group financial statements requires management to make judgements, estimates and assumptions that affect the application of policies and reported amounts of assets and liabilities, income and expenses. The estimates and associated assumptions are based on historical experience and various other factors that are believed to be reasonable under the circumstances. Actual results may differ from these estimates. The estimates and underlying assumptions are reviewed on an ongoing basis.
Critical estimates and assumptions that are applied in the preparation of the consolidated financial statements include:
Depreciation and amortisationThe Group exercises judgement to determine useful lives and residual values of intangibles, property, plant and equipment and investment property. The assets are depreciated down to their residual values over their estimated useful lives.
Impairmenti) Impairment of goodwillThe Group tests annually whether goodwill has suffered any impairment. The recoverable amount of the cash-generating units has been determined based on value in use calculations. These calculations require the use of estimates as set out in Note 10.
ii) Impairment of assetsThe Group has determined each store as a separate cash-generating unit for impairment testing. Where there are indicators for impairment, the Group performs an impairment test.
Recoverable amounts for cash-generating units are based on the higher of value in use and fair value less costs to sell. Value in use is calculated from cash flow projections for five years using data from the Group’s latest internal forecasts. These calculations require the use of estimates as set out in Note 11.
Tesco PLC Annual Report and Financial Statements 2012 95

Notes to the Group financial statements
Note 1 Accounting policies continued
iii) Impairment of loans and advances to customers and banksThe Group’s loan impairment provisions are established to recognise incurred impairment losses in its portfolio of loans classified as loans and receivables and carried at amortised cost. These calculations require the use of estimates as set out in the accounting policy note for Financial instruments.
ProvisionsProvisions have been made for onerous leases, dilapidations, restructuring, pensions, customer redress and claims. These provisions are estimates and the actual costs and timing of future cash flows are dependent on future events. The difference between expectations and the actual future liability will be accounted for in the period when such determination is made.
The Group has a provision for potential customer redress. In the prior year, the Financial Services Authority (‘FSA’) formally issued Policy Statement 10/12 (‘PS 10/12’), which introduced new guidance in respect of Payment Protection Insurance (‘PPI’) customer redress and evidential provisions to the FSA Handbook with an implementation date of 1 December 2010. The Group will continue to handle complaints and redress customers in accordance with PS 10/12. This will include ongoing analysis of historical claims experience in accordance with the guidance.
The calculation of this provision involves estimating a number of variables, principally the level of customer complaints which may be received and the level of any compensation which may be payable to customers. The number of cases on which compensation is ultimately payable may also be influenced by the outcome of the analysis of historical claims referred to above. A change in the estimate of any of the key variable in this calculation could have the potential to significantly impact the provision recognised.
Insurance reservesThe Group recognises insurance commission arising from the sale of general insurance policies sold under the Tesco brand. The level of commission is dependent upon the profitability of the underlying insurance policies, which is in turn dependent on the level of reserves held by the insurance trading partner to underwrite the policies in place. Calculation of the required level of insurance claims reserves is dependent on a detailed actuarial review. Management also undertakes an assessment of other risks which are outside the scope of this review but that are inherent in assessing potential claims liabilities including court/legal rulings on individual large losses, the extent to which claims developments impact the reinsurance protection in place and the proportion of claims settling with periodic payment orders. A change in the estimate of any of the key variables in this calculation could have the potential to significantly impact the reserve balance recognised which would therefore also impact the insurance commission revenue recognised in the income statement. The nature of these factors is such that it is not possible at this time to quantify the uncertainty around the eventual cost.
Post-employment benefit obligationsThe present value of the post-employment benefit obligations depends on a number of factors that are determined on an actuarial basis using a number of assumptions. The assumptions used in determining the net cost (income) for pensions include the discount rate. Any changes in these assumptions will impact the carrying amount of post-employment benefit obligations.
Key assumptions for post-employment benefit obligations are disclosed in Note 26.
Adoption of new International Financial Reporting StandardsThe Group has adopted the following amended standards and interpretations as of 27 February 2011.
IAS 24 (amended) ‘Related party disclosures’
IFRIC 14 (amended) ‘Prepayments of a minimum funding requirement’
IFRIC 19 ‘Extinguishing financial liabilities with equity instruments’
The Group has adopted all amendments published in ‘Improvements to IFRSs’ issued in May 2010. The adoption of the above standards, interpretations and amendments has not had any significant impact on the amounts reported in the Group financial statements but may impact the accounting for future transactions and arrangements.
RevenueRevenue comprises the fair value of consideration received or receivable for the sale of goods and services in the ordinary course of the Group’s activities.
Sale of goodsRevenue is recognised when the significant risks and rewards of ownership of the goods have transferred to the buyer and the amount of revenue can be measured reliably.
Revenue is recorded net of returns, discounts/offers and value added taxes.
Provision of servicesRevenue from the provision of services is recognised when the service is provided and the revenue can be measured reliably, based on the terms of the contract.
Where the Group acts as an agent selling goods or services, only the commission income is included within revenue.
Financial servicesRevenue consists of interest, fees and income from the provision of insurance.
Interest income on financial assets that are classified as loans and receivables is determined using the effective interest rate method.
Calculation of the effective interest rate takes into account fees receivable, that are an integral part of the instrument’s yield, premiums or discounts on acquisition or issue, early redemption fees and transaction costs.
Fees in respect of services (such as credit card interchange, late payment, balance transfer fees and ATM revenue) are recognised as the right to consideration accrues through the provision of the service to the customer. The arrangements are generally contractual and the cost of providing the service is incurred as the service is rendered.
The Group generates commission from the sale and service of Motor and Home insurance policies underwritten by Tesco Underwriting Limited, or in a minority of cases by a third party underwriter. This is based on commission rates which are independent of the profitability of underlying insurance policies. Similar commission income is also generated from the sale of white label insurance products underwritten by other third party providers.
The Group continues to receive insurance commission arising from the sale of insurance policies sold under the Tesco brand through the legacy arrangement with RBS. This commission income is variable and dependent upon the profitability of the underlying insurance policies.
Clubcard, loyalty and other initiativesThe cost of Clubcard and loyalty initiatives is part of the fair value of the consideration received and is deferred and subsequently recognised over the period that the awards are redeemed. The deferral is treated as a deduction from revenue.
The fair value of the points awarded is determined with reference to the fair value to the customer and considers factors such as redemption via Clubcard deals versus money-off-in-store and redemption rate.
96 Tesco PLC Annual Report and Financial Statements 2012

STRATEGIC REVIEW PERFORMANCE REVIEW GOVERNANCE FINANCIAL STATEMENTSOVERVIEW
Tesco for Schools & Clubs vouchers are issued by Tesco for redemption by participating schools/clubs and are part of our overall Community Plan. The cost of the redemption (i.e meeting the obligation attached to the vouchers) is treated as a cost rather than a deduction from sales.
Rental incomeRental income is recognised in the period in which it is earned, in accordance with the terms of the lease.
Finance incomeFinance income, excluding income arising from financial services, is recognised in the period to which it relates using the effective interest rate method.
Finance costsFinance costs directly attributable to the acquisition or construction of qualifying assets are capitalised. Qualifying assets are those that necessarily take a substantial period of time to prepare for their intended use. All other borrowing costs are recognised in the Group Income Statement in finance costs, excluding those arising from financial services, in the period in which they occur. For Tesco Bank, finance cost on financial liabilities is determined using the effective interest rate method and is recognised in cost of sales.
Business combinations and goodwillThe Group accounts for all business combinations by applying the purchase method. All acquisition-related costs are expensed.
On acquisition, the assets (including intangible assets), liabilities and contingent liabilities of an acquired entity are measured at their fair value. Non-controlling interest is stated at the non-controlling interest’s proportion of the fair values of the assets and liabilities recognised.
Goodwill arising on consolidation represents the excess of the consideration transferred over the net fair value of the Group’s share of the net assets, liabilities and contingent liabilities of the acquired subsidiary, joint venture or associate and the fair value of the non-controlling interest in the acquiree. If the consideration is less than the fair value of the Group’s share of the net assets, liabilities and contingent liabilities of the acquired entity (i.e. a discount on acquisition), the difference is credited to the Group Income Statement in the period of acquisition.
At the acquisition date of a subsidiary, goodwill acquired is recognised as an asset and is allocated to each of the cash-generating units expected to benefit from the business combination’s synergies and to the lowest level at which management monitors the goodwill. Goodwill arising on the acquisition of joint ventures and associates is included within the carrying value of the investment.
On disposal of a subsidiary, joint venture or associate, the attributable amount of goodwill is included in the determination of the profit or loss on disposal.
Intangible assetsAcquired intangible assetsSeparately acquired intangible assets, such as software, pharmacy licences, customer relationships, contracts and brands are measured initially at cost. Intangible assets acquired in a business combination are recognised at fair value at the acquisition date. Intangible assets with finite useful lives are carried at cost and are amortised on a straight-line basis over their estimated useful lives, at 2%-100% of cost per annum.
Internally-generated intangible assets – Research and development expenditureResearch costs are expensed as incurred. Development expenditure incurred on an individual project is capitalised only if specific criteria are met including that the asset created will probably generate future economic benefits.
Following the initial recognition of development expenditure, the cost is amortised over the asset’s estimated useful life at 10%-25% of cost per annum.
Property, plant and equipment Property, plant and equipment is carried at cost less accumulated depreciation and any recognised impairment in value.
Property, plant and equipment is depreciated on a straight-line basis to its residual value over its anticipated useful economic life. The following depreciation rates are applied for the Group:
freehold and leasehold buildings with greater than 40 years unexpired – at 2.5% of cost;
leasehold properties with less than 40 years unexpired are depreciated by equal annual instalments over the unexpired period of the lease; and
plant, equipment, fixtures and fittings and motor vehicles – at rates varying from 9% to 50%.
Assets held under finance leases are depreciated over their expected useful lives on the same basis as owned assets or, when shorter, over the term of the relevant lease.
Impairment of non-financial assetsGoodwill is reviewed for impairment at least annually by assessing the recoverable amount of each cash-generating unit to which the goodwill relates. The recoverable amount is the higher of fair value less costs to sell, and value in use. When the recoverable amount of the cash-generating unit is less than the carrying amount, an impairment loss is recognised. Any impairment is recognised immediately in the Group Income Statement and is not subsequently reversed.
For all other non-financial assets (including intangible assets and property, plant and equipment) the Group performs impairment testing where there are indicators of impairment. If such an indicator exists, the recoverable amount of the asset is estimated in order to determine the extent of the impairment loss (if any). Where the asset does not generate cash flows that are independent from other assets, the Group estimates the recoverable amount of the cash-generating unit to which the asset belongs.
The recoverable amount is the higher of fair value less costs to sell and value in use. If the recoverable amount of an asset (or cash-generating unit) is estimated to be less than its carrying amount, the carrying amount of the asset (or cash-generating unit) is reduced to its recoverable amount. An impairment loss is recognised immediately in the Group Income Statement.
Where an impairment loss subsequently reverses, the carrying amount of the asset (or cash-generating unit) is increased to the revised estimate of the recoverable amount, but so that the increased carrying amount does not exceed the carrying amount that would have been determined if no impairment loss had been recognised for the asset (or cash-generating unit) in prior years. A reversal of an impairment loss is recognised immediately as a credit to the Group Income Statement.
Investment propertyInvestment property assets are carried at cost less accumulated depreciation and any recognised impairment in value. The depreciation policies for investment property are consistent with those described for owner-occupied property.
Short-term and other investmentsShort-term and other investments in the Group Balance Sheet comprise receivables, loan receivables and available-for-sale financial assets.
Receivables and loan receivables are recognised at amortised cost. Available-for-sale financial assets are recognised at fair value.
Refer to the financial instruments accounting policy for further detail.
InventoriesInventories comprise goods and properties held for resale and properties held for, or in the course of, development with a view to sell. Inventories are valued at the lower of cost and fair value less costs to sell using the weighted average cost basis.
Note 1 Accounting policies continued
Tesco PLC Annual Report and Financial Statements 2012 97

Notes to the Group financial statements
Cash and cash equivalentsCash and cash equivalents in the Group Balance Sheet consist of cash at bank, in hand, demand deposits with banks, loans and advances to banks, certificate of deposits and other receivables together with short-term deposits with an original maturity of three months or less.
Non-current assets held for saleNon-current assets and disposal groups are classified as held for sale if their carrying amount will be recovered through sale rather than continuing use. Non-current assets (and disposal groups) classified as held for sale are measured at the lower of carrying amount and fair value less costs to sell.
LeasingLeases are classified as finance leases whenever the terms of the lease transfer substantially all the risks and rewards of ownership to the lessee. All other leases are classified as operating leases.
The Group as a lessorAmounts due from lessees under finance leases are recorded as receivables at the amount of the Group’s net investment in the leases. Finance lease income is allocated to accounting periods so as to reflect a constant periodic rate of return on the Group’s net investment in the lease. Rental income from operating leases is recognised on a straight-line basis over the term of the lease.
The Group as a lesseeAssets held under finance leases are recognised as assets of the Group at their fair value or, if lower, at the present value of the minimum lease payments, each determined at the inception of the lease. The corresponding liability is included in the Group Balance Sheet as a finance lease obligation. Lease payments are apportioned between finance charges and a reduction of the lease obligations so as to achieve a constant rate of interest on the remaining balance of the liability. Finance charges are charged to the Group Income Statement. Rentals payable under operating leases are charged to the Group Income Statement on a straight-line basis over the term of the lease.
Sale and leasebackA sale and leaseback transaction is one where the Group sells an asset and immediately reacquires the use of the asset by entering into a lease with the buyer.
The accounting treatment of the sale and leaseback depends upon the substance of the transaction (by applying the lease classification principles described above) and whether or not the sale was made at the asset’s fair value.
For sale and finance leasebacks, any profit from the sale is deferred and amortised over the lease term. For sale and operating leasebacks, generally the assets are sold at fair value, and accordingly the profit or loss from the sale is recognised immediately in the Group Income Statement.
Post-employment and similar obligationsFor defined benefit plans, obligations are measured at discounted present value (using the projected unit credit method) whilst plan assets are recorded at fair value. The operating and financing costs of such plans are recognised separately in the Group Income Statement; service costs are spread systematically over the expected service lives of employees and financing costs are recognised in the periods in which they arise. Actuarial gains and losses are recognised immediately in the Group Statement of Comprehensive Income.
Payments to defined contribution schemes are recognised as an expense as they fall due.
Share-based paymentsThe fair value of employee share option plans is calculated at the grant date using the Black-Scholes model. The resulting cost is charged to the Group Income Statement over the vesting period. The value of the charge is adjusted to reflect expected and actual levels of vesting.
TaxationThe tax expense included in the Group Income Statement consists of current and deferred tax.
Current tax is the expected tax payable on the taxable income for the year, using tax rates enacted or substantively enacted by the balance sheet date. Tax expense is recognised in the Group Income Statement except to the extent that it relates to items recognised in the Group Statement of Other Comprehensive Income or directly in the Group Statement of Changes in Equity, in which case it is recognised in the Group Statement of Other Comprehensive Income or directly in the Group Statement of Changes in Equity, respectively.
Deferred tax is provided using the balance sheet liability method, providing for temporary differences between the carrying amounts of assets and liabilities for financial reporting purposes and the amounts used for taxation purposes.
Deferred tax is calculated at the tax rates that have been enacted or substantively enacted by the balance sheet date. Deferred tax is charged or credited in the Group Income Statement, except when it relates to items charged or credited directly to equity or other comprehensive income, in which case the deferred tax is also recognised in equity, or other comprehensive income, respectively.
Deferred tax assets are recognised to the extent that it is probable that taxable profits will be available against which deductible temporary differences can be utilised.
The carrying amount of deferred tax assets is reviewed at each balance sheet date and reduced to the extent that it is no longer probable that sufficient taxable profits will be available to allow all or part of the assets to be recovered.
Deferred tax assets and liabilities are offset against each other when there is a legally enforceable right to set-off current taxation assets against current taxation liabilities and it is the intention to settle these on a net basis.
Foreign currenciesTransactions in foreign currencies are translated at the exchange rate on the date of the transaction. At each balance sheet date, monetary assets and liabilities that are denominated in foreign currencies are retranslated at the rates prevailing on the balance sheet date. All differences are taken to the Group Income Statement.
The assets and liabilities of overseas subsidiaries denominated in foreign currencies are translated into Pound Sterling at exchange rates prevailing at the date of the Group Balance Sheet; profits and losses are translated at average exchange rates for the relevant accounting periods. Exchange differences arising are recognised in the Group Statement of Comprehensive Income and are included in the Group’s translation reserve. Such translation differences are recognised as income or expenses in the period in which the operation is disposed of.
Note 1 Accounting policies continued
98 Tesco PLC Annual Report and Financial Statements 2012

STRATEGIC REVIEW PERFORMANCE REVIEW GOVERNANCE FINANCIAL STATEMENTSOVERVIEW
Goodwill and fair value adjustments arising on the acquisition of a foreign entity are treated as assets and liabilities of the foreign entity and translated at the closing rate.
Financial instrumentsFinancial assets and financial liabilities are recognised on the Group Balance Sheet when the Group becomes a party to the contractual provisions of the instrument.
Trade receivablesTrade receivables are non interest-bearing and are recognised initially at fair value, and subsequently at amortised cost using the effective interest rate method, less provision for impairment.
InvestmentsInvestments are recognised at trade date. Investments are classified as either held for trading or available-for-sale, and are recognised at fair value. For available-for-sale investments, gains and losses arising from changes in fair value are recognised directly in the other comprehensive income, until the security is disposed of or is determined to be impaired, at which time the cumulative gain or loss previously recognised in other comprehensive income is included in the Group Income Statement for the period. Interest calculated using the effective interest rate method is recognised in the Group Income Statement. Dividends on an available-for-sale equity instrument are recognised in the Group Income Statement when the entity’s right to receive payment is established.
Loans and advances to customersLoans and advances to customers are not classified as held for trading nor designated as fair value through profit and loss. Loans and advances are initially recognised at fair value plus directly related transaction costs. Subsequent to initial recognition, these assets are carried at amortised cost using the effective interest method less any impairment losses. Income from these financial assets is calculated on an effective yield basis and is recognised in the Group Income Statement.
Impairment of loans and advances to customersAt each balance sheet date the Group reviews the carrying amounts of its loans and advances to determine whether there is any indication that those assets have suffered an impairment loss.
If there is objective evidence that an impairment loss on a financial asset or group of financial assets classified as loans and advances has been incurred, the Group measures the amount of the loss as the difference between the carrying amount of the asset or group of assets and the present value of estimated future cash flows from the asset or group of assets discounted at the effective interest rate of the instrument at initial recognition. Impairment losses are assessed individually for financial assets that are individually significant and collectively for assets that are not individually significant. In making collective assessments of impairment, financial assets are grouped into portfolios on the basis of similar risk characteristics. Future cash flows from these portfolios are estimated on the basis of the contractual cash flows and historical loss experience for assets with similar credit risk characteristics. Historical loss experience is adjusted, on the basis of current observable data, to reflect the effects of current conditions not affecting the period of historical experience.
Impairment losses are recognised in the Group Income Statement and the carrying amount of the financial asset or group of financial assets is reduced by establishing an allowance for impairment losses. If in a subsequent period the amount of the impairment loss reduces and the reduction can be ascribed to an event after the impairment was recognised, the previously recognised loss is reversed by adjusting the allowance. Once an impairment loss has been recognised on a financial asset or group of financial assets, interest income is recognised on the carrying amount using the rate of interest at which estimated future cash flows were discounted in measuring impairment.
Loan impairment provisions are established on a portfolio basis taking into account the level of arrears, security, past loss experience, credit scores and defaults based on portfolio trends. The most significant factors in establishing these provisions are the expected loss rates. The portfolios include credit card receivables and other personal advances. The future credit quality of these portfolios is subject to uncertainties that could cause actual credit losses to differ materially from reported loan impairment provisions. These uncertainties include the economic environment, notably interest rates and their effect on customer spending, the unemployment level, payment behaviour and bankruptcy trends.
Interest-bearing borrowingsInterest-bearing bank loans and overdrafts are initially recorded at fair value, net of attributable transaction costs. Subsequent to initial recognition, interest-bearing borrowings are stated at amortised cost with any difference between proceeds and redemption value being recognised in the Group Income Statement over the period of the borrowings on an effective interest basis.
Trade payablesTrade payables are non interest-bearing and are recognised initially at fair value and subsequently measured at amortised cost using the effective interest method.
Equity instrumentsEquity instruments issued by the Group are recorded at the proceeds received, net of direct issue costs.
Derivative financial instruments and hedge accountingThe Group uses derivative financial instruments to hedge its exposure to foreign exchange, interest rate and commodity risks arising from operating, financing and investing activities. The Group does not hold or issue derivative financial instruments for trading purposes, however, if derivatives do not qualify for hedge accounting they are accounted for as such.
Derivative financial instruments are recognised and stated at fair value. Where derivatives do not qualify for hedge accounting, any gains or losses on remeasurement are immediately recognised in the Group Income Statement. Where derivatives qualify for hedge accounting, recognition of any resultant gain or loss depends on the nature of the hedge relationship and the item being hedged. In order to qualify for hedge accounting, the Group is required to document from inception the relationship between the item being hedged and the hedging instrument. The Group is also required to document and demonstrate an assessment of the relationship between the hedged item and the hedging instrument, which shows that the hedge will be highly effective on an ongoing basis. This effectiveness testing is performed at each period end to ensure that the hedge remains highly effective.
Derivative financial instruments with maturity dates of more than one year from the balance sheet date are disclosed as non-current.
Fair value hedgingDerivative financial instruments are classified as fair value hedges when they hedge the Group’s exposure to changes in the fair value of a recognised asset or liability. Changes in the fair value of derivatives that are designated and qualify as fair value hedges are recorded in the Group Income Statement together with any changes in the fair value of the hedged item that is attributable to the hedged risk.
Cash flow hedgingDerivative financial instruments are classified as cash flow hedges when they hedge the Group’s exposure to variability in cash flows that are either attributable to a particular risk associated with a recognised asset or liability, or a highly probable forecasted transaction. The effective element of any gain or loss from remeasuring the derivative instrument is recognised directly in the other comprehensive income.
Note 1 Accounting policies continued
Tesco PLC Annual Report and Financial Statements 2012 99

Notes to the Group financial statements
The associated cumulative gain or loss is reclassified from the other comprehensive income and recognised in the Group Income Statement in the same period or periods during which the hedged transaction affects the Group Income Statement. The classification of the effective portion when recognised in the Group Income Statement is the same as the classification of the hedged transaction. Any element of the remeasurement of the derivative instrument which does not meet the criteria for an effective hedge is recognised immediately in the Group Income Statement within finance income or costs.
Hedge accounting is discontinued when the hedging instrument expires or is sold, terminated or exercised, or no longer qualifies for hedge accounting. At that point in time, any cumulative gain or loss on the hedging instrument recognised in equity is retained in the Group Statement of Changes in Equity until the forecasted transaction occurs or the original hedged item affects the Group Income Statement. If a forecasted hedged transaction is no longer expected to occur, the net cumulative gain or loss recognised in the Group Statement of Changes in Equity is reclassified to the Group Income Statement.
Net investment hedgingDerivative financial instruments are classified as net investment hedges when they hedge the Group’s net investment in an overseas operation. The effective element of any foreign exchange gain or loss from remeasuring the derivative instrument is recognised directly in other comprehensive income. Any ineffective element is recognised immediately in the Group Income Statement. Gains and losses accumulated in other comprehensive income are included in the Group Income Statement when the foreign operation is disposed of.
Treatment of agreements to acquire non-controlling interestsThe Group has entered into a number of agreements to purchase the remaining shares of subsidiaries with non-controlling interests.
The net present value of the expected future payments are shown as a financial liability. At the end of each period, the valuation of the liability is reassessed with any changes recognised in the Group Income Statement within finance income or costs.
ProvisionsProvisions are measured at the present value of the expenditures expected to be required to settle the obligation using a pre-tax rate that reflects current market assessments of the time value of money and the risks specific to the obligation. The increase in the provision due to passage of time is recognised as interest expense.
Provisions for onerous leases are recognised when the Group believes that the unavoidable costs of meeting the lease obligations exceed the economic benefits expected to be received under the lease. Provisions for dilapidation costs are recognised on a lease by lease basis.
Other recent accounting developmentsAs of the date of authorisation of these financial statements, the following standards were in issue but not yet effective and not yet been endorsed by the EU. The Group has not applied these standards in the preparation of the financial statements:
IAS 1 (Amended) ‘Financial statement presentation’ regarding other comprehensive income ‘Presentation of financial statements’ is effective from periods commencing on or after 1 July 2012. The main change from this amendment is to require entities to group items presented in ‘other comprehensive income’ (‘OCI’) on the basis of whether they are potentially reclassifiable to the Group Income Statement subsequently (reclassification adjustments). The amendments do not address which items are presented in OCI.
IAS 19 (Amended) ‘Employee benefits’ is effective from periods commencing on or after 1 January 2013. It eliminates the corridor approach and requires immediate recognition of all actuarial gains and losses in the other comprehensive income, immediate recognition of all past service costs and the replacement of interest cost and expected return on plan assets with a net interest amount that is calculated by applying the discount rate to the net defined benefit liability/asset.
IFRS 9 ‘Financial instruments’ is effective from periods commencing on or after 1 January 2015. It is the first standard issued as part of a wider project to replace IAS 39. It retains but simplifies the mixed measurement model and establishes two primary measurement categories for financial assets: i) amortised cost and ii) fair value. The basis of classification depends on the entity’s business model and the contractual cash flow characteristics of the financial asset.
IFRS 10 ‘Consolidated financial statements’ is effective from periods commencing on or after 1 January 2013. It builds on existing principles by identifying the concept of control as the determining factor in whether an entity should be included within the consolidated financial statements of the parent company. It also provides additional guidance to assist in the determination of control where this is difficult to assess.
IFRS 11 ‘Joint arrangements’ is effective from periods commencing on or after 1 January 2013. It is a more realistic reflection of joint arrangements by focusing on the rights and obligations of the arrangement rather than its legal form. There are now only two types of joint arrangement: joint operations and joint ventures.
IFRS 12 ‘Disclosures of interests in other entities’ is effective from periods commencing on or after 1 January 2013. It includes the disclosure requirements for all forms of interests in other entities, including joint arrangements, associates, special purpose vehicles and other off balance sheet vehicles.
IFRS 13 ‘Fair value measurement’ is effective from periods commencing on or after 1 January 2013. It aims to improve consistency and reduce complexity by providing precise definition of fair value and single source of fair value measurement and disclosure requirements for use across IFRSs.
IAS 27 (Amended) ‘Separate financial statements’ is effective from periods commencing on or after 1 January 2013. It includes the provisions on separate financial statements that are left after the control provisions of IAS 27 have been included in the new IFRS 10.
IAS 28 (Amended) ‘Associates and joint ventures’ is effective from periods commencing on or after 1 January 2013. It includes the requirements for joint ventures, as well as associates, to be equity accounted following the issue of IFRS 11.
IFRS 7 (Amended) ‘Financial instruments: Disclosures’ and IAS 32 (Amended) Financial instruments: Presentation’ are effective from 1 January 2013 and 2014 respectively. The IAS 32 amendment clarifies some of the requirements for offsetting financial assets and financial liabilities on the statement of financial position while the IFRS 7 amendment will require more extensive disclosures than are required under IFRS.
Use of non-GAAP profit measures – underlying profit before taxThe Directors believe that underlying profit before tax and underlying diluted earnings per share measures provide additional useful information for shareholders on underlying trends and performance. These measures are used for performance analysis. Underlying profit is not defined by IFRS and therefore may not be directly comparable with other companies’ adjusted profit measures. It is not intended to be a substitute for, or superior to IFRS measurements of profit.
Note 1 Accounting policies continued
100 Tesco PLC Annual Report and Financial Statements 2012

STRATEGIC REVIEW PERFORMANCE REVIEW GOVERNANCE FINANCIAL STATEMENTSOVERVIEW
The adjustments made to reported profit before tax are:
IAS 32 and IAS 39 ‘Financial Instruments’ – fair value remeasurements. Under IAS 32 and IAS 39, the Group applies hedge accounting to its various hedge relationships when allowed under IAS 39 and when practical to do so. Sometimes the Group is unable to apply hedge accounting to the arrangements but continues to enter into these arrangements as they provide certainty or active management of the exchange rates and interest rates applicable to the Group. The Group believes these arrangements remain effective and economically and commercially viable hedges despite the inability to apply hedge accounting. Where hedge accounting is not applied to certain hedging arrangements, the reported results reflect the movement in fair value of related derivatives due to changes in foreign exchange and interest rates. In addition, at each year end, any gain or loss accruing on open contracts is recognised in the Group Income Statement for the financial year, regardless of the expected outcome of the hedging contract on termination. This may mean that the Group Income Statement charge is highly volatile, whilst the resulting cash flows may not be as volatile. The underlying profit measure removes this volatility to help better identify underlying performance of the Group.
IAS 19 ‘Employee Benefits’ – non-cash Group Income Statement charge for pensions. Under IAS 19, the cost of providing pension benefits in the future is discounted to a present value at the corporate bond yield rates applicable on the last day of the previous financial year. Corporate bond yield rates vary over time which in turn creates volatility in the Group Income Statement and Group Balance Sheet. IAS 19 also increases the charge for young pension schemes, such as the Group’s, by requiring the use of rates which do not take into account the future expected returns on the assets held in the pension scheme which will fund pension liabilities as they fall due. The sum of these two effects can make the IAS 19 charge disproportionately higher and more volatile than the cash contributions the Group is required to make in order to fund all future liabilities. Therefore, within underlying profit the Group has included the ‘normal’ cash contributions for pensions but excluded the volatile element of IAS 19 to represent what the Group believes to be a fairer measure of the cost of providing post-employment benefits.
IAS 17 ‘Leases’ – impact of annual uplifts in rent and rent-free periods. The amount charged to the Group Income Statement in respect of operating lease costs and incentives is expected to increase significantly as the Group expands its international business. The leases have been structured in a way to increase annual lease costs as the businesses expand. IAS 17 requires the total expected cost of a lease to be recognised on a straight-line basis over the term of the lease, irrespective of the actual timing of the cost. This adjustment also impacts the Group’s operating profit and rental income within the share of post-tax profits of joint ventures and associates.
IFRS 3 (Revised) ‘Business Combinations’ – intangible asset amortisation charges and costs arising from acquisitions. Under IFRS 3 intangible assets are separately identified and fair valued. The intangible assets are required to be amortised on a straight-line basis over their useful lives and as such is a non-cash charge that does not reflect the underlying performance of the business acquired. Similarly, the standard requires all acquisition costs to be expensed in the Group Income Statement. Due to their nature, these costs have been excluded from underlying profit as they do not reflect the underlying performance of the Group.
IFRIC 13 ‘Customer Loyalty Programmes’ – fair value of awards. The interpretation requires the fair value of customer loyalty awards to be measured as a separate component of a sales transaction. The underlying profit measure removes this fair value allocation to present underlying business performance, and to reflect the performance of the operating segments as measured by management.
IAS 36 ‘Impairment of Intangibles’ – impairment of goodwill arising on acquisitions. The remaining carrying value of goodwill relating to Japan was not fully recoverable and was fully impaired during the prior financial year. The resulting non-cash charge does not reflect the underlying performance of the Group.
Restructuring and other one-off costs. These relate to certain costs associated with the Group’s restructuring activities and certain one-off costs including costs relating to fair valuing the assets of a disposal group. These have been excluded from underlying profit as they do not reflect the underlying performance of the Group.
Note 1 Accounting policies continued
Tesco PLC Annual Report and Financial Statements 2012 101

Notes to the Group financial statements
Note 2 Segmental reporting
The Group’s reporting segments are determined based on the Group’s internal reporting to the Chief Operating Decision Maker (‘CODM’). The CODM has been determined to be the Executive Committee as it is primarily responsible for the allocation of resources to segments and the assessment of performance of the segments.
During the financial year, the Group announced its decision to sell its operations in Japan (previously reported as part of the Asia segment). Accordingly, these operations have been treated as discontinued as described in more detail in Notes 1 and 7. The segment results do not include any amounts for these discontinued operations. The segment assets and other segment information sets out continuing operations separately from discontinued operations.
The CODM now considers the principal activities of the Group to be:
Retailing and associated activities in:
– the UK;
– Asia – China, India, Malaysia, South Korea, Thailand;
– Europe – Czech Republic, Hungary, Poland, Republic of Ireland, Slovakia, Turkey; and
– the United States of America (‘US’)
Retail banking and insurance services through Tesco Bank in the UK.
The CODM uses trading profit, as reviewed at monthly Executive Committee meetings, as the key measure of the segments’ results as it reflects the segments’ underlying trading performance for the financial year under evaluation. Trading profit is a consistent measure within the Group.
Segment trading profit is an adjusted measure of operating profit and measures the performance of each segment before profits/losses arising on property-related items, the impact on leases of annual uplifts in rent and rent-free periods, intangible asset amortisation charges and costs arising from acquisitions, and goodwill impairment and restructuring and other one-off costs. The IAS 19 pension charge is replaced with the ‘normal’ cash contributions for pensions. An adjustment is also made for the fair value of customer loyalty awards.
Inter-segment revenue between the operating segments is not material.
The segment results, the reconciliation of the segment measures to the respective statutory items included in the Group Income Statement, the segment assets and other segment information are as follows:
Year ended 25 February 2012At constant exchange rates*
UK£m
Asia£m
Europe
£mUS£m
TescoBank
£m
Total atconstant
exchange£m
Foreignexchange
£m
Totalat actual
exchange£m
Continuing operationsSales including VAT (excluding IFRIC 13) 47,355 11,615 11,380 660 1,044 72,054 (19) 72,035 Revenue (excluding IFRIC 13) 42,798 10,816 9,878 652 1,044 65,188 (22) 65,166 Effect of IFRIC 13 (550) (35) (39) (2) – (626) (1) (627)Revenue 42,248 10,781 9,839 650 1,044 64,562 (23) 64,539 Trading profit/(loss) 2,480 735 525 (158) 168 3,750 11 3,761 Trading margin† 5.8% 6.8% 5.3% (24.2%) 16.1% 5.8% 5.8%
Year ended 25 February 2012At actual exchange rates**
UK£m
Asia£m
Europe£m
US£m
TescoBank
£m
Totalat actual
exchange£m
Continuing operationsSales including VAT (excluding IFRIC 13) 47,355 11,627 11,371 638 1,044 72,035 Revenue (excluding IFRIC 13) 42,798 10,828 9,866 630 1,044 65,166 Effect of IFRIC 13 (550) (35) (40) (2) – (627)Revenue 42,248 10,793 9,826 628 1,044 64,539 Trading profit/(loss) 2,480 737 529 (153) 168 3,761 Trading margin† 5.8% 6.8% 5.4% (24.3%) 16.1% 5.8%
* Constant exchange rates are the average actual periodic exchange rates for the previous financial year.** Actual exchange rates are the average actual periodic exchange rates for that financial year.† Trading margin is based on revenue excluding the accounting impact of IFRIC 13.
102 Tesco PLC Annual Report and Financial Statements 2012

STRATEGIC REVIEW PERFORMANCE REVIEW GOVERNANCE FINANCIAL STATEMENTSOVERVIEW
Note 2 Segmental reporting continued
Year ended 26 February 2011*
At actual exchange rates**UK£m
Asia£m
Europe
£mUS£m
TescoBank
£m
Totalat actual
exchange£m
Continuing operationsSales including VAT (excluding IFRIC 13) 44,571 10,524 10,558 502 919 67,074 Revenue (excluding IFRIC 13) 40,766 9,802 9,192 495 919 61,174 Effect of IFRIC 13 (649) (37) (33) – – (719)Revenue 40,117 9,765 9,159 495 919 60,455 Trading profit/(loss) 2,504 605 527 (186) 264 3,714 Trading margin† 6.1% 6.2% 5.7% (37.6%) 28.7% 6.1%
Reconciliation of trading profit to profit before tax
2012£m
2011*£m
Trading profit 3,761 3,714Adjustments:Profit/losses arising on property-related items 376 432IAS 19 ‘Employee Benefits’ – non-cash Group Income Statement charge for pensions (35) (95)IAS 17 ‘Leases’ – impact of annual uplifts in rent and rent-free periods (48) (64)IFRS 3 ‘Business Combinations’ – intangible asset amortisation charges and costs arising from acquisitions (22) (42)IFRIC 13 ‘Customer Loyalty Programmes’ – fair value of awards (17) (8)Restructuring and other one-off costs (30) (20)Operating profit 3,985 3,917Share of post-tax profits from joint ventures and associates 91 57Finance income 176 150Finance costs (417) (483)Profit before tax 3,835 3,641Taxation (879) (864)Profit for the year from continuing operations 2,956 2,777
Segment assets
At 25 February 2012UK£m
Asia£m
Europe£m
US£m
TescoBank
£m
Other/unallocated
£m
Total continuingoperations
Discontinuedoperations
Total£m
Total segment non-current assets 14,978 8,471 6,835 1,086 4,799 1,749 37,918 – 37,918Total segment non-current assets includes:
Investments in joint ventures and associates 134 217 – – 72 – 423 – 423
At 26 February 2011*UK£m
Asia£m
Europe£m
US£m
TescoBank
£m
Other/unallocated
£m
Total continuingoperations
Discontinuedoperations
Total£m
Total segment non-current assets 14,456 7,557 6,601 945 4,340 1,187 35,086 81 35,167Total segment non-current assets includes:
Investments in joint ventures and associates 79 173 – – 64 – 316 – 316
* See Note 1 Accounting policies for details of reclassifications.** Actual exchange rates are the average actual periodic exchange rates for that financial year.† Trading margin is based on revenue excluding the accounting impact of IFRIC 13.
Tesco PLC Annual Report and Financial Statements 2012 103

Notes to the Group financial statements
Note 2 Segmental reporting continued
Other segment information
Year ended 25 February 2012UK£m
Asia£m
Europe£m
US£m
TescoBank
£m
Total continuingoperations
Discontinuedoperations
Total£m
Capital expenditure (including acquisitions through business combinations):Property, plant and equipment 1,495 1,140 663 143 22 3,463 4 3,467Investment property – 8 102 – – 110 – 110Goodwill and other intangible assets 179 29 68 22 143 441 – 441
Depreciation:Property, plant and equipment (617) (306) (277) (45) (16) (1,261) (4) (1,265)Investment property – (15) (24) – – (39) – (39)
Amortisation of intangible assets (113) (12) (22) – (44) (191) (3) (194)Impairment losses (27) (5) (3) (9) – (44) (77) (121)Reversal of prior year impairment losses 27 1 8 – – 36 – 36
Year ended 26 February 2011*UK£m
Asia£m
Europe£m
US£m
TescoBank
£m
Total continuingoperations
Discontinuedoperations
Total£m
Capital expenditure (including acquisitions through business combinations):Property, plant and equipment 1,486 958 603 192 62 3,301 19 3,320Investment property – 17 7 – – 24 – 24
Goodwill and other intangible assets 159 26 23 82 163 453 2 455Depreciation:
Property, plant and equipment (607) (265) (263) (40) (11) (1,186) (8) (1,194)Investment property – (17) (14) – – (31) – (31)
Amortisation of intangible assets (109) (13) (22) – (47) (191) (4) (195)Goodwill impairment losses – – – – – – (55) (55)Impairment losses (14) – (3) (8) – (25) – (25)Reversal of prior year impairment losses 14 13 11 – – 38 – 38
* See Note 1 Accounting policies for details of reclassifications.
Note 3 Income and expenses
Continuing operations2012
£m 2011*
£m
Profit before tax is stated after charging/(crediting) the following:Rental income, of which £499m (2011: £417m) relates to investment properties (605) (541)Direct operating expenses arising on rental earning investment properties 157 122 Costs of inventories recognised as an expense 48,910 45,529Stock losses 1,155 1,023Depreciation, amortisation and impairment charged 1,499 1,395Operating lease expense, of which £133m (2011: £53m) relates to hire of plant and machinery 1,247 1,033
* See Note 1 Accounting policies for details of reclassifications.
104 Tesco PLC Annual Report and Financial Statements 2012

STRATEGIC REVIEW PERFORMANCE REVIEW GOVERNANCE FINANCIAL STATEMENTSOVERVIEW
Note 3 Income and expenses continued
During the financial year the Group obtained the following services from the Group’s auditor, PricewaterhouseCoopers LLP, and network firms:
2012£m
2011*£m
Audit servicesFees payable to the Company’s auditor for the audit of the Company and Group financial statements 0.7 0.6The audit of the accounts of the Company’s subsidiaries pursuant to legislation 3.9 3.6
4.6 4.2Non-audit servicesFees payable to the Company’s auditor and network firms for other services:
Other services pursuant to legislation – 0.1Other services relating to taxation 0.6 0.7Other services relating to information technology 0.4 0.3All other services 1.5 0.6
Total auditor remuneration 7.1 5.9
In addition to the amounts shown above, the auditors received fees of £0.1m (2011: £0.1m) for the audit of the main Group pension scheme.
A description of the work of the Audit Committee is set out in the Corporate Governance Report on page 58 and includes how objectivity and independence is safeguarded when non-audit services are provided by PricewaterhouseCoopers LLP.
* See Note 1 Accounting policies for details of reclassifications.
Note 4 Employment costs, including Directors’ remuneration
Continuing operations2012
£m2011*
£m
Wages and salaries 5,719 5,409 Social security costs 473 464 Post-employment defined benefits (Note 26) 492 528 Post-employment defined contributions (Note 26) 20 14 Share-based payments expense (Note 25) 153 287
6,857 6,702
The average number of employees by operating segment during the financial year was:
Average number of employees
Average number of full-time equivalents
2012 2011* 2012 2011*
UK 300,373 293,676 205,852 200,966 Asia 117,015 99,704 108,149 94,141Europe 94,409 89,559 85,071 82,270 US 5,056 4,134 4,297 3,448 Tesco Bank 2,818 1,274 2,719 1,224 Total 519,671 488,347 406,088 382,049
* See Note 1 Accounting policies for details of reclassifications.
Tesco PLC Annual Report and Financial Statements 2012 105

Notes to the Group financial statements
Note 5 Finance income and costs
Continuing operations2012
£m2011
£m
Finance incomeBank interest receivable and similar income on cash and cash equivalents 114 131Net pension finance income (Note 26) 18 –IAS 32 and IAS 39 ‘Financial Instruments’ – fair value remeasurements 44 19Total finance income 176 150
Finance costsInterest payable on short-term bank loans and overdrafts repayable within five years (62) (101)Finance charges payable under finance leases and hire purchase contracts (11) (10)GBP MTN (226) (233)EUR MTN (180) (194)USD MTN (67) (57)Other MTNs (11) (17)Capitalised interest (Note 11) 140 147 Total finance costs (417) (465)Net pension finance cost (Note 26) – (18)Total finance costs (417) (483)
GBP MTNsInterest payable on the 4% RPI GBP MTN 2016 includes £13m (2011: £12m) of Retail Price Index (RPI) related amortisation.Interest payable on the 3.322% LPI GBP MTN 2025 includes £13m (2011: £10m) of RPI related amortisation.Interest payable on the 1.982% RPI GBP MTN 2036 includes £11m (2011: £11m) of RPI related amortisation.
Note 6 Taxation
Recognised in the Group Income Statement
Continuing operations2012
£m2011
£m
Current tax expenseUK corporation tax 579 694 Foreign tax 196 181 Adjustments in respect of prior years (42) (114) 733 761 Deferred tax expenseOrigination and reversal of temporary differences 230 148Adjustments in respect of prior years (12) 12 Change in tax rate (72) (57)
146 103 Total income tax expense 879 864
The Finance Act 2011 included legislation to reduce the main rate of corporation tax from 27% to 26% from 1 April 2011 and to 25% from 1 April 2012. The reduction from 27% to 25% was substantively enacted at the balance sheet date and has therefore been reflected in these Group financial statements.
In addition to the changes in rates of corporation tax disclosed above, a number of further changes to the UK corporation tax system were announced in both the March 2011 and March 2012 UK Budget Statements. A resolution passed by Parliament on 26 March 2012 reduced the main rate of corporation tax to 24% from 1 April 2012. Legislation to reduce the main rate of corporation tax from 24% to 23% from 1 April 2013 is expected to be included in the Finance Act 2012. Further reductions to the main rate are proposed to reduce the rate to 22% by 1 April 2014. None of these expected rate reductions had been substantively enacted at the balance sheet date and are therefore not reflected in these Group financial statements.
The effect of the changes enacted by Parliament on 26 March 2012 to reduce the corporation tax rate from 25% to 24%, with effect from 1 April 2012, is to reduce the deferred tax liability provided at the balance sheet date by £35m (£53m increase in profit and £18m decrease in other comprehensive income).
The proposed reductions of the main rate of corporation tax by 1% per annum to 22% by 1 April 2014 are expected to be enacted separately each year. The overall effect of the further changes from 24% to 22%, if these applied to the deferred tax balance at the balance sheet date, would be to reduce the deferred tax liability by £70m (being £35m recognised in 2013 and £35m recognised in 2014).
106 Tesco PLC Annual Report and Financial Statements 2012

STRATEGIC REVIEW PERFORMANCE REVIEW GOVERNANCE FINANCIAL STATEMENTSOVERVIEW
Note 6 Taxation continued
Reconciliation of effective tax charge
2012£m
2011*£m
Profit before tax 3,835 3,641Tax charge at 26.2% (2011: 28.0%) (1,005) (1,019)Effect of:
Non-deductible expenses (86) (107)Differences in overseas taxation rates 72 99Adjustments in respect of prior years 54 102Share of profits of joint ventures and associates 14 4Change in tax rate 72 57
Total income tax charge for the year (879) (864)Effective tax rate 22.9% 23.7%
* See Note 1 Accounting Policies for details of reclassifications.
Tax on items credited directly to the Group Statement of Changes in Equity2012
£m2011
£m
Current tax (charge)/credit on:Share-based payments (1) 7
Deferred tax charge on:Share-based payments (5) (7)
Total tax on items charged to Group Statement of Changes in Equity (6) –
Tax relating to components of the Group Statement of Comprehensive Income2012
£m2011
£m
Current tax credit/(charge) on: Foreign exchange movements 6 31Fair value of movement on available-for-sale investments (2) (1)
Deferred tax credit/(charge) on:Pensions 94 (184)Fair value movements on cash flow hedges (25) 1
Total tax on items credited/(charged) to Group Statement of Comprehensive Income 73 (153)
Deferred taxThe following are the major deferred tax (liabilities)/assets recognised by the Group and movements thereon during the current and prior financial years:
Property- related
items*£m
Retirementbenefit
obligation£m
Share-basedpayments
£m
Short-termtiming
differences£m
Tax losses£m
Financial Instruments
£m
Otherpre/post
tax temporarydifferences
£mTotal
£m
At 27 February 2010 (1,496) 511 56 91 41 36 4 (757)(Charge)/credit to the
Group Income Statement (101) 35 (2) 5 (10) (33) 3 (103)Charge to Group Statement of
Changes in Equity – – (7) – – – – (7)(Charge)/credit to Group Statement of
Comprehensive Income – (184) – – – 1 – (183)Foreign exchange and other movements 5 – – (2) 1 – – 4At 26 February 2011 (1,592) 362 47 94 32 4 7 (1,046)(Charge)/credit to the
Group Income Statement (93) 9 (31) (33) 3 (1) – (146)Charge to Group Statement of
Changes in Equity – – (5) – – – – (5)Credit/(charge) to Group Statement of
Comprehensive Income – 94 – – – (25) – 69Discontinued operations – – – – (14) – – (14)Business combinations (1) – – 3 1 – 1 4Foreign exchange and other movements (3) – – – 2 – 2 1At 25 February 2012 (1,689) 465 11 64 24 (22) 10 (1,137)
* Property-related items include deferred tax liability on rolled over gains of £361m (2011: £335m) and deferred tax assets on capital losses of £71m (2011: £70m). The remaining balance relates to accelerated tax depreciation.
Tesco PLC Annual Report and Financial Statements 2012 107

Notes to the Group financial statements
Note 6 Taxation continued
Certain deferred tax assets and liabilities have been offset and analysed as follows:
2012£m
2011£m
Deferred tax assets 23 48Deferred tax liabilities (1,160) (1,094)
(1,137) (1,046)
No deferred tax is recognised on unremitted earnings of overseas subsidiaries and joint ventures, on the grounds that the Group is able to control the timing of the reversal of these temporary differences and it is probable that they will not reverse in the foreseeable future. The temporary difference unrecognised at the year end amounted to £3.4bn (2011: £3.0bn). The deferred tax on unremitted earnings at 25 February 2012 is estimated to be £161m (2011: £90m) which relates to taxes payable on repatriation and dividend withholding taxes levied by overseas tax jurisdictions. UK tax legislation relating to company distributions provides for exemption from tax for most repatriated profits, subject to certain exceptions.
Unrecognised deferred tax assetsDeferred tax assets in relation to continuing operations have not been recognised in respect of the following items (because it is not probable that future taxable profits will be available against which the Group can utilise the benefits):
2012£m
2011£m
Deductible temporary differences 29 19Tax losses 484 403
513 422
As at 25 February 2012, the Group has unused trading tax losses from continuing operations of £1,523m (2011: £1,309m) available for offset against future profits. A deferred tax asset has been recognised in respect of £110m (2011: £109m) of such losses. No deferred tax asset has been recognised in respect of the remaining £1,413m (2011: £1,200m) due to the unpredictability of future profit streams. Included in unrecognised tax losses are losses of £479m that will expire in 2016 (2011: £390m in 2015) and £879m that will expire between 2017 and 2032 (2011: £744m between 2016 and 2031). Other losses will be carried forward indefinitely.
Note 7 Discontinued operations and non-current assets classified as held for sale25 February
2012£m
26 February 2011
£m
Assets of the disposal group 65 –Non-current assets classified as held for sale 445 431Total assets of the disposal group and non-current assets classified as held for sale 510 431Total liabilities of the disposal group (69) –Total net assets classified as held for sale 441 431
The non-current assets held for sale consist mainly of properties in the UK and Thailand due to be sold within one year.
Discontinued operationsThe tables below show the results of the discontinued operations in relation to the Group’s decision to sell its operations in Japan which are included in the Group Income Statement, Group Balance Sheet and Group Cash Flow Statement respectively.
52 weeks ended
25 February 2012
£m
52 weeks ended
26 February 2011
£m
Revenue 436 476Cost of sales* (539) (541)Administrative expenses (23) (36)Loss arising on property related items (1) (5)Finance costs (1) –Loss before tax on discontinued operations (128) (106)Taxation (14) –Loss for the year from discontinued operations (142) (106)
Loss per share impact from discontinued operationsBasic (1.77p) (1.33p)Diluted (1.76p) (1.31p)
* Including operating lease expense of £27m (2011: £32m).
108 Tesco PLC Annual Report and Financial Statements 2012

STRATEGIC REVIEW PERFORMANCE REVIEW GOVERNANCE FINANCIAL STATEMENTSOVERVIEW
Note 7 Discontinued operations and non-current assets classified as held for sale continued52 weeks
ended 25 February
2012£m
52 weeks ended
26 February 2011
£m
Non-GAAP measure: underlying loss before taxLoss before tax on discontinued operations (128) (106)Adjustments for:Restructuring and other one-off costs Restructuring costs 23 9 Store impairment cost relating to fair value of assets of the disposal group 57 – Intangible asset impairment cost relating to fair value of assests of the disposal group 20 –
100 9IAS 36 ‘Impairments of Assets’ – impairment of goodwill arising on acquisitions – 55Underlying loss before tax on discontinued operations (28) (42)
Balance Sheet25 February
2012£m
Assets of the disposal groupInventories 16Trade and other receivables 43Cash and cash equivalents 6Total assets of the disposal group 65Liabilities of the disposal groupTrade and other payables (68)Borrowings (1)Total liabilities of the disposal group (69)Total net liabilities of the disposal group (4)
Future minimum rentals payable under non-cancellable operating leases associated with operations in Japan amount to £113m.
Cash Flow Statement52 weeks
ended 25 February
2012£m
52 weeks ended
26 February 2011
£m
Net cash flows from operating activities (53) (50)Net cash flows from investing activities 6 (27)Net cash flows from financing activities 46 73Net cash flows from discontinued operations (1) (4)
Note 8 Dividends2012 2011
pence/share £m pence/share £m
Amounts recognised as distributions to owners in the financial year:Final dividend for the prior financial year 10.09 811 9.16 730Interim dividend for the current financial year 4.63 369 4.37 351
14.72 1,180 13.53 1,081Proposed final dividend for the current financial year 10.13 815 10.09 812
The proposed final dividend was approved by the Board of Directors on 17 April 2012 and is subject to the approval of shareholders at the Annual General Meeting. The proposed dividend has not been included as a liability as at 25 February 2012, in accordance with IAS 10 ‘Events After the Balance Sheet Date’. It will be paid on 6 July 2012 to shareholders who are on the Register of members at close of business on 27 April 2012.
Tesco PLC Annual Report and Financial Statements 2012 109

Notes to the Group financial statements
Note 9 Earnings per share and diluted earnings per share
Basic earnings per share amounts are calculated by dividing the profit attributable to owners of the parent by the weighted average number of ordinary shares in issue during the financial year.
Diluted earnings per share amounts are calculated by dividing the profit attributable to owners of the parent by the weighted average number of ordinary shares in issue during the financial year adjusted for the effects of potentially dilutive options. The dilutive effect is calculated on the full exercise of all potentially dilutive ordinary share options granted by the Group, including performance-based options which the Group considers to have been earned.
2012 2011
Basic
Potentially dilutive
share options Diluted Basic
Potentially dilutive
share options Diluted
Profit/(loss) (£m) Continuing operations 2,948 – 2,948 2,761 – 2,761 Discontinued operations (142) – (142) (106) – (106)Weighted average number of shares (millions) 8,021 24 8,045 8,020 41 8,061 Earnings per share (pence) Continuing operations 36.75 (0.11) 36.64 34.43 (0.18) 34.25 Discontinued operations (1.77) 0.01 (1.76) (1.33) 0.02 (1.31)Total 34.98 (0.10) 34.88 33.10 (0.16) 32.94
There have been no transactions involving ordinary shares between the reporting date and the date of approval of these financial statements which would significantly change the earnings per share calculations shown above.
Reconciliation of non-GAAP underlying diluted earnings per share
2012 2011*
£m pence/share £m pence/share
Profit from continuing operations (Diluted) 2,948 36.64 2,761 34.25Adjustments for:
IAS 32 and IAS 39 ‘Financial Instruments’ – fair value remeasurements (44) (0.54) (19) (0.24)IAS 19 ‘Employee Benefits’ – non-cash Group Income Statement charge for pensions 17 0.21 113 1.40IAS 17 ‘Leases’ – impact of annual uplifts in rent and rent-free periods 38 0.47 48 0.60 IFRS 3 ‘Business Combinations’ – intangible asset amortisation charges and costs arising from acquisitions 22 0.27 42 0.52IFRIC 13 ‘Customer Loyalty Programmes’ – fair value of awards 17 0.21 8 0.10Restructuring and other one-off costs 30 0.37 20 0.25
Tax effect of adjustments at the effective rate of tax** (2012: 22.9%, 2011: 23.7%) (18) (0.22) (50) (0.62)Underlying earnings from continuing operations 3,010 37.41 2,923 36.26
* See Note 1 Accounting policies for details of reclassifications.** The effective tax rate of 22.9% (2011: 23.7%) excludes certain permanent differences on which tax relief is not available.
110 Tesco PLC Annual Report and Financial Statements 2012

STRATEGIC REVIEW PERFORMANCE REVIEW GOVERNANCE FINANCIAL STATEMENTSOVERVIEW
Note 10 Goodwill and other intangible assets
Internallygenerated
developmentcosts
£m
Pharmacyand
softwarelicences
£m
Otherintangible
assets£m
Goodwill£m
Total£m
CostAt 26 February 2011 1,300 563 342 3,600 5,805Foreign currency translation (2) 2 – 34 34 Additions 261 77 3 100 441 Reclassification (104) 120 3 – 19 Disposals – (4) (1) – (5)Transfer to disposal group classified as held for sale (1) (32) – (186) (219)At 25 February 2012 1,454 726 347 3,548 6,075
Accumulated amortisation and impairment lossesAt 26 February 2011 672 288 223 284 1,467Foreign currency translation (1) – – 1 –Amortisation for the year 106 69 19 – 194 Impairment losses for the year 1 19 – – 20 Disposals – (4) (1) – (5)Transfer to disposal group classified as held for sale (1) (32) – (186) (219)At 25 February 2012 777 340 241 99 1,457
Net carrying valueAt 25 February 2012 677 386 106 3,449 4,618 At 26 February 2011 628 275 119 3,316 4,338
Internallygenerated
developmentcosts
£m
Pharmacyand
softwarelicences
£m
Otherintangible
assets£m
Goodwill£m
Total£m
CostAt 27 February 2010 1,133 368 335 3,566 5,402Foreign currency translation – (5) (2) (48) (55)Additions 243 128 2 82 455Reclassification (74) 74 7 – 7Disposals (2) (2) – – (4)At 26 February 2011 1,300 563 342 3,600 5,805
Accumulated amortisation and impairment lossesAt 27 February 2010 574 242 180 229 1,225Foreign currency translation – (5) – – (5)Amortisation for the year 100 52 43 – 195Impairment losses for the year – – – 55 55Disposals (2) (1) – – (3)At 26 February 2011 672 288 223 284 1,467
Net carrying valueAt 26 February 2011 628 275 119 3,316 4,338At 27 February 2010 559 126 155 3,337 4,177
Tesco PLC Annual Report and Financial Statements 2012 111

Notes to the Group financial statements
Note 10 Goodwill and other intangible assets continued
Impairment of goodwillGoodwill arising on business combinations is not amortised but is reviewed for impairment on an annual basis, or more frequently if there are indications that goodwill may be impaired. Goodwill acquired in a business combination is allocated to groups of cash-generating units according to the level at which management monitor that goodwill.
Recoverable amounts for cash-generating units are based on the higher of value in use and fair value less costs to sell. Value in use is calculated from cash flow projections for generally five years using data from the Group’s latest internal forecasts, the results of which are reviewed by the Board. The key assumptions for the value in use calculations are those regarding discount rates, growth rates and expected changes in margins. Management estimate discount rates using pre-tax rates that reflect the current market assessment of the time value of money and the risks specific to the cash-generating units. Changes in selling prices and direct costs are based on past experience and expectations of future changes in the market. Given the current economic climate, a sensitivity analysis has been performed in assessing the recoverable amounts of goodwill.
The pre-tax discount rates used to calculate value in use range from 6% to 17% (2011: 8% to 14%). On a post-tax basis, the discount rates ranged from 5% to 13% (2011: 6% to 12%). These discount rates are derived from the Group’s post-tax weighted average cost of capital, as adjusted for the specific risks relating to each geographical region.
The forecasts are extrapolated beyond five years based on estimated long-term average growth rates of 1% to 5% (2011: 2% to 5%).
In February 2012 and 2011 impairment reviews were performed by comparing the carrying value of goodwill with the recoverable amount of the cash-generating units to which goodwill has been allocated.
The components of goodwill are as follows:
2012£m
2011£m
China 622 582Czech Republic 73 34Malaysia 86 83Poland 388 401South Korea 479 468Tesco Bank 802 802Thailand 165 161Turkey 46 50UK 681 645US 102 78Other 5 12
3,449 3,316
112 Tesco PLC Annual Report and Financial Statements 2012

STRATEGIC REVIEW PERFORMANCE REVIEW GOVERNANCE FINANCIAL STATEMENTSOVERVIEW
Note 11 Property, plant and equipmentLand andbuildings
£mOther(a)
£mTotal
£m
CostAt 26 February 2011 23,479 9,091 32,570Foreign currency translation (14) (11) (25)Additions(b) 2,286 1,172 3,458 Acquisitions through business combinations 3 6 9 Reclassification (63) – (63)Classified as held for sale (53) (11) (64)Disposals (843) (198) (1,041)Transfer to disposal group classified as held for sale (34) (38) (72)At 25 February 2012 24,761 10,011 34,772
Accumulated depreciation and impairment lossesAt 26 February 2011 2,705 5,467 8,172Foreign currency translation (10) (11) (21)Charge for the year 429 836 1,265 Impairment losses for the year 74 25 99 Reversal of impairment losses for the year (36) – (36)Reclassification 5 – 5 Classified as held for sale (5) (7) (12)Disposals (177) (161) (338)Transfer to disposal group classified as held for sale (34) (38) (72)At 25 February 2012 2,951 6,111 9,062
Net carrying value(c)(d)
At 25 February 2012 21,810 3,900 25,710 At 26 February 2011 20,774 3,624 24,398
Construction in progress included above(e)
At 25 February 2012 1,246 44 1,290
(a) Other assets consist of plant, equipment, fixtures and fittings and motor vehicles.
(b) Includes £140m (2011: £147m) in respect of interest capitalised, principally relating to land and building assets. The capitalisation rate used to determine the amount of finance costs capitalised during the financial year was 5.1% (2011: 5.1%). Interest capitalised is deducted in determining taxable profit in the financial year in which it is incurred.
(c) Net carrying value includes: (i) Capitalised interest at 25 February 2012 of £1,185m (2011: £1,084m). (ii) Assets held under finance leases which are analysed below:
2012 2011
Land andbuildings
£mOther(a)
£m
Land andbuildings
£mOther(a)
£m
Cost 149 574 139 580Accumulated depreciation
and impairment losses (37) (495) (24) (462)Net carrying value 112 79 115 118
These assets are pledged as security for the finance lease liabilities.
(d) The net carrying value of land and buildings comprises:
2012
£m2011
£m
Freehold 19,016 18,094Long leasehold – 50 years or more 676 677Short leasehold – less than 50 years 2,118 2,003Net carrying value 21,810 20,774
(e) Construction in progress does not include land.
Tesco PLC Annual Report and Financial Statements 2012 113

Notes to the Group financial statements
Note 11 Property, plant and equipment continuedLand andbuildings
£mOther(a)
£mTotal
£m
CostAt 27 February 2010 23,385 8,398 31,783Foreign currency translation (257) (153) (410)Additions(b) 2,577 697 3,274Acquisitions through business combinations 22 24 46Reclassification (673) 301 (372)Classified as held for sale (110) – (110)Disposals (1,465) (176) (1,641)At 26 February 2011 23,479 9,091 32,570
Accumulated depreciation and impairment lossesAt 27 February 2010 2,700 4,880 7,580Foreign currency translation (21) (55) (76)Charge for the year 412 782 1,194Impairment losses for the year 20 3 23Reversal of impairment losses for the year (38) – (38)Reclassification (199) 3 (196)Classified as held for sale (29) – (29)Disposals (140) (146) (286)At 26 February 2011 2,705 5,467 8,172
Net carrying value(c)(d)
At 26 February 2011 20,774 3,624 24,398At 27 February 2010 20,685 3,518 24,203
Construction in progress included above(e)
At 26 February 2011 1,267 196 1,463
(b) (c) (d) (e) See page 113 for footnotes.
Impairment of property, plant and equipmentThe Group has determined that for the purposes of impairment testing, each store is a cash-generating unit. Cash-generating units are tested for impairment if there are indications of impairment at the balance sheet date.
Recoverable amounts for cash-generating units are mainly based on value in use, which is generally calculated from cash flow projections for five to twenty years using data from the Group’s latest internal forecasts, the results of which are reviewed by the Board. The key assumptions for the value in use calculations are those regarding discount rates, growth rates and expected changes in margins. Management estimate discount rates using pre-tax rates that reflect the current market assessment of the time value of money and the risks specific to the cash-generating units. Changes in selling prices and direct costs are based on past experience and expectations of future changes in the market.
The forecasts are extrapolated beyond five years based on estimated long-term growth rates of 1% to 5% (2011: 2% to 5%).
The pre-tax discount rates used to calculate value in use range from 6% to 17% (2011: 6% to 14%) depending on the specific conditions in which each store operates. On a post-tax basis, the discount rates ranged from 5% to 13% (2011: 6% to 12%). These discount rates are derived from the Group’s post-tax weighted average cost of capital, as adjusted for the specific risks relating to each geographical region.
The impairment losses relate to stores whose recoverable amounts do not exceed the asset carrying values. In all cases, impairment losses arose due to stores performing below forecasted trading levels.
The reversal of previous impairment losses arose principally due to improvements in stores’ performances over the last year, which increased the net present value of future cash flows.
114 Tesco PLC Annual Report and Financial Statements 2012

STRATEGIC REVIEW PERFORMANCE REVIEW GOVERNANCE FINANCIAL STATEMENTSOVERVIEW
Note 12 Investment property 2012
£m2011
£m
CostAt beginning of the year 2,092 1,919Foreign currency translation (9) (35)Additions 14 24Acquisitions through business combinations 96 –Reclassification 44 197Classified as held for sale 23 (2)Disposals (7) (11)At end of the year 2,253 2,092
Accumulated depreciation and impairment lossesAt beginning of the year 229 188 Foreign currency translation (2) (3)Charge for the year 39 31 Impairment losses for the year 2 2 Reclassification (6) 11 At end of the year 262 229 Net carrying value at end of the year 1,991 1,863
The estimated fair value of the Group’s investment property is £4.3bn (2011: £4.4bn). This fair value has been determined by applying an appropriate rental yield to the rentals earned by the investment property. A valuation has not been performed by an independent valuer.
Note 13 Group entities
Principal subsidiariesThe Group consolidates its subsidiary undertakings and its principal subsidiaries are:
Business activity
Share of issuedordinary share capital
and voting rights
Country of incorporationand principal country
of operation
Tesco Stores Limited Retail 100% EnglandOne Stop Stores Limited* Retail 100% EnglandTesco Ireland Limited Retail 100% Republic of IrelandTesco-Global Stores Privately Held Co. Limited Retail 100% HungaryTesco Polska Sp. z o.o. Retail 100% PolandTesco Stores C R a.s. Retail 100% Czech RepublicTesco Stores S R a.s. Retail 100% SlovakiaTesco Kipa Kitle Paza rlama Ticaret ve Gide Sanai A.S.* Retail 95% TurkeyHomeplus Co., Limited Retail 100% South KoreaHomeplus Tesco Co., Limited Retail 100% South KoreaEk-Chai Distribution System Co. Limited Retail 86%** ThailandTesco Stores (Malaysia) Sdn Bhd Retail 70% MalaysiaTesco Japan Co. Limited Retail 100% JapanTesco Management (Shanghai) Co., Limited Retail 100% People’s Republic of ChinaDobbies Garden Centres Limited Retail 100% ScotlandFresh & Easy Neighborhood Market Inc Retail 100% USTesco Personal Finance Group Limited*
(trading as Tesco Bank) Financial Services 100% ScotlandTesco Distribution Limited Distribution 100% EnglandTesco Property Holdings Limited Property 100% EnglandTesco International Sourcing Limited Purchasing 100% Hong Kongdunnhumby Limited Data Analysis 100% EnglandELH Insurance Limited Self-insurance 100% GuernseyValiant Insurance Company Limited Self-insurance 100% Republic of Ireland
* Held by the Parent Company (all other principal subsidiaries are held by an intermediate subsidiary). ** The Group has 86% of voting rights and 39% of issued ordinary share capital in Ek-Chai Distribution System Co. Limited.
The accounting period ends of the subsidiary undertakings consolidated in these financial statements are on or around 25 February 2012. A full list of the Group’s subsidiary undertakings will be annexed to the next Annual Return filed at Companies House. There are no significant restrictions on the ability of subsidiary undertakings to transfer funds to the parent, other than those imposed by the Companies Act 2006.
Tesco PLC Annual Report and Financial Statements 2012 115

Notes to the Group financial statements
Note 13 Group entities continued
Interests in joint ventures and associatesThe Group uses the equity method of accounting for its interest in joint ventures and associates. The following table shows the aggregate movement in the Group’s investment in joint ventures and associates:
Joint ventures£m
Associates£m
Total£m
At 27 February 2010 136 16 152Additions 88 86 174Foreign currency translation (5) – (5)Share of post-tax profits/(losses) of joint ventures and associates 65 (8) 57Income received from joint ventures and associates (60) (2) (62)At 26 February 2011 224 92 316Additions 49 – 49 Disposals (8) – (8)Foreign currency translation 12 – 12 Share of post-tax profits of joint ventures and associates 71 20 91Other movements in reserves – 3 3Dividends received from joint ventures and associates (40) – (40)At 25 February 2012 308 115 423
Significant joint ventures The Group’s principal joint ventures are:
Business activity
Share of issued share capital, loan capital and
debt securities
Country of incorporation and principal country
of operation
Shopping Centres Limited* Property Investment 50% EnglandBLT Properties Limited* Property Investment 50% EnglandThe Tesco British Land Property Partnership Property Investment 50% England
The Tesco Red Limited Partnership Property Investment 50% EnglandThe Tesco Aqua Limited Partnership Property Investment 50% EnglandThe Tesco Jade Limited Partnership Property Investment 50% EnglandThe Tesco Coral Limited Partnership Property Investment 50% EnglandThe Tesco Blue Limited Partnership Property Investment 50% EnglandThe Tesco Atrato Limited Partnership Property Investment 50% EnglandThe Tesco Property Limited Partnership Property Investment 50% EnglandThe Tesco Passaic Limited Partnership Property Investment 50% EnglandThe Tesco Navona Limited Partnership Property Investment 50% EnglandThe Tesco Sarum Limited Partnership Property Investment 50% EnglandFushun Splendor Real Estate Development Co. Limited Property Investment 50% People’s Republic of ChinaAnshan Tesco Real Estate Development Co. Limited Property Investment 50% People’s Republic of ChinaTesco Qinhuangdo Property Limited Property Investment 50% People’s Republic of ChinaXiamen Hete Property Co. Limited Property Investment 50% People’s Republic of ChinaTesco Fujian Property Limited Property Investment 50% People’s Republic of ChinaTesco Shenyang Property Co. Limited Property Investment 50% People’s Republic of ChinaTesco (Fujian) Industry Limited Property Investment 50% People’s Republic of ChinaTesco Nanjing Zhongshan Real Estate Development Co. Limited Property Investment 50% People’s Republic of ChinaArena (Jersey) Management Limited Property Investment 50% JerseyThe Tesco Property (No. 2) Limited Partnership Property Investment 50% JerseyTesco Mobile Limited Telecommunications 50% England
* Held by the Parent Company (all other principal subsidiaries are held by an intermediate subsidiary).
The accounting period ends of the joint ventures consolidated in these financial statements range from 31 December 2011 to 29 February 2012. Accounting period end dates differ from those of the Group for commercial reasons and depend upon the requirements of the joint venture partner as well as those of the Group.
There are no significant restrictions on the ability of joint ventures to transfer funds to the parent, other than those imposed by the Companies Act 2006.
116 Tesco PLC Annual Report and Financial Statements 2012
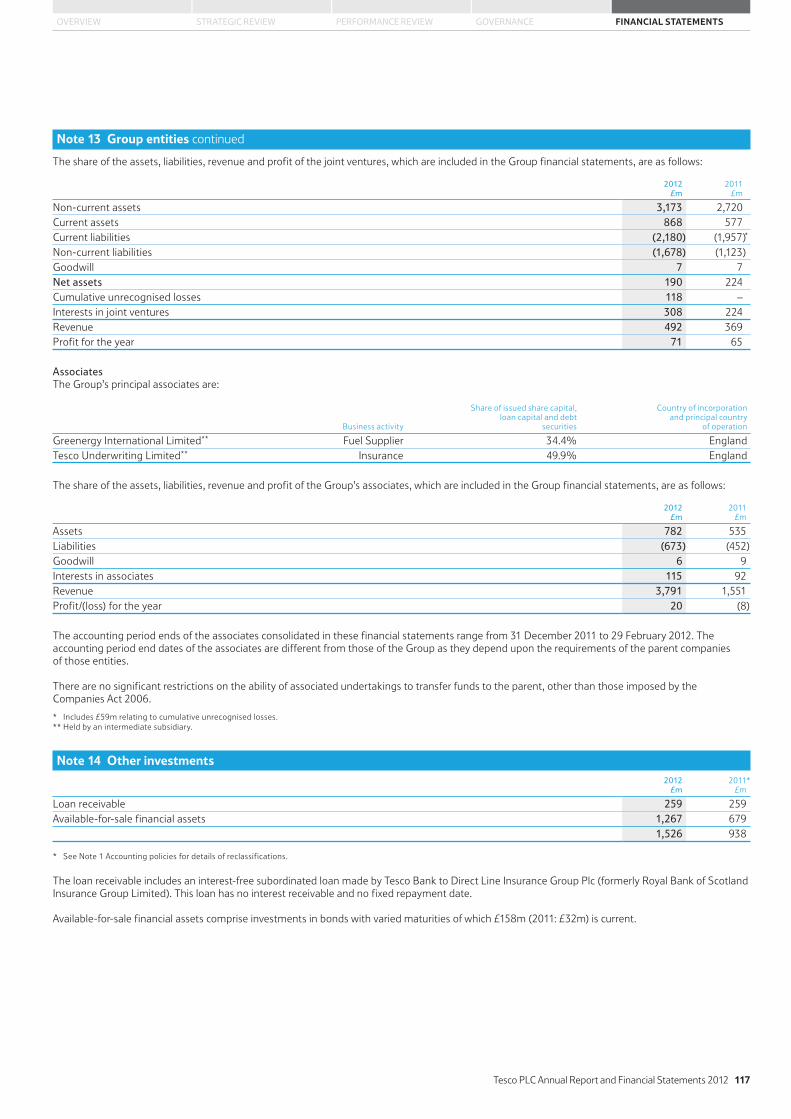
STRATEGIC REVIEW PERFORMANCE REVIEW GOVERNANCE FINANCIAL STATEMENTSOVERVIEW
Note 13 Group entities continued
The share of the assets, liabilities, revenue and profit of the joint ventures, which are included in the Group financial statements, are as follows:
2012£m
2011£m
Non-current assets 3,173 2,720Current assets 868 577Current liabilities (2,180) (1,957)*
Non-current liabilities (1,678) (1,123)Goodwill 7 7Net assets 190 224Cumulative unrecognised losses 118 –Interests in joint ventures 308 224Revenue 492 369Profit for the year 71 65
Associates The Group’s principal associates are:
Business activity
Share of issued share capital,loan capital and debt
securities
Country of incorporation and principal country
of operation
Greenergy International Limited** Fuel Supplier 34.4% EnglandTesco Underwriting Limited** Insurance 49.9% England
The share of the assets, liabilities, revenue and profit of the Group’s associates, which are included in the Group financial statements, are as follows:
2012£m
2011£m
Assets 782 535Liabilities (673) (452)Goodwill 6 9Interests in associates 115 92Revenue 3,791 1,551Profit/(loss) for the year 20 (8)
The accounting period ends of the associates consolidated in these financial statements range from 31 December 2011 to 29 February 2012. The accounting period end dates of the associates are different from those of the Group as they depend upon the requirements of the parent companies of those entities.
There are no significant restrictions on the ability of associated undertakings to transfer funds to the parent, other than those imposed by the Companies Act 2006.
* Includes £59m relating to cumulative unrecognised losses.** Held by an intermediate subsidiary.
Note 14 Other investments 2012
£m2011*
£m
Loan receivable 259 259Available-for-sale financial assets 1,267 679
1,526 938
* See Note 1 Accounting policies for details of reclassifications.
The loan receivable includes an interest-free subordinated loan made by Tesco Bank to Direct Line Insurance Group Plc (formerly Royal Bank of Scotland Insurance Group Limited). This loan has no interest receivable and no fixed repayment date.
Available-for-sale financial assets comprise investments in bonds with varied maturities of which £158m (2011: £32m) is current.
Tesco PLC Annual Report and Financial Statements 2012 117

Notes to the Group financial statements
Note 15 Inventories2012
£m2011
£m
Goods held for resale 3,537 3,142Development properties 61 20
3,598 3,162
Note 16 Trade and other receivables2012
£m2011*
£m
Prepayments and accrued income 420 387Other receivables 1,848 1,416Amounts owed by joint ventures and associates (Note 28) 389 527
2,657 2,330
Included within trade and other receivables are the following amounts receivable after more than one year:
2012£m
2011£m
Prepayments and accrued income 36 31Other receivables 377 378Amounts owed by joint ventures and associates 269 432
682 841
Trade and other receivables are generally non interest-bearing. Credit terms vary by country and the nature of the debt, ranging from seven to sixty days.
As at 25 February 2012, trade and other receivables of £30m (2011: £37m) were past due and impaired. The amount of the provision was £50m (2011: £44m). The ageing analysis of these receivables is as follows:
2012£m
2011£m
Up to three months past due 5 4Three to six months past due 3 3Over six months past due 22 30
30 37
As at 25 February 2012, trade and other receivables of £415m (2011: £144m) were past due but not impaired. The ageing analysis of these receivables is as follows:
2012£m
2011£m
Up to three months past due 194 114Three to six months past due 114 13Over six months past due 107 17
415 144
No receivables have been renegotiated in the current or prior financial years.
* See Note 1 Accounting policies for details of reclassifications.
118 Tesco PLC Annual Report and Financial Statements 2012

STRATEGIC REVIEW PERFORMANCE REVIEW GOVERNANCE FINANCIAL STATEMENTSOVERVIEW
Note 17 Loans and advances to customers
Tesco Bank has loans and advances to customers.
2012£m
2011£m
Non-current 1,901 2,127Current 2,502 2,514
4,403 4,641
The maturity of these loans and advances is as follows:
At 25 February 20122012
£m2011
£m
Repayable on demand or at short notice 1 1Within three months 2,557 2,572Greater than three months but less than one year 46 47Greater than one year but less than five years 1,396 1,700After five years 588 503
4,588 4,823Provision for impairment of loans and advances (185) (182)
4,403 4,641
At 25 February 2012, £1.2bn of the credit card portfolio had its legal interest assigned to a special purpose entity for use as collateral in securitisation transactions (2011: £1.4bn). As a result of the early repayment in May 2011, there are no securitisation notes in issue as at 25 February 2012 (2011: £1.2bn).
Provision for impairment of loans and advances
£m
At 27 February 2010 (314)Charge for the year (131)Amounts written off 268Recoveries of amounts previously written off (9)Unwind of discount 4At 26 February 2011 (182)Charge for the year (119)Amounts written off 120 Recoveries of amounts previously written off (8)Unwind of discount 4 At 25 February 2012 (185)
Tesco PLC Annual Report and Financial Statements 2012 119

Notes to the Group financial statements
Note 17 Loans and advances to customers continued
At 25 February 2012, Tesco Bank’s non-accrual loans were £194m (2011: £212m). Loan impairment provisions of £185m (2011: £182m) were held against these loans. During the financial year ended 25 February 2012, the gross income not recognised but which would have been recognised under the original terms of non-accrual loans was £13m (2011: £8m).
At 25 February 2012, loans and advances to customers of £74m (2011 : £73m) were past due but not impaired. The ageing analysis of these loans and advances is as follows:
2012£m
2011£m
Up to one month past due 50 54Up to two months past due 14 13
Two to three months past due 10 6
74 73
Note 18 Cash and cash equivalents2012
£m2011*
£m
Cash at bank and in hand 1,995 1,769Short-term deposits 182 85Certificates of deposit 35 170Loans and advances to banks 93 404Cash and cash equivalents 2,305 2,428
Cash of £1,243m (2011: £1,022m) held on money market funds is classed as short-term investments.
* See Note 1 Accounting policies for details of reclassifications.
Note 19 Trade and other payables2012
£m2011
£m
Trade payables 5,971 5,782*
Other taxation and social security 462 514
Other payables 2,651 2,274
Amounts payable to joint ventures and associates (Note 28) 404 4
Accruals and deferred income 1,746 1,910
11,234 10,484
Included in other payables are amounts of £223m (2011: £181m) which are non-current.
* Includes £264m payable to Greenergy International Limited.
120 Tesco PLC Annual Report and Financial Statements 2012

STRATEGIC REVIEW PERFORMANCE REVIEW GOVERNANCE FINANCIAL STATEMENTSOVERVIEW
Note 20 Borrowings
Current
Par valueMaturity
year2012
£m2011
£m
Bank loans and overdrafts – – 399 437Loan from joint ventures (Note 28) – – 16 263.875% MTN €389m 2011 – 346LIBOR + 0.5% Bond – Tesco Bank £225m 2012 – 2245.625% MTN €1,500m 2012 1,304 –Other MTNs – – 87 303Finance leases (Note 34) – – 32 50
1,838 1,386
Non-current
Par valueMaturity
year2012
£m2011
£m
5.625% MTN €1,500m 2012 – 1,3175% MTN £600m 2014 619 6062% USD Bond $500m 2014 317 –5.125% MTN €600m 2015 526 5104% RPI MTN* £282m 2016 288 2765.875% MTN €1,039m 2016 1,042 9972.7% USD Bond $500m 2017 318 –5.5% USD Bond $850m 2017 659 6005.2% Tesco Bank Retail Bond £125m 2018 138 1263.375% MTN €750m 2018 638 –5.5% MTN £350m 2019 352 3511% RPI Tesco Bank Retail Bond** £60m 2019 59 –6.125% MTN £900m 2022 892 8915% MTN £389m 2023 401 3903.322% LPI MTN† £287m 2025 290 2796% MTN £200m 2029 251 2185.5% MTN £200m 2033 249 2151.982% RPI MTN± £240m 2036 242 2316.15% USD Bond $1,150m 2037 897 8045% MTN £173m 2042 174 1745.125% MTN €600m 2047 635 5775.2% MTN £279m 2057 274 274Other MTNs – – 162 169Other loans – – 354 536Finance leases (Note 34) – – 134 148
9,911 9,689
* The 4% RPI MTN is redeemable at par, including indexation for increases in the Retail Price Index (‘RPI’) over the life of the MTN.** The 1% RPI Tesco Bank Retail Bond is redeemable at par, including indexation for increases in the RPI over the life of the Bond.† The 3.322% Limited Price Inflation (‘LPI’) MTN is redeemable at par, including indexation for increases in the RPI over the life of the MTN. The maximum indexation of the principal
in any one year is 5%, with a minimum of 0%.± The 1.982% RPI MTN is redeemable at par, including indexation for increases in the RPI over the life of the MTN.
Borrowing facilitiesThe Group has the following undrawn committed facilities available at 25 February 2012, in respect of which all conditions precedent had been met as at that date:
2012£m
2011£m
Expiring in more than two years 2,825 2,825
All facilities incur commitment fees at market rates and would provide funding at floating rates.
Tesco PLC Annual Report and Financial Statements 2012 121

Notes to the Group financial statements
Note 21 Financial instruments
Derivatives are used to hedge exposure to market risks and those that are held as hedging instruments are formally designated as hedges as defined in IAS 39. Derivatives may qualify as hedges for accounting purposes and the Group’s hedging policies are further described below.
Finance income of £3m (2011: £27m) resulted from hedge ineffectiveness.
Fair value hedgesThe Group maintains interest rate and cross currency swap contracts as fair value hedges of the interest rate and currency risk on fixed rate debt issued by the Group. Changes in the fair value of derivatives that are designated and qualify as fair value hedges are recorded in the Group Income Statement, together with any changes in the fair value of the hedged asset or liability that are attributable to the hedged risk. The gain or loss on the hedging instrument and hedged item is recognised in the Group Income Statement within finance income or costs. If the hedge no longer meets the criteria for hedge accounting, the adjustment to the carrying value of the hedged item is amortised to the Group Income Statement under the effective interest rate method.
A gain of £263m on hedging instruments was recognised during the financial year, offset by a loss of £260m on hedged items (2011: a loss of £369m on hedging instruments was offset by a gain of £396m on hedged items).
Cash flow hedgesThe Group uses forward foreign currency contracts to hedge the cost of future purchases of goods for resale where those purchases are denominated in a currency other than the functional currency of the purchasing company. Where these contracts qualify for hedge accounting, mark-to-market gains and losses are deferred in equity. These hedging instruments are primarily used to hedge purchases in Euros and US Dollars. The cash flows hedged will occur and will affect the Group Income Statement within one year of the balance sheet date.
The Group also uses index-linked swaps to hedge cash flows on index-linked debt, interest rate swaps to hedge interest cash flows on debt and cross currency swaps to hedge intercompany loan cash flows denominated in foreign currencies.
Net investment hedges The Group uses forward foreign currency contracts, currency denominated borrowings and currency swaps to hedge the exposure of a portion of its non-Sterling denominated assets against changes in value due to changes in foreign exchange rates.
At the start of the year the Group had a South Korean Won denominated liability relating to the future purchase of the minority shareholding of its subsidiary, Homeplus Co., Limited. This liability was designated as a net investment hedge of a proportion of the assets of Homeplus Co., Limited. This option was exercised during the financial year.
Gains and losses accumulated in equity are included in the Group Income Statement on disposal of the overseas operations.
Financial instruments not qualifying for hedge accountingThe Group’s policy is not to use derivatives for trading purposes. However, some derivatives do not qualify for hedge accounting or are specifically not designated as a hedge where gains and losses on the hedging instrument and the hedged item naturally offset in the Group Income Statement.
These instruments include caps, interest rate swaps and forward foreign currency contracts. Changes in the fair value of any derivative instruments that do not qualify for hedge accounting are recognised immediately in the Group Income Statement within finance income or costs.
The fair value of derivative financial instruments have been disclosed in the Group Balance Sheet as follows:
2012 2011
Asset£m
Liability£m
Asset£m
Liability£m
Current 41 (128) 148 (255)Non-current 1,726 (688) 1,139 (600)
1,767 (816) 1,287 (855)
122 Tesco PLC Annual Report and Financial Statements 2012

STRATEGIC REVIEW PERFORMANCE REVIEW GOVERNANCE FINANCIAL STATEMENTSOVERVIEW
Note 21 Financial instruments continued
The fair value and notional amounts of derivatives analysed by hedge type are as follows:
2012 2011
Asset Liability Asset Liability
Fair value£m
Notional£m
Fair value£m
Notional£m
Fair value£m
Notional£m
Fair value£m
Notional£m
Fair value hedgesInterest rate swaps and similar instruments 96 1,751 (68) 2,031 27 1,410 (57) 1,844Cross currency swaps 818 2,686 (8) 269 717 2,674 (28) 714Cash flow hedgesInterest rate swaps and similar instruments – – (132) 400 – – (54) 455Cross currency swaps 233 304 (41) 988 126 298 (151) 784Index-linked swaps 30 809 – – – – (8) 772Forward foreign currency contracts 23 733 (21) 1,211 8 346 (12) 1,269Net investment hedgesForward foreign currency contracts – – (7) 969 19 383 (97) 952Future purchases of non-controlling interests – – – – – – (106) –Cash flow hedges and net investment hedgesCross currency swaps – – (1) 318 – – – –Derivatives not in a formal hedge relationshipInterest rate swaps and similar instruments 3 25 (1) 25 1 25 (1) 25Cross currency swaps 3 146 (4) 56 2 84 (10) 65Index-linked swaps 539 3,149 (468) 3,149 376 2,639 (311) 2,639Forward foreign currency contracts 22 923 (62) 1,282 11 523 (20) 720Future purchases of non-controlling interests – – (3) – – – – –Total 1,767 10,526 (816) 10,698 1,287 8,382 (855) 10,239
The carrying value and fair value of financial assets and liabilities are as follows:2012 2011*
Carryingvalue
£m
Fairvalue
£m
Carryingvalue
£m
Fairvalue
£m
AssetsCash and cash equivalents 2,305 2,305 2,428 2,428Loans and advances to customers – Tesco Bank 4,403 4,440 4,641 4,636Short-term investments 1,243 1,243 1,022 1,022Other investments – Tesco Bank 1,526 1,524 938 923Joint venture and associates loan receivables (Note 28) 384 384 503 514Other receivables 10 10 25 25Derivative financial assets:
Interest rate swaps and similar instruments 99 99 28 28Cross currency swaps 1,054 1,054 845 845Index-linked swaps 569 569 376 376Forward foreign currency contracts 45 45 38 38
Total financial assets 11,638 11,673 10,844 10,835
LiabilitiesShort-term borrowings:
Amortised cost (1,806) (1,841) (708) (707)Bonds in fair value hedge relationships – – (628) (614)
Long-term borrowings:Amortised cost (4,575) (4,966) (4,584) (4,678)Bonds in fair value hedge relationships (5,202) (5,140) (4,957) (4,915)
Finance leases (Group as lessee – Note 34) (166) (166) (198) (198)Customer deposits – Tesco Bank (5,387) (5,410) (5,074) (5,081)Deposits by banks – Tesco Bank (78) (78) (36) (36)Derivative and other financial liabilities:
Interest rate swaps and similar instruments (201) (201) (112) (112)Cross currency swaps (54) (54) (189) (189)Index-linked swaps (468) (468) (319) (319)Forward foreign currency contracts (90) (90) (129) (129)Future purchases of non-controlling interests (3) (3) (106) (106)
Total financial liabilities (18,030) (18,417) (17,040) (17,084)Total (6,392) (6,744) (6,196) (6,249)
* See Note 1 Accounting policies for details of reclassifications. Tesco PLC Annual Report and Financial Statements 2012 123

Notes to the Group financial statements
Note 21 Financial instruments continued
The fair values of financial instruments have been determined by reference to prices available from the markets on which the instruments are traded, where they are available. Where market prices are not available, the fair value has been calculated by discounting expected future cash flows at prevailing interest rates. The fair value of cash and cash equivalents and short-term investments is the same as their carrying value.
Financial assets and liabilities by categoryThe accounting classifications of each class of financial assets and liabilities as at 25 February 2012 and 26 February 2011 are as follows:
At 25 February 2012
Available-for-sale
£m
Loans andreceivables/
other financialliabilities
£m
Fair valuethrough
profit or loss£m
Total£m
Cash and cash equivalents 35 2,270 – 2,305Loans and advances to customers – Tesco Bank – 4,403 – 4,403Short-term investments – 1,243 – 1,243Other investments – Tesco Bank 1,267 259 – 1,526Joint venture and associates loan receivables (Note 28) – 384 – 384Other receivables – 10 – 10Customer deposits – Tesco Bank – (5,387) – (5,387)Deposits by banks – Tesco Bank – (78) – (78)Short-term borrowings – (1,806) – (1,806)Long-term borrowings – (9,777) – (9,777)Finance leases (Note 34) – (166) – (166)Derivative financial instruments:
Interest rate swaps and similar instruments – – (102) (102)Cross currency swaps – – 1,000 1,000 Index-linked swaps – – 101 101 Forward foreign currency contracts – – (45) (45)Future purchases of non-controlling interests – – (3) (3)
1,302 (8,645) 951 (6,392)
At 26 February 2011
Available-for-sale
£m
Loans andreceivables/
other financialliabilities
£m
Fair valuethrough
profit or loss£m
Total*£m
Cash and cash equivalents 170 2,258 – 2,428Loans and advances to customers – Tesco Bank – 4,641 – 4,641Short-term investments – 1,022 – 1,022Other investments – Tesco Bank 679 259 – 938Joint venture and associates loan receivables (Note 28) – 503 – 503Other receivables – 25 – 25Customer deposits – Tesco Bank – (5,074) – (5,074)Deposits by banks – Tesco Bank – (36) – (36)Short-term borrowings – (1,336) – (1,336)Long-term borrowings – (9,541) – (9,541)Finance leases (Note 34) – (198) – (198)Derivative financial instruments:
Interest rate swaps and similar instruments – – (84) (84)Cross currency swaps – – 656 656Index-linked swaps – – 57 57Forward foreign currency contracts – – (91) (91)Future purchases of non-controlling interests – – (106) (106)
849 (7,477) 432 (6,196)
* See Note 1 Accounting policies for details of reclassifications.
124 Tesco PLC Annual Report and Financial Statements 2012

STRATEGIC REVIEW PERFORMANCE REVIEW GOVERNANCE FINANCIAL STATEMENTSOVERVIEW
Note 21 Financial instruments continued
The following table presents the Group’s financial assets and liabilities that are measured at fair value at 25 February 2012, by level of fair value hierarchy:
quoted prices (unadjusted) in active markets for identical assets or liabilities (Level 1);
inputs other than quoted prices included within Level 1 that are observable for the asset or liability, either directly (that is, as prices) or indirectly (that is, derived from prices) (Level 2); and
inputs for the asset or liability that are not based on observable market data (that is, unobservable inputs) (Level 3).
At 25 February 2012Level 1
£mLevel 2
£mLevel 3
£mTotal
£m
AssetsAvailable-for-sale financial assets 542 760 – 1,302 Derivative financial instruments:
Interest rate swaps and similar instruments – 99 – 99 Cross currency swaps – 1,054 – 1,054 Index-linked swaps – 569 – 569 Forward foreign currency contracts – 45 – 45
Total assets 542 2,527 – 3,069
LiabilitiesDerivative financial instruments:
Interest rate swaps and similar instruments – (201) – (201)Cross currency swaps – (54) – (54)Index-linked swaps – (468) – (468)Forward foreign currency contracts – (90) – (90)Future purchases of non-controlling interests – – (3) (3)
Total liabilities – (813) (3) (816)Total 542 1,714 (3) 2,253
At 26 February 2011Level 1
£mLevel 2
£mLevel 3
£mTotal
£m
AssetsAvailable-for-sale financial assets 188 661 – 849Derivative financial instruments:
Interest rate swaps and similar instruments – 28 – 28Cross currency swaps – 845 – 845Index-linked swaps – 376 – 376Forward foreign currency contracts – 38 – 38
Total assets 188 1,948 – 2,136
Liabilities
Derivative financial instruments: Interest rate swaps and similar instruments – (112) – (112)Cross currency swaps – (189) – (189)Index-linked swaps – (319) – (319)Forward foreign currency contracts – (129) – (129)Future purchases of non-controlling interests – – (106) (106)
Total liabilities – (749) (106) (855)Total 188 1,199 (106) 1,281
The following table presents the changes in Level 3 instruments:
2012£m
2011£m
At beginning of the year (106) (146)Gains/(losses) recognised in finance costs in the Group Income Statement 33 (6)(Losses)/gains recognised in the Group Statement of Changes in Equity (3) 2Purchase of non-controlling interests 73 44At end of the year (3) (106)
During the financial year, there were no transfers between Level 1 and Level 2 fair value measurements and no transfers into or out of Level 3 fair value measurements. A reasonably possible change in assumptions is unlikely to result in a significant change in the fair value of Level 3 instruments.
Tesco PLC Annual Report and Financial Statements 2012 125

Notes to the Group financial statements
Note 22 Financial risk factors
The main financial risks faced by the Group relate to fluctuations in interest and foreign exchange rates, the risk of default by counterparties to financial transactions and the availability of funds to meet business needs. The management of these risks is set out below.
Risk management is carried out by a central treasury department under policies approved by the Board of Directors. The Board provides written principles for risk management, as described in the Principal risks and uncertainties on pages 40 to 47.
Interest rate riskInterest rate risk arises from long-term borrowings. Debt issued at variable rates as well as cash deposits and short-term investments exposes the Group to cash flow interest rate risk. Debt issued at fixed rates exposes the Group to fair value risk. Our interest rate management policy is explained on page 47.
The Group has Retail Price Index (‘RPI’) debt where the principal is indexed to increases in the RPI. RPI debt is treated as floating rate debt. The Group also has Limited Price lnflation (‘LPI’) debt, where the principal is indexed to RPI, with an annual maximum increase of 5% and a minimum of 0%. LPI debt is treated as fixed rate debt.
For interest rate risk relating to Tesco Bank, refer to the separate section on Tesco Bank financial risk factors below.
During 2012 and 2011, net debt was managed using derivative instruments to hedge interest rate risk as follows:
2012 2011*
Fixed£m
Floating£m
Total£m
Fixed£m
Floating£m
Total£m
Cash and cash equivalents 35 2,270 2,305 170 2,258 2,428Loans and advances to customers – Tesco Bank 1,956 2,447 4,403 2,161 2,480 4,641Short-term investments – 1,243 1,243 – 1,022 1,022Other investments 1,335 191 1,526 755 183 938Joint venture and associate, loan receivables (Note 28) – 384 384 – 503 503Other receivables – 10 10 – 25 25Finance leases (Note 34) (111) (55) (166) (92) (106) (198)Bank and other borrowings (10,729) (854) (11,583) (9,697) (1,180) (10,877)Customer deposits – Tesco Bank (1,470) (3,917) (5,387) (398) (4,676) (5,074)Deposits by banks – Tesco Bank (78) – (78) (36) – (36)Future purchases of non-controlling interests (3) – (3) (106) – (106)Derivative effect:
Interest rate swaps (1,402) 1,402 – (1,218) 1,218 –Cross currency swaps 2,635 (2,635) – 3,459 (3,459) –Index-linked swaps (522) 522 – (498) 498 –Caps and collars (1) 1 – – – –
Total (8,355) 1,009 (7,346) (5,500) (1,234) (6,734)
Credit risk Credit risk arises from cash and cash equivalents, trade and other receivables, financial instruments and deposits with banks and financial institutions. The Group policy on credit risk is described on page 47.
The counterparty exposure under derivative contracts is £1.8bn (2011: £1.3bn). The Group considers its maximum credit risk to be £11.6bn (2011: £10.8bn*), being the Group’s total financial assets.
For credit risk relating to Tesco Bank, refer to the separate section on Tesco Bank financial risk factors below.
Liquidity risk Liquidity risk is managed by short-term and long-term cash flow forecasts. In addition, the Group has committed facility agreements for £2.8bn (2011: £2.8bn), which mature between 2014 and 2015.
The Group has a European Medium Term Note programme of £15bn, of which £7.4bn was in issue at 25 February 2012 (2011: £8.5bn), plus a Euro Commercial Paper programme of £2bn, none of which was in issue at 25 February 2012 (2011: £nil), and a US Commercial Paper programme of $4bn, none of which was in issue at 25 February 2012 (2011: £nil).
During 2012 the Group issued £1.4bn of long-term debt of which £0.6bn was issued as part of the European Medium Term Note Programme.
For liquidity risk relating to Tesco Bank, refer to the separate section on Tesco Bank financial risk factors below.
* See Note 1 Accounting policies for details of reclassifications.
126 Tesco PLC Annual Report and Financial Statements 2012

STRATEGIC REVIEW PERFORMANCE REVIEW GOVERNANCE FINANCIAL STATEMENTSOVERVIEW
Note 22 Financial risk factors continued
The following is an analysis of the undiscounted contractual cash flows payable under financial liabilities and derivatives. The potential cash outflow of £18.6bn is considered acceptable as it is offset by financial assets and trade receivables of £14.3bn (2011: £17.1bn offset by financial assets and trade receivables of £13.2bn).
The undiscounted cash flows will differ from both the carrying values and fair value. Floating rate interest is estimated using the prevailing rate at the balance sheet date. Cash flows in foreign currencies are translated using spot rates at the balance sheet date. For index-linked liabilities, inflation is estimated at 3% for the life of the liability.
At 25 February 2012
Duewithin1 year
£m
Duebetween
1 and 2years
£m
Duebetween
2 and 3years
£m
Duebetween
3 and 4years
£m
Duebetween
4 and 5years
£m
Duebeyond5 years
£m
Non-derivative financial liabilitiesBank and other borrowings (1,734) (867) (1,005) (5) (1,524) (6,124)Interest payments on borrowings (557) (431) (395) (359) (359) (3,716)Customer deposits – Tesco Bank (5,087) (249) (51) – – – Deposits by banks – Tesco Bank (78) – – – – – Finance leases (39) (17) (15) (13) (13) (222)Trade and other payables (11,011) (105) (22) (35) (9) (52)Derivative and other financial liabilitiesNet settled derivative contracts – receipts 67 54 56 21 60 470 Net settled derivative contracts – payments (122) (80) (69) (61) (43) (342)Gross settled derivative contracts – receipts 3,905 735 1,416 166 1,047 3,757 Gross settled derivative contracts – payments (3,900) (652) (1,328) (77) (935) (2,685)Future purchases of non-controlling interests (3) – – – – – Total (18,559) (1,612) (1,413) (363) (1,776) (8,914)
At 26 February 2011
Duewithin1 year
£m
Duebetween
1 and 2years
£m
Duebetween
2 and 3years
£m
Duebetween
3 and 4years
£m
Duebetween
4 and 5years
£m
Duebeyond5 years
£m
Non-derivative financial liabilitiesBank and other borrowings (1,278) (1,587) (876) (622) – (6,647)Interest payments on borrowings (518) (495) (395) (355) (326) (3,828)Customer deposits – Tesco Bank (4,898) (173) (3) – – –Deposits by banks – Tesco Bank (36) – – – – –Finance leases (56) (36) (15) (15) (16) (205)Trade and other payables (10,303) (84) (14) (7) (3) (73)Derivative and other financial liabilitiesNet settled derivative contracts – receipts 74 68 68 37 14 31Net settled derivative contracts – payments (176) (109) (88) (76) (57) (697)Gross settled derivative contracts – receipts 1,619 641 468 672 132 3,368Gross settled derivative contracts – payments (1,404) (652) (341) (610) (60) (2,631)Future purchases of non-controlling interests (85) (24) – – – –Total (17,061) (2,451) (1,196) (976) (316) (10,682)
Foreign exchange riskThe Group is exposed to foreign exchange risk principally via:
Transactional exposure arises from the cost of future purchases of goods for resale, where those purchases are denominated in a currency other than the functional currency of the purchasing company. Transactional exposures that could significantly impact the Group Income Statement are hedged. These exposures are hedged via forward foreign currency contracts which are designated as cash flow hedges. The notional and fair value of these contracts is shown in Note 21.
Net investment exposure arises from changes in the value of net investments denominated in currencies other than Pounds Sterling. The Group hedges a part of its investments in its international subsidiaries via foreign currency transactions and borrowings in matching currencies which are formally designated as net investment hedges.
Loans to non-UK subsidiaries are hedged via foreign currency transactions and borrowings in matching currencies. These are not formally designated as hedges as gains and losses on hedges and hedged loans will naturally offset.
Tesco PLC Annual Report and Financial Statements 2012 127

Notes to the Group financial statements
Note 22 Financial risk factors continued
The impact on Group financial statements from foreign currency volatility is shown in the sensitivity analysis below:
Sensitivity analysisThe analysis excludes the impact of movements in market variables on the carrying value of pension and other post-employment obligations and on the retranslation of overseas net assets as required by IAS 21 ‘The Effects of Changes in Foreign Exchange Rates’. However, it does include the foreign exchange sensitivity resulting from all local entity non-functional currency financial instruments.
The sensitivity analysis has been prepared on the basis that the amount of net debt, the ratio of fixed to floating interest rates of the debt and derivatives portfolio, and the proportion of financial instruments in foreign currencies are all constant and on the basis of the hedge designations in place at 25 February 2012. It should be noted that the sensitivity analysis reflects the impact on income and equity due to all financial instruments held at the balance sheet date. It does not reflect any change in sales or costs that may result from changing interest or exchange rates.
The following assumptions were made in calculating the sensitivity analysis:
the sensitivity of interest payable to movements in interest rates is calculated on net floating rate debt, deposits and derivative instruments with no sensitivity assumed for RPI-linked debt which has all been swapped to fixed rates;
changes in the carrying value of derivative financial instruments designated as fair value hedges from movements in interest rates or foreign exchange rates have an immaterial effect on the Group Income Statement and equity due to compensating adjustments in the carrying value of debt;
changes in the carrying value of derivative financial instruments designated as net investment hedges from movements in foreign exchange rates are recorded directly in the Group Statement of Comprehensive Income;
changes in the carrying value of derivative financial instruments not designated as hedging instruments only affect the Group Income Statement;
all other changes in the carrying value of derivative financial instruments designated as hedging instruments are fully effective with no impact on the Group Income Statement; and
the floating leg of any swap or any floating rate debt is treated as not having any interest rate already set, therefore a change in interest rates affects a full 12-month period for the interest payable portion of the sensitivity calculations.
Using the above assumptions, the following table shows the illustrative effect on the Group Income Statement and the Group Statement of Comprehensive Income that would result from changes in UK interest rates and in exchange rates:
2012 2011
Incomegain/(loss)
£m
Equitygain/(loss)
£m
Incomegain/(loss)
£m
Equitygain/(loss)
£m
1% increase in GBP interest rates (2011: 1%) (3) – (14) –5% appreciation of the Euro (2011: 5%) (1) (40) 2 (46)5% appreciation of the South Korean Won (2011: 5%) – 59 (1) 15% appreciation of the US Dollar (2011: 5%) 10 50 8 355% appreciation of the Czech Koruna (2011: 5%) 1 17 – (6)
A decrease in interest rates and a depreciation of foreign currencies would have the opposite effect to the impact in the table above.
The impact on the Group Statement of Comprehensive Income from changing exchange rates results principally from foreign currency deals used as net investment hedges. The impact on the Group Statement of Comprehensive Income will largely be offset by the revaluation in equity of the hedged assets. For changes in the USD/GBP exchange rate, the impact on the Group Statement of Comprehensive Income results principally from forward purchases of US Dollars as cash flow hedges.
Capital riskThe Group’s objectives when managing capital (defined as net debt plus equity) are to safeguard the Group’s ability to continue as a going concern in order to provide returns to shareholders and benefits for other stakeholders, while maintaining a strong credit rating and headroom whilst optimising return to shareholders through an appropriate balance of debt and equity funding. The Group manages its capital structure and makes adjustments to it, in light of changes to economic conditions and the strategic objectives of the Group.
To maintain or adjust the capital structure, the Group may adjust the dividend payment to shareholders, buy back shares and cancel them, or issue new shares. During 2012, the Group purchased and cancelled £290m ordinary shares.
The policy for debt is to ensure a smooth debt maturity profile with the objective of ensuring continuity of funding. This policy continued during the financial year with bonds redeemed of £521m (2011: £1,861m) and new bonds issued primarily to finance maturing debt in 2012/13 totalling £1,358m (2011: £125m). The Group borrows centrally and locally, using a variety of capital market instruments and borrowing facilities to meet the Group’s business requirements of each local business.
128 Tesco PLC Annual Report and Financial Statements 2012

STRATEGIC REVIEW PERFORMANCE REVIEW GOVERNANCE FINANCIAL STATEMENTSOVERVIEW
Note 22 Financial risk factors continued
Tesco Bank
Interest rate riskInterest rate risk arises where assets and liabilities in Tesco Bank’s banking activities have different repricing dates. Tesco Bank policy seeks to minimise the sensitivity of net interest income to changes in interest rates. Potential exposures to interest rate movements in the medium to long term are measured and controlled through position and sensitivity limits. Short-term exposures are measured and controlled in terms of net interest income sensitivity over 12 months to a 1% parallel movement in interest rates. Tesco Bank also use Economic Value Equity (‘EVE’) for risk management purposes with focus on the value of Tesco Bank in today’s interest rate environment and its sensitivity to changes in interest rates. Interest rate risk is managed using interest rate swaps as the main hedging instrument.
Liquidity risk Liquidity risk is the risk that Tesco Bank is unable to meet its payment obligations as they fall due. Liquidity risk is managed within Tesco Bank’s banking activities and adheres to the liquidity requirements set by the FSA. Tesco Bank’s Board has set a defined liquidity risk policy and contingency funding which is prudent and in excess of the minimum requirements as set out by the FSA and by Tesco Bank. A diversified portfolio of high-quality liquid and marketable assets is maintained. Cash flow commitments and marketable asset holdings are measured and managed on a daily basis. Tesco Bank has sufficient liquidity to meet all foreseeable outflow requirements as they fall due and its liquidity risk is further mitigated by its well diversified retail deposit base and a pool of surplus cash resources that are invested in a range of marketable assets.
Credit riskCredit risk is the potential that a bank borrower or counterparty will fail to meet its obligations in accordance with agreed terms. Credit risk principally arises from the Bank’s retail lending activities but also from the placement of surplus funds with other banks and money market funds, investments in transferable securities and interest rate and foreign exchange derivatives. In addition, credit risk arises from contractual arrangements with third parties where payments and commissions are due to the Bank for short periods of time.
Retail credit policy is managed through the credit risk policy framework with standards and limits defined at all stages of the customer lifecycle, including new account sanctioning, customer management and collections and recovery activity. Customer lending decisions are managed principally through the deployment of bespoke credit scorecard models and credit policy rules, which exclude specific areas of lending, and an affordability assessment which determines a customer’s ability to repay an outstanding credit amount. Wholesale credit risk is managed using a limit-based framework, with limits determined by counterparty credit worthiness, instrument type and remaining tenor. A limits framework is also in place for the management of third party credit exposures.
Expressed as an annual probability of default, the upper and lower boundaries and the midpoint for each of the asset quality grades are as follows:
At 25 February 2012 and 26 February 2011Annual probability of default
Asset quality gradeMinimum
%Midpoint
%Maximum
%S&P
equivalent
AQ1 0.00 0.10 0.20 AAA to BBB-AQ2 0.21 0.40 0.60 BB+ to BBAQ3 0.61 1.05 1.50 BB- to B+AQ4 1.51 3.25 5.00 B+ to BAQ5 5.01 52.50 100.00 B and below
At 25 February 2012AQ1
£mAQ2
£mAQ3
£mAQ4
£mAQ5
£m
Accruingpast due
£m
Non-accrual
£m
Impairmentprovision
£mTotal
£m
Assets:
Other investments 1,526 – – – – – – – 1,526 Loans and advances to customers 630 977 866 690 1,158 73 194 (185) 4,403 Total assets 2,156 977 866 690 1,158 73 194 (185) 5,929
Commitments 4,471 1,716 662 426 147 – – – 7,422 Total off-balance sheet 4,471 1,716 662 426 147 – – – 7,422
During the financial year, there was a change in the methodology which Tesco Bank uses to measure the customer risk in relation to outstanding loan balances. As a result this has revised the categorisation of some customer accounts since the prior year end in terms of asset quality grading. Despite this change in methodology and the resulting impact on the data presented, there has not been any significant change in the underlying quality of the loans portfolio year on year.
At 26 February 2011*AQ1
£mAQ2
£mAQ3
£mAQ4
£mAQ5
£m
Accruingpast due
£m
Non-accrual
£m
Impairmentprovision
£mTotal
£m
Assets:Other investments 938 – – – – – – – 938Loans and advances to customers 599 466 924 1,663 886 73 212 (182) 4,641Total assets 1,537 466 924 1,663 886 73 212 (182) 5,579
Commitments 4,254 1,601 645 444 183 – – – 7,127Total off-balance sheet 4,254 1,601 645 444 183 – – – 7,127
* See Note 1 Accounting Policies for details of reclassifications.Tesco PLC Annual Report and Financial Statements 2012 129

Notes to the Group financial statements
Note 22 Financial risk factors continued
Insurance riskTesco Bank is exposed to insurance risks through its ownership of 49.9% of Tesco Underwriting Limited (‘TU’), an authorised insurance company, and through its historic distribution arrangement with RBS Insurance. Since late 2010 the majority of new business policies for Home and Motor Insurance products sold by Tesco Bank have been underwritten by TU. The key insurance risks within TU relate to Underwriting Risk and specifically the potential for a major weather event to generate significant claims on Home insurance or on Motor insurance the cost of settling bodily injury claims. Exposure to this risk is actively managed within TU with close monitoring of performance metrics and the use of reinsurance to limit TU’s exposure above predetermined limits.
The primary risk that the Group remains exposed to through its previous relationship with RBS Insurance is Reserving Risk – the risk that claims reserves are insufficient to cover the ultimate cost of those insurance claims that have not yet settled. This is particularly relevant to Motor insurance claims where the ultimate cost of large bodily injury claims is uncertain and the time taken to settle such claims can vary significantly depending on the severity of the injury. This risk is, in part, mitigated by the use of reinsurance to limit Tesco Bank’s exposure to the cost of individual claims above certain predetermined limits. However, the nature of this exposure results in the process of estimating the ultimate cost of these claims carrying a degree of uncertainty.
Note 23 Customer deposits and deposits by banks2012
£m2011
£m
Customer deposits 5,387 5,074Deposits by banks 78 36
5,465 5,110
Included within customer deposits is £300m (2011: £177m) that is non-current.
Note 24 ProvisionsProperty
provisions£m
Otherprovisions
£mTotal
£m
At 27 February 2010 111 100 211Foreign currency translation (3) – (3)Amount released in the year (18) (50) (68)Amount provided in the year 48 – 48Amount utilised in the year – (11) (11)At 26 February 2011 138 39 177Foreign currency translation 2 – 2 Amount released in the year (45) – (45)Amount provided in the year 28 61 89 Amount utilised in the year (4) (22) (26)Others 2 – 2 At 25 February 2012 121 78 199
The balances are analysed as follows:
2012£m
2011£m
Current 99 64Non-current 100 113
199 177
Property provisions comprise obligation for future rents payable net of rents receivable on onerous and vacant property leases, terminal dilapidations and future rents above market value on unprofitable stores. The majority of these provisions are expected to be utilised over the period to 2020.
The other provisions balance relates to a provision for Tesco Bank customer redress in respect of potential customer complaints arising from historic sales of PPI and a provision for customer insurance cancellations. The PPI provision is likely to be utilised over several years, although the timing of utilisation is uncertain. The balance is classified as current at the year end.
The British Bankers Association initiated a judicial review on 24 January 2011 in relation to the regulation of PPI sales practices. The Group did not participate in this action and continued to deal with customer complaints in line with the FSA requirements throughout the duration of the legal proceedings undertaken by the other banks involved.
130 Tesco PLC Annual Report and Financial Statements 2012

STRATEGIC REVIEW PERFORMANCE REVIEW GOVERNANCE FINANCIAL STATEMENTSOVERVIEW
Note 24 Provisions continued
During the first half of the financial year, the Group undertook a review of historic sales practices in place over the period in which PPI was sold to customers. During the financial year, the Group announced its intention to begin a programme of proactive customer contact, inviting customers who think they were mis-sold PPI during a specific time period to seek reimbursement from the Group. This programme has entered an initial pilot phase. The principal purpose of the pilot was to test operational processes in order to ensure that they were fit for purpose and could cope with the volume associated with a full programme of customer contact. Following the decision to pro-actively contact customers, the provision was increased by £57m in the first half of the financial year.
The Group will continue to handle claims and redress customers in accordance with PS10/12. This will include ongoing analysis of historical claims experience in accordance with the guidance.
Note 25 Share-based payments
For continuing operations, the Group Income Statement charge for the year recognised in respect of share-based payments is £153m (2011: £288m), which is made up of share option schemes and share bonus payments. Of this amount, £125m (2011: £220m) will be settled in equity and £28m (2011: £68m) in cash.
Share option schemesThe Company had ten share option schemes in operation during the financial year, all of which are equity-settled schemes:
i) The Savings-related Share Option Scheme (1981) permits the grant to employees of options in respect of ordinary shares linked to a building society/bank save-as-you-earn contract for a term of three or five years with contributions from employees of an amount between £5 and £250 per four-weekly period. Options are capable of being exercised at the end of the three- or five-year period at a subscription price not less than 80% of the average of the middle-market quotations of an ordinary share over the three dealing days immediately preceding the offer date.
ii) The Irish Savings-related Share Option Scheme (2000) permits the grant to Irish employees of options in respect of ordinary shares linked to a building society/bank save-as-you-earn contract for a term of three or five years with contributions from employees of an amount between €12 and €320 per four-weekly period. Options are capable of being exercised at the end of the three- or five-year period at a subscription price not less than 80% of the average of the middle-market quotations of an ordinary share over the three dealing days immediately preceding the offer date.
iii) The Approved Executive Share Option Scheme (1994) was adopted on 17 October 1994. The exercise of options granted under this scheme will normally be conditional upon the achievement of a specified performance target related to the growth in earnings per share over a three-year period. No further options will be granted under this scheme and it has been replaced by the Discretionary Share Option Plan (2004). There were no discounted options granted under this scheme.
iv) The Unapproved Executive Share Option Scheme (1996) was adopted on 7 June 1996. The exercise of options granted under this scheme will normally be conditional upon the achievement of a specified performance target related to the growth in earnings per share over a three-year period. No further options will be granted under this scheme and it has been replaced by the Discretionary Share Option Plan (2004). There were no discounted options granted under this scheme.
v) The International Executive Share Option Scheme (1994) was adopted on 20 May 1994. This scheme permits the grant to selected non-UK executives of options to acquire ordinary shares on substantially the same basis as their UK counterparts. The exercise of options granted under this scheme will normally be conditional upon the achievement of a specified performance target related to the growth in earnings per share over a three-year period. No further options will be granted under this scheme and it has been replaced by the Discretionary Share Option Plan (2004). There were no discounted options granted under this scheme.
vi) The Executive Incentive Plan (2004) was adopted on 5 July 2004. This scheme permits the grant of options in respect of ordinary shares to selected executives. Options are normally exercisable between three and ten years from the date of grant for nil consideration.
vii) The Performance Share Plan (2004) was adopted on 5 July 2004 and amended on 29 June 2007. This scheme permits the grant of options in respect of ordinary shares to selected executives. Options granted before 29 June 2007 are normally exercisable between four and ten years from the date of grant for nil consideration. Options granted after 29 June 2007 are normally exercisable between three and ten years from the date of grant for nil consideration. The exercise of options will normally be conditional upon the achievement of specified performance targets related to the return on capital employed over a three-year period. No further options will be granted under this scheme and it has been replaced by the Performance Share Plan (2011).
viii) The Performance Share Plan (2011) was adopted on 1 July 2011 and amended on 4 July 2011. This scheme permits the grant of options in respect of ordinary shares to selected executives. Options are normally exercisable between three and ten years from the date of grant for nil consideration. The exercise of options will normally be conditional upon the achievement of specified performance targets related to the return on capital employed and earnings per share over a three-year period.
Tesco PLC Annual Report and Financial Statements 2012 131

Notes to the Group financial statements
Note 25 Share-based payments continued
ix) The Discretionary Share Option Plan (2004) was adopted on 5 July 2004. This scheme permits the grant of approved, unapproved and international options in respect of ordinary shares to selected executives. Options are normally exercisable between three and ten years from the date of grant at a price not less than the middle-market quotation or average middle-market quotations of an ordinary share for the dealing day or three dealing days preceding the date of grant. The exercise of options will normally be conditional upon the achievement of a specified performance target related to the annual percentage growth in earnings per share over a three-year period. There will be no discounted options granted under this scheme.
x) The Group New Business Incentive Plan (2007) was adopted on 29 June 2007. This scheme permits the grant of options in respect of ordinary shares to selected executives. Options will normally vest in four tranches: four, five, six and seven years after the date of grant and will be exercisable for up to two years from the vesting dates for nil consideration. The exercise of options will normally be conditional upon the achievement of specified performance targets related to the return on capital employed over the seven-year plan.
The following tables reconcile the number of share options outstanding and the weighted average exercise price (‘WAEP’):
For the year ended 25 February 2012
Savings-related share option scheme
Irish savings-relatedshare option scheme
Approvedshare option scheme
Unapprovedshare option scheme
International executiveshare option scheme
Nil costshare option schemes
Options WAEP Options WAEP Options WAEP Options WAEP Options WAEP Options WAEP
Outstanding at26 February 2011 141,225,710 345.41 5,720,602 348.84 14,847,597 389.21 92,512,818 374.29 65,066,054 382.06 12,399,127 0.00
Granted 28,566,015 364.00 1,133,139 364.00 7,448 402.75 2,555 402.75 40,000 402.75 6,513,912 0.00Forfeited (21,030,145) 376.08 (1,255,918) 367.98 (439,466) 385.94 (1,897,884) 384.93 (3,314,141) 380.28 (603,508) 0.00Exercised (16,840,547) 300.49 (622,620) 304.96 (747,015) 276.82 (3,198,654) 272.20 (2,040,493) 288.26 (507,617) 0.00Outstanding at
25 February 2012 131,921,033 350.28 4,975,203 352.95 13,668,564 395.47 87,418,835 377.80 59,751,420 385.37 17,801,914 0.00
Exercisable as at25 February 2012 16,757,641 309.18 557,813 309.91 7,887,688 402.06 44,131,269 380.11 27,530,779 393.35 11,240,457 0.00
Exercise price range (pence)
248.00 to 410.00
307.00 to 410.00
197.50 to 473.75
197.50 to 473.75
197.50 to 473.75 0.00
Weighted average remaining contractual life (years) 0.43 0.43 4.94 4.65 5.01 6.17
For the year ended 26 February 2011
Savings-related share option scheme
Irish savings-relatedshare option scheme
Approvedshare option scheme
Unapprovedshare option scheme
International executiveshare option scheme
Nil costshare option schemes
Options WAEP Options WAEP Options WAEP Options WAEP Options WAEP Options WAEP
Outstanding at27 February 2010 138,234,520 323.37 5,455,068 326.70 14,550,891 361.57 85,907,622 351.46 54,880,748 363.64 9,185,455 0.00
Granted 29,920,166 386.00 1,470,162 386.00 3,793,684 419.85 21,447,502 419.81 17,065,475 420.00 4,148,918 0.00Forfeited (7,971,500) 328.09 (666,990) 320.21 (1,030,137) 395.79 (3,915,038) 401.52 (3,192,794) 382.05 (499,596) 0.00Exercised (18,957,476) 256.02 (537,638) 261.38 (2,466,841) 270.56 (10,927,268) 274.37 (3,687,375) 283.46 (435,650) 0.00Outstanding at
26 February 2011 141,225,710 345.41 5,720,602 348.84 14,847,597 389.21 92,512,818 374.29 65,066,054 382.06 12,399,127 0.00
Exercisable as at26 February 2011 15,506,889 366.48 668,423 381.98 6,090,853 375.33 32,577,023 348.13 19,138,101 364.16 3,744,903 0.00
Exercise price range (pence)
248.00 to 410.00
248.00 to 410.00
197.50 to 473.75
197.50 to 473.75
197.50 to 473.75 0.00
Weighted average remaining contractual life (years) 0.43 0.43 4.92 4.61 4.98 6.74
Share options were exercised on a regular basis throughout the financial year. The average share price during the financial year ended 25 February 2012 was 385.43p (2011: 417.80p).
132 Tesco PLC Annual Report and Financial Statements 2012

STRATEGIC REVIEW PERFORMANCE REVIEW GOVERNANCE FINANCIAL STATEMENTSOVERVIEW
Note 25 Share-based payments continued
The fair value of share options is estimated at the date of grant using the Black-Scholes option pricing model. The following table gives the assumptions applied to the options granted in the respective periods shown. No assumption has been made to incorporate the effects of expected early exercise.
2012 2011
Savings-related share option
schemes
Executive share option
schemes
Nil cost option
schemes
Savings-related share option
schemes
Executive share option
schemes
Nil cost share option
schemes
Expected dividend yield (%) 4.1% 4.1% 0.0% 3.5% 3.5% 0.0%Expected volatility (%) 23 – 27% 26% 26% 26 – 30% 25% 25%Risk-free interest rate (%) 1.5 – 1.8% 2.0% 2.6% 1.6 – 2.2% 2.3 – 3.2% 2.7%Expected life of option (years) 3 or 5 6 6 3 or 5 6 6Weighted average fair value of options granted (pence) 69.85 62.91 408.14 93.41 77.86 414.06Probability of forfeiture (%) 14 – 16% 10% 0% 14 – 16% 10% 0%Share price (pence) 404.00 402.75 408.14 436.00 419.89 414.06Weighted average exercise price (pence) 364.00 402.75 0.00 386.00 419.89 0.00
Volatility is a measure of the amount by which a price is expected to fluctuate during a period. The measure of volatility used in the Group’s option pricing models is the annualised standard deviation of the continuously compounded rates of return on the share over a period of time. In estimating the future volatility of the Company’s share price, the Board considers the historical volatility of the share price over the most recent period that is generally commensurate with the expected term of the option, taking into account the remaining contractual life of the option.
Share bonus schemesEligible UK employees are able to participate in Shares in Success, an all-employee profit-sharing scheme. Each year, shares are awarded as a percentage of earnings up to a maximum of £3,000. Eligible Republic of Ireland employees are able to participate in a Share Bonus Scheme, an all-employee profit-sharing scheme. Each year, employees receive a percentage of their earnings as either cash or shares.
Senior management also participate in performance-related bonus schemes. The amount paid to employees is based on a percentage of salary and is paid partly in cash and partly in shares. Bonuses are awarded to eligible employees who have completed a required service period and depend on the achievement of corporate targets. The accrued cash element of the bonus at the balance sheet date is £13m (2011: £38m).
Selected senior management participate in the selected senior management Performance Share Plan. Awards made under this plan will normally vest three years after the date of the award for nil consideration. Vesting will normally be conditional on the achievement of specified performance targets related to the return on capital employed over a three-year performance period.
Senior management participate in the senior management Performance Share Plan (2011). Awards made under this plan will normally vest three years after the date of the award for nil consideration. Vesting will normally be conditional on the achievement of specified performance targets related to the return on capital employed and earnings per share over a three-year performance period.
Senior management in the US business also participate in the US Long-Term Incentive Plan (2007) which was adopted on 29 June 2007. The awards made under this plan will normally vest in four tranches: four, five, six and seven years after the date of award, for nil consideration. Vesting will normally be conditional on the achievement of specified performance targets related to the return on capital employed in the US business over the seven-year plan.
The Executive Directors participate in short-term and long-term bonus schemes designed to align their interests with those of shareholders. Full details of these schemes can be found in the Directors’ Remuneration Report.
The fair value of shares awarded under these schemes is their market value on the date of award. Expected dividends are not incorporated into the fair value except for awards under the US Long-Term Incentive Plan.
The number and weighted average fair value (‘WAFV’) of share bonuses awarded during the financial year were:
2012 2011
Number of shares
WAFV pence
Number ofshares
WAFVpence
Shares in Success 26,597,598 416.26 25,360,677 416.23Irish Share Bonus Scheme 156,313 419.50 141,970 397.70Executive Incentive Scheme 9,482,746 415.89 12,765,004 398.68Performance Share Plan 21,075,604 389.13 2,405,730 399.78US Long-Term Incentive Plan 132,786 405.63 192,078 433.05
Tesco PLC Annual Report and Financial Statements 2012 133

Notes to the Group financial statements
Note 26 Post-employment benefits
PensionsThe Group operates a variety of post-employment benefit arrangements, covering both funded defined contribution and funded and unfunded defined benefit schemes. The most significant of these are the funded defined benefit pension schemes for the Group’s employees in the UK, the Republic of Ireland and South Korea.
Defined contribution plansThe contributions payable for defined contribution schemes of £20m (2011: £14m) have been recognised in the Group Income Statement.
Defined benefit plansUK The principal plan within the Group is the Tesco PLC Pension Scheme, which is a funded defined benefit pension scheme in the UK, the assets of which are held as a segregated fund and administered by trustees. Towers Watson Limited, an independent actuary, carried out the latest triennial actuarial assessment of the scheme as at 31 March 2008, using the projected unit method.
At 31 March 2008, the actuarial deficit was £275m. The market value of the schemes’ assets was £3,987m and these assets represented 94% of the benefits that had accrued to members, after allowing for expected increases in earnings and pensions in payment. The actuarial assessment as at 31 March 2011 has started and the results will be finalised by June 2012. The Group is currently in consultation with staff and trustees regarding proposed changes to the scheme.
OverseasThe most significant overseas schemes are the funded defined benefit schemes which operate in the Republic of Ireland and South Korea. An independent actuary, using the projected unit method, carried out the latest actuarial assessment of the Republic of Ireland scheme as at 1 April 2010 and South Korea as at 25 February 2012.
The valuations used for IAS 19 have been based on the most recent actuarial valuations and updated by Towers Watson Limited to take account of the requirements of IAS 19 in order to assess the liabilities of the schemes as at 25 February 2012. The schemes’ assets are stated at their market values as at 25 February 2012. Towers Watson Limited have updated the most recent Republic of Ireland and South Korea valuations. The liabilities relating to retirement healthcare benefits have also been determined in accordance with IAS 19 and are incorporated in the following tables.
Principal assumptions The major assumptions, on a weighted average basis, used by the actuaries were as detailed below:
2012 %
2011%
Discount rate 5.2 5.9Price inflation 3.1 3.5Rate of increase in salaries 3.2 3.6Rate of increase in pensions in payment* 2.9 3.3Rate of increase in deferred pensions* 2.1 2.8Rate of increase in career average benefits 3.1 3.5
* In excess of any Guaranteed Minimum Pension (GMP) element.
The main financial assumption is the real discount rate (the excess of the discount rate over the rate of price inflation). If this assumption increased/ decreased by 0.1%, the UK defined benefit obligation would decrease/increase by approximately £170m and the annual UK current service cost would decrease/increase by approximately £14m.
UK mortality assumptions The Company conducts analysis of mortality trends under the Tesco PLC Pension Scheme in the UK as part of the triennial actuarial valuation of the Scheme. At the latest triennial actuarial valuation as at 31 March 2008 the following assumptions were adopted for funding purposes:
Base tables: PMA92C00 for male members with cohort improvements to 2000 and members taken to be one year younger than actual age. PFA92C00 for female members with cohort improvements to 2000 and members taken to be half a year older than actual age.
These assumptions were used for the calculation of the pension liability as at 25 February 2012 for the main UK scheme.
The mortality assumptions used are based on tables that have been updated in line with medium cohort projections with a minimum improvement of 1% per annum from 31 March 2008 to 25 February 2012. In addition, the allowance for future mortality improvements incorporates medium cohort projections with a minimum improvement of 1% per annum.
The following table illustrates the expectation of life of an average member retiring at age 65 at the balance sheet date and a member reaching age 65 at the same date +25 years:
2012 years
2011years
Retiring at reporting date at age 65: Male 21.8 21.7 Female 23.6 23.5Retiring at reporting date +25 years at age 65: Male 24.2 24.1 Female 26.1 26.0
134 Tesco PLC Annual Report and Financial Statements 2012

STRATEGIC REVIEW PERFORMANCE REVIEW GOVERNANCE FINANCIAL STATEMENTSOVERVIEW
Note 26 Post-employment benefits continued
Rates of return on scheme assets The assets in the defined benefit pension schemes and the expected nominal rates of return are as follow:
2012 2011
Long-term rate of return
%
Market value
£m
Long-term rate of return
%
Marketvalue
£m
Equities 8.1 3,377 8.5 3,032Bonds 4.9 1,365 5.0 1,116Property 6.5 577 6.8 511Other (alternative assets) 8.1 741 8.5 564Cash 3.6 109 4.0 385Total market value of assets 6,169 5,608
The expected rate of return on assets is a weighted average based on the actual plan assets held and the respective returns expected on the separate asset classes. The expected rates of return on equities and cash have both been set having regard to expected returns over the medium term, as calculated by the Company’s independent actuary. The expected rate of return on bonds was measured directly from actual yields for gilts and corporate bond stocks. The rates take into account the actual mix of UK gilts, UK corporate bonds and overseas bonds held at the balance sheet date.
Movement in pension deficit during the financial year Changes in the fair value of defined benefit pension plan assets are as follows:
2012£m
2011£m
Opening fair value of plan assets 5,608 4,696Expected return 422 363Actuarial (losses)/gains (168) 278Contributions by employer 457 433Actual member contributions 11 10Foreign currency translation (1) (9)Benefits paid (160) (163)Closing fair value of plan assets 6,169 5,608
Changes in the present value of defined benefit obligations are as follows:
2012£m
2011£m
Opening defined benefit obligation (6,964) (6,536)Current service cost (495) (499)Past service gain/(cost) 3 (29)Interest cost (404) (381)(Losses)/gains on change of assumptions (373) 342Experience gain/(loss) 43 (25)Foreign currency translation – 11Benefits paid 160 163Actual member contributions (11) (10)Closing defined benefit obligation (8,041) (6,964)
The amounts that have been charged to the Group Income Statement and Group Statement of Comprehensive Income are set out below:
2012£m
2011£m
Analysis of the amount charged to operating profit:Current service cost (495) (499)Past service gain/(cost) 3 (29)Total charge to operating profit (492) (528)Analysis of the amount (charged)/credited to finance (cost)/income: Expected return on pension schemes’ assets 422 363Interest on pension schemes’ liabilities (404) (381)Net pension finance income/(cost) (Note 5) 18 (18)Total charge to the Group Income Statement (474) (546)Analysis of the amount recognised in the Group Statement of Comprehensive Income: Actual return less expected return on pension schemes’ assets (168) 278Experience gains/(losses) arising on the schemes’ liabilities 43 (25)Foreign currency translation – 2Changes in assumptions underlying the present value of the schemes’ liabilities (373) 342Total (loss)/gain recognised in the Group Statement of Comprehensive Income (498) 597
Tesco PLC Annual Report and Financial Statements 2012 135

Notes to the Group financial statements
Note 26 Post-employment benefits continued
The cumulative losses recognised through the Group Statement of Comprehensive Income since the date of transition to IFRS are £1,037m (2011: £539m).
Summary of movements in deficit during the financial year
2012£m
2011£m
Deficit in schemes at beginning of the year (1,356) (1,840)Current service cost (495) (499)Past service gain/(cost) 3 (29)Other finance income/(cost) 18 (18)Contributions by employer 457 433Foreign currency translation (1) 2Actuarial (loss)/gain (498) 595Deficit in schemes at end of the year (1,872) (1,356)
History of movements The historical movement in defined benefit pension schemes’ assets and liabilities and history of experience gains and losses are as follows:
2012£m
2011£m
2010£m
2009£m
2008£m
Total market value of assets 6,169 5,608 4,696 3,420 4,089Present value of liabilities relating to unfunded schemes (60) (65) (54) (39) (34)Present value of liabilities relating to partially funded schemes (7,981) (6,899) (6,482) (4,875) (4,893)Pension deficit (1,872) (1,356) (1,840) (1,494) (838)
Experience (losses)/gains on scheme assets (168) 278 733 (1,270) (465)Experience gains/(losses) on plan liabilities 43 (25) (1) (117) (20)
Post-employment benefits other than pensions The Company operates a scheme offering post-employment healthcare benefits. The cost of providing these benefits has been accounted for on a similar basis to that used for defined benefit pension schemes.
The liability as at 25 February 2012 of £11m (2011: £12m) was determined in accordance with the advice of independent actuaries. During the financial year, £1m (2011: £1m) has been charged to the Group Income Statement and £1m (2011: £1m) of benefits were paid.
A change of 1% in assumed healthcare cost trend rates would have the following effect:
2012£m
2011£m
Effect of a 1% increase in assumed healthcare cost trend rates on: Service and interest cost – –Defined benefit obligation 2 2
Effect of a 1% decrease in assumed healthcare cost trend rates on: Service and interest cost – –Defined benefit obligation (1) (1)
Expected contributions The Company expects to make normal cash contributions of approximately £486m to defined schemes in the financial year ending 23 February 2013. In addition to this the Company paid a contribution of £180m on 30 March 2012, ahead of the completion of the triennial valuation.
Note 27 Called up share capital2012 2011
Ordinary shares of 5p each Ordinary shares of 5p each
Number £m Number £m
Allotted, called up and fully paid:At beginning of the year 8,046,468,092 402 7,985,044,057 399Share options exercises 23,490,825 1 36,535,102 2Share bonus awards issues 32,656,313 2 24,888,933 1Shares purchased for cancellation (70,802,785) (3) – –At end of the year 8,031,812,445 402 8,046,468,092 402
During the financial year, 23 million (2011: 37 million) ordinary shares of 5p each were issued in relation to share options for an aggregate consideration of £69m (2011: £97m).
During the financial year, 33 million (2011: 25 million) shares of 5p each were issued in relation to share bonus awards for an aggregate consideration of £2m (2011: £1m).
136 Tesco PLC Annual Report and Financial Statements 2012

STRATEGIC REVIEW PERFORMANCE REVIEW GOVERNANCE FINANCIAL STATEMENTSOVERVIEW
Note 27 Called up share capital continued
During the financial year, the Group purchased and cancelled 70.8 million (2011: nil) shares of 5p each representing 1% (2011: 0%) of the called up capital as at 25 February 2012 at an average price of £4.07 (2011: n/a) per share. The total consideration including expenses was £290m (2011: £nil). The excess of the consideration over the aggregate nominal value of the shares purchased has been charged to retained earnings.
Between 26 February 2012 and 13 April 2012 options over 2,779,741 ordinary shares have been exercised under the terms of the Savings-related Share Option Scheme (1981) and the Irish Savings-related Share Option Scheme (2000). Between 26 February 2012 and 13 April 2012, options over 937,548 ordinary shares have been exercised under the terms of the Executive Share Option Schemes (1994 and 1996) and the Discretionary Share Option Plan (2004).
As at 25 February 2012, the Directors were authorised to purchase up to a maximum in aggregate of 803.6 million (2011: 802.1 million) ordinary shares.
The owners of ordinary shares are entitled to receive dividends as declared from time to time and are entitled to one vote per share at general meetings of the Company.
Capital redemption reserveUpon cancellation of the shares purchased as part of the share buy-back, a capital redemption reserve is created representing the nominal value of the shares cancelled. This is a non-distributable reserve.
Note 28 Related party transactions
Transactions between the Company and its subsidiaries, which are related parties, have been eliminated on consolidation and are not disclosed in this note. Transactions between the Group and its joint ventures and associates are disclosed below:
Trading transactionsSales to
related partiesPurchases from
related partiesAmounts owed
by related partiesAmounts owed
to related parties
2012
£m2011
£m2012
£m2011
£m2012
£m2011
£m2012
£m2011
£m
Joint ventures 263 281 480 449 5 18 36 4Associates 2 3 1,691 1,104 – 6 368 264
Sales to related parties consists of services/management fees and loan interest.
Purchases from related parties include £351m (2011: £306m) of rentals payable to the Group’s joint ventures (including those joint ventures formed as part of the sale and leaseback programme) and £1,691m (2011: £1,104m) of fuel purchased from Greenergy International Limited. In addition, duty on the fuel purchases paid by the Group to Greenergy International Limited was £1,950m (2011: £1,877m).
Non-trading transactionsSale and leaseback
of assetsLoans to
related partiesLoans from
related partiesInjection of
equity funding
2012
£m2011
£m2012
£m2011
£m2012
£m2011
£m2012
£m2011
£m
Joint ventures 450 1,652 380 502 16 26 49 94Associates – – 4 1 – – – 69
Transactions between the Group and the Group’s pension plans are disclosed in Note 26.
A number of the Group’s subsidiaries are members of one or more partnerships to whom the provisions of the Partnerships (Accounts) Regulations 2008 (‘Regulations’) apply. The accounts for those partnerships have been consolidated into these accounts pursuant to Regulation 7 of the Regulations.
On 31 January 2012, the Group completed a new sale and leaseback transaction involving UK property assets, structured as a joint venture with a UK investor. Ten trading stores and one store under development were sold for proceeds of £450m at an average net yield of 4.9%.
Transactions with key management personnelFrom 27 Feburary 2011, members of the Board of Directors and Executive Committee of Tesco PLC are deemed to be key management personnel. Before that time only members of the Board of Directors were deemed to be key management personnel.
Key management personnel compensation and their transactions with Tesco Bank are disclosed below:2012
£m2011
£m
Salaries and short-term benefits 13 10Pensions 4 3Share-based payments 9 27
26 40
Of the total remuneration to key management personnel, £6m (2011: £nil) is due to Executive Committee members who are not on the PLC Board.
Tesco PLC Annual Report and Financial Statements 2012 137

Notes to the Group financial statements
Note 28 Related party transactions continued
Transactions of key management personnel with Tesco Bank during the financial year were as follows:
Credit card and personal loan balances
Saving deposit accounts
Number of key management
personnel £m
Number of key management
personnel £m
At 25 February 2012 12 – 13 2At 26 February 2011 7 – 10 1
Note 29 Reconciliation of profit before tax to cash generated from operations2012
£m2011*
£m
Profit before tax 3,835 3,641Net finance costs (Note 5) 241 333Share of post-tax profits of joint ventures and associates (Note 13) (91) (57)Operating profit 3,985 3,917Operating loss of discontinued operations (127) (106)Depreciation and amortisation 1,498 1,420Profits/losses arising on property-related items from continuing operations (376) (432)Profits/losses arising on property-related items from discontinued operations 1 5Loss arising on sale of non property-related items 4 3Profit arising on sale of other investments (5) –Impairment of goodwill (Note 10) – 55Net charge/(reversal) of impairment of property, plant and equipment (Note 11) and intangible assets (Note 10) 75 (13)Adjustment for non-cash element of pensions charge 35 95Share-based payments (Note 25) 125 220Tesco Bank non-cash items included in profit before tax 166 (83)Increase in inventories (461) (467)Increase in trade and other receivables (139) (152)Increase in trade and other payables and provisions 679 976Tesco Bank decrease/(increase) in loans and advances to customers (Note 17) 150 (519)Tesco Bank increase in trade and other receivables (278) (86)Tesco Bank increase in customer and bank deposits and trade and other payables 356 780Decrease in working capital 307 532Cash generated from operations 5,688 5,613
* See Note 1 Accounting policies for details of reclassifications.
The increase in working capital includes the impact of translating foreign currency working capital movements at average exchange rates rather than year end exchange rates.
Note 30 Analysis of changes in net debt At
26 February2011**
£m
Tesco Bank at26 February
2011*£m
Cash flow£m
Business combinations
£m
Othernon-cash
movements£m
Net debt of disposal group
£m
Elimination of Tesco Bank
£m
At25 February
2012**£m
Cash and cash equivalents 1,722 706 (148) 7 24 (6) (580) 1,725Short-term investments 1,022 – 221 – – – – 1,243Joint venture loan and other
receivables 493 34 (142) – 8 – (34) 359Bank and other borrowings (10,282) (595) 353 (98) (962) 1 576 (11,007)Finance lease payables (198) – 45 – (13) – – (166)Net derivative financial instruments 453 (21) (94) – 613 – 52 1,003Net debt of the disposal group – – – – – 5 – 5 (6,790) 124 235 (91) (330) – 14 (6,838)
* See Note 1 Accounting policies for details of reclassifications.** These amounts relate to the net debt excluding Tesco Bank but including the disposal group.
138 Tesco PLC Annual Report and Financial Statements 2012

STRATEGIC REVIEW PERFORMANCE REVIEW GOVERNANCE FINANCIAL STATEMENTSOVERVIEW
Note 31 Business combinations and other acquisitions
Business combinationsDuring the financial year, the Group completed five business combination transactions as follows:
i) 18 March 2011 – Acquired 100% of the ordinary share capital relating to the 77 stores of Mills Group in the UK for a cash consideration of £10m;
ii) 1 April 2011 – Acquired 100% of the ordinary share capital relating to the 87 franchised kiosks and 47 stores branded as Zabka and Koruna in the Czech Republic for a cash consideration of £36m;
iii) 18 April 2011 – Acquired 80.25% of the ordinary share capital of Blinkbox Entertainment Limited in the UK for a cash consideration of £3m;
iv) 8 June 2011 – Acquired 100% of the ordinary share capital of BzzAgent Inc and BzzAgent Limited for a cash consideration of £9m and deferred contingent consideration of £15m; and
v) 18 August 2011 – Acquired the remaining 50% of the ordinary share capital of its joint venture Multi Veste Czech Republic 9, s.r.o not already owned by the Group for a total consideration of £24m, split equally between cash and equity.
The table below sets out the provisional fair values to the Group in respect of these acquisitions.Provisional
fair values on acquisition
£m
Non-current assets 107Current assets 25Cash 5Current liabilities (41)Non-current liabilities (98)Net liabilities acquired (2)Non-controlling interests (1)Goodwill arising on acquisition 100
97Consideration:Cash 70Non-cash 27Total consideration 97
The goodwill represents synergies within the operating models and the economies of scale expected from incorporating the operations of acquired entities within the Group.
Purchase of non-controlling interestOn 1 July 2011, the Group completed the acquisition of the remaining 6% of the ordinary share capital of Homeplus Co., Limited for a cash consideration of £73m.
Note 32 Commitments and contingencies
Capital commitmentsAt 25 February 2012, there were commitments for capital expenditure contracted for, but not provided for of £1,599m (2011: £1,719m), principally relating to the store development programme.
Contingent liabilitiesFor details of assets held under finance leases, which are pledged as security for the finance lease liabilities, see Note 11.
There are a number of contingent liabilities that arise in the normal course of business which if realised are not expected to result in a material liability to the Group. The Group recognises provisions for liabilities when it is more likely than not that a settlement will be required and the value of such a payment can be reliably estimated.
Tesco BankAt 25 February 2012, Tesco Bank had commitments of formal standby facilities, credit lines and other commitments to lend, totalling £7.4bn (2011: £7.1bn). The amount is intended to provide an indication of the potential volume of business and not of the underlying credit or other risks.
The Financial Services Compensation Scheme (‘FSCS’) is the UK statutory fund of last resort for customers of authorised financial services institutions and pays compensation if an institution is unable to pay claims against it. The FSCS has borrowed from HM Treasury to fund these compensation costs associated with institutions that failed in 2008 and will receive receipts from asset sales, surplus cash flow and other recoveries from these institutions in the future. The initial borrowings from HM Treasury are on an interest-only basis and, from 1 April 2012, this has increased from 12 month LIBOR + 30 basis points to 12 month LIBOR + 100 basis points.
The FSCS meets its obligations by raising management expense levies which will be kept based on limits advised by the FSA. These include amounts to cover the interest on its borrowings and compensation levies on the industry.
Each deposit-taking institution contributes in proportion to its share of total protected deposits. As at 25 February 2012, Tesco Bank accrued £5m (2011: £3m) in respect of its current obligation to meet expenses levies, based on indicative costs published by the FSCS.
If the FSCS does not receive sufficient funds from the failed institutions to repay HM Treasury in full it will raise compensation levies. At this time it is not possible to estimate the amount or timing of any shortfall resulting from the cash flows received from the failed institutions and, accordingly, no provision for compensation levies, which could be significant, has been made in these financial statements.
Tesco PLC Annual Report and Financial Statements 2012 139

Notes to the Group financial statements
Note 33 Capital resources
The following table shows the composition of regulatory capital resources of Tesco Personal Finance PLC (‘TPF’), being the regulated entity, at the balance sheet date:
2012£m
2011 £m
Tier 1 capital: Shareholders’ funds and non-controlling interests 714 761Tier 2 capital: Qualifying subordinated debt 375 235Other interests 22 18Supervisory deductions (365) (365)Total regulatory capital 746 649
The movement of tier 1 capital during the financial year is analysed as follows:
2012£m
2011 £m
At beginning of the year 761 576Share capital and share premium 112 446Profit attributable to shareholders 65 57Other reserves 6 –Ordinary dividends (108) (162)Increase in intangible assets (122) (156)At end of the year 714 761
It is TPF’s policy to maintain a strong capital base, to expand it as appropriate and to utilise it efficiently throughout its activities to optimise the return to shareholders while maintaining a prudent relationship between the capital base and the underlying risks of the business. In carrying out this policy, TPF has regard to the supervisory requirements of the FSA. TPF has carried regulatory capital reserves in excess of its capital requirements throughout the financial year.
Note 34 Leasing commitments
Finance lease commitments – Group as lesseeThe Group has finance leases for various items of plant, equipment, fixtures and fittings. There are also a small number of buildings which are held under finance leases. The fair value of the Group’s lease obligations approximate to their carrying value.
Future minimum lease payments under finance leases and hire purchase contracts, together with the present value of the net minimum lease payments, are as follows:
Minimum lease paymentsPresent value of
minimum lease payments
2012£m
2011£m
2012£m
2011£m
Within one year 39 56 32 50Greater than one year but less than five years 58 81 20 44After five years 222 206 114 104Total minimum lease payments 319 343 166 198Less future finance charges (153) (145)Present value of minimum lease payments 166 198 Analysed as:Current finance lease payables 32 50Non-current finance lease payables 134 148 166 198
140 Tesco PLC Annual Report and Financial Statements 2012

STRATEGIC REVIEW PERFORMANCE REVIEW GOVERNANCE FINANCIAL STATEMENTSOVERVIEW
Note 34 Leasing commitments continued
Operating lease commitments – Group as lesseeFuture minimum rentals payable under non-cancellable operating leases are as follows:
2012£m
2011£m
Within one year 1,289 1,138Greater than one year but less than five years 4,797 4,246After five years 11,237 10,631Total minimum lease payments 17,323 16,015
Future minimum rentals payable under non-cancellable operating leases after five years are analysed further as follows:
2012£m
2011£m
Greater than five years but less than ten years 4,667 4,203Greater than ten years but less than fifteen years 3,245 3,023After fifteen years 3,325 3,405Total minimum lease payments – after five years 11,237 10,631
Future minimum rentals payable under non-cancellable operating leases associated with the discontinued operations in Japan included in the above tables amount to £nil (2011: £132m). See Note 7 for further details on discontinued operations.
Operating lease payments represent rentals payable by the Group for certain of its retail, distribution and office properties and other assets such as motor vehicles. The leases have varying terms, purchase options, escalation clauses and renewal rights.
The Group has lease break options on certain sale and leaseback transactions, which are exercisable if an existing option to buy back leased assets at market value at a specified date is also exercised, no commitment has been included in respect of the buy-back option as the option is at the Group’s discretion. The Group is not obliged to pay lease rentals after that date, therefore minimum lease payments exclude those falling after the buy-back date.
Operating lease commitments with joint ventures Since 1988 the Group has entered into several joint ventures and sold and leased back properties to and from these joint ventures. The terms of these sale and leasebacks vary, however, common factors include: the sale of the properties to the joint venture at market value; options within the lease for the Group to repurchase the properties at market value; market rent reviews; and 20 to 30 full-year lease terms. The Group reviews the substance as well as the form of the arrangements when determining the classification of leases as operating or finance. All of the leases under these arrangements are operating leases.
Operating lease receivables – Group as lessorThe Group both rents out its properties and also sublets various leased buildings under operating leases. At the balance sheet date, the following future minimum lease payments are contractually receivable from tenants:
2012£m
2011£m
Within one year 241 286Greater than one year but less than five years 398 537After five years 297 306Total minimum lease receivables 936 1,129
Note 35 Events after the reporting period
On 5 March 2012, Ek-Chai Distribution System Co. Ltd. (‘Tesco Lotus’), announced the final offering price of the Initial Public Offering of Tesco Lotus Retail Growth Freehold and Leasehold Property (‘TLGF’). Tesco Lotus subscribed for 25% of the available units in TLGF. The units commenced trading on the Stock Exchange of Thailand on 19 March 2012.
Tesco PLC Annual Report and Financial Statements 2012 141
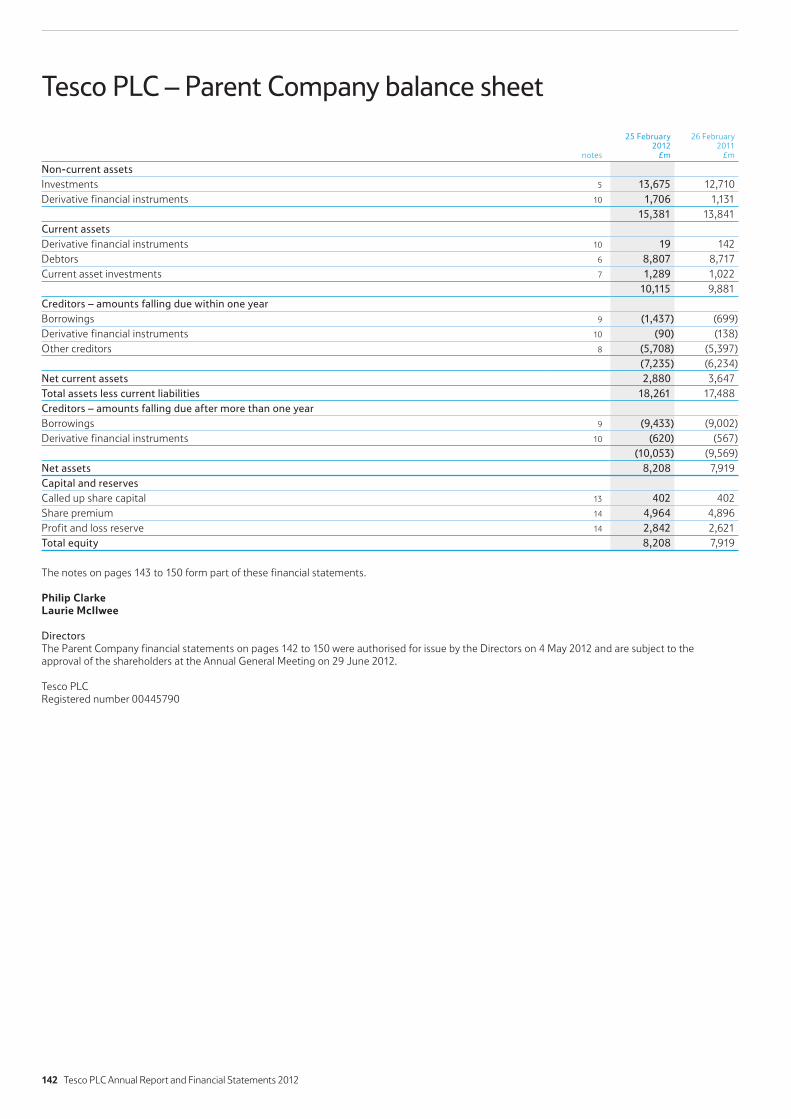
Tesco PLC – Parent Company balance sheet
notes
25 February2012
£m
26 February2011
£m
Non-current assetsInvestments 5 13,675 12,710Derivative financial instruments 10 1,706 1,131 15,381 13,841Current assetsDerivative financial instruments 10 19 142Debtors 6 8,807 8,717Current asset investments 7 1,289 1,022 10,115 9,881Creditors – amounts falling due within one yearBorrowings 9 (1,437) (699)Derivative financial instruments 10 (90) (138)Other creditors 8 (5,708) (5,397) (7,235) (6,234)Net current assets 2,880 3,647Total assets less current liabilities 18,261 17,488Creditors – amounts falling due after more than one yearBorrowings 9 (9,433) (9,002)Derivative financial instruments 10 (620) (567) (10,053) (9,569)Net assets 8,208 7,919Capital and reservesCalled up share capital 13 402 402Share premium 14 4,964 4,896Profit and loss reserve 14 2,842 2,621Total equity 8,208 7,919
The notes on pages 143 to 150 form part of these financial statements.
Philip Clarke Laurie McIlwee
Directors The Parent Company financial statements on pages 142 to 150 were authorised for issue by the Directors on 4 May 2012 and are subject to the approval of the shareholders at the Annual General Meeting on 29 June 2012.
Tesco PLC Registered number 00445790
142 Tesco PLC Annual Report and Financial Statements 2012

STRATEGIC REVIEW PERFORMANCE REVIEW GOVERNANCE FINANCIAL STATEMENTSOVERVIEW
Notes to the Parent Company financial statements
Basis of preparationThe Parent Company financial statements have been prepared on a going concern basis using the historical cost convention modified for the revaluation of certain financial instruments and in accordance with generally accepted accounting principles (‘UK GAAP’) and the Companies Act 2006.
The financial year represents the 52 weeks to 25 February 2012 (prior financial year 52 weeks to 26 February 2011).
A summary of the Company’s significant accounting policies is set out below.
ExemptionsThe Directors have taken advantage of the exemption available under section 408 of the Companies Act 2006 and not presented a Profit and Loss Account for the Company alone.
The Company has taken advantage of the FRS 29 ‘Financial Instruments: Disclosures’, exemption and not provided derivative financial instrument disclosures of the Company alone.
The Company has also taken advantage of the exemption from preparing a Cash Flow statement under the terms of FRS 1 ‘Cash Flow Statement’. The cash flows of the Company are included in the Tesco Group financial statements.
The Company is also exempt under the terms of FRS 8 ‘Related Parties’ from disclosing related party transactions with entities that are part of the Tesco Group.
Current asset investmentsCurrent asset investments relate to money market deposits which are recognised initially at fair value, and subsequently at amortised cost. All income from these investments is included in the Profit and Loss Account as interest receivable and similar income.
Investments in subsidiaries and joint venturesInvestments in subsidiaries and joint ventures are stated at cost less, where appropriate, provisions for impairment.
Foreign currenciesAssets and liabilities that are denominated in foreign currencies are translated into Pounds Sterling at the exchange rates prevailing at the balance sheet date of the financial year.
Share-based paymentsThe fair value of employee share option plans is calculated at the grant date using the Black-Scholes model. The resulting cost is charged to the Parent Company Profit and Loss Account over the vesting period. The value of the charge is adjusted to reflect expected and actual levels of vesting.
Where the Company awards options to employees of subsidiary entities, this is treated as a capital contribution.
Financial instrumentsFinancial assets and financial liabilities are recognised on the Company’s Balance Sheet when the Company becomes a party to the contractual provisions of the instrument.
DebtorsDebtors are recognised initially at fair value, and subsequently at amortised cost using the effective interest rate method, less provision for impairment.
Financial liabilities and equity instrumentsFinancial liabilities and equity instruments are classified according to the substance of the contractual arrangements entered into. An equity instrument is any contract that gives a residual interest in the assets of the Company after deducting all of its liabilities. Equity instruments issued by the Company are recorded as the proceeds received, net of direct issue costs.
BorrowingsInterest-bearing bank loans and overdrafts are initially recognised at the value of the amount received, net of attributable transaction costs. Subsequent to initial recognition, interest-bearing borrowings are stated at amortised cost with any differences between cost and redemption value being recognised in the Company Profit and Loss Account over the period of the borrowings on an effective interest basis.
Other creditorsOther creditors are recognised initially at fair value, and subsequently at amortised cost using the effective interest rate method.
Derivative financial instruments and hedge accountingThe Company uses derivative financial instruments to hedge its exposure to foreign exchange and interest rate risks arising from operating, financing and investing activities. The Company does not hold or issue derivative financial instruments for trading purposes.
Derivative financial instruments are recognised and stated at fair value. Where derivatives do not qualify for hedge accounting, any gains or losses on remeasurement are immediately recognised in the Company Profit and Loss Account. Where derivatives qualify for hedge accounting, recognition of any resultant gain or loss depends on the nature of the hedge relationship and the items being hedged.
In order to qualify for hedge accounting, the Company is required to document from inception, the relationship between the item being hedged and the hedging instrument. The Company is also required to document and demonstrate an assessment of the relationship between the hedged item and the hedging instrument, which shows that the hedge will be highly effective on an ongoing basis. This effectiveness testing is performed at each reporting date to ensure that the hedge remains highly effective.
Derivative financial instruments with maturity dates of more than one year from the balance sheet date are disclosed as falling due after more than one year.
Note 1 Accounting policies
Tesco PLC Annual Report and Financial Statements 2012 143

Fair value hedgingDerivative financial instruments are classified as fair value hedges when they hedge the Company’s exposure to changes in the fair value of a recognised asset or liability. Changes in the fair value of derivatives that are designated and qualify as fair value hedges are recorded in the Company Profit and Loss Account, together with any changes in the fair value of the hedged item that is attributable to the hedged risk.
Cash flow hedgingDerivative financial instruments are classified as cash flow hedges when they hedge the Company’s exposure to variability in cash flows that are either attributable to a particular risk associated with a recognised asset or liability, or a highly probable forecasted transaction.
The effective element of any gain or loss from remeasuring the derivative instrument is recognised directly in equity.
The associated cumulative gain or loss is removed from equity and recognised in the Company Profit and Loss Account in the same period during which the hedged transaction affects the Company Profit and Loss Account. The classification of the effective portion when recognised in the Company Profit and Loss Account is the same as the classification of the hedged transaction. Any element of the remeasurement criteria of the derivative instrument which does not meet the criteria for an effective hedge is recognised immediately in the Company Profit and Loss Account.
Hedge accounting is discontinued when the hedging instrument expires or is sold, terminated or exercised, no longer qualifies for hedge accounting or is de-designated. At that point in time, any cumulative gain or loss on the hedging instrument recognised in equity is retained in equity until the forecasted transaction occurs or the original hedged item affects the Parent Company Profit and Loss Account. If a forecasted hedged transaction is no longer expected to occur, the net cumulative gain or loss recognised in equity is transferred to the Company Profit and Loss Account.
PensionsThe Company participates in the Tesco PLC Pension Scheme which is a multi-employer scheme within the Tesco Group and cannot identify its share of the underlying assets and liabilities of the scheme. Accordingly, as permitted by FRS 17 ‘Retirement Benefits’, the Company has accounted for the scheme as a defined contribution scheme, and the charge for the period is based upon the cash contributions payable.
TaxationCorporation tax payable is provided on the taxable profit for the year, using the tax rates enacted or substantively enacted by the Balance Sheet date.
Deferred tax is recognised in respect of all timing differences that have originated but not reversed at the Balance Sheet date and would give rise to an obligation to pay more or less tax in the future.
Deferred tax assets are recognised to the extent that they are recoverable. They are regarded as recoverable to the extent that on the basis of all available evidence, it is regarded as more likely than not that there will be suitable taxable profits from which the future reversal of the underlying timing differences can be deducted.
Deferred tax is measured on a non-discontinued basis at the tax rates that are expected to apply in the periods in which the timing differences reverse, based on tax rates and laws that have been substantively enacted by the Balance Sheet date.
Note 1 Accounting policies continued
Notes to the Parent Company financial statements
144 Tesco PLC Annual Report and Financial Statements 2012

STRATEGIC REVIEW PERFORMANCE REVIEW GOVERNANCE FINANCIAL STATEMENTSOVERVIEW
Note 2 Auditor remuneration 2012
£m2011
£m
Fees payable to the Company’s auditor for the audit of the Company and Group financial statements 0.7 0.6
Note 3 Employment costs, including Directors’ remuneration2012
£m2011
£m
Wages and salaries 16 14Social security costs 2 2Pension costs 1 1Share-based payment expense 7 26 26 43
The average number of employees (all Directors of the Company) during the financial year was 15 (2011: 16).
The Schedule VI requirements for Directors’ remuneration are included within the Directors’ remuneration report on pages 64 to 86.
Note 4 Dividends
For details of dividends see Note 8 in the Group financial statements.
Note 5 InvestmentsShares in Group
undertakings£m
Shares in joint ventures
£mTotal
£m
Cost At 26 February 2011 13,229 16 13,245Additions 969 – 969Disposals (4) – (4)At 25 February 2012 14,194 16 14,210
ImpairmentAt 26 February 2011 535 – 535At 25 February 2012 535 – 535
Net carrying valueAt 25 February 2012 13,659 16 13,675At 26 February 2011 12,694 16 12,710
For a list of the Company’s principal operating subsidiary undertakings and joint ventures see Note 13 in the Group financial statements.
Tesco PLC Annual Report and Financial Statements 2012 145

Note 6 Debtors2012
£m2011
£m
Amounts owed by group undertakings 8,611 8,520Amounts owed by joint ventures and associates* 177 178Other debtors 15 13Deferred tax asset** 4 6
8,807 8,717
Amounts owed by group undertakings are either interest-bearing or non interest-bearing depending on the type and duration of debtor relationship.
* The amounts owed by joint ventures and associates of £117m (2011: £178m) are due after more than one year. ** The deferred tax asset recognised by the Company, and the movements thereon, during the financial year are as follows:
Financial instruments
£m
Other timingdifferences
£mTotal
£m
At 26 February 2011 8 (2) 6Charge to the Profit and Loss Account for the year (2) – (2)At 25 February 2012 6 (2) 4
Note 7 Current asset investments2012
£m2011
£m
Short-term investments 1,243 1,022Short-term deposits and cash at bank 46 –
1,289 1,022
Note 8 Other creditors2012
£m2011
£m
Amounts falling due within one year: Other tax and social security 2 2Amounts owed to group undertakings 5,640 5,217 Other liabilities 66 178 5,708 5,397
Amounts owed to group undertakings are either interest-bearing or non interest-bearing depending on the type and duration of creditor relationship.
Notes to the Parent Company financial statements
146 Tesco PLC Annual Report and Financial Statements 2012
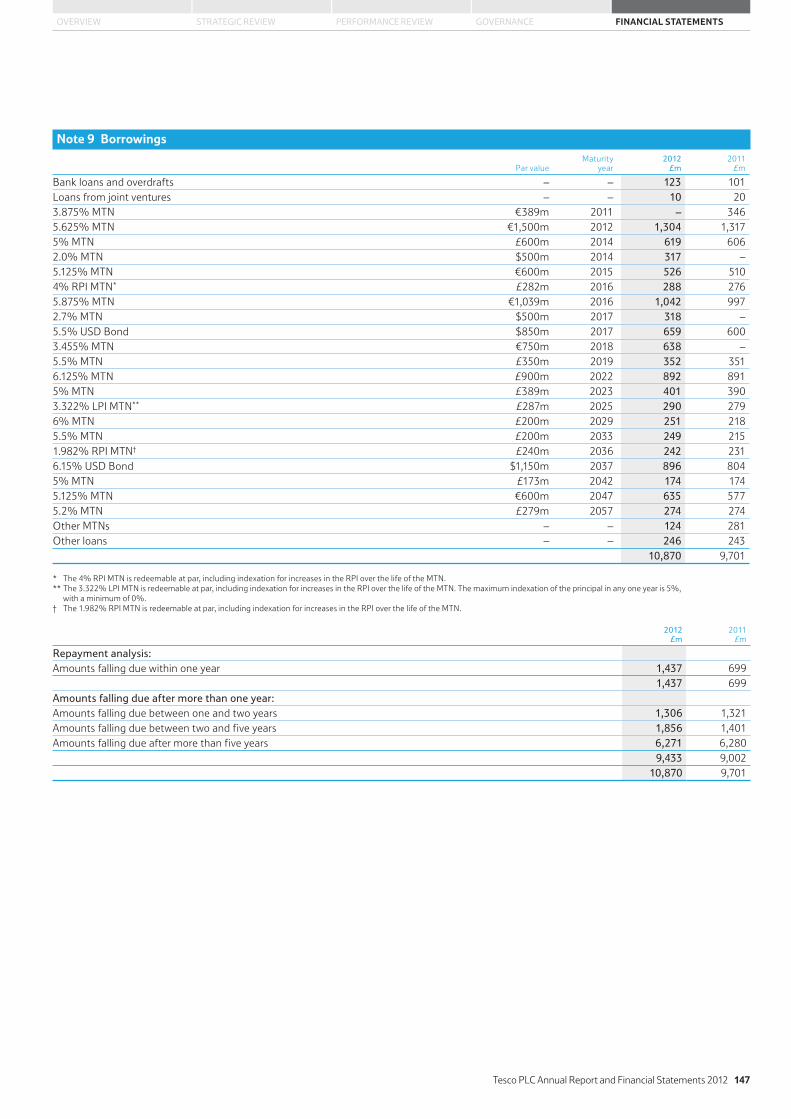
STRATEGIC REVIEW PERFORMANCE REVIEW GOVERNANCE FINANCIAL STATEMENTSOVERVIEW
Note 9 Borrowings
Par valueMaturity
year2012
£m2011
£m
Bank loans and overdrafts – – 123 101Loans from joint ventures – – 10 203.875% MTN €389m 2011 – 3465.625% MTN €1,500m 2012 1,304 1,3175% MTN £600m 2014 619 6062.0% MTN $500m 2014 317 –5.125% MTN €600m 2015 526 5104% RPI MTN* £282m 2016 288 2765.875% MTN €1,039m 2016 1,042 9972.7% MTN $500m 2017 318 –5.5% USD Bond $850m 2017 659 6003.455% MTN €750m 2018 638 –5.5% MTN £350m 2019 352 3516.125% MTN £900m 2022 892 8915% MTN £389m 2023 401 3903.322% LPI MTN** £287m 2025 290 2796% MTN £200m 2029 251 2185.5% MTN £200m 2033 249 2151.982% RPI MTN† £240m 2036 242 2316.15% USD Bond $1,150m 2037 896 8045% MTN £173m 2042 174 1745.125% MTN €600m 2047 635 5775.2% MTN £279m 2057 274 274Other MTNs – – 124 281Other loans – – 246 243 10,870 9,701
* The 4% RPI MTN is redeemable at par, including indexation for increases in the RPI over the life of the MTN.** The 3.322% LPI MTN is redeemable at par, including indexation for increases in the RPI over the life of the MTN. The maximum indexation of the principal in any one year is 5%,
with a minimum of 0%.† The 1.982% RPI MTN is redeemable at par, including indexation for increases in the RPI over the life of the MTN.
2012£m
2011£m
Repayment analysis:Amounts falling due within one year 1,437 699 1,437 699Amounts falling due after more than one year:Amounts falling due between one and two years 1,306 1,321Amounts falling due between two and five years 1,856 1,401Amounts falling due after more than five years 6,271 6,280 9,433 9,002 10,870 9,701
Tesco PLC Annual Report and Financial Statements 2012 147

Note 10 Derivative financial instruments
The fair value of derivative financial instruments has been disclosed in the Company’s Balance Sheet as:
2012 2011
Asset
£mLiability
£mAsset
£mLiability
£m
Current 19 (90) 142 (138)Non-current 1,706 (620) 1,131 (567)Total 1,725 (710) 1,273 (705)
2012 2011
Asset Liability Asset Liability
Fair value
£mNotional
£mFair value
£mNotional
£mFair value
£mNotional
£mFair value
£mNotional
£m
Fair value hedgesInterest rate swaps and similar
instruments 81 1,065 – – 13 665 (21) 400Cross currency swaps 818 2,686 (8) 269 728 2,674 (39) 714Cash flow hedgesInterest rate swaps and similar
instruments – – (132) 400 – – (54) 400Cross currency swaps 233 304 (41) 988 126 298 (151) 784Index-linked swaps 30 809 – – – – (8) 772Forward foreign currency contracts 1 285 (4) 616 – – (1) 145Net investment hedgesForward foreign currency contracts – – (7) 969 19 383 (97) 952Cash flow hedge and net
investment hedgesCross currency swaps – – (1) 318 – – – –Derivatives not in a formal
hedge relationshipIndex-linked swaps 539 3,089 (468) 3,089 377 2,639 (310) 2,639Forward foreign currency contracts 23 782 (49) 1,034 10 400 (24) 550Total 1,725 9,020 (710) 7,683 1,273 7,059 (705) 7,356
Note 11 Share-based payments
The Company’s equity-settled share-based payment schemes comprise various share schemes designed to reward Executive Directors. For further information on these schemes, including the valuation models and assumptions used, see Note 25 in the Group financial statements.
Share option schemes The number of options and WAEP of share option schemes relating to the Company employees are:
For the year ended 25 February 2012
Savings-relatedshare option scheme
Approvedshare option scheme
Unapprovedshare option scheme
Nil costshare options
Options WAEP Options WAEP Options WAEP Options WAEP
Outstanding at26 February 2011 33,834 342.93 64,330 373.06 14,368,570 385.59 12,399,127 0.00
Granted 4,944 364.00 – – – – 4,742,273 0.00Forfeited (5,028) 343.54 – – – – (603,508) 0.00Exercised (7,838) 313.89 – – – – (507,617) 0.00Outstanding at
25 February 2012 25,912 355.62 64,330 373.06 14,368,570 385.59 16,030,275 0.00Exercisable as at
25 February 2012 – – 28,600 314.68 7,413,586 395.27 9,468,818 0.00Exercise price range
(pence) – – –312.75
to 318.60 –312.75
to 473.75 – 0.00Weighted average remaining
contractual life (years) – – – 3.51 – 4.98 – 6.12
Notes to the Parent Company financial statements
148 Tesco PLC Annual Report and Financial Statements 2012

STRATEGIC REVIEW PERFORMANCE REVIEW GOVERNANCE FINANCIAL STATEMENTSOVERVIEW
Note 11 Share-based payments continued
For the year ended 26 February 2011
Savings-relatedshare option scheme
Approvedshare option scheme
Unapprovedshare option scheme
Nil costshare options
Options WAEP Options WAEP Options WAEP Options WAEP
Outstanding at27 February 2010 36,106 315.87 53,381 280.99 14,549,529 347.65 9,185,455 0.00
Granted 5,516 386.00 35,730 419.80 3,150,544 419.80 4,148,918 0.00Forfeited – – – – – – (499,596) 0.00Exercised (7,788) 248.00 (24,781) 242.11 (3,331,503) 252.23 (435,650) 0.00Outstanding at
26 February 2011 33,834 342.93 64,330 373.06 14,368,570 385.59 12,399,127 0.00Exercisable as at
26 February 2011 – – 28,600 314.68 4,797,618 377.97 3,744,903 0.00Exercise price range
(pence) – – –312.75
to 318.60 –312.75
to 473.75 – 0.00Weighted average remaining
contractual life (years) – – – 4.51 – 5.30 – 6.74
Share bonus schemes The number and WAFV of share bonuses awarded during the financial year relating to the Company employees are:
2012 2011
Shares
numberWAFVpence
Sharesnumber
WAFVpence
Shares in Success 5,045 416.26 5,766 416.23 Executive Incentive Scheme 195,497 411.75 292,085 388.05 Performance Share Plan 500,615 407.09 218,620 433.79 US Long-Term Incentive Plan – – 74,997 433.06
Note 12 Pensions
The total cost of the pension scheme to the Company was £1m (2011: £1m). Further disclosure relating to the Tesco PLC Pension Scheme can be found in Note 26 of the Group financial statements.
Note 13 Called up share capital2012 2011
Ordinary shares of 5p each Ordinary shares of 5p each
Number £m Number £m
Allotted, called up and fully paid:At beginning of the year 8,046,468,092 402 7,985,044,057 399Share options 23,490,825 1 36,535,102 2Share bonus awards 32,656,313 2 24,888,933 1Shares purchased for cancellation (70,802,785) (3) – –At end of the year 8,031,812,445 402 8,046,468,092 402
During the financial year, 23 million (2011: 37 million) ordinary shares of 5p each were issued in relation to share options for an aggregate consideration of £69m (2011: £97m).
During the financial year, 33 million (2011: 25 million) shares of 5p each were issued in relation to share bonus awards for an aggregate consideration of £2m (2011: £1m).
During the financial year the Company purchased and cancelled 70.8 million (2011: nil) shares of 5p each representing 1% (2011: 0%) of the called up share capital as at 25 February 2012 at an average price of £4.07 (2011: n/a) per share. The total consideration including expenses was £290m (2011: n/a). The excess of the consideration over the aggregate nominal value of the shares purchased has been charged to the profit and loss reserve.
Tesco PLC Annual Report and Financial Statements 2012 149

Note 13 Called up share capital continued
Between 26 February 2012 and 13 April 2012, options over 2,779,741 ordinary shares have been exercised under the terms of the Savings-related Share Option Scheme (1981) and the Irish Savings-related Share Option Scheme (2000). Between 26 February 2012 and 13 April 2012, options over 937,548 ordinary shares have been exercised under the terms of the Executive Share Option Schemes (1994 and 1996) and the Discretionary Share Option Plan (2004).
As at 25 February 2012, the Directors were authorised to purchase up to a maximum in aggregate of 803.6 million (2011: 802.1 million) ordinary shares.
The owners of ordinary shares are entitled to receive dividends as declared from time to time and are entitled to one vote per share at general meetings of the Company.
Capital redemption reserveUpon cancellation of the shares purchased as part of the share buy-back, a capital redemption reserve is created representing the nominal value of the shares cancelled. This is a non-distributable reserve. Details of the capital redemption reserve are set out in the Group Statement of Changes in Equity.
Note 14 Reserves2012
£m2011
£m
Share premiumAt beginning of the year 4,896 4,801Premium on issue of shares less costs 68 95At end of the year 4,964 4,896 Profit and loss reserveAt beginning of the year 2,621 2,731Share-based payments 111 161Shares purchased for cancellation – profit and loss reserve (290) –Shares purchased for cancellation – capital redemption reserve 3 –Dividends authorised in the year (1,180) (1,081)Losses on cash flow hedges 79 (6)Profit after tax for the year 1,498 816At end of the year 2,842 2,621
Notes to the Parent Company financial statements
150 Tesco PLC Annual Report and Financial Statements 2012

STRATEGIC REVIEW PERFORMANCE REVIEW GOVERNANCE FINANCIAL STATEMENTSOVERVIEW
Independent auditors’ report to the members of Tesco PLC
We have audited the Parent Company financial statements of Tesco PLC for the 52 weeks ended 25 February 2012 which comprise the Parent Company balance sheet and the related notes. The financial reporting framework that has been applied in their preparation is applicable law and United Kingdom Accounting Standards (United Kingdom Generally Accepted Accounting Practice).
Respective responsibilities of directors and auditors As explained more fully in the Statement of Directors’ responsibilities set out on page 88, the Directors are responsible for the preparation of the Parent Company financial statements and for being satisfied that they give a true and fair view. Our responsibility is to audit and express an opinion on the Parent Company financial statements in accordance with applicable law and International Standards on Auditing (UK and Ireland). Those standards require us to comply with the Auditing Practices Board’s Ethical Standards for Auditors.
This report, including the opinions, has been prepared for and only for the Company’s members as a body in accordance with Chapter 3 of Part 16 of the Companies Act 2006 and for no other purpose. We do not, in giving these opinions, accept or assume responsibility for any other purpose or to any other person to whom this report is shown or into whose hands it may come save where expressly agreed by our prior consent in writing.
Scope of the audit of the financial statementsAn audit involves obtaining evidence about the amounts and disclosures in the financial statements sufficient to give reasonable assurance that the financial statements are free from material misstatement, whether caused by fraud or error. This includes an assessment of: whether the accounting policies are appropriate to the Parent Company’s circumstances and have been consistently applied and adequately disclosed; the reasonableness of significant accounting estimates made by the Directors; and the overall presentation of the financial statements. In addition, we read all the financial and non-financial information in the Annual Report and Financial Statements to identify material inconsistencies with the audited financial statements. If we become aware of any apparent material misstatements or inconsistencies we consider the implications for our report.
Opinion on financial statements In our opinion the Parent Company financial statements:
give a true and fair view of the state of the Company’s affairs as at 25 February 2012;
have been properly prepared in accordance with United Kingdom Generally Accepted Accounting Practice; and
have been prepared in accordance with the requirements of the Companies Act 2006.
Opinion on other matters prescribed by the Companies Act 2006 In our opinion:
the part of the Directors’ Remuneration Report to be audited has been properly prepared in accordance with the Companies Act 2006; and
the information given in the Directors’ Report for the 52 weeks ended 25 February 2012 for which the Parent Company financial statements are prepared is consistent with the Parent Company financial statements.
Matters on which we are required to report by exception We have nothing to report in respect of the following matters where the Companies Act 2006 requires us to report to you if, in our opinion:
adequate accounting records have not been kept by the Parent Company, or returns adequate for our audit have not been received from branches not visited by us; or
the Parent Company financial statements and the part of the Directors’ Remuneration Report to be audited are not in agreement with the accounting records and returns; or
certain disclosures of Directors’ remuneration specified by law are not made; or
we have not received all the information and explanations we require for our audit.
Other matter We have reported separately on the Group financial statements of Tesco PLC for the 52 weeks ended 25 February 2012.
Richard Winter (Senior Statutory Auditor)for and on behalf of PricewaterhouseCoopers LLP Chartered Accountants and Statutory Auditors London 4 May 2012
Tesco PLC Annual Report and Financial Statements 2012 151

Five year record
2008 2009 2010 2011 1 2012 1
Financial statistics (£m)Sales including VAT excluding IFRIC 13 51,773 59,426 62,537 67,074 72,035Revenue excluding IFRIC 13 47,298 53,898 56,910 61,174 65,166
Operating profit2 2,791 3,1693 3,457 3,917 3,985Operating profit margin2 5.9% 5.9% 6.1% 6.4% 6.1%Share of post-tax profits of joint ventures and associates 75 110 33 57 91Net finance costs (63) (362) (314) (333) (241)Profit before tax 2,803 2,9173 3,176 3,641 3,835Taxation (673) (779) (840) (864) (879)Profit for the year from continuing operations 2,130 2,138 2,336 2,777 2,956Discontinued operations – – – (106) (142)Profit for the period 2,130 2,138 2,336 2,671 2,814Attributable to:Owners of the parent 2,124 2,1333 2,327 2,655 2,806Non-controlling interests 6 5 9 16 8Underlying profit before tax – continuing operations4 2,846 3,124 3,395 3,853 3,915
Other financial statistics
Diluted earnings per share – continuing operations 26.61p 26.96p 29.19p 34.25p 36.64pUnderlying diluted earnings per share – continuing operations 27.02p 28.87p 31.66p 36.26p 37.41pDividend per share5 10.90p 11.96p 13.05p 14.46p 14.76pReturn on capital employed (‘ROCE’)4 12.7%6 12.8%7 12.1% 12.9%8 13.3%Total shareholder return4 22.8% 8.0% 9.5% 6.7% (3.0%)Net debt (£m) 6,182 9,600 7,929 6,790 6,838Enterprise value9 (£m) 37,656 35,907 41,442 39,462 32,324
Retail statisticsNumber of stores 3,751 4,332 4,836 5,26510 6,234Total sales area – 000 sq ft11 76,86712 88,55612 95,23113 103,17210 112,433Average employees 444,127 468,508 472,094 488,347 519,671Average full-time equivalents 345,737 364,015 366,413 382,049 406,088
1 During the financial year, the Group announced its decision to sell its operations in Japan. Accordingly, these operations have been treated as discontinued in 2012. The 2011 statistics have been re-presented to be consistent with 2012. Prior years have not been re-presented.
2 Operating profit includes integration costs and profit arising on sale of fixed assets. Operating margin is based upon revenue excluding VAT.3 The Group adopted IFRIC 13 ‘Customer Loyalty Programmes’ and the amendments to IFRS 2 ‘Share-Based Payment’ from 24 February 2008. Periods before this date have not been restated.4 See glossary for definitions.5 Dividend per share relating to the interim and proposed final dividend.6 Using a ‘normalised’ tax rate before start-up costs in the US and Tesco Direct and excluding the impact of foreign exchange in equity and our acquisition of a majority share of Dobbies.7 Excluding acquisition of Tesco Bank and Homever, India start-up costs, and after adjusting for assets held for sale. Calculated on a 52-week basis, ROCE for 2009 is 12.8%.8 Includes Japan.9 Market capitalisation plus net debt.10 Includes franchise stores but excludes Japan.11 Store sizes exclude lobby and restaurant areas.12 Restated to include Dobbies stores.13 Restated to include Dobbies stores and account for a space restatement of 109,000 sq ft driven by a comprehensive remeasurement of One Stop stores.
152 Tesco PLC Annual Report and Financial Statements 2012

Financial calendar
Designed and produced by C O N R A N D E S I G N G R O U P
This Report is printed on Revive 100 Pure White Silk paper and has been independently certified on behalf of the Forest Stewardship Council® (FSC). The inks used are all vegetable oil based.
Printed at Pureprint Group Ltd, ISO14001, FSC certified and CarbonNeutral®
Financial year end 2011/12 25 February 2012Final ex-dividend date 25 April 2012Record date 27 April 2012Q1 Interim Management Statement 11 June 2012Annual General Meeting 29 June 2012Final dividend payment date 6 July 2012Half-year end 2012/13 25 August 2012Interim Results October 2012Q3 Interim Management Statement December 2012Financial year ended 2012/13 23 February 2013
Please note that dates are provisional and subject to change.
Glossary Capital expenditure: the additions to property, plant and equipment, investment property and intangible assets (excluding assets acquired under business combinations).
Capex % of sales: capital expenditure as defined above, divided by Group sales including VAT and excluding IFRIC 13.
Constant tax rate: using the prior year’s effective tax rate.
EBITDAR: operating profit before depreciation, amortisation, rent and movements in impairments of property, plant and equipment, investment property and intangible assets.
Fixed charge cover: the ratio of EBITDAR (excluding Tesco Bank EBITDAR) divided by financing costs (net interest excluding IAS 32 and 39 impacts and pension finance costs) plus operating lease expenses.
Gearing: net debt divided by total equity.
Net indebtedness: the ratio of adjusted net debt (net debt plus pension deficit and the present value of lease obligations) divided by EBITDAR (excluding Tesco Bank EBITDAR).
Return on capital employed: profit before interest and tax less tax at the effective rate of tax divided by the calculated average of opening and closing net assets plus net debt plus dividend creditor less net assets held for resale.
Total shareholder return: the notional return from a share, measured as the percentage change in the share price, plus the dividends paid with the gross dividends reinvested in Tesco shares. This is measured over a five-year period.
Underlying diluted earnings per share: underlying profit less tax at the effective tax rate and minority interest divided by the diluted weighted average number of shares in issue during the year.
Underlying profit before tax: underlying profit before tax excludes the impact of non-cash elements of IAS 17, 19, 32 and 39 (principally the impact of annual uplifts in rents and rent-free periods, pension costs, and the marking to market of financial instruments); the amortisation charge on intangible assets arising on acquisition and acquisition costs, and the non-cash impact of IFRIC 13. It also excludes restructuring and other one-off costs.

Tesco PLC Tesco House Delamare Road Cheshunt Hertfordshire EN8 9SL
www.tescoplc.com/ar2012