financial statements for 2013 - marel
TRANSCRIPT

1
Financial Statements
for 2013

3
Marel.com/ar2013
Marel’s annual report 2013 is for the first time a web-only edition. This is in line with the forward-thinking, innovative spirit of Marel and reflects the company’s emphasis on sustainability. On Marel.com/ar2013 you will find the complete report along with videos and other useful information. The report is accessible on all devices and can be downloaded in the Download Center found in the online report.
Marel’s Annual Report is a Web-Only Edition
GO TO
and explore our performance and outlook.
4 5
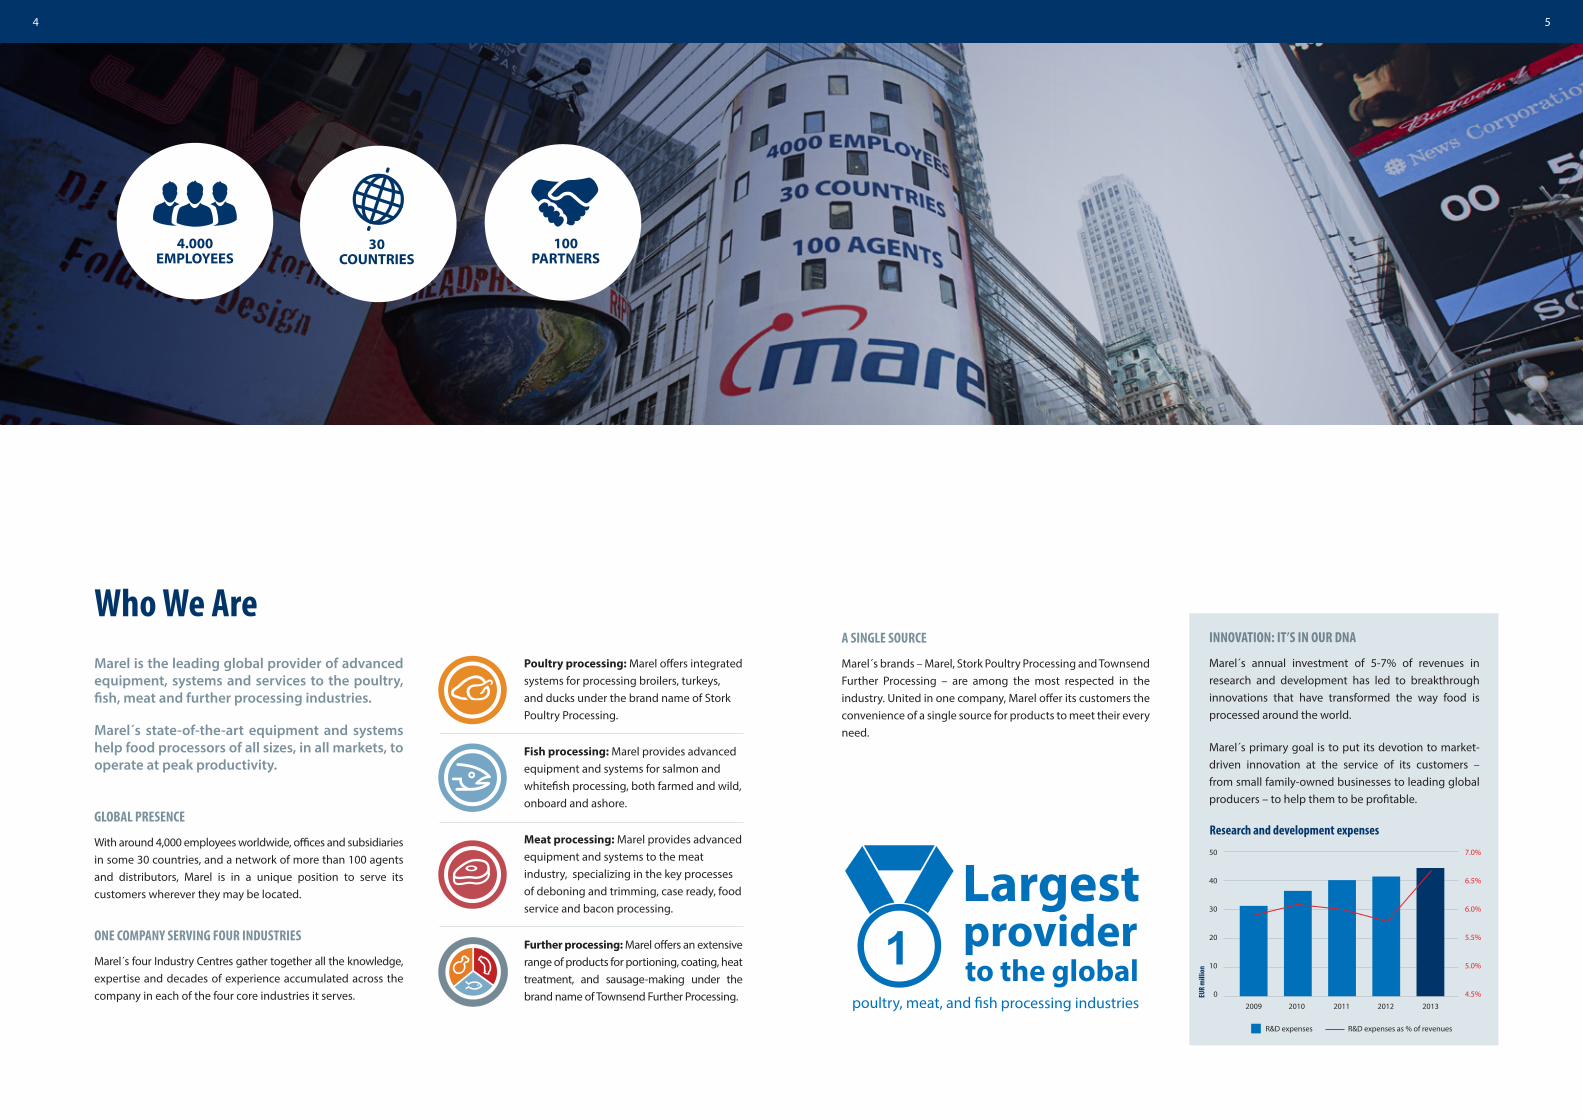
Marel is the leading global provider of advanced equipment, systems and services to the poultry, fish, meat and further processing industries.
Marel´s state-of-the-art equipment and systems help food processors of all sizes, in all markets, to operate at peak productivity.
GLOBAL PRESENCE
With around 4,000 employees worldwide, offices and subsidiaries in some 30 countries, and a network of more than 100 agents and distributors, Marel is in a unique position to serve its customers wherever they may be located.
ONE COMPANY SERVING FOUR INDUSTRIES
Marel´s four Industry Centres gather together all the knowledge, expertise and decades of experience accumulated across the company in each of the four core industries it serves.
Who We AreINNOVATION: IT’S IN OUR DNA
Marel´s annual investment of 5-7% of revenues in research and development has led to breakthrough innovations that have transformed the way food is processed around the world.
Marel´s primary goal is to put its devotion to market-driven innovation at the service of its customers – from small family-owned businesses to leading global producers – to help them to be profitable.
Poultry processing: Marel offers integrated systems for processing broilers, turkeys, and ducks under the brand name of Stork Poultry Processing.
Fish processing: Marel provides advanced equipment and systems for salmon and whitefish processing, both farmed and wild, onboard and ashore.
Meat processing: Marel provides advanced equipment and systems to the meat industry, specializing in the key processes of deboning and trimming, case ready, food service and bacon processing.
Further processing: Marel offers an extensive range of products for portioning, coating, heat treatment, and sausage-making under the brand name of Townsend Further Processing.
A SINGLE SOURCE
Marel´s brands – Marel, Stork Poultry Processing and Townsend Further Processing – are among the most respected in the industry. United in one company, Marel offer its customers the convenience of a single source for products to meet their every need.
4.000EMPLOYEES
30 COUNTRIES
100PARTNERS
20132012201120102009
7.0%
6.5%
6.0%
5.5%
5.0%
4.5%
50
40
30
20
10
0
Research and development expenses
EUR
mill
ion
R&D expenses R&D expenses as % of revenues
6 7
DIVIDEND
In 2011, the Board introduced a targeted capital structure for Marel of net debt in the range of 2-3 times earnings before interest, tax, depreciation, and amortization, where excess capital is used to stimulate growth and pay dividends to shareholders targeted at 20-40% of net profits.
In 2012 and 2013, dividends of €6.9 and €7.1 million, respectively, were paid to shareholders. In light of the current capital structure and upcoming refocusing program, the Board has proposed that no dividends will be paid for 2013.
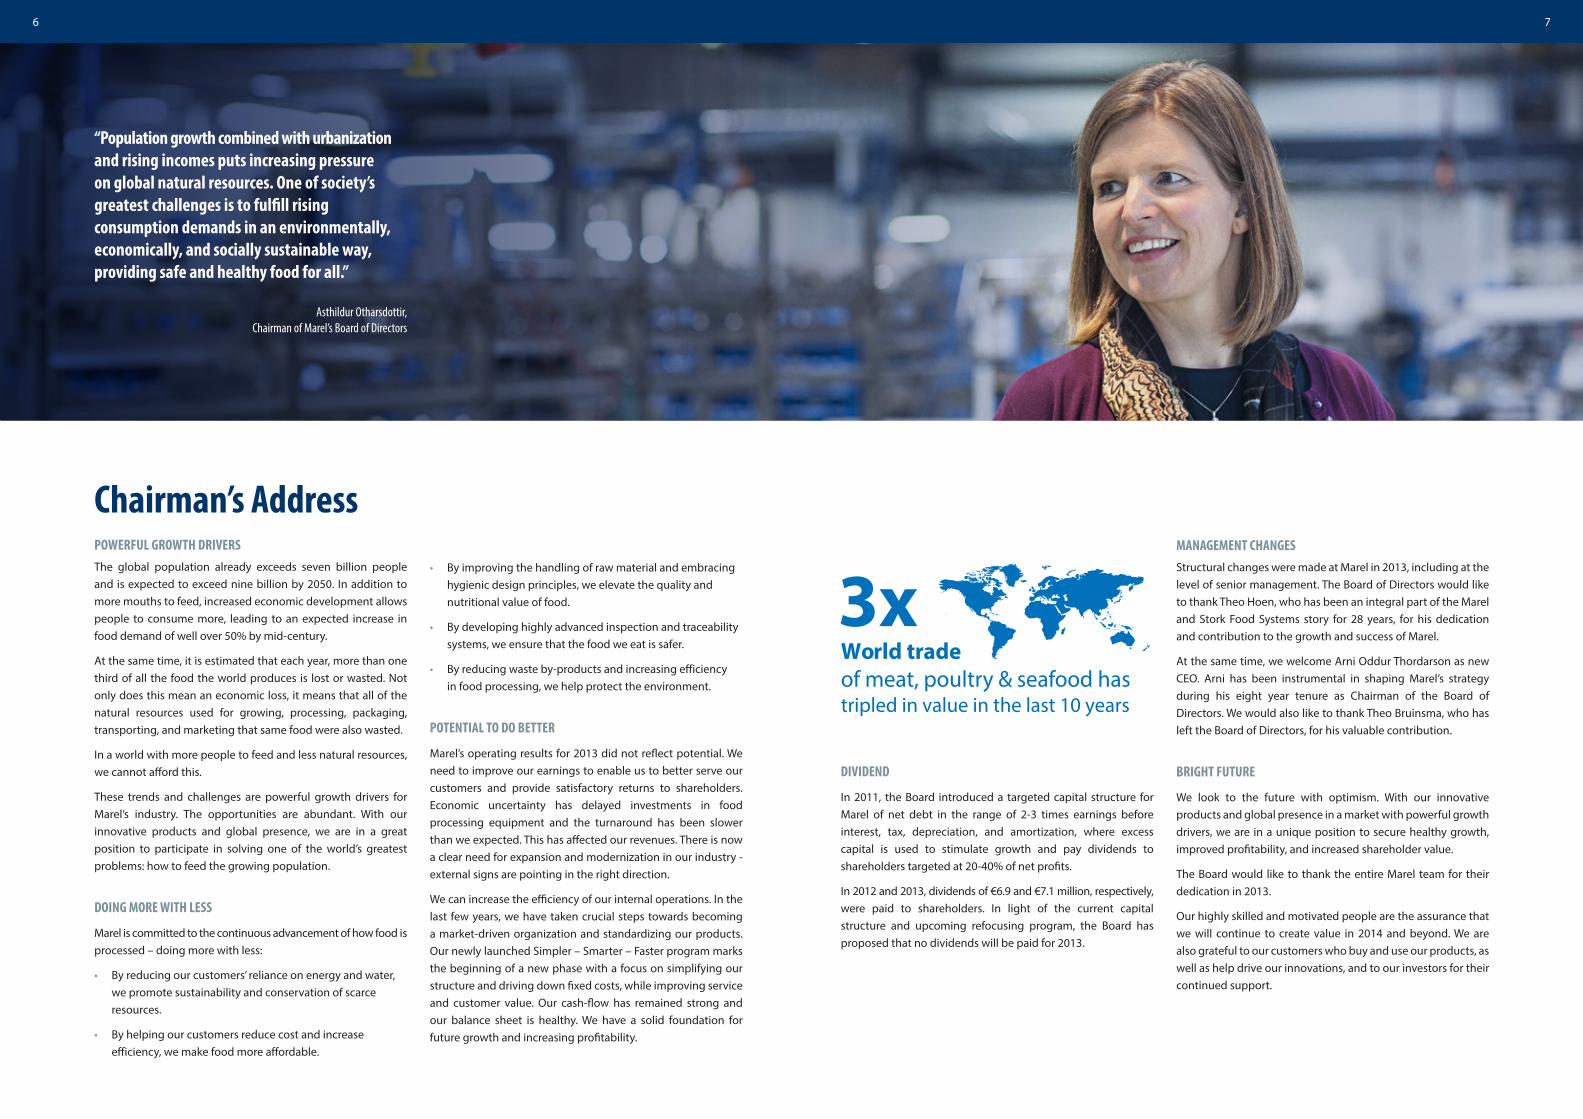
“Population growth combined with urbanization and rising incomes puts increasing pressure on global natural resources. One of society’s greatest challenges is to fulfill rising consumption demands in an environmentally, economically, and socially sustainable way, providing safe and healthy food for all.”
Asthildur Otharsdottir, Chairman of Marel’s Board of Directors
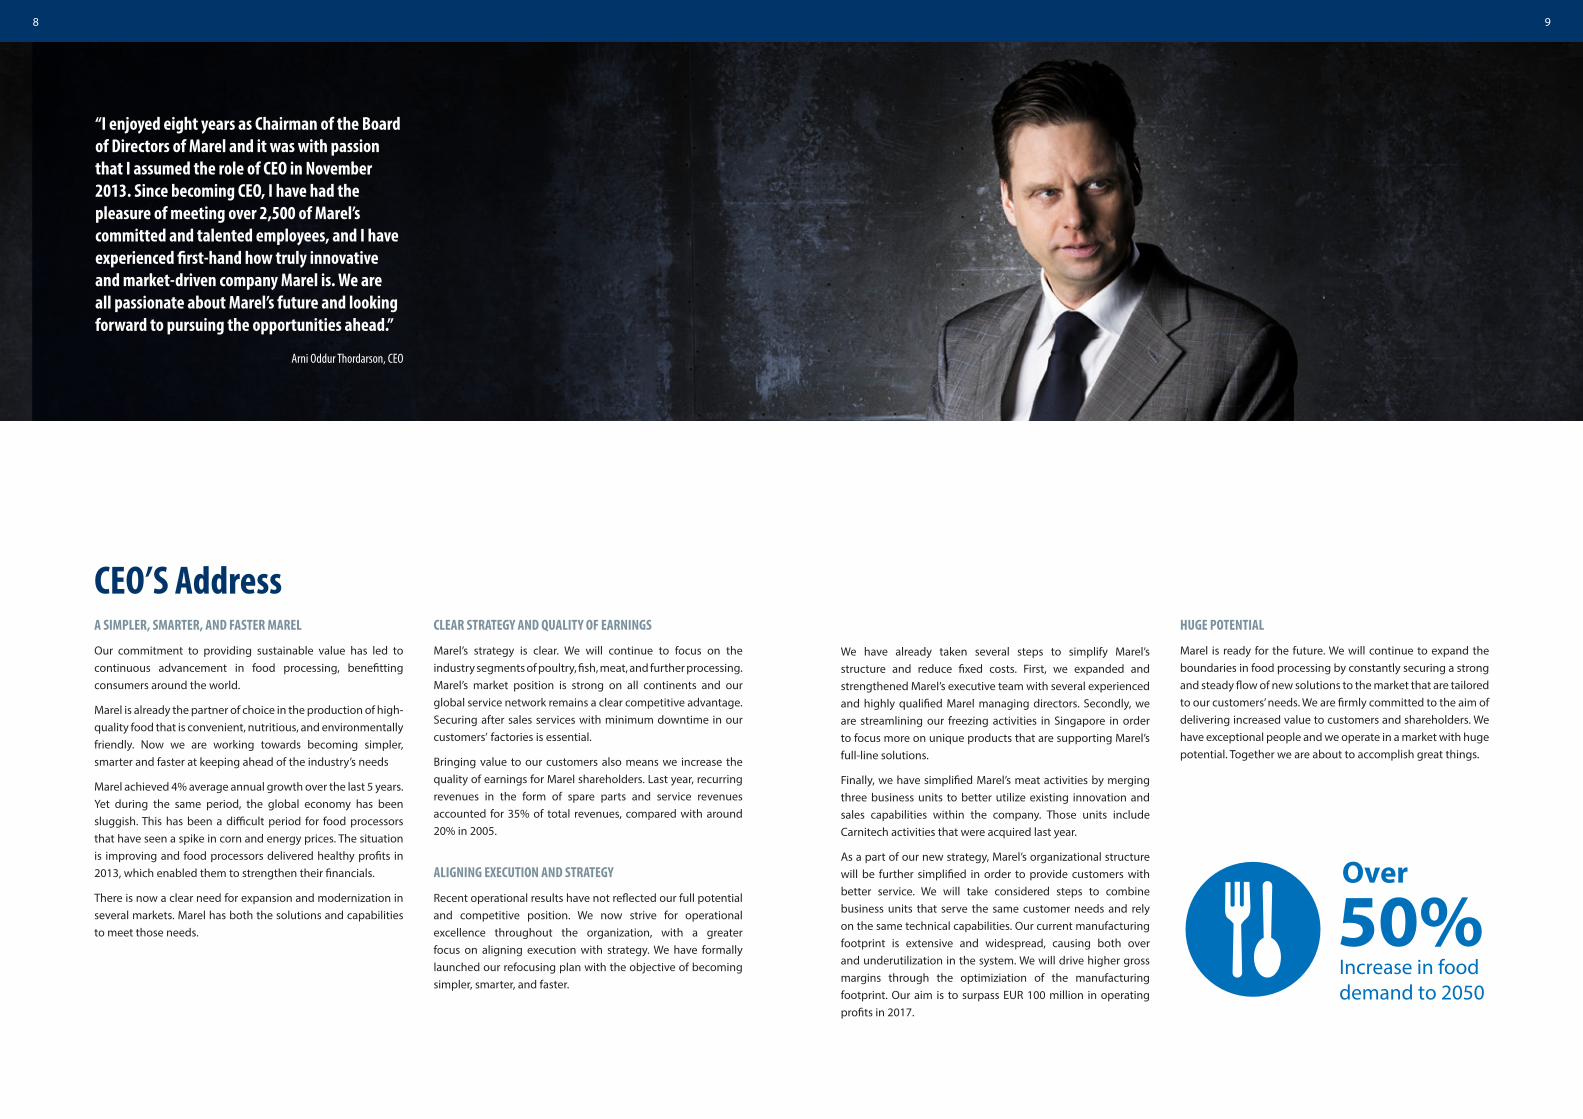
Chairman’s AddressPOWERFUL GROWTH DRIVERSThe global population already exceeds seven billion people and is expected to exceed nine billion by 2050. In addition to more mouths to feed, increased economic development allows people to consume more, leading to an expected increase in food demand of well over 50% by mid-century.
At the same time, it is estimated that each year, more than one third of all the food the world produces is lost or wasted. Not only does this mean an economic loss, it means that all of the natural resources used for growing, processing, packaging, transporting, and marketing that same food were also wasted.
In a world with more people to feed and less natural resources, we cannot afford this.
These trends and challenges are powerful growth drivers for Marel’s industry. The opportunities are abundant. With our innovative products and global presence, we are in a great position to participate in solving one of the world’s greatest problems: how to feed the growing population.
DOING MORE WITH LESS
Marel is committed to the continuous advancement of how food is processed – doing more with less:
• By reducing our customers’ reliance on energy and water, we promote sustainability and conservation of scarce resources.
• By helping our customers reduce cost and increase efficiency, we make food more affordable.
• By improving the handling of raw material and embracing hygienic design principles, we elevate the quality and nutritional value of food.
• By developing highly advanced inspection and traceability systems, we ensure that the food we eat is safer.
• By reducing waste by-products and increasing efficiency in food processing, we help protect the environment.
POTENTIAL TO DO BETTER
Marel’s operating results for 2013 did not reflect potential. We need to improve our earnings to enable us to better serve our customers and provide satisfactory returns to shareholders. Economic uncertainty has delayed investments in food processing equipment and the turnaround has been slower than we expected. This has affected our revenues. There is now a clear need for expansion and modernization in our industry - external signs are pointing in the right direction.
We can increase the efficiency of our internal operations. In the last few years, we have taken crucial steps towards becoming a market-driven organization and standardizing our products. Our newly launched Simpler – Smarter – Faster program marks the beginning of a new phase with a focus on simplifying our structure and driving down fixed costs, while improving service and customer value. Our cash-flow has remained strong and our balance sheet is healthy. We have a solid foundation for future growth and increasing profitability.
World trade of meat, poultry & seafood hastripled in value in the last 10 years
3xMANAGEMENT CHANGESStructural changes were made at Marel in 2013, including at the level of senior management. The Board of Directors would like to thank Theo Hoen, who has been an integral part of the Marel and Stork Food Systems story for 28 years, for his dedication and contribution to the growth and success of Marel.
At the same time, we welcome Arni Oddur Thordarson as new CEO. Arni has been instrumental in shaping Marel’s strategy during his eight year tenure as Chairman of the Board of Directors. We would also like to thank Theo Bruinsma, who has left the Board of Directors, for his valuable contribution.
BRIGHT FUTURE
We look to the future with optimism. With our innovative products and global presence in a market with powerful growth drivers, we are in a unique position to secure healthy growth, improved profitability, and increased shareholder value.
The Board would like to thank the entire Marel team for their dedication in 2013.
Our highly skilled and motivated people are the assurance that we will continue to create value in 2014 and beyond. We are also grateful to our customers who buy and use our products, as well as help drive our innovations, and to our investors for their continued support.
8 9
“I enjoyed eight years as Chairman of the Board of Directors of Marel and it was with passion that I assumed the role of CEO in November 2013. Since becoming CEO, I have had the pleasure of meeting over 2,500 of Marel’s committed and talented employees, and I have experienced first-hand how truly innovative and market-driven company Marel is. We are all passionate about Marel’s future and looking forward to pursuing the opportunities ahead.”
Arni Oddur Thordarson, CEO
CEO’S AddressA SIMPLER, SMARTER, AND FASTER MAREL
Our commitment to providing sustainable value has led to continuous advancement in food processing, benefitting consumers around the world.
Marel is already the partner of choice in the production of high-quality food that is convenient, nutritious, and environmentally friendly. Now we are working towards becoming simpler, smarter and faster at keeping ahead of the industry’s needs
Marel achieved 4% average annual growth over the last 5 years. Yet during the same period, the global economy has been sluggish. This has been a difficult period for food processors that have seen a spike in corn and energy prices. The situation is improving and food processors delivered healthy profits in 2013, which enabled them to strengthen their financials.
There is now a clear need for expansion and modernization in several markets. Marel has both the solutions and capabilities to meet those needs.
CLEAR STRATEGY AND QUALITY OF EARNINGS
Marel’s strategy is clear. We will continue to focus on the industry segments of poultry, fish, meat, and further processing. Marel’s market position is strong on all continents and our global service network remains a clear competitive advantage. Securing after sales services with minimum downtime in our customers’ factories is essential.
Bringing value to our customers also means we increase the quality of earnings for Marel shareholders. Last year, recurring revenues in the form of spare parts and service revenues accounted for 35% of total revenues, compared with around 20% in 2005.
ALIGNING EXECUTION AND STRATEGY
Recent operational results have not reflected our full potential and competitive position. We now strive for operational excellence throughout the organization, with a greater focus on aligning execution with strategy. We have formally launched our refocusing plan with the objective of becoming simpler, smarter, and faster.
We have already taken several steps to simplify Marel’s structure and reduce fixed costs. First, we expanded and strengthened Marel’s executive team with several experienced and highly qualified Marel managing directors. Secondly, we are streamlining our freezing activities in Singapore in order to focus more on unique products that are supporting Marel’s full-line solutions.
Finally, we have simplified Marel’s meat activities by merging three business units to better utilize existing innovation and sales capabilities within the company. Those units include Carnitech activities that were acquired last year.
As a part of our new strategy, Marel’s organizational structure will be further simplified in order to provide customers with better service. We will take considered steps to combine business units that serve the same customer needs and rely on the same technical capabilities. Our current manufacturing footprint is extensive and widespread, causing both over and underutilization in the system. We will drive higher gross margins through the optimiziation of the manufacturing footprint. Our aim is to surpass EUR 100 million in operating profits in 2017.
HUGE POTENTIAL
Marel is ready for the future. We will continue to expand the boundaries in food processing by constantly securing a strong and steady flow of new solutions to the market that are tailored to our customers’ needs. We are firmly committed to the aim of delivering increased value to customers and shareholders. We have exceptional people and we operate in a market with huge potential. Together we are about to accomplish great things.
Increase in food demand to 2050
Over
50%

10 11
Sales in 2013, by business segments
Fish
Poultry
Meat
Further processins
Others
Number of employees (FTEs)by geographical location at year end 2013
24% 28%
17%13%
9%
8%
Netherlands
US
Iceland
Denmark
UK
Other countries
Sales in 2013, by geographical location
Iceland
The Netherlands
Europe other
North America
Other countries
700
600
500
400
300
200
100
02013
2013
2013
2013 2013
2012
2012
2012
2012 2012
2011
2011
2011
2011 2011
2010
2010
2010
2010 2010
2009
2009
2009
2009 2009
Revenues
EUR
mill
ion
50%
40%
30%
20%
10%
0%
Equity ratio
700
600
500
400
300
200
100
0
14%
12%
10%
8%
6%
4%
2%
0%
Revenues and profitfrom operations (EBIT) as percentage of revenuse
EUR
mill
ion
EUR
mill
ion
EUR
mill
ion
45
40
35
30
25
20
15
10
5
0
8,5%
8,0%
7,5%
7,0%
6,5%
6,0%
5,5%
5,0%
4,5%
4,0%
Research and development expenses
100
80
60
40
20
0
EBITDA
Marel in Figures
Population Growth Urbanization Diet & Lifestyle Change
Sustainability & Environment
Marel’s Growth Drivers

12 13
Results 2013 2012 2011 2010 2009
Revenue 661,536 713,960 668,357 600,421 531,680
Gross profit 233,644 249,226 247,289 227,074 191,674
Result before depreciation (EBITDA) 69,444 85,963 87,006 82,177 58,752
Result from operations (EBIT) 42,909 61,081 62,166 57,334 8,047
Net result for the period 20,620 35,609 34,463 13,626 (11,811)
Order Book 2013 2012 2011 2010 2009
Orders Received* 668,584 650,493 702,419 638,453 474,077
Order Book 132,438 125,390 196,218 162,155 105,832
* Includes service revenues.
Cash flow statement 2013 2012 2011 2010 2009
Cash generated from operating activities, before interest & tax 80,320 65,569 63,716 114,881 75,395
Net cash from (to) operating activities 64,097 49,095 43,183 78,988 25,526
Investing activities (31,963) (37,294) (28,690) (16,757) 10,758
Financing activities (26,461) (26,486) (47,120) (67,453) 10,168
Financial position 2013 2012 2011 2010 2009
Total assets 839,568 865,128 877,818 877,623 882,882
Working capital 49,041 59,076 52,487 78,114 109,111
Equity 419,339 403,748 373,471 343,269 323,797
Net debt 217,130 243,242 250,489 256,741 295,012
Various figures in proportion to sales 2013 2012 2011 2010 2009
Gross profit 35.3% 34.9% 37.0% 37.8% 36.1%
Selling and marketing expenses 14.4% 12.6% 11.9% 11.8% 13.8%
Research and development expenses 6.7% 5.8% 6.0% 6.1% 5.9%
Administrative expenses 7.8% 8.0% 8.0% 9.1% 13.1%
Wages and benefits 37.9% 33.9% 31.4% 31.7% 36.1%
Result before depreciation (EBITDA) 10.5% 12.0% 13.0% 13.7% 11.1%
Depreciation/amortisation 4.0% 3.5% 3.7% 4.1% 9.5%
Result from operations (EBIT) 6.5% 8.6% 9.3% 9.5% 1.5%
Net result for the period 3.1% 5.0% 5.2% 2.3% (2.2%)
Other key ratios 2013 2012 2011 2010 2009
Current ratio 1.3 1.3 1.2 1.4 1.6
Quick ratio 0.8 0.8 0.8 1.0 1.2
Equity ratio 49.9% 46.7% 42.5% 39.1% 36.7%
Return on owners’ equity 5.0% 9.2% 9.6% 4.1% (3.9%)
Return on total assets 2.4% 4.1% 3.9% 1.5% (1.3%)
Key figures from Marel’s core operations, normalised 2013 2012 2011 2010 2009
Revenue 661,536 713,960 668,357 582,130 434,796
Result from operations (EBIT) 42,909 61,081 73,152 64,144 24,760
EBIT as a % of sales 6.5% 8.6% 10.9% 11.0% 5.7%
Result before depreciation and amortisation (EBITDA) 69,444 85,963 97,992 88,060 47,432
EBITDA as a % of sales 10.5% 12.0% 14.7% 15.1% 10.9%
Leverage 3.13 2.83 2.56 2.92 N/A
Marel in Figures
Marel’s financial results were below full potential in 2013. Cash flow was strong. Order book and orders received were steady. Strategic progress was made.
15
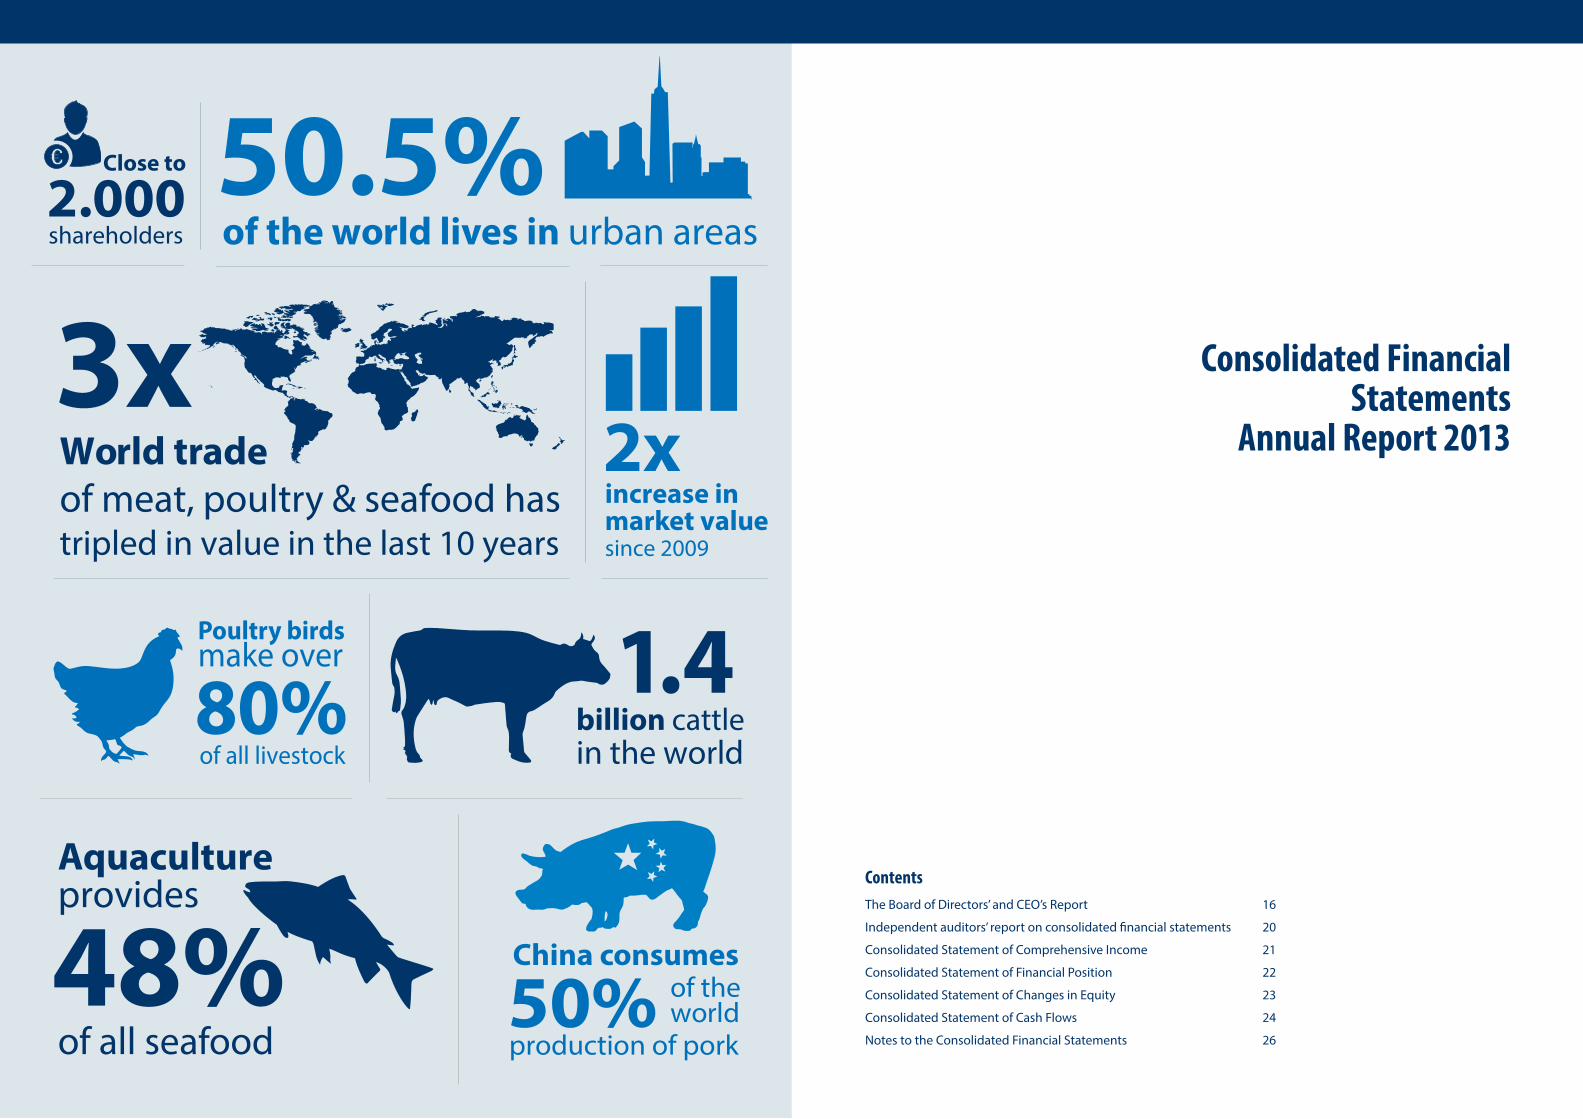
Consolidated Financial Statements
Annual Report 2013
The Board of Directors’ and CEO’s Report 16
Independent auditors’ report on consolidated financial statements 20
Consolidated Statement of Comprehensive Income 21
Consolidated Statement of Financial Position 22
Consolidated Statement of Changes in Equity 23
Consolidated Statement of Cash Flows 24
Notes to the Consolidated Financial Statements 26
Contents
World trade of meat, poultry & seafood hastripled in value in the last 10 years
3x
Poultry birdsmake over
of all livestock80%
Aquacultureprovides
of all seafood48%
of the world lives in urban areas50.5%
et valuesince 2009
increase inmark
2x
shareholders
Close to
2.000
billion cattlein the world
.41
of the world
production of pork
China consumes
50%
16 17
The Board of Directors' and CEO's Report Marel is a leading global provider of advanced equipment, systems and services for the poultry, fish, meat and further processing industries. Marel has offices and subsidiaries in over 30 countries and a global network of more than 100 agents and distributors.
The Consolidated Financial Statements for the year 2013 comprise the financial statements of Marel hf. (“the Company”) and its subsidiaries (together “the Group”). The Consolidated Financial Statements are prepared in accordance with International Financial Reporting Standards (IFRS) as adopted by the European Union (EU) and additional Icelandic disclosure requirements.
Operations in 2013
According to the Consolidated Statement of Comprehensive Income, the Group's operating revenue amounted to EUR 661.5 million in 2013, compared to EUR 714.0 million in 2012. Profit for the year amounted to EUR 20.6 million (2012: EUR 35.6 million). Total comprehensive income amounted to EUR 21.8 million (2012: EUR 36.6 million). In 2013 the Company expensed EUR 44.4 million (2012: EUR 41.6 million) for research and development.
In July Marel acquired the assets related to the mixing and grinding activities from the estate of Carnitech A/S for EUR 1.5 million.
According to the Consolidated Statement of Financial Position, the Company's assets amounted to EUR 839.6 million at the end of 2013 (2012: EUR 865.1 million). Equity amounted to EUR 419.3 million at the end of 2013 (at year-end 2012: EUR 403.7 million) or 49.9% of total assets (at year-end 2012: 46.7%). Net interest bearing debt decreased from EUR 243.2 million at the end of 2012 to EUR 217.1 million at the end of 2013. The Group was in full compliance with bank covenants in 2013.
The average number of full time employees was 4,084 in 2013 (2012: 4,049). Total salaries and wages were EUR 210.3 million (2012: 206.1 million).
According to the Company's 2013 Annual General Meeting decision, a dividend of EUR 7.1 million or 0.97 euro cents per share was paid out to shareholders for the operational year 2012, corresponding to about 20% of the Companyʼs profit for the year. Comparable figures for the year before were a total dividend of EUR 6.9 million or 0.95 euro cents per share.
The goodwill of the Group was tested for impairment at year-end by calculating its recoverable amount. The results of these impairment tests were that there was no impairment as the recoverable amount of the goodwill was well above book value.
At the end of 2013 the Companyʼs order book amounted to EUR 132 million (2012: EUR 125 million).
At the end of October the Companyʼs Board of Directors appointed Árni Oddur Þórðarson as the Chief Executive Officer of Marel hf., replacing Theo Hoen. At the same time Ásthildur Margrét Otharsdóttir assumed the role of the Chairman of the Board and Arnar Þór Másson became Vice Chairman. In beginning of November Árni Oddur Þórðarson and Theo Bruinsma resigned from the Companyʼs Board of Directors.
Marelʼs executive team was expanded and strengthened in December with several experienced and highly qualified Marel´s Managing Directors. These changes will further align execution with strategy and enable Marel to reach its long term goals. By this change all of Marelʼs key industries are represented in the executive team, sharpening the market and innovative driven focus of the Company.
The management and the Board of Directors of the Group believe that they are taking all the necessary measures to support the sustainability and growth of the Groupʼs business in the current circumstances. Accordingly they continue to adopt the going concern basis in preparing the annual report and financial statements.
The management of the Group believes it is well placed to manage its business risks successfully based on the present economic outlook. Further information is disclosed in note 3 to the Consolidated Financial Statements 2013.
Share Capital and Articles of Association
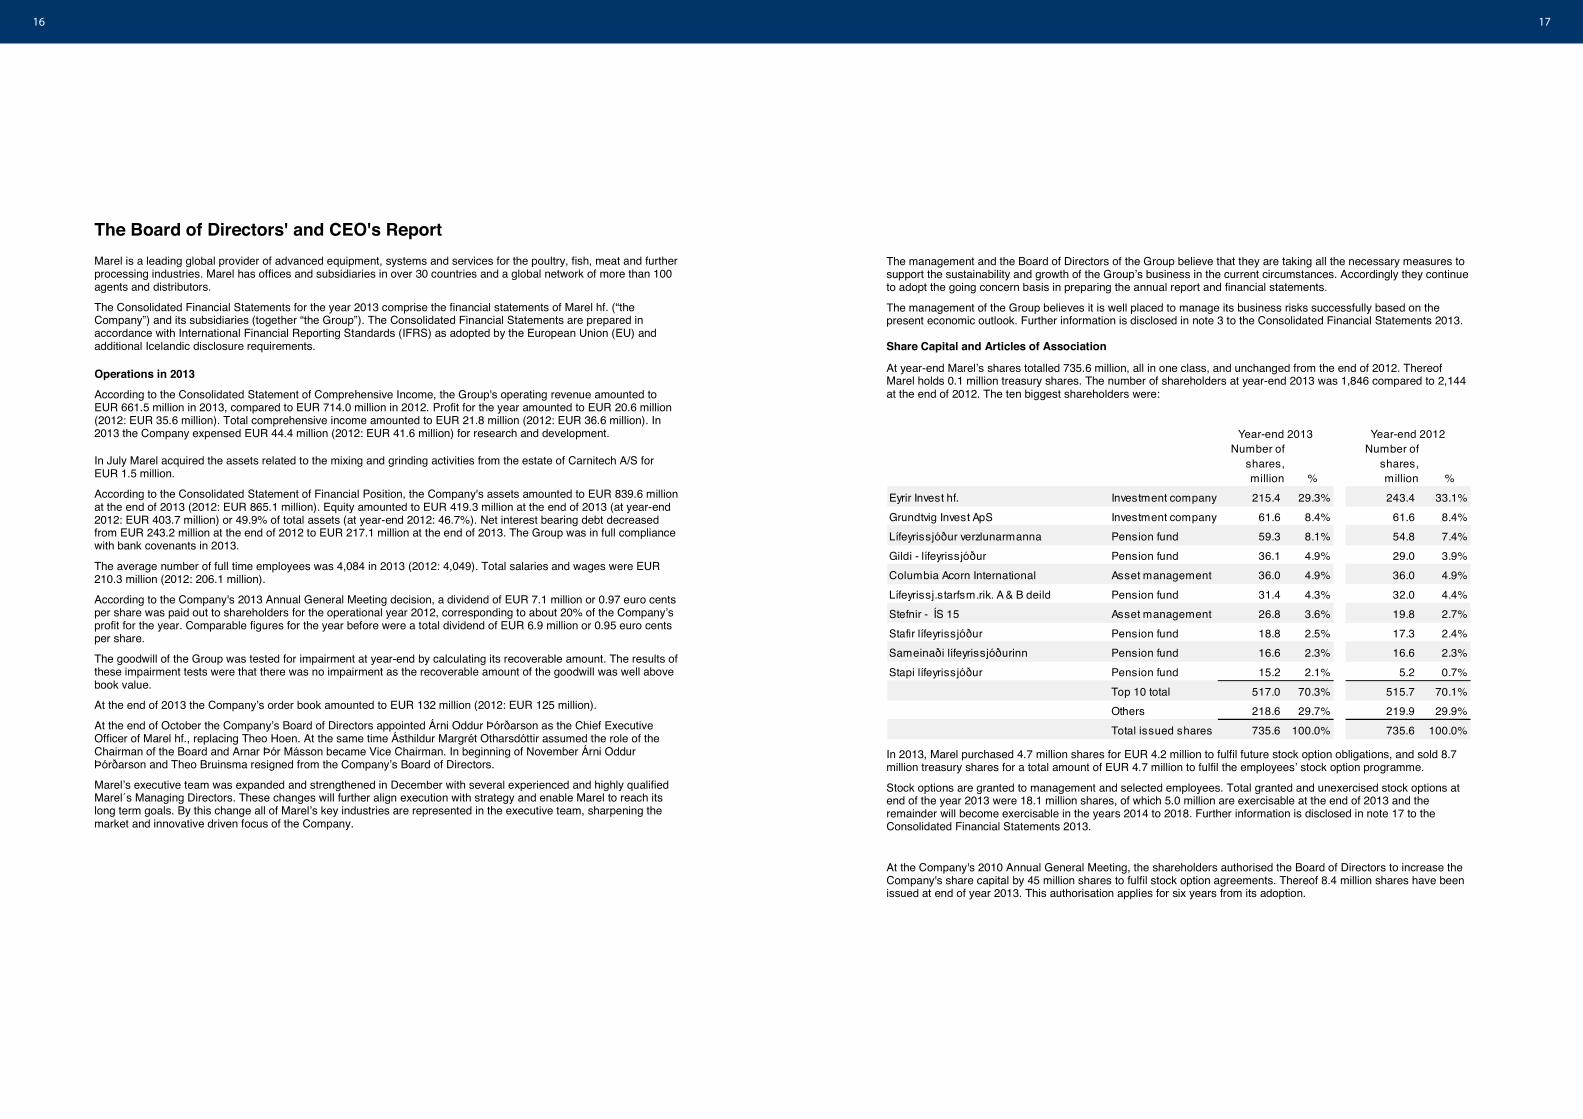
At year-end Marelʼs shares totalled 735.6 million, all in one class, and unchanged from the end of 2012. Thereof Marel holds 0.1 million treasury shares. The number of shareholders at year-end 2013 was 1,846 compared to 2,144 at the end of 2012. The ten biggest shareholders were:
Number of shares, million %
Number of shares, million %
Eyrir Invest hf. Investment company 215.4 29.3% 243.4 33.1%Grundtvig Invest ApS Investment company 61.6 8.4% 61.6 8.4%Lífeyrissjóður verzlunarmanna Pension fund 59.3 8.1% 54.8 7.4%Gildi - lífeyrissjóður Pension fund 36.1 4.9% 29.0 3.9%Columbia Acorn International Asset management 36.0 4.9% 36.0 4.9%Lífeyrissj.starfsm.rik. A & B deild Pension fund 31.4 4.3% 32.0 4.4%Stefnir - ÍS 15 Asset management 26.8 3.6% 19.8 2.7%Stafir lífeyrissjóður Pension fund 18.8 2.5% 17.3 2.4%Sameinaði lífeyrissjóðurinn Pension fund 16.6 2.3% 16.6 2.3%Stapi lífeyrissjóður Pension fund 15.2 2.1% 5.2 0.7%
Top 10 total 517.0 70.3% 515.7 70.1%Others 218.6 29.7% 219.9 29.9%Total issued shares 735.6 100.0% 735.6 100.0%
Year-end 2013 Year-end 2012
In 2013, Marel purchased 4.7 million shares for EUR 4.2 million to fulfil future stock option obligations, and sold 8.7 million treasury shares for a total amount of EUR 4.7 million to fulfil the employeesʼ stock option programme.
Stock options are granted to management and selected employees. Total granted and unexercised stock options at end of the year 2013 were 18.1 million shares, of which 5.0 million are exercisable at the end of 2013 and the remainder will become exercisable in the years 2014 to 2018. Further information is disclosed in note 17 to the Consolidated Financial Statements 2013.
At the Company's 2010 Annual General Meeting, the shareholders authorised the Board of Directors to increase the Company's share capital by 45 million shares to fulfil stock option agreements. Thereof 8.4 million shares have been issued at end of year 2013. This authorisation applies for six years from its adoption.
18 19
Marel hf., Consolidated Financial Statements 31 December 2013All amounts in EUR*1000 unless otherwise stated
The Board of Directors suggests that no dividends will be paid for the operational year 2013, but refers to the financial statements regarding appropriation of the profit for the period and changes in shareholders' equity.
Corporate Governance
The Companyʼs corporate governance policy is based on the Guidelines on Corporate Governance issued in March 2012 by the Icelandic Chamber of Commerce, NASDAQ OMX Iceland hf. and Confederation of Icelandic Employers, which is in accordance with Clause 2.26 in the Rules for issuers of financial instruments on NASDAQ OMX Iceland issued in December 2013. In compliance with the guidelines, the Board of Directors has prepared a Corporate Governance Statement which is distributed with the Consolidated Financial Statements 2013 and disclosed in the Annual Report 2013.
Candidates for the Board of Directors of the Company have to notify the Board of Directors in writing at least five full days before the beginning of the Annual General Meeting. The Company's Articles of Association can only be amended with the approval of 2/3 of casted votes and approval of shareholders who control at least 2/3 of the shares represented in a legal shareholders' meeting, provided that the notification calling the meeting thoroughly informs on such amendment and what the amendment consists in.
Statement by the Board of Directors and the CEO
According to the Board of Directorsʼ and CEOʼs best knowledge these Consolidated Financial Statements comply with International Financial Reporting Standards (IFRS) as adopted by the EU and additional Icelandic disclosure requirements for consolidated financial statements of listed companies. Further according to the Board of Directorsʼ best knowledge, the statements give a true and fair view of the Group´s financial position as at 31 December 2013, operating performance and the cash flows for the year ended 31 December 2013 as well as describe the principal risk and uncertainty factors faced by the Group. The report of the Board of Directors provides a clear overview of developments and achievements in the Company's operations and its situation.
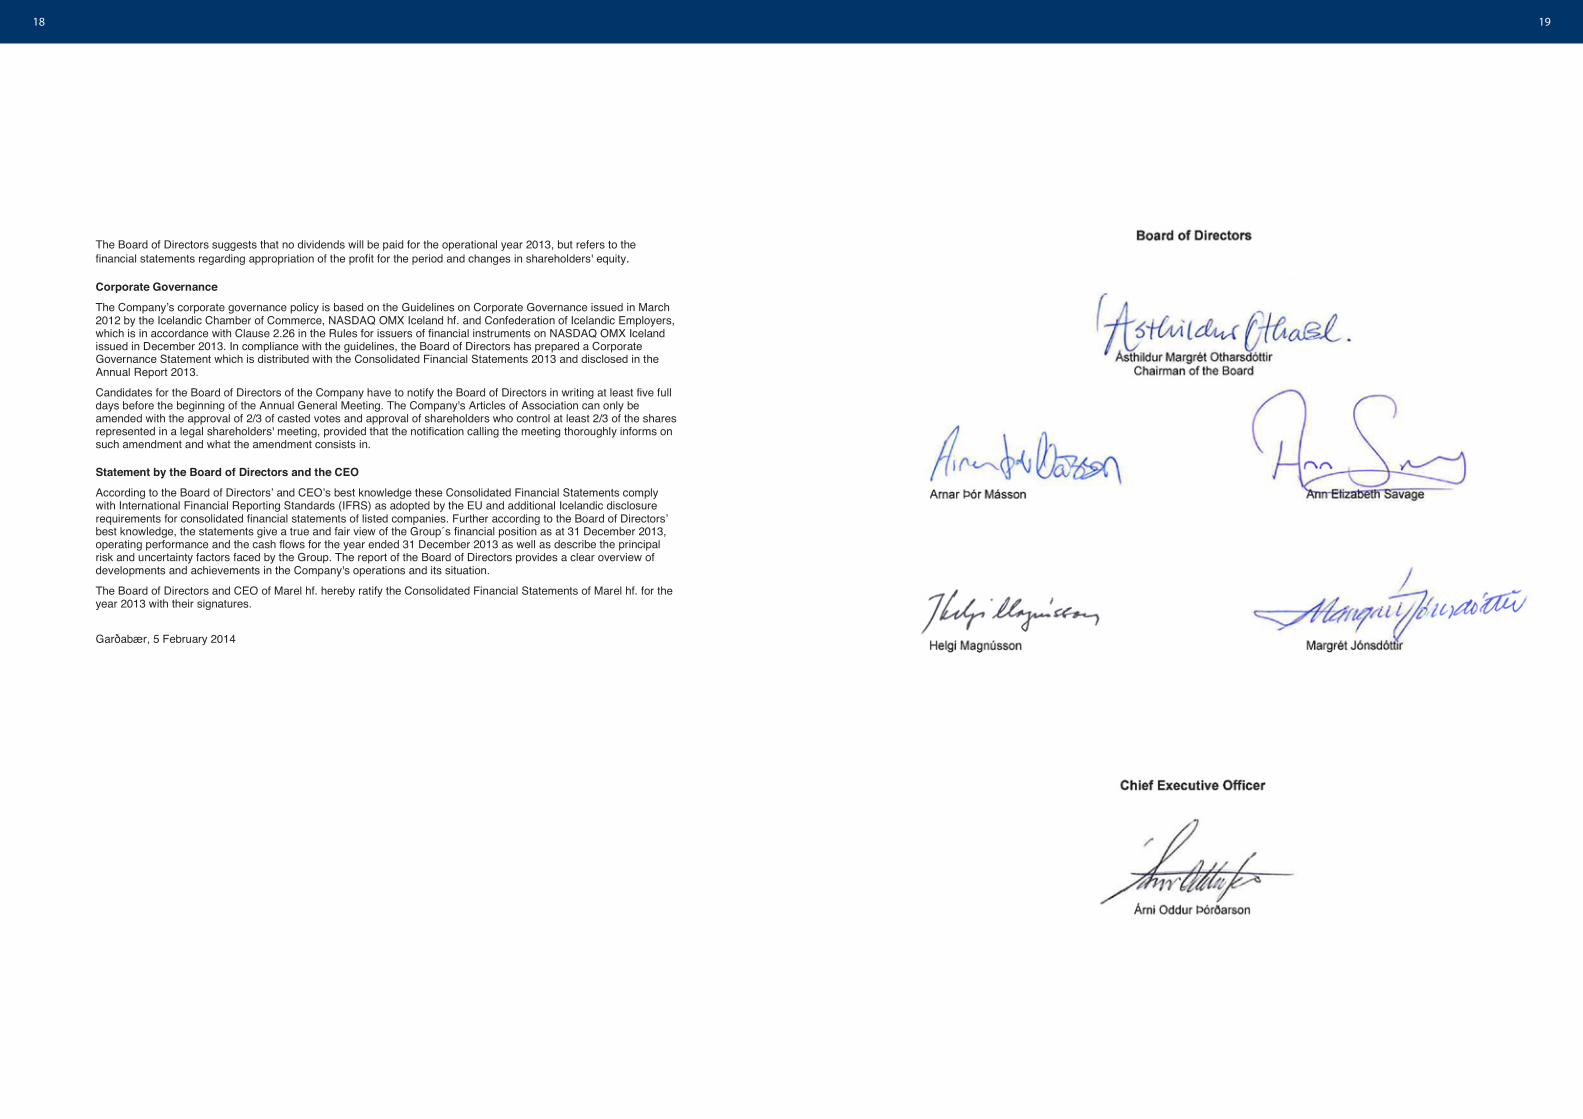
The Board of Directors and CEO of Marel hf. hereby ratify the Consolidated Financial Statements of Marel hf. for the year 2013 with their signatures.
Garðabær, 5 February 2014

20 21
Marel hf., Consolidated Financial Statements 31 December 2013All amounts in EUR*1000 unless otherwise stated
Consolidated Statement of Comprehensive Income 2013 2012
Notes
Revenues ........................................................................................................................................... 5 661,536 713,960 Cost of sales ...................................................................................................................................... (427,892) (464,734) Gross profit 233,644 249,226
Selling and marketing expenses ........................................................................................................ (95,105) (90,119) Research and development expenses .............................................................................................. (44,388) (41,566) Administrative expenses ................................................................................................................... (51,313) (56,945) Other operating income / (expenses) ................................................................................................ 6 71 485
Result from operations 42,909 61,081
Finance costs .................................................................................................................................... 7 (19,427) (18,366) Finance income .................................................................................................................................. 7 363 336 Net f inance costs ............................................................................................................................... 7 (19,064) (18,030)
Result before income tax 23,845 43,051
Income tax ......................................................................................................................................... 9 (3,225) (7,442) Profit for the period 20,620 35,609
Other Comprehensive IncomeItems that are or will be reclassified to profit or loss:Currency translation differences ....................................................................................................... (1,593) (229) Cash f low hedges ............................................................................................................................. 3,621 1,602 Income tax relating to cash f low hedges ........................................................................................... (828) (400) Other comprehensive income for the period, net of tax 1,200 973 Total comprehensive income for the period 21,820 36,582
Profit (loss) attributable to:Shareholders of the Company ........................................................................................................... 20,620 35,609 Comprehensive income attributable to:Shareholders of the Company ........................................................................................................... 21,820 36,582
Earnings per share for result attributable to equity holders of the Company during the period (expressed in EUR cent per share): - basic .............................................................................................................................................. 10 2.81 4.88 - diluted ............................................................................................................................................ 10 2.79 4.83
Earnings per share for total comprehensive income attributable to equity holders of the Company during the period (expressed in EUR cent per share): - basic .............................................................................................................................................. 2.97 5.01 - diluted ............................................................................................................................................ 2.95 4.96
The notes on pages 11 - 60 are an integral part of the Consolidated Financial Statements
22 23
Marel hf., Consolidated Financial Statements 31 December 2013All amounts in EUR*1000 unless otherwise stated
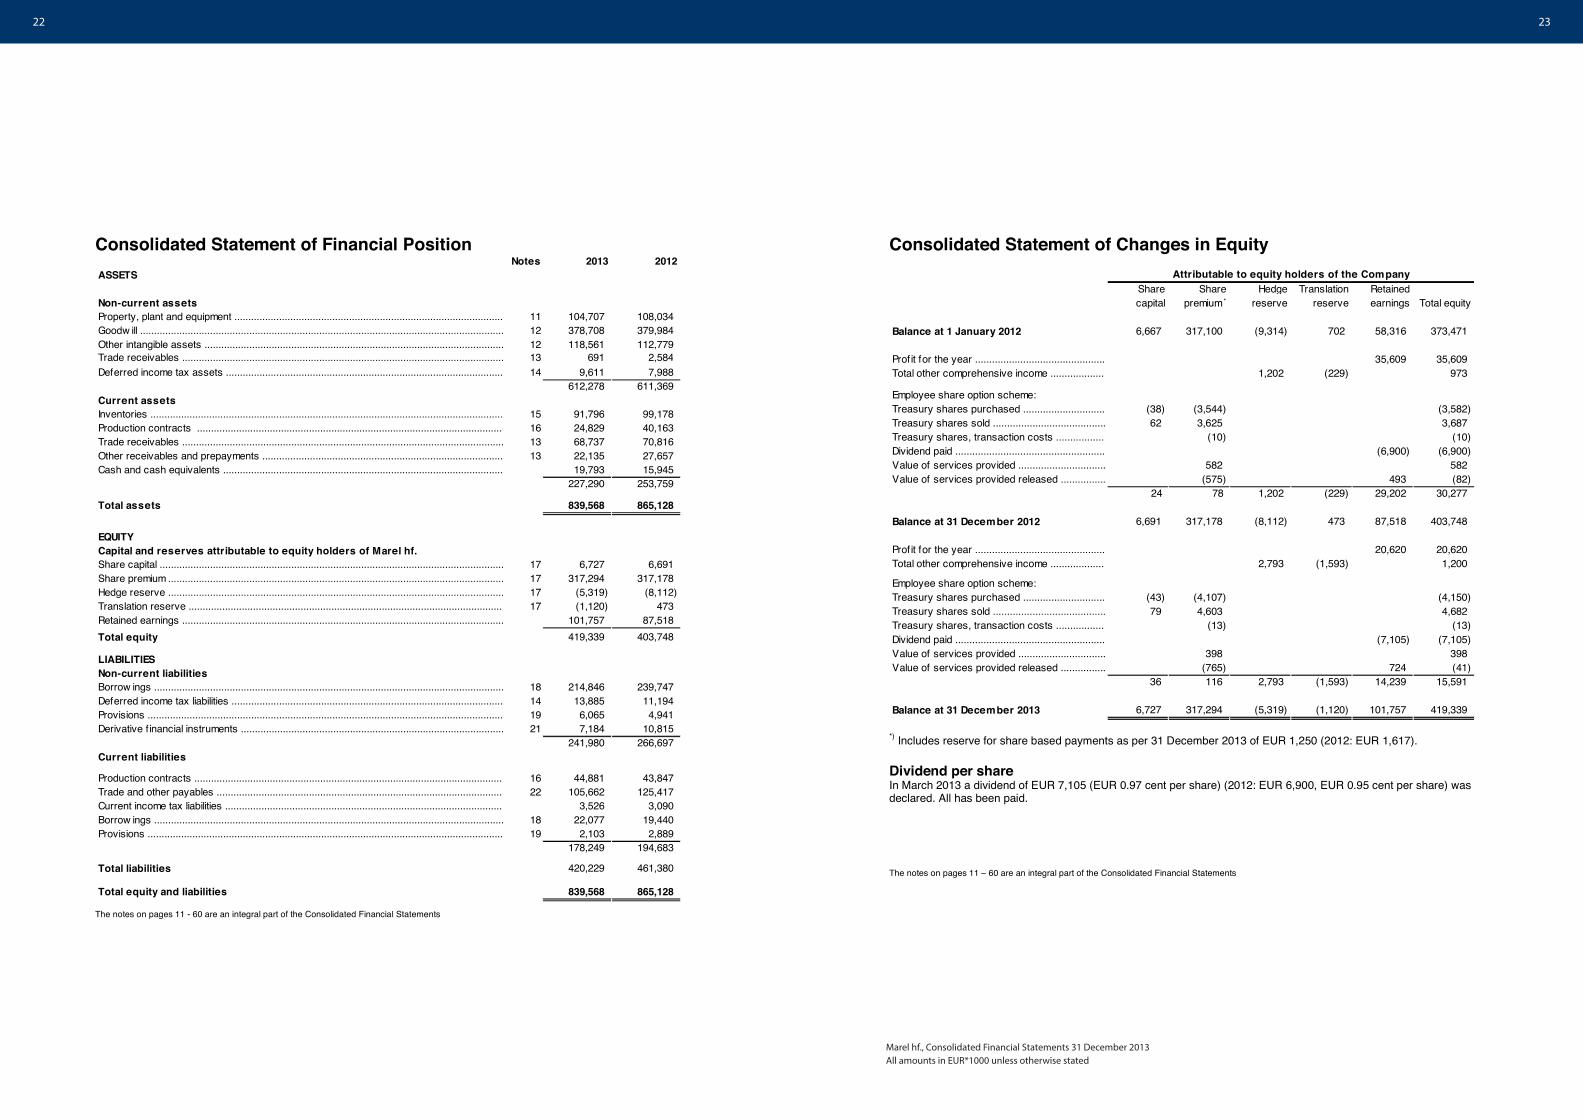
Consolidated Statement of Financial PositionNotes 2013 2012
ASSETS
Non-current assetsProperty, plant and equipment ................................................................................................ 11 104,707 108,034 Goodw ill .................................................................................................................................. 12 378,708 379,984 Other intangible assets ........................................................................................................... 12 118,561 112,779 Trade receivables ................................................................................................................... 13 691 2,584 Deferred income tax assets ................................................................................................... 14 9,611 7,988
612,278 611,369 Current assetsInventories .............................................................................................................................. 15 91,796 99,178 Production contracts ............................................................................................................. 16 24,829 40,163 Trade receivables ................................................................................................................... 13 68,737 70,816 Other receivables and prepayments ...................................................................................... 13 22,135 27,657 Cash and cash equivalents .................................................................................................... 19,793 15,945
227,290 253,759
Total assets 839,568 865,128
EQUITYCapital and reserves attributable to equity holders of Marel hf.Share capital ........................................................................................................................... 17 6,727 6,691 Share premium ........................................................................................................................ 17 317,294 317,178 Hedge reserve ........................................................................................................................ 17 (5,319) (8,112) Translation reserve ................................................................................................................ 17 (1,120) 473 Retained earnings ................................................................................................................... 101,757 87,518 Total equity 419,339 403,748
LIABILITIESNon-current liabilitiesBorrow ings ............................................................................................................................. 18 214,846 239,747 Deferred income tax liabilities ................................................................................................. 14 13,885 11,194 Provisions ............................................................................................................................... 19 6,065 4,941 Derivative financial instruments .............................................................................................. 21 7,184 10,815
241,980 266,697 Current liabilities
Production contracts .............................................................................................................. 16 44,881 43,847 Trade and other payables ...................................................................................................... 22 105,662 125,417 Current income tax liabilities ................................................................................................... 3,526 3,090 Borrow ings ............................................................................................................................. 18 22,077 19,440 Provisions ............................................................................................................................... 19 2,103 2,889
178,249 194,683
Total liabilities 420,229 461,380
Total equity and liabilities 839,568 865,128
The notes on pages 11 - 60 are an integral part of the Consolidated Financial Statements
Consolidated Statement of Changes in Equity
Share capital
Share premium *
Hedge reserve
Translation reserve
Retained earnings Total equity
Balance at 1 January 2012 6,667 317,100 (9,314) 702 58,316 373,471
Prof it for the year .............................................. 35,609 35,609 Total other comprehensive income ................... 1,202 (229) 973
Employee share option scheme:Treasury shares purchased ............................. (38) (3,544) (3,582) Treasury shares sold ........................................ 62 3,625 3,687 Treasury shares, transaction costs ................. (10) (10) Dividend paid ..................................................... (6,900) (6,900) Value of services provided ............................... 582 582 Value of services provided released ................ (575) 493 (82)
24 78 1,202 (229) 29,202 30,277
Balance at 31 December 2012 6,691 317,178 (8,112) 473 87,518 403,748
Prof it for the year .............................................. 20,620 20,620 Total other comprehensive income ................... 2,793 (1,593) 1,200
Employee share option scheme:Treasury shares purchased ............................. (43) (4,107) (4,150) Treasury shares sold ........................................ 79 4,603 4,682 Treasury shares, transaction costs ................. (13) (13) Dividend paid ..................................................... (7,105) (7,105) Value of services provided ............................... 398 398 Value of services provided released ................ (765) 724 (41)
36 116 2,793 (1,593) 14,239 15,591
Balance at 31 December 2013 6,727 317,294 (5,319) (1,120) 101,757 419,339
Attributable to equity holders of the Company
*) Includes reserve for share based payments as per 31 December 2013 of EUR 1,250 (2012: EUR 1,617).
Dividend per share In March 2013 a dividend of EUR 7,105 (EUR 0.97 cent per share) (2012: EUR 6,900, EUR 0.95 cent per share) was declared. All has been paid.
The notes on pages 11 – 60 are an integral part of the Consolidated Financial Statements

24 25
Marel hf., Consolidated Financial Statements 31 December 2013All amounts in EUR*1000 unless otherwise stated
Consolidated Statement of Cash Flows
Cash flow s from operating activities Notes 2013 2012
Result from operations ................................................................................................................ 42,909 61,081
Adjustments to reconcile result from operations to net cash provided by operating activities:Depreciation and impairment of property, plant and equipment .................................................. 11 9,270 9,945 Amortisation and impairment of intangible assets ....................................................................... 12 17,266 14,937 Gain on sale of property, plant and equipment .......................................................................... (246) (190) Changes in non current receivables ........................................................................................... 1,887 531 Working capital provided by / (used in) operating activities 71,086 86,304
Changes in working capital:Inventories and production contracts ......................................................................................... 22,655 (23,132) Trade and other receivables ....................................................................................................... 4,140 3,972 Trade and other payables ........................................................................................................... (17,879) 340 Provisions ................................................................................................................................... 318 (1,915) Changes in operating assets and liabilities 9,234 (20,735)
Cash generated from operating activities 80,320 65,569
Taxes paid .................................................................................................................................. (2,699) (1,341) Interest and finance costs paid .................................................................................................. (13,524) (15,133)
Net cash from operating activities 64,097 49,095
The notes on pages 11 - 60 are an integral part of the Consolidated Financial Statements
Cash flow s from Investing activities Notes 2013 2012Interest received ......................................................................................................................... 455 333 Acquistion of assets ................................................................................................................... (1,488) - Purchase of property, plant and equipment ................................................................................ (7,355) (11,279) Investments in intangibles ........................................................................................................... (24,029) (28,153) Proceeds from sale of property, plant and equipment ................................................................ 454 1,807 Other changes ............................................................................................................................ - (2) Net cash used in investing activities (31,963) (37,294)
Cash flow s from financing activitiesPurchase of treasury shares ..................................................................................................... (4,163) (3,592) Sale of treasury shares .............................................................................................................. 4,682 3,687 Exercise of share options ........................................................................................................... (41) - Proceeds from borrow ings ......................................................................................................... 49,000 47,540 Repayments of borrow ings ........................................................................................................ (68,834) (67,221) Dividends paid ............................................................................................................................. (7,105) (6,900) Net cash used in financing activities (26,461) (26,486)
Net increase (decrease) in net cash 5,673 (14,685)
Exchange (loss) / gain on net cash ............................................................................................ (1,825) (304) Net cash at beginning of the period ............................................................................................ 15,945 30,934
Net cash at end of the period 19,793 15,945
Cash and cash equivalents ........................................................................................................ 19,793 15,945
Net cash at end of the period 19,793 15,945
The notes on pages 11 - 60 are an integral part of the Consolidated Financial Statements

26 27
Marel hf., Consolidated Financial Statements 31 December 2013All amounts in EUR*1000 unless otherwise stated
Notes to the Consolidated Financial Statements
1 General information Marel hf. ("the Company") is a limited liability company incorporated and domiciled in Iceland. The address of its registered office is Austurhraun 9, Gardabaer.
The Consolidated Financial Statements of the Company as at and for the year ended 31 December 2013 comprise the Company and its subsidiaries (together "the Group"). The Group is primarily involved in the manufacture, development, distribution and sales of solutions for use in all major sectors of the food processing industry. All amounts are in EUR*1000 unless otherwise stated.
The Company has its listing on the Nasdaq OMX Nordic Exchange in Iceland.
The Financial Statements as presented in this report are subject to the adoption by the Annual General Meeting of Shareholders, to be held on 5 March 2014.
2 Summary of significant accounting policies The principal accounting policies applied in the preparation of these Consolidated Financial Statements are set out below. These policies have been consistently applied to the years presented, unless otherwise stated.
2.1 Basis of preparation
A. Statement of Compliance The Consolidated Financial Statements of the Group have been prepared in accordance with International Financial Reporting Standards (IFRSs) as adopted by the European Union (EU) and additional Icelandic disclosure requirements for consolidated financial information of listed companies in accordance with Icelandic Financial Statements Act No. 3/2006 and rules for issuers of financial instruments in Nasdaq OMX in Iceland.
These Consolidated Financial Statements have been approved for issue by the Board of Directors on 5 February 2014.
B. Basis of Measurement These Consolidated Financial Statements have been prepared under the historical cost convention, as modified by the revaluation of available-for-sale financial assets and financial assets (including derivative instruments) at fair value through profit or loss or other comprehensive income.
C. Functional and presentation currency Items included in the Financial Statements of each entity in the Group are measured using the currency that best reflects the economic substance of the underlying events and circumstances relevant to that entity (“the functional currency”). The Consolidated Financial Statements are presented in Euro (EUR), which is the Group's reporting currency. All financial information presented in Euro has been rounded to the nearest thousand.
D. Use of estimates and judgements The preparation of the Consolidated Financial Statements in accordance with IFRS requires the use of certain critical accounting estimates. It also requires management to exercise judgment in the process of applying the Group's accounting policies. The areas involving a higher degree of judgment or complexity, or areas where assumptions and estimates are significant to the Consolidated Financial Statements are disclosed in note 4.
Estimates and underlying assumptions are reviewed on an on-going basis. Revisions to accounting estimates are recognised in the period in which the estimates are revised and in any future period affected.
E. Changes in accounting policies Standards, amendments and interpretations to existing standards that are not yet effective have not been early adopted by the Group.
The following standards and amendments to existing standards have been published and have an effective date on or after 1 January 2013.
• Amendments to IFRS 7 Disclosures – Offsetting Financial Assets and Financial Liabilities • IFRS 10 Consolidated Financial Statements • IFRS 11 Joint Arrangements • IFRS 12 Disclosure of Interests in Other Entities • IFRS 13 Fair Value Measurement • IAS 1 Presentation of items of other comprehensive income (amendments) • IAS 19 (as revised in 2011) Employee Benefits
These standards have been adopted as per 1 January 2013 and have a non-material effect on the Groupʼs Consolidated Financial Statements of 2013.

28 29
Marel hf., Consolidated Financial Statements 31 December 2013All amounts in EUR*1000 unless otherwise stated
2.2 Consolidation
Subsidiaries Subsidiaries are entities controlled by the Group. The Group controls an entity when it is exposed to, or has rights to, variable returns from its involvement with the entity and has the ability to affect those returns through its power over the entity. The financial statements of subsidiaries are included in the consolidated financial statements from the date on which control commences until the date on which control ceases.
When the Group loses control over a subsidiary, it derecognizes the assets and liabilities of the subsidiary, and any related Non-Controlling Interest (NCI) and other components of equity. Any resulting gain or loss is recognised in profit or loss. Any interest retained in the former subsidiary is measured at fair value when control is lost.
Business combinations The Group accounts for business combinations using the acquisition method when control is transferred to the Group. The consideration transferred in the acquisition is generally measured at fair value, as are the identifiable net assets acquired. Any goodwill that arises is tested annually for impairment. Any gain on a bargain purchase is recognized in profit or loss immediately. Transaction costs are expensed as incurred, except if related to the issue of debt or equity securities.
The consideration transferred does not include amount related to the settlement of pre-existing relationships. Such amounts are generally recognized in profit or loss.
Any contingent consideration payable is measured at fair value at the acquisition date. If the contingent consideration is classified as equity, then it is not remeasured and settlement is accounted for within equity. Otherwise, subsequent changes in the fair value of the contingent consideration are recognized in profit or loss.
If share-based payment awards (replacement awards) are required to be exchanged for awards held by the acquireeʼs employees (acquireeʼs award), then all or a portion of the amount of the acquirerʼs replacement awards is included in measuring the consideration transferred in the business combination. This determination is based on the market-based measure of the replacement awards compared with the market-based measure of the replacement awards compared with the market-based measure of the acquireeʼs awards and the extent to which the replacement awards relate to pre-combination service.
Intercompany transactions, balances and unrealised gains on transactions between Group companies are eliminated. Unrealised losses are also eliminated unless the transaction provides evidence of an impairment of the asset transferred. Accounting policies of subsidiaries have been changed where necessary to ensure consistency with the policies adopted by the Group.
Transactions and non-controlling interests Transactions that result in changes in ownership interests while retaining control are accounted for as transactions with equity holders in their capacity as equity holders. As a result, no gain or loss on such changes is recognised in profit or loss but rather in equity. Also, no change in the carrying amounts of assets (including goodwill) or liabilities is recognised as a result of such transactions. This approach is consistent with NCI being a component of equity.
Associates Associates are all entities over which the Group has significant influence but not control, generally accompanying a shareholding of between 20% and 50% of the voting rights. Investments in associates are accounted for by the equity method of accounting and are initially recognised at cost. The Groupʼs investment in associates includes goodwill identified on acquisition, net of any accumulated impairment loss. See note 2.7 for the impairment of non-financial assets including goodwill.
The Group's share of its associates' post-acquisition profits or losses is recognised in the Statement of Comprehensive Income, and its share of post-acquisition movements in reserves is recognised in reserves. The cumulative post-acquisition movements are adjusted against the carrying amount of the investment. When the Group's share of losses in an associate equals or exceeds its interest in the associate, including any other unsecured receivables, the Group does not recognise further losses, unless it has incurred obligations or made payments on behalf of the associate.
Unrealised gains on transactions between the Group and its associates are eliminated to the extent of the Group's interest in the associates. Unrealised losses are also eliminated unless the transaction provides evidence of an impairment of the asset transferred. Accounting policies of associates have been changed where necessary to ensure consistency with the policies adopted by the Group.
Dilution gains and losses arising in investments in associates are recognised in the Statement of Comprehensive Income.
2.3 Segment information
An operating segment is a component of the Group that engages in business activities from which it may earn revenues and incur expenses, including revenues and expenses that relate to transactions with any of the Group's other components. All operating segments' operating results are reviewed regularly by the Group's CEO and strategic decisions are based on these operating segments. The operating structure in the Group is developing further towards the operating segments.
2.4 Foreign currency translation
Transactions and balances Foreign currency transactions are translated into the respective functional currencies of Group entities, and from there into the Group's reporting currency using the exchange rates prevailing at the dates of the transactions or valuation where items are revaluated. Foreign exchange gains and losses resulting from the settlement of such transactions and from the translation at year-end exchange rates of monetary assets and liabilities denominated in foreign currencies are recognised in the Statement of Comprehensive Income, except when deferred in equity as permanent loan, as qualifying cash flow hedges and qualifying net investment hedges as explained in note 2.9. Foreign exchange gains and losses that relate to borrowings and cash and cash equivalents as well as all other foreign exchange gains and losses are recognised immediately in the Statement of Comprehensive Income within 'Finance income' or 'Finance costs'.
Group companies The results and financial position of all the Group entities (none of which has the currency of a hyperinflationary economy) that have a functional currency different from the presentation currency are translated into the presentation currency as follows: (i) assets and liabilities presented are translated at the closing rate at the date of that Consolidated Statement of Financial Position; (ii) income and expenses for each Statement of Comprehensive Income are translated at average exchange rates, unless this average is not a reasonable approximation of the cumulative effect of the rates prevailing on the transaction dates, in which case income and expenses are translated at the dates of the transactions; and (iii) all resulting exchange differences are recognised as a separate component of equity (Translation reserve).
On consolidation, exchange differences arising from the translation of the net investment in foreign operations, and of borrowings and other currency instruments designated as hedges of such investments, are recognised in Translation reserve. When a foreign operation is partially disposed of or sold, exchange differences that were recorded in other comprehensive income are recognised in the profit or loss for the period as part of the gain or loss on sale.

30 31
Marel hf., Consolidated Financial Statements 31 December 2013All amounts in EUR*1000 unless otherwise stated
Goodwill and fair value adjustments arising on the acquisition of a foreign entity are treated as assets and liabilities of the foreign entity and translated at the closing rate.
In case of a non-wholly-owned subsidiary, the relevant proportionate share of the translation difference is allocated to the non-controlling interests. When a foreign operation is disposed of such that control, significant influence or joint control is lost, the cumulative amount in the translation reserve related to that foreign operation is reclassified to profit or loss as part of the gain or loss on disposal. When the Group disposes of only part of its interest in a subsidiary that includes a foreign operation while retaining control, the relevant proportion of the cumulative amount is reattributed to non-controlling interests. When the Group disposes of only part of its investment in an associate or joint venture that includes a foreign operation while retaining significant influence or joint control, the relevant proportion of the cumulative amount is reclassified to profit or loss.
2.5 Property, plant and equipment
Land and buildings comprise mainly factories and offices. All property, plant and equipment (PPE) is recognised at cost less subsequent depreciation and impairment, except for land, which is shown at cost less impairment. Cost includes expenditure that is directly attributable to the acquisition of the items.
Subsequent costs are included in the assetʼs carrying amount or recognised as a separate asset, as appropriate, only when it is probable that future economic benefits associated with the item will flow to the Group and the cost of the item can be measured reliably. The carrying amount of the replaced part is derecognised. All other repairs and maintenance are charged to the profit or loss for the period during the financial period in which they are incurred.
Land is not depreciated. Depreciation on assets is calculated using the straight-line method to allocate the cost of each asset to its residual value over its estimated useful life, as follows:
− Land and buildings...................................................................................................... 30-50 years − Plant and machinery................................................................................................... 4-15 years − Vehicles & equipment................................................................................................. 3-7 years
Major renovations are depreciated over the remaining useful life of the related asset or to the date of the next major renovation, whichever is sooner.
The assetsʼ residual values and useful lives are reviewed, and adjusted if appropriate, at each reporting date.
An assetʼs carrying amount is written down immediately to its recoverable amount if the assetʼs carrying amount is greater than its estimated recoverable amount (see note 2.7).
Gains and losses on disposals are determined by comparing proceeds with carrying amount. These are recognised within other operating income (expenses) in the Statement of Comprehensive Income.
Borrowing cost is expensed as incurred except when directly attributable to acquisition or construction of an asset that necessarily takes a substantial period of time to get ready for its intended use. Such borrowing cost is capitalised as part of the cost of the asset when it is probable that it will result in future economic benefits to the entity and the cost can be measured reliably.
2.6 Intangible assets
Goodwill Goodwill represents the excess of the cost of an acquisition over the fair value of the Groupʼs share of the net identifiable assets of the acquired subsidiary at the date of acquisition. Goodwill is tested annually for impairment and carried at cost less accumulated impairment losses. Gains and losses on the disposal of an entity include the carrying amount of goodwill relating to the entity sold. Goodwill on some acquisitions that occurred prior to 1 January 2004 has been charged in full to retained earnings in shareholdersʼ equity, such goodwill has not been retroactively capitalised. Goodwill is allocated to cash-generating units for the purpose of impairment testing. The allocation is made to those cash-generating units or groups of cash-generating units that are expected to benefit from the business combination in which the goodwill arose.
Research and development Research expenditure is recognised as an expense as incurred. Costs incurred on development projects relating to the design and testing of new or improved products are recognised as intangible assets when it is probable that the project will generate future economic benefits, considering its commercial and technological feasibility, and costs can be measured reliably. Other development expenditures are recognised as an expense as incurred. Development costs previously recognised as an expense are not recognised as an asset in a subsequent period. Development costs that have a finite useful life and that have been capitalised are amortised from the commencement of the commercial production of the product on a straight-line basis over the period of its expected benefit, not exceeding five years.
Patents & Trade name Expenditure to acquire patents, trademarks and licenses is capitalised and amortised using the straight-line method over their useful lives, but not exceeding 8 years, or 11 years in case of trademarks, with the exception of one particular case. These intangible assets are not revaluated.
Other intangible assets Costs associated with maintaining computer software programmes are recognised as an expense as incurred. Development costs that are directly attributable to the design and testing of identifiable and unique software products controlled by the group are recognised as intangible assets when the following criteria are met: – it is technically feasible to complete the software product so that it will be available for use; – management intends to complete the software product and use or sell it; – there is an ability to use or sell the software product; – it can be demonstrated how the software product will generate probable future economic benefits; – adequate technical, financial and other resources to complete the development and to use or sell the software product are available; and – the expenditure attributable to the software product during its development can be measured reliably.
Directly attributable costs capitalised as part of the software product include the software development employee costs and an appropriate portion of relevant overheads. Other development expenditures that do not meet these criteria are recognised as an expense as incurred. Development costs previously recognised as an expense are not recognised as an asset in a subsequent period. Computer software development costs recognised as assets are amortised over their estimated useful lives, which can vary from 3 to 5 years.

32 33
Marel hf., Consolidated Financial Statements 31 December 2013All amounts in EUR*1000 unless otherwise stated
2.7 Impairment of non-financial assets
Assets that have an indefinite useful life are not subject to amortisation and are tested annually for impairment. Assets that are subject to amortisation are reviewed for impairment whenever events or changes in circumstances indicate that the carrying amount may not be recoverable. Non-financial assets other than goodwill that suffer impairment are reviewed for possible reversal of the impairment at each reporting date.
At each reporting date, the Group reviews the carrying amounts of its non-financial assets (other than inventories and deferred tax assets) to determine whether there is any indication of impairment. If any such indication exists, then the assetʼs recoverable amount is estimated. Goodwill is tested annually for impairment.
For impairment testing, assets are grouped together into the smallest group of assets that generates cash inflows from continuing use that are largely independent of the cash inflows of other assets or CGUs. Goodwill arising from a business combination is allocated to CGUs or groups of CGUs that are expected to benefit from the synergies of the combination.
The recoverable amount of an asset or CGU is the greater of its value in use and its fair value less costs to sell. Value in use is based on the estimated future cash flows, discounted to their present value using a pre-tax discount rate that reflects current market assessments of the time value of money and the risks specific to the asset or CGU.
An impairment loss is recognised if the carrying amount of an asset or CGU exceeds its recoverable amount.
Impairment losses are recognised in profit or loss. They are allocated first to reduce the carrying amount of any goodwill allocated to the CGU, and then to reduce the carrying amounts of the other assets in the CGU on a pro rata basis.
An impairment loss in respect of goodwill is not reversed. For other assets, an impairment loss is reversed only to the extent that the assetʼs carrying amount does not exceed the carrying amount that would have been determined, net of depreciation or amortisation, if no impairment loss had been recognised.
2.8 Financial assets
Financial assets other than derivatives The Group classifies its investments in the following categories: financial assets at fair value through profit or loss, held-to-maturity financial assets, loans and receivables and available-for-sale financial assets.
The classification depends on the purpose for which the investments were acquired. Management determines the classification of its investments at initial recognition.
Financial assets at fair value through profit or loss A financial asset is classified at fair value through profit or loss if it is classified as held for trading or is designated as such upon initial recognition. Financial assets are designated at fair value through profit or loss if the Group manages such investments and makes purchase and sale decisions based on their fair value in accordance with the Groupʼs documented risk management or investment strategy. Upon initial recognition attributable transaction costs are recognised in profit or loss as incurred. Financial assets at fair value through profit or loss are measured at fair value, and changes therein are recognised in profit or loss. If the Group has the positive intent and ability to hold debt securities to maturity, then such financial assets are classified as held-to-maturity.
Held-to-maturity financial assets If the Group has the positive intent and ability to hold debt securities to maturity, then such financial assets are classified as held to maturity. Held-to-maturity financial assets are recognised initially at fair value plus any directly attributable transaction costs. Subsequent to initial recognition held-to-maturity financial assets are measured at amortised cost using the effective interest method, less any impairment losses. Any sale or reclassification of a more than insignificant amount of held-to-maturity investments not close to their maturity would result in the reclassification of all held-to-maturity investments as available for sale, and prevent the Group from classifying investment securities as held to maturity for the current and the following two financial years.
Loans and receivables Receivables are non-derivative financial assets with fixed or determinable payments that are not quoted in an active market. They are included in current assets, except for maturities greater than 12 months after the reporting date. These are classified as non-current assets. The Groupʼs receivables comprise ʻtrade receivablesʼ and ʻcash and cash equivalentsʼ in the Consolidated Statement of Financial Position (notes 2.12 and 2.13) and are recognised initially at fair value and subsequently measured at amortised cost using the effective interest method.
Available-for-sale financial assets Available-for-sale financial assets are non-derivatives that are either designated in this category or not classified in any of the other categories. They are recognised initially at fair value and included in non-current assets unless management intends to dispose of the investment within 12 months of the reporting date. Regular purchases and sales of financial assets are recognised on trade-date, the date on which the Group commits to purchase or sell the asset. Investments are initially recognised at fair value plus transaction costs for all financial assets not carried at fair value through profit or loss. Financial assets are derecognised when the rights to receive cash flows from the investments have expired or have been transferred and the Group has transferred substantially all risks and rewards of ownership. Available-for-sale financial assets are subsequently carried at fair value.
Fair value measurement The fair values of quoted investments are based on current bid prices. If the market for a financial asset is not active (and for unlisted securities), the Group establishes fair value by using valuation techniques. These include the use of recent armʼs length transactions, reference to other instruments that are substantially the same and discounted cash flow analysis refined to reflect the issuerʼs specific circumstances. The fair value of investments traded in active markets (such as trading and available-for-sale securities) is based on quoted market prices at the reporting date. The fair value of investments that are not traded in an active market is determined by using valuation techniques. The Group uses a variety of methods and makes assumptions that are based on market conditions existing at each reporting date.
Impairment of financial assets The Group assesses at each reporting date whether there is objective evidence that a financial asset or a group of financial assets is impaired. In the case of equity securities classified as available for sale, a significant or prolonged decline in the fair value of the security below its cost is considered as an indicator that the securities are impaired. If any such evidence exists for available-for-sale financial assets, the cumulative loss – measured as the difference between the acquisition cost and the current fair value, less any impairment loss on that financial asset previously recognised in profit or loss – is removed from Equity and recognised in the Consolidated Statement of Comprehensive Income for the period. Impairment losses recognised in the Consolidated Statement of Comprehensive Income for the period on equity instruments are not reversed through the Consolidated Statement of Comprehensive Income for the period. Impairment testing of receivables is described in note 2.12.
The carrying value less impairment provision of trade receivables and payables are assumed to approximate their fair values due to the short-term nature of trade receivables. The fair value of financial liabilities for disclosure purposes is estimated by discounting the future contractual cash flows at the current market interest rate that is available to the Group for similar financial instruments. Non-derivative financial liabilities

34 35
Marel hf., Consolidated Financial Statements 31 December 2013All amounts in EUR*1000 unless otherwise stated
Non-derivative financial liabilities are initially recognised at fair value less any directly attributable transaction costs. Subsequent to initial recognition, these liabilities are measured at amortised cost using the effective interest method.
2.9 Derivative financial instruments and hedging activities
Derivatives are initially recognised at fair value on the date a derivative contract is entered into and are subsequently revaluated at their fair value.
The method of recognising the resulting gain or loss depends on whether the derivative is designated as a hedging instrument, and if so, the nature of the item being hedged. The Group designates certain derivatives as either: (a) Hedges of a particular risk associated with a recognised asset or liability or a highly probable forecast transaction (cash flow hedge); or (b) Hedges of a net investment in a foreign operation (net investment hedge).
The Group documents at the inception of the transaction the relationship between hedging instruments and hedged items, as well as its risk management objectives and strategy for undertaking various hedging transactions. The Group also documents its assessment, both at hedge inception and on an on-going basis, of whether the derivatives that are used in hedging transactions are highly effective in offsetting changes in fair values or cash flows of hedged items.
Movements on the hedge reserve in equity are shown in the Statement of Changes in Equity. The full fair value of a hedging derivative is classified as a non-current asset or liability when the remaining hedged item is more than 12 months and as a current asset or liability when the remaining maturity of the hedged item is less than 12 months. Trading derivatives are classified as current asset or liabilities.
(a) Cash flow hedge The effective portion of changes in the fair value of derivatives that are designated and qualify as cash flow hedges is recognised in other comprehensive income and presented in the hedge reserve in equity. The profit or loss relating to the ineffective portion is recognised immediately in the Statement of Comprehensive Income within Finance income or Finance costs.
Amounts accumulated in equity are recycled in the Consolidated Statement of Comprehensive Income for the period in the periods when the hedged item affects profit or loss.
However, when the forecast transaction that is hedged results in the recognition of a non-financial asset (for example, inventory or non-current assets) the gains and losses previously deferred in equity are transferred from equity and included in the initial measurement of the cost of the asset. The deferred amounts are ultimately recognised in cost of goods sold in case of inventory or in depreciation in case of non-current assets.
When a hedging instrument expires or is sold, or when a hedge no longer meets the criteria for hedge accounting, any cumulative gain or loss existing in equity at that time remains in equity and is recognised when the forecast transaction is ultimately recognised in the Statement of Comprehensive Income. When a forecast transaction is no longer expected to occur, the cumulative gain or loss that was reported in equity is immediately transferred to the Statement of Comprehensive Income within Finance income or Finance costs.
(b) Net investment hedge Hedges of net investments in foreign operations are accounted for similarly to cash flow hedges. Any gain or loss on the hedging instrument relating to the effective portion of the hedge is recognised in other comprehensive income and presented in the hedge reserve in equity. The gain or loss relating to the ineffective portion is recognised immediately in the Statement of Comprehensive Income within Finance income or Finance costs. Gains and losses accumulated in equity are included in profit or loss when the foreign operation is partially disposed of or sold.
(c) Derivatives at fair value through profit or loss are accounted for at fair value through profit or loss. Certain derivative instruments do not qualify for hedge accounting. Changes in the fair value of any of these derivative instruments are recognised immediately in the Consolidated Statement of Comprehensive Income within Finance income or Finance costs.
2.10 Inventories
Inventories are stated at the lower of historical cost or net realisable value. Cost is determined using the weighted average method and an adjustment to net realisable value is considered for items, which have not moved during the last 12 months. The cost of finished goods and work in process comprise raw materials, direct labour, other direct costs and related production overheads based on normal operating capacity but exclude borrowing costs. Net realisable value is the estimated selling price in the ordinary course of business, less the costs of completion and any applicable variable selling expenses. Costs of inventories include the transfer from equity of gains or losses on qualifying cash flow hedges relating to production cost.
2.11 Production contracts
Production costs are recognised when incurred.
When the outcome of a production contract can be estimated reliably and it is probable that the contract will be profitable, contract revenue is recognised over the period of the contract. When it is probable that total contract costs will exceed total contract revenue, the expected loss is recognised as an expense immediately.
When the outcome of a production contract cannot be estimated reliably, contract revenue is recognised only to the extent of production costs incurred that are likely to be recoverable.
The Group uses the ʻpercentage of completion methodʼ to determine the appropriate amount to recognise in a given period. The stage of completion is measured by reference to the contract costs incurred up to the reporting date as a percentage of total estimated costs for each contract. Costs incurred in the year in connection with future activity on a contract are excluded from contract costs in determining the stage of completion. They are presented as inventories, prepayments or other assets, depending on their nature.
The Group presents as an asset the gross amount due from customers for contract work for all contracts in progress for which costs incurred plus recognised profits or less recognised losses exceeds progress billings.
The Group presents as a liability the gross amount due to customers for contract work for all contracts in progress for which progress billings exceed costs incurred plus recognised profits or less recognised losses.

36 37
Marel hf., Consolidated Financial Statements 31 December 2013All amounts in EUR*1000 unless otherwise stated
2.12 Receivables and prepayments
Trade receivables are recognised initially at fair value and subsequently measured at amortised cost using the effective interest method, less provision for impairment. A provision for impairment of trade receivables is established when there is objective evidence that the Group will not be able to collect all amounts due according to the original terms of receivables. Significant financial difficulties of the debtor, probability that the debtor will enter bankruptcy or financial reorganisation, and default or delinquency in payments are considered indicators that the trade receivable is impaired. The amount of the provision is the difference between the assetʼs carrying amount and the present value of estimated future cash flows, discounted at the effective interest rate.
The carrying amount of the assets is reduced through the use of an allowance account, and the amount of the loss is recognised in profit or loss. When a trade receivable is uncollectable, it is written off against the allowance account for trade receivables. Subsequent recoveries of amounts previously written off are credited in profit or loss.
2.13 Cash and cash equivalents
Cash and cash equivalents can include cash on hand, deposits held at call with banks and other short-term highly liquid investments with original maturities of three months or less. Bank overdrafts are shown within borrowings in current liabilities on the Consolidated Statement of Financial Position.
2.14 Share capital
Ordinary shares are classified as equity.
Incremental costs directly attributable to the issue of new shares or options are shown in shareholders' equity as a deduction, net of tax, from the proceeds.
Where any group company purchases the Companyʼs equity share capital (treasury shares), the consideration paid, including any directly attributable incremental costs (net of income taxes), is deducted from equity attributable to the Company's shareholders until the shares are cancelled or reissued. Where such shares are subsequently sold or reissued, any consideration received, net of any directly attributable incremental transaction costs and the related income tax effects, is included in equity attributable to the Company's shareholders.
Private placements need to be approved by the shareholders in the Companyʻs Annual General Meeting. Based on such resolution, where the shareholders waive their pre-emptive rights, the Board of Directors can approve for a private placement.
2.15 Trade payables
Trade payables are recognised initially at fair value and subsequently measured at amortised cost using the effective interest method.
2.16 Borrowings
Borrowings are recognised initially at fair value, net of transaction costs incurred. Borrowings are subsequently stated at amortised cost; any difference between the proceeds (net of transaction costs) and the redemption value is recognised in the Statement of Comprehensive Income over the period of the borrowings using the effective interest method.
Borrowings are classified as current liabilities unless the Group has an unconditional right to defer settlement of the liability for at least 12 months after the reporting date.
2.17 Current and deferred income tax
The tax expense for the period comprises current and deferred tax. Tax is recognised in the Statement of Comprehensive Income, except to the extent that it relates to items recognised directly in shareholders' equity. In this case, the tax on this item is included in deferred taxes; the net amount is recognised in equity.
The current income tax charge is calculated on the basis of the tax laws enacted or substantively enacted at the reporting date in the countries where the Companyʼs subsidiaries and associates operate and generate taxable income. Management periodically evaluates positions taken in tax returns with respect to situations in which applicable tax regulations are subject to interpretation and establishes provisions where appropriate on the basis of amounts expected to be paid to the tax authorities.
Deferred income tax is provided in full, using the liability method, on temporary differences arising between the tax bases of assets and liabilities and their carrying amounts in the financial statements. Deferred income tax is determined using tax rates (and laws) that have been enacted or substantially enacted by reporting date and are expected to apply when the related deferred income tax asset is realised or the deferred income tax liability is settled.
Deferred tax assets are recognised to the extent that it is probable that future taxable profit will be available against which the temporary differences can be utilised.
2.18 Employee benefits
Share-based compensation The Group operates a number of equity-settled, share-based compensation plans, under which the entity receives services from employees as consideration for equity instruments (options) of the Group. The fair value of the employee services received in exchange for the grant of the options is recognised as an expense. The total amount to be expensed is determined by reference to the fair value of the options granted, excluding the impact of any non-market service and performance vesting conditions (for example, profitability, sales growth targets and remaining an employee of the entity over a specified time period). Non-market vesting conditions are included in assumptions about the number of options that are expected to vest. The total amount expensed is recognised over the vesting period, which is the period over which all of the specified vesting conditions are to be satisfied. At reporting date, the entity revises its estimates of the number of options that are expected to vest based on the non-market vesting conditions. It recognises the impact of the revision to original estimates, if any, in the Statement of Comprehensive Income, with a corresponding adjustment to equity. The proceeds received net of any directly attributable transaction costs are credited to share capital (nominal value) and share premium when the options are exercised. The fair value of the employee share options granted is measured using the Black-Scholes formula. Measurement inputs include share price on measurement date, exercise price of the options, expected volatility based on weighted average historic volatility adjusted for changes expected due to publicly available information, weighted average expected life of the instruments based on historical experience and general option holder behaviour, expected dividends, and the risk-free interest rate based on government bonds. Service and non-market performance conditions attached to the transactions are not taken into account in determining fair value.
Profit sharing and bonus plans Under some circumstances, a liability for key employee benefits in the form of profit sharing and bonus plans is recognised in other provisions when there is no realistic alternative but to settle the liability and at least the condition is met that there is a formal plan and the amounts to be paid are determined before the time of issuing the financial statements. Liabilities for profit sharing and bonus plans are expected to be settled within 12 months and are measured at the amounts expected to be paid when they are settled.
38 39
Marel hf., Consolidated Financial Statements 31 December 2013All amounts in EUR*1000 unless otherwise stated
Pension plans Marel has several pension plans in accordance with local rules and conditions. Based on IAS 19R, only one arrangement with regards to early retirement rights can be classified as defined benefit until the moment of settlement expected in 2020 (VPL in the Netherlands). One other defined benefit obligation refers to jubilee rights in the Netherlands. Because of their non-material character, these arrangements are not disclosed separately. For the majority of its employees, the Group has pension plans, classified as defined contribution plans, in which the liabilities to the employees are based on the number of years of service and the salary levels. A defined contribution plan is a plan to provide benefits after retirement in which an entity makes fixed contributions to a separate entity, and legally has no constructive obligation to make further contributions. Obligations relating to defined contribution pension plans are charged to profit or loss as employee remuneration expenses when the contributions are payable. Contributions paid in advance are presented as assets to the extent that cash repayment or a reduction in future contributions is available.
2.19 Provisions
Provisions for restructuring costs and legal claims are recognised when the Group has a present legal or constructive obligation as a result of past events, it is probable that an outflow of resources will be required to settle the obligation, and the amount has been reliably estimated. Restructuring provisions comprise lease termination penalties and employee termination payments. Provisions are not recognised for future operating losses. The Group gives guarantee on certain products and undertakes to repair or replace items that fail to perform satisfactorily. If the Group expects a provision to be reimbursed, for example under an insurance contract, the reimbursement is recognised as a separate asset but only when the reimbursement is virtually certain.
Provisions are measured at the present value of the expenditures expected to be required to settle the obligation using a pre-tax rate that reflects current market assessments of the time value of money and the risks specific to the obligation. The increase in the provision due to passage of time is recognised as interest expense.
2.20 Revenue recognition
Revenue comprises the fair value for the sale of goods and services net of value-added tax, rebates and discounts, and after eliminating sales within the Group. Revenue from the sale of goods is recognised when significant risks and rewards of ownership of the goods are transferred to the buyer.
The Group recognises revenue when the amount of revenue can be reliably measured, it is probable that future economic benefits will flow to the entity and when specific criteria have been met. The amount of revenue is not considered to be reliably measurable until all contingencies relating to the sale have been resolved. The Group bases its estimates on historical results, taking into consideration the type of customer, the type of transaction and the specifics of each arrangement.
Revenue from fixed-price contracts for delivering design services and solutions is recognised under the percentage-of-completion (POC) method. Under the POC method, revenue is generally recognised based on the services performed and direct expenses incurred to date as a percentage of the total services to be performed and total expenses to be incurred.
Interest income is recognised on a time proportion basis, taking account of the principal outstanding and the effective rate over the period to maturity. When a receivable is impaired, the Group reduces the carrying amount to its recoverable amount, being the estimated future cash flow discounted at original effective interest rate of the instrument, and continues unwinding the discount as interest income.
2.21 Leases
Leases of property, plant and equipment where the Group has substantially obtained all the risks and rewards of ownership are classified as finance leases. Finance leases are capitalised at the inception of the lease at the lower of the fair value of the leased property or the present value of the minimum lease payments. Each lease payment is allocated between the liability and finance charges so as to achieve a constant rate on the finance balance outstanding. The corresponding rental obligations, net of finance charges, are included in other long-term borrowings. The interest element of the lease payment is charged to the profit or loss over the lease period so as to produce a constant periodic rate of interest on the remaining balance of the liability for each period. The property, plant and equipment acquired under finance leases are depreciated over the shorter of the useful life of the asset and the lease term.
Leases where a significant portion of the risks and rewards of ownership are retained by the lessor are classified as operating leases. Payments made under operating leases, net of any incentives received from the lessor are charged to the profit or loss on a straight-line basis over the period of the lease.
In those cases where the Group is the lessor of a finance lease, the finance lease is recorded in the Statement of Financial Position as a receivable, at an amount equal to the net investment in the lease. The finance income is recorded in the profit or loss based on a pattern reflecting a constant periodic rate of return on the lessorʼs net investment outstanding in respect of the finance lease. Assets held by the Group for operating leases are presented in the Statement of Financial Position according to the nature of the asset. Operating lease income is recognized in the profit or loss over the lease term on a straight line basis.
2.22 Dividend distribution
Dividend distribution to the Companyʼs shareholders is recognised in the Groupʼs financial statements in the period in which the dividends are approved by the Companyʼs shareholders.
Dividends are recognised when the right to receive payment is established.

40 41
Marel hf., Consolidated Financial Statements 31 December 2013All amounts in EUR*1000 unless otherwise stated
3 Financial risk management Financial risk factors
The Groupʼs activities expose to financial risk consisting of market risks (interest and currency risk), credit risk and liquidity risk.
This note presents information about the Group´s exposure to each of the above mentioned risks, the Groupʼs objectives, policies and processes for measuring and managing the risk. Further quantitative disclosures are included throughout these Consolidated Financial Statements.
Risk management framework Risk management is carried out by a central treasury department (Group Treasury) under policies and with instruments approved by the Board of Directors. Group Treasury identifies, evaluates and hedges financial risks in close co-operation with the Groupʼs operating units. The Group´s overall risk management program focuses on the unpredictability of financial markets and seeks to minimize potential adverse effects on the Group´s financial performance. The Group uses derivative financial instruments to hedge certain risk exposures and does not enter into financial contracts for speculative purposes. Group Treasury and Corporate Control staff meet with CFO weekly to monitor the risk management process.
(a) Market risk In November 2010, the Group entered into a EUR 350m facilities agreement with six international banks, led by ING bank, Rabobank and ABN Amro. Marel amended and extended this facilities agreement with the consortium with effective date 31 December 2012, while the terms and conditions generally remained in line with Loan Market Association (LMA) corporate standards. The key amendments were:
• The junior loan was converted into senior debt, making it an all senior facility; • The facility was extended by one year with final maturity in November 2016 • Initial interest terms EURIBOR/LIBOR +250 bps for the facility depending on leverage.
The Group has a financing structure which can accommodate the Group´s financing requirements till 2016 with USD and EUR borrowings matching the Group´s exposure in these currencies to a large extent.
(i) Foreign exchange risk The Group operates internationally and is exposed to currency risk arising from mainly the USD and GBP, primarily with respect to the EUR, as the EUR is the Group´s reporting currency. Financial exposure is hedged in accordance with the Group´s general policy and within set limits. The Group monitors foreign exchange risk arising from commercial transactions, recognized assets and liabilities (transaction risk) that are determined in a currency other than the entity´s functional currency. Derivative hedging is applied if the exposure is outside of the risk tolerance band on a consolidated basis. Currency exposure arising from net assets of the Group´s major foreign operations (translation risk) is managed primarily through borrowings denominated in the relevant foreign currencies as the policy is to apply natural exchange rate hedging where possible. Economic risk is defined as the extent to which currency fluctuations can alter a companyʼs future operating cash flows, that is future revenues and costs. Economic risk is not hedged.
The year end and average rates used for the currencies mentioned above are:
Year-end rate 2013
Average rate 2013
Year-end rate 2012
Average rate 2012
1.3768 1.3283 1.3242 1.2855 0.8350 0.8493 0.8206 0.8111
EUR/USD .............................................................................................EUR/GBP .............................................................................................
The following table details the Group's sensitivity of transaction and translation risk to a 10% increase and decrease in the EUR against the relevant foreign currencies. 10% is the sensitivity rate used when reporting foreign currency risk internally to key management personnel and represents management's assessment of the reasonably possible change in foreign exchange rates. The sensitivity analysis includes only outstanding foreign currency denominated monetary items and adjusts their translation at the period-end for a 10% change in foreign currency rates. The sensitivity analysis includes external loans as well as loans to foreign operations within the Group where the denomination of the loan is in a currency other than the functional currency of the lender or the borrower. A positive number below indicates an increase in profit or equity where the EUR strengthens 10% against the relevant currency.
For a 10% weakening of the EUR against the relevant currency, there would be a comparable impact on the profit or equity, and the balances below would be opposite.
USD impact
GBP impact
USD impact
GBP impact
(682) (856) (683) (1,033)- - - -
2013 2012
Prof it or (loss) .....................................................................................Equity ..................................................................................................
On the operational side, only a fraction of a percentage of revenues is denominated in ISK, while around 6.6% (2012: 5.8%) of costs is in ISK.
Liabilities in currency recorded in EUR in 2013Finance lease
liabilities
Capitalised finance
chargesOther
borrowings Total
90 - 3,221 3,311 - (2,991) 139,500 136,509 107 (1,104) 98,053 97,056 47 - - 47
244 (4,095) 240,774 236,923 (220) 1,365 (23,222) (22,077)
24 (2,730) 217,552 214,846 Current matures .........................................................................
Liabilities in other currencies .....................................................Liabilities in USD .........................................................................Liabilities in EUR .........................................................................Liabilities in DKK .........................................................................
Liabilities in currency recorded in EUR in 2012Finance lease
liabilities
Capitalised finance
chargesOther
borrowings Total
69 - 8,929 8,998 - (4,006) 153,500 149,494 235 (1,556) 101,949 100,628 67 - - 67
371 (5,562) 264,378 259,187 (196) 1,390 (20,634) (19,440)
175 (4,172) 243,744 239,747
Liabilities in DKK .........................................................................Liabilities in EUR .........................................................................Liabilities in USD .........................................................................Liabilities in other currencies .....................................................
Current matures .........................................................................
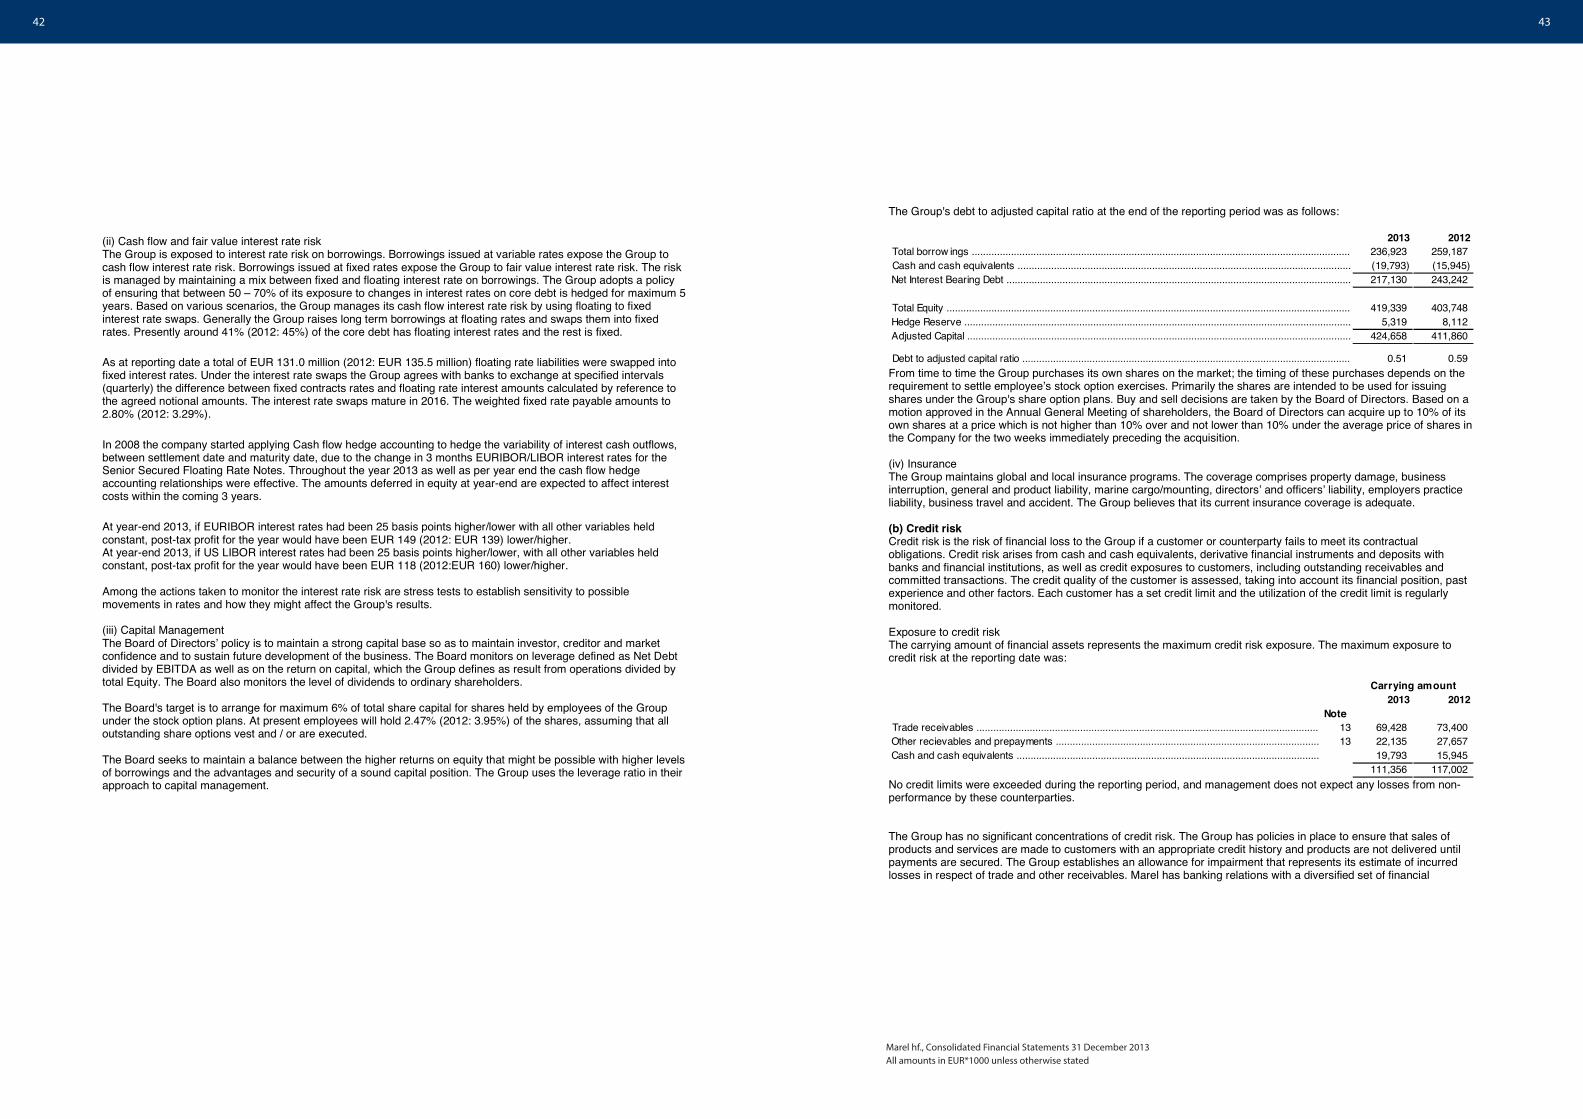
42 43
Marel hf., Consolidated Financial Statements 31 December 2013All amounts in EUR*1000 unless otherwise stated
(ii) Cash flow and fair value interest rate risk The Group is exposed to interest rate risk on borrowings. Borrowings issued at variable rates expose the Group to cash flow interest rate risk. Borrowings issued at fixed rates expose the Group to fair value interest rate risk. The risk is managed by maintaining a mix between fixed and floating interest rate on borrowings. The Group adopts a policy of ensuring that between 50 – 70% of its exposure to changes in interest rates on core debt is hedged for maximum 5 years. Based on various scenarios, the Group manages its cash flow interest rate risk by using floating to fixed interest rate swaps. Generally the Group raises long term borrowings at floating rates and swaps them into fixed rates. Presently around 41% (2012: 45%) of the core debt has floating interest rates and the rest is fixed.
As at reporting date a total of EUR 131.0 million (2012: EUR 135.5 million) floating rate liabilities were swapped into fixed interest rates. Under the interest rate swaps the Group agrees with banks to exchange at specified intervals (quarterly) the difference between fixed contracts rates and floating rate interest amounts calculated by reference to the agreed notional amounts. The interest rate swaps mature in 2016. The weighted fixed rate payable amounts to 2.80% (2012: 3.29%).
In 2008 the company started applying Cash flow hedge accounting to hedge the variability of interest cash outflows, between settlement date and maturity date, due to the change in 3 months EURIBOR/LIBOR interest rates for the Senior Secured Floating Rate Notes. Throughout the year 2013 as well as per year end the cash flow hedge accounting relationships were effective. The amounts deferred in equity at year-end are expected to affect interest costs within the coming 3 years.
At year-end 2013, if EURIBOR interest rates had been 25 basis points higher/lower with all other variables held constant, post-tax profit for the year would have been EUR 149 (2012: EUR 139) lower/higher. At year-end 2013, if US LIBOR interest rates had been 25 basis points higher/lower, with all other variables held constant, post-tax profit for the year would have been EUR 118 (2012:EUR 160) lower/higher.
Among the actions taken to monitor the interest rate risk are stress tests to establish sensitivity to possible movements in rates and how they might affect the Group's results.
(iii) Capital Management The Board of Directorsʼ policy is to maintain a strong capital base so as to maintain investor, creditor and market confidence and to sustain future development of the business. The Board monitors on leverage defined as Net Debt divided by EBITDA as well as on the return on capital, which the Group defines as result from operations divided by total Equity. The Board also monitors the level of dividends to ordinary shareholders.
The Board's target is to arrange for maximum 6% of total share capital for shares held by employees of the Group under the stock option plans. At present employees will hold 2.47% (2012: 3.95%) of the shares, assuming that all outstanding share options vest and / or are executed.
The Board seeks to maintain a balance between the higher returns on equity that might be possible with higher levels of borrowings and the advantages and security of a sound capital position. The Group uses the leverage ratio in their approach to capital management.
The Group's debt to adjusted capital ratio at the end of the reporting period was as follows:
2013 2012236,923 259,187 (19,793) (15,945)217,130 243,242
419,339 403,748 5,319 8,112
424,658 411,860
0.51 0.59
Total borrow ings .......................................................................................................................................
Adjusted Capital .........................................................................................................................................Hedge Reserve ..........................................................................................................................................Total Equity ................................................................................................................................................
Net Interest Bearing Debt ...........................................................................................................................Cash and cash equivalents .......................................................................................................................
Debt to adjusted capital ratio .....................................................................................................................From time to time the Group purchases its own shares on the market; the timing of these purchases depends on the requirement to settle employeeʼs stock option exercises. Primarily the shares are intended to be used for issuing shares under the Group's share option plans. Buy and sell decisions are taken by the Board of Directors. Based on a motion approved in the Annual General Meeting of shareholders, the Board of Directors can acquire up to 10% of its own shares at a price which is not higher than 10% over and not lower than 10% under the average price of shares in the Company for the two weeks immediately preceding the acquisition.
(iv) Insurance The Group maintains global and local insurance programs. The coverage comprises property damage, business interruption, general and product liability, marine cargo/mounting, directorsʼ and officersʼ liability, employers practice liability, business travel and accident. The Group believes that its current insurance coverage is adequate.
(b) Credit risk Credit risk is the risk of financial loss to the Group if a customer or counterparty fails to meet its contractual obligations. Credit risk arises from cash and cash equivalents, derivative financial instruments and deposits with banks and financial institutions, as well as credit exposures to customers, including outstanding receivables and committed transactions. The credit quality of the customer is assessed, taking into account its financial position, past experience and other factors. Each customer has a set credit limit and the utilization of the credit limit is regularly monitored.
Exposure to credit risk The carrying amount of financial assets represents the maximum credit risk exposure. The maximum exposure to credit risk at the reporting date was:
2013 2012Note
13 69,428 73,400 13 22,135 27,657
19,793 15,945 111,356 117,002
Carrying amount
Trade receivables ..........................................................................................................................Other recievables and prepayments ..............................................................................................Cash and cash equivalents ............................................................................................................
No credit limits were exceeded during the reporting period, and management does not expect any losses from non-performance by these counterparties.
The Group has no significant concentrations of credit risk. The Group has policies in place to ensure that sales of products and services are made to customers with an appropriate credit history and products are not delivered until payments are secured. The Group establishes an allowance for impairment that represents its estimate of incurred losses in respect of trade and other receivables. Marel has banking relations with a diversified set of financial
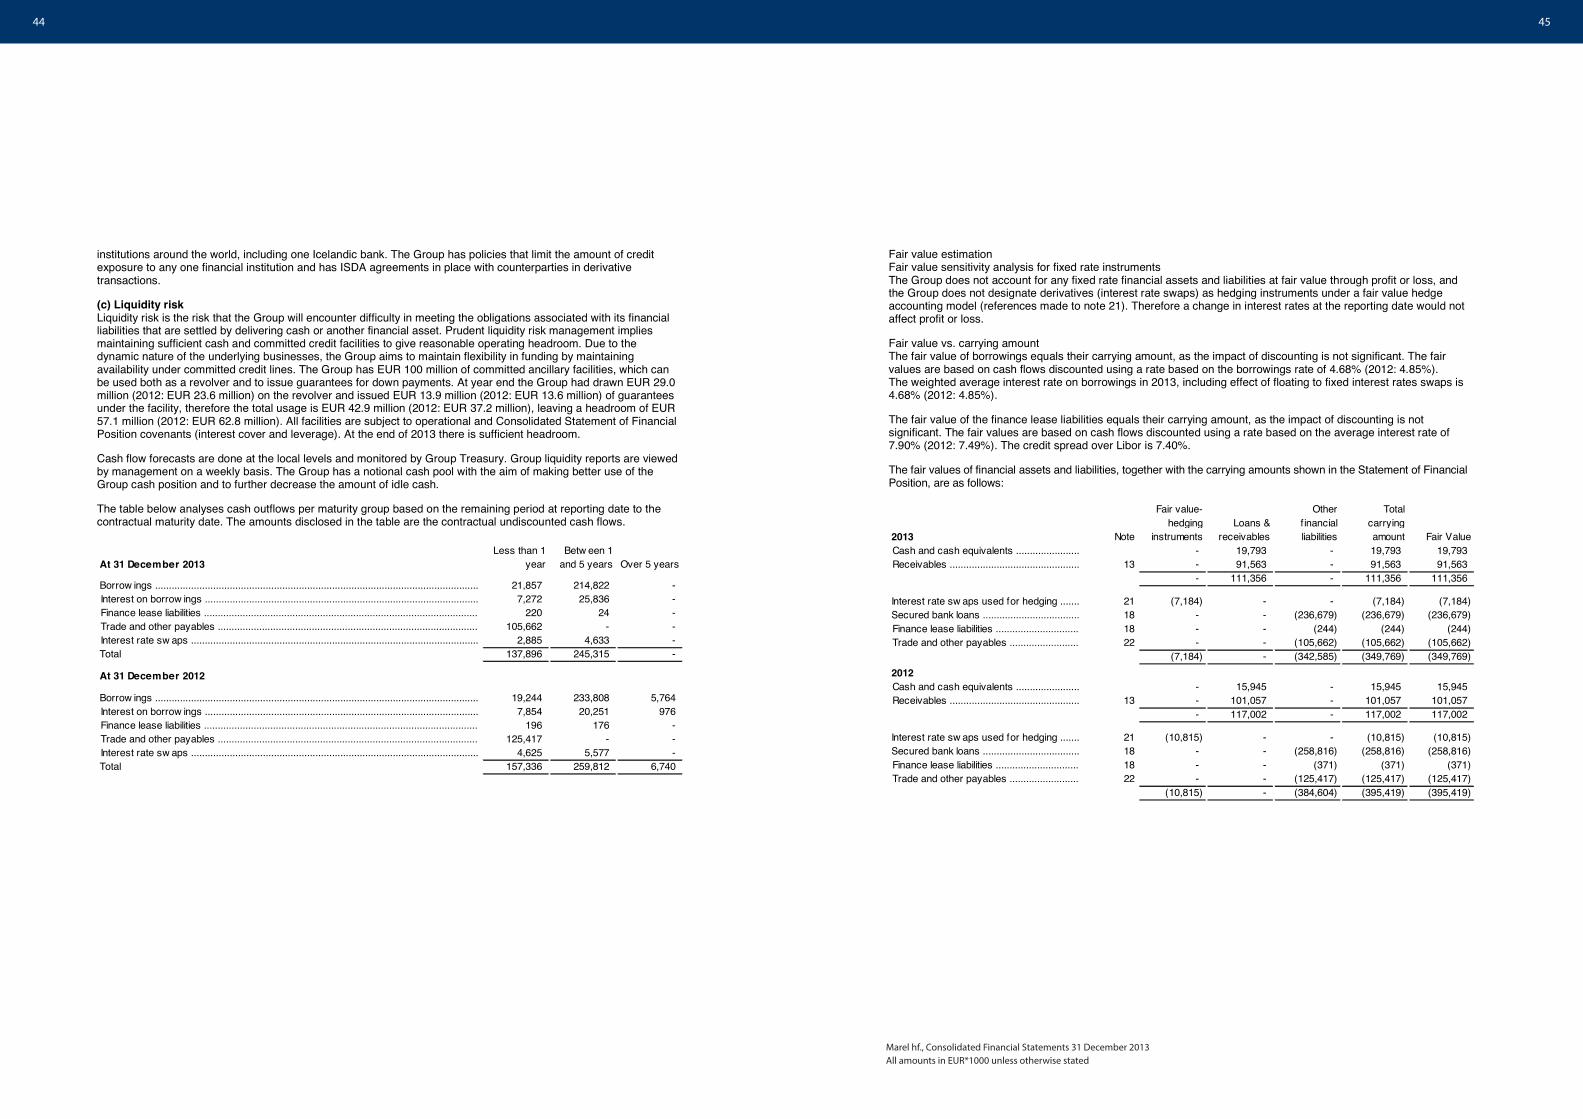
44 45
Marel hf., Consolidated Financial Statements 31 December 2013All amounts in EUR*1000 unless otherwise stated
institutions around the world, including one Icelandic bank. The Group has policies that limit the amount of credit exposure to any one financial institution and has ISDA agreements in place with counterparties in derivative transactions.
(c) Liquidity risk Liquidity risk is the risk that the Group will encounter difficulty in meeting the obligations associated with its financial liabilities that are settled by delivering cash or another financial asset. Prudent liquidity risk management implies maintaining sufficient cash and committed credit facilities to give reasonable operating headroom. Due to the dynamic nature of the underlying businesses, the Group aims to maintain flexibility in funding by maintaining availability under committed credit lines. The Group has EUR 100 million of committed ancillary facilities, which can be used both as a revolver and to issue guarantees for down payments. At year end the Group had drawn EUR 29.0 million (2012: EUR 23.6 million) on the revolver and issued EUR 13.9 million (2012: EUR 13.6 million) of guarantees under the facility, therefore the total usage is EUR 42.9 million (2012: EUR 37.2 million), leaving a headroom of EUR 57.1 million (2012: EUR 62.8 million). All facilities are subject to operational and Consolidated Statement of Financial Position covenants (interest cover and leverage). At the end of 2013 there is sufficient headroom.
Cash flow forecasts are done at the local levels and monitored by Group Treasury. Group liquidity reports are viewed by management on a weekly basis. The Group has a notional cash pool with the aim of making better use of the Group cash position and to further decrease the amount of idle cash.
The table below analyses cash outflows per maturity group based on the remaining period at reporting date to the contractual maturity date. The amounts disclosed in the table are the contractual undiscounted cash flows.
At 31 December 2013Less than 1
yearBetw een 1
and 5 years Over 5 years
21,857 214,822 - 7,272 25,836 -
220 24 - 105,662 - -
2,885 4,633 - Total 137,896 245,315 -
At 31 December 2012
19,244 233,808 5,764 7,854 20,251 976
196 176 - 125,417 - -
4,625 5,577 - Total 157,336 259,812 6,740
Interest rate sw aps ........................................................................................................
Borrow ings .....................................................................................................................Interest on borrow ings ...................................................................................................Finance lease liabilities ...................................................................................................Trade and other payables ..............................................................................................
Fair value estimationFair value sensitivity analysis for fixed rate instruments The Group does not account for any fixed rate financial assets and liabilities at fair value through profit or loss, and the Group does not designate derivatives (interest rate swaps) as hedging instruments under a fair value hedge accounting model (references made to note 21). Therefore a change in interest rates at the reporting date would not affect profit or loss.
Fair value vs. carrying amount The fair value of borrowings equals their carrying amount, as the impact of discounting is not significant. The fair values are based on cash flows discounted using a rate based on the borrowings rate of 4.68% (2012: 4.85%). The weighted average interest rate on borrowings in 2013, including effect of floating to fixed interest rates swaps is 4.68% (2012: 4.85%).
The fair value of the finance lease liabilities equals their carrying amount, as the impact of discounting is not significant. The fair values are based on cash flows discounted using a rate based on the average interest rate of 7.90% (2012: 7.49%). The credit spread over Libor is 7.40%.
The fair values of financial assets and liabilities, together with the carrying amounts shown in the Statement of Financial Position, are as follows:
2013 Note
Fair value- hedging
instrumentsLoans &
receivables
Other f inancial liabilities
Total carrying amount Fair Value
- 19,793 - 19,793 19,793 13 - 91,563 - 91,563 91,563
- 111,356 - 111,356 111,356
21 (7,184) - - (7,184) (7,184) 18 - - (236,679) (236,679) (236,679) 18 - - (244) (244) (244) 22 - - (105,662) (105,662) (105,662)
(7,184) - (342,585) (349,769) (349,769) 2012
- 15,945 - 15,945 15,945 13 - 101,057 - 101,057 101,057
- 117,002 - 117,002 117,002
21 (10,815) - - (10,815) (10,815) 18 - - (258,816) (258,816) (258,816) 18 - - (371) (371) (371) 22 - - (125,417) (125,417) (125,417)
(10,815) - (384,604) (395,419) (395,419) Trade and other payables .........................Finance lease liabilities ..............................
Secured bank loans ...................................Finance lease liabilities ..............................Trade and other payables .........................
Cash and cash equivalents .......................Receivables ...............................................
Interest rate sw aps used for hedging .......Secured bank loans ...................................
Interest rate sw aps used for hedging .......
Cash and cash equivalents .......................Receivables ...............................................

46 47
Marel hf., Consolidated Financial Statements 31 December 2013All amounts in EUR*1000 unless otherwise stated
The Group measures fair values using the following fair value hierarchy that reflects the significance of the inputs used in making measurements:
Level 1: The fair value of financial instruments traded in active market, such as trading and available-for-sale securities, is based on quoted market prices at the reporting date. The quoted market price used for financial assets held by the Group is the current bid price.
Level 2: The fair value of financial instruments that are not traded in an active market is determined by using valuation techniques. The Group uses a variety of methods and makes assumptions that are based on market conditions existing at each reporting date. These valuation techniques are based on observable inputs, either directly (i.e. as prices) or indirectly (i.e. derived from prices).
Level 3: Valuation techniques using significant unobservable inputs.
The table below analyses financial instruments, measured at fair value at the end of the reporting period, by the level in the fair value hierarchy into which the fair value measurement is categorised:
At 31 December 2013 Level 1 Level 2 Level 3 Total- 7,184 - 7,184
At 31 December 2012- 10,815 - 10,815
Derrivate liabilities held for risk management .........................................
Derrivate liabilities held for risk management .........................................
No financial instruments were transferred from Level 1 to Level 2, or from Level 2 to Level 3 of the fair value hierarchy.
4 Critical accounting estimates and assumptions Estimates and judgements are continuously evaluated and are based on historical experience and other factors, including expectations of future events that are believed to be reasonable under the circumstances. The Group makes estimates and assumptions concerning the future. The actual results will, by definition, seldom be exactly equal to the related accounting estimates used.
The estimates and assumptions that have a significant risk of causing a material adjustment to the carrying amounts of assets and liabilities within the next financial year are discussed below.
(a) Estimated impairment The Group tests annually whether goodwill has suffered any impairment, in accordance with the accounting policy stated in note 2.7. The recoverable amounts of cash-generating units have been determined based on value-in-use calculations. These calculations require the use of estimates (note 12).
The Group tests annually whether financial assets have suffered any impairment, in accordance with the accounting policy stated in note 2.8. The recoverable amounts of cash-generating units have been determined based on value in use calculation. These calculations require the use of estimates.
(b) Income taxes The Group is subject to income taxes in numerous jurisdictions. Significant judgement is required in determining the worldwide provision for income taxes. There are many transactions and calculations for which the ultimate tax determination is uncertain during the ordinary course of business. The Group recognises liabilities for anticipated tax audit issues based on estimates of whether additional taxes will be due. Where the final tax outcome of these matters is different from the amounts that were initially recorded, such differences will impact the income tax and deferred tax provisions in the period in which such determination is made.
(c) Fair value of derivatives and other financial instruments The fair value of financial instruments that are not traded in an active market (for example, over-the-counter derivatives) is determined by using valuation techniques. The Group uses its judgment to select a variety of methods and make assumptions that are mainly based on market conditions existing at each reporting date. The Group uses discounted cash flow analysis for available-for-sale financial assets that are not traded in active markets.
(d) Capitalised development cost The recoverability of the capitalised development cost is tested regularly, to verify if expected future economic benefits justify the values captured in the intangible fixed assets. The Group uses discounted cash flow analysis for this purpose. (e) Revenue recognition The Group uses the percentage-of-completion method in accounting for its revenues for production contracts. Use of the percentage-of-completion method requires the Group to estimate the stage of completion to date as a proportion of the total work to be performed.
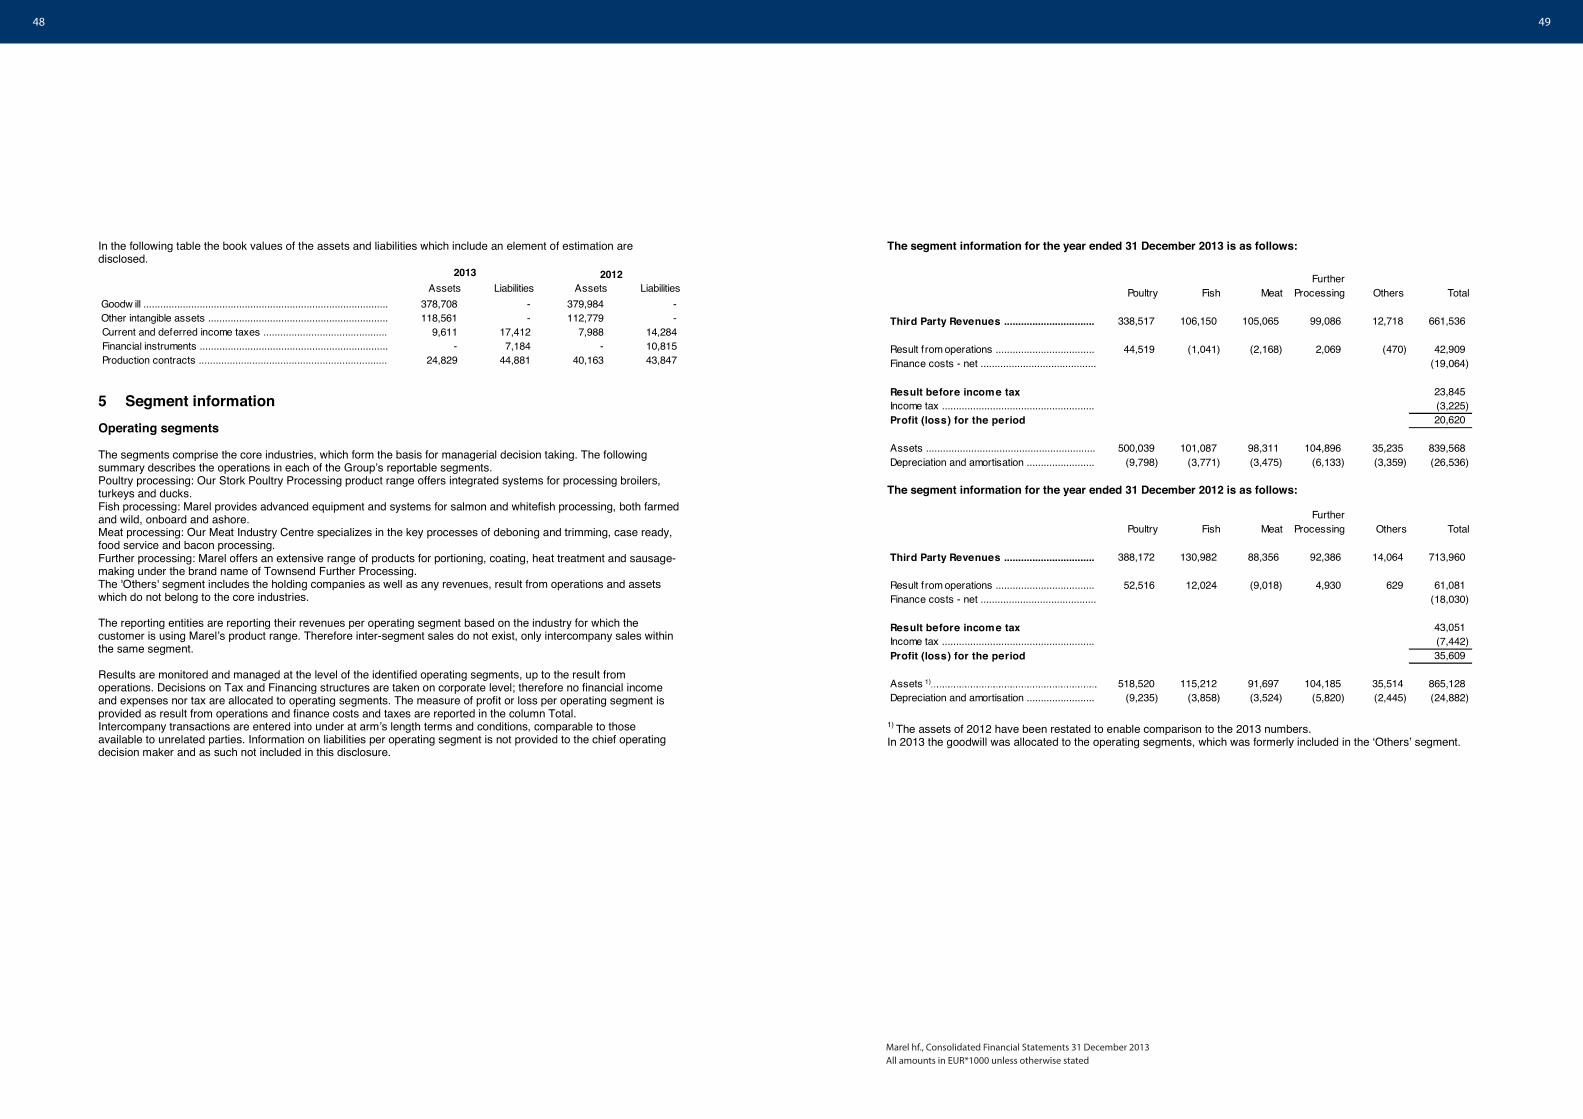
48 49
Marel hf., Consolidated Financial Statements 31 December 2013All amounts in EUR*1000 unless otherwise stated
In the following table the book values of the assets and liabilities which include an element of estimation are disclosed.
Assets Liabilities Assets Liabilities378,708 - 379,984 - 118,561 - 112,779 -
9,611 17,412 7,988 14,284 - 7,184 - 10,815
24,829 44,881 40,163 43,847 Production contracts ...................................................................
2013 2012
Goodw ill .......................................................................................Other intangible assets ................................................................Current and deferred income taxes ............................................Financial instruments ...................................................................
5 Segment information Operating segments
The segments comprise the core industries, which form the basis for managerial decision taking. The following summary describes the operations in each of the Groupʼs reportable segments. Poultry processing: Our Stork Poultry Processing product range offers integrated systems for processing broilers, turkeys and ducks. Fish processing: Marel provides advanced equipment and systems for salmon and whitefish processing, both farmed and wild, onboard and ashore. Meat processing: Our Meat Industry Centre specializes in the key processes of deboning and trimming, case ready, food service and bacon processing. Further processing: Marel offers an extensive range of products for portioning, coating, heat treatment and sausage-making under the brand name of Townsend Further Processing. The 'Others' segment includes the holding companies as well as any revenues, result from operations and assets which do not belong to the core industries.
The reporting entities are reporting their revenues per operating segment based on the industry for which the customer is using Marelʼs product range. Therefore inter-segment sales do not exist, only intercompany sales within the same segment.
Results are monitored and managed at the level of the identified operating segments, up to the result from operations. Decisions on Tax and Financing structures are taken on corporate level; therefore no financial income and expenses nor tax are allocated to operating segments. The measure of profit or loss per operating segment is provided as result from operations and finance costs and taxes are reported in the column Total. Intercompany transactions are entered into under at armʼs length terms and conditions, comparable to those available to unrelated parties. Information on liabilities per operating segment is not provided to the chief operating decision maker and as such not included in this disclosure.
The segment information for the year ended 31 December 2013 is as follows:
Poultry Fish MeatFurther
Processing Others Total
Third Party Revenues ................................ 338,517 106,150 105,065 99,086 12,718 661,536
Result from operations ................................... 44,519 (1,041) (2,168) 2,069 (470) 42,909 Finance costs - net ......................................... (19,064)
Result before income tax 23,845 Income tax ...................................................... (3,225) Profit (loss) for the period 20,620
Assets ............................................................ 500,039 101,087 98,311 104,896 35,235 839,568 Depreciation and amortisation ........................ (9,798) (3,771) (3,475) (6,133) (3,359) (26,536)
The segment information for the year ended 31 December 2012 is as follows:
Poultry Fish MeatFurther
Processing Others Total
Third Party Revenues ................................ 388,172 130,982 88,356 92,386 14,064 713,960
Result from operations ................................... 52,516 12,024 (9,018) 4,930 629 61,081 Finance costs - net ......................................... (18,030)
Result before income tax 43,051 Income tax ...................................................... (7,442) Profit (loss) for the period 35,609
Assets 1)…………………………………………………………………………………………………518,520 115,212 91,697 104,185 35,514 865,128 Depreciation and amortisation ........................ (9,235) (3,858) (3,524) (5,820) (2,445) (24,882)
1) The assets of 2012 have been restated to enable comparison to the 2013 numbers. In 2013 the goodwill was allocated to the operating segments, which was formerly included in the ʻOthersʼ segment.
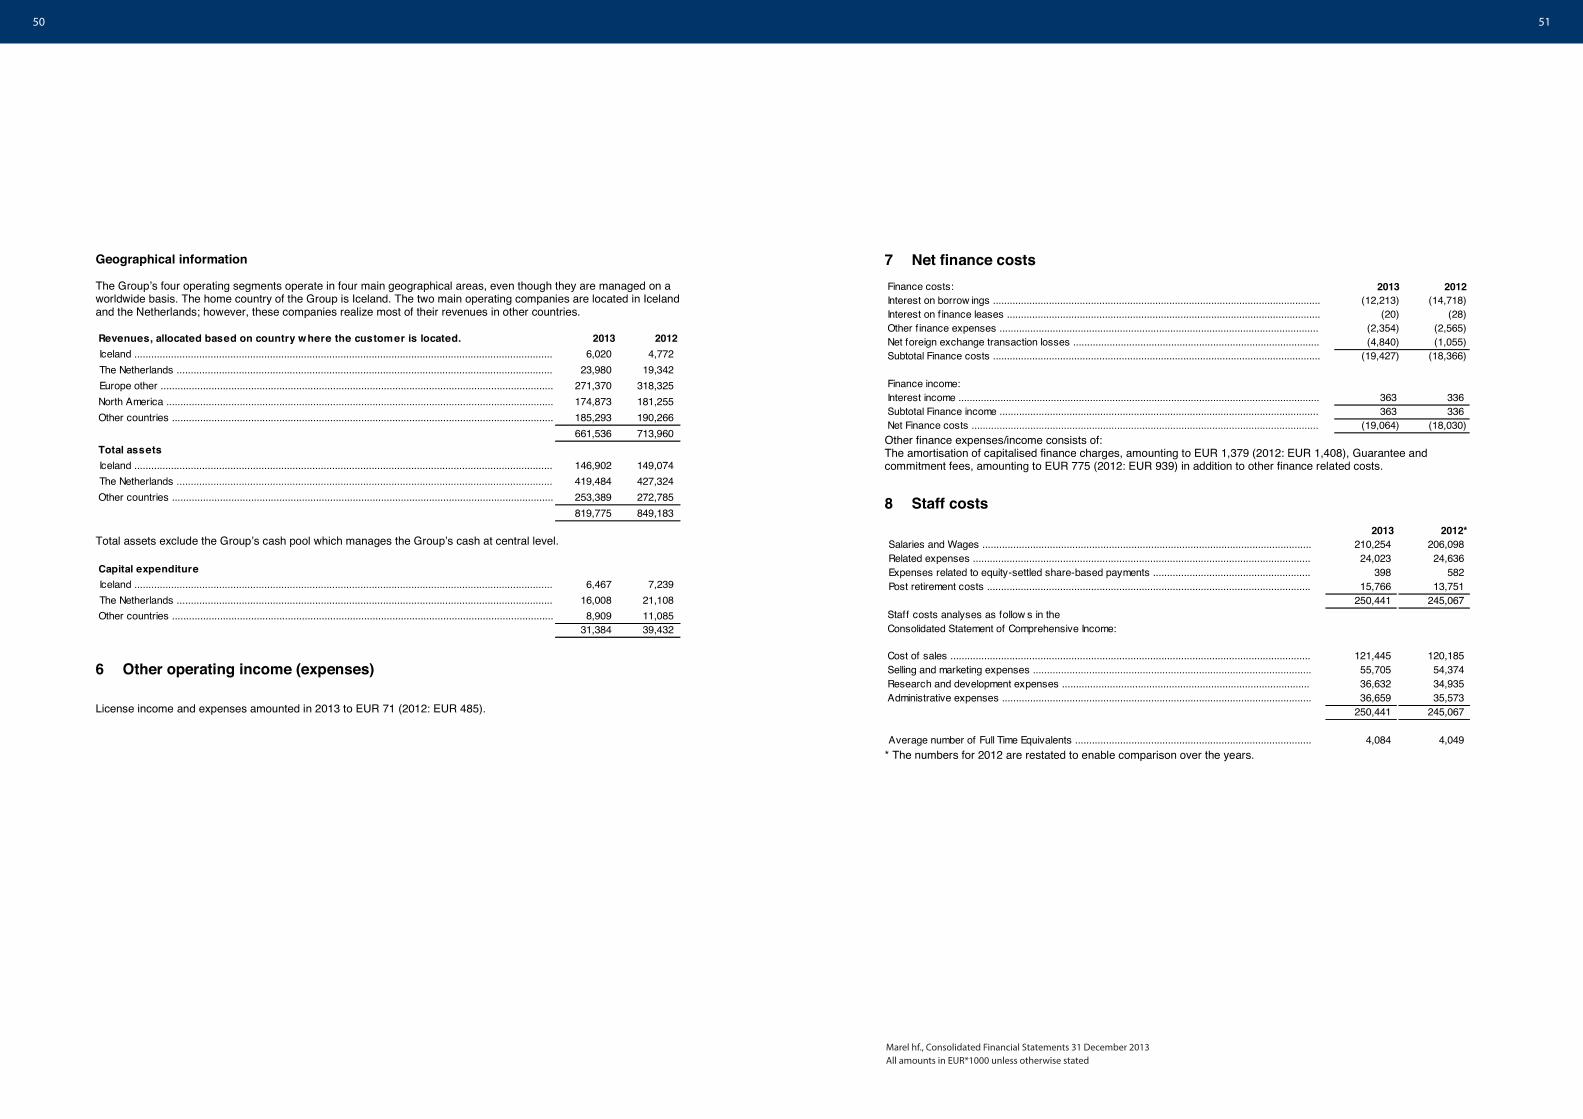
50 51
Marel hf., Consolidated Financial Statements 31 December 2013All amounts in EUR*1000 unless otherwise stated
Geographical information
The Groupʼs four operating segments operate in four main geographical areas, even though they are managed on a worldwide basis. The home country of the Group is Iceland. The two main operating companies are located in Iceland and the Netherlands; however, these companies realize most of their revenues in other countries.
Revenues, allocated based on country where the customer is located. 2013 20126,020 4,772
23,980 19,342 271,370 318,325 174,873 181,255 185,293 190,266 661,536 713,960
Total assets146,902 149,074 419,484 427,324 253,389 272,785 819,775 849,183
North America .........................................................................................................................................
Iceland ....................................................................................................................................................The Netherlands .....................................................................................................................................Europe other ...........................................................................................................................................
Other countries .......................................................................................................................................
Iceland ....................................................................................................................................................The Netherlands .....................................................................................................................................Other countries .......................................................................................................................................
Total assets exclude the Groupʼs cash pool which manages the Groupʼs cash at central level.
Capital expenditure6,467 7,239
16,008 21,108 8,909 11,085
31,384 39,432 Other countries .......................................................................................................................................
Iceland ....................................................................................................................................................The Netherlands .....................................................................................................................................
6 Other operating income (expenses)
License income and expenses amounted in 2013 to EUR 71 (2012: EUR 485).
7 Net finance costs Finance costs: 2013 2012
(12,213) (14,718) (20) (28)
(2,354) (2,565) (4,840) (1,055)
(19,427) (18,366)
Finance income:363 336 363 336
(19,064) (18,030)Subtotal Finance income ..................................................................................................................Net Finance costs ............................................................................................................................
Interest on borrow ings .....................................................................................................................Interest on f inance leases ................................................................................................................Other finance expenses ..................................................................................................................Net foreign exchange transaction losses ........................................................................................Subtotal Finance costs .....................................................................................................................
Interest income .................................................................................................................................
Other finance expenses/income consists of: The amortisation of capitalised finance charges, amounting to EUR 1,379 (2012: EUR 1,408), Guarantee and commitment fees, amounting to EUR 775 (2012: EUR 939) in addition to other finance related costs.
8 Staff costs 2013 2012*
210,254 206,098 24,023 24,636
398 582 15,766 13,751
250,441 245,067 Staff costs analyses as follow s in the Consolidated Statement of Comprehensive Income:
121,445 120,185 55,705 54,374 36,632 34,935 36,659 35,573
250,441 245,067
4,084 4,049
Selling and marketing expenses ...................................................................................................Research and development expenses ........................................................................................Administrative expenses ..............................................................................................................
Average number of Full Time Equivalents ....................................................................................
Salaries and Wages .....................................................................................................................Related expenses ........................................................................................................................Expenses related to equity-settled share-based payments ........................................................Post retirement costs ...................................................................................................................
Cost of sales ................................................................................................................................
* The numbers for 2012 are restated to enable comparison over the years.

52 53
Marel hf., Consolidated Financial Statements 31 December 2013All amounts in EUR*1000 unless otherwise stated
9 Income Tax 2013 2012
(3,350) (1,856)125 (5,586)
(3,225) (7,442)
Current tax .........................................................................................................................................Deferred tax .......................................................................................................................................
The tax on the Groupʼs profit before tax differs from the theoretical amount that would arise using the weighted average tax rate applicable to profits of the consolidated companies as follows:
Reconciliation of effective income tax% %
23,845 43,051
(4,769) 20.0 (8,610) 20.0 (2,376) 10.0 (2,564) 6.0 (7,145) 30.0 (11,174) 26.0
230 (1.0) (163) 0.4 2,687 (11.3) 2,981 (6.9)
249 (1.0) 401 (0.9) (24) 0.1 1,214 (2.8)484 (2.0) (655) 1.5 124 (1) (92) 0.2 170 (0.7) 46 (0.1)
Tax charge included in the prof it for the period (3,225) 13.5 (7,442) 17.3
Tax losses (un)recognised ..............................................................(Impairment)/reversal of tax losses .................................................Effect of tax rate changes ...............................................................Others ..............................................................................................
Permanent dif ferences .....................................................................
2013 2012
Result before income tax .................................................................
Income tax using Iceland rate ...........................................................Effect tax rates in other jurisdictions ...............................................Weighted average applicable tax .....................................................
FX effect Iceland ..............................................................................R&D tax incentives ...........................................................................
10 Earnings per share Basic earnings per share is calculated by dividing the net profit attributable to shareholders by the weighted average number of ordinary shares in issue during the period, excluding ordinary shares purchased by the Company and held as treasury shares.
Basic earnings per share (EUR cent per share) 2013 201220,620 35,609
733,741 729,545 2.81 4.88
Net prof it attributable to shareholders .............................................................................................Weighted average number of outstanding shares in issue (thousands) ........................................Basic earnings per share (EUR cent per share) .............................................................................
The diluted earnings per share is calculated by adjusting the weighted average number of ordinary shares outstanding to assume conversion of all dilutive potential ordinary shares. The Company has one category of dilutive potential ordinary shares: share options. For the share options a calculation is done to determine the number of shares that could have been acquired at fair value (determined as the average annual market share price of the Companyʼs shares) based on the monetary value of the subscription rights attached to outstanding share options. The number of shares calculated as above is compared with the number of shares that would have been issued assuming the exercise of the share options.
Diluted earnings per share (EUR cent) 2013 201220,620 35,609
733,741 729,545 5,119 7,613
738,860 737,158 2.79 4.83
Weighted average number of outstanding shares for diluted earnings per share (thousands) .....Diluted earnings per share (EUR cent) ............................................................................................
Net prof it used to determine diluted earnings per share ..................................................................
Weighted average number of outstanding shares in issue (thousands) ........................................Adjustments for share options (thousands) ....................................................................................

54 55
Marel hf., Consolidated Financial Statements 31 December 2013All amounts in EUR*1000 unless otherwise stated
11 Property, plant and equipment
Land & Plant & Vehicles & buildings machinery equipment Total
At 1 January 2012Cost ...................................................................................... 112,621 63,895 44,800 221,316 Accumulated depreciation ..................................................... (30,249) (46,143) (36,836) (113,228)Net book amount .................................................................... 82,372 17,752 7,964 108,088
Year ended 31 December 2012Opening net book amount ..................................................... 82,372 17,752 7,964 108,088 Exchange dif ferences ........................................................... (217) (215) (258) (690)Additions ............................................................................... 3,249 3,367 4,663 11,279 Disposals .............................................................................. (65) (113) (520) (698)Depreciation charge ............................................................. (2,982) (4,004) (2,959) (9,945)Closing net book amount ........................................................ 82,357 16,787 8,890 108,034
At 1 January 2013Cost ...................................................................................... 115,433 65,434 47,370 228,237 Accumulated depreciation ..................................................... (33,076) (48,647) (38,480) (120,203)Net book amount .................................................................... 82,357 16,787 8,890 108,034
Year ended 31 December 2013Opening net book amount ..................................................... 82,357 16,787 8,890 108,034 Exchange dif ferences ........................................................... (602) (118) (203) (923)Additions ............................................................................... 1,055 4,604 1,696 7,355 Disposals .............................................................................. - (116) (262) (378)Reclassification to intangible assets ..................................... - - (111) (111)Depreciation charge ............................................................. (3,059) (3,423) (2,788) (9,270)Closing net book amount ........................................................ 79,751 17,734 7,222 104,707
At 31 December 2013Cost ...................................................................................... 115,497 66,693 44,767 226,957 Accumulated depreciation ..................................................... (35,746) (48,959) (37,545) (122,250)Net book amount .................................................................... 79,751 17,734 7,222 104,707
Depreciation of property, plant and equipment analyses as follows in the Consolidated Statement of Comprehensive Income:
2013 20125,675 6,383
853 795 450 373
2,292 2,394 9,270 9,945
Administrative expenses ...............................................................................................................
Cost of sales .................................................................................................................................Selling and marketing expenses ....................................................................................................Research and development expenses .........................................................................................
As of 31 December 2013, mortgages included in interest bearing debt amounted to EUR 3,221 (2012: EUR 8,929), which are secured against a pledge on the real estate for the amount of EUR 5,412 (2012: EUR 12,363).
The carrying amount of the assets recognised under finance lease is EUR 460 (2012: EUR 714).

56 57
Marel hf., Consolidated Financial Statements 31 December 2013All amounts in EUR*1000 unless otherwise stated
12 Intangible Assets
Developm. Patents & Other Total otherGoodwill costs Trade name Intangibles Intangibles
At 1 January 2012Cost .......................................................................... 380,419 80,305 51,661 14,480 146,446 Accumulated amortisation ......................................... - (29,438) (12,060) (4,875) (46,373) Net book amount ....................................................... 380,419 50,867 39,601 9,605 100,073
Year ended 31 December 2012Opening net book amount ........................................ 380,419 50,867 39,601 9,605 100,073 Exchange dif ferences .............................................. (435) 168 (439) (239) (510) Additions ................................................................... - 22,459 - 5,694 28,153 Reclassification ......................................................... - 1,275 (625) (650) - Amortisation charge ................................................. - (9,337) (3,603) (1,997) (14,937) Closing net book amount ........................................... 379,984 65,432 34,934 12,413 112,779
At 1 January 2013Cost .......................................................................... 379,984 103,575 50,985 19,187 173,747 Accumulated depreciation ........................................ - (38,143) (16,051) (6,774) (60,968) Net book amount ....................................................... 379,984 65,432 34,934 12,413 112,779
Year ended 31 December 2013Opening net book amount ........................................ 379,984 65,432 34,934 12,413 112,779 Reclassification ......................................................... - (654) 556 98 - Exchange dif ferences .............................................. (1,276) (440) (626) (26) (1,092) Additions ................................................................... - 21,484 - 2,545 24,029 Reclassification from tangible assets ....................... - - - 111 111 Amortisation charge ................................................. - (10,915) (3,534) (2,817) (17,266) Closing net book amount ........................................... 378,708 74,907 31,330 12,324 118,561
At 31 December 2013Cost .......................................................................... 378,708 122,537 50,512 22,792 195,841 Accumulated amortisation ......................................... - (47,630) (19,182) (10,468) (77,280) Net book amount ....................................................... 378,708 74,907 31,330 12,324 118,561
Amortisation of intangible assets analyses as follows in the Consolidated Statement of Comprehensive Income:
2013 2012104 78 355 353
12,162 10,586 4,645 3,920
17,266 14,937
Cost of sales ......................................................................................................................................Selling and marketing expenses ........................................................................................................Research and development expenses ..............................................................................................Administrative expenses ...................................................................................................................
Goodwill impairment testing
Annually goodwill is tested for impairment at the level of the Group's Cash Generating Units (CGUs). For Marel, the CGUs are based on the market oriented business model (Poultry, Fish, Further Processing and Meat) in accordance with IFRS 8 Operating Segments. Only at the level of the operating segments the connection can be made between the business for which the goodwill was originally paid and the results of the synergies after the acquisition of Stork Food Systems by Marel. The annual impairment test includes all fixed assets and net working capital allocated to CGUs.
The purpose of impairment testing is to determine whether the recoverable amount exceeds the carrying amount. The recoverable amount of an operating segment is determined as the present value of the future cash flows expected to be derived from a CGU, based on amongst others:
• the estimated future cash flows that the Group expects the CGU to earn; • possible variations in the amount or timing of those future cash flows; • the time value of money, which is reflected by using a discount rate based on the current market risk-free
rate of interest; • the price for the uncertainty inherent in the CGU.
Future cash flows are based on financial budgets approved by management with an average weighted growth rate of 9% to 17% for a five year period. Cash flows beyond the strategic plan period are extrapolated using estimated growth rates as shown in the table below, as well as a post-tax discount rate of 9.5%. The growth rate does not exceed the long-term average growth rate for the business in which the CGU operates.
The Goodwill impairment test performed in the fourth quarter, which was based on the numbers of 30 September 2013, confirmed the recoverability of existing goodwill. Since the outcome of the impairment testing exceeded the carrying amounts with significantly more than 10%, sensitivity testing is not required. At 31 December there were no triggers which indicated that a new calculation was required.
The key assumptions used for the impairment test in 2013 are listed below.
2013 Poultry Fish MeatFurther
ProcessingTotal
GoodwillGoodwill 320,394 25,869 21,052 11,393 378,708
Growth rate 1)………………………………………………………………………………………………………………3.0% 3.0% 3.0% 3.0% 3.0%Discount rate 2)………………………………………………………………………………………………………………………………9.5% 9.5% 9.5% 9.5% 9.5%
1) Weighted average growth rate used to extrapolate cash flows beyond strategic plan period. 2) Discount rate applied to the cash flow projections.
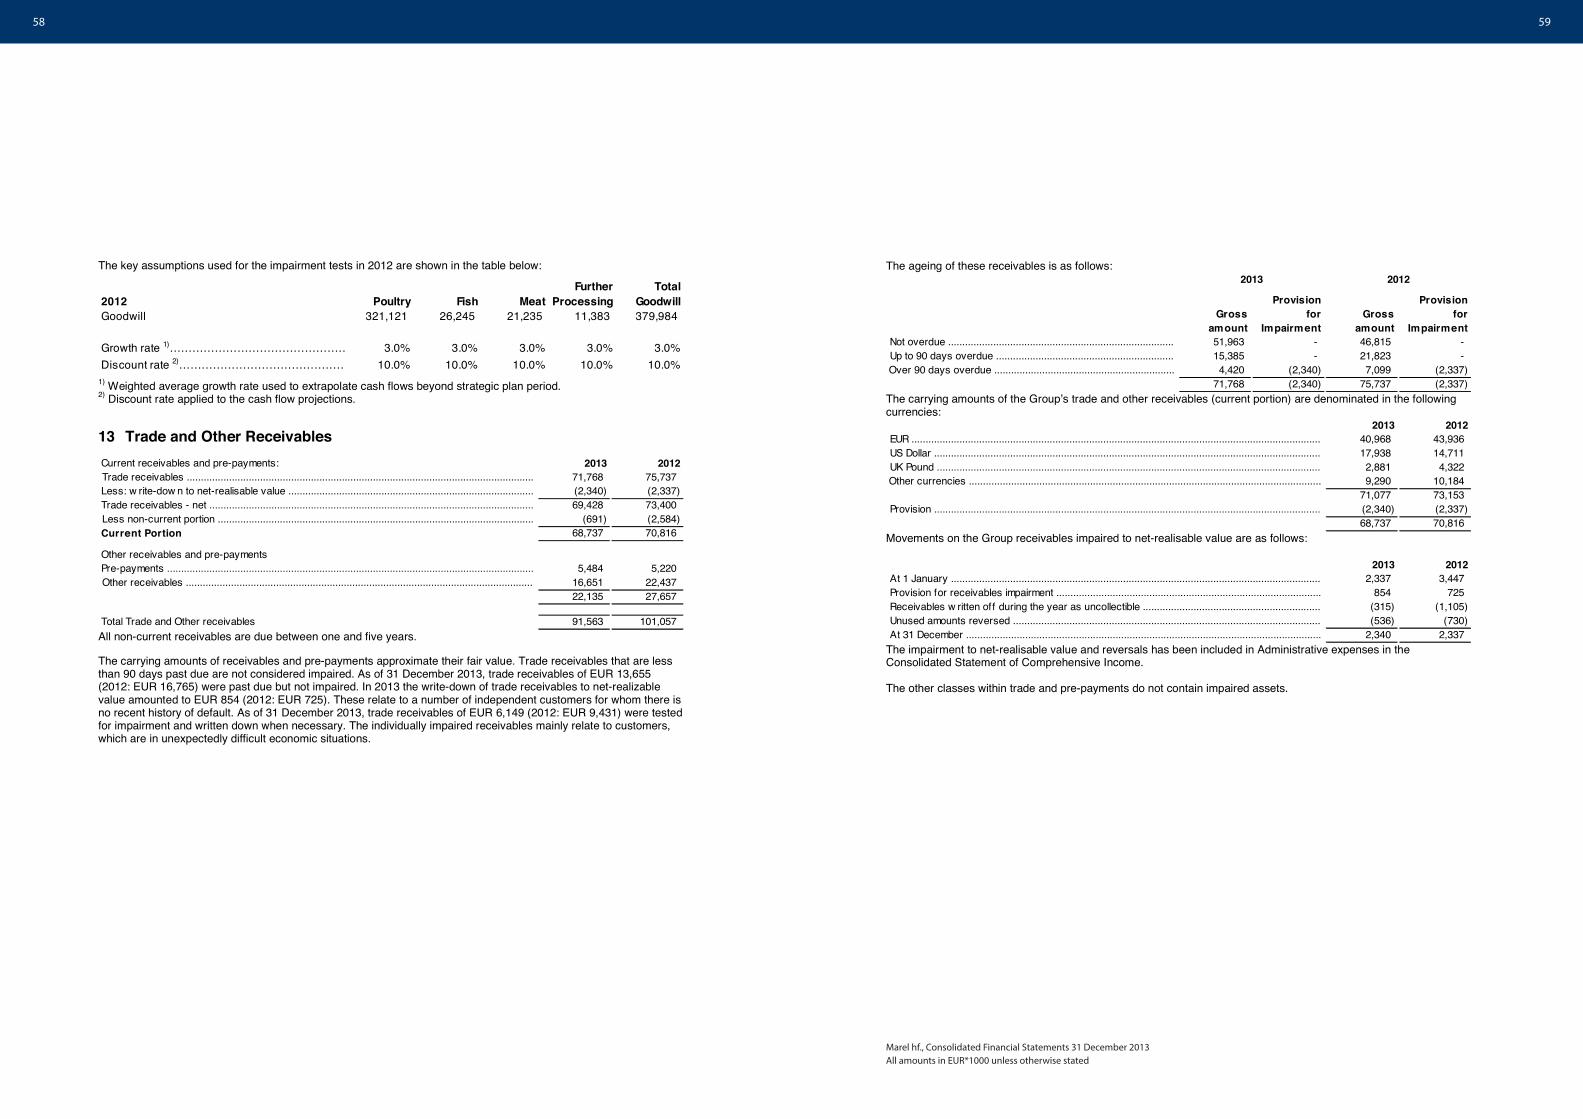
58 59
Marel hf., Consolidated Financial Statements 31 December 2013All amounts in EUR*1000 unless otherwise stated
The key assumptions used for the impairment tests in 2012 are shown in the table below:
2012 Poultry Fish MeatFurther
ProcessingTotal
GoodwillGoodwill 321,121 26,245 21,235 11,383 379,984
Growth rate 1)………………………………………………………………………………………………………………3.0% 3.0% 3.0% 3.0% 3.0%Discount rate 2)………………………………………………………………………………………………………………………………10.0% 10.0% 10.0% 10.0% 10.0%
1) Weighted average growth rate used to extrapolate cash flows beyond strategic plan period. 2) Discount rate applied to the cash flow projections.
13 Trade and Other Receivables Current receivables and pre-payments: 2013 2012
71,768 75,737 (2,340) (2,337) 69,428 73,400
(691) (2,584) Current Portion 68,737 70,816
Other receivables and pre-payments5,484 5,220
16,651 22,437 22,135 27,657
Total Trade and Other receivables 91,563 101,057
Other receivables ...........................................................................................................................
Trade receivables ...........................................................................................................................Less: w rite-dow n to net-realisable value .......................................................................................Trade receivables - net ...................................................................................................................Less non-current portion ................................................................................................................
Pre-payments ..................................................................................................................................
All non-current receivables are due between one and five years.
The carrying amounts of receivables and pre-payments approximate their fair value. Trade receivables that are less than 90 days past due are not considered impaired. As of 31 December 2013, trade receivables of EUR 13,655 (2012: EUR 16,765) were past due but not impaired. In 2013 the write-down of trade receivables to net-realizable value amounted to EUR 854 (2012: EUR 725). These relate to a number of independent customers for whom there is no recent history of default. As of 31 December 2013, trade receivables of EUR 6,149 (2012: EUR 9,431) were tested for impairment and written down when necessary. The individually impaired receivables mainly relate to customers, which are in unexpectedly difficult economic situations.
The ageing of these receivables is as follows:
Gross amount
Provision for
ImpairmentGross
amount
Provision for
Impairment51,963 - 46,815 - 15,385 - 21,823 - 4,420 (2,340) 7,099 (2,337)
71,768 (2,340) 75,737 (2,337)
2013 2012
Up to 90 days overdue ...............................................................Over 90 days overdue ................................................................
Not overdue ................................................................................
The carrying amounts of the Groupʼs trade and other receivables (current portion) are denominated in the following currencies:
2013 201240,968 43,936 17,938 14,711 2,881 4,322 9,290 10,184
71,077 73,153 (2,340) (2,337) 68,737 70,816
UK Pound ........................................................................................................................................Other currencies .............................................................................................................................
Provision .........................................................................................................................................
EUR .................................................................................................................................................US Dollar .........................................................................................................................................
Movements on the Group receivables impaired to net-realisable value are as follows:
2013 20122,337 3,447
854 725 (315) (1,105) (536) (730)
2,340 2,337 Unused amounts reversed .............................................................................................................At 31 December ..............................................................................................................................
At 1 January ...................................................................................................................................Provision for receivables impairment ..............................................................................................Receivables w ritten off during the year as uncollectible ...............................................................
The impairment to net-realisable value and reversals has been included in Administrative expenses in the Consolidated Statement of Comprehensive Income.
The other classes within trade and pre-payments do not contain impaired assets.
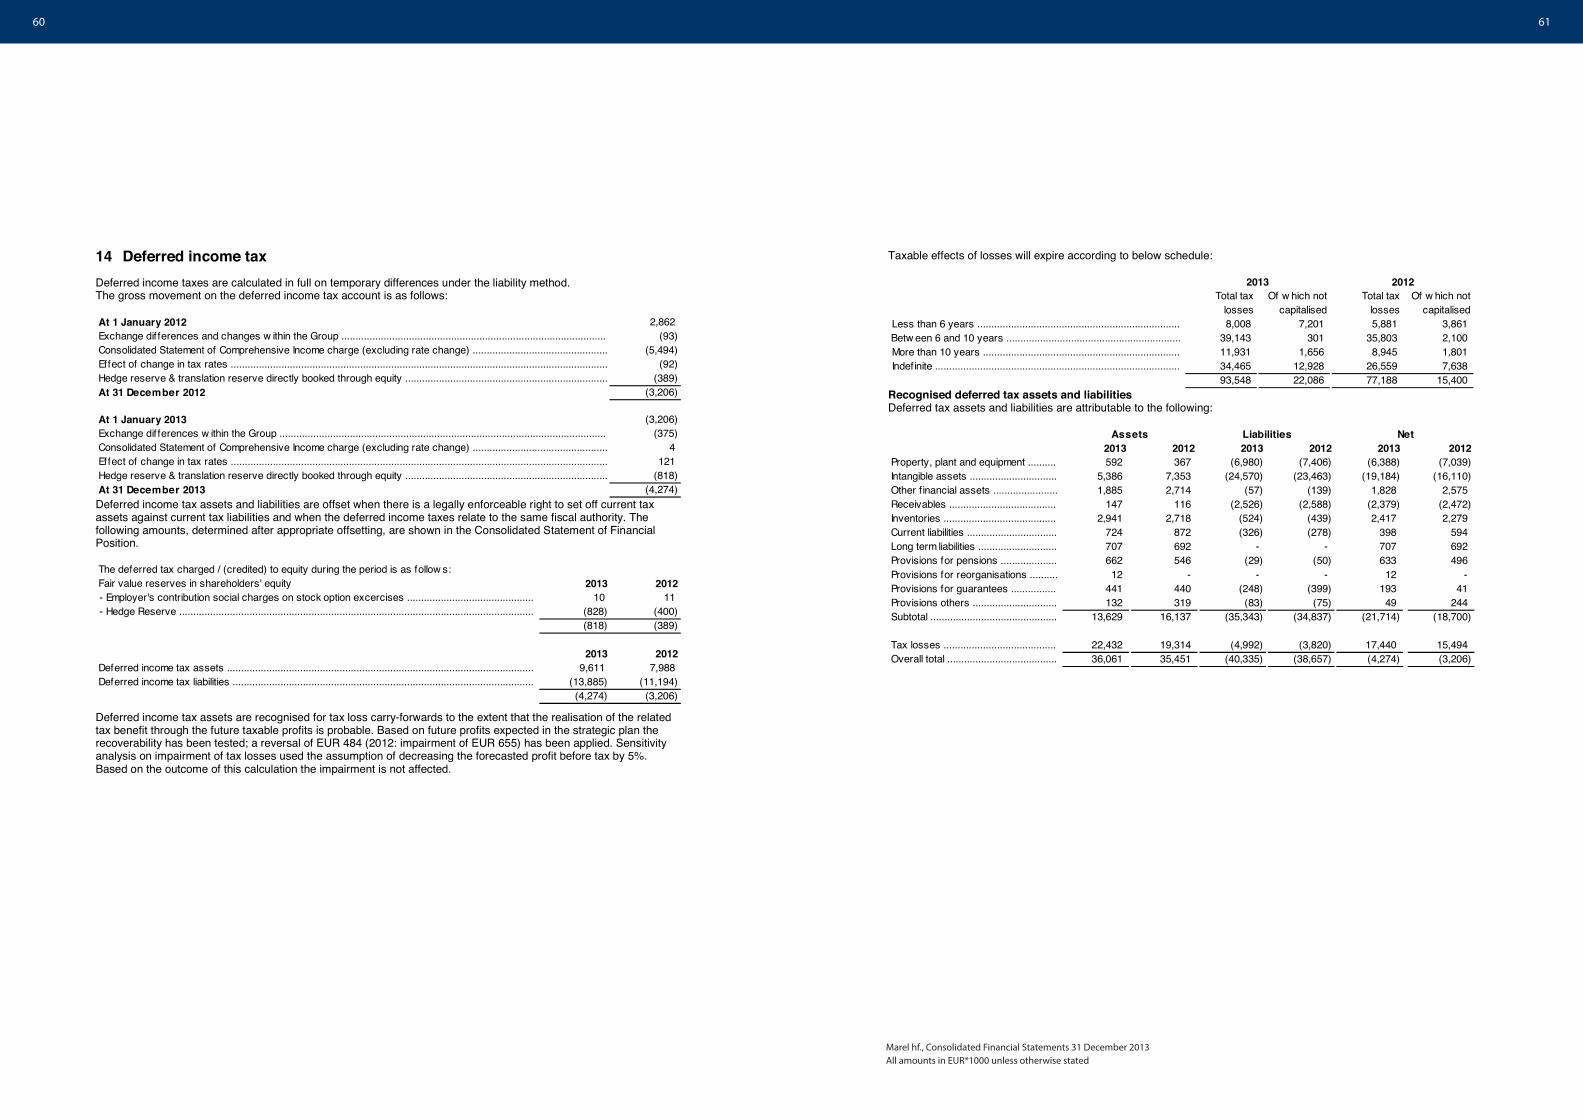
60 61
Marel hf., Consolidated Financial Statements 31 December 2013All amounts in EUR*1000 unless otherwise stated
14 Deferred income tax Deferred income taxes are calculated in full on temporary differences under the liability method. The gross movement on the deferred income tax account is as follows:
At 1 January 2012 2,862 (93)
(5,494) (92)
(389)At 31 December 2012 (3,206)
At 1 January 2013 (3,206) (375)
4 121
(818)At 31 December 2013 (4,274)
Exchange dif ferences and changes w ithin the Group ..............................................................................................Consolidated Statement of Comprehensive Income charge (excluding rate change) ................................................Effect of change in tax rates ......................................................................................................................................Hedge reserve & translation reserve directly booked through equity ........................................................................
Exchange dif ferences w ithin the Group ....................................................................................................................Consolidated Statement of Comprehensive Income charge (excluding rate change) ................................................Effect of change in tax rates ......................................................................................................................................Hedge reserve & translation reserve directly booked through equity ........................................................................
Deferred income tax assets and liabilities are offset when there is a legally enforceable right to set off current tax assets against current tax liabilities and when the deferred income taxes relate to the same fiscal authority. The following amounts, determined after appropriate offsetting, are shown in the Consolidated Statement of Financial Position.
The deferred tax charged / (credited) to equity during the period is as follow s:Fair value reserves in shareholders' equity 2013 2012
10 11 (828) (400) (818) (389)
2013 20129,611 7,988
(13,885) (11,194) (4,274) (3,206)
- Employer's contribution social charges on stock option excercises .............................................- Hedge Reserve ..............................................................................................................................
Deferred income tax assets .............................................................................................................Deferred income tax liabilities ...........................................................................................................
Deferred income tax assets are recognised for tax loss carry-forwards to the extent that the realisation of the related tax benefit through the future taxable profits is probable. Based on future profits expected in the strategic plan the recoverability has been tested; a reversal of EUR 484 (2012: impairment of EUR 655) has been applied. Sensitivity analysis on impairment of tax losses used the assumption of decreasing the forecasted profit before tax by 5%. Based on the outcome of this calculation the impairment is not affected.
Taxable effects of losses will expire according to below schedule:
Total tax losses
Of w hich not capitalised
Total tax losses
Of w hich not capitalised
8,008 7,201 5,881 3,861 39,143 301 35,803 2,100 11,931 1,656 8,945 1,801 34,465 12,928 26,559 7,638 93,548 22,086 77,188 15,400
2012
Less than 6 years ........................................................................Betw een 6 and 10 years ..............................................................More than 10 years ......................................................................Indef inite .......................................................................................
2013
Recognised deferred tax assets and liabilities Deferred tax assets and liabilities are attributable to the following:
2013 2012 2013 2012 2013 2012Property, plant and equipment .......... 592 367 (6,980) (7,406) (6,388) (7,039) Intangible assets ............................... 5,386 7,353 (24,570) (23,463) (19,184) (16,110) Other financial assets ....................... 1,885 2,714 (57) (139) 1,828 2,575 Receivables ...................................... 147 116 (2,526) (2,588) (2,379) (2,472) Inventories ........................................ 2,941 2,718 (524) (439) 2,417 2,279 Current liabilities ................................ 724 872 (326) (278) 398 594 Long term liabilities ............................ 707 692 - - 707 692 Provisions for pensions .................... 662 546 (29) (50) 633 496 Provisions for reorganisations .......... 12 - - - 12 - Provisions for guarantees ................ 441 440 (248) (399) 193 41 Provisions others .............................. 132 319 (83) (75) 49 244 Subtotal ............................................. 13,629 16,137 (35,343) (34,837) (21,714) (18,700)
Tax losses ........................................ 22,432 19,314 (4,992) (3,820) 17,440 15,494 Overall total ....................................... 36,061 35,451 (40,335) (38,657) (4,274) (3,206)
Assets Liabilities Net
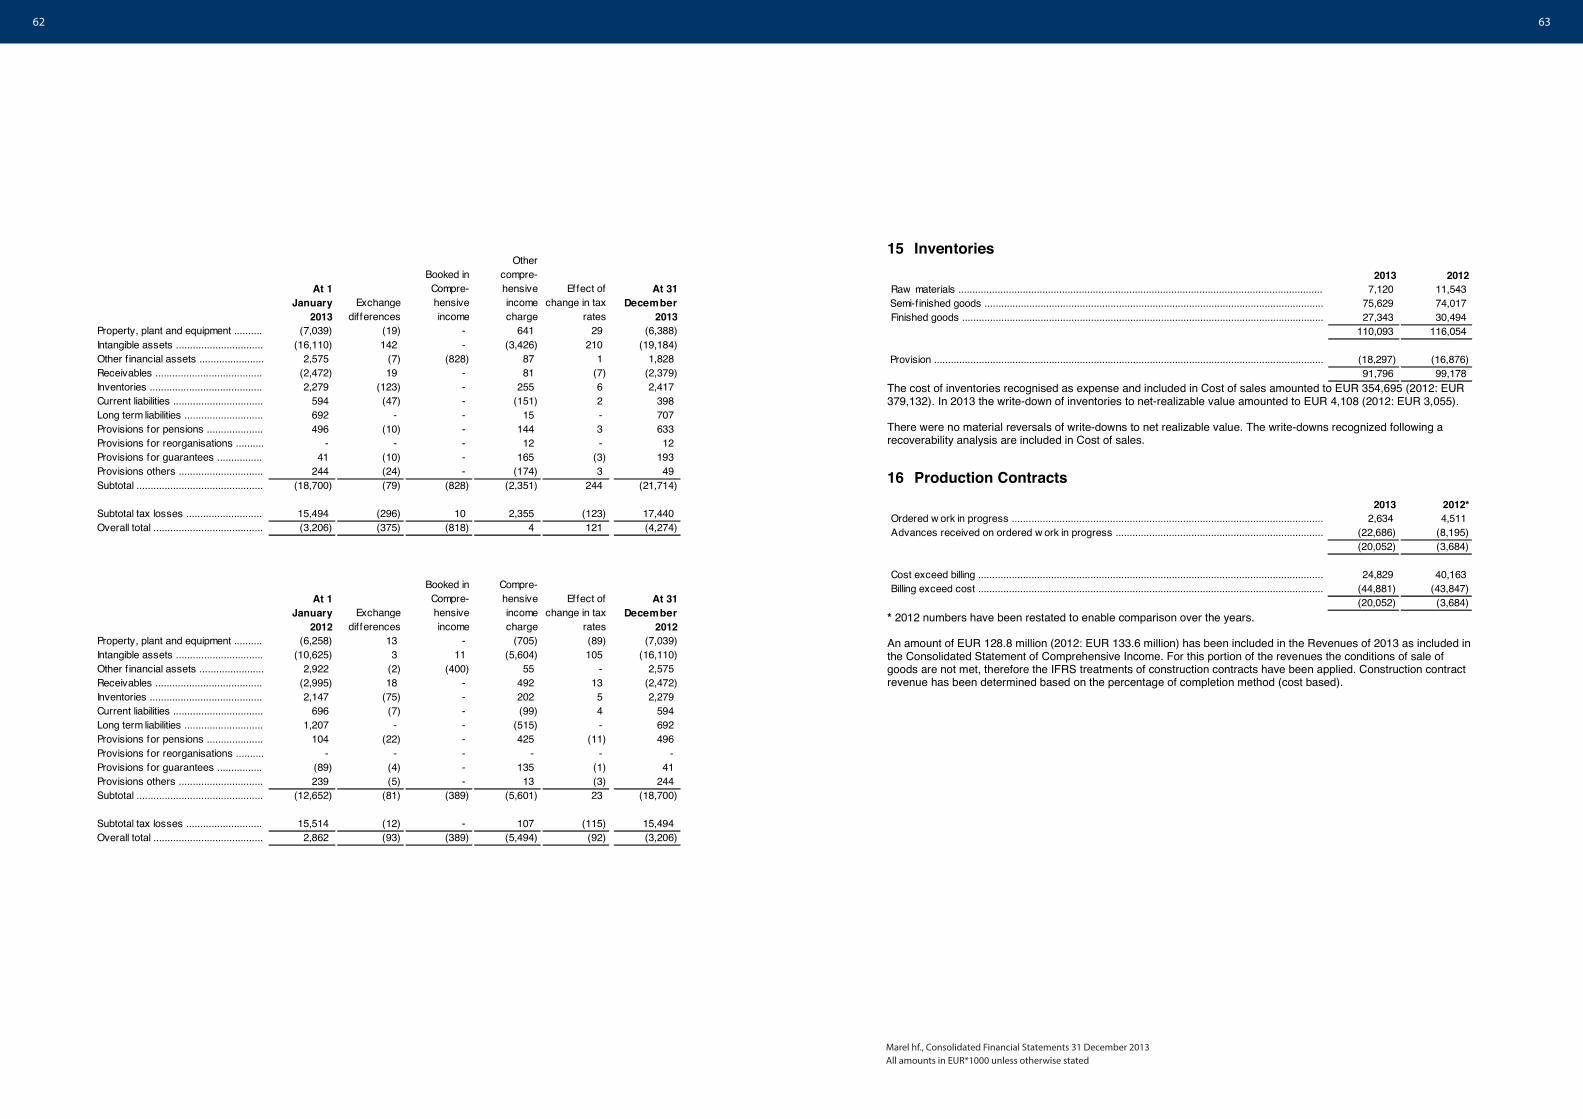
62 63
Marel hf., Consolidated Financial Statements 31 December 2013All amounts in EUR*1000 unless otherwise stated
At 1 January
2013Exchange
differences
Booked in Compre- hensive income
Other compre- hensive income charge
Effect of change in tax
rates
At 31 December
2013Property, plant and equipment .......... (7,039) (19) - 641 29 (6,388) Intangible assets ............................... (16,110) 142 - (3,426) 210 (19,184) Other financial assets ....................... 2,575 (7) (828) 87 1 1,828 Receivables ...................................... (2,472) 19 - 81 (7) (2,379) Inventories ........................................ 2,279 (123) - 255 6 2,417 Current liabilities ................................ 594 (47) - (151) 2 398 Long term liabilities ............................ 692 - - 15 - 707 Provisions for pensions .................... 496 (10) - 144 3 633 Provisions for reorganisations .......... - - - 12 - 12 Provisions for guarantees ................ 41 (10) - 165 (3) 193 Provisions others .............................. 244 (24) - (174) 3 49 Subtotal ............................................. (18,700) (79) (828) (2,351) 244 (21,714)
Subtotal tax losses ........................... 15,494 (296) 10 2,355 (123) 17,440 Overall total ....................................... (3,206) (375) (818) 4 121 (4,274)
At 1 January
2012Exchange
differences
Booked in Compre- hensive income
Compre- hensive income charge
Effect of change in tax
rates
At 31 December
2012Property, plant and equipment .......... (6,258) 13 - (705) (89) (7,039) Intangible assets ............................... (10,625) 3 11 (5,604) 105 (16,110) Other financial assets ....................... 2,922 (2) (400) 55 - 2,575 Receivables ...................................... (2,995) 18 - 492 13 (2,472) Inventories ........................................ 2,147 (75) - 202 5 2,279 Current liabilities ................................ 696 (7) - (99) 4 594 Long term liabilities ............................ 1,207 - - (515) - 692 Provisions for pensions .................... 104 (22) - 425 (11) 496 Provisions for reorganisations .......... - - - - - - Provisions for guarantees ................ (89) (4) - 135 (1) 41 Provisions others .............................. 239 (5) - 13 (3) 244 Subtotal ............................................. (12,652) (81) (389) (5,601) 23 (18,700)
Subtotal tax losses ........................... 15,514 (12) - 107 (115) 15,494 Overall total ....................................... 2,862 (93) (389) (5,494) (92) (3,206)
15 Inventories 2013 2012
7,120 11,543 75,629 74,017 27,343 30,494
110,093 116,054
(18,297) (16,876)91,796 99,178
Raw materials ..................................................................................................................................Semi-finished goods .........................................................................................................................Finished goods .................................................................................................................................
Provision ...........................................................................................................................................
The cost of inventories recognised as expense and included in Cost of sales amounted to EUR 354,695 (2012: EUR 379,132). In 2013 the write-down of inventories to net-realizable value amounted to EUR 4,108 (2012: EUR 3,055).
There were no material reversals of write-downs to net realizable value. The write-downs recognized following a recoverability analysis are included in Cost of sales.
16 Production Contracts 2013 2012*
2,634 4,511 (22,686) (8,195) (20,052) (3,684)
24,829 40,163 (44,881) (43,847) (20,052) (3,684)
Ordered w ork in progress ...............................................................................................................Advances received on ordered w ork in progress ..........................................................................
Cost exceed billing ...........................................................................................................................Billing exceed cost ...........................................................................................................................
* 2012 numbers have been restated to enable comparison over the years.
An amount of EUR 128.8 million (2012: EUR 133.6 million) has been included in the Revenues of 2013 as included in the Consolidated Statement of Comprehensive Income. For this portion of the revenues the conditions of sale of goods are not met, therefore the IFRS treatments of construction contracts have been applied. Construction contract revenue has been determined based on the percentage of completion method (cost based).
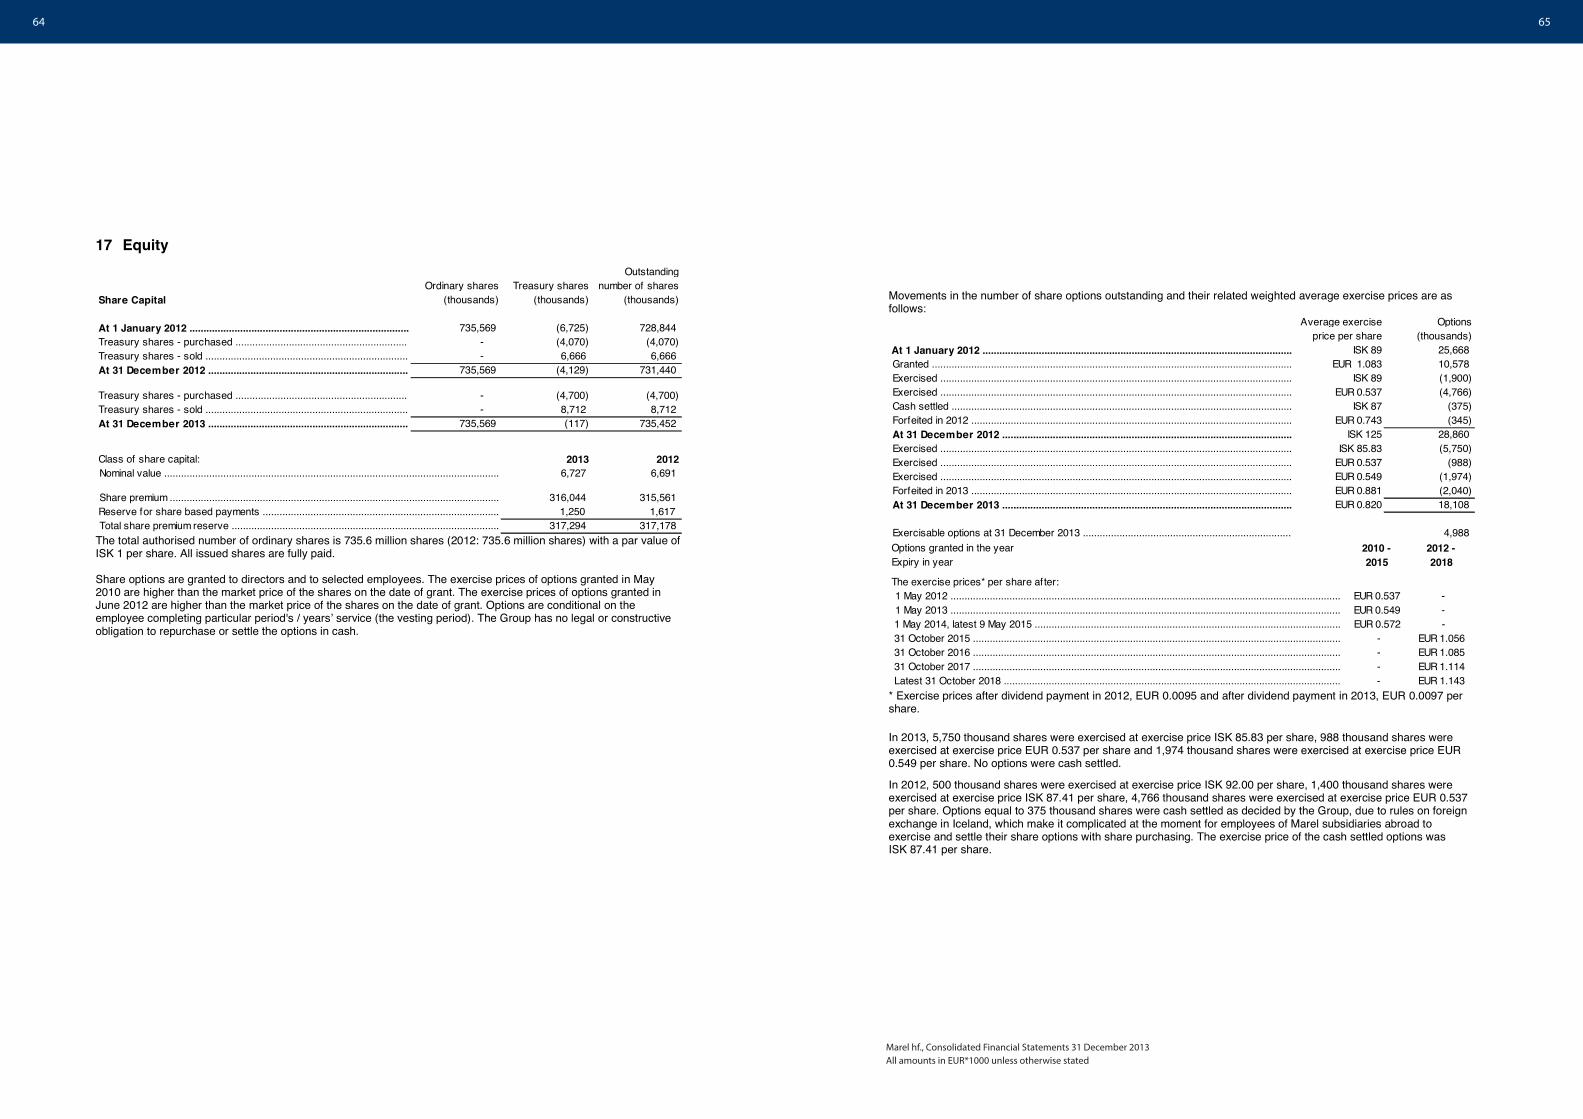
64 65
Marel hf., Consolidated Financial Statements 31 December 2013All amounts in EUR*1000 unless otherwise stated
17 Equity
Share CapitalOrdinary shares
(thousands)Treasury shares
(thousands)
Outstanding number of shares
(thousands)
735,569 (6,725) 728,844 - (4,070) (4,070)- 6,666 6,666
735,569 (4,129) 731,440
- (4,700) (4,700) - 8,712 8,712
735,569 (117) 735,452
Class of share capital: 2013 20126,727 6,691
316,044 315,561 1,250 1,617
317,294 317,178
At 1 January 2012 ..............................................................................Treasury shares - purchased .............................................................Treasury shares - sold ........................................................................At 31 December 2012 .......................................................................
Treasury shares - purchased .............................................................Treasury shares - sold ........................................................................At 31 December 2013 .......................................................................
Total share premium reserve ...............................................................................................Reserve for share based payments ....................................................................................Share premium .....................................................................................................................
Nominal value .......................................................................................................................
The total authorised number of ordinary shares is 735.6 million shares (2012: 735.6 million shares) with a par value of ISK 1 per share. All issued shares are fully paid.
Share options are granted to directors and to selected employees. The exercise prices of options granted in May 2010 are higher than the market price of the shares on the date of grant. The exercise prices of options granted in June 2012 are higher than the market price of the shares on the date of grant. Options are conditional on the employee completing particular period's / yearsʼ service (the vesting period). The Group has no legal or constructive obligation to repurchase or settle the options in cash.
Movements in the number of share options outstanding and their related weighted average exercise prices are as follows:
Average exercise price per share
Options (thousands)
ISK 89 25,668 EUR 1.083 10,578
ISK 89 (1,900)EUR 0.537 (4,766)
ISK 87 (375)EUR 0.743 (345)
ISK 125 28,860 ISK 85.83 (5,750)
EUR 0.537 (988)EUR 0.549 (1,974)EUR 0.881 (2,040)EUR 0.820 18,108
4,988
Forfeited in 2012 ..................................................................................................................
At 1 January 2012 ..............................................................................................................
Exercised .............................................................................................................................Cash settled .........................................................................................................................
Granted ................................................................................................................................Exercised .............................................................................................................................
At 31 December 2013 .......................................................................................................
Exercisable options at 31 December 2013 ..........................................................................
At 31 December 2012 .......................................................................................................Exercised .............................................................................................................................Exercised .............................................................................................................................Exercised .............................................................................................................................Forfeited in 2013 ..................................................................................................................
Options granted in the year 2010 - 2012 -Expiry in year 2015 2018
The exercise prices* per share after: 1 May 2012 ........................................................................................................................................... EUR 0.537 - 1 May 2013 ........................................................................................................................................... EUR 0.549 - 1 May 2014, latest 9 May 2015 ............................................................................................................. EUR 0.572 - 31 October 2015 ................................................................................................................................... - EUR 1.056 31 October 2016 ................................................................................................................................... - EUR 1.085 31 October 2017 ................................................................................................................................... - EUR 1.114 Latest 31 October 2018 ........................................................................................................................ - EUR 1.143* Exercise prices after dividend payment in 2012, EUR 0.0095 and after dividend payment in 2013, EUR 0.0097 per share.
In 2013, 5,750 thousand shares were exercised at exercise price ISK 85.83 per share, 988 thousand shares were exercised at exercise price EUR 0.537 per share and 1,974 thousand shares were exercised at exercise price EUR 0.549 per share. No options were cash settled.
In 2012, 500 thousand shares were exercised at exercise price ISK 92.00 per share, 1,400 thousand shares were exercised at exercise price ISK 87.41 per share, 4,766 thousand shares were exercised at exercise price EUR 0.537 per share. Options equal to 375 thousand shares were cash settled as decided by the Group, due to rules on foreign exchange in Iceland, which make it complicated at the moment for employees of Marel subsidiaries abroad to exercise and settle their share options with share purchasing. The exercise price of the cash settled options was ISK 87.41 per share.
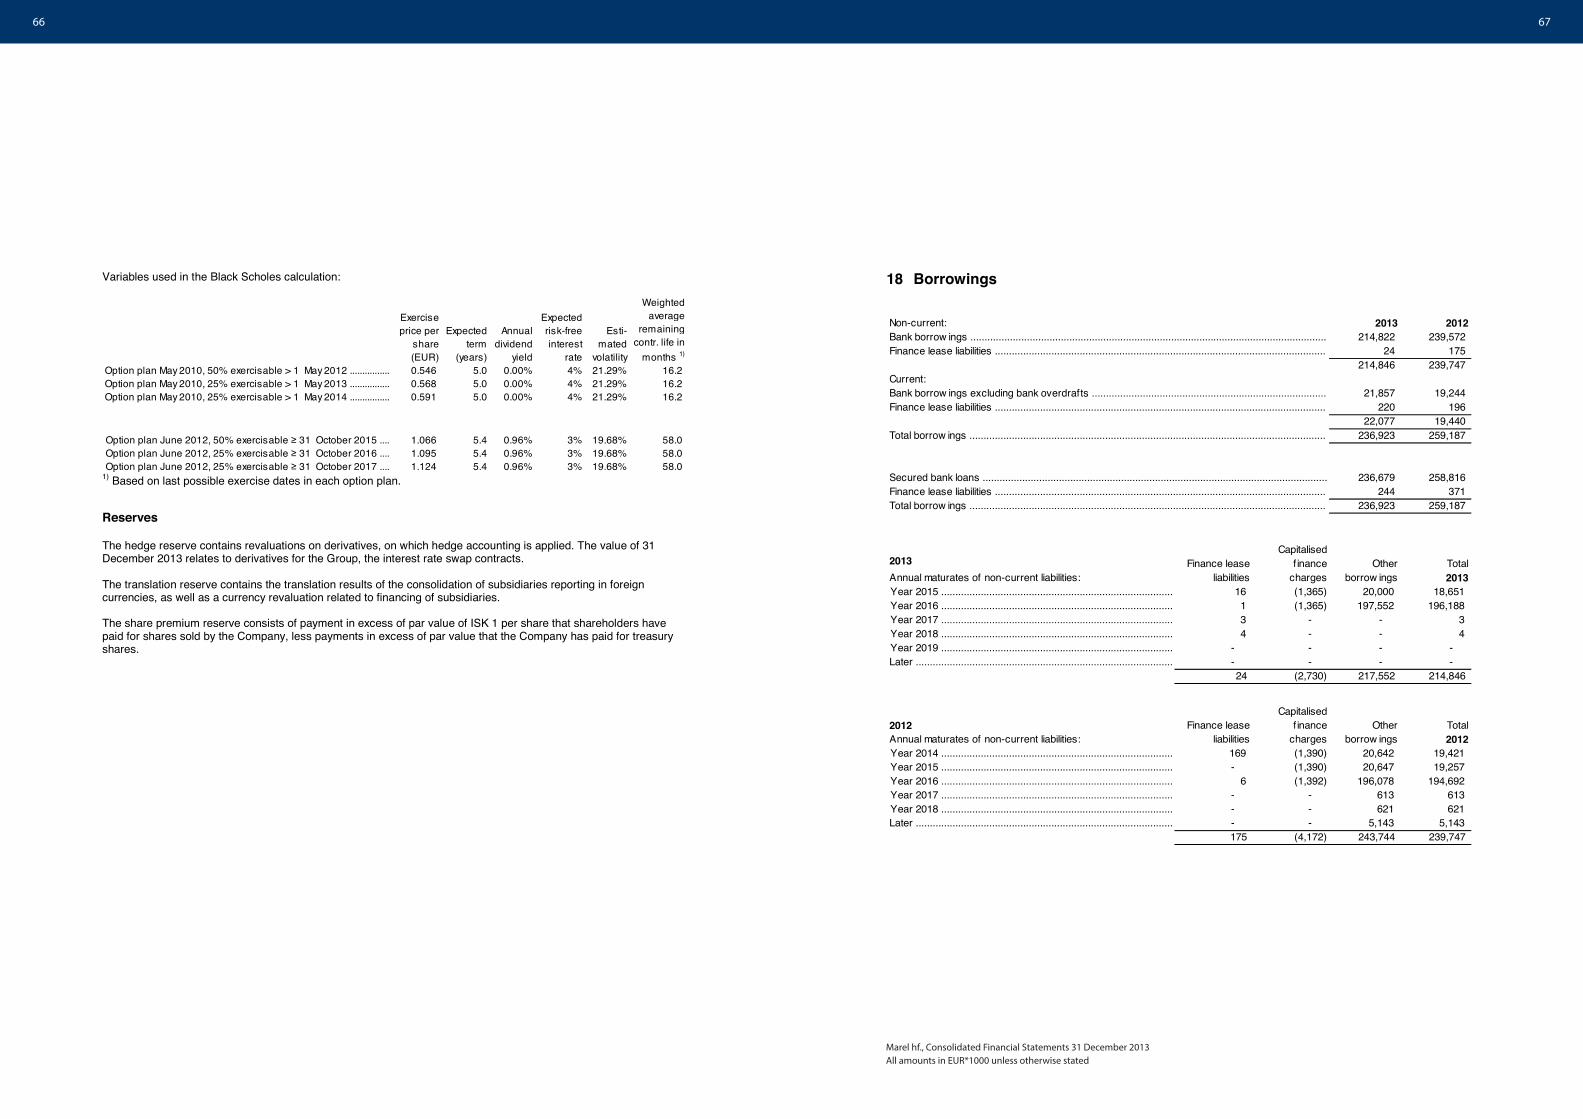
66 67
Marel hf., Consolidated Financial Statements 31 December 2013All amounts in EUR*1000 unless otherwise stated
Variables used in the Black Scholes calculation:
Exercise price per
share (EUR)
Expected term
(years)
Annual dividend
yield
Expected risk-free interest
rate
Esti- mated
volatility
Weighted average
remaining contr. life in
months 1)
0.546 5.0 0.00% 4% 21.29% 16.2 0.568 5.0 0.00% 4% 21.29% 16.2 0.591 5.0 0.00% 4% 21.29% 16.2
1.066 5.4 0.96% 3% 19.68% 58.0 1.095 5.4 0.96% 3% 19.68% 58.0 1.124 5.4 0.96% 3% 19.68% 58.0 Option plan June 2012, 25% exercisable ≥ 31 October 2017 ....
Option plan May 2010, 50% exercisable > 1 May 2012 ................Option plan May 2010, 25% exercisable > 1 May 2013 ................Option plan May 2010, 25% exercisable > 1 May 2014 ................
Option plan June 2012, 50% exercisable ≥ 31 October 2015 ....Option plan June 2012, 25% exercisable ≥ 31 October 2016 ....
1) Based on last possible exercise dates in each option plan.
Reserves
The hedge reserve contains revaluations on derivatives, on which hedge accounting is applied. The value of 31 December 2013 relates to derivatives for the Group, the interest rate swap contracts.
The translation reserve contains the translation results of the consolidation of subsidiaries reporting in foreign currencies, as well as a currency revaluation related to financing of subsidiaries.
The share premium reserve consists of payment in excess of par value of ISK 1 per share that shareholders have paid for shares sold by the Company, less payments in excess of par value that the Company has paid for treasury shares.
18 Borrowings
Non-current: 2013 2012214,822 239,572
24 175 214,846 239,747
Current:21,857 19,244
220 196 22,077 19,440
236,923 259,187
236,679 258,816 244 371
236,923 259,187
Finance lease liabilities .....................................................................................................................
Total borrow ings ..............................................................................................................................
Secured bank loans ..........................................................................................................................Finance lease liabilities .....................................................................................................................Total borrow ings ..............................................................................................................................
Bank borrow ings ..............................................................................................................................Finance lease liabilities .....................................................................................................................
Bank borrow ings excluding bank overdrafts ...................................................................................
2013Annual maturates of non-current liabilities:
16 (1,365) 20,000 18,651 1 (1,365) 197,552 196,188 3 - - 3 4 - - 4
- - - - - - - - 24 (2,730) 217,552 214,846
Finance lease liabilities
Other borrow ings
Total 2013
Capitalised f inance
charges
Later ...........................................................................................
Year 2015 ..................................................................................Year 2016 ..................................................................................Year 2017 ..................................................................................Year 2018 ..................................................................................Year 2019 ..................................................................................
2012Annual maturates of non-current liabilities:
169 (1,390) 20,642 19,421 - (1,390) 20,647 19,257
6 (1,392) 196,078 194,692 - - 613 613 - - 621 621 - - 5,143 5,143 175 (4,172) 243,744 239,747
Total 2012
Finance lease liabilities
Capitalised f inance
chargesOther
borrow ings
Later ...........................................................................................
Year 2014 ..................................................................................Year 2015 ..................................................................................Year 2016 ..................................................................................Year 2017 ..................................................................................Year 2018 ..................................................................................
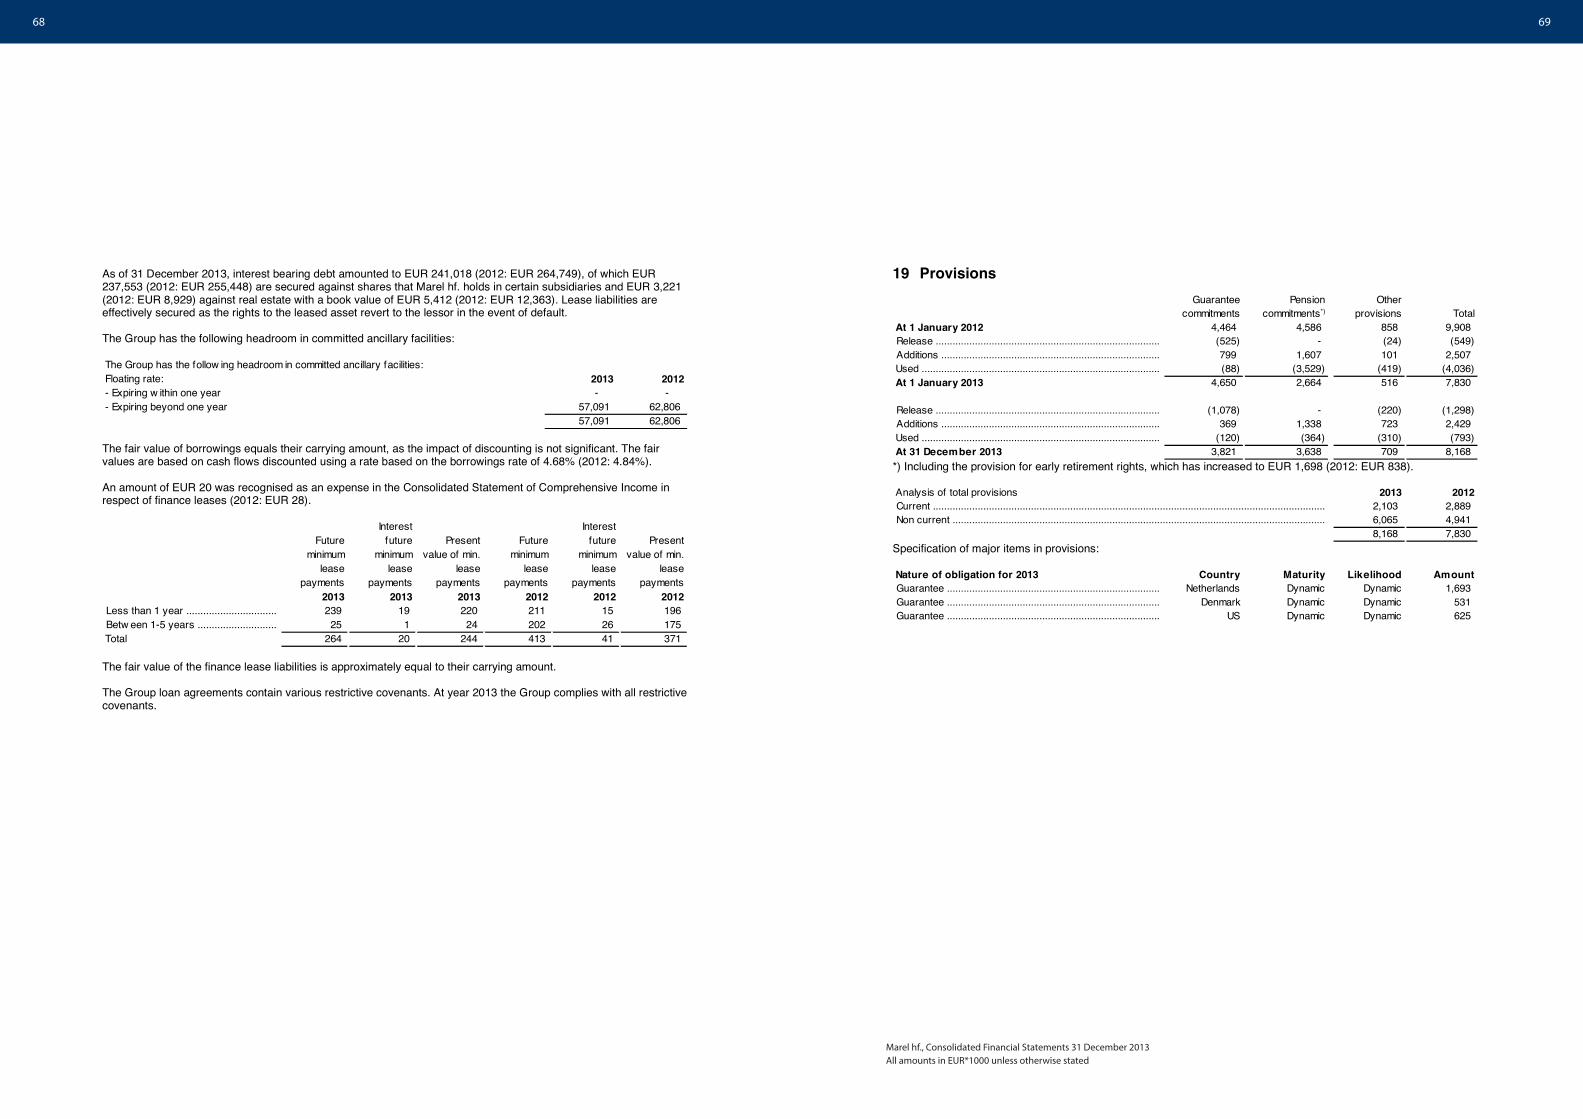
68 69
Marel hf., Consolidated Financial Statements 31 December 2013All amounts in EUR*1000 unless otherwise stated
As of 31 December 2013, interest bearing debt amounted to EUR 241,018 (2012: EUR 264,749), of which EUR 237,553 (2012: EUR 255,448) are secured against shares that Marel hf. holds in certain subsidiaries and EUR 3,221 (2012: EUR 8,929) against real estate with a book value of EUR 5,412 (2012: EUR 12,363). Lease liabilities are effectively secured as the rights to the leased asset revert to the lessor in the event of default.
The Group has the following headroom in committed ancillary facilities:
The Group has the follow ing headroom in committed ancillary facilities:Floating rate: 2013 2012- Expiring w ithin one year - - - Expiring beyond one year 57,091 62,806
57,091 62,806
The fair value of borrowings equals their carrying amount, as the impact of discounting is not significant. The fair values are based on cash flows discounted using a rate based on the borrowings rate of 4.68% (2012: 4.84%).
An amount of EUR 20 was recognised as an expense in the Consolidated Statement of Comprehensive Income in respect of finance leases (2012: EUR 28).
Future minimum
lease payments
Interest future
minimum lease
payments
Present value of min.
lease payments
Future minimum
lease payments
Interest future
minimum lease
payments
Present value of min.
lease payments
2013 2013 2013 2012 2012 2012239 19 220 211 15 196 25 1 24 202 26 175
Total 264 20 244 413 41 371
Less than 1 year ................................Betw een 1-5 years ............................
The fair value of the finance lease liabilities is approximately equal to their carrying amount.
The Group loan agreements contain various restrictive covenants. At year 2013 the Group complies with all restrictive covenants.
19 Provisions Guarantee
commitmentsPension
commitments*)Other
provisions Total At 1 January 2012 4,464 4,586 858 9,908
(525) - (24) (549) 799 1,607 101 2,507 (88) (3,529) (419) (4,036)
At 1 January 2013 4,650 2,664 516 7,830
(1,078) - (220) (1,298) 369 1,338 723 2,429
(120) (364) (310) (793) At 31 December 2013 3,821 3,638 709 8,168 Used .....................................................................................
Release ................................................................................Additions ..............................................................................Used .....................................................................................
Release ................................................................................Additions ..............................................................................
*) Including the provision for early retirement rights, which has increased to EUR 1,698 (2012: EUR 838).
Analysis of total provisions 2013 20122,103 2,889 6,065 4,941 8,168 7,830
Current ............................................................................................................................................Non current .....................................................................................................................................
Specification of major items in provisions:
Nature of obligation for 2013 Country Maturity Likelihood AmountNetherlands Dynamic Dynamic 1,693
Denmark Dynamic Dynamic 531 US Dynamic Dynamic 625
Guarantee ............................................................................Guarantee ............................................................................Guarantee ............................................................................
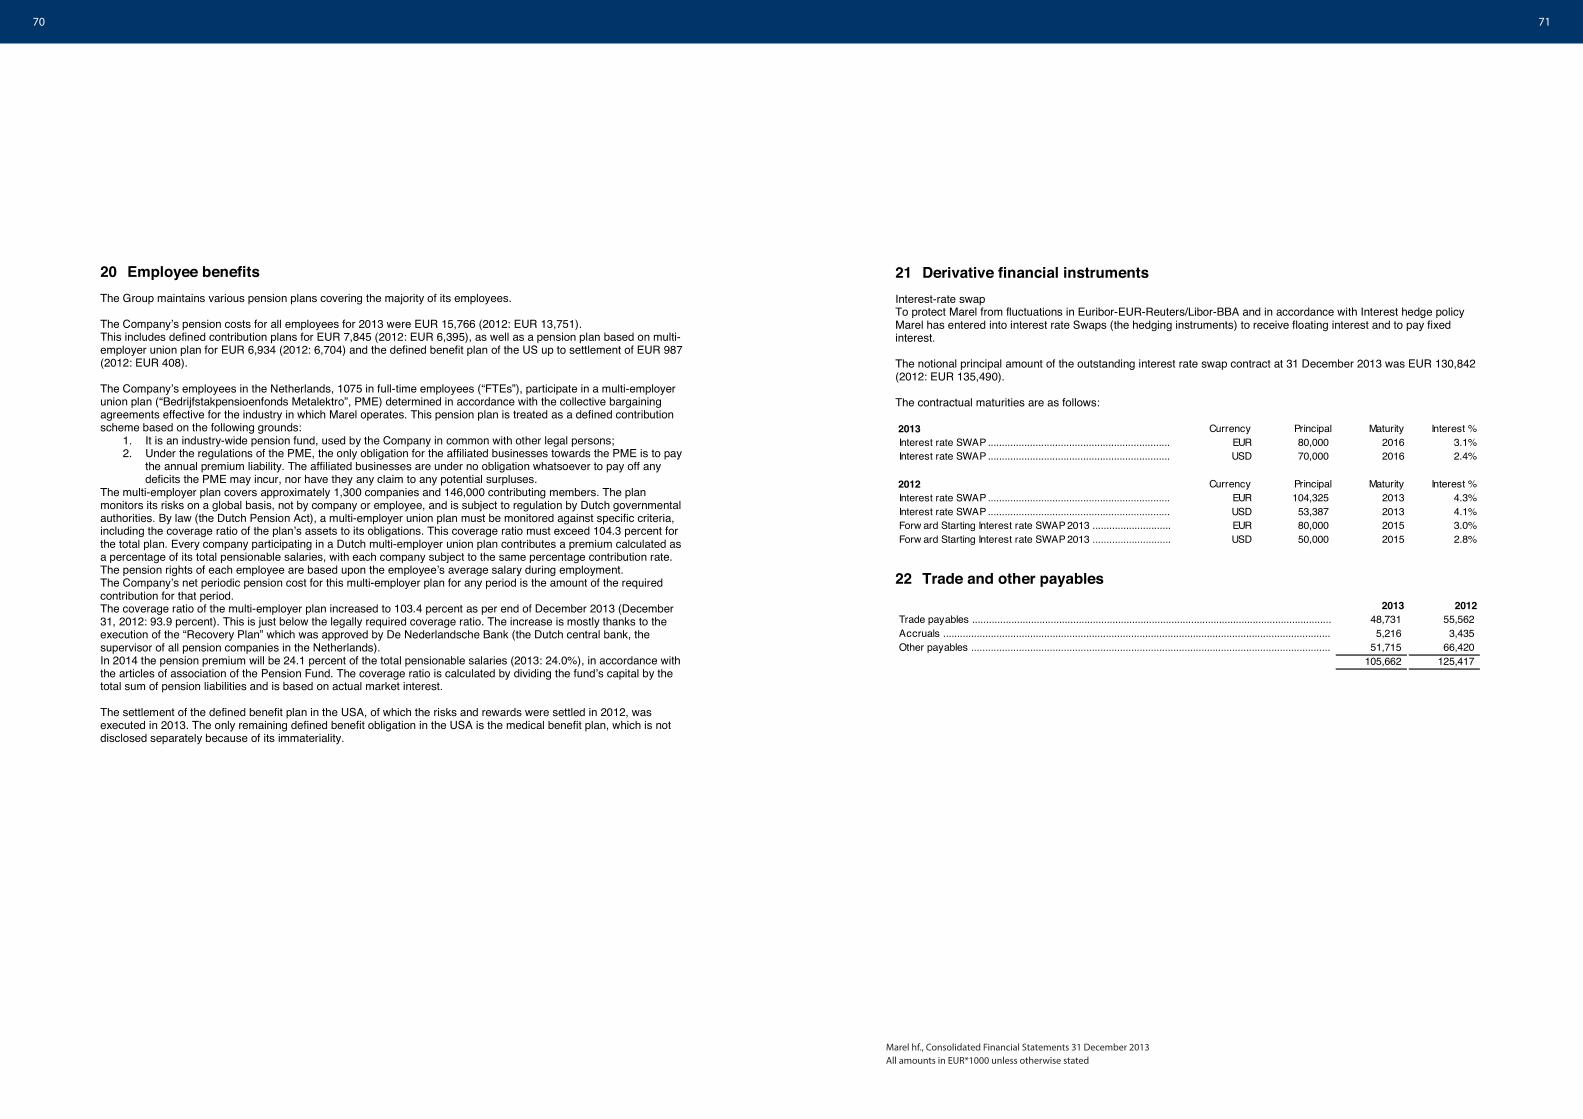
70 71
Marel hf., Consolidated Financial Statements 31 December 2013All amounts in EUR*1000 unless otherwise stated
20 Employee benefits The Group maintains various pension plans covering the majority of its employees.
The Companyʼs pension costs for all employees for 2013 were EUR 15,766 (2012: EUR 13,751). This includes defined contribution plans for EUR 7,845 (2012: EUR 6,395), as well as a pension plan based on multi-employer union plan for EUR 6,934 (2012: 6,704) and the defined benefit plan of the US up to settlement of EUR 987 (2012: EUR 408).
The Companyʼs employees in the Netherlands, 1075 in full-time employees (“FTEs”), participate in a multi-employer union plan (“Bedrijfstakpensioenfonds Metalektro”, PME) determined in accordance with the collective bargaining agreements effective for the industry in which Marel operates. This pension plan is treated as a defined contribution scheme based on the following grounds:
1. It is an industry-wide pension fund, used by the Company in common with other legal persons; 2. Under the regulations of the PME, the only obligation for the affiliated businesses towards the PME is to pay
the annual premium liability. The affiliated businesses are under no obligation whatsoever to pay off any deficits the PME may incur, nor have they any claim to any potential surpluses.
The multi-employer plan covers approximately 1,300 companies and 146,000 contributing members. The plan monitors its risks on a global basis, not by company or employee, and is subject to regulation by Dutch governmental authorities. By law (the Dutch Pension Act), a multi-employer union plan must be monitored against specific criteria, including the coverage ratio of the planʼs assets to its obligations. This coverage ratio must exceed 104.3 percent for the total plan. Every company participating in a Dutch multi-employer union plan contributes a premium calculated as a percentage of its total pensionable salaries, with each company subject to the same percentage contribution rate. The pension rights of each employee are based upon the employeeʼs average salary during employment. The Companyʼs net periodic pension cost for this multi-employer plan for any period is the amount of the required contribution for that period. The coverage ratio of the multi-employer plan increased to 103.4 percent as per end of December 2013 (December 31, 2012: 93.9 percent). This is just below the legally required coverage ratio. The increase is mostly thanks to the execution of the “Recovery Plan” which was approved by De Nederlandsche Bank (the Dutch central bank, the supervisor of all pension companies in the Netherlands). In 2014 the pension premium will be 24.1 percent of the total pensionable salaries (2013: 24.0%), in accordance with the articles of association of the Pension Fund. The coverage ratio is calculated by dividing the fundʼs capital by the total sum of pension liabilities and is based on actual market interest.
The settlement of the defined benefit plan in the USA, of which the risks and rewards were settled in 2012, was executed in 2013. The only remaining defined benefit obligation in the USA is the medical benefit plan, which is not disclosed separately because of its immateriality.
21 Derivative financial instruments Interest-rate swap To protect Marel from fluctuations in Euribor-EUR-Reuters/Libor-BBA and in accordance with Interest hedge policy Marel has entered into interest rate Swaps (the hedging instruments) to receive floating interest and to pay fixed interest.
The notional principal amount of the outstanding interest rate swap contract at 31 December 2013 was EUR 130,842 (2012: EUR 135,490).
The contractual maturities are as follows:
2013 Currency Principal Maturity Interest %EUR 80,000 2016 3.1%USD 70,000 2016 2.4%
2012 Currency Principal Maturity Interest %EUR 104,325 2013 4.3%USD 53,387 2013 4.1%EUR 80,000 2015 3.0%USD 50,000 2015 2.8%
Interest rate SWAP .................................................................Interest rate SWAP .................................................................Forw ard Starting Interest rate SWAP 2013 ............................Forw ard Starting Interest rate SWAP 2013 ............................
Interest rate SWAP .................................................................Interest rate SWAP .................................................................
22 Trade and other payables 2013 2012
48,731 55,562 5,216 3,435
51,715 66,420 105,662 125,417
Trade payables ................................................................................................................................Accruals ..........................................................................................................................................Other payables ................................................................................................................................

72 73
Marel hf., Consolidated Financial Statements 31 December 2013All amounts in EUR*1000 unless otherwise stated
23 Contingencies At 31 December 2013 the Group had contingent liabilities in respect of bank and other guarantees and other matters arising in the ordinary course of business from which it is anticipated that no material liabilities will arise. In the ordinary course of business the Group has given guarantees amounting to EUR 18,842 (2012: EUR 15,882) to third parties.
From time to time claims are filed against the Group. Although the outcome of current claims cannot be predicted with any certainty, it is assumed – partly on the basis of legal advice – that these will not have any significant impact on the consolidated financial statements.
24 Commitments and insurance At the end of the reporting period, the future minimum lease payments under non-cancellable operating leases are payable as follows:
2013 20126,253 4,237 8,736 5,581 3,350 1,147
18,339 10,965
Less than 1 year ..............................................................................................................................Betw een 1 and 5 years ...................................................................................................................Later than 5 years ...........................................................................................................................Total operational lease liabilities .......................................................................................................
During the year an amount of EUR 6,386 was recognised as an expense in profit or loss in respect of operating leases (2012: EUR 4,513).
Insurance The Group has covered Business Interruption Risks with an insurance policy underwritten by an independent insurance company for a maximum period of 24 months. The insurance benefits for Business Interruption amount to EUR 514 million for 2013 for the whole Group. The Group Insurance value of buildings amounts to EUR 137 million, productions machinery and equipment including software and office equipment amount to EUR 132 million and inventories to EUR 96 million. Currently there are no major differences between appraisal value and insured value.
25 Related party transactions At the end of December 2013 and 2012, there are no loans to directors.
Board feePension
contribution1)Stock
options2)
Bought shares acc.
to stock options2)
Shares at year-end 2)
75 6 - - 215,499 3)
25 2 - - - 35 3 - - - 65 5 - - 32 5 - - - 4,300
30 2 - - 4,505 30 2 - - 200 25 2 - - 1,000 4)
Salary and benefits
Share based
benefitsIncentive
paymentsPension
contribution1)Stock
options 2)
Bought shares acc.
to stock options2)
Shares at year-end 2)
Árni Oddur Þórðarson, CEO (as of 31 October 2013). 65 - - 5 - - 215,499 Theo Hoen, former CEO (until 31 October 2013)....... 2,224 569 78 82 - 2,000 1,500 Erik Kaman, CFO.................................................. 388 462 61 33 800 1,500 1,675 Sigsteinn Gretarsson, COO.................................... 343 34 51 37 538 88 26 Five Managing Directors......................................... 1,083 410 147 107 2,185 1,313 124 5)
Ann Elizabeth Savage, Board Member (as of 6 March 2013).........................
Helgi Magnússon, Board Member.............................................................
Board fee for the year 2013 and shares at year-end
Árni Oddur Þórðarson, former Chairman (until 31 October 2013)....................
Arnar Þór Másson, Vice Chairman (until 31 October 2013 Board Member).....Ásthildur Margrét Otharsdóttir , Chairman (until 31 October 2013 Board Member )..Friðrik Jóhannsson, Board Member (until 6 March 2013).............................
Margrét Jónsdóttir, Board Member............................................................Theo Bruinsma, Board Member (until 31 October 2013)................................
1) Pension contributions for all board members are part of a defined contribution plan. 2) Number of shares * 1000 3) Shares owned by Eyrir Invest hf., where Árni Oddur Þórðarson was CEO till 31 October 2013, including those of
financially related parties. Margrét Jónsdóttir is the MD of Operations of Eyrir Invest hf. 4) Theo Bruinsma was previously President of Townsend Inc. which was acquired by Stork in 2006. Thereafter, he
was part of Stork and Marel's management team until 2010. In accordance with his employment agreement, Mr. Bruinsma received payments in 2013 in addition to the board fee amounting to EUR 406.
5) Marel has identified five managers other than the members of the Board of Management who have materialsignificance for Marelʼs operations. This group consists of the four Managing Directors of Marelʼs Industry Centers and the Managing Director of Marelʼs international sales and service network.
Stock optionsNumber of
shares 2)
Average exercise
price350 0.549 EUR per share450 1.073 EUR per share
88 0.560 EUR per share450 1.073 EUR per share
925 0.549 EUR per share1,260 1.073 EUR per share
Erik Kaman, CFO.............................................................................................................................
Sigsteinn Gretarsson, COO...............................................................................................................
Five Managing Directors....................................................................................................................
2) Number of shares * 1000

74 75
Marel hf., Consolidated Financial Statements 31 December 2013All amounts in EUR*1000 unless otherwise stated
Board feePension
contribution1)Stock
options 2)
Bought shares acc.
to stock options2)
Shares at year-end 2)
87 7 - - 243,499 3)
29 2 - - - 58 5 - - 32 33 3 - - 4,300 29 2 - - 5,105 29 2 - - 200 4 - - - -
29 2 - 375 1,000 4)
Salary and benefits
Share based
benefits Incentive
paymentsPension
contribution1)Stock
options 2)
Bought shares acc.
to stock options2)
Shares at year-end 2)
Theo Hoen, CEO................................................... 418 - 136 92 2,950 - 1,500 Erik Kaman, CFO.................................................. 376 - 109 32 2,300 - 1,675 Sigsteinn Gretarsson, COO.................................... 333 285 93 24 625 825 26 Five managing directors ......................................... 925 150 177 107 3,435 425 124 5)
Friðrik Jóhannsson, Board Member...........................................................
Board fee for the year 2012 and shares at year-end
Árni Oddur Þórðarson, Chairman................................................................Arnar Þór Másson, Board Member.............................................................Ásthildur Margrét Otharsdóttir, Board Member.............................................
Helgi Magnússon, Board Member.............................................................Margrét Jónsdóttir, Board Member............................................................Smári Rúnar Þorvaldsson, Board Member (until 29 February 2012)................Theo Bruinsma, Board Member..................................................................
1) Pension contributions for all board members are part of a defined contribution plan. 2) Number of shares * 1000 3) Shares owned by Eyrir Invest hf., where Árni Oddur Þórðarson is CEO, including those of financially related parties.
Margrét Jónsdóttir is the CFO of Eyrir Invest hf. 4) Theo Bruinsma was previously President of Townsend Inc. which was acquired by Stork in 2006. Thereafter, he
was part of Stork and Marel's management team until 2010. In accordance with his employment agreement, Mr. Bruinsma received payments in 2012 in addition to the board fee amounting to EUR 433 as well as share based benefits amounting to EUR 128. At the year-end 2012 he does not hold any stock options.
5) Marel has identified five managers other than the members of the Board of Management who have material significance for Marelʼs operations. This group consists of the four Managing Directors of Marelʼs Industry Centers and the Managing Director of Marelʼs international sales and service network.
Stock optionsNumber of
shares 2)
Average exercise
price2,000 87.41 ISK per share
350 0.553 EUR per share600 1.083 EUR per share
1,500 87.41 ISK per share350 0.553 EUR per share450 1,083 EUR per share
175 0.570 EUR per share450 1,083 EUR per share
1,250 87.41 ISK per share2,185 0.86 EUR per share
Five Managing Directors....................................................................................................................
Sigsteinn Gretarsson, COO...............................................................................................................
Theo Hoen, CEO..............................................................................................................................
Erik Kaman, CFO.............................................................................................................................
2) Number of shares * 1000
26 Events after the balance sheet date No significant events have taken place since the reporting date.
27 Subsidiaries The largest subsidiaries are listed below:
Country of Ownership Incorporation Interest
Marel Iceland ehf. ………………………………………………… Iceland 100% Marel A/S …………………………………………………………. Denmark 100% Marel Salmon A/S ……………………………………………….. Denmark 100%Marel Seattle Inc …………………………………………………. USA 100% Marel Singapore Pte. Ltd ……………………………………….. Singapore 100% Marel Ltd. ………………………………………………………..… UK 100% Marel Slovakia s.r.o. ……………………………………………… Slovakia 100% Marel Holding B.V. ……………………………………………..… Netherlands 100% Marel Stork Poultry Processing B.V. …………………………… Netherlands 100% Marel Stork Poultry Processing Inc. ………………………….… USA 100% Marel Townsend Further Processing B.V. …………………..… Netherlands 100% Marel Meat Processing B.V. ………………………………….…. Netherlands 100% Marel Meat Processing Inc ……………………………………… USA 100%Stork Inter Ibérica S.A. …………………………………………… Spain 100%
Marel Inc. …………………………………………………………. USA 100% Marel Norge AS ………………………………………………...… Norway 100% Marel Food Systems GmbH & Co. KG ………………………… Germany 100% Marel GB Ltd. …………………………………………………….. UK 100% Marel Food Systems do Brasil Comercial Ltda. …………….… Brazil 100% Marel France SARL ……………………………………………… France 100% Marel Benelux B.V. ………………………………………….…… Netherlands 100% Marel Australia Pty Ltd. ………………………………………..… Australia 100% Marel Stork Food Systems Máquinas Alimenticias Ltda …….. Brazil 100%
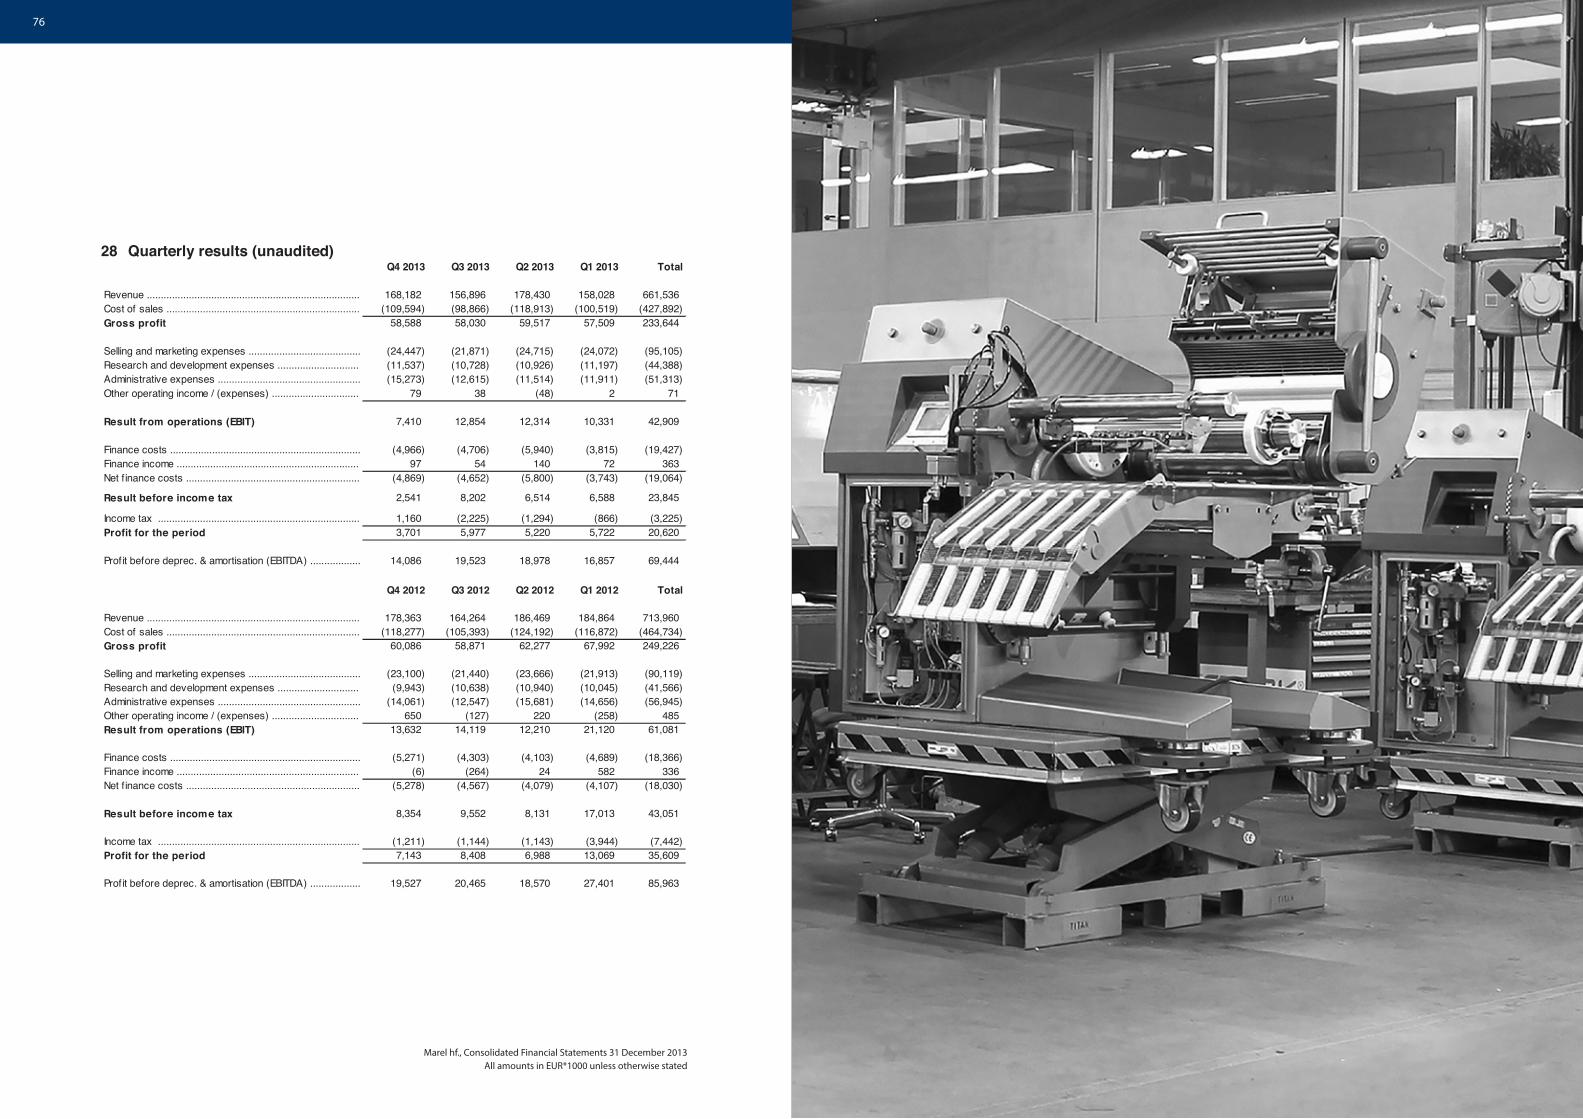
76 77
Marel hf., Consolidated Financial Statements 31 December 2013All amounts in EUR*1000 unless otherwise stated
28 Quarterly results (unaudited) Q4 2013 Q3 2013 Q2 2013 Q1 2013 Total
Revenue ............................................................................ 168,182 156,896 178,430 158,028 661,536 Cost of sales ..................................................................... (109,594) (98,866) (118,913) (100,519) (427,892) Gross profit 58,588 58,030 59,517 57,509 233,644
Selling and marketing expenses ........................................ (24,447) (21,871) (24,715) (24,072) (95,105) Research and development expenses ............................. (11,537) (10,728) (10,926) (11,197) (44,388) Administrative expenses ................................................... (15,273) (12,615) (11,514) (11,911) (51,313) Other operating income / (expenses) ............................... 79 38 (48) 2 71
Result from operations (EBIT) 7,410 12,854 12,314 10,331 42,909
Finance costs .................................................................... (4,966) (4,706) (5,940) (3,815) (19,427) Finance income ................................................................. 97 54 140 72 363 Net f inance costs .............................................................. (4,869) (4,652) (5,800) (3,743) (19,064)
Result before income tax 2,541 8,202 6,514 6,588 23,845
Income tax ........................................................................ 1,160 (2,225) (1,294) (866) (3,225) Profit for the period 3,701 5,977 5,220 5,722 20,620
Prof it before deprec. & amortisation (EBITDA) .................. 14,086 19,523 18,978 16,857 69,444
Q4 2012 Q3 2012 Q2 2012 Q1 2012 Total
Revenue ............................................................................ 178,363 164,264 186,469 184,864 713,960 Cost of sales ..................................................................... (118,277) (105,393) (124,192) (116,872) (464,734) Gross profit 60,086 58,871 62,277 67,992 249,226
Selling and marketing expenses ........................................ (23,100) (21,440) (23,666) (21,913) (90,119) Research and development expenses ............................. (9,943) (10,638) (10,940) (10,045) (41,566) Administrative expenses ................................................... (14,061) (12,547) (15,681) (14,656) (56,945) Other operating income / (expenses) ............................... 650 (127) 220 (258) 485 Result from operations (EBIT) 13,632 14,119 12,210 21,120 61,081
Finance costs .................................................................... (5,271) (4,303) (4,103) (4,689) (18,366) Finance income ................................................................. (6) (264) 24 582 336 Net f inance costs .............................................................. (5,278) (4,567) (4,079) (4,107) (18,030)
Result before income tax 8,354 9,552 8,131 17,013 43,051
Income tax ........................................................................ (1,211) (1,144) (1,143) (3,944) (7,442) Profit for the period 7,143 8,408 6,988 13,069 35,609
Prof it before deprec. & amortisation (EBITDA) .................. 19,527 20,465 18,570 27,401 85,963
Marel hf., Consolidated Financial Statements 31 December 2013All amounts in EUR*1000 unless otherwise stated
78