financial statements audit amity sd 2015-16 · amity school district no. 4j management’s...
TRANSCRIPT

AMITY SCHOOL DISTRICT NO. 4J
AMITY, OREGON
JUNE 30, 2016
AUDIT REPORT
STEVE TUCHSCHERER Certified Public Accountant A Professional Corporation
AMITY SCHOOL DISTRICT NO. 4J
807 Trade Street Amity, Oregon 97101-0138
(503) 835-2171
DISTRICT OFFICIALS
BARBARA ROWE . . . . . . . . . . . . . Board Chair PO Box 590, Amity, OR 97101 RAY BOTTENBERG. . . . . . . . . . . . . Vice Chair 9605 Yocum Road, Sheridan, OR 97378 PAUL DAUENHAUER . . . . . . . . . . . . Board Member 12800 SE Fairview Rd., Dayton, OR 97114 MATT FOERTSCH . . . . . . . . . . . . . Board Member PO Box 404, Amity, OR 97101 RYAN JONES . . . . . . . . . . . . . . . Board Member 22320 SE Boulder Crest Lane, Amity, OR 97101
ADMINISTRATION JEFF CLARK. . . . . . . . . . . . . . . . Superintendent 807 Trade Street, Amity, OR 97101 ANN ADAMS. . . . . . . . . . . . . . . . Deputy Clerk 807 Trade Street, Amity, OR 97101

AMITY SCHOOL DISTRICT NO. 4J
AUDIT REPORT
June 30, 2016
TABLE OF CONTENTS PAGE INDEPENDENT AUDITOR'S REPORT . . . . . . . . . . . 1a – 1b MANAGEMENT’S DISCUSSION AND ANALYSIS . . . . . . . . 2 - 10 BASIC FINANCIAL STATEMENTS: Government-wide Financial Statements: Statement of Net Position . . . . . . . . . . . . . 11 Statement of Activities . . . . . . . . . . . . . . 12 Fund Financial Statements: Balance Sheet - Governmental Funds . . . . . . . . . . . 13 Reconciliation of the Balance Sheet - Governmental Funds to the Statement of Net Position . . . . . . . . . . . . 14 Statement of Revenues, Expenditures, and Changes in Fund Balances - Governmental Funds . . . . . . . . . . . . . . 15 Reconciliation of the Statement of Revenues, Expenditures, and Changes in Fund Balances - Governmental Funds to the Statement of Activities . . 16 Notes To The Basic Financial Statements . . . . . . . . . . 17 - 45 REQUIRED SUPPLEMENTARY INFORMATION: Schedule of Revenues, Expenditures and Changes in Fund Balance - Budget and Actual - General Fund #100 . . . . . . 46 Schedule of Expenditures - Budget and Actual - General Fund #100 . . . . 47 Schedule of Revenues, Expenditures and Changes in Fund Balance - Budget and Actual: IDEA Grant Fund #200 . . . . . . . . . . . . . 48 Title 1 Grant Fund #201 . . . . . . . . . . . . . 49 Schedule of Proportionate Share of the Net Pension Liability . . . . . . 50 Schedule of Employer Contributions . . . . . . . . . . . 51

AMITY SCHOOL DISTRICT NO. 4J
AUDIT REPORT
June 30, 2016
TABLE OF CONTENTS (Continued): PAGE OTHER SUPPLEMENTARY INFORMATION:
Non-Major Special Revenue Funds: Combining Balance Sheet . . . . . . . . . . . . . 52 Combining Statement of Revenues, Expenditures, and Changes in Fund Balances 53 Schedule of Revenues, Expenditures, and Changes in Fund Balance - Budget and Actual: Federal Miscellaneous Grants Fund #204 . . . . . . . . 54 State Miscellaneous Grants Fund #205 . . . . . . . . 55 Community Projects Fund #250 . . . . . . . . . . 56 Student Body Fund #270 . . . . . . . . . . . . 57 Food Service Fund #280 . . . . . . . . . . . . 58 Vehicle Replacement Fund #292 . . . . . . . . . . 59 Technology Replacement Fund #293 . . . . . . . . . 60 Unemployment Fund #298 . . . . . . . . . . . 61 Scholarship Fund #299 . . . . . . . . . . . 62 Debt Service Funds: Schedule of Revenues, Expenditures, and Changes in Fund Balance - Budget and Actual: Debt Service Fund #300 (A Major Fund) . . . . . . . 63 PERS Bond Debt Service Fund #302 (A Major Fund) . . . . 64 Capital Projects Funds: Schedule of Revenues, Expenditures, and Changes in Fund Balance - Budget and Actual: Capital Improvement Fund #430 (A Major Fund) . . . . . . 65 Additional Supporting Schedules: Schedule of Property Tax Transactions . . . . . . . . . . 66 Schedule of Fund Expenditures & Appropriations . . . . . . . . 67 Schedule of Long-Term Debt Transactions . . . . . . . . . 68 Schedule of Future Requirements to Retire Long-Term Debt . . . . . 69 ACCOMPANYING INFORMATION: Independent Auditor’s Report Required by Oregon State Regulations . . . . . . . . . . . . . 70

AMITY SCHOOL DISTRICT NO. 4J
AUDIT REPORT
June 30, 2016
TABLE OF CONTENTS (Continued): PAGE SINGLE AUDIT SECTION: Schedule of Expenditures of Federal Awards . . . . . . . . . 71 Independent Auditor’s Report on Compliance and on Internal Control over Financial Reporting Based on an Audit of Financial Statements Performed in Accordance with Government Auditing Standards . . . . . . 72 Independent Auditor’s Report on Compliance for Each Major Program and on Internal Control over Compliance Required by the Uniform Guidance . . . 73 - 74 Schedule of Findings and Questioned Costs . . . . . . . . . . 75 FORM 581-3211-C . . . . . . . . . . . . . . . . . 76


MANAGEMENT’S DISCUSSION
AND ANALYSIS

AMITY SCHOOL DISTRICT NO. 4J Management’s Discussion and Analysis (MD&A)
For the Fiscal Year Ended June 30, 2016 Unaudited
- 2 -
The discussion and analysis of Amity School District’s financial performance provides an overview of the District’s financial activities for the fiscal year that ended June 30, 2016. The intent of this discussion and analysis is to look at the District’s financial performance as a whole. Readers should also review the basic financial statements and notes to enhance their understanding of the District’s financial performance. FINANCIAL HIGHLIGHTS Key financial highlights for the fiscal year ended June 30, 2016 are as follows: Pension asset and liability accounts are based on estimates from Oregon PERS that will fluctuate significantly
from year to year, which impact several of the following highlights. See Note 7, starting on page 29 for additional information.
The District’s net position decreased by $183,290 which represents a 21.6 percent decrease from the previous year.
General revenues accounted for $8,512,931 in revenue, or 89.8 percent of all revenues. Program specific revenues
in the form of charges for services, and grants and contributions accounted for $963,864 or 10.2 percent of total revenues of $9,476,795.
The District had $9,660,085 in expenses related to governmental activities; which was more than total revenues, resulting in a decrease in net position of $183,290. Total expenses increased $491,733 over the previous year.
Total assets of governmental activities decreased by $26,416 a percentage decrease of 0.24 percent, primarily due
to the elimination of the net pension asset from the prior year.
Total liabilities increased by $420,951, largely due to the addition of the net pension liability of $523,750 and a new QZAB loan of $650,000.
Among the governmental funds, the general fund had $7,980,301 in revenues, which primarily consisted of state
school support funds and property taxes. General Fund expenditures totaled $8,097,718 including $95,000 in budgeted interfund transfers out and $69,261 in budgeted debt service payments. The General Fund’s fund balance decreased $117,417 to $683,262.
OVERVIEW OF THE FINANCIAL STATEMENTS Management’s Discussion and Analysis introduces the District’s basic financial statements. The basic financial statements include: 1) government-wide financial statements, 2) fund financial statements, and 3) notes to the financial statements. This report also includes additional supplementary information to supplement the basic financial statements.

AMITY SCHOOL DISTRICT NO. 4J Management’s Discussion and Analysis (MD&A)
For the Fiscal Year Ended June 30, 2016 Unaudited
- 3 -
Government-wide Financial Statements The first of the government-wide statements is the Statement of Net Position. This is the District-wide statement of financial position presenting information that includes all of the District’s assets and liabilities. Over time, increases or decreases in net position may serve as a useful indicator of whether the financial position of the District as a whole is improving or deteriorating. Evaluation of the overall economic health of the District would extend to other non-financial factors such as the condition of school buildings and other facilities and changes in the district’s enrollment, which dictates the majority of revenue to be collected through the State Funding Formula. The second government-wide statement is the Statement of Activities which reports how the District’s net position changed during the current fiscal year. All current year revenues and expenses are included regardless of when cash is received or paid. An important purpose of the design of the Statement of Activities is to show the financial reliance of the distinct activities or functions of the District that are primarily supported by intergovernmental revenues-- principally state basic school support and property tax revenues. The governmental activities of the District include instruction, instructional support services, operation and maintenance of plant, student transportation, and non-instructional support services. Fund Financial Statements A fund is an accountability unit used to maintain control over resources segregated for specific activities or objectives. The District uses fund accounting to ensure and demonstrate compliance with finance-related laws and regulations. Within the basic financial statements, Fund Financial Statements focus on the District’s most significant funds rather than the District as a whole. Major funds are separately reported while all others are combined into a single, aggregated presentation. Individual fund data for non-major funds is provided in the form of individual budget versus actual statements and combining statements in a later section of this report. At this time the District has two kinds of funds: Governmental funds focus on how money flows into and out of those funds and the balances left at year-end available for spending in future periods. Unlike the government-wide financial statements, the fund financial statements report short-term fiscal accountability focusing on use of spendable resources during the year, and balances of spendable resources available at the end of the fiscal year. They are useful in evaluating whether the annual financing requirements of governmental programs such as regular and special education were financed in the short term and the commitment of spendable resources for the near-term. Since the government-wide focus includes the long-term view, comparisons between these two perspectives may provide insight into the long-term impact of short-term financing decisions. Both the governmental statement of assets, liabilities, and fund equities and the governmental fund statement of receipts, expenditures, and changes in fund balances provide a reconciliation to government-wide statements to assist in understanding the differences between these two perspectives. Fiduciary funds such as private-purpose trust funds for scholarships are reported in the fiduciary fund financial statements, but are excluded from government-wide reporting. Fiduciary fund financial statements report net position and changes in net position on a cash basis. Notes to the Financial Statements The accompanying notes to the financial statements provide information essential to a full understanding of the government-wide and fund financial statements. The notes to the financial statements begin immediately following the basic financial statements.

AMITY SCHOOL DISTRICT NO. 4J Management’s Discussion and Analysis (MD&A)
For the Fiscal Year Ended June 30, 2016 Unaudited
- 4 -
Other Information In addition to the basic financial statements and accompanying notes, this report also presents, as required supplementary information schedules of revenues, expenditures, and changes in fund balance–budget and actual for the General Fund, the IDEA Grant Fund, the Title 1 Fund. The required supplementary information immediately follows the notes to the financial statements. Other supplementary information includes individual fund schedules of revenues, expenditures, and changes in fund balance–budget and actual for the Debt Service Funds and all non-major funds. Also presented as other supplementary information are various other schedules. These schedules immediately follow the required supplementary information in this report. Financial Analysis of the School District as a Whole Recall that the Statement of Net Position provides the perspective of the District as a whole. Net position may serve over time as a useful indicator of a government’s financial position. The District’s net position at fiscal year-end is $667,201. This is a $183,290 decrease from last year’s net position and represents a 21.6 percent decrease from the previous year. The following table provides a summary of the District’s net position. Prior year information is provided for comparative purposes.
June 30, 2016 June 30, 2015Percentage Change
AssetsCurrent and Other Assets 5,967,893$ 5,784,629$ 3.17%Capital Assets 5,051,813 5,261,493 -3.99%
Total Assets 11,019,706 11,046,122 -0.24%
Deferred Outflow of Resources 33,745 - N/A
LiabilitiesLong-Term Liabilities 9,323,170 8,987,169 3.74%Other Liabilities 904,860 819,910 10.36%
Total Liabilities 10,228,030 9,807,079 4.29%
Deferred Inflow of Resources 158,220 388,552 -59.3%
Net PositionInvested in Capital Assets Net of Debt 275,332 543,255 -49.32%Restricted 33,894 244,293 -86.13%Unrestricted 357,975 62,943 468.73%
Total Net Position 667,201$ 850,491$ -21.55%
Summary of Net Position
Governmental Activities
AMITY SCHOOL DISTRICT NO. 4J Management’s Discussion and Analysis (MD&A)
For the Fiscal Year Ended June 30, 2016 Unaudited
- 5 -
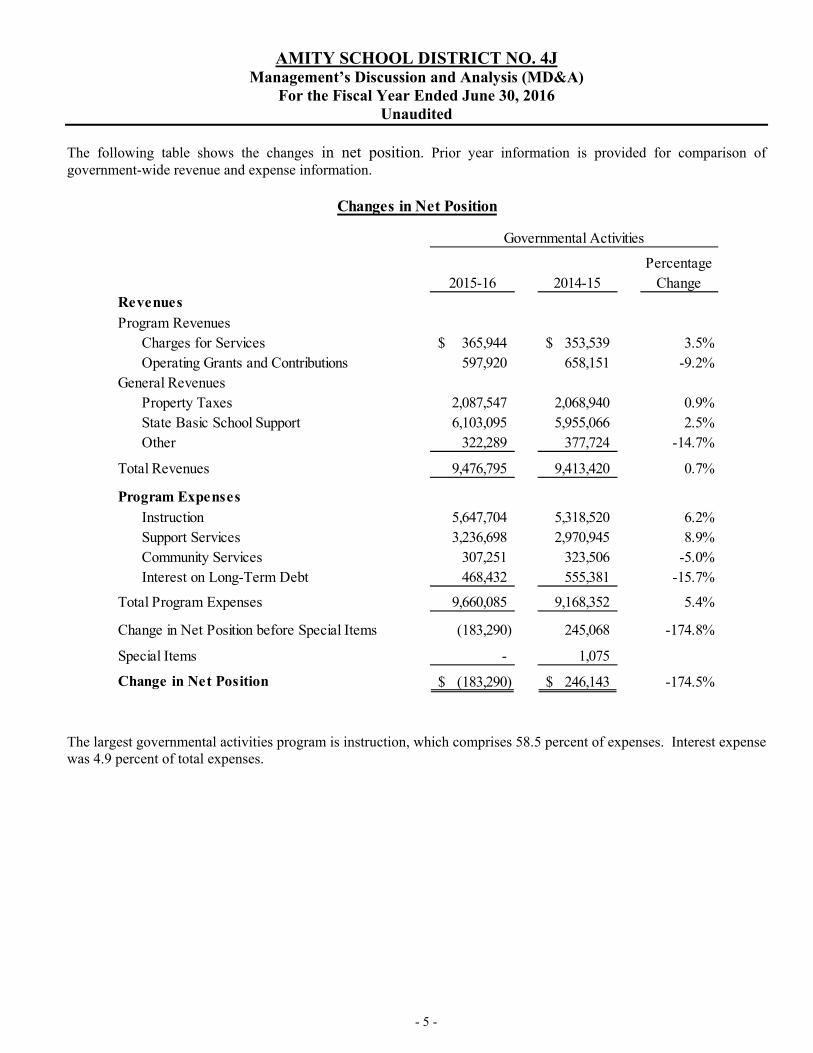
The following table shows the changes in net position. Prior year information is provided for comparison of government-wide revenue and expense information.
Governmental Activities
2015-16 2014-15Percentage
ChangeRevenuesProgram Revenues
Charges for Services 365,944$ 353,539$ 3.5%Operating Grants and Contributions 597,920 658,151 -9.2%
General RevenuesProperty Taxes 2,087,547 2,068,940 0.9%State Basic School Support 6,103,095 5,955,066 2.5%Other 322,289 377,724 -14.7%
Total Revenues 9,476,795 9,413,420 0.7%
Program ExpensesInstruction 5,647,704 5,318,520 6.2%Support Services 3,236,698 2,970,945 8.9%Community Services 307,251 323,506 -5.0%Interest on Long-Term Debt 468,432 555,381 -15.7%
Total Program Expenses 9,660,085 9,168,352 5.4%
Change in Net Position before Special Items (183,290) 245,068 -174.8%
Special Items - 1,075
Change in Net Position (183,290)$ 246,143$ -174.5%
Changes in Net Position
The largest governmental activities program is instruction, which comprises 58.5 percent of expenses. Interest expense was 4.9 percent of total expenses.

AMITY SCHOOL DISTRICT NO. 4J Management’s Discussion and Analysis (MD&A)
For the Fiscal Year Ended June 30, 2016 Unaudited
- 6 -
The following chart analyzes the revenue between governmental activities from prior to current year.

AMITY SCHOOL DISTRICT NO. 4J Management’s Discussion and Analysis (MD&A)
For the Fiscal Year Ended June 30, 2016 Unaudited
- 7 -
The Statement of Activities shows the cost of program services and the charges for services, grants, and contributions offsetting those services. The following table shows, for governmental activity, the total cost of the four major functional activities of the District. The table also shows each function’s net cost (total cost less charges for services generated by the activities and intergovernmental aid provided for specific programs). The net cost shows the financial burden that was placed on the State and District’s taxpayers by each of these functions.
Total Cost of Services
Net Cost (Profit) of Services
Total Cost of Services
Net Cost (Profit) of Services
Instruction 5,647,704$ 4,984,643$ 5,318,520$ 4,644,105$ Support Services
Students 487,215 487,161 464,564 464,297 Instructional Staff 147,176 114,323 153,998 98,028 General Administration 210,848 210,848 197,303 197,303 School Administration 612,909 610,418 541,658 536,983 Business Services 286,304 286,304 256,414 256,414 Operation & Maintenance of Plant Services 786,905 786,905 724,171 724,171 Student Transportation Services 456,492 456,492 408,438 408,438 Staff Services 25,853 25,322 21,547 21,547 Technology Services 222,996 222,996 202,852 202,852
Community Services 307,251 42,377 323,506 47,143 Interest on Long-Term Debt 468,432 468,432 555,381 555,381
Total Program Expenses 9,660,085$ 8,696,221$ 9,168,352$ 8,156,662$
Governmental Activities
2015-16 2014-15
The dependence on property tax and state basic support revenues is apparent. Over 88 percent of instruction activities are supported through property tax and state basic support. For all governmental activities general revenue support was 90 percent. Unrestricted state basic school support payments are by far the primary support of Amity School District No. 4J students.
AMITY SCHOOL DISTRICT NO. 4J Management’s Discussion and Analysis (MD&A)
For the Fiscal Year Ended June 30, 2016 Unaudited
- 8 -
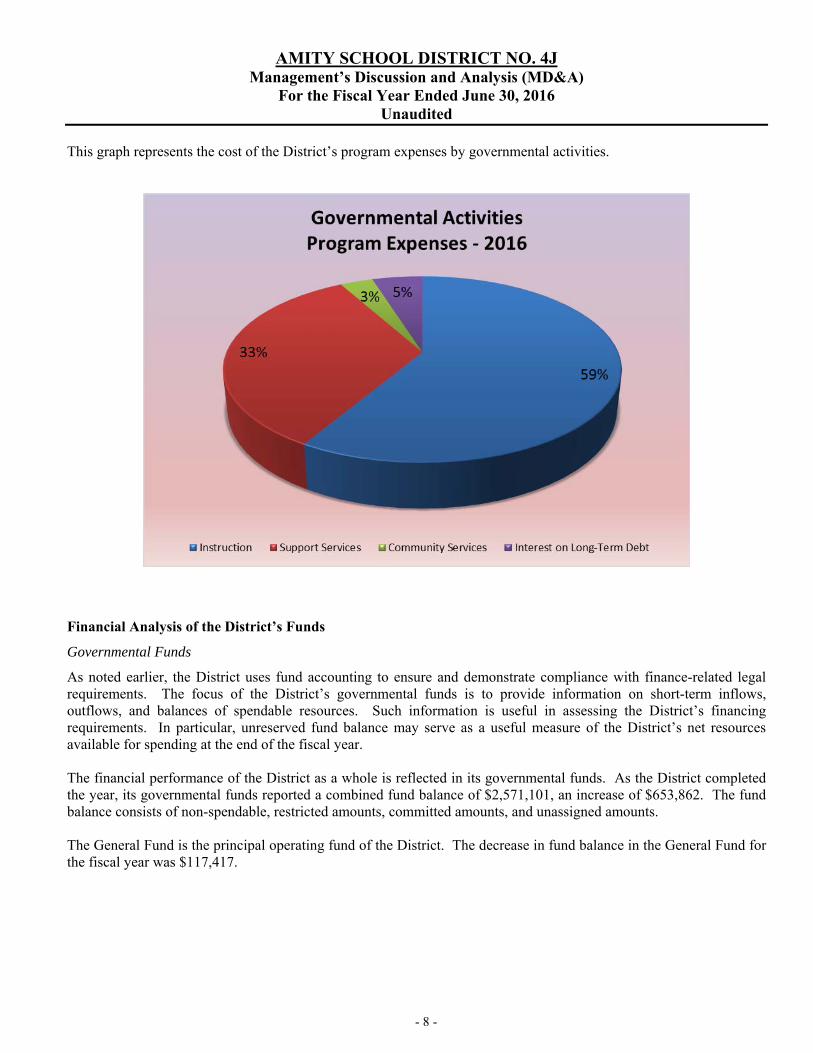
This graph represents the cost of the District’s program expenses by governmental activities.
Financial Analysis of the District’s Funds Governmental Funds As noted earlier, the District uses fund accounting to ensure and demonstrate compliance with finance-related legal requirements. The focus of the District’s governmental funds is to provide information on short-term inflows, outflows, and balances of spendable resources. Such information is useful in assessing the District’s financing requirements. In particular, unreserved fund balance may serve as a useful measure of the District’s net resources available for spending at the end of the fiscal year. The financial performance of the District as a whole is reflected in its governmental funds. As the District completed the year, its governmental funds reported a combined fund balance of $2,571,101, an increase of $653,862. The fund balance consists of non-spendable, restricted amounts, committed amounts, and unassigned amounts. The General Fund is the principal operating fund of the District. The decrease in fund balance in the General Fund for the fiscal year was $117,417.

AMITY SCHOOL DISTRICT NO. 4J Management’s Discussion and Analysis (MD&A)
For the Fiscal Year Ended June 30, 2016 Unaudited
- 9 -
Budgetary Highlights Over the course of the year, the District made only minor changes to its various funds’ budgets. General Fund revenues were budgeted and anticipated to be collected in the amount of $7,936,683 during the fiscal year. Actual General Fund receipts of $7,980,301 were more than budgeted revenues by $43,618, or 0.6 percent. In the General Fund, District spending was less than budgeted amounts in most function areas. Total appropriations budgeted in the General Fund were $8,830,983 while actual General Fund expenditures of $8,097,718 resulted in a difference of $733,265 or 8.3 percent of the budgeted total. The IDEA Grant Fund actual revenues of $149,089 were $99,911 less than budgeted while expenditures of $149,089 were $99,911 less than the budgeted amount. The fund began the year with a $0 balance and ended the year with a $0 balance. The Title 1 Grant Fund actual revenues of $120,278 were $79,722 less than budgeted while expenditures of $120,278 were $79,722 less than the budgeted amount. The fund began the year with a $0 balance and ended the year with a $0 balance. The Debt Service Fund actual revenues received were $28,113 more than budgeted while expenditures equaled the budgeted amount of $561,556. The fund began the year with a $44,781 balance and ended the year with a $33,894 balance. The PERS Bond Service Fund actual revenues received were $107,007 more than budgeted while expenditures equaled the budgeted amount. The fund began the year with a $445,084 balance and ended the year with a $581,876 balance. Capital Assets and Debt Administration Capital Assets As of June 30, 2016, the District had invested $10,467,635 in capital assets, including school buildings, athletic facilities, land, vehicles, computers and other equipment and furnishings. This amount represents an increase of $121,344 from the prior year due to additions. Total depreciation expense for the year was $331,024. Additional information on the District’s capital assets can be found in Note 4 in the notes to the basic financial statements section of this report.

AMITY SCHOOL DISTRICT NO. 4J Management’s Discussion and Analysis (MD&A)
For the Fiscal Year Ended June 30, 2016 Unaudited
- 10 -
Long-Term Debt At June 30, 2016, the District had general obligation bonds payable due of $3,530,000. The entire balance is backed by the full faith and credit of the District. Principal payments on the current bonds were $490,000 during the fiscal year. Interest of $71,556 was paid on the bonded debt. The District had an outstanding limited tax pension obligation bond payable of $4,711,420. For more information see note 5 of this document. The District had Qualified Zone Academy Bonds (QZAB) payable of $1,108,865. A new QZAB loan was acquired during the fiscal year in the amount of $650,000. The entire balance is backed by the full faith and credit of the District. Debt payments reduced the QZAB debts by $69,261 during the fiscal year. Annual payments are made to a trustee, which accumulates the payments until the bonds come due in 2019. Interest is earned on the account held by the trustee, and interest on the bonds is subsidized by the federal government’s QZAB program. The District had capital leases for bus purchases payable of $137,616, the current principal payment was $32,496 and $3,912 was paid in interest. Economic Factors and Next Year’s Budget and Rates The primary factors considered in developing the budget for next year were the District’s declining student enrollment level in spite of a 3 percent increase in anticipated state school fund allocations. The budget was created with a 5 percent decrease in PERS rates as compared to the current fiscal year. Budgeted expenditures in the General Fund decreased 4 percent to $8,574,768 for fiscal year 2016-2017. Anticipated revenue decreases in state school fund accounts for the decrease in budgeted expenditures. No new programs were added to the 2016-2017 budget. The State’s budget for the 2016-2017 biennium is expected to meet the District’s 2016-2017 budgeted state basic school support revenues. The district continues its conservative approach to review the status of the various issues impacting its funding while scrutinizing all expenditures and working closely with staff to implement cost saving practices. The 2016-17 budget has been prepared emphasizing transparency in order to maximize efficiency. Contacting the District’s Financial Management This financial report is designed to provide our citizens, taxpayers, investors and creditors with a general overview of the District’s finances and to demonstrate the District’s accountability for the resources it receives. If you have any questions about this report or need additional information, contact the Business Office, Amity School District No. 4J, 807 Trade St., Amity, Oregon 97101.

BASIC FINANCIAL
STATEMENTS
Government-wide Financial Statements

Governmental ActivitiesASSETS:
Current Assets:Cash and Investments 2,371,814$ Property Taxes Receivable 200,049 Accounts Receivable 67,899 Due From Other Governments 124,654 Prepaid Expenses 544 Prepaid Loan Fees, net of accumulated amortizatio 131,447 Inventory-Food, Supplies & Commodities 7,519
Total Current Assets 2,903,926$
Capital Assets:Land 296,099 Land Improvements 767,926 Buildings & Improvements 8,529,167 Vehicles 509,545 Equipment 364,898 Less: Accumulated Depreciation (5,415,822)
Total Capital Assets, Net of Depreciation 5,051,813
Other Assets:Prepaid Expense - Pension Obligation 6,618,174 Less: Accumulated Amortization (3,554,207)$
Total Other Assets, Net of Amortization 3,063,967
Total Assets 11,019,706$
DEFERRED OUTFLOW OF RESOURCES:Pension Related Deferrals 33,745
Total Deferred Outflow of Resources 33,745$
LIABILITIES: Current Liabilities:
Accounts Payable 27,578$ Accrued Vacation Benefits 27,718 Interest Payable 4,559 Current Portion of Long-Term Liabilities:
Capital Leases Payable 33,243 QZAB Note Payable 112,595 General Obligations Bonds 520,000 Limited Tax PERS Bonds 179,167 Total Current Liabilities 904,860$
Long-Term Liabilities:Noncurrent Portion of Long-Term Liabilities:
Capital Leases Payable 104,373$ General Obligations Bonds 3,010,000 Limited Tax PERS Bonds 4,532,253 QZAB Note Payable 996,270 Net OPEB Obligation 156,524
Net Pension Liability 523,750 Total Long-Term Liabilities 9,323,170
Total Liabilities 10,228,030$
DEFERRED INFLOW OF RESOURCES:Pension Related Deferrals 158,220
Total Deferred Inflow of Resources 158,220$
NET POSITION:Invested in capital assets, net of related debt 275,332$ Restricted for: Debt Service 33,894 Unrestricted 357,975
Total Net Position 667,201$
AMITY SCHOOL DISTRICT NO. 4JSTATEMENT OF NET POSITION
June 30, 2016
The accompanying notes to the basic financial statements are an integral part of this statement.- 11 -

Net (Expense)Revenue and
Change inProgram Revenues Net Position
Charges Operatingfor Grants and Governmental
(Expenses) Services Contributions ActivitiesGOVERNMENTAL ACTIVITIES:
Instruction:Regular Instruction 4,280,580$ 307,088$ 92,815$ (3,880,677)$ Special Programs 1,365,446 - 263,158 (1,102,288) Summer School Programs 1,678 - - (1,678)
Total Instruction 5,647,704 307,088 355,973 (4,984,643)
Support Services:Students 487,215 - 54 (487,161) Instructional Staff 147,176 - 32,853 (114,323) General Administration 210,848 - - (210,848) School Administration 612,909 - 2,491 (610,418) Business Services 286,304 - - (286,304) Operation & Maintenance of Plant Service 786,905 - - (786,905) Student Transportation Services 456,492 - - (456,492) Staff Services 25,853 - 531 (25,322) Technology Services 222,996 - - (222,996)
Total Support Services 3,236,698 - 35,929 (3,200,769)
Community Services 307,251 58,856 206,018 (42,377)
Interest on Long-Term Debt 468,432 - - (468,432)
Total Governmental Activities 9,660,085$ 365,944$ 597,920$ (8,696,221)$
GENERAL REVENUES:Local Sources: Property Taxes, Levied for General Purposes 1,540,264 Property Taxes, Levied for Debt Service Purposes 547,283 Interest and Investment Earnings 21,864 Miscellaneous 102,217
County School Fund 88,768
State School Support Available for General Purposes 6,103,095 Common School Fund 109,440
Subtotal - General Revenues 8,512,931
Change in Net Position (183,290)
Net Position - July 1, 2015 850,491
Net Position - June 30, 2016 667,201$
AMITY SCHOOL DISTRICT NO. 4J
STATEMENT OF ACTIVITIES
For the Fiscal Year Ended June 30, 2016
The accompanying notes to the basic financial statements are an integral part of this statement.- 12 -

BASIC FINANCIAL
STATEMENTS
Fund Financial Statements Governmental Funds

PERSIDEA Debt Bond Debt Capital
General Grant Title 1 Service Service Improveme TotalFund Fund Fund Fund Fund Fund Other Governmental#100 #200 #201 #300 #302 #430 Funds Funds
ASSETS:Cash and Cash Equivalents 507,701$ -$ -$ 24,619$ 581,876$ 738,897$ 518,721$ 2,371,814$ Accounts Receivable 67,899 - - - - - - 67,899 Property Taxes Receivable 143,006 - - 57,043 - - - 200,049 Due From Other Funds 110,001 - - - - - - 110,001 Due from Other Governments - 55,225 41,302 - - - 28,127 124,654 Prepaid Expenses - - - - - - 544 544 Inventory-Food, Supplies & Commodities - - - - - - 7,519 7,519
Total Assets 828,607$ 55,225$ 41,302$ 81,662$ 581,876$ 738,897$ 554,911$ 2,882,480$
LIABILITIES, DEFERRED INFLOWS OF RESOURCES AND FUND BALANCES:Liabilities:
Account Payables 26,832$ -$ -$ -$ -$ -$ 746$ 27,578$ Due to Other Funds - 55,225 41,302 - - - 13,474 110,001
Total Liabilities 26,832 55,225 41,302 - - - 14,220 137,579
Deferred Inflows of Resources:Deferred Property Tax Revenue 118,513 - - 47,768 - - - 166,281
Total Deferred Inflows of Resources 118,513 - - 47,768 - - - 166,281
Fund Balances:Non-spendable - - - - - - 7,519 7,519 Restricted for:
Debt Service - - - 33,894 - - - 33,894 Committed for:
Educational Programs - - - - - - 74,977 74,977 Community Projects - - - - - - 12,634 12,634 Student Body Activities - - - - - - 174,256 174,256 Food Service Programs - - - - - - 5,798 5,798 Equipment Acquisition - - - - - - 140,179 140,179 Capital Construction & Bldg. Maint. - - - - - 738,897 - 738,897 Employee Benefits Programs - - - - - - 125,328 125,328 Debt Service - - - - 581,876 - - 581,876
Unassigned 683,262 - - - - - - 683,262
Total Fund Balances 683,262 - - 33,894 581,876 738,897 540,691 2,578,620
Total Liabilities, Deferred Inflows of Resources & Fund Balances 828,607$ 55,225$ 41,302$ 81,662$ 581,876$ 738,897$ 554,911$ 2,882,480$
AMITY SCHOOL DISTRICT NO. 4JBALANCE SHEET
GOVERNMENTAL FUNDSJune 30, 2016
The accompanying notes to the basic financial statements are an integral part of this statement.- 13 -

Total Fund Balances - Governmental Funds 2,578,620$
Amounts reported for governmental activities in the Statement of Net Position are different because:
Capital assets used in governmental activities are not financial resources
and therefore not reported in the governmental funds.
The cost of the assets is - 10,467,635$
The accumulated depreciation is - (5,415,822)
Net Value of Assets 5,051,813
Amounts paid to Oregon Public Retirement System to reduce the unfunded
pension obligation of the District are not financial resources and therefore
are not capitalized as a prepaid expense in the governmental funds.
The original prepaid amount is - 6,618,174
The accumulated amortization is - (3,554,207)
Net Value of Prepaid Expense 3,063,967
Amounts paid for loan fees out of refunding bond proceeds are not financial
resources and therefore are not capitalized as a prepaid expense in the
governmental funds.
The original prepaid amount net
of accumulated amortization is - 131,447
Accrued interest payable is not included as a liability in the governmental funds. (4,559)
Property taxes receivable that will not be available to pay for current-period
expenditures are deferred in the governmental funds. 166,281
Deferred inflows and outflows of pension contributions and earnings arenot reported in the governmental funds.
Deferred Pension Contributions 33,745 Deferred Earnings on Pension Assets (158,220) Net Value of Deferrals (124,475)
Certain liabilities are not due and payable in the current period
and therefore are not reported in the governmental funds. Those liabilities at year-end consist of :
Accrued Vacation Benefits 27,718 Capital Leases 137,616 Limited Tax PERS Bonds 4,711,420 General Obligation Bonds 3,530,000 Net OPEB Obligation 156,524 QZAB Note Payable 1,108,865 Net Pension Liability 523,750
Total Long-Term Liabilities (10,195,893)
Net Position of Governmental Activities 667,201$
AMITY SCHOOL DISTRICT NO. 4J
RECONCILIATION OF THE BALANCE SHEETGOVERNMENTAL FUNDS TO THE STATEMENT OF NET POSITION
June 30, 2016
The accompanying notes to the basic financial statements are an integral part of this statement.- 14 -

PERSBond
IDEA Debt Debt Capital Other TotalGeneral Grant Title 1 Service Service Improvem Govern- Govern-
Fund Fund Fund Fund Fund Fund mental mental#100 #200 #201 #300 #302 #430 Funds Funds
REVENUES:
Basic School Support Fund 6,074,042$ -$ -$ -$ -$ -$ 29,053$ 6,103,095$ Ad Valorem Taxes-Current Year 1,475,770 - - 526,011 - - - 2,001,781
Ad Valorem Taxes-Prior Year 55,244 - - 22,859 - - - 78,103 Services Provided to Other Funds - - - - 706,416 - - 706,416 Fees and Charges 30,768 - - - - - 318,405 349,173 Admission to Co-Curricular Activities 16,771 - - - - - - 16,771 Interest on Investments 10,610 - - 1,799 2,591 879 5,985 21,864 Miscellaneous Local Revenues 30,613 - - - - 31,939 39,665 102,217 County School Fund 88,768 - - - - - - 88,768 Common School Fund 109,440 - - - - - - 109,440 State Grants-In-Aid 88,270 - - - - - 7,694 95,964 Federal Reimbursement Grants 5 149,089 120,278 - - - 232,584 501,956
Total Revenues 7,980,301 149,089 120,278 550,669 709,007 32,818 633,386 10,175,548
EXPENDITURES:
Instruction:Regular Instruction 3,788,206 - - - - - 246,542 4,034,748 Special Programs 1,082,144 143,462 119,696 - - - - 1,345,302 Summer School Programs 1,595 - - - - - - 1,595
Support Services:Students 491,171 54 - - - - - 491,225 Instructional Staff 115,503 5,573 47 - - - 27,233 148,356 General Administration 210,631 - - - - - - 210,631 School Administration 618,171 - - - - - 2,491 620,662 Business Services 233,029 - - - - 13,000 216 246,245 Operation & Maint. of Plant Services 757,669 - - - - 17,304 12,606 787,579 Student Transportation Services 408,748 - - - - - - 408,748 Information and Staff Services 23,924 - - - - - 531 24,455 Technology Services 202,666 - - - - - 16,484 219,150
Community Services - - 535 - - - 296,450 296,985 Facilities Acquisition and Construction - - - - - 96,565 - 96,565 Debt Service 69,261 - - 561,556 572,215 - 36,408 1,239,440
Total Expenditures 8,002,718 149,089 120,278 561,556 572,215 126,869 638,961 10,171,686
Excess (Deficiency) of RevenuesOver Expenditures (22,417) - - (10,887) 136,792 (94,051) (5,575) 3,862
OTHER FINANCING SOURCES (USES):Interfund Transfers In - - - - - 45,000 50,000 95,000 Bond Proceeds In - - - - 650,000 - 650,000 Interfund Transfers Out (95,000) - - - - - - (95,000)
Net Change in Fund Balances (117,417) - - (10,887) 136,792 600,949 44,425 653,862
Fund Balances - July 1, 2015 800,679 - - 44,781 445,084 137,948 488,747 1,917,239
Fund Balances - June 30, 2016 683,262$ -$ -$ 33,894$ 581,876$ 738,897$ 533,172$ 2,571,101$
AMITY SCHOOL DISTRICT NO. 4JStatement of Revenues,
Expenditures, and Changes in Fund BalancesGOVERNMENTAL FUNDS
For the Fiscal Year Ended June 30, 2016
The accompanying notes to the basic financial statements are an integral part of this statement.- 15 -

Net Changes in Fund Balances - Total Governmental Funds 653,862$
Amounts reported for governmental activities in the Statement of Activities are different because:
Governmental funds report capital outlay as expenditures. However, in the Statement of Activities, the cost of those assets are allocated over their estimated useful lives as depreciation expense.
Expenditures for capitalized assets 121,344$ Less current year depreciation (331,024) (209,680)
Some property tax revenues will not be collected for several months after the District's fiscal year end and are therefore not considered "available" revenues in the governmental funds, instead these funds are shown as deferred revenue. However, these funds are recorded as revenue in the Statement of Activities. 7,663 7,663
Changes in the Food Service inventory balance from the prior year to the current year are an adjustment to expense for the Statement of Activities. That change is reflected as a change in fund balance reserve for the fund financial statements. That difference in accounting is reconciled here. 1,386 1,386
Expense accruals in the governmental funds do not include accrued interest expense payable. The change in payables from the prior year to the current year is reconciled here. 815 815
Payment of unfunded pension obligation was originally reported in the governmental funds as an expenditure. In the Statement of Activities the amount to be charged each year as an expense over the estimated expense incurred to pay the obligation is amortized, rather than expensed at the time of the prepayment of PERS funding.
Amount of current year amortization (255,331) (255,331)
Cost of loan fees was originally reported in the governmental funds as an expenditure. In the Statement of Activities the amount to be charged each year as an expense over the repayment period of the obligation is amortized, rather than expensed at the time the loan fees were incurred.
Amount of current year amortization (30,333) (30,333)
Some items reported in Statement of Activities do not require the use of current financial resources and therefore are not reported as expenditures in governmental funds.
These activities consist of:Increase in accrued OPEB (7,257) Vacation Payable (27,718) (34,975)
Adjustment for pension costs on accrued basis (459,185)
Bond proceeds are recognized as revenue for the governmental funds. (650,000)
Repayment of debt principal amounts are expenditures in the governmental funds, but the repayment reduces long-term debt liabilities in the Statement of Net Position.
Retirement of principal is as follows:Vacation Payable 22,295 Capital Leases Payable 32,496 General Obligations Bonds 490,000 Limited Tax PERS Bonds 178,436 QZAB Note Payable 69,261 792,488
Changes in Net Position of Governmental Activities (183,290)$
AMITY SCHOOL DISTRICT #4J
RECONCILIATION OF THE STATEMENT OF REVENUES, EXPENDITURES, AND CHANGES IN FUND BALANCES
GOVERNMENTAL FUNDS TO THE STATEMENT OF ACTIVITIESFor the Fiscal Year Ended June 30, 2016
The accompanying notes to the basic financial statements are an integral part of this statement.- 16 -

BASIC FINANCIAL
STATEMENTS
Notes to the Basic Financial Statements
AMITY SCHOOL DISTRICT NO. 4J NOTES TO THE BASIC FINANCIAL STATEMENTS
June 30, 2016
- 17 -
Amity School District No. 4J was organized under the provisions of Oregon Statutes pursuant to ORS Chapter 332 for the purpose of operating elementary and secondary schools. The District is government by a separately elected five-member Board of Directors who approve the administrative officials. The daily functioning of the District is under the supervision of the Superintendant. As required by generally accepted accounting principles, all activities of the Dis-trict have been included in the basic financial statements. 1. SUMMARY OF SIGNIFICANT ACCOUNTING POLICIES: The financial statements of Amity School District No. 4J have been prepared in conformity with accounting principals generally accepted in the United States of America as applied to government units. The Governmental Accounting Standards Board (GASB) is the accepted standard-setting body for establishing governmental accounting and financial reporting principles. The more significant of the government's accounting policies are described below. A. Reporting Entity In determining the financial reporting entity, Amity School District No. 4J complies with Governmental Accounting Standards Board Statement 14, “The Financial Reporting Entity.” The criteria for including organizations as compo-nent units within the District’s reporting entity, include whether 1) the District appoints a voting majority of the organ-ization’s board; 2) the District is able to impose its will on the organization; 3) the organization has the potential to im-pose a financial benefit or burden on the District; and 4) there is fiscal dependency by the organization on the District. Based on these criteria, Amity School District No. 4J has no component units. B. Basis of Presentation Government-wide Statements: The statement of net position and the statement of activities display information about the District as a whole. These statements include the financial activities of the overall District. Eliminations have been made to minimize the double counting of internal activities. Governmental activities include programs supported pri-marily by taxes, state school support payments, grants and other intergovernmental revenues. The District has no business type activities that rely, to a significant extent, on fees and charges for support. The District also reports no fiduciary activities. The statement of activities demonstrates the degree to which direct expenses of a given function are offset by program revenues. Direct expenses are those that are specifically associated with a program of function and, therefore, are clear-ly identifiable to a particular function. Program revenues include (a) fees and charges paid by the recipients of goods or services offered by the programs and (b) grants and contributions that are restricted to meeting the operational or capital requirements of a particular program. Revenues that are not classified as program revenues, including all taxes, are presented as general revenues. The comparison of direct expenses with program revenues identifies the extent to which each governmental function is self-financing or draws from the general revenues of the District.
AMITY SCHOOL DISTRICT NO. 4J NOTES TO THE BASIC FINANCIAL STATEMENTS
June 30, 2016
- 18 -
1. SUMMARY OF SIGNIFICANT ACCOUNTING POLICIES (CONT.): B. Basis of Presentation (Cont.) Fund Financial Statements: During the fiscal year, the District segregates transactions related to certain school dis-trict functions or activities in separate funds in order to aid financial management and to demonstrate legal compliance. The fund financial statements provide information about the District’s funds. The fund financial statements provide reports on the financial condition and results of operations for governmental funds. Major individual governmental funds are reported as separate columns in the fund financial statements. The District reports the following major governmental funds:
General Fund - The General Fund is the main operating fund of the District. All financial resources, except those required to be accounted for in another fund, are accounted for in the General Fund. All general tax rev-enues and other receipts that are not restricted by law or contractual agreement to some other fund are ac-counted for in this fund. General Fund expenditures are categorized by “Instruction” which is the direct teach-ing of students or the interaction between teacher and students. “Support Services” covers all the support ac-tivities for students, teachers, and facilities. Major activities in support services are transportation, mainte-nance of facilities (i.e. heating, phones, electricity, cleaning,) administration, counseling for students, and technology support.
IDEA Grant Fund – This fund includes all resources received from federal IDEA grants passed through the Oregon Department of Education. Title 1 Grant Fund – This fund includes all resources received from federal Title 1 grants passed through the Oregon Department of Education. PERS Bond Debt Service Fund - Revenues accounted for in the PERS Bond Fund are charges to other funds and interest earned on investments. Expenditures accounted for in the PERS Bond Fund are the principal and interest payments on the PERS Bond.
Debt Service Fund – Revenues accounted for in the Debt Service Fund are from local property taxes levied to make general obligation bond payments, which are also accounted for in this fund according to the bond re-payment schedule. Capital Improvement Fund – Revenues accounted for in the Capital Improvement Fund are from transfers in and loan proceeds to cover capital expenditures.
C. Measurement Focus/Basis of Accounting Measurement focus refers to what is being measured; basis of accounting refers to when transactions are recognized in the financial records and reported on the financial statements. Basis of accounting relates to the timing of the meas-urement made, regardless of the measurement focus applied.

AMITY SCHOOL DISTRICT NO. 4J NOTES TO THE BASIC FINANCIAL STATEMENTS
June 30, 2016
- 19 -
1. SUMMARY OF SIGNIFICANT ACCOUNTING POLICIES (CONT.): C. Measurement Focus/Basis of Accounting (Cont.) The government-wide statements are prepared using the economic resources measurement focus and the accrual basis of accounting. The economic resources measurement focus means all assets and liabilities (whether current or non-current) are included on the statement of net position and the operating statements present increases (revenues) and de-creases (expenses) in net total assets. Under the accrual basis of accounting, revenues are recognized when earned. Ex-penses are recognized when the liability is incurred. Governmental fund financial statements are reported using the current financial resources measurement focus and the modified accrual basis of accounting. Under this method, revenues are recognized when they become both measurable and available. "Measurable" means the amount of the transaction can be determined and "available" means collectible within the current period or within sixty days after year end. Expenditures are recorded when the related fund liability is incurred, except for principal and interest on long-term debt which are reported when due. General capital asset ac-quisitions are reported as expenditures in governmental funds. Proceeds of long-term debt and acquisitions under capi-tal leases are reported as other financing sources. The revenues susceptible to accrual are property taxes, charges for services, interest income and intergovernmental revenues. All other governmental fund revenues are recognized when received, as they are deemed immaterial. De-ferred revenues arise when potential revenue does not meet both the "measurable" and "available" criteria for recogni-tion in the current period. In subsequent periods, when the revenue recognition is met or when the District has a legal claim to the resources, the liability for deferred revenue is removed from the balance sheet and revenue is recognized. D. Budgeting The District budgets all funds as required by state law. The District budgets for all funds on a modified accrual basis. The resolution authorizing appropriations for each fund sets the level by which expenditures cannot legally exceed ap-propriations. Total expenditures are controlled by annual appropriations at the following organizational levels: instruc-tion, support services, community services, facilities acquisition and construction, and other expenditures. Appropria-tions lapse as of the fiscal year-end. A detailed budget document is required that contains more detailed information for the above-mentioned expenditure categories. Unexpected additional resources may be added to the budget through the use of a supplemental budget and appropria-tions resolution. A supplemental budget may require hearings before the public, publications in newspapers, and ap-proval by the District Board of Directors. Original and supplemental budgets may be modified by the use of appro-priations transfers between the levels of control. Such transfers require approval by the District Board of Directors.

AMITY SCHOOL DISTRICT NO. 4J NOTES TO THE BASIC FINANCIAL STATEMENTS
June 30, 2016
- 20 -
1. SUMMARY OF SIGNIFICANT ACCOUNTING POLICIES (CONT.): E. Cash and Investments Cash and cash equivalents include cash on hand, checking, savings and money market accounts and any short-term, highly liquid investments with initial maturity dates of three months or less. The District has adopted an investment policy requiring compliance with Oregon statutes, which authorizes the District to invest in obligations of the United States, the agencies and instrumentalities of the United States and the State of Or-egon, and numerous other investment instruments. The District’s investments may consist of time certificates of deposit, banker’s acceptances, commercial paper, U.S. Government Agency securities, and the State of Oregon Treasurer’s Local Government Investment Pool (LGIP). The District’s investments are reported at fair value at year-end. Changes in the fair value of investments are recorded as investment earnings. The LGIP is stated at cost, which approximates fair value. Fair value of the LGIP is the same as the District’s value in the pool shares. The Oregon State Treasury administers the LGIP. It is an open-ended, non-load diversified portfolio offered to any agency, political subdivision or public corporation of the State that by law is made the custodian of, or has control of, any fund. The LGIP is included in the Oregon Short Term Fund (OSTF) which was established by the State Treasurer. In seeking to best serve local governments of Oregon, the Oregon legislature established the Oregon Short-Term Fund Board. The purpose of the Board is to advise the Oregon State Treasury in the management and investment options of the LGIP. F. Receivables Amounts due from individuals, organizations or other governmental units are recorded as receivables at year-end. These amounts include charges for services rendered, or for goods and material provided by the District. All receiva-bles are expected to be collected. Accordingly, receivables are reported at the gross amount without an allowance for uncollectible accounts. Receivables are also recognized for property taxes and intergovernmental grants. Property taxes receivable consist of uncollected taxes levied and payable at the end of the fiscal year. All taxes are considered collectible. Consequently no allowance for uncollectible taxes has been established. In the governmental fund financial statements, property tax-es not collected within sixty days of the end of the fiscal year are reported as a deferred inflow or resources. (See note 1.K.) Intergovernmental grant reimbursement and entitlement amounts for which all eligibility requirements imposed by the provider have been met, but which were not received by the fiscal year end, are reported as due from other govern-ments. G. Prepaid Expenses The District has elected to report the amount paid to Oregon Public Employee Retirement System (PERS) to reduce the calculated unfunded pension liability obligation as a prepaid expense, as reported on the government-wide State-ment of Net Position. The prepaid asset is to be amortized in the amounts and over the estimated length of time the un-funded portion of the pension obligation is expected be paid out to its current and former employees.
AMITY SCHOOL DISTRICT NO. 4J NOTES TO THE BASIC FINANCIAL STATEMENTS
June 30, 2016
- 21 -
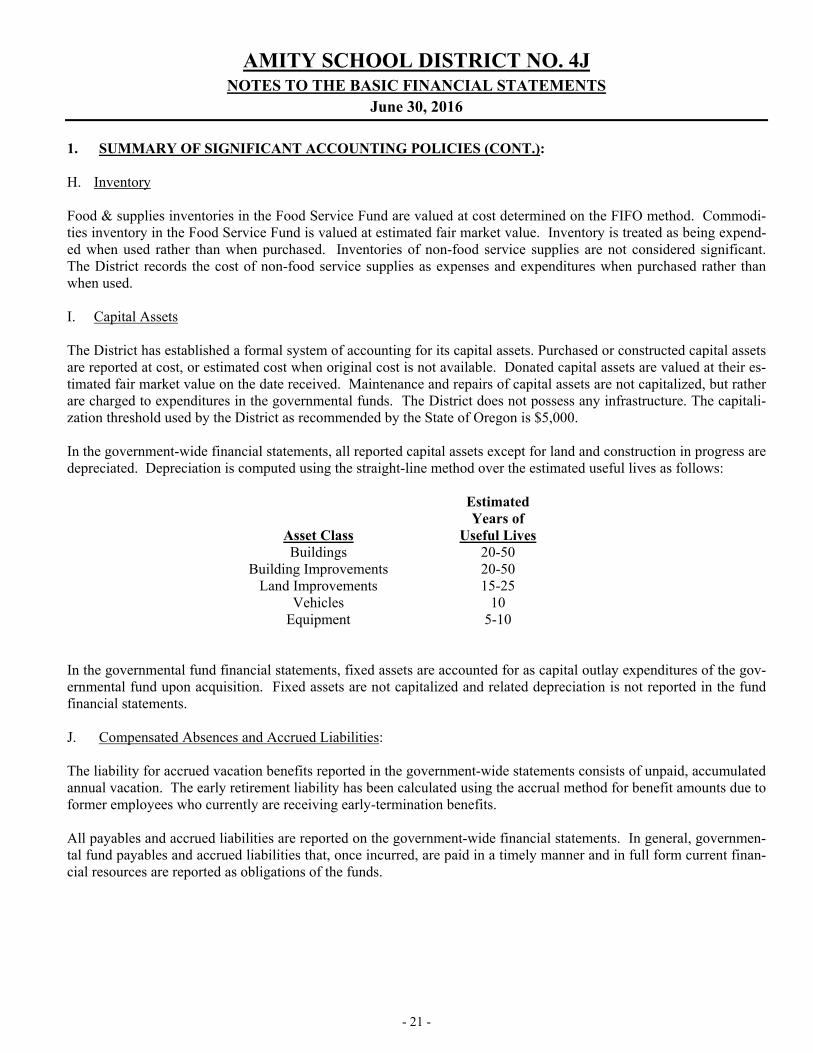
1. SUMMARY OF SIGNIFICANT ACCOUNTING POLICIES (CONT.): H. Inventory Food & supplies inventories in the Food Service Fund are valued at cost determined on the FIFO method. Commodi-ties inventory in the Food Service Fund is valued at estimated fair market value. Inventory is treated as being expend-ed when used rather than when purchased. Inventories of non-food service supplies are not considered significant. The District records the cost of non-food service supplies as expenses and expenditures when purchased rather than when used. I. Capital Assets The District has established a formal system of accounting for its capital assets. Purchased or constructed capital assets are reported at cost, or estimated cost when original cost is not available. Donated capital assets are valued at their es-timated fair market value on the date received. Maintenance and repairs of capital assets are not capitalized, but rather are charged to expenditures in the governmental funds. The District does not possess any infrastructure. The capitali-zation threshold used by the District as recommended by the State of Oregon is $5,000. In the government-wide financial statements, all reported capital assets except for land and construction in progress are depreciated. Depreciation is computed using the straight-line method over the estimated useful lives as follows: Estimated Years of Asset Class Useful Lives Buildings 20-50 Building Improvements 20-50 Land Improvements 15-25 Vehicles 10 Equipment 5-10 In the governmental fund financial statements, fixed assets are accounted for as capital outlay expenditures of the gov-ernmental fund upon acquisition. Fixed assets are not capitalized and related depreciation is not reported in the fund financial statements. J. Compensated Absences and Accrued Liabilities: The liability for accrued vacation benefits reported in the government-wide statements consists of unpaid, accumulated annual vacation. The early retirement liability has been calculated using the accrual method for benefit amounts due to former employees who currently are receiving early-termination benefits. All payables and accrued liabilities are reported on the government-wide financial statements. In general, governmen-tal fund payables and accrued liabilities that, once incurred, are paid in a timely manner and in full form current finan-cial resources are reported as obligations of the funds.

AMITY SCHOOL DISTRICT NO. 4J NOTES TO THE BASIC FINANCIAL STATEMENTS
June 30, 2016
- 22 -
1. SUMMARY OF SIGNIFICANT ACCOUNTING POLICIES (CONT.): K. Deferred Inflows/Outflows of Resources In addition to assets, the statement of financial position will sometimes report a separate section for deferred outflows of resources. This separate financial statement element, deferred outflows of resources, represents a consumption of net position that applies to a future period(s) and so will not be recognized as an outflow of resources (ex-pense/expenditure) until then. Currently, the District has only one item that qualifies for reporting in this category, de-ferred pension contributions. In addition to liabilities, the statement of financial position will sometimes report a separate section for deferred in-flows of resources. This separate financial statement element, deferred inflows of resources, represents an acquisition of net position that applies to a future period(s) and so will not be recognized as an inflow of resources (revenue) until that time. The District has only one type of item that qualifies for reporting in this category, deferred earnings on pen-sion assets. In the governmental funds balance sheet, a different category of deferred inflow of resources, delinquent property tax revenue not available, is reported. Property taxes levied and considered receivable at the end of the fiscal year, but not collected within sixty days of the end of the fiscal year are reported in this category. These amounts are recognized as an inflow of resources (revenue) in the period that the amounts become available. L. Long-Term Obligations All bonds payable, notes payable and capital leases payable are recognized in the government-wide financial state-ments as a liability of the District. Amounts of the long-term debt due within the following fiscal year are included in the current liabilities section of the Statement of Net Position. Bond premiums and discounts, as well as issuance costs, are deferred and amortized over the life of the bonds using the straight-line method, which approximates the ef-fective interest method. Bonds payable are reported net of the applicable bond premium or discount. In the governmental fund financial statements, proceeds of long-term debt and acquisitions under capital leases are re-ported as other financing sources. Principal and interest payments on bonded debt and capital lease payments are rec-orded as a debt service in the expenditure section of the statement and schedules.

AMITY SCHOOL DISTRICT NO. 4J NOTES TO THE BASIC FINANCIAL STATEMENTS
June 30, 2016
- 23 -
1. SUMMARY OF SIGNIFICANT ACCOUNTING POLICIES (CONT.): M. Equity Classifications: Government-wide Statements Equity is classified as net position, which represents the difference between assets, liabilities, and deferred accounts. Net position is displayed in three components:
a. Invested in capital assets, net of related debt - Consists of capital assets including restricted capital assets, net of accumulated depreciation and reduced by the outstanding balances of any bonds, mortgages, notes, or other borrowing that are attributable to the acquisition, construction, or improvement of those assets.
b. Restricted net position - Consists of net position with constraints placed on the use either by (1) external groups such as creditors, grantor, contributors, or laws or regulations of other governments; or (2) law through constitutional provisions or enabling legislation.
c. Unrestricted net position - All other net position that do not meet the definition of “restricted” or “invest-ed in capital assets, net of related debt.”
The District’s policy is to first apply restricted resources when an expense is incurred for purposes for which both re-stricted and unrestricted net position is available. Fund Financial Statements The governmental fund financial statements present fund balances based on classifications that comprise a hierarchy that is based primarily on the extent to which the District is bound to honor constraints on the specific purposes for which amounts in the respective governmental funds can be spent. The classifications used in the governmental fund financial statements are as follows:
Nonspendable: This classification includes amounts that cannot be spent either because it is not in spenda-ble form or because of legal or contractual constraints. Restricted: This classification includes fund balance amounts that are constrained for specific purposes which are externally imposed by creditors, grantors, contributors, or laws or regulations of other governments, or imposed by law through constitutional provisions or enabling legislation. Committed: This classification includes fund balance amounts that are constrained for specific purpose that are internally imposed by the government through resolution of the highest level of decision making authority, the Board of Directors, and does not lapse at year-end. Assigned: This classification includes fund balance amounts that are intended to be used for specific pur-poses that are neither restricted nor committed. This intent can be expressed by the Board of Directors or through the Board of Directors delegating this responsibility to selected staff members or through the budget-ary process. This classification also includes the remaining positive fund balance for all governmental funds except for the General Fund.
Unassigned: This classification includes positive fund balance within the General Fund which has not been classified within the above-mentioned categories, and negative fund balances of other governmental funds.
The District’s policy is to use restricted fund balances first, followed by committed resources, and then assigned re-sources, as appropriate opportunities arise, but reserves the right to selectively spend unassigned resources first to defer the use of the constrained fund balances.

AMITY SCHOOL DISTRICT NO. 4J NOTES TO THE BASIC FINANCIAL STATEMENTS
June 30, 2016
- 24 -
1. SUMMARY OF SIGNIFICANT ACCOUNTING POLICIES (CONT.): N. Property Taxes Real and personal property taxes attach as an enforceable lien on property as of January 1. All taxes are levied as of the lien date and are payable in three installments on November 15, February 15, and May 15. Taxes unpaid and out-standing on May 16 are considered delinquent.
Uncollected property taxes are recorded on the statement of net position. Uncollected taxes are deemed to be substan-tially collectible or recoverable through liens; therefore, no allowance for uncollectable taxes has been established. All property taxes receivable are due from property owners within the District. O. Inter-Fund Transactions
Quasi-external transactions are accounted for as revenues or expenditures, while reimbursements to a fund for expendi-tures initially made from it that are properly applicable to another fund, are recorded as expenditures in the reimburs-ing fund and as reductions of expenditures in the fund that is reimbursed. All other inter-fund transactions are reported as transfers. Nonrecurring or non-routine permanent transfers of equity are reported as residual equity transfers. All other inter-fund transfers are reported as operating transfers. P. Use of Estimates
The preparation of financial statements, in conformity with accounting principles generally accepted in the United States of America, requires management to make estimates and assumptions that affect the reported amount of assets and liabilities as well as disclosures of contingent assets and liabilities at the date of the financial statements and the reported amounts of revenues and expenditures during the reporting period. Actual results could differ from those es-timates. Q. Pensions
For purposes of measuring the net pension liability, deferred outflows of resources and deferred inflows of resources related to pensions, and pension expense, information about the fiduciary net position of the Oregon Public Employees Retirement Fund (OPERF) and the Oregon Public Service Retirement Plan (OPSRP) and additions to/deductions from OPERF’s and OPSRP’s fiduciary net position have been determined on the same basis as they are reported by PERS. For this purpose, benefit payments (including refunds of employee contributions) are recognized when due and paya-ble in accordance with the benefit terms. Investments are reported at fair value. 2. CASH AND INVESTMENTS: For discussion of deposit and investment policies and other related information, see Note 1.E. The District follows the practice of aggregating the cash assets of various funds to maximize cash management effi-ciency and returns. Various restrictions on deposits and investments are imposed by state statutes. These restrictions are summarized at Note 1.E. Investments, including amounts held in pool cash and investments are stated at fair value. In accordance with Gov-ernmental Accounting Standards Board (GASB) Statement No. 31, Accounting and Financial Reporting for Certain Investments and for External Investment Pools, investments with a remaining maturity of more than one year at the time of purchase are stated at fair value. Fair value is determined at the quoted market prices, if available; otherwise, the fair value is estimated based on the amount at which the investment could be exchanged in a current transaction be-tween willing parties, other than a forced liquidation sale. Investments in the State of Oregon Local Government In-vestment Pool (LGIP) are stated at fair value.

AMITY SCHOOL DISTRICT NO. 4J NOTES TO THE BASIC FINANCIAL STATEMENTS
June 30, 2016
- 25 -
2. CASH AND INVESTMENTS (CONT.): Deposits - All cash is deposited in compliance with Oregon statutes. The insurance and collateral requirements for de-posits are established by banking regulations and Oregon law. FDIC insurance of $250,000 applies to the deposits in each depository. Where balances continually exceed $250,000, ORS 295 requires the depositor to verify that deposit accounts are only maintained at financial institutions on the list of qualified depositories found on the state treasurer’s website. Qualifying depository banks must pledge securities with a particular value based on the bank’s level of capi-talization. The balances in excess of the FDIC insurance are considered exposed to custodial credit risk.
Custodial Credit Risk for Deposits - Custodial credit risk for deposits exists when, in the event of a depository failure, the District's deposits may not be returned to it. The District does not have a deposit policy for custodial credit risk.
As of June 30, 2016, the reported amounts of the District’s deposits were $819,041 and the bank balance was $1,311,221. Of the bank balance, the entire amount was covered by federal depository insurance or by pledged securi-ties with the qualifying depository banks. Investments - Oregon statutes authorize the District to invest in obligations of the U.S. Treasury and U.S. agencies, banker’s acceptances, repurchase agreements, commercial paper rated A-1 by Standard & Poor’s Corporation or P-1 by Moody’s Commercial Paper Record, and the Local Governmental Investment Pool. The District has no credit risk policy or investment policy that would further limit its investment choices
Credit Risk - Credit risk exists when there is a possibility the issuer or other counterparty to an investment may be unable to fulfill its obligations. As of June 30, 2016, the District’s investment in the Oregon State Treasurer’s Lo-cal Government Investment Pool (LGIP) was unrated.
At June 30, 2016, the District's investments in financial institutions are as follows:
Fair Value Credit Rating
Oregon State Treasurer's Local Government
Investment Pool (LGIP) 1,552,710$ N/A
Federal Agency Notes 64 N/A
Total Investments 1,552,773$
Type of Investment
Investments in the LGIP and federal agency notes do not require disclosure credit rating quality.
Concentration of Credit Risk - An increased risk of loss occurs as more investments are acquired from one issuer. This results in a concentration of credit risk. The District places no limit on the amount that may be invested in any one issuer. More than 5 percent of the District's investments are in the Oregon State Treasurer's Local Gov-ernment Investment Pool (LGIP). This investment is 100% of the District's total investments.
AMITY SCHOOL DISTRICT NO. 4J NOTES TO THE BASIC FINANCIAL STATEMENTS
June 30, 2016
- 26 -
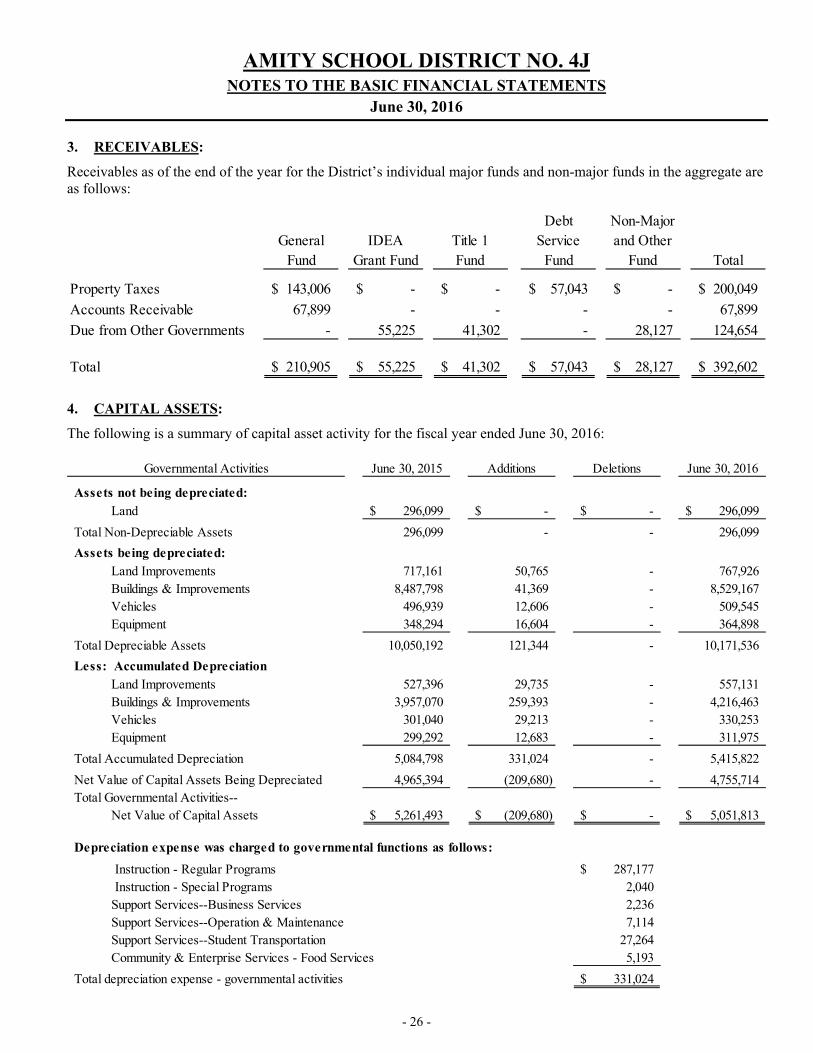
3. RECEIVABLES: Receivables as of the end of the year for the District’s individual major funds and non-major funds in the aggregate are as follows:
GeneralFund
IDEA Grant Fund
Title 1 Fund
Debt Service
Fund
Non-Major and Other
Fund Total
Property Taxes 143,006$ -$ -$ 57,043$ -$ 200,049$
Accounts Receivable 67,899 - - - - 67,899
Due from Other Governments - 55,225 41,302 - 28,127 124,654
Total 210,905$ 55,225$ 41,302$ 57,043$ 28,127$ 392,602$
4. CAPITAL ASSETS: The following is a summary of capital asset activity for the fiscal year ended June 30, 2016:
Governmental Activities June 30, 2015 Additions Deletions June 30, 2016
Assets not being depreciated:Land 296,099$ -$ -$ 296,099$
Total Non-Depreciable Assets 296,099 - - 296,099
Assets being depreciated:Land Improvements 717,161 50,765 - 767,926 Buildings & Improvements 8,487,798 41,369 - 8,529,167 Vehicles 496,939 12,606 - 509,545 Equipment 348,294 16,604 - 364,898
Total Depreciable Assets 10,050,192 121,344 - 10,171,536
Less: Accumulated DepreciationLand Improvements 527,396 29,735 - 557,131 Buildings & Improvements 3,957,070 259,393 - 4,216,463 Vehicles 301,040 29,213 - 330,253 Equipment 299,292 12,683 - 311,975
Total Accumulated Depreciation 5,084,798 331,024 - 5,415,822
Net Value of Capital Assets Being Depreciated 4,965,394 (209,680) - 4,755,714 Total Governmental Activities--
Net Value of Capital Assets 5,261,493$ (209,680)$ -$ 5,051,813$
Depreciation expense was charged to governmental functions as follows:
Instruction - Regular Programs 287,177$ Instruction - Special Programs 2,040 Support Services--Business Services 2,236 Support Services--Operation & Maintenance 7,114 Support Services--Student Transportation 27,264 Community & Enterprise Services - Food Services 5,193
Total depreciation expense - governmental activities 331,024$

AMITY SCHOOL DISTRICT NO. 4J NOTES TO THE BASIC FINANCIAL STATEMENTS
June 30, 2016
- 27 -
5. LONG-TERM DEBT: A summary of debt transactions for the year ended June 30, 2016 is as follows:
OutstandingBalance
June 1, 2015
New Issuesand Interest
Matured
Principaland Interest
Retired
OutstandingBalance
June 30, 2016
Amounts Due Within One Year
Principal 4,020,000$ -$ 490,000$ 3,530,000$ 520,000$
Interest - 71,556 71,556 - 62,834
Totals 4,020,000$ 71,556$ 561,556$ 3,530,000$ 582,834$
Principal 4,889,856$ -$ 178,436$ 4,711,420$ 179,167$ Interest - 393,779 393,779 - 423,048
Totals 4,889,856$ 393,779$ 572,215$ 4,711,420$ 602,215$
Capitalized Lease:
Bus Leases with Sovereign Bank. Total Lease $237,820 for 3 busses purchased on October 15, 2013 with an interest rate of 2.30%.
Principal 170,112$ -$ 32,496$ 137,616$ 33,243$ Interest - 3,912 3,912 - 3,165
Totals 170,112$ 3,912$ 36,408$ 137,616$ 36,408$
Qualified Zone Academy Bond:
Principal 528,126$ -$ 69,261$ 458,865$ 69,261$ Interest - - - - -
Totals 528,126$ -$ 69,261$ 458,865$ 69,261$
Principal -$ 650,000$ -$ 650,000$ 43,334$ Interest - - - - -
Totals -$ 650,000$ -$ 650,000$ 43,334$
TOTAL DEBT AGREEMENTS: Principal 9,608,094$ 650,000$ 770,193$ 9,487,901$ 845,005$ Interest - 469,247 469,247 - 489,047
Totals 9,608,094$ 1,119,247$ 1,239,440$ 9,487,901$ 1,334,052$
Qualified Zone Academy Bond (QZAB), original balance of $650,000, dated April 6, 2016, for the purchase of equipment and improvments to real property. Held by Pacific Continental Bank. Deposit amounts of $43,334.00 per year required, with the first deposit being due April 6, 2017. Bond interest is computed at 0.00%.
General Obligation and Limited Tax Bonded Debt:
Qualified Zone Academy Bond (QZAB), original balance of $1,290,000, dated February 1, 2004, for funding qualified buildingimprovements and equipment purchases. Interest costs are subsidized by the federal government. Annual payments of $69,261 are placed into a sinking fund maintained by a paying agent. Earnings of the sinking fund reduce total payments made to retire bonds. The debt willbe paid to bondholders at maturity in 2019 from the sinking fund. Reported outstanding balance at fiscal year end reflects total of originalbond payable amount net of depostis made to date into sinking fund.
Oregon School Boards Association Limited Tax Pension Obligation Bonds Series 2004, held by Wells Fargo Bank Northwest, NA trustee.The original balance was $6,618,714 issued April 21, 2004. Fixed interest rates on the bonds vary from 1.5% to 6.27%.
General Obligation Refunding Bond, Series 2015 for refunding of GO Refunding Bonds, Series 2005, dated March 19, 2015. The original balance of the 2015 refunding bonds was $4,076,000. Interest rate on the refunding bonds is fixed at 1.78%

AMITY SCHOOL DISTRICT NO. 4J NOTES TO THE BASIC FINANCIAL STATEMENTS
June 30, 2016
- 28 -
5. LONG-TERM DEBT (Cont.): The debt service requirements on the above debt are as follows:
Due Fiscal YearEnding June 30, Principal Interest Total
General Obligation and Limited Tax Bonds:2017 699,167 485,882 1,185,049 2018 723,241 507,552 1,230,793 2019 751,588 529,504 1,281,092 2020 776,485 554,373 1,330,858 2021 803,920 576,258 1,380,178
2022-2026 3,172,019 1,707,536 4,879,555 2027-2028 1,315,000 98,832 1,413,832
Totals 8,241,420$ 4,459,937$ 12,701,357$
Qualified Zone Academy Bond:2019 1,012,953$ -$ 1,012,953$ 2031 650,000 - 650,000
Totals 1,662,953 - 1,662,953 Capital Leases:
2017 33,243 3,165 36,408 2018 34,007 2,401 36,408 2019 34,790 1,618 36,408 2020 35,576 832 36,408
Totals 137,616$ 8,016$ 145,632$ For further detail on debt service, see the ‘Schedule of Long Term Debt Transactions’ and ‘Schedule of Future Re-quirements for Retirement of Long Term’ in the Supplemental Data section of this report.

AMITY SCHOOL DISTRICT NO. 4J NOTES TO THE BASIC FINANCIAL STATEMENTS
June 30, 2016
- 29 -
6. PENSION PLAN:
A. Name of Pension Plan The Oregon Public Employees Retirement System (PERS) consists of a cost-sharing multiple-employer defined bene-fit pension plan. B. Description of Benefit Terms Plan Benefits
All benefits of the System are established by the legislature pursuant to ORS Chapters 238 and 238A.
1. Tier One/Tier Two Retirement Benefit (Chapter 238). Tier One/Tier Two Retirement Benefit plan is closed to new members hired on or after August 29, 2003.
Pension Benefits
The PERS retirement allowance is payable monthly for life. It may be selected from 13 retirement benefit options. These options include survivorship benefits and lump-sum refunds. The basic benefit is based on years of service and final average salary. A percentage (2.0 percent for police and fire employees, 1.67 percent for general service employ-ees) is multiplied by the number of years of service and the final average salary. Benefits may also be calculated under either a formula plus annuity (for members who were contributing before August 21, 1981) or a money match compu-tation if a greater benefit results.
A member is considered vested and will be eligible at minimum retirement age for a service retirement allowance if he or she has had a contribution in each of five calendar years or has reached at least 50 years of age before ceasing em-ployment with a participating employer (age 45 for police and fire members). General service employees may retire af-ter reaching age 55. Police and fire members are eligible after reaching age 50. Tier One general service employee benefits are reduced if retirement occurs prior to age 58 with fewer than 30 years of service. Police and fire member benefits are reduced if retirement occurs prior to age 55 with fewer than 25 years of service. Tier Two members are el-igible for full benefits at age 60. The ORS Chapter 238 Defined Benefit Pension Plan is closed to new members hired on or after August 29, 2003.
Death Benefits
Upon the death of a non-retired member, the beneficiary receives a lump-sum refund of the member’s account balance (accumulated contributions and interest). In addition, the beneficiary will receive a lump-sum payment from employer funds equal to the account balance, provided one or more of the following conditions are met:
• the member was employed by a PERS employer at the time of death, • the member died within 120 days after termination of PERS-covered employment, • the member died as a result of injury sustained while employed in a PERS-covered job, or • the member was on an official leave of absence from a PERS-covered job at the time of death.
Disability Benefits
A member with 10 or more years of creditable service who becomes disabled from other than duty-connected causes may receive a non-duty disability benefit. A disability resulting from a job-incurred injury or illness qualifies a mem-ber (including PERS judge members) for disability benefits regardless of the length of PERS-covered service. Upon qualifying for either a non-duty or duty disability, service time is computed to age 58 (55 for police and fire members) when determining the monthly benefit.

AMITY SCHOOL DISTRICT NO. 4J NOTES TO THE BASIC FINANCIAL STATEMENTS
June 30, 2016
- 30 -
6. PENSION PLAN (Cont.):
Benefit Changes After Retirement
Members may choose to continue participation in a variable equities investment account after retiring and may experi-ence annual benefit fluctuations due to changes in the market value of equity investments.
Under ORS 238.360 monthly benefits are adjusted annually through cost-of-living changes. Under current law, the cap on the COLA in fiscal year 2016 and beyond will vary based on 1.25 percent on the first $60,000 of annual benefit and 0.15 percent on annual benefits above $60,000. 2. OPSRP Defined Benefit Pension Program (OPSRP DB). The Pension Program (ORS Chapter 238A) provides benefits to members hired on or after August 29, 2003.
Pension Benefits
This portion of OPSRP provides a life pension funded by employer contributions. Benefits are calculated with the fol-lowing formula for members who attain normal retirement age:
Police and fire: 1.8 percent is multiplied by the number of years of service and the final average salary. Normal retire-ment age for police and fire members is age 60 or age 53 with 25 years of retirement credit. To be classified as a police and fire member, the individual must have been employed continuously as a police and fire member for at least five years immediately preceding retirement.
General service: 1.5 percent is multiplied by the number of years of service and the final average salary. Normal re-tirement age for general service members is age 65, or age 58 with 30 years of retirement credit.
A member of the OPSRP Pension Program becomes vested on the earliest of the following dates: the date the member completes 600 hours of service in each of five calendar years, the date the member reaches normal retirement age, and, if the pension program is terminated, the date on which termination becomes effective.
Death Benefits
Upon the death of a non-retired member, the spouse or other person who is constitutionally required to be treated in the same manner as the spouse, receives for life 50 percent of the pension that would otherwise have been paid to the de-ceased member.
Disability Benefits
A member who has accrued 10 or more years of retirement credits before the member becomes disabled or a member who becomes disabled due to job-related injury shall receive a disability benefit of 45 percent of the member’s salary determined as of the last full month of employment before the disability occurred.
Benefit Changes After Retirement
Under ORS 238A.210 monthly benefits are adjusted annually through cost-of-living changes. Under current law, the cap on the COLA in fiscal year 2016 and beyond will vary based on 1.25 percent on the first $60,000 of annual benefit and 0.15 percent on annual benefits above $60,000. 3. IAP Plan Description: OPSRP Individual Account Program (OPSRP IAP)
Pension Benefits
An IAP member becomes vested on the date the employee account is established or on the date the rollover account was established. If the employer makes optional employer contributions for a member, the member becomes vested on the earliest of the following dates: the date the member completes 600 hours of service in each of five calendar years, the date the member reaches normal retirement age, the date the IAP is terminated, the date the active member be-comes disabled, or the date the active member dies. Upon retirement, a member of the OPSRP Individual Account Program (IAP)
AMITY SCHOOL DISTRICT NO. 4J NOTES TO THE BASIC FINANCIAL STATEMENTS
June 30, 2016
- 31 -
6. PENSION PLAN (Cont.): may receive the amounts in his or her employee account, rollover account, and vested employer account as a lump-sum payment or in equal installments over a 5-, 10-, 15-, 20-year period or an anticipated life span option. Each distribution option has a $200 minimum distribution limit.
Death Benefits
Upon the death of a non-retired member, the beneficiary receives in a lump sum the member’s account balance, rollo-ver account balance, and vested employer optional contribution account balance. If a retired member dies before the installment payments are completed, the beneficiary may receive the remaining installment payments or choose a lump-sum payment.
Recordkeeping
PERS contracts with VOYA Financial to maintain IAP participant records. C. Contributions PERS funding policy provides for monthly employer contributions at actuarially determined rates. These contributions, expressed as a percentage of covered payroll, are intended to accumulate sufficient assets to pay benefits when due. This funding policy applies to the PERS Defined Benefit Plan and the Other Postemployment Benefit Plans.
Employer contribution rates during the period were based on the December 31, 2013 actuarial valuation. The rates based on a percentage of payroll, first became effective July 1, 2015. The state of Oregon and certain schools, commu-nity colleges, and political subdivisions have made lump sum payments to establish side accounts, and their rates have been reduced.
Employer contributions for the year ended June 30, 2016 were $344,286, excluding amounts to fund employer specific liabilities.
D. Pension Plan CAFR Oregon PERS produces an independently audited CAFR which can be found at: http://www.oregon.gov/pers/Pages/section/financial_reports/financials.aspx E. Actuarial Valuations The employer contribution rates effective July 1, 2015, through June 30, 2017, were set using the projected unit credit actuarial cost method. For the Tier One/Tier Two component of the PERS Defined Benefit Plan, this method produced an employer contribution rate consisting of (1) an amount for normal cost (the estimated amount necessary to finance benefits earned by the employees during the current service year), (2) an amount for the amortization of unfunded ac-tuarial accrued liabilities, which are being amortized over a fixed period with new unfunded actuarial accrued liabili-ties being amortized over 20 years. For the OPSRP Pension Program component of the PERS Defined Benefit Plan, this method produced an employer contribution rate consisting of (a) an amount for normal cost (the estimated amount necessary to finance benefits earned by the employees during the current service year), (b) an amount for the amortiza-tion of unfunded actuarial accrued liabilities, which are being amortized over a fixed period with new unfunded actuar-ial accrued liabilities being amortized over 16 years.

AMITY SCHOOL DISTRICT NO. 4J NOTES TO THE BASIC FINANCIAL STATEMENTS
June 30, 2016
- 32 -
6. PENSION PLAN (Cont.): F. Actuarial Methods and Assumptions Used in Developing Total Pension Liability Valuation Date December 31, 2013
Measurement Date June 30, 2015
Experience Study 2014, published September 2015
Actuarial cost method Entry Age Normal Actuarial assumptions:
Inflation rate 2.75 percent
Long-term expected rate of return 7.75 percent
Discount rate 7.75 percent
Projected salary increases 3.75 percent Cost of living adjustments (COLA)
Blend of 2.00% COLA and graded COLA (1.25%/0.15%) in accordance with Moro decision; blend based on service.
Mortality Healthy retirees and beneficiaries: RP-2000 Sex-distinct, generational per Scale AA, with collar adjustments and set-backs as described in the valuation. Active members: Mortality rates are a percentage of healthy retiree rates that vary by group, as described in the valuation. Disabled retirees: Mortality rates are a percentage (65% for males, 90% for females) of the RP-2000 static combined disabled mortality sex-distinct table.
Actuarial valuations of an ongoing plan involve estimates of the value of projected benefits and assumptions about the probability of events far into the future. Actuarially determined amounts are subject to continual revision as actual re-sults are compared to past expectations and new estimates are made about the future. Experience studies are performed as of December 31 of even numbered years. The methods and assumptions shown above are based on the 2014 Expe-rience Study which reviewed experience for the four-year period ending on December 31, 2014.
Discount Rate
The discount rate used to measure the total pension liability was 7.75 percent for the Defined Benefit Pension Plan. The projection of cash flows used to determine the discount rate assumed that contributions from plan members and those of the contributing employers are made at the contractually required rates, as actuarially determined. Based on those assumptions, the pension plan’s fiduciary net position was projected to be available to make all projected future benefit payments of current plan members. Therefore, the long-term expected rate of return on pension plan invest-ments for the Defined Benefit Pension Plan was applied to all periods of projected benefit payments to determine the total pension liability.

AMITY SCHOOL DISTRICT NO. 4J NOTES TO THE BASIC FINANCIAL STATEMENTS
June 30, 2016
- 33 -
6. PENSION PLAN (Cont.): Depletion Date Projection GASB 68 generally requires that a blended discount rate be used to measure the Total Pension Liability (the Actuarial Accrued Liability calculated using the Individual Entry Age Normal Cost Method). The long-term expected return on plan investments may be used to discount liabilities to the extent that the plan’s Fiduciary Net Position is projected to cover benefit payments and administrative expenses. A 20-year high quality (AA/Aa or higher) municipal bond rate must be used for periods where the Fiduciary Net Position is not projected to cover benefit payments and administra-tive expenses. Determining the discount rate under GASB 68 will often require that the actuary perform complex pro-jections of future benefit payments and pension plan investments. GASB 68 (paragraph 67) does allow for alternative evaluations of projected solvency, if such evaluation can reliably be made. GASB does not contemplate a specific method for making an alternative evaluation of sufficiency; it is left to professional judgment. The following circumstances justify an alternative evaluation of sufficiency for PERS: - PERS has a formal written policy to calculate an Actuarially Determined Contribution (ADC), which is articulated in the actuarial valuation report. - The ADC is based on a closed, layered amortization period, which means that payment of the full ADC each year will bring the plan to a 100% funded position by the end of the amortization period if future experience follows as-sumption. - GASB 68 specifies that the projections regarding future solvency assume that plan assets earn the assumed rate of re-turn and there are no future changes in the plan provisions or actuarial methods and assumptions, which means that the projections would not reflect any adverse future experience which might impact the plan’s funded position. Based on these circumstances, it is our independent actuary’s opinion that the detailed depletion date projections out-lined in GASB 68 would clearly indicate that the Fiduciary Net Position is always projected to be sufficient to cover benefit payments and administrative expenses. Assumed Asset Allocation
Low Range High Range OIC Target
Cash 0.0% 3.0% 0.0%
Debt Securities 15.0% 25.0% 20.0%
Public Equity 32.5% 42.5% 37.5%
Private Equity 16.0% 24.0% 20.0%
Real estate 9.4% 15.5% 12.5%
Alternative Equity 0.0% 10.0% 10.0%
Opportunity Portfolio 0.0% 3.0% 0.0%
Total 100%
Asset Class/Strategy

AMITY SCHOOL DISTRICT NO. 4J NOTES TO THE BASIC FINANCIAL STATEMENTS
June 30, 2016
- 34 -
6. PENSION PLAN (Cont.): Long-Term Expected Rate of Return To develop an analytical basis for the selection of the long-term expected rate of return assumption, in July 2013 the PERS Board reviewed long-term assumptions developed by both Milliman’s capital market assumptions team and the Oregon Investment Council’s (OIC) investment advisors. Each asset class assumption is based on a consistent set of underlying assumptions, and includes adjustment for the inflation assumption. These assumptions are not based on his-torical returns, but instead are based on a forward-looking capital market economic model. The table below shows Mil-liman’s assumptions for each of the asset classes in which the plan was invested at that time based on the OIC long-term target asset allocation. The OIC’s description of each asset class was used to map the target allocation to the asset classes shown below.
Target
Annual Arithmetic
Mean
20-Year Annualized
Geometric Mean
Annual Standard Deviation
Core Fixed Income 8.00% 4.10% 4.00% 4.68%
Short-Term Bonds 8.00% 3.65% 3.61% 2.74%
Bank/Leveraged Loans 3.00% 5.69% 5.42% 7.82%
High Yield Bonds 1.00% 6.67% 6.20% 10.28%
Large/Mid Cap US Equities 15.75% 7.96% 6.70% 17.07%
Small Cap US Equities 1.31% 8.93% 6.99% 21.35%
Micro Cap US Equities 1.31% 9.37% 7.01% 23.72%
Developed Foreign Equities 13.13% 8.34% 6.73% 19.40%
Emerging Foreign Equities 4.13% 10.56% 7.25% 28.45%
Non-US Small Cap Equities 1.88% 9.01% 7.22% 20.55%
Private Equity 17.50% 11.60% 7.97% 30.00%
Real Estate (Property) 10.00% 6.48% 5.84% 12.00%
Real Estate (REITS) 2.50% 8.74% 6.69% 22.02%
Hedge Fund of Funds - Diversified 2.50% 4.94% 4.64% 8.09%
Hedge Fund - Event-driven 0.63% 7.07% 6.72% 8.90%
Timber 1.88% 6.60% 5.85% 13.00%
Farmland 1.88% 7.11% 6.37% 13.00%
Infrastructure 3.75% 8.31% 7.13% 16.50%
Commodities 1.88% 6.07% 4.58% 18.40%
Portfolio - Net of Investment Expenses 100% 7.80% 7.03% 13.27%
Asset Class
AMITY SCHOOL DISTRICT NO. 4J NOTES TO THE BASIC FINANCIAL STATEMENTS
June 30, 2016
- 35 -
6. PENSION PLAN (Cont.): G. Sensitivity Analysis The following presents the employer’s proportionate share of the net pension liability calculated using the discount rate of 7.75 percent, as well as what the employer’s proportionate share of the net pension liability would be if it were calculated using a discount rate that is 1-percentage-point lower (6.75 percent) or 1-percentage-point higher (8.75 per-cent) than the current rate:
1% Decrease Discount Rate 1% Increase
6.75% 7.75% 8.75%
Employer's proportionate share of the net pension liability 1,264,052$ 523,750$ (100,129)$
H. Summary of Significant Accounting Policies Reporting Entity PERS’ financial statements are prepared on the basis of a fiscal year ended June 30. The Oregon State Treasurer has statutory responsibility for custody and investment of PERS assets. As a result of this fiduciary responsibility, PERS is included as part of the primary government in the State of Oregon Comprehensive Annual Financial Report. Basis of Presentation The accompanying financial statements are prepared in accordance with Governmental Accounting Standards Board Statements and generally accepted accounting principles that apply to governmental accounting for fiduciary funds. Basis of Accounting The accrual basis of accounting is used. Revenues are recognized when earned. Contributions are recognized when due, pursuant to formal commitments, as well as statutory and Board requirements. Expenses are recognized when in-curred. Benefits are recognized when currently due and payable. Withdrawals are recognized in the month they are due and payable. Investments Oregon Revised Statute (ORS) 293.706 established the Oregon Investment Council (OIC), which consists of five vot-ing members. Four members of the council, who are qualified by training and experience in the field of investment or finance, are appointed by the governor subject to state Senate confirmation. The state treasurer serves as the council’s remaining voting member. In addition, the director of the Public Employees Retirement System serves as a non-voting OIC member. OIC ensures moneys in the investment funds are invested and reinvested to achieve the investment objective of making the moneys as productive as possible. Furthermore, the investments of those funds are managed as a prudent investor would do under the prevailing circumstances and in light of the purposes, terms, distribution requirements, and laws governing each investment fund. This standard requires the exercise of reasonable care, skill, and caution and is ap-plied to investments not in isolation, but in the context of each fund’s portfolio as part of an overall investment strate-gy. The strategy should incorporate risk and return objectives reasonably suitable to the particular investment fund.

AMITY SCHOOL DISTRICT NO. 4J NOTES TO THE BASIC FINANCIAL STATEMENTS
June 30, 2016
- 36 -
6. PENSION PLAN (Cont.): When implementing investment decisions, OIC has a duty to diversify the investments of the investment funds unless, under the circumstances, it is not prudent to do so. In addition, OIC must act with prudence when selecting agents and delegating authority.
Investments are recognized at fair value, the amount at which financial instruments could be exchanged in a current transaction between willing parties other than in a forced or liquidation sale.
The fair value of publicly traded debt and equity securities in active markets is determined by the custodian’s pricing agent using nationally recognized pricing services. The custodian’s pricing agent values equity securities traded on a national or international exchange at the last reported sales price, and generally values debt securities by using evaluat-ed bid prices. For securities that do not have an active market, such as private placements or commingled investment vehicles, a market price is calculated by either the custodian's pricing agent or the investment manager. For example, a similar benchmark security may be used to derive the fair value. The benchmark will typically have a coupon rate and maturity date comparable to the debt security being valued, and its market risk will be similar, considering current market conditions. The fair value of real estate investment trust (REIT) securities is determined by the custodian's pric-ing agent using recognized pricing services.
Investments in private equities are recorded at fair value, as of June 30, 2015, as determined by management based on valuation information provided by the general partner. Investments in private equities representing publicly traded se-curities are stated at quoted market price. Where observable market inputs are not available, valuation models are ap-plied. The general partner determines fair value based on the best information available and by reference to infor-mation including, but not limited to, the following: projected sales, net earnings, earnings before interest, taxes, depre-ciation and amortization, balance sheets, public and private transactions, valuations for publicly traded comparable companies, and/or other measures, and consideration of any other pertinent information including the types of securi-ties held and the general partner’s own assumptions regarding the investment. The methods used to determine the fair value of these investments typically include: (1) the market approach (whereby fair value is derived by reference to ob-servable valuation measures for comparable companies or assets) and (2) the income approach (e.g., the discounted cash flow method).
Investments in real estate, with the exception of publicly traded REITS, for which observable market prices in active markets do not exist, are reported at fair value as of June 30, 2014, as determined by management based on valuation information provided in good faith by the general partner. Direct investments in real estate are appraised every two to three years, and between appraisals, investment managers adjust values to reflect current and projected operating per-formance and financial transactions. In the absence of observable market prices, general partners determine the fair value of real estate partnerships using valuation methods considered most appropriate. A variety of factors are consid-ered, including the nature of the investment, local market conditions, trading values on public exchanges for compara-ble investments, current and projected operating performance, and financing transactions subsequent to the acquisition of the investment. Investments in the opportunity and alternatives portfolios are recorded at fair value as of June 30, 2015 by the respec-tive general partner or account manager. Investments in the opportunity and alternatives portfolios representing public-ly traded securities are stated at quoted market price. Where observable market inputs are not available, valuation models are applied. The general partner or account manager determines fair value based on the best information avail-able and by reference to information including, but not limited to, the following: projected sales, net earnings, earnings before interest, taxes, depreciation, and amortization, balance sheets, public and private transactions, valuations for publicly traded comparable companies, and/or other measures, and consideration of any other pertinent information in-cluding the types of securities held and the general partner’s own assumptions regarding the investment. The methods used to determine the fair value of these investments typically include: (1) the market approach (whereby fair value is derived by reference to observable valuation measures for comparable companies or assets); (2) the income approach (e.g. the discounted cash flow method).
AMITY SCHOOL DISTRICT NO. 4J NOTES TO THE BASIC FINANCIAL STATEMENTS
June 30, 2016
- 37 -
6. PENSION PLAN (Cont.): Due to the inherent uncertainty and the degree of judgment involved in determining private equity, opportunity, alter-natives, and real estate portfolio investment valuations, the fair values reflected in the accompanying financial state-ments may differ significantly from values that would have been used had a readily determinable market value for the investments existed and the difference could be material. In addition, these investments are generally considered to be illiquid long-term investments, and the recorded fair values may materially differ from the amounts that eventually may be realized from the sale or other disposition of these investments. OIC has approved the following asset classes for the PERF: Short-Term Investing, Fixed Income, Real Estate, Public and Private Equities, and Alternative Investments. In addition, PERF invests in the Opportunity Portfolio which may be populated with investment approaches across a wide range of investment opportunities with no limitation as to asset classes or strategies. OIC must approve, in advance, the purchase of investments in a new asset class not described above. As of June 30, 2015, PERS did not hold investments in any one organization that represent 5 percent of more of PERS’ fiduciary net position. I. Changes in Assumptions A summary of key changes implemented since the December 31, 2013 valuation are described briefly below. Addi-tional detail and a comprehensive list of changes in methods and assumptions can be found in the 2014 Experience Study for the System, which was published on September 23, 2015, and can be found at: https://www.oregon.gov/pers/docs/2014_experience_study_9-23-15.pdf Changes in Actuarial Methods and Allocation Procedures Allocation of Liability for Service Segments For purposes of allocating Tier 1/Tier 2 member’s actuarial accrued liability among multiple employers, the valuation uses a weighted average of the Money Match methodology and the Full Formula methodology used by PERS when the member retires. The weights are determined based on the prevalence of each formula among the current Tier 1/Tier 2 population. For the December 31, 2012 and December 31, 2013 valuations, the Money Match was weighted 70 percent for General Service members and 5 percent for Police & Fire members. For the December 31, 2014 and December 31, 2015 valuations, this weighting has been adjusted to 25 percent for General Service members and 0 percent for Police & Fire members, based on a projection of the proportion of liability attributable to Money Match benefits at those val-uation dates. Changes in Economic Assumptions Inflation - The inflation assumption was lowered from 2.75% to 2.50%. Payroll Growth – Due to the lowered inflation assumption, the payroll growth assumption will be reduced from 3.75% to 3.50%. Regular Investment Return - The assumed investment return was reduced to 7.50% from 7.75%. Tier 1/Tier 2 Administrative Expenses - Assumed administrative expenses for tier 1/tier 2 were valued at $33 million per year. Healthcare Cost Inflation - The healthcare cost inflation for the maximum RHIPA subsidy was updated based on anal-ysis performed by Milliman’s healthcare actuaries. This analysis includes the consideration of the excise tax that will be introduced in 2018 by the Patient Protection and Affordable Care Act

AMITY SCHOOL DISTRICT NO. 4J NOTES TO THE BASIC FINANCIAL STATEMENTS
June 30, 2016
- 38 -
6. PENSION PLAN (Cont.): Changes in Demographic Assumptions
A summary of the changes recommended to the Board are as follows: Adjust the healthy mortality assumption to reflect an updated mortality improvement scale for all groups. Adjust retirement rates for most groups modestly to more closely align with recent and expected future experi-
ence. Increase the merit component of the salary increase assumption for all members based on observations of the
last eight years of experience. Update pre-retirement termination of employment assumptions for two member categories. Slightly lower assumed rates of duty disability for general service members. Update the Tier 1 unused vacation cash out assumption for most categories. The recommendations increase the
Tier 1 unused vacation cash out assumption based on recent experience. Adjust the Tier 1/Tier 2 unused sick leave assumption for three groups to more closely reflect recently ob-
served experience. Decrease the healthy participation assumption for the RHIA retiree healthcare programs from 45% to 38%. Increase the participation assumption for the RHIPA retiree healthcare program for longer-service members.
Mortality Rates A summary of the current assumed mortality rates and recommended changes is shown below:
December 31, 2013 ValuationRecommended December 31, 2014 and
2015 Valuations
Healthy Annuitant Mortality RP2000 Generational with Scale AA, Combined Active/Healthy Annuitant, Sex Distinct
RP2000 Generational with Scale BB, Combined Active/Healthy Annuitant, Sex Distinct
School District male No collar, set back 24 months No change to collar adjustment or set back
Blended 25% blue collar/75% white collar, set back 12 months
No change to collar adjustment or set back
Blended 25% blue collar/75% white collar, set back 12 months
No change to collar adjustment or set back
School District female White collar, set back 24 months No collar, set back 24 months
Other female (and female beneficiary) White collar, no setback Blended 25% blue collar/75% white collar, no setback
Disabled Retiree Mortality RP 2000 Static, Disabled, No Collar, Sex distinct
RP 2000 Generational with Scale BB, Disabled, No Collar, Sex distinct
65% of Disabled table, but not less than corresponding healthy annuitant rates
70% of Disabled table, but not less than corresponding healthy annuitant rates
90% of Disabled table, but not less than corresponding healthy annuitant rates
95% of Disabled table, but not less than corresponding healthy annuitant rates
Non-Annuitant Mortality Fixed Percentage of Healthy Annuitant Mortality
No change
School District male 70% 60%
Other General Service male 85% 75%
95% 75%
School District female 60% 55%
Other female 55% 60%
Assumption
Other General Service male (and male beneficiary)
Police & Fire male
Police & Fire male
Male
Female

AMITY SCHOOL DISTRICT NO. 4J NOTES TO THE BASIC FINANCIAL STATEMENTS
June 30, 2016
- 39 -
6. PENSION PLAN (Cont.): Change in Proportionate Share
Since the December 31, 2013 actuarial valuation, the system-wide actuarial accrued liability has increased primarily due to the Moro decision and assumption changes, along with interest on the liability as current active members get closer to retirement. The Oregon Supreme Court decision in Moro v. State of Oregon, issued on April 30, 2015, re-versed a significant portion of the reductions the 2013 Oregon Legislature made to future system Cost of Living Ad-justments (COLA) through Senate Bills 822 and 861. This reversal increased the benefits projected to be paid by Em-ployers compared to those developed in the prior actuarial valuation, and consequently increased plan liabilities. The employers’ projected long-term contribution effort has been adjusted for the estimated impact of the Moro Decision. In accordance with stature, a biennial review of actuarial methods and assumptions was completed in 2105 to be used for the December 31, 2014 actuarial valuation. After completion of this review and subsequent to the measurement date, the PERS Board adopted several assumption chances, including lowering the investment return assumption to 7.50%, which will be effective January 1, 2016.
Deferred Items
Deferred items are calculated at the system-wide level and are allocated to employers based on their proportionate share. For the measurement period ending June 30, 2015, employers will report the following deferred items:
A difference between expected and actual experience, which is being amortized over 5.4 years, the remaining service lives of all plan participants, including retirees. One year of this amortization is included in the em-ployer’s total pension expense for the measurement period.
Changes is employer proportion since the prior measurement date, which is being amortized over 5.4 years, the remaining service lives of all plan participants, including retirees. One year of this amortization is includ-ed in the employer’s total pension expense for the measurement period.
A Net difference between projected and actual earnings which is being amortized over a closed five year peri-od. One year’s amortization is being recognized in the employer’s total pension expense for the measurement period.
I. Employer Contributions
PERS includes accrued contributions when due pursuant to legal requirements, as of June 30 in its Statement of Changes in Fiduciary Net Position. These are normally included in the employer statements cut off as of the fifth of the following month. PERS does not try to accrue contributions based on paydate. Beginning with fiscal year 2016, PERS will be able to report cash contributions and UAL side account amortization by employer, and will publish this information on the PERS Website. Prior to fiscal year 2016, contributions to the OPSRP Defined Benefit plan were not accounted for by employer, as all employers were pooled for actuarial purposes.
J. Elements of Changes in Net Position
This information can be found in the Schedule of Changes in Net Pension Liability found on page 61, of the June 30, 2015 PERS CAFR.
Pension Liabilities/(Assets), Pension Expense, and Deferred Outflows and Inflows of Resources Related to Pensions
At June 30, 2016, the employer reported a liability of $523,750 for its proportionate share of the net pension liability. The net pension liability/(asset) was measured as of June 30, 2015, and the total pension liability used to calculate the net pension liability was determined by an actuarial valuation as of that date. The employer’s proportion of the net pension liability was based on a projection of the employer’s long-term share of contributions to the pension plan rela-tive to the projected contributions of all participating employers, actuarially determined.

AMITY SCHOOL DISTRICT NO. 4J NOTES TO THE BASIC FINANCIAL STATEMENTS
June 30, 2016
- 40 -
6. PENSION PLAN (Cont.):
At June 30, 2015, the employer’s proportion was 0.00912225 percent.
For the year ended June 30, 2016, the employer recognized pension expense of $505,648. At June 30, 2016, the em-ployer reported deferred outflows of resources and deferred inflows of resources related to pensions from the following sources:
Deferred Outflows of Resources
Deferred Inflows of Resources
Differences between expected and actual experience 28,243$ -$
Changes of assumptions - -
- 109,790
5,502 -
- 48,430
33,745$ 158,220$
344,286 N/A
Total Deferred Outflow/(Inflow) of Resources 378,031$ 158,220$
Net Deferred Outflow/(Inflow) of Resources prior to post-measurement date contributions (124,475)
Net difference between projected and actual earnings on investements
Differences between employer contributions and employer's proportionate share of system contributions
Changes in proportionate share
Total Deferred Outflows/Inflows
Post-measurement date contributions
$124,475 reported as deferred inflows of resources related to pensions resulting from employer contributions subse-quent to the measurement date will be recognized as a reduction of the net pension liability in the year ended June 30, 2017.Other amounts reported as deferred outflows of resources and deferred inflows of resources related to pensions will be recognized in pension expense/(income) as follows:
Employer subsequent fiscal years
1st Fiscal Year (55,864)$ 2nd Fiscal Year (55,864) 3rd Fiscal Year (55,864) 4th Fiscal Year 44,196 5th Fiscal Year (1,079) Thereafter - Total (124,475)$
Deferred Outflow/(Inflow) of Resources (prior to post-measurement date contributions)

AMITY SCHOOL DISTRICT NO. 4J NOTES TO THE BASIC FINANCIAL STATEMENTS
June 30, 2016
- 41 -
7. OTHER POST-EMPLOYMENT BENEFITS (OPEB): Oregon Public Employees Retirement Systems’ (PERS) Retiree Health Insurance Account (RHIA) Plan Description The District contributes to the Oregon Public Employees Retirement Systems’ (PERS) Retiree Health Insurance Ac-count (RHIA), a cost-sharing multiple-employer defined benefit post-employment healthcare plan administered by the Oregon Public Employees Retirement Board (OPERB). The plan, which was established under Oregon Revised Stat-utes 238.420, provides a payment of up to $60 per month towards the costs of health insurance for eligible PERS retir-ees. RHIA post-employment benefits are set by state statute. A comprehensive annual financial report of the funds ad-ministered by the OPERB may be obtained by writing to Oregon Public Employees Retirement System, P.O. Box 23700, Tigard, OR 97281-3700, by calling (503) 598- 7377, or by accessing the PERS web site at http://oregon.gov/PERS/. Funding Policy Participating employers are contractually required to contribute at a rate assessed bi-annually by the OPERB, currently 0.59% of annual covered payroll. The OPERB sets the employer contribution rate based on the annual required contri-bution of the employers (ARC), an amount actuarially determined in accordance with the parameters of GASB State-ment 45. The ARC represents a level of funding that, if paid on an ongoing basis, is projected to cover normal cost each year and amortize any unfunded actuarial liabilities (or funding excess) of the plan over a period not to exceed thirty years. The District’s contributions to PERS’ RHIA for the year ended June 30, 2016, was $20,628, which equaled the required contributions for the year.

AMITY SCHOOL DISTRICT NO. 4J NOTES TO THE BASIC FINANCIAL STATEMENTS
June 30, 2016
- 42 -
7. OTHER POST-EMPLOYMENT BENEFITS (OPEB) (CONT.): Annual OPEB Cost and Net OPEB Obligation The District’s annual other post-employment benefit cost (expense) is calculated based on the annual required contri-bution of the employer, an amount actuarially determined in accordance within the parameters of GASB 45. The ARC represents a level of funding that, if paid on an ongoing basis, is projected to cover normal cost each year and amortize any unfunded actuarial liabilities (or funding excess) over a period not to exceed thirty years. The following table shows the components of the District’s annual OPEB cost for the fiscal year ending June 30, 2016, the amount actually contributed to the plans, and changes in the District’s net OPEB obligation:
Annual required contribution 29,751$ Interest on net OPEB obligation 7,090 Adjustment to the annual required contribution 8,956
Annual OPEB cost (expense) 45,797 Contributions made 20,628
Increase in net OPEB obligation 7,257 Net OPEB obligation, beginning of year 149,267
Net OPEB obligation, end of year 156,524$
8. CONTINGENT LIABILITIES: Amounts received or receivable from grantor agencies are subject to audit and adjustment by grantor agencies, princi-pally the federal government. Any disallowed claims, including amounts already collected, may constitute a liability of the applicable funds. The amount, if any, of expenditures which may be disallowed by the grantor cannot be deter-mined at this time although the District expects such amount, if any, to be immaterial. The District is not currently named as a defendant in any pending or threatened litigation. 9. COMMODITIES RECEIVED IN FOOD SERVICE FUND: During the year the District received USDA commodities. Fair market value of the amount of commodities used dur-ing the 2015-16 fiscal year is $19,085. The amount is reflected as federal revenue received and as a food expenditure in the Food Service Fund in the financial statements. Fair market value is determined by the Oregon Department of Education.

AMITY SCHOOL DISTRICT NO. 4J NOTES TO THE BASIC FINANCIAL STATEMENTS
June 30, 2016
- 43 -
10. RISK MANAGEMENT: The District is exposed to various risks of loss related to limited torts; theft of, damage to and destruction of assets; er-rors and omissions and natural disasters. The District is joined together with other school districts in the state, which are participating members of United Schools Insurance Program of Oregon, a public entity risk pool currently operat-ing as a common risk management and insurance program for member governments. The District has an annually re-newable contract to pay United Schools Insurance Program of Oregon an annual premium for its general liability, property liability, automobile liability, boiler and machinery, comprehensive crime, and umbrella insurance coverage. The District carries commercial insurance for all other losses, including workers’ compensation and employee health and accident insurance. Premiums to the health insurance company are paid through a combination of employer con-tributions and payroll withholdings for eligible employees. The District came under the State Unemployment Act as of July 1, 1974. The District has elected to pay State Unem-ployment insurance to the State of Oregon to pay for any claims paid to former employees. There have been no significant reductions in coverage from the prior years and settlements have not exceeded insur-ance coverage in the past three years.

AMITY SCHOOL DISTRICT NO. 4J NOTES TO THE BASIC FINANCIAL STATEMENTS
June 30, 2016
- 44 -
11. INTERFUND RECEIVABLES, PAYABLES, AND TRANSFERS: The interfund balances between the general fund and special revenue funds represent payments made by the general fund on behalf of the special revenue funds in relation to grant reimbursements. All balances are expected to be repaid within one year. Interfund balances at June 30, 2016 consisted of the following individual fund receivables and payables:
Due From Due To
Other Other
Funds Funds
General Fund #100 110,001$ -$
Special Revenue Funds:
IDEA Fund #200 - 55,225
Title 1 Fund #201 - 41,302
Federal Miscellaneous Fund #204 - 13,474
Total 110,001$ 110,001$
Interfund transfers for the year ended June 30, 2016 were as follows:
Transfers Transfers
Out In
General Fund #100 95,000$ -$
Food Service Fund #280 - 30,000
Vehicle Replacement Fund #292 - 10,000
Technology Replacement Fund #293 - 10,000
Capital Improvement Fund #430 - 45,000
Total 95,000$ 95,000$
The transfer out of the General Fund to the Food Service Fund represents the District’s election to provide General Fund support to the food service program. The transfer out of the General Fund to the Capital Improvement Fund and Technology Replacement Fund represents the District’s election to provide General Fund support towards capital ac-tivities.

AMITY SCHOOL DISTRICT NO. 4J NOTES TO THE BASIC FINANCIAL STATEMENTS
June 30, 2016
- 45 -
12. FUND BALANCE COMPARISONS:
FundActual
June 30, 2016 Budgeted
July 1, 2016
General Fund #100 683,262$ 670,000$
State Miscellaneous Grants Fund # 205 2,175 -
Community Projects Fund # 250 12,634 10,500
Student Body Fund # 270 174,256 185,000
Food Service Fund # 280 5,798 10,000
Vehicle Replacement Fund # 292 14,529 14,528
Technology Replacement Fund # 293 125,650 125,650
Unemployment Fund # 298 125,328 125,180
Scholarship Fund # 299 72,802 73,000
Debt Service Fund # 300 33,894 31,500
PERS Bond Debt Fund # 302 581,876 594,613
Capital Improvement Fund #430 738,897$ 733,209$

REQUIRED
SUPPLEMENTARY
INFORMATION

Actual Variance withAmounts Final Budget
Budgeted Amounts (Budgetary Basis) PositiveOriginal Final (See Note 1) (Negative)
REVENUES:Revenues from Local Sources:
Ad Valorem Taxes-Current Year 1,440,000 1,440,000 1,475,770 35,770 Ad Valorem Taxes-Prior Year 60,000 60,000 55,244 (4,756) Land Sales - Delinquent Taxes 25 25 28 3 Penalties & Interest on Taxes 25 25 21 (4) Tuition - - 271 271 Interest on Investments 13,000 13,000 10,610 (2,390) Admission to Co-Curricular 15,000 15,000 16,771 1,771 Fees 33,000 33,000 30,768 (2,232) Rental on Buildings 9,800 9,800 9,770 (30) Contributions from Private Sources 1,500 1,500 300 (1,200) Services Provided Charter Schools 1,000 1,000 500 (500) Recovery of Prior Years' Expenditures 5,000 5,000 39 (4,961) Miscellaneous 25,000 25,000 18,940 (6,060) Revenue in Lieu of Taxes 1,200 1,200 - (1,200) Fingerprint Fees 300 300 744 444
Total Local Revenues 1,604,850 1,604,850 1,619,776 14,926
Revenues from Intermediate Sources:County School Fund 3,000 3,000 1,105 (1,895) ESD Apportionment 80,394 80,394 80,393 (1) Restricted Revenue - - 5,280 5,280 Other Intermediate Sources 1,500 1,500 1,990 490
Total Intermediate Revenues 84,894 84,894 88,768 3,874
Revenues from State Sources:Basic School Support Fund 5,901,657 5,901,657 6,074,042 172,385 Common School Fund 80,272 80,272 109,440 29,168 Other Unrestricted Grants-in-Aid 265,000 265,000 88,270 (176,730)
Total State Revenues 6,246,929 6,246,929 6,271,752 24,823
Revenues from Federal Sources:Federal Forest Fees 10 10 5 (5)
Total Federal Revenues 10 10 5 (5)
Total Revenues 7,936,683 7,936,683 7,980,301 43,618
Total Expenditures 8,830,983 8,830,983 8,097,718 (733,265)
Excess (Deficiency) of Revenues Over Expenditures (894,300) (894,300) (117,417) 776,883
Fund Balance - July 1, 2015 1,000,000 1,000,000 800,679 (199,321)
Fund Balance - June 30, 2016 105,700$ 105,700$ 683,262$ 577,562$
AMITY SCHOOL DISTRICT NO. 4J
GENERAL FUND #100For the Fiscal Year Ended June 30, 2016
Schedule of Revenues, Expenditures, andChanges in Fund Balance - Budget and Actual
- 46 -

Actual Amounts (Budgetary Basis - See Note 1)Supplies Variance with
Employee Purchased and Other Final BudgetSalaries Benefits Services Materials Objects Transfers Budgeted Amounts Positive
100 200 300 400 600 700 Total Original Final (Negative)INSTRUCTION:
Regular Programs:#1111 Elementary K-5 908,429$ 471,863$ 8,191$ 32,035$ 145$ -$ 1,420,663$ 1,509,704$ 1,509,704$ (89,041)$ #1113 Elementary Extracurricular 6,969 2,252 975 1,208 - - 11,404 10,838 10,838 566 #1121 Middle School 534,613 253,357 4,186 10,408 - - 802,564 849,771 849,771 (47,207) #1122 Middle School Extracurricular 16,186 3,118 4,446 2,238 - - 25,988 24,358 24,358 1,630 #1131 High School 857,168 410,706 13,611 32,398 1,386 - 1,315,269 1,321,289 1,271,289 43,980 #1132 High School Extracurricular 114,870 36,548 41,674 15,666 3,560 - 212,318 220,680 220,680 (8,362)
Special Programs:#1210 Talented & Gifted - - - - - - - 3,857 3,857 (3,857) #1220 Restrict. Prgms f/ Stdnts w/Disablts. - - 205,639 - - - 205,639 177,600 177,600 28,039 #1225 Restrict. Prgms f/ Stdnts w/Disablts., Out of Dist. - - - - - - - 600 600 (600) #1250 Resources Room 273,302 168,952 528 5,139 - - 447,921 466,582 466,582 (18,661) #1280 Alternative Education - - 369,818 - - - 369,818 445,735 420,735 (50,917) #1291 English as Second Language 41,507 14,178 - 3,081 - - 58,766 77,186 77,186 (18,420) #1292 Teen Parent Program - - - - - - - 203 203 (203) #1294 Youth Corrections Education - - - - - - - 2,060 2,060 (2,060) #1430 High School Summer Programs 1,200 395 - - - - 1,595 1,985 1,985 (390)
Total Instruction 2,754,244 1,361,369 649,068 102,173 5,091 - 4,871,945 5,112,448 5,037,448 (165,503)
SUPPORT SERVICES:Students:
#2110 Attendance and Social Work Srvs 64,602 45,785 17,147 5 - - 127,539 130,192 130,192 (2,653) #2120 Guidance Services 138,119 61,588 514 523 - - 200,744 219,844 254,844 (54,100) #2130 Health Services - - 2,128 - - - 2,128 3,830 3,830 (1,702) #2140 Psychological Services - - 38,750 - - - 38,750 10,030 50,030 (11,280) #2150 Speech, Pathlgy & Audiology Srvs - - 266 - - - 266 700 700 (434) #2190 Service Direction Services 81,168 40,576 - - - - 121,744 110,917 110,917 10,827
Instructional Staff:#2210 Improvement of Instruct. Srvs - - - - - - - 1,015 1,015 (1,015) #2220 Education Media Services 67,696 20,707 540 3,881 110 - 92,934 52,578 52,578 40,356 #2230 Assessment and Testing 6,753 3,656 - 1,596 - - 12,005 16,459 16,459 (4,454) #2240 Instructional Staff Development 1,250 8,299 1,015 - - - 10,564 2,016 2,016 8,548
General Administration:#2310 Board of Education Services - - 16,409 1,940 11,090 - 29,439 40,780 40,780 (11,341) #2320 Executive Administrative Services 116,454 60,204 3,087 522 925 - 181,192 186,840 186,840 (5,648)
School Administration:#2410 Office of the Principal Services 384,527 222,808 5,836 2,280 2,720 - 618,171 588,273 588,273 29,898
Business:#2520 Fiscal Services 103,138 50,405 27,952 2,884 48,650 - 233,029 175,762 175,762 57,267 #2540 Operation and Maintenance of Plant Svcs
Care & Upkeep of Buildings 179,131 130,732 216,538 56,048 59,026 - 641,475 719,828 719,828 (78,353) Care & Upkeep of Grounds 7,248 4,469 19,219 6,089 - - 37,025 39,802 39,802 (2,777) District-Wide Maintenance 43,700 26,885 6,358 2,226 - - 79,169 82,985 82,985 (3,816)
#2550 Student Transportation ServicesService Direction 6,528 3,347 - - - - 9,875 9,867 9,867 8 Vehicle Operations Services 2,214 225 264,730 6,056 3,818 - 277,043 333,003 333,003 (55,960) Special Education Transportation Srvs - - 99,703 - - - 99,703 96,360 96,360 3,343 Other Student Transportation Services 14,001 8,126 - - - - 22,127 21,856 21,856 271
Central Activities:#2630 Information Services 14,189 7,373 180 - - - 21,742 23,559 23,559 (1,817) #2640 Staff Services - - 2,182 - - - 2,182 3,529 3,529 (1,347) #2660 Technology Services 72,497 39,939 54,128 35,952 150 - 202,666 234,248 234,248 (31,582)
Total Support Services 1,303,215 735,124 776,682 120,002 126,489 - 3,061,512 3,104,273 3,179,273 (117,761)
Debt Service - - - - 69,261 - 69,261 69,262 69,262 (1)
Interfund Transfers - - - - - 95,000 95,000 95,000 105,000 (10,000)
Contingency - - - - - - - 450,000 440,000 (440,000)
Total General Fund Expenditures 4,057,459$ 2,096,493$ 1,425,750$ 222,175$ 200,841$ 95,000$ 8,097,718$ 8,830,983$ 8,830,983$ (733,265)$
For the Fiscal Year Ended June 30, 2016
AMITY SCHOOL DISTRICT NO. 4JSCHEDULE OF EXPENDITURES
GENERAL FUND #100
- 47 -

Actual Variance withAmounts Final Budget
Budgeted Amounts (Budgetary Basis) PositiveOriginal Final (See Note 1) (Negative)
REVENUES:Revenues from Federal Sources:
IDEA Grant 220,000$ 220,000$ 135,170$ (84,830)$ IDEA Supplemental Grant - - 2,621 2,621 IDEA - 619 Grant 10,000 10,000 4,896 (5,104) State Personnel Development Grant (EBISS) 9,000 9,000 6,402 (2,598) SPR&I 5,000 5,000 - (5,000) IDEA Enhancement 5,000 5,000 - (5,000)
Total Federal Revenues 249,000 249,000 149,089 (99,911)
Total Revenues 249,000 249,000 149,089 (99,911)
EXPENDITURES:Instruction:
#1111 Primary ProgramsSupplies & Materials - - 2,099 2,099
#1255 Resource RoomsSalaries 144,945 144,945 100,667 (44,278) Employee Benefits 56,655 56,655 39,071 (17,584) Purchased Services 2,895 2,895 - (2,895)
#1256 Resource RoomsSalaries 1,285 1,285 1,350 65 Employee Benefits 445 445 275 (170)
#1260 Treatment and HabilitationPurchased Services 3,505 3,505 - (3,505)
Total Instruction 209,730 209,730 143,462 (66,268)
Support Services:#2190 Service Direction, Student Support Svcs
Salaries 11,300 11,300 41 (11,259) Employee Benefits 355 355 13 (342) Purchased Services 600 600 - (600)
# 2210 Improvement of Instruction SerivcesSalaries 3,025 3,025 84 (2,941) Employee Benefits 580 580 14 (566) Purchased Services 5,610 5,610 772 (4,838) Supplies and Materials 300 300 72 (228)
#2240 Instructional Staff DevelopmentSalaries 11,800 11,800 1,332 (10,468) Employee Benefits - - 411 411 Purchased Services 3,000 3,000 2,437 (563) Supplies and Materials 2,700 2,700 451 (2,249)
Total Support Services 39,270 39,270 5,627 (33,643)
Total Expenditures 249,000 249,000 149,089 (99,911)
Excess (Deficiency) of Revenues Over Expenditures - - - -
Fund Balance - July 1, 2015 - - - -
Fund Balance - June 30, 2016 -$ -$ -$ -$
AMITY SCHOOL DISTRICT NO. 4J
IDEA GRANT FUND #200For the Fiscal Year Ended June 30, 2016
Schedule of Revenues, Expenditures, andChanges in Fund Balance - Budget and Actual
- 48 -

Actual Variance with
Amounts Final Budget
Budgeted Amounts (Budgetary Basis) Positive
Original Final (See Note 1) (Negative)
REVENUES:Revenues from Federal Sources:
Title 1 Grant 200,000$ 200,000$ 120,278$ (79,722)$
Total Revenues 200,000 200,000 120,278 (79,722)
EXPENDITURES:Instruction:
#1272 Title 1Salaries 77,032 77,032 79,928 2,896 Employee Benefits 58,918 58,918 26,293 (32,625) Purchased Services 3,500 3,500 3,287 (213) Supplies and Materials 30,000 30,000 9,917 (20,083) Other Uses - - 271 271
Total Instruction 169,450 169,450 119,696 (49,754)
Support Services:#2240 Instructional Staff Development
Purchased Services 30,000 30,000 47 (29,953)
Total Support Services 30,000 30,000 47 (29,953)
Enterprise and Community Services:#3330 Civic Services
Supplies and Materials 550 550 535 (15)
Total Enterprise and Community Svcs 550 550 535 (15)
Total Expenditures 200,000 200,000 120,278 (79,722)
Excess (Deficiency) of Revenues Over Expenditures - - - -
Fund Balance - July 1, 2015 - - - -
Fund Balance - June 30, 2016 -$ -$ -$ -$
AMITY SCHOOL DISTRICT NO. 4J
TITLE 1 FUND #201
For the Fiscal Year Ended June 30, 2016
Schedule of Revenues, Expenditures, andChanges in Fund Balance - Budget and Actual
- 49 -

2016 20150.00912225% 0.00880183%
523,750$ (199,512)$
3,931,540$ 3,931,540$
13.32% -5.07%
91.9% 103.6%
Employer's proportionate share of the net pension liability (asset)
Employer's covered - employee payroll
Employer's proportionate share of the net pension liability (asset) as a percentage of its covered - employee payroll
Plan fiduciary net position as a percentage of the total pension liability
*This schedule is presented to illustrate the requirement to show information for 10 years. However the full 10-year trend will be presented for those years for which information is available
Employer's proportion of the net pension liability (asset)
AMITY SCHOOL DISTRICT NO. 4J
SCHEDULE OF PROPORTIONATE SHARE OF THE NET PENSION LIABILITY
PERS
Last 10 Fiscal Years*
- 50 -

2016 2015 2014 2013 2012 2011 2010 2009 2008 2007
344,286$ 338,760$ 286,635$ 257,842$ 255,071$ 192,983$ 200,041$ 226,213$ 219,554$ 168,111$
344,286 338,760 286,635 257,842 255,071 192,983 200,041 226,213 219,554 168,111
-$ -$ -$ -$ -$ -$ -$ -$ -$ -$
3,931,540$ 3,864,906$ 3,864,906$ 3,589,876$ 3,553,505$ 3,363,297$ 3,440,483$ 3,570,818$ 3,620,977$ 3,584,215$
0.53% 3.69% 3.69% 2.06% 2.06% 0.29% 0.29% 0.29% 0.29% 0.29%
Contribution deficiency (excess)
Employer's covered - employee payroll
Contributions as a percentage of covered - employee payroll
AMITY SCHOOL DISTRICT NO. 4JSCHEDULE OF EMPLOYER CONTRIBUTIONS
PERS
Last 10 Fiscal Years
Contractually required contribution
Contributions in relation to the contractually required contribution
- 51 -
OTHER
SUPPLEMENTARY
INFORMATION
Non-Major Special Revenue Funds

Federal StateMisc. Misc. Community Student Food Vehicle Technology Unemploy-
Grants Grants Projects Body Service Replacement Replacement ment ScholarshipFund Fund Fund Fund Fund Fund Fund Fund Fund#204 #205 #250 #270 #280 #292 #293 #298 #299 Total
ASSETS:Cash and Investments -$ 1,631$ 11,489$ 174,256$ (6,964)$ 14,529$ 125,650$ 125,328$ 72,802$ 518,721$ Accounts Receivable - 544 - - - - - - - 544 Intergovernmental Receivable 13,474 - 1,145 - 13,508 - - - - 28,127 Inventories-Food, Supplies
and Commodities - - - - 7,519 - - - - 7,519
Total Assets 13,474$ 2,175$ 12,634$ 174,256$ 14,063$ 14,529$ 125,650$ 125,328$ 72,802$ 554,911$
LIABILITIES & FUND BALANCES:Liabilities:
Accounts Payable -$ -$ -$ -$ 746$ -$ -$ -$ -$ 746$ Due to Other Funds 13,474 - - - - - - - - 13,474
Total Liabilities 13,474 - - - 746 - - - - 14,220
Fund Balances:Non-spendable - - - - 7,519 - - - - 7,519 Committed for:
Educational Programs - 2,175 - - - - - - 72,802 74,977 Community Projects - - 12,634 - - - - - - 12,634 Student Body Activities - - - 174,256 - - - - - 174,256 Food Service Programs - - - - 5,798 - - - - 5,798 Equipment Acquisition - - - - - 14,529 125,650 - - 140,179 Employee Benefits Programs - - - - - - - 125,328 - 125,328
Total Fund Balances - 2,175 12,634 174,256 13,317 14,529 125,650 125,328 72,802 540,691
Total Liabilities and Fund Balances 13,474$ 2,175$ 12,634$ 174,256$ 14,063$ 14,529$ 125,650$ 125,328$ 72,802$ 554,911$
AMITY SCHOOL DISTRICT NO. 4JCOMBINING BALANCE SHEET
NON-MAJOR SPECIAL REVENUE FUNDSJune 30, 2016
- 52 -

Federal StateMisc. Misc. Community Student Food Vehicle Technology Unem-
Grants Grants Projects Body Service Replacement Replacement ployment ScholarshipFund Fund Fund Fund Fund Fund Fund Fund Fund#204 #205 #250 #270 #280 #292 #293 #298 #299 Totals
REVENUES:Basic School Support Fund -$ -$ -$ -$ 2,571$ 26,482$ -$ -$ -$ 29,053$ Fees and Charges - - 8,657 259,549 50,199 - - - - 318,405 Interest on Investments - - - - 5 - - 792 5,188 5,985 Miscellaneous Local Revenues - - - - 2,343 - 37,322 - - 39,665 State Grants-In-Aid - 5,747 - - 1,947 - - - - 7,694 Federal Reimbursement Grants 29,048 - - - 203,536 - - - - 232,584
Total Revenues 29,048 5,747 8,657 259,549 260,601 26,482 37,322 792 5,188 633,386
EXPENDITURES:Instruction:
Regular Instruction - 4,206 - 242,336 - - - - - 246,542 Support Services:
Instructional Staff 26,026 1,207 - - - - - - - 27,233 School Administration 2,491 - - - - - - - - 2,491 Business Services - - - - - - - 216 - 216 Operation & Maint. of Plant Services - - - - - 12,606 - - - 12,606 Information and Staff Services 531 - - - - - - - - 531 Technology Services - - - - - - 16,484 - - 16,484
Enterprise & Community Srvs - - 5,232 - 286,518 - - - 4,700 296,450 Debt Service - - - - - 36,408 - - - 36,408
Total Expenditures 29,048 5,413 5,232 242,336 286,518 49,014 16,484 216 4,700 638,961
Excess (Deficiency) of Revenues
Over Expenditures - 334 3,425 17,213 (25,917) (22,532) 20,838 576 488 (5,575)
OTHER FINANCING SOURCES (USES):
Operating Transfers In - - - - 30,000 10,000 10,000 - - 50,000
Total Other Financing Sources (Uses) - - - - 30,000 10,000 10,000 - - 50,000
Net Change in Fund Balances - 334 3,425 17,213 4,083 (12,532) 30,838 576 488 44,425
Fund Balances - July 1, 2015 - 1,841 9,209 157,043 1,715 27,061 94,812 124,752 72,314 488,747
Fund Balances - June 30, 2016 -$ 2,175$ 12,634$ 174,256$ 5,798$ 14,529$ 125,650$ 125,328$ 72,802$ 533,172$
AMITY SCHOOL DISTRICT NO. 4JCombining Statement of Revenues,
Expenditures, and Changes in Fund Balances
For the Fiscal Year Ended June 30, 2016NON-MAJOR SPECIAL REVENUE FUNDS
- 53 -

Actual Variance withAmounts Final Budget
Budgeted Amounts (Budgetary Basis) PositiveOriginal Final (See Note 1) (Negative)
REVENUES:Revenues from Federal Sources:
Title IIa Improving Teacher Quality Grant 70,000$ 70,000$ 27,982$ (42,018)$ Title IIIa English Language No Child Left Behind 10,000 10,000 - (10,000) Title VI Grant 138,000 138,000 - (138,000) Vocational Education Carl Perkins Grant 4,000 4,000 - (4,000) Title X Innovative Program 10,000 10,000 - (10,000) Grants-in-Aid from the Fed Gov't 30,000 30,000 - (30,000) Other Restricted Federal Grant 4,000 4,000 1,066 (2,934)
Total Revenues 266,000 266,000 29,048 (236,952)
EXPENDITURES:Instruction:
#1111 Elementary K-5 - Title IIaSalaries 10,000 10,000 - (10,000) Supplies and Materials 92,000 92,000 - (92,000)
#1131 High School Programs - Title XSalaries 1,000 1,000 - (1,000) Supplies and Materials 48,000 48,000 - (48,000)
#1291 English Second Language ProgramSalaries 4,700 4,700 - (4,700) Employee Benefits 1,600 1,600 - (1,600) Purchased Services 2,800 2,800 - (2,800) Supplies and Materials 900 900 - (900)
Total Instruction 161,000 161,000 - (161,000)
Support Services:#2110 Attendance Services
Supplies and Materials 5,975 5,975 - (5,975) Other Uses 2,000 2,000 - (2,000)
#2210 Improvement of Instruction Services - Title IIaSalaries 7,300 7,300 2,250 (5,050) Employee Benefits - - 733 733
#2213 Social Work Services - Misc Fed GrantsSupplies and Materi 20,000 20,000 - (20,000)
#2240 Instructional Staff Development - Title IIaSalaries 26,625 26,625 7,584 (19,041) Employee Benefits 2,170 2,170 2,355 185 Purchased Services 32,000 32,000 12,038 (19,962)
#2241 Instructional Staff Development - TNTSalaries 3,500 3,500 835 (2,665) Employee Benefits 500 500 231 (269)
#2490 Other Support ServicesSalaries 1,705 1,705 - (1,705) Purchased Services 2,200 2,200 2,491 291
#2520 Fiscal Services - Title XSalaries 400 400 - (400) Employee Benefits 325 325 - (325) Purchased Services 300 300 - (300)
#2640 Staff Services - Title IIaSalaries - - 400 400 Employee Benefits - - 131 131
Total Support Services 105,000 105,000 29,048 (75,952)
Total Expenditures 266,000 266,000 29,048 (236,952)
Excess (Deficiency) of Revenues Over Expenditures - - - -
Fund Balance - July 1, 2015 - - - -
Fund Balance - June 30, 2016 -$ -$ -$ -$
AMITY SCHOOL DISTRICT NO. 4J
FEDERAL MISCELLANEOUS GRANTS FUND #204For the Fiscal Year Ended June 30, 2016
Schedule of Revenues, Expenditures, andChanges in Fund Balance - Budget and Actual
- 54 -

Actual Variance withAmounts Final Budget
Budgeted Amounts (Budgetary Basis) PositiveOriginal Final (See Note 1) (Negative)
REVENUES:Other Revenue from Local Sources 75,000$ 75,000$ -$ (75,000)$ Other Restricted State Grants 84,000 84,000 5,747 (78,253)
Total Revenues 159,000 159,000 5,747 (153,253)
EXPENDITURES:Instruction:
#1121 Middle School ProgramsSupplies & Materials 40,000 40,000 - (40,000)
#1131 High School ProgramsSalaries - - 174 174 Employee Benefits - - 50 50 Purchased Services - - 691 691 Supplies & Materials 10,000 10,000 3,291 (6,709)
Total Instruction 50,000 50,000 4,206 (45,794)
Support Services:#2113 Social Work Services
Salaries 30,000 30,000 - (30,000) Employee Benefits 10,000 10,000 - (10,000) Purchased Services 15,000 15,000 - (15,000) Supplies & Materials 5,000 5,000 - (5,000)
#2210 Improvement of Instruction ServicesSalaries 6,900 6,900 - (6,900) Employee Benefits 600 600 - (600) Purchased Services 41,500 41,500 - (41,500)
#2240 Instructional Staff DevelopmentSalaries - - 130 130 Employee Benefits - - 10 10 Purchased Services - - 1,067 1,067
Total Support Services 109,000 109,000 1,207 (107,793)
Total Expenditures 159,000 159,000 5,413 (153,587)
Excess (Deficiency) of Revenues
Over Expenditures - - 334 334
Fund Balance - July 1, 2015 - - 1,841 1,841
Fund Balance - June 30, 2016 -$ -$ 2,175$ 334$
AMITY SCHOOL DISTRICT NO. 4J
STATE MISCELLANEOUS GRANTS FUND #205
For the Fiscal Year Ended June 30, 2016
Schedule of Revenues, Expenditures, andChanges in Fund Balance - Budget and Actual
- 55 -
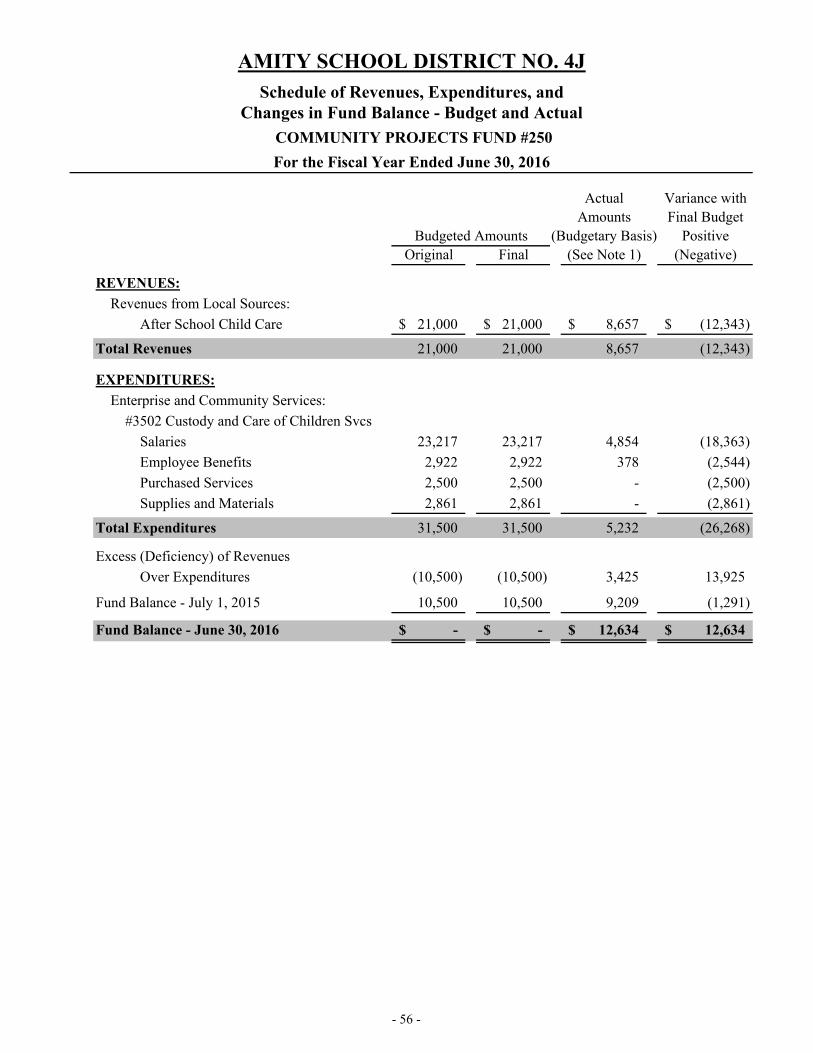
Actual Variance withAmounts Final Budget
Budgeted Amounts (Budgetary Basis) PositiveOriginal Final (See Note 1) (Negative)
REVENUES:
Revenues from Local Sources:
After School Child Care 21,000$ 21,000$ 8,657$ (12,343)$
Total Revenues 21,000 21,000 8,657 (12,343)
EXPENDITURES:
Enterprise and Community Services:
#3502 Custody and Care of Children Svcs
Salaries 23,217 23,217 4,854 (18,363)
Employee Benefits 2,922 2,922 378 (2,544)
Purchased Services 2,500 2,500 - (2,500)
Supplies and Materials 2,861 2,861 - (2,861)
Total Expenditures 31,500 31,500 5,232 (26,268)
Excess (Deficiency) of Revenues
Over Expenditures (10,500) (10,500) 3,425 13,925
Fund Balance - July 1, 2015 10,500 10,500 9,209 (1,291)
Fund Balance - June 30, 2016 -$ -$ 12,634$ 12,634$
AMITY SCHOOL DISTRICT NO. 4J
COMMUNITY PROJECTS FUND #250
For the Fiscal Year Ended June 30, 2016
Schedule of Revenues, Expenditures, andChanges in Fund Balance - Budget and Actual
- 56 -

Actual Variance withAmounts Final Budget
Budgeted Amounts (Budgetary Basis) PositiveOriginal Final (See Note 1) (Negative)
REVENUES:
Revenues from Local Sources:
Other Curricular Activities 275,000$ 275,000$ 259,549$ (15,451)$
Total Revenues 275,000 275,000 259,549 (15,451)
EXPENDITURES:
Instruction:
#1113 Elementary Extracurricular
Materials and Supplies 80,000 80,000 37,018 (42,982)
#1122 Middle School Extracurricular
Materials and Supplies 80,000 80,000 21,166 (58,834)
#1132 High School Extracurricular
Materials and Supplies 300,000 300,000 184,152 (115,848)
Total Instruction 460,000 460,000 242,336 (217,664)
Total Expenditures 460,000 460,000 242,336 (217,664)
Excess (Deficiency) of Revenues
Over Expenditures (185,000) (185,000) 17,213 202,213
Fund Balance - July 1, 2015 185,000 185,000 157,043 (27,957)
Fund Balance - June 30, 2016 -$ -$ 174,256$ 174,256$
For the Fiscal Year Ended June 30, 2016
AMITY SCHOOL DISTRICT NO. 4J
Schedule of Revenues, Expenditures and Changes in Fund Balance - Budget and Actual
STUDENT BODY FUND #270
- 57 -

Actual Variance withAmounts Final Budget
Budgeted Amounts (Budgetary Basis PositiveOriginal Final (See Note 1) (Negative)
REVENUES:Revenues from Local Sources:
Interest on Investments 50$ 50$ 5$ (45)$ Breakfast Sales 5,000 5,000 1,907 (3,093) Lunch Sales 85,000 85,000 44,886 (40,114) Daily Sales - Non-reimbursable 10,000 10,000 3,406 (6,594) Special Functions 4,000 4,000 2,343 (1,657) Miscellaneous Revenue 1,250 1,250 - (1,250)
Total Local Revenues 105,300 105,300 52,547 (52,753) Revenues from State Sources:
Basic School Support Fund 3,500 3,500 2,571 (929) Reduced Price Meal Reimbursement 40,000 40,000 1,947 (38,053)
Total State Revenues 43,500 43,500 4,518 (38,982) Revenues from Federal Sources:
School Nutrition Reimbursements - Lunch & Breakfa 200,000 200,000 184,451 (15,549) Commodities 25,000 25,000 19,085 (5,915)
Total Federal Revenues 225,000 225,000 203,536 (21,464)
Total Revenues 373,800 373,800 260,601 (113,199)
EXPENDITURES:Enterprise and Community Services:
#3120 Food Services:Salaries 75,351 85,351 71,145 (14,206) Employee Benefits 77,811 77,811 40,109 (37,702) Purchased Services 3,268 3,268 4,731 1,463 Supplies and Materials 212,000 212,000 151,870 (60,130) Capital Outlay 11,000 11,000 (11,000) Other Objects 6,300 6,300 4,793 (1,507)
#3190 Other Food Services:Salaries 9,181 9,181 10,263 1,082 Employee Benefits 9,889 9,889 3,607 (6,282)
Total Enterprise and Community Services 404,800 414,800 286,518 (128,282)
Other Uses:#5100 Debt Service
Long Term Debt Service 40,000 40,000 - (40,000)
Total Other Uses 40,000 40,000 - (40,000)
Total Expenditures 444,800 454,800 286,518 (168,282)
Excess (Deficiency) of Revenues Over Expenditures (71,000) (81,000) (25,917) 55,083
OTHER FINANCING SOURCES (USES):Long Term Debt Financing Source 40,000 40,000 - (40,000) Interfund Transfer In 30,000 40,000 30,000 (10,000)
Total Other Financing Sources (Uses) 70,000 80,000 30,000 (50,000)
Net Change in Fund Balance (1,000) (1,000) 4,083 5,083
Fund Balance - July 1, 2015 1,000 1,000 1,715 715
Fund Balance - June 30, 2016 -$ -$ 5,798$ 5,798$
For the Fiscal Year Ended June 30, 2016
AMITY SCHOOL DISTRICT NO. 4JSchedule of Revenues, Expenditures
and Changes in Fund Balance - Budget and Actual
FOOD SERVICE FUND #280
- 58 -

Actual Variance withAmounts Final Budget
Budgeted Amounts (Budgetary Basis) PositiveOriginal Final (See Note 1) (Negative)
REVENUES:
Revenues from State Sources:
SSF Transportation 26,482$ 26,482$ 26,482$ -$
Total Revenues 26,482 26,482 26,482 -
EXPENDITURES:
Support Services:
#2540 Operation & Maintenance of Plant Services
Capital Outlay - - 12,606 12,606
#2550 Transportation Services
Capital Outlay 27,134 27,134 - (27,134)
Total Support Services 27,134 27,134 12,606 (14,528)
Other Uses:
#5110 Debt Service
#610 Redemption of Principal 32,496 32,496 32,496 -
#620 Interest 3,913 3,913 3,912 (1)
Total Other Uses 36,409 36,409 36,408 (1)
Total Expenditures 63,543 63,543 49,014 (14,529)
Excess (Deficiency) of Revenues
Over Expenditures (37,061) (37,061) (22,532) 14,529
OTHER FINANCING SOURCES (USES):
Interfund Transfer In 10,000 10,000 10,000 -
Total Other Financing Sources (Uses) 10,000 10,000 10,000 -
Net Change in Fund Balance (27,061) (27,061) (12,532) 14,529
Fund Balance - July 1, 2015 27,061 27,061 27,061 -
Fund Balance - June 30, 2016 -$ -$ 14,529$ 14,529$
For the Fiscal Year Ended June 30, 2016
AMITY SCHOOL DISTRICT NO. 4J
Schedule of Revenues, Expenditures and Changes in Fund Balance - Budget and Actual
VEHICLE REPLACEMENT FUND #292
- 59 -

Actual Variance withAmounts Final Budget
Budgeted Amounts (Budgetary Basis) PositiveOriginal Final (See Note 1) (Negative)
REVENUES:Revenues from Local Sources:
E-Rate Revenue 37,000$ 37,000$ 37,322$ 322$
Total Revenues 37,000 37,000 37,322 322
EXPENDITURES:Instruction:
#1111 Elementary ProgramsSupplies & Materials 20,000 20,000 - (20,000)
#1121 Middle School ProgramsSupplies & Materials 20,000 20,000 - (20,000)
#1131 High School ProgramsSupplies & Materials 20,000 20,000 - (20,000)
Total Instruction 60,000 60,000 - (40,000) Support Services:
#2660 Technology ServicesPurchased Services 5,000 5,000 4,494 (506) Supplies & Materials 52,000 52,000 11,990 (40,010)
Total Support Services 57,000 57,000 16,484 (40,516)
Total Expenditures 117,000 117,000 16,484 (80,516)
Excess (Deficiency) of Revenues Over Expenditures (80,000) (80,000) 20,838 80,838
OTHER FINANCING SOURCES (USES):
Interfund Transfer In 10,000 10,000 10,000 -
Total Other Financing Sources (Uses) 10,000 10,000 10,000 -
Net Change in Fund Balance (70,000) (70,000) 30,838 80,838
Fund Balance - July 1, 2015 70,000 70,000 94,812 24,812
Fund Balance - June 30, 2016 -$ -$ 125,650$ 105,650$
For the Fiscal Year Ended June 30, 2016
AMITY SCHOOL DISTRICT NO. 4J
Schedule of Revenues, Expenditures and Changes in Fund Balance-Budget and Actual
TECHNOLOGY REPLACEMENT FUND #293
- 60 -

Actual Variance withAmounts Final Budget
Budgeted Amounts (Budgetary Basis) PositiveOriginal Final (See Note 1) (Negative)
REVENUES:
Revenues from Local Sources:
Interest on Investments 720$ 720$ 792$ 72$
Total Revenues 720 720 792 72
EXPENDITURES:
Support Services:
#2520 Fiscal Services -
Employee Benefits 125,570 125,570 96 (125,474)
Purchased Services 150 150 120 (30)
Total Support Services 125,720 125,720 216 (125,504)
Total Expenditures 125,720 125,720 216 (125,504)
Excess (Deficiency) of Revenues
Over Expenditures (125,000) (125,000) 576 125,576
Fund Balance - July 1, 2015 125,000 125,000 124,752 (248)
Fund Balance - June 30, 2016 -$ -$ 125,328$ 125,328$
For the Fiscal Year Ended June 30, 2016
AMITY SCHOOL DISTRICT NO. 4J
Schedule of Revenues, Expenditures and Changes in Fund Balance - Budget and Actual
UNEMPLOYMENT FUND #298
- 61 -

Actual Variance withAmounts Final Budget
Budgeted Amounts (Budgetary Basis) PositiveOriginal Final (See Note 1) (Negative)
REVENUES:
Revenues from Locals Sources:
Interest on Investments 500$ 500$ 78$ (422)$
Contributions from Private Sources 200 200 5,110 4,910
Total Revenues 700 700 5,188 4,488
EXPENDITURES:
Enterprise and Community Services
#3390 Other Comm. Svcs - Purchased Svcs 18,000 18,000 4,700 (13,300)
Total Enterprise and Community Svcs 18,000 18,000 4,700 (13,300)
Other Uses
#6000 Contingency 55,700 55,700 - (55,700)
Total Expenditures 73,700 73,700 4,700 (69,000)
Excess (Deficiency) of Revenues
Over Expenditures (73,000) (73,000) 488 73,488
Fund Balance - July 1, 2015 73,000 73,000 72,314 (686)
Fund Balance - June 30, 2016 -$ -$ 72,802$ 72,802$
For the Fiscal Year Ended June 30, 2016
AMITY SCHOOL DISTRICT NO. 4J
Schedule of Revenues, Expenditures and Changes in Fund Balance - Budget and Actual
SCHOLARSHIP FUND #299
- 62 -
OTHER
SUPPLEMENTARY
INFORMATION
Debt Service Funds

Actual Variance withAmounts Final Budget
Budgeted Amounts (Budgetary Basis) PositiveOriginal Final (See Note 1) (Negative)
REVENUES:
Revenues from Local Sources:
Current Year's Taxes 506,556$ 506,556$ 526,011$ 19,455$
Prior Year's Taxes 15,000 15,000 22,859 7,859
Penalties and Interest on Local Taxes - - 8 8
Interest on Investments 1,000 1,000 1,791 791
Total Revenues 522,556 522,556 550,669 28,113
EXPENDITURES:
Other Uses:
#5110 Debt Service:
#610 Principal Redemption 490,000 490,000 490,000 -
#620 Interest Expense 71,556 71,556 71,556 -
Total Expenditures 561,556 561,556 561,556 -
Excess (Deficiency) of Revenues
Over Expenditures (39,000) (39,000) (10,887) 28,113
Fund Balance - July 1, 2015 39,000 39,000 44,781 (28,113)
Fund Balance - June 30, 2016 -$ -$ 33,894$ -$
AMITY SCHOOL DISTRICT NO. 4J
Schedule of Revenues, Expenditures, and
DEBT SERVICE FUND #300(A Major Fund)
For the Fiscal Year Ended June 30, 2016
Changes in Fund Balance - Budget and Actual
- 63 -

Actual Variance withAmounts Final Budget
Budgeted Amounts (Budgetary Basis) PositiveOriginal Final (See Note 1) (Negative)
REVENUES:
Revenues from Local Sources:
Services Provided Other Funds 600,000$ 600,000$ 706,416$ 106,416$
Interest Income 2,000 2,000 2,591 591
Total Revenues 602,000 602,000 709,007 107,007
EXPENDITURES:
Other Uses:
#5110 Debt Service:
#610 Principal Redemption 178,436 178,436 178,436 -
#620 Interest Expense 393,779 393,779 393,779 -
Total Expenditures 572,215 572,215 572,215 -
Excess (Deficiency) of Revenues
Over Expenditures 29,785 29,785 136,792 107,007
Fund Balance - July 1, 2015 428,561 428,561 445,084 16,523
Fund Balance - June 30, 2016 458,346$ 458,346$ 581,876$ 123,530$
For the Fiscal Year Ended June 30, 2016
AMITY SCHOOL DISTRICT NO. 4J
Schedule of Revenues, Expenditures, and
PERS BOND DEBT SERVICE FUND #302(A Major Fund)
Changes in Fund Balance - Budget and Actual
- 64 -

OTHER
SUPPLEMENTARY
INFORMATION
Capital Projects Funds
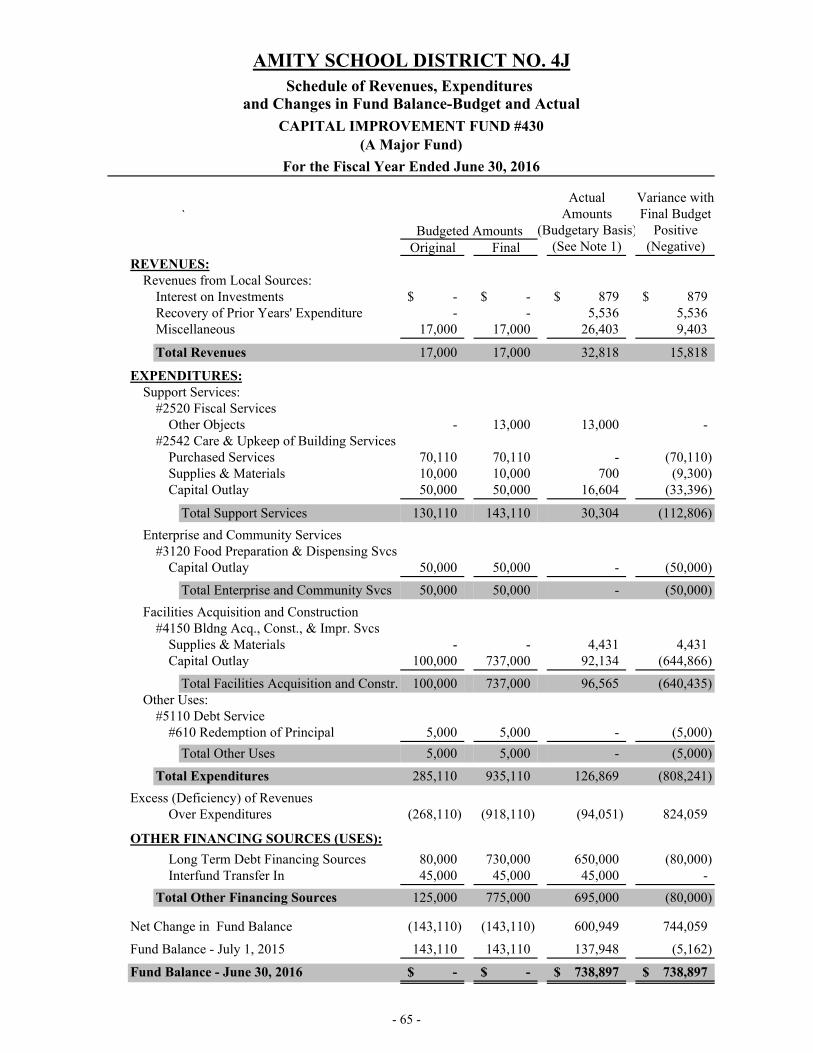
Actual Variance with` Amounts Final Budget
(Budgetary Basis) PositiveOriginal Final (See Note 1) (Negative)
REVENUES:Revenues from Local Sources:
Interest on Investments -$ -$ 879$ 879$ Recovery of Prior Years' Expenditure - - 5,536 5,536 Miscellaneous 17,000 17,000 26,403 9,403
Total Revenues 17,000 17,000 32,818 15,818
EXPENDITURES:Support Services:
#2520 Fiscal ServicesOther Objects - 13,000 13,000 -
#2542 Care & Upkeep of Building ServicesPurchased Services 70,110 70,110 - (70,110) Supplies & Materials 10,000 10,000 700 (9,300) Capital Outlay 50,000 50,000 16,604 (33,396)
Total Support Services 130,110 143,110 30,304 (112,806)
Enterprise and Community Services#3120 Food Preparation & Dispensing Svcs
Capital Outlay 50,000 50,000 - (50,000)
Total Enterprise and Community Svcs 50,000 50,000 - (50,000)
Facilities Acquisition and Construction#4150 Bldng Acq., Const., & Impr. Svcs
Supplies & Materials - - 4,431 4,431 Capital Outlay 100,000 737,000 92,134 (644,866)
Total Facilities Acquisition and Constr. 100,000 737,000 96,565 (640,435) Other Uses:
#5110 Debt Service#610 Redemption of Principal 5,000 5,000 - (5,000)
Total Other Uses 5,000 5,000 - (5,000)
Total Expenditures 285,110 935,110 126,869 (808,241)
Excess (Deficiency) of Revenues Over Expenditures (268,110) (918,110) (94,051) 824,059
OTHER FINANCING SOURCES (USES):
Long Term Debt Financing Sources 80,000 730,000 650,000 (80,000) Interfund Transfer In 45,000 45,000 45,000 -
Total Other Financing Sources 125,000 775,000 695,000 (80,000)
Net Change in Fund Balance (143,110) (143,110) 600,949 744,059
Fund Balance - July 1, 2015 143,110 143,110 137,948 (5,162)
Fund Balance - June 30, 2016 -$ -$ 738,897$ 738,897$
Budgeted Amounts
For the Fiscal Year Ended June 30, 2016
AMITY SCHOOL DISTRICT NO. 4JSchedule of Revenues, Expenditures
and Changes in Fund Balance-Budget and ActualCAPITAL IMPROVEMENT FUND #430
(A Major Fund)
- 65 -

OTHER
SUPPLEMENTARY
INFORMATION
Additional Supporting Schedules

Subject to Measure 5
Limits
Bond Levy Tax, Outside Measure 5
Limits Total
Yamhill County:Assessed Valuation, 2015-16 Tax Roll 286,790,275$ 286,790,275$ 286,790,275$ General Fund Permanent Rate Levy, Per One Thousand Dollars 4.7796 4.7796
General Obligation Bond Levy Rate, Per One Thousand Dollars 1.6345 1.6345
Amount Levy Rates Will Raise 1,370,743 468,759 1,839,502 Loss Due to Measure 5 Compression (40,662) - (40,662) Other Adjustments - 3,550 3,550
Net Tax Levy - Yamhill County 1,330,081$ 472,309$ 1,802,390$
Polk County:Assessed Valuation, 2015-16 Tax Roll 53,674,359$ 53,674,359$ 53,674,359$ General Fund Permanent Rate Levy, Per One Thousand Dollars 4.7796 4.7796
General Obligation Bond Levy Rate, Per One Thousand Dollars 1.6345 1.6345
Amount Levy Rates Will Raise 256,542 87,731 344,273 Loss Due to Measure 5 Compression (10,457) - (10,457)
Net Tax Levy - Polk County 246,085$ 87,731$ 333,816$
Tax Collector'sUncollected Adjustments Collections Uncollected
Balance Increase During BalanceTax Year July 1, 2015 (Decrease) the Year June 30, 2016
2015-16 2,136,205$ (84,454)$ 1,978,486$ 73,265$ 2014-15 82,459 18,978 59,590 41,847 2013-14 47,573 6,114 23,189 30,498 2012-13 31,093 6,034 17,498 19,629 2011-12 14,090 6,904 11,479 9,515 2010-11 11,298 (196) 993 10,109
2009-10 & Prior 18,955 (2,037) 1,731 15,187
Totals 2,341,673$ (48,657)$ 2,092,966 200,050$
Less 2014-15 Accrual (46,850) Add 2015-16 Accrual 33,768
Total Property Tax Revenues - Modified Accrual Method 2,079,884$
Modified Accrual (Budget Basis) Revenues by Fund: Current Prior Total
General Fund 1,475,770$ 55,244$ 1,531,014$ Debt Service Fund 526,011 22,859 548,870
Total Property Tax Revenues 2,001,781$ 78,103$ 2,079,884$
AMITY SCHOOL DISTRICT NO. 4J
SCHEDULE OF PROPERTY TAX TRANSACTIONS
For the Fiscal Year Ended June 30, 2016
- 66 -

Over/(Under)Expenditures Appropriations Appropriations
GENERAL FUND #100Instruction 4,871,945$ 5,037,448$ *** (165,503)$ Support Services 3,061,512 3,179,273 *** (117,761) Other Uses 164,261 174,262 ** (10,001) Contingency - 440,000 ** (440,000)
IDEA GRANT FUND #200Instruction 143,462 209,730 (66,268) Support Services 5,627 39,270 (33,643)
TITLE 1 FUND #201Instruction 119,696 169,450 (49,754) Support Services 47 30,000 (29,953) Enterprise and Community Services 535 550 (15)
FEDERAL MISCELLANEOUS GRANTS FUND #204Instruction - 161,000 (161,000) Support Services 29,048 105,000 (75,952)
STATE MISCELLANEOUS GRANTS FUND #205Instruction 4,206 50,000 (45,794) Support Services 1,207 109,000 (107,793)
COMMUNITY PROJECTS FUND #250Enterprise and Community Services 5,232 31,500 (26,268)
STUDENT BODY FUND #270Instruction 242,336 460,000 (217,664)
FOOD SERVICE FUND #280Enterprise and Community Services 286,518 414,800 (128,282) Other Uses - 40,000 (40,000)
VEHICLE REPLACEMENT FUND #292Support Services 12,606 27,134 (14,528) Other Uses 36,408 36,409 (1)
TECHNOLOGY REPLACEMENT FUND #293Instruction - 60,000 (60,000) Support Services 16,484 57,000 (40,516)
UNEMPLOYMENT FUND #298Support Services 216 125,720 (125,504)
SCHOLARSHIP FUND #299Purchased Services 4,700 18,000 (13,300) Contingency - 55,700 (55,700)
DEBT SERVICE FUND #300Other Uses 561,556 561,556 -
PERS BOND DEBT SERVICE FUND #302Other Uses 572,215 572,215 -
CAPITAL IMPROVEMENT FUND #430Support Services 30,304 143,110 (112,806) Enterprise and Community Services - 50,000 (50,000) Facilities Acquisition, Construction & Improvement 96,565 737,000 * (640,435) Other Uses - 5,000 (5,000)
TOTAL ALL FUNDS 10,266,686$ 13,100,127$ (2,833,441)$
RECAP:Original Budget Appropriation 12,440,127
* Resolution 2015-2016 (4) 650,000 ** Resolution 2015-2016 (9) 10,000
*** Resolution 2015-2016 (10) -
Total Budget Appropriations 13,100,127$
AMITY SCHOOL DISTRICT NO. 4JSCHEDULE OF FUND EXPENDITURES AND APPROPRIATIONS
For the Fiscal Year Ended June 30, 2016
- 67 -

Outstanding New Issues Principal Outstanding AmountBalance and and Balance Due Within
July 1, 2015 Matured Retired June 30, 2016 One Year
Principal 4,020,000$ -$ 490,000$ 3,530,000$ 520,000$ Interest - 71,556 71,556 - 62,834
Totals 4,020,000$ 71,556$ 561,556$ 3,530,000$ 582,834$
Principal 4,889,856$ -$ 178,436$ 4,711,420$ 179,167$ Interest - 393,779 393,779 - 423,048
Totals 4,889,856$ 393,779$ 572,215$ 4,711,420$ 602,215$
Principal 170,112$ -$ 32,496$ 137,616$ 33,243$ Interest - 3,912 3,912 - 3,165
Totals 170,112$ 3,912$ 36,408$ 137,616$ 36,408$
Principal 528,126$ -$ 69,261$ 458,865$ 69,261$ Interest - - - - -
Totals 528,126$ -$ 69,261$ 458,865$ 69,261$
Principal -$ 650,000$ -$ 650,000$ 43,334$ Interest - - - - -
Totals -$ 650,000$ -$ 650,000$ 43,334$
TOTAL DEBT AGREEMENTS:Principal 9,608,094$ 650,000$ 770,193$ 9,487,901$ 845,005$ Interest - 469,247 469,247 - 489,047
Totals 9,608,094$ 1,119,247$ 1,239,440$ 9,487,901$ 1,334,052$
Qualified Zone Academy Bond (QZAB), original balance of $650,000, dated April 6, 2016, for the purchase of equipment and improvments to real property. Held by Pacific Continental Bank. Deposit amounts of $43,334.00 per year required, with the first deposit being due April 6, 2017. Bond interest is computed at 0.00%.
AMITY SCHOOL DISTRICT NO. 4J
SCHEDULE OF LONG-TERM DEBT TRANSACTIONS
General Obligation Refunding Bond, Series 2015 for refunding of GO Refunding Bonds, Series 2005, dated March 19, 2015. The original balance of the 2015 refunding bonds was $4,076,000. Interest rate on the refunding bonds is fixed at 1.78%
Qualified Zone Academy Bond (QZAB), original balance of $1,290,000, dated February 1, 2004, for fundingqualified building improvements and equipment purchases. Interest costs are subsidized by the federal government.Annual payments of $69,261 are placed into a sinking fund maintained by a paying agent. Earnings of the sinkingfund reduce total payments made to retire bonds. The debt will be paid to bondholders at maturity in 2019 from thesinking fund. Reported outstanding balance at fiscal year end reflects total of original bond payable amount net ofdepostis made to date into sinking fund.
Oregon School Boards Association Limited Tax Pension Obligation Bonds Series 2004, held by Wells Fargo Bank Northwest, NA trustee. The original balance was $6,618,714 issued April 21, 2004. Fixed interest rates on the bonds vary from 1.5% to 6.27%.
For the Fiscal Year Ended June 30, 2016
Bus Leases with Sovereign Bank. Total Lease $237,820 for 3 busses purchased on October 15, 2013 with an interest rate of 2.30%.
- 68 -

Fiscal Year
Ending June 30, Total Principal Interest
Coupon Interest
Rate
GO Refunding Bond, Series 2015 2017 582,834$ 520,000$ 62,834$ 1.78%2018 598,578 545,000 53,578 1.78%
- Interest rate 1.78% 2019 618,877 575,000 43,877 1.78% - Dated March 19, 2015 2020 633,642 600,000 33,642 1.78%
2021 652,962 630,000 22,962 1.78%2022 671,748 660,000 11,748 1.78%
Totals 3,758,641$ 3,530,000$ 228,641$
OSBA Limited Tax Pension OB, 2017 602,215$ 179,167$ 423,048$ 5.83%Series 2004 2018 632,215 178,241 453,974 5.96% - Original Balance $6,618,714 2019 662,215 176,588 485,627 6.07%
2020 697,216 176,485 520,731 6.15% - Dated: April 21, 2004 2021 727,216 173,920 553,296 6.22%
2022 762,216 173,094 589,122 6.26%2023 802,215 173,925 628,290 6.27%2024 842,216 645,000 197,216 6.27%2025 881,028 720,000 161,028 5.68%2026 920,132 800,000 120,132 5.68%2027 964,692 890,000 74,692 5.68%2028 449,140 425,000 24,140 5.68%
Totals 8,942,716$ 4,711,420$ 4,231,296$
QZAB Original Balance $1,290,000 2019 1,012,953$ 1,012,953$ -$
Totals 1,012,953$ 1,012,953$ -$
QZAB held by Pacific Continental Bank 2017 43,334$ 43,334$ -$
- Original Balance $650,000 2018 43,334 43,334 -
- Interest rate 0.0% 2019 43,334 43,334 -
- Dated April 6, 2016 2020 43,334 43,334 -
- Required deposit of $43,334 per year 2021 43,334 43,334 -
2022 43,334 43,334 -
2023 43,334 43,334 -
2024 43,334 43,334 -
2025 43,334 43,334 -
2026 43,334 43,334 -
2027 43,334 43,334 -
2028 43,334 43,334 -
2029 43,334 43,334 -
2030 43,334 43,334 -
2031 43,324 43,324 -
Totals 650,000$ 650,000$ -$
2017 36,408$ 33,243$ 3,165$
- Original Balance $237,820 2018 36,408 34,007 2,401
- Interest rate 2.30% 2019 36,408 34,790 1,618
2020 36,408 35,576 832
Totals 145,632$ 137,616$ 8,016$
Total Future Requirements for Long-Term Debt 14,509,942$ 10,041,989$ 4,467,953$
- Dated: October 15, 2013
- Interest rate 1.5% - 6.27%
Bus Leases with Sovereign Bank
- Original Balance $4,076,000
AMITY SCHOOL DISTRICT NO. 4JSCHEDULE OF FUTURE REQUIREMENTS FOR
RETIREMENT OF LONG-TERM DEBT
For the Fiscal Year Ended June 30, 2016
- 69 -

ACCOMPANYING
INFORMATION


SINGLE AUDIT SECTION

(Receivable)/ (Receivable)/
Federal Original Deferred DeferredFederal Grantor/Pass Through Grantor/ CFDA Grant Program or Revenue Cash Revenue
Program Title Fund Number Period Grant Amount June 30, 2015 Received Expenditures June 30, 2016
Passed Through Oregon Department of Education:
Title 1-A Title 1 84.010A 2013-14 174,961$ (9,155)$ 9,155$ -$ -$ Title 1-A Title 1 84.010A 2014-15 157,674 (55,259) 80,062 24,803 - Title 1-A Title 1 84.010A 2015-16 134,007 - 54,173 95,475 (41,302) Total Title 1 466,642 (64,414) 143,390 120,278 (41,302)
Title 2-A Improving Teacher Quality Federal Misc. 84.367 2015-16 34,365 - 14,576 27,358 (12,782) Title 2-A Improving Teacher Quality Federal Misc. 84.367 2014-15 35,006 (2,105) 2,729 624 - Total Title 2A - Improving Teacher Quality 69,371 (2,105) 17,305 27,982 (12,782)
IDEA - Special Education Grants to States IDEA Grant 84.027A 2015-16 146,411 - 9,152 58,637 (49,485) IDEA - Special Education Grants to States IDEA Grant 84.027A 2014-15 151,369 (39,721) 116,253 76,532 - IDEA - Enhancement & Extended Assessment Training IDEA Grant 84.027 2015-16 651 - 500 651 (151) IDEA - Enhancement & Extended Assessment Training IDEA Grant 84.027 2014-15 1,591 - 346 346 - IDEA, Special Education- Preschool Grants-15/16 IDEA Grant 84.173 2015-16 1,224 - 392 1,224 (832) IDEA, Special Education-Preschool Grants-14/15 IDEA Grant 84.173 2014-15 3,672 - 3,672 3,672 - IDEA - SPR&I IDEA Grant 84.027 2014-15 728 (276) 276 - - IDEA - SPR&I IDEA Grant 84.027 2015-16 1,625 - 1,625 1,625 - Post School Outcomes State Grant 84.027 2015-16 85 - - 85 (85) Special Education - State Personnel Development IDEA Grant 84.323 2015-16 6,743 - 1,092 5,849 (4,757) Special Education - State Personnel Development IDEA Grant 84.323 2014-15 12,392 (5,839) 6,392 553 - Total IDEA 326,491 (45,836) 139,700 149,174 (55,310)
Passed through Education Service District:Education for Homeless Children and Youth Federal Misc. 84.196 2015-16 1,066 - 374 1,066 (692) Education for Homeless Children and Youth Federal Misc. 84.196 2014-15 - - Total Education for Homeless Children and Youth 1,066 - 374 1,066 (692)
Total U.S. Department of Education 863,570$ (112,355)$ 300,769$ 298,500$ (110,086)$
U.S. DEPARTMENT OF AGRICULTURE
Passed Through Oregon Department of Education:
Commodities * Food Service 10.550 2015-16 19,085$ -$ 19,085$ 19,085$ -$ National School Lunch - Breakfast * Food Service 10.553 2015-16 51,163 - 51,163 51,163 - National School Lunch - Breakfast * Food Service 10.553 2014-15 53,087 (237) 237 - - National School Lunch - Section 4 * Food Service 10.555 2015-16 120,705 - 120,705 133,288 (12,583) National School Lunch - Section 4 * Food Service 10.555 2014-15 - - Total National School Lunch Program * 244,040 (237) 191,190 203,536 (12,583)
Passed Through Yamhill County:
Federal Forest Fees General 10.665 2015-16 5 - 5 5 -
Total U.S. Department of Agriculture 244,045 (237) 191,195 203,541 (12,583)
TOTALS 1,107,615$ (112,592)$ 491,964$ 502,041$ (122,669)$
RECONCILIATION TO REVENUE:Cash Receipts per Schedule Above 491,964$ Grants Receivable/Deferred Revenue Beginning of Year (112,592) Grants Receivable/Deferred Revenue End of Year 122,669
Federal Revenue Recognized per Financial Statements 502,041$
* major program
This schedule is prepared using the modifed accrual basis of accounting
AMITY SCHOOL DISTRICT NO. 4JSCHEDULE OF EXPENDITURES OF FEDERAL AWARDS
Fiscal Year Ended June 30, 2016
- 71 -


AMITY SCHOOL DISTRICT NO. 4J
SCHEDULE OF FINDINGS AND QUESTIONED COSTS
June 30, 2016
- 75 -
Section I—Summary of Auditor’s Results
1. The auditor’s report expresses an unqualified opinion on the financial statements of Amity School District No. 4J.
2. No material weaknesses or reportable conditions related to the financial statement audit were
identified which are required to be reported in accordance with Government Auditing Standards.
3. No instances of noncompliance material to the financial statements of Amity School District No. 4J were disclosed during the audit.
4. No significant deficiencies in internal control were disclosed by the audit of the financial statements.
5. No material weaknesses or significant deficiencies in internal controls over major programs were disclosed by the audit.
6. The auditor’s report on compliance for the major federal award program expresses an unqualified opinion.
7. The audit did not disclose any findings that are required to be reported.
8. The program tested as a major program was the National School Lunch cluster, CFDA Number(s) 10.550, 10.553 and 10.555.
9. The threshold for distinguishing between Type A and B programs was $300,000.
10. The District was determined to be a low-risk auditee.
Section II—Financial Statements Findings
No findings related to the financial statements are reported for the year ended June 30, 2016. Section III—Findings and Questioned Costs for Federal Awards.
No matters were reported relating to significant deficiencies, material weaknesses, or instances of noncompliance related to the financial statements that are required to be reported in accordance with paragraphs 5.18 through 5.20 of Government Auditing Standards.
Section IV—Summary Schedule of Prior Audit Findings
There were no findings or questioned costs for the year ended June 30, 2015.

Parts A is needed for computing Oregon's full allocation for ESEA, Title 1 & other Federal Funds for Educatio
A. Energy Bills for Heating - All Funds:
Please enter your expenditures for electricity Function 2540& heating fuel for these Functions & Objects. Function 2550
B. Replacement of Equipment - General Fund:Include all General Fund expenditures in Object 542, except for the following exclusions:
Exclude these functions: Exclude these functions:
1113,1122 & 1132 Extra-curricular Activities 4150 Construction
1140 Pre-Kindergarten 2550 Pupil Transportation
1300 Continuing Education 3100 Food Service
1400 Summer School 3300 Community Services
AMITY SCHOOL DISTRICT NO. 4J
Oregon Department of Education Form 581-3211-C
For the Fiscal Year Ended June 30, 2016
-$
-$
125,438$
SUPPLEMENTAL INFORMATION, 2015-2016
Objects 325 & 326
- 76 -