financial statements 2014 - olvigroup.fi of directors‘ report 3 ... olvi group‘s overall...
TRANSCRIPT

FINANCIAL STATEMENTS
2014

Olvi plc – Financial Statements 2014
2 | page
Table of Contents
Board of Directors‘ Report
3 – 13
Consolidated Financial Statements 2014 (IFRS)
Consolidated Income Statement
14
Consolidated Balance Sheet
15
Consolidated Cash Flow Statement
16
Changes in Consolidated Shareholders‘ Equity 17
Consolidated Accounting Policies
18 – 33
Notes to the Consolidated Financial Statements
34 – 54
Consolidated Financial Ratios 2012 to 2014
55
Per-share Ratios
55
Parent Company‘s Financial Statements 2014 (FAS)
Parent Company‘s Income Statement
56
Parent Company‘s Balance Sheet
57
Parent Company‘s Cash Flow Statement
58
Parent Company‘s Accounting Policies
59
Notes to the Parent Company‘s Financial Statements
60 – 66
Shares and Shareholders
67 – 68
Parent Company‘s Financial Ratios 2012 to 2014
69
Per-share Ratios
69
Calculation of Financial Ratios
70
Board of Directors‘ Proposal for the Distribution of
Profit
71
Date and Signatures
71
Auditor‘s Note
71
Olvi plc‘s Board of Directors
72

Olvi plc – Financial Statements 2014
3 | page
FINANCIAL STATEMENTS 2014
BOARD OF DIRECTORS‘ REPORT THE YEAR IN BRIEF
Olvi Group‘s overall performance remained
on a healthy level in 2014.
Full year 2014:
Olvi Group‘s sales volume increased by 3.5 percent to 576.5 (557.2) million litres
The Group‘s net sales increased slightly and totalled 328.2 (327.3) million euro
The Group‘s reported operating profit de-
clined slightly, amounting to 41.0 (43.2) million euro
Olvi Group‘s earnings per share stood at 1.57 (1.61) euro per share
The equity ratio remained good at 57.9 (58.0) percent
CONSOLIDATED KEY RATIOS
1-12/ 2014
1-12/ 2013
Sales volume, Mltr 576.5 557.2
Net sales, MEUR 328.2 327.3
EBITDA, MEUR 55.9 56.8
Operating profit, MEUR 41.0 43.2
% of net sales 12.5 13.2
Net profit for the
period 33.1 34.2
% of net sales 10.1 10.4
Earnings per share,
EUR 1.57 1.61
Gross capital expenditure, MEUR
41.6 35.7
Equity per share, EUR 9.17 8.14
Equity to total assets, %
57.9 58.0
Gearing, % 29.8 26.4
BUSINESS DEVELOPMENT
Olvi Group‘s performance in 2014 can be
considered quite good, taking into account
the decline of the overall market.
We were able to increase our sales volume
and net sales, and our market position
strengthened in the main market areas. Op-
erating profit fell slightly short of the previ-
ous year.
The Baltic states performed well in their
business during 2014, and the same is true
of Belarus in spite of the devaluation of the
local rouble. By contrast, we faced challenges
in Finland.
The business environment in Finland changed
substantially during 2014. Weakened con-
sumer purchasing power and changes in pur-
chasing patterns, tax hikes effective as of the
beginning of 2014, as well as price competi-
tion and increased private imports hampered
the parent company‘s profitability.
Olvi initiated reorganisation of the Finnish
operations in November with the aim of re-
sponding to changes in the operating envi-
ronment and ensuring our competitive ability
in the long term.
However, many positive things were seen
during the year also in Finland. According to
an extensive study of beer brands commis-
sioned by the Markkinointi&Mainonta trade
journal from the Taloustutkimus research
agency (10/2014), Sandels and OLVI were
regarded the most appreciated brands of
beer in Finland.
In a challenging business environment, Olvi
was successful in increasing its domestic
sales volume and strengthening its market
position.

Olvi plc – Financial Statements 2014
4 | page
However, domestic growth was insufficient to
replace the gap in exports to Russia after ex-
traordinarily good development in 2013.
Overall development of the Baltic operations
continued strong. Lithuania was able to clear-
ly improve its performance, and profitability
in Estonia was at a very good level. The situ-
ation in Latvia has been more challenging
compared to the other units in the Baltic
states due to diminished intra-Group sales
and the weakened overall market situation.
In Belarus, the sales volume, net sales and
operating profit increased on the year 2013.
The currency devaluation trend that started
late in the year imposes uncertainty on the
Belarusian operations. This had its impact on
the net sales and earnings for 2014. A posi-
tive opportunity worth mentioning is the co-
operation agreement signed by our Belarus-
ian subsidiary OAO Lidskoe Pivo with
PepsiCo, Inc., the second-largest soft drinks
company in the world, with regard to the
Belarusian market.
Olvi continued on a track of intensive in-
vestments in 2014. The logistics investment
in Finland proceeded according to plan and
will provide for more efficient operations dur-
ing the 2015 high season.
A canning line was introduced in Lithuania
during 2014, and this has contributed to the
growth and performance improvements in
Lithuania. Investments to further increase
production capacity are underway in Belarus.
The investments in progress will be complet-
ed during the 2015 summer season.
OLVI GROUP’S AND ITS GEOGRAPHICAL
SEGMENTS’ SALES VOLUME, NET SALES
AND EARNINGS IN 2014
Sales development
Olvi Group‘s sales volume in 2014 made an
all-time high of 576.5 (557.2) million litres.
This represents an increase of 19.3 million li-
tres or 3.5 percent.
The strongest growth was seen in Belarus
(increase 13.4 million litres) and in Lithuania
(increase 11.5 million litres). Sales volume
increased also in the Estonian unit. Latvia fell
short of the previous year mostly due to a
decline in intra-Group sales.
The sales volume in Finland increased by 2.7
million litres but exports included in the fig-
ures for the Finnish business area declined by
10.8 million litres.
Sales volume,
million litres
1-12/
2014
1-12/
2013
Finland (Olvi plc) 151.8 159.9
Estonia (AS A. Le Coq) 131.6 129.3
Latvia (A/S Cēsu Alus) 76.1 79.7
Lithuania
(AB Volfas Engelman) 81.1 69.6
Belarus
(OAO Lidskoe Pivo) 169.9 156.5
Eliminations -34.0 -37.8
Total 576.5 557.2
The Group‘s net sales in 2014 amounted to
328.2 (327.3) million euro. In 2014, net
sales increased in Belarus by 10.5 million eu-
ro, in Lithuania by 4.3 million euro and in Es-
tonia by 1.2 million euro. By contrast, net
sales for the Finnish business area declined
due to diminished exports included in the
Finnish figures as well as domestic price
competition.
Net sales,
million euro
1-12/
2014
1-12/
2013
Finland (Olvi plc) 107.7 123.6
Estonia (AS A. Le Coq) 82.5 81.3
Latvia (A/S Cēsu Alus) 34.9 37.6
Lithuania
(AB Volfas Engelman) 38.4 34.1
Belarus
(OAO Lidskoe Pivo) 78.8 68.3
Eliminations -14.0 -17.6
Total 328.2 327.3
Earnings development
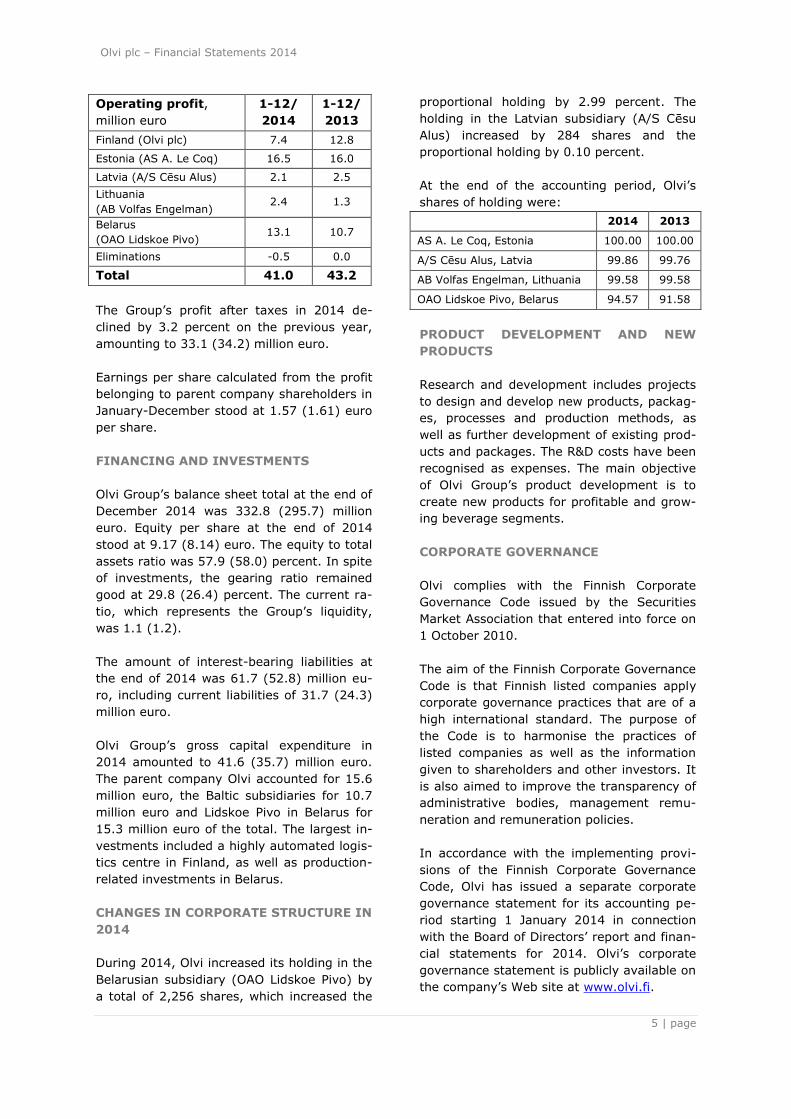
The Group‘s operating profit for January-
December declined slightly and amounted to
41.0 (43.2) million euro, or 12.6 (13.2) per-
cent of net sales. Performance in Belarus im-
proved by 2.4 million euro, in Lithuania by
1.1 million euro and in Estonia by 0.5 million
euro. Performance in Finland and Latvia
weakened on the previous year.
Olvi plc – Financial Statements 2014
5 | page
Operating profit,
million euro
1-12/
2014
1-12/
2013
Finland (Olvi plc) 7.4 12.8
Estonia (AS A. Le Coq) 16.5 16.0
Latvia (A/S Cēsu Alus) 2.1 2.5
Lithuania
(AB Volfas Engelman) 2.4 1.3
Belarus
(OAO Lidskoe Pivo) 13.1 10.7
Eliminations -0.5 0.0
Total 41.0 43.2
The Group‘s profit after taxes in 2014 de-
clined by 3.2 percent on the previous year,
amounting to 33.1 (34.2) million euro.
Earnings per share calculated from the profit
belonging to parent company shareholders in
January-December stood at 1.57 (1.61) euro
per share.
FINANCING AND INVESTMENTS
Olvi Group‘s balance sheet total at the end of
December 2014 was 332.8 (295.7) million
euro. Equity per share at the end of 2014
stood at 9.17 (8.14) euro. The equity to total
assets ratio was 57.9 (58.0) percent. In spite
of investments, the gearing ratio remained
good at 29.8 (26.4) percent. The current ra-
tio, which represents the Group‘s liquidity,
was 1.1 (1.2).
The amount of interest-bearing liabilities at
the end of 2014 was 61.7 (52.8) million eu-
ro, including current liabilities of 31.7 (24.3)
million euro.
Olvi Group‘s gross capital expenditure in
2014 amounted to 41.6 (35.7) million euro.
The parent company Olvi accounted for 15.6
million euro, the Baltic subsidiaries for 10.7
million euro and Lidskoe Pivo in Belarus for
15.3 million euro of the total. The largest in-
vestments included a highly automated logis-
tics centre in Finland, as well as production-
related investments in Belarus.
CHANGES IN CORPORATE STRUCTURE IN
2014
During 2014, Olvi increased its holding in the
Belarusian subsidiary (OAO Lidskoe Pivo) by
a total of 2,256 shares, which increased the
proportional holding by 2.99 percent. The
holding in the Latvian subsidiary (A/S Cēsu
Alus) increased by 284 shares and the
proportional holding by 0.10 percent.
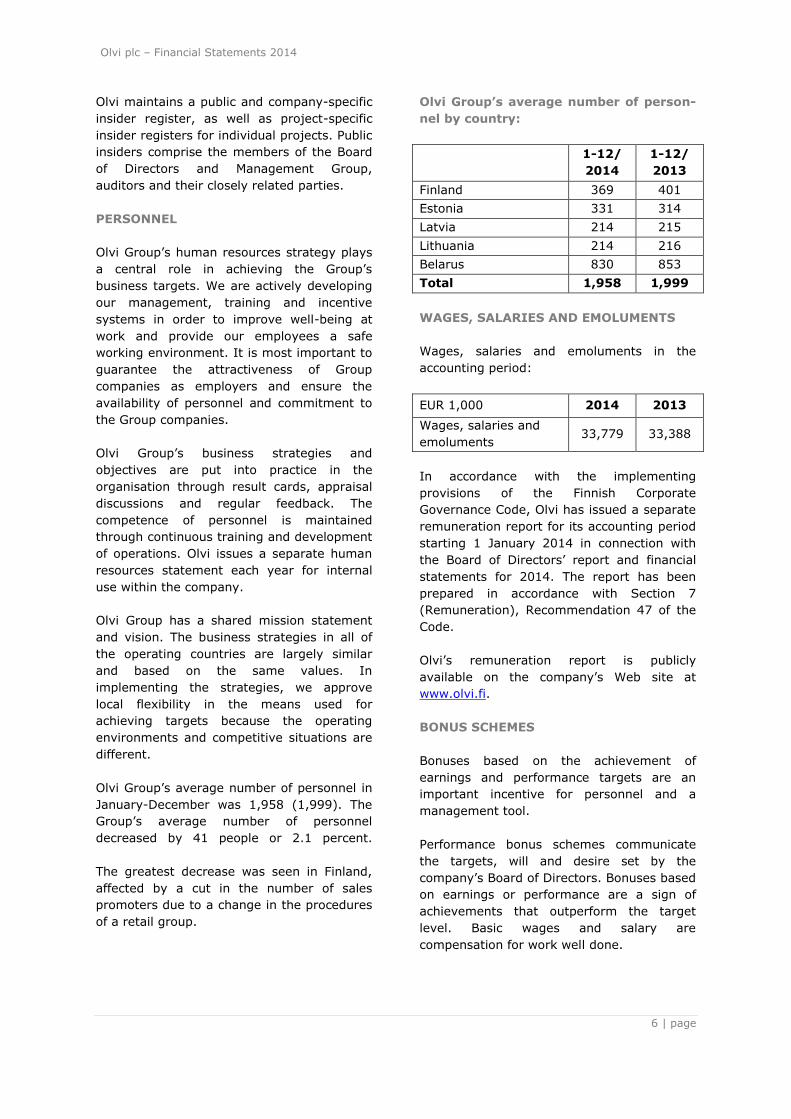
At the end of the accounting period, Olvi‘s
shares of holding were:
2014 2013
AS A. Le Coq, Estonia 100.00 100.00
A/S Cēsu Alus, Latvia 99.86 99.76
AB Volfas Engelman, Lithuania 99.58 99.58
OAO Lidskoe Pivo, Belarus 94.57 91.58
PRODUCT DEVELOPMENT AND NEW
PRODUCTS
Research and development includes projects
to design and develop new products, packag-
es, processes and production methods, as
well as further development of existing prod-
ucts and packages. The R&D costs have been
recognised as expenses. The main objective
of Olvi Group‘s product development is to
create new products for profitable and grow-
ing beverage segments.
CORPORATE GOVERNANCE
Olvi complies with the Finnish Corporate
Governance Code issued by the Securities
Market Association that entered into force on
1 October 2010.
The aim of the Finnish Corporate Governance
Code is that Finnish listed companies apply
corporate governance practices that are of a
high international standard. The purpose of
the Code is to harmonise the practices of
listed companies as well as the information
given to shareholders and other investors. It
is also aimed to improve the transparency of
administrative bodies, management remu-
neration and remuneration policies.
In accordance with the implementing provi-
sions of the Finnish Corporate Governance
Code, Olvi has issued a separate corporate
governance statement for its accounting pe-
riod starting 1 January 2014 in connection
with the Board of Directors‘ report and finan-
cial statements for 2014. Olvi‘s corporate
governance statement is publicly available on
the company‘s Web site at www.olvi.fi.
Olvi plc – Financial Statements 2014
6 | page
Olvi maintains a public and company-specific
insider register, as well as project-specific
insider registers for individual projects. Public
insiders comprise the members of the Board
of Directors and Management Group,
auditors and their closely related parties.
PERSONNEL
Olvi Group‘s human resources strategy plays
a central role in achieving the Group‘s
business targets. We are actively developing
our management, training and incentive
systems in order to improve well-being at
work and provide our employees a safe
working environment. It is most important to
guarantee the attractiveness of Group
companies as employers and ensure the
availability of personnel and commitment to
the Group companies.
Olvi Group‘s business strategies and
objectives are put into practice in the
organisation through result cards, appraisal
discussions and regular feedback. The
competence of personnel is maintained
through continuous training and development
of operations. Olvi issues a separate human
resources statement each year for internal
use within the company.
Olvi Group has a shared mission statement
and vision. The business strategies in all of
the operating countries are largely similar
and based on the same values. In
implementing the strategies, we approve
local flexibility in the means used for
achieving targets because the operating
environments and competitive situations are
different.
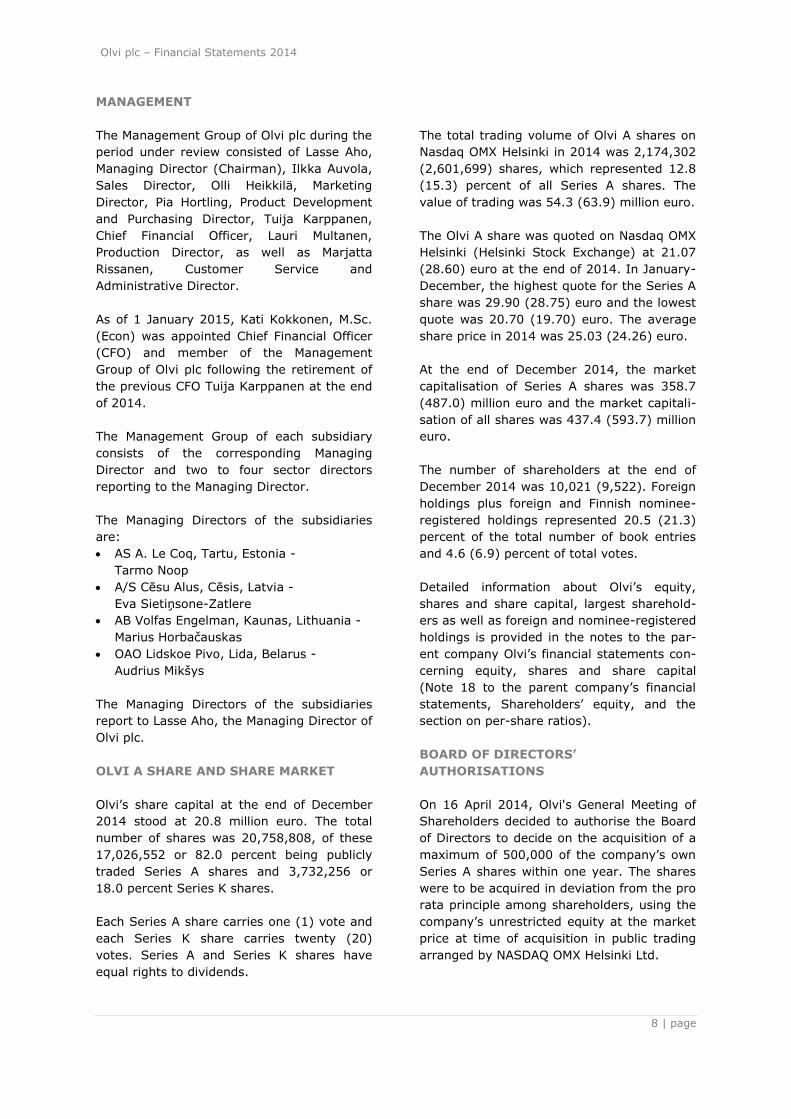
Olvi Group‘s average number of personnel in
January-December was 1,958 (1,999). The
Group‘s average number of personnel
decreased by 41 people or 2.1 percent.
The greatest decrease was seen in Finland,
affected by a cut in the number of sales
promoters due to a change in the procedures
of a retail group.
Olvi Group’s average number of person-
nel by country:
1-12/
2014
1-12/
2013
Finland 369 401
Estonia 331 314
Latvia 214 215
Lithuania 214 216
Belarus 830 853
Total 1,958 1,999
WAGES, SALARIES AND EMOLUMENTS
Wages, salaries and emoluments in the
accounting period:
EUR 1,000 2014 2013
Wages, salaries and
emoluments 33,779 33,388
In accordance with the implementing
provisions of the Finnish Corporate
Governance Code, Olvi has issued a separate
remuneration report for its accounting period
starting 1 January 2014 in connection with
the Board of Directors‘ report and financial
statements for 2014. The report has been
prepared in accordance with Section 7
(Remuneration), Recommendation 47 of the
Code.
Olvi‘s remuneration report is publicly
available on the company‘s Web site at
www.olvi.fi.
BONUS SCHEMES
Bonuses based on the achievement of
earnings and performance targets are an
important incentive for personnel and a
management tool.
Performance bonus schemes communicate
the targets, will and desire set by the
company‘s Board of Directors. Bonuses based
on earnings or performance are a sign of
achievements that outperform the target
level. Basic wages and salary are
compensation for work well done.

Olvi plc – Financial Statements 2014
7 | page
The overall objectives of bonuses based on
target-setting include clarity, fairness and
sufficient effect. Bonus schemes must not
encourage imprudent risk-taking or
negligence.
The objectives for long-term bonuses in
particular include increasing shareholder
value, supporting profitable growth and
relative profitability, and making operational
management and key employees committed
to the company.
Components of remuneration to
personnel
The components of remuneration to
personnel are as follows:
a) Fixed remuneration
Olvi‘s Board of Directors decides on the
terms of service of the Managing Director,
which are specified in a written directors‘
contract. The Board of Directors assesses the
Managing Director‘s performance annually.
The terms of service of other top
management shall be decided by the Board
of Directors on the basis of the Managing
Director‘s proposal. The Managing Director
and other management executives shall not
receive separate remuneration for their work
in the management group or other internal
management organs within the Group.
b) Short-term incentives
Short-term incentives are performance bonus
schemes in which the monitoring period is
one accounting period. The Board of
Directors shall decide upon the basis for
definition of the incentives. In 2014, the
basis for definition of the performance bonus
was operating profit. The entire personnel of
Olvi is included in the scope of performance
bonuses, while in other Group companies,
the scope includes the management group
members.
Furthermore, Olvi Group‘s subsidiaries have
incentive schemes that cover either the
entire personnel or the company‘s key
employees and are based on the
achievement of targets specified in
performance cards.
c) Long-term incentives
Long-term incentives are based on
programmes confirmed by the company‘s
Board of Directors that are valid for at least
two accounting periods. The programmes can
be share-based incentive schemes or
performance bonus schemes based on
Group-level targets.
On 29 April 2014, Olvi plc‘s Board of
Directors decided on a new share-based
incentive plan for the Group‘s key personnel.
The aim of the new plan is to combine the
objectives of the shareholders and the key
employees in order to increase the value of
the company, to commit the key employees
to the company, and to offer them a
competitive reward plan based on earning
the company‘s shares.
The share-based incentive plan is described
in more detail in Note 22 to the financial
statements, Share-based payments.
Personnel fund
Olvi has an operational personnel fund that
covers Olvi‘s entire personnel excluding top
management.
The basis of making profit-sharing
contributions to the personnel fund shall be
decided annually by the company‘s Board of
Directors.
MANAGEMENT AND AUDITORS
The Chairman of the Board of Olvi plc is
Heikki Hortling, M.Sc. (Econ), and the Vice
Chairman is Esa Lager, M.Sc. (Econ), LL.M.
Other members of the Board of Directors
include Heikki Sinnemaa, LL.M., Jaakko
Autere, M.Sc. (Econ) and Tarja Pääkkönen,
Dr.Tech.
During the period under review, the
company‘s auditor was the authorised public
accounting firm PricewaterhouseCoopers Oy,
with Sami Posti, Authorised Public
Accountant, as auditor in charge.
Olvi plc – Financial Statements 2014
8 | page
MANAGEMENT
The Management Group of Olvi plc during the
period under review consisted of Lasse Aho,
Managing Director (Chairman), Ilkka Auvola,
Sales Director, Olli Heikkilä, Marketing
Director, Pia Hortling, Product Development
and Purchasing Director, Tuija Karppanen,
Chief Financial Officer, Lauri Multanen,
Production Director, as well as Marjatta
Rissanen, Customer Service and
Administrative Director.
As of 1 January 2015, Kati Kokkonen, M.Sc.
(Econ) was appointed Chief Financial Officer
(CFO) and member of the Management
Group of Olvi plc following the retirement of
the previous CFO Tuija Karppanen at the end
of 2014.
The Management Group of each subsidiary
consists of the corresponding Managing
Director and two to four sector directors
reporting to the Managing Director.
The Managing Directors of the subsidiaries
are:
AS A. Le Coq, Tartu, Estonia -
Tarmo Noop
A/S Cēsu Alus, Cēsis, Latvia -
Eva Sietiņsone-Zatlere
AB Volfas Engelman, Kaunas, Lithuania -
Marius Horbačauskas
OAO Lidskoe Pivo, Lida, Belarus -
Audrius Mikšys
The Managing Directors of the subsidiaries
report to Lasse Aho, the Managing Director of
Olvi plc.
OLVI A SHARE AND SHARE MARKET
Olvi‘s share capital at the end of December
2014 stood at 20.8 million euro. The total
number of shares was 20,758,808, of these
17,026,552 or 82.0 percent being publicly
traded Series A shares and 3,732,256 or
18.0 percent Series K shares.
Each Series A share carries one (1) vote and
each Series K share carries twenty (20)
votes. Series A and Series K shares have
equal rights to dividends.
The total trading volume of Olvi A shares on
Nasdaq OMX Helsinki in 2014 was 2,174,302
(2,601,699) shares, which represented 12.8
(15.3) percent of all Series A shares. The
value of trading was 54.3 (63.9) million euro.
The Olvi A share was quoted on Nasdaq OMX
Helsinki (Helsinki Stock Exchange) at 21.07
(28.60) euro at the end of 2014. In January-
December, the highest quote for the Series A
share was 29.90 (28.75) euro and the lowest
quote was 20.70 (19.70) euro. The average
share price in 2014 was 25.03 (24.26) euro.
At the end of December 2014, the market
capitalisation of Series A shares was 358.7
(487.0) million euro and the market capitali-
sation of all shares was 437.4 (593.7) million
euro.
The number of shareholders at the end of
December 2014 was 10,021 (9,522). Foreign
holdings plus foreign and Finnish nominee-
registered holdings represented 20.5 (21.3)
percent of the total number of book entries
and 4.6 (6.9) percent of total votes.
Detailed information about Olvi‘s equity,
shares and share capital, largest sharehold-
ers as well as foreign and nominee-registered
holdings is provided in the notes to the par-
ent company Olvi‘s financial statements con-
cerning equity, shares and share capital
(Note 18 to the parent company‘s financial
statements, Shareholders‘ equity, and the
section on per-share ratios).
BOARD OF DIRECTORS’
AUTHORISATIONS
On 16 April 2014, Olvi's General Meeting of
Shareholders decided to authorise the Board
of Directors to decide on the acquisition of a
maximum of 500,000 of the company‘s own
Series A shares within one year. The shares
were to be acquired in deviation from the pro
rata principle among shareholders, using the
company‘s unrestricted equity at the market
price at time of acquisition in public trading
arranged by NASDAQ OMX Helsinki Ltd.

Olvi plc – Financial Statements 2014
9 | page
The Annual General Meeting also decided to
authorise the Board of Directors to decide on
the issue of a maximum of 1,000,000 new
Series A shares and the transfer of a
maximum of 500,000 Series A shares held as
treasury shares (―Issue authorisation‖).
The new shares were to be issued and the
treasury shares transferred in one or more
lots either against payment or free of charge.
The new shares were to be issued and the
treasury shares transferred to the company‘s
shareholders on a pro rata basis in relation to
their existing holdings, or a private placing
could have been executed in deviation from
shareholders‘ pre-emptive rights if a weighty
economic reason for this existed from the
company‘s viewpoint, such as financing or
execution of corporate acquisitions or ar-
rangements, development of the company‘s
equity structure, improvement of share li-
quidity or implementation of the company‘s
incentive schemes. A private placing can be
free of charge only if a particularly weighty
economic reason for this exists from the
company‘s viewpoint, taking into considera-
tion the interests of all shareholders. The
Board of Directors would have decided upon
other matters related to share issues.
It was proposed that the issue authorisation
would be valid until the closing of the Annual
General Meeting 2015, however no longer
than 18 months from the General Meeting‘s
decision of issue authorisation.
The Board of Directors did not exercise the
authorisations granted by the General
Meeting during 2014.
TREASURY SHARES
There were no changes in the number of
treasury shares held by Olvi in January-
September 2014. At the end of the reporting
period, Olvi held 1,124 Series A shares as
treasury shares. Treasury shares held by the
company itself are ineligible for voting.
Series A shares held by the company as
treasury shares represented 0.005 percent of
the share capital and 0.001 percent of the
aggregate number of votes. The treasury
shares represented 0.007 percent of all
Series A shares and associated votes.
FLAGGING NOTICES
During 2014, Olvi has not received any
flagging notices in accordance with Chapter
2, Section 10 of the Securities Markets Act.
ENVIRONMENTAL ISSUES
In accordance with its environmental policy,
Olvi is strongly committed to procedures and
methods that spare the environment, as well
as all laws and recommendations related to
its business. The objectives for Olvi's envi-
ronmental policy are defined annually and
realised as objectives on the performance
cards. The achievement of environmental
targets and related indicators are regularly
monitored by top management and designat-
ed representatives.
Olvi Group’s environmental principles:
We favour efficient reuse and recycling
of packages.
We route by-products and production
waste to recovery.
In the development of products and pro-
cedures, we are committed to the effi-
cient use of raw materials and energy,
as well as the reduction of environmen-
tal impacts.
Olvi endeavours to spare clean water,
purify water for reuse, and to prevent
the release of substances that cause en-
vironmental load (such as phosphorus
and biological oxygen consumers) into
waste water.
We aim to increase the use of renewable
energy sources whenever technically
and economically possible.
We favour co-operation partners that
show environmental responsibility.
We openly disclose information on our
operations and the environmental im-
pacts of our products.
We encourage our personnel to take re-
sponsibility and show innovation also
with regard to their work environment
and environmental impacts.

Olvi plc – Financial Statements 2014
10 | page
Handling of waste and emissions from
production, packaging and transports
The by-products mash and excess yeast
are delivered to cattle farms for use as
animal feed.
Raw materials and chemicals are trans-
ported to the brewery in tanks and recy-
clable packages.
Packaging waste from production, as well
as hazardous waste, is sorted at our own
waste processing centre and delivered for
recycling.
Olvi‘s products are packaged exclusively
in refillable or recyclable packages. Olvi
belongs to the national bottle recycling
scheme.
Wastewater is routed to the process of the
local municipal wastewater treatment
plant through an equalising tank that re-
duces biological oxygen-consuming load
and a bio-filter.
Most of the production facility‘s heat re-
quirement is produced by district heating
supplemented by the production of a
steam facility. This, as well as the
transport of goods, generates flue gas
emissions, and the fermentation process
at the brewery releases carbon dioxide.
The wort-boiling process releases a harm-
less bread-like sweet smell to the vicinity.
Olvi‘s environmental measures and objec-
tives are described in more detail on the cor-
porate Web site at www.olvi.fi.
In 2009, Olvi joined a voluntary energy effi-
ciency agreement system administered by
the Finnish Food and Drink Industries‘ Feder-
ation and based on the EU Energy Services
Directive. The system is valid until the end of
2016 and replaces the energy-saving agree-
ment that expired at the end of 2007. The
system involves agreement on a framework
for continuous and systematic improvements
in energy efficiency. This shows that Olvi is a
serious player in our society‘s joint effort
against climate change.
Olvi‘s environmental permit was granted on
30 September 2003 and has been valid until
further notice.
An application to update the environmental
permit has been submitted at the end of
2014. An official decision regarding the ap-
proval of the update is expected during 2015.
Olvi Group companies have not been
involved in any legal or administrative
proceedings related to environmental issues,
and the company is not aware of any
environmental risks that would have a
significant effect on Olvi Group‘s financial
position.
BUSINESS RISKS AND THEIR
MANAGEMENT
Risk management is a part of Olvi Group‘s
everyday management and operations. The
objective of risk management is to ensure
the realisation of the company‘s strategy and
secure its financial development and the con-
tinuity of business. The task of risk manage-
ment is to operate proactively and create op-
erating conditions in which business risks are
managed comprehensively and systematical-
ly in all of the Group companies and all levels
of the organisation.
Strategic risks
Olvi Group‘s strategic risks refer to risks re-
lated to the characteristics of the company‘s
business and strategic choices. The Group‘s
operations are located in several countries
that differ substantially in terms of their so-
cial and economic situations and the phases
and directions of development. For example,
strategic risks relate to changes in tax legis-
lation and other regulations, the environment
and foreign exchange markets. If realised,
strategic risks can substantially hamper the
company‘s operational preconditions. The
Group‘s most substantial identified strategic
risks relate to Belarus, particularly the situa-
tion in the country‘s economy and politics.
Olvi plc – Financial Statements 2014
11 | page
Operational risks
The Group‘s most substantial identified oper-
ational risks relate to the procurement and
quality of raw materials, the production pro-
cess, markets and customers, personnel, in-
formation security and systems, as well as
changes in foreign exchange rates.
Raw materials
General economic development and annual
fluctuations in crop yield affect the prices and
availability of major raw materials used with-
in Olvi Group. Disruptions in raw material de-
liveries and quality may hamper customer re-
lations and business operations. Purchases of
major raw materials are made under pro-
curement contracts standardised at the
Group level. The Group aims to secure the
predictability of purchase prices for critical
raw materials through long-term procure-
ment contracts. The company has a hedging
policy concerning raw materials and their
prices. All units emphasise the significance of
the quality of raw materials and other pro-
duction factors in the overall production
chain.
Production process
The aim is to minimise production risks
through clear documentation of processes,
increasing the degree of automation, compli-
ance with quality management system and
the pursuit of clear operating methods in re-
lation to decision-making and supervision.
The efficiency and applicability of processes
and methods are monitored using internal
indicators. The monitoring and development
of production efficiency includes, among oth-
er things, the reliability and utilisation rate of
production machinery, development of the
working environment and factors related to
people‘s work. The Group has a property and
loss-of-profits insurance programme covering
all of the operating areas, and its coverage is
reviewed annually.
Markets and customers
The Group‘s business operations are charac-
terised by substantial seasonal variation. The
net sales and operating profit from the re-
ported geographical segments do not
accumulate evenly but vary substantially ac-
cording to the time of the year and the char-
acteristics of each season.
Negative changes in the economy may im-
pact consumers‘ purchasing behaviour and
hamper their liquidity. All Group companies
employ efficient credit controls as a major
method for minimising credit losses.
Legislative changes and other changes in the
operations of authorities, such as changes in
excise taxes and marketing restrictions, may
affect the demand for the Group‘s products
and their relative competitive position.
Personnel
Risks related to personnel include, among
others, risks in obtaining labour, employment
relationship risks, key person risks, compe-
tence risks and risks arising from insufficient
well-being and accidents at work.
Crucial focal points in HR management in-
clude maintaining and developing a good
employer image, as well as ensuring the
availability and commitment of personnel.
Other focal points include maintaining and
continuously developing well-being and safe-
ty at work, improvement of management
systems, construction and maintenance of
backup personnel systems, as well as train-
ing and incentive schemes.
Information security and IT
Olvi Group employs an information security
policy pertaining to all of the companies. It
defines the principles for implementing in-
formation security and provides guidelines
for its development.
Risks related to information technology and
systems are manifested as operational dis-
ruptions and deficiencies, for example. The
availability and correctness of data is ensured
through the choice of operating methods and
various technical solutions. The Group‘s op-
erations in Finland, the Baltic states and Bel-
arus utilise a common enterprise resource
planning system.
Olvi plc – Financial Statements 2014
12 | page
A risk analysis pertaining to information se-
curity and the operation of information sys-
tems is carried out annually.
Financing risks
The Group is exposed to several financing
risks in its normal course of business: market
risk (including foreign exchange risk as well
as interest rate risk on cash flow and fair
value), credit risk, liquidity risk and capital
risk.
The objective of financing risk management
is to minimise the adverse effects of changes
in the financial markets on the Group‘s finan-
cial performance, shareholders' equity and li-
quidity.
The general principles of the Group‘s risk
management are approved by the Board of
Directors of the parent company, and the
parent company‘s management together with
the management of subsidiaries is responsi-
ble for their practical implementation. Re-
sponsibility for Olvi Group‘s financing tasks is
centralised in the parent company Olvi. The
objectives of centralisation include optimisa-
tion of cash flows and financing costs, as well
as efficient risk management.
Financing risks are described in more detail
in Note 25 to the consolidated financial
statements, Management of financing risks.
Financing risks are also described in more
detail in the Investors section of the corpo-
rate Web site.
BUSINESS RISKS AND UNCERTAINTIES
IN THE NEAR TERM
The most substantial factor hampering the
predictability of Olvi Group‘s business relates
to Belarus and its economic and political out-
look for the next few years.
Foreign exchange risks arise from the cash
flows of purchases and sales in foreign cur-
rency, as well as the investment in the Bela-
rusian subsidiary and the conversion of its
balance sheet items into euro. Financial re-
porting in Belarus is subject to the IAS 29
standard ―Financial Reporting in Hyperinfla-
tionary Economies‖. Furthermore, negative
development of the Russian economy may
impose challenges on the Belarusian operat-
ing environment.
Other short-term risks and uncertainties are
related to continuing negative development
of the general economic circumstances and
the impact it may have on the company‘s op-
erations.
There have not been any other significant
changes in Olvi Group‘s business risks.
NEAR-TERM OUTLOOK
Olvi estimates that the Group‘s sales volume
for 2015 will increase slightly and that net
sales will be on a par with the previous year.
Operating profit is expected to be on a par
with 2014 or slightly decline, depending
greatly on the stabilisation of the Belarusian
economy and exchange rate. Sales volumes
in Belarus are expected to develop well.
BOARD OF DIRECTORS’ PROPOSAL FOR
THE DISTRIBUTION OF PROFIT
The parent company Olvi plc had 49.5 (50.6)
million euro of distributable funds on 31 De-
cember 2014, of which profit for the period
accounted for 12.5 (15.8) million euro.
Olvi plc‘s Board of Directors proposes to the
Annual General Meeting that distributable
funds be used as follows:
1) A dividend of 0.65 (0.65) euro shall be
paid for 2014 on each Series K and Series A
share, totalling 13.5 (13.5) million euro. The
dividend represents 41.4 (40.4) percent of
Olvi Group‘s earnings per share.
The dividend will be paid to shareholders reg-
istered in Olvi plc‘s register of shareholders
held by Euroclear Finland Ltd on the record
date of the dividend payment, 20 April 2015.
It is proposed that the dividend be paid on
30 April 2015. No dividend shall be paid on
treasury shares.
2) 36.0 million euro shall be retained in the
parent company‘s non-restricted equity.
Olvi plc – Financial Statements 2014
13 | page
EVENTS AFTER THE REVIEW PERIOD
The statutory co-operation negotiations initi-
ated in November 2014 with regard to the
Finnish operations were completed on 29
January 2015. The outcome of the negotia-
tions is that across the organisation in Fin-
land, efficiency measures will be taken and
procedures will change. In total, this will call
for redundancies of 32 people. This will come
true through pension arrangements concern-
ing 10 people, temporary layoffs of three
people and dismissal of 19 people.
FINANCIAL REPORTS IN 2015
Olvi Group‘s financial statements, Board of
Directors‘ report and Corporate Governance
Statement 2014 will be published on 24
March 2015. The parent company Olvi plc‘s
remuneration report will also be published at
the same time.
The notice to convene Olvi plc‘s Annual Gen-
eral Meeting, which will be held on 16 April
2015 in Iisalmi, will be published on 24
March 2015. The financial statements, Board
of Directors‘ report and notice to convene the
AGM will be available on Olvi plc‘s Web site
on the same day.
The following interim reports will be re-
leased in 2015:
Interim report from January to March on
29 April 2015,
Interim report from January to June on 13
August 2015, and
Interim report from January to September
on 29 October 2015.
OLVI PLC
Board of Directors
Olvi plc – Financial Statements 2014
14 | page
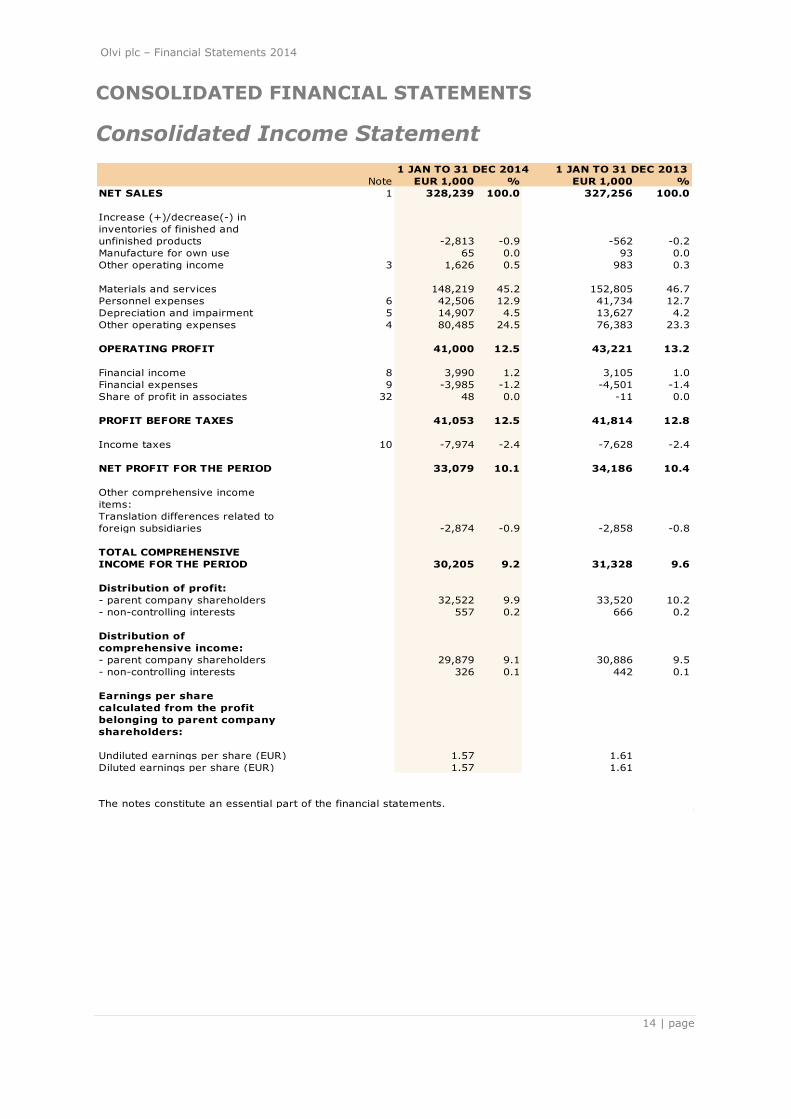
CONSOLIDATED FINANCIAL STATEMENTS
Consolidated Income Statement
1 JAN TO 31 DEC 2014 1 JAN TO 31 DEC 2013
Note EUR 1,000 % EUR 1,000 %
NET SALES 1 328,239 100.0 327,256 100.0
Increase (+)/decrease(-) in
inventories of finished and
unfinished products -2,813 -0.9 -562 -0.2
Manufacture for own use 65 0.0 93 0.0
Other operating income 3 1,626 0.5 983 0.3
Materials and services 148,219 45.2 152,805 46.7
Personnel expenses 6 42,506 12.9 41,734 12.7
Depreciation and impairment 5 14,907 4.5 13,627 4.2
Other operating expenses 4 80,485 24.5 76,383 23.3
OPERATING PROFIT 41,000 12.5 43,221 13.2
Financial income 8 3,990 1.2 3,105 1.0
Financial expenses 9 -3,985 -1.2 -4,501 -1.4
Share of profit in associates 32 48 0.0 -11 0.0
PROFIT BEFORE TAXES 41,053 12.5 41,814 12.8
Income taxes 10 -7,974 -2.4 -7,628 -2.4
NET PROFIT FOR THE PERIOD 33,079 10.1 34,186 10.4
Other comprehensive income
items:
Translation differences related to
foreign subsidiaries -2,874 -0.9 -2,858 -0.8
TOTAL COMPREHENSIVE
INCOME FOR THE PERIOD 30,205 9.2 31,328 9.6
Distribution of profit:
- parent company shareholders 32,522 9.9 33,520 10.2
- non-controlling interests 557 0.2 666 0.2
Distribution of
comprehensive income:
- parent company shareholders 29,879 9.1 30,886 9.5
- non-controlling interests 326 0.1 442 0.1
Earnings per share
calculated from the profit
belonging to parent company
shareholders:
Undiluted earnings per share (EUR) 1.57 1.61
Diluted earnings per share (EUR) 1.57 1.61
The notes constitute an essential part of the financial statements.
Olvi plc – Financial Statements 2014
15 | page
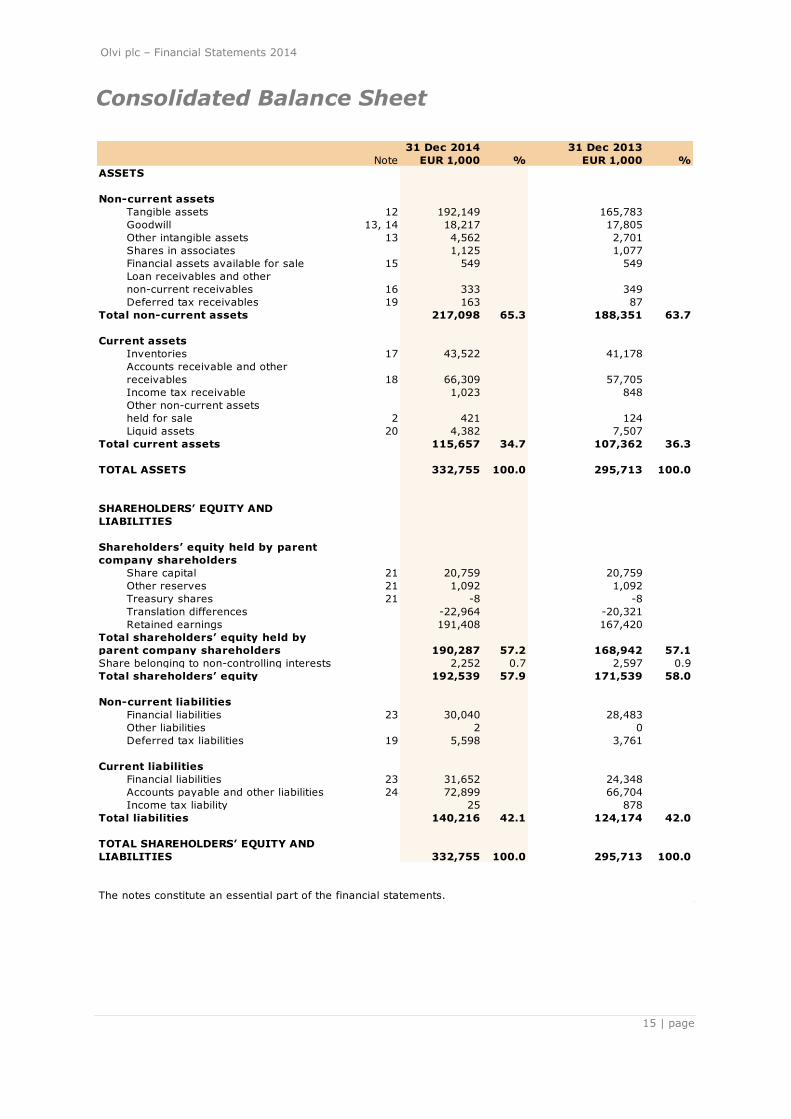
Consolidated Balance Sheet
31 Dec 2014 31 Dec 2013
Note EUR 1,000 % EUR 1,000 %
ASSETS
Non-current assets
Tangible assets 12 192,149 165,783
Goodwill 13, 14 18,217 17,805
Other intangible assets 13 4,562 2,701
Shares in associates 1,125 1,077
Financial assets available for sale 15 549 549
Loan receivables and other
non-current receivables 16 333 349
Deferred tax receivables 19 163 87
Total non-current assets 217,098 65.3 188,351 63.7
Current assets
Inventories 17 43,522 41,178
Accounts receivable and other
receivables 18 66,309 57,705
Income tax receivable 1,023 848
Other non-current assets
held for sale 2 421 124
Liquid assets 20 4,382 7,507
Total current assets 115,657 34.7 107,362 36.3
TOTAL ASSETS 332,755 100.0 295,713 100.0
SHAREHOLDERS’ EQUITY AND
LIABILITIES
Shareholders’ equity held by parent
company shareholders
Share capital 21 20,759 20,759
Other reserves 21 1,092 1,092
Treasury shares 21 -8 -8
Translation differences -22,964 -20,321
Retained earnings 191,408 167,420
Total shareholders’ equity held by
parent company shareholders 190,287 57.2 168,942 57.1
Share belonging to non-controlling interests 2,252 0.7 2,597 0.9
Total shareholders’ equity 192,539 57.9 171,539 58.0
Non-current liabilities
Financial liabilities 23 30,040 28,483
Other liabilities 2 0
Deferred tax liabilities 19 5,598 3,761
Current liabilities
Financial liabilities 23 31,652 24,348
Accounts payable and other liabilities 24 72,899 66,704
Income tax liability 25 878
Total liabilities 140,216 42.1 124,174 42.0
TOTAL SHAREHOLDERS’ EQUITY AND
LIABILITIES 332,755 100.0 295,713 100.0
The notes constitute an essential part of the financial statements.

Olvi plc – Financial Statements 2014
16 | page
Consolidated Cash Flow Statement
1-12/2014 1-12/2013
Note EUR 1,000 EUR 1,000
Cash flow from operations
Net profit for the period 33,079 34,186
Adjustments: 27
Depreciation and impairment 5 14,907 13,627
Other adjustments 10,792 10,587
Change in net working capital:
Increase (-)/decrease (+) in current interest-free accounts
receivable and other receivables -7,020 -3,267
Increase (-)/decrease (+) in inventories -1,952 0
Increase (+)/decrease (-) in current interest-free liabilities 6,614 5,718
Interest paid -3,393 -4,246
Interest received 385 530
Taxes paid -7,063 -7,126
Cash flow from operations (A) 46,349 50,009
Cash flow from investments
Investments in tangible and intangible assets -43,855 -31,975
Capital gains on disposal of tangible and intangible assets 200 220
Expenditure on other investments -298 0
Cash flow from investments (B) -43,953 -31,755
Cash flow from financing
Withdrawals of loans 32,657 5,541
Repayments of loans -24,542 -11,180
Dividends paid -13,531 -10,541 Increase (-)/decrease (+) in current interest-bearing business
receivables -23 1
Increase (-)/decrease (+) in non-current loan receivables 16 55
Cash flow from financing (C) -5,423 -16,124
Increase (+)/decrease (-) in liquid assets (A+B+C) -3,027 2,130
Liquid assets 1 January 7,507 5,698
Effect of exchange rate changes -98 -321
Liquid assets 31 December 20 4,382 7,507
The notes constitute an essential part of the financial statements.
Olvi plc – Financial Statements 2014
17 | page
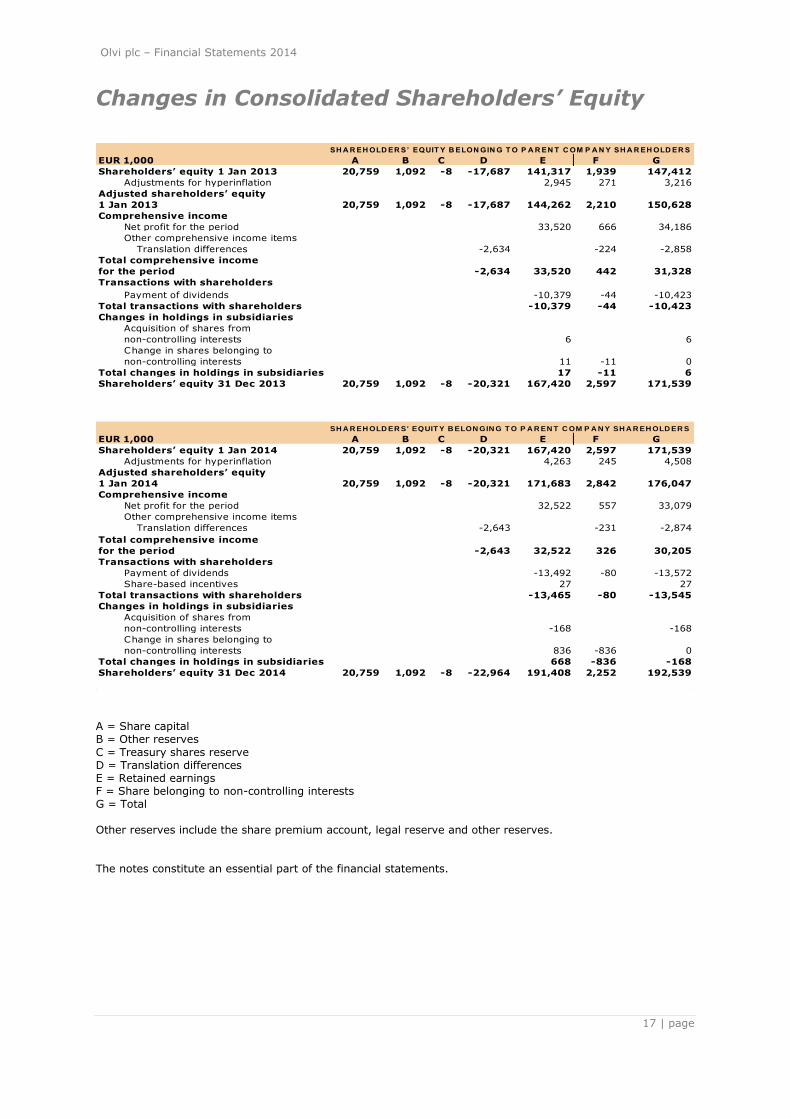
Changes in Consolidated Shareholders’ Equity
SH A R EH OLD ER S’ EQUIT Y B ELON GIN G T O P A R EN T C OM P A N Y SH A R EH OLD ER S
EUR 1,000 A B C D E F G
Shareholders’ equity 1 Jan 2013 20,759 1,092 -8 -17,687 141,317 1,939 147,412
Adjustments for hyperinflation 2,945 271 3,216
Adjusted shareholders’ equity
1 Jan 2013 20,759 1,092 -8 -17,687 144,262 2,210 150,628
Comprehensive income
Net profit for the period 33,520 666 34,186
Other comprehensive income items
Translation differences -2,634 -224 -2,858
Total comprehensive income
for the period -2,634 33,520 442 31,328
Transactions with shareholders
Payment of dividends -10,379 -44 -10,423
Total transactions with shareholders -10,379 -44 -10,423
Changes in holdings in subsidiaries
Acquisition of shares from
non-controlling interests 6 6
Change in shares belonging to
non-controlling interests 11 -11 0
Total changes in holdings in subsidiaries 17 -11 6
Shareholders’ equity 31 Dec 2013 20,759 1,092 -8 -20,321 167,420 2,597 171,539
SH A R EH OLD ER S' EQUIT Y B ELON GIN G T O P A R EN T C OM P A N Y SH A R EH OLD ER S
EUR 1,000 A B C D E F G
Shareholders’ equity 1 Jan 2014 20,759 1,092 -8 -20,321 167,420 2,597 171,539
Adjustments for hyperinflation 4,263 245 4,508
Adjusted shareholders’ equity
1 Jan 2014 20,759 1,092 -8 -20,321 171,683 2,842 176,047
Comprehensive income
Net profit for the period 32,522 557 33,079
Other comprehensive income items
Translation differences -2,643 -231 -2,874
Total comprehensive income
for the period -2,643 32,522 326 30,205
Transactions with shareholders
Payment of dividends -13,492 -80 -13,572
Share-based incentives 27 27
Total transactions with shareholders -13,465 -80 -13,545
Changes in holdings in subsidiaries
Acquisition of shares from
non-controlling interests -168 -168
Change in shares belonging to
non-controlling interests 836 -836 0
Total changes in holdings in subsidiaries 668 -836 -168
Shareholders’ equity 31 Dec 2014 20,759 1,092 -8 -22,964 191,408 2,252 192,539
A = Share capital B = Other reserves
C = Treasury shares reserve D = Translation differences E = Retained earnings F = Share belonging to non-controlling interests G = Total
Other reserves include the share premium account, legal reserve and other reserves.
The notes constitute an essential part of the financial statements.

Olvi plc – Financial Statements 2014
18 | page
Consolidated Accounting Policies
Basic information on the Group
Olvi plc (―the company‖) and its subsidiaries
(jointly ―the Group‖) manufacture beers, ci-ders, long drinks, mineral waters, juices, soft drinks, energy drinks, sports beverages, kvass and other beverages. Olvi Group oper-ates in Finland, Estonia, Latvia, Lithuania and Belarus.
The Group‘s parent company is Olvi plc (Business ID 0170318-9), and its Series A shares are quoted on the Nasdaq OMX Hel-
sinki Ltd Main List. The parent company is headquartered in Iisalmi and its registered address is P.O. Box 16, 74101 Iisalmi.
A copy of the consolidated financial state-ments is available on the Internet at www.olvi.fi or from the headquarters of the Group‘s parent company at Olvitie I-IV, 74100 Iisalmi.
The accounting period of all Group compa-nies corresponds to the calendar year and ended on 31 December 2014. Olvi plc‘s Board of Directors has approved
the disclosure of these financial statements at its meeting on 23 February 2015. Accord-
ing to the Finnish Companies Act, sharehold-ers have the option to approve or reject the financial statements at a General Meeting of Shareholders to be held after disclosure. The General Meeting of Shareholders may also decide on amending the financial statements.
Accounting policies
Basis of preparation
The consolidated financial statements have been prepared in compliance with the ap-
proved International Financial Reporting
Standards (IFRS), observing the IAS and IFRS standards as well as SIC and IFRIC in-terpretations valid on 31 December 2014. In the Finnish Accounting Act and regulations enacted by virtue of the Act, International Financial Reporting Standards refer to the standards approved for use in the European
Union in accordance with the procedure specified in the EU regulation (EC) No 1606/2002. The notes to the financial state-ments are also in compliance with Finnish legislation concerning accounting and corpo-rate law that supplements the IFRS regula-tions.
The consolidated financial statements have been prepared on the basis of original cost with the exception of financial assets availa-ble for sale, financial assets and liabilities recognised at fair value through profit or loss, derivative contracts, as well as share-based transactions settled in cash, which
have been recognised at fair value. The fi-nancial statement information is presented in thousands of euros (EUR 1,000). For the sa-ke of presentation, individual figures and to-
tals have been rounded to full thousands, which may cause rounding differences in ad-ditions.
Preparation of financial statements in ac-cordance with IFRS standards requires the Group‘s management to make certain esti-mates and considerations. Information on considerations made by management with
regard to application of the Group‘s account-ing policies that have the most significant ef-fect on the figures presented in the financial statements is presented in the Section ―Ac-counting policies requiring consideration by management and crucial factors of uncertain-
ty associated with estimates‖.
Consolidated Accounting Policies Subsidiaries The consolidated financial statements include the parent company Olvi plc as well as all
Finnish and non-Finnish subsidiaries in which the Group directly or indirectly controls more than 50 percent of the voting rights associat-ed with shares or otherwise has the right to define the principles of the entity‘s finances and business operations in order to gain
benefit from its operations.
Intra-Group shareholdings have been elimi-nated using the purchase method. The con-sideration given and the acquired entity‘s identifiable assets and assumed liabilities have been measured at fair value at the time
of acquisition. Acquired subsidiaries are included in the con-solidated financial statements as of the date the Group has acquired a position of control, and divested subsidiaries are included until the date the Group‘s control is discontinued.
All intra-Group business transactions, receiv-ables, liabilities, unrealised gains and internal
profit distribution are eliminated during the preparation of the consolidated financial

Olvi plc – Financial Statements 2014
19 | page
statements. Unrealised losses are not elimi-nated if they are caused by impairment.
The distribution of profit or loss for the finan-cial period between the parent company‘s shareholders and non-controlling interests is presented in the separate income statement, and the distribution of comprehensive in-come between the parent company‘s share-
holders and non-controlling interests is pre-sented in connection with the statement of comprehensive income. Comprehensive in-come is allocated between parent company shareholders and non-controlling interests even if this would lead to a negative share allocated to non-controlling interests. The
share of equity belonging to non-controlling
interests is presented as a separate balance sheet item under shareholders‘ equity. Changes in the parent company‘s holding in a subsidiary that do not lead to loss of con-trol are processed as equity transactions.
Associates
Associates in which the Group holds 20 to 50 percent of voting rights or in which the Group exercises significant power but has no position of control are consolidated using the equity method. A share of profit in associates corresponding to the Group‘s share of hold-
ing has been calculated in accordance with
the Group‘s holding and presented as a sepa-rate item in the income statement after fi-nancial income and expenses. If the Group‘s share of an associate‘s losses exceeds the book value of the investment, the investment is recognised in the balance sheet at zero
value, and losses exceeding the book value are not taken into account unless the Group is otherwise committed to the fulfilment of the associate‘s obligations.
Segment reporting
Operating segments are reported in a man-ner consistent with internal reporting provid-
ed to the chief operating decision maker. The chief operating decision maker, who is re-sponsible of allocating resources to the oper-ating segments and assessing their perfor-mance, is identified to be the Group‘s Manag-
ing Director making strategic decisions.
Olvi Group‘s operating segments consist of the Group‘s geographical operating areas, which are Finland, Estonia, Latvia, Lithuania and Belarus.
The Group‘s segment information is de-scribed in more detail in Note 1 to the con-
solidated financial statements, Segment
information.
Conversion of items in foreign currency
The figures indicating the earnings and finan-cial position of Group entities are determined
in the currency of each unit‘s primary operat-ing environment (―functional currency‖). The consolidated financial statements are pre-sented in euro, which is the operating and presentation currency of the Group‘s parent company.
Transactions denominated in foreign curren-cy have been converted into the functional currency at the exchange rate valid on the
transaction date. Monetary items in foreign currency have been converted into the func-tional currency at the exchange rates valid
on the closing date of the reporting period. The parent company‘s receivables and debts denominated in foreign currency have been converted into euro at the mean exchange rate quoted by the European Central Bank on the balance sheet date. Receivables and debts of non-Finnish consolidated companies
denominated in foreign currency have been converted at the exchange rate of the coun-try in question on the balance sheet date. Gains and losses originating from business transactions in foreign currency and the con-
version of monetary items are recognised
through profit and loss. Foreign exchange gains and losses from op-erations are included in the corresponding items above operating profit. Foreign ex-change gains and losses on loans denomi-nated in foreign currency are included in fi-
nancial income and expenses. The income and expense items within the in-come statements of non-Finnish consolidated companies that use a functional currency other than the Group‘s presentation currency (and that do not operate in hyperinflationary
economies) have been converted into euro at the average exchange rates for the account-ing period, which refers to the averages of the mean exchange rates quoted by the Eu-ropean Central Bank on the last day of each month. Balance sheet items have been con-
verted into euro at the mean exchange rate quoted by the European Central Bank on the balance sheet date. The different exchange rates applicable to the conversion of profit or loss on the income statement and balance sheet result in a translation difference recog-nised in shareholders‘ equity on the balance
sheet, and any change in this difference is recognised in other comprehensive income
items. Translation differences arising from

Olvi plc – Financial Statements 2014
20 | page
the elimination of the acquisition cost of for-eign Group companies, as well as translation
differences arising from equity items accu-
mulated after the acquisition, are recognised in other comprehensive income items. When a subsidiary is divested in full or in part, ac-cumulated translation differences are recog-nised in the income statement as part of the sales gain or loss.
Goodwill arising from the acquisition of for-eign entities and the fair value adjustments made to the book values of the assets and li-abilities of such foreign entities upon acquisi-tion are treated as assets and liabilities be-longing to the foreign entities. They are con-
verted into euro at the exchange rates valid
on the closing date of the reporting period. Inflation accounting Belarus was listed as a hyperinflationary economy in December 2011. The 2011,
2012, 2013 and 2014 financial statements of the subsidiary OAO Lidskoe Pivo registered in Belarus have been adjusted in accordance with IAS 29, ―Financial Reporting in Hyperin-flationary Economies‖. Items denominated in BYR currency have been adjusted using the
Belarusian general consumer price index. Ad-justments have been made monthly starting from December 2008.
The adjustment factors applied from Decem-ber 2008 to December 2014 were as follows:
12/2008 4.1618 12/2009 3.7886 12/2010 3.4434 12/2011 1.6501 12/2012 1.3560 12/2013 1.1629 12/2014 1.0000
The values do not represent market values, repurchase values or other fair values used in actual transactions.
In the conversion of the 2014 financial
statements, monetary receivables and liabili-ties have not been reassessed using a con-version factor but they have been converted into euro using the exchange rate between BYR and euro valid on the closing date of the reporting period.
The same procedure has also been applied to other non-monetary balance sheet items measured at fair value. On the other hand, other non-monetary balance sheet items as well as income statement items have been converted using the corresponding conver-
sion factor values.
Monthly averages of the conversion factor have been applied to income statement
items. The impact of the inflation factor on
the company‘s monetary net position arising from the procedure has been included in fi-nancial income and/or expenses as a profit or loss. A change in tax accruals correspond-ing to the financial statement adjustments has been recognised in deferred tax liabili-
ties. The income and expense items within OAO Lidskoe Pivo‘s income statement, as well as the company‘s balance sheet, have been converted into euro at the mean exchange rate quoted by the Belarusian Central Bank
on the balance sheet date, in accordance
with IAS 29. OAO Lidskoe Pivo‘s functional currency is hy-perinflationary but because its figures are converted to a non-inflationary currency, the euro, the data for comparison from the pre-
vious accounting period and all earlier ac-counting periods must be the same as pre-sented in the financial statements for the year in question (in other words, they shall not be adjusted to correspond to any subse-quent changes in price levels or exchange
rates). Property, plant and equipment
Property, plant and equipment are recog-nised in the balance sheet at original cost deducted by accumulated depreciation and
impairment losses. Asset items are depreciated by the straight-line method over their estimated useful life. Depreciation is not booked on land areas. Es-timated useful lives are the following:
Buildings 20 to 40 years Plant machinery and equipment 15 to 20 years Other fixed assets 5 years
The residual value and useful life of asset
items are reviewed upon each closing of the accounts and adjusted if necessary to reflect any changes in the expected economic bene-fit. Depreciation on a property, plant or equip-ment item will be discontinued when the item
is classified as available for sale in accord-ance with the standard IFRS 5 Non-current Assets Held for Sale and Discontinued Opera-tions. Sales gains and losses arising from the de-
commissioning and transfer of property,
plant and equipment items are included in

Olvi plc – Financial Statements 2014
21 | page
other operating income or other operating expenses.
Borrowing costs Borrowing costs attributable to the acquisi-tion, construction or manufacture of an item fulfilling the conditions of the revised IAS 23 standard are capitalised as part of the acqui-
sition cost of that item if the item fulfils said conditions and capitalisation is started on or after 1 January 2009. All borrowing costs were previously recognised as immediate ex-penses. The Group has not had any capital-ised borrowing costs up to date.
All borrowing costs other than those falling
under IAS 23 are recognised as expenses in the period during which they have arisen. Government grants Public subsidies such as government grants
associated with the acquisition of property, plant and equipment items are recognised as deductions in the book values of property, plant and equipment items. The subsidies will be recognised as income through reduced depreciation over the useful life of the item.
Subsidies received as compensation for real-ised costs are recognised on the income
statement at the same time as the associat-ed costs are recognised as expenses. Such subsidies are presented in other operating income.
Intangible assets Goodwill Goodwill arising from business combinations is recognised at the amount to which the to-
tal of consideration given, the share of non-controlling interests in the acquired entity and any previous holding exceed the fair val-ue of net assets acquired.
No regular amortisation is booked on good-
will but it is tested for impairment annually or, if necessary, more frequently. For this purpose, goodwill is allocated to cash gener-ating units that correspond to the manage-ment‘s way of supervising the business and associated goodwill. In the Group, cash gen-erating units correspond to operating seg-
ments reported to top management. Goodwill is recognised at original cost deducted by impairment. Research and development costs
Research and development costs are recog-
nised as expenses in the income statement.
Development costs arising from the design of new or more advanced products are capital-
ised as intangible assets in the balance sheet
starting from the time the product is techni-cally feasible, it can be utilised commercially, and future economic benefit is expected from the product. Development costs previously recognised as
expenses will not be subsequently capital-ised. Amortisation is booked on an item starting from the time it is ready for use. An item that is not yet ready for use is tested annually for impairment. Other intangible assets
An intangible asset item is recognised in the balance sheet only if its acquisition cost can be reliably determined and it is probable that the expected economic benefit from the item will be to the Group‘s advantage. Patents, trademarks and licences with a limited useful
life are booked in the balance sheet at origi-nal cost and recognised as expenses in the income statement by straight-line amortisa-tion over their known or estimated useful life. No amortisation is booked on intangible assets with an unlimited useful life but they
are tested annually for impairment. The Group currently has no intangible assets with an unlimited useful life.
The amortisation periods for intangible as-sets are the following:
Trademarks and development costs 10 years Computer software 5 years Others 5 years Leases
The Group as a lessee Leases on tangible assets in which the Group has a significant part of the risks and bene-
fits characteristic of ownership are catego-rised as finance lease agreements.
Asset items acquired on finance lease agreements are recognised in the balance sheet at the fair value of the leased item in the start of the lease period or at a lower present value of minimum rents. Asset items acquired on finance lease agreements are
depreciated over the useful life of the item or the lease period, whichever is shorter. Leas-ing rents payable are divided into financing cost and reduction of debt over the lease pe-riod so that the interest rate on the debt re-maining in each accounting period is equal.
Lease obligations are included in financial li-
abilities.

Olvi plc – Financial Statements 2014
22 | page
Lease agreements in which the risks and benefits characteristic of ownership remain
with the lessor are treated as other lease
agreements. Leases payable on the basis of other lease agreements are recognised as expenses in the income statement in equal instalments over the lease period. The Group as a lessor
Items leased out by the Group in which a significant part of the risks and benefits characteristic of ownership have been trans-ferred to the lessee are treated as finance lease agreements and recognised as receiva-bles in the balance sheet. The receivable is
recognised at present value.
The financial income on a finance lease agreement is recognised as income during the lease period so that the remaining net investment will produce the same percentage of yield over the lease period. The Group
does not currently have any substantial fi-nance lease agreements as a lessor. Assets leased out on agreements other than finance lease are included in property, plant and equipment items in the balance sheet.
They are depreciated over their useful life just as similar property, plant and equipment items in own use. Lease income is recognised
in the balance sheet as equal instalments over the lease period. Impairment
The balance sheet values of non-current tan-gible and intangible assets are assessed for impairment on the balance sheet date and every time there is evidence that the value of an asset may have been impaired. The im-pairment test estimates the amount recover-
able from an asset. Recoverable amount equals to the fair value of an asset deducted by costs arising from its transfer, or value in use if this is higher.
An impairment loss is recognised in the in-
come statement when the book value of an asset exceeds its recoverable amount. If an impairment loss is attributable to a cash generating unit, it is first allocated to reduce the goodwill attributable to the cash generat-ing unit and then to reduce other asset items within the unit on a pro rata basis. An im-
pairment loss will be reversed if there is a change in the circumstances and the amount recoverable from an asset has changed since the recognition of the impairment loss. How-ever, any impairment loss reversal may not exceed the amount that would be the book
value of the asset if the impairment loss was
not recognised. Impairment losses recog-
nised on goodwill are not to be reversed in any circumstances.
Impairment testing The Group carries out annual impairment testing of goodwill, unfinished intangible and tangible assets and net operating capital, and any evidence of potential impairment is
evaluated as presented above in the ac-counting policies. Recoverable amounts from cash generating units are determined through calculations based on value in use. The preparation of these calculations re-quires the use of estimates.
Cash flow estimates are based on forecasts
approved by management covering a three-year period. The crucial variables used for the calculation of value in use are budgeted sales volume, budgeted net sales and oper-ating profit. Estimated sales and production volumes are based on existing fixed assets.
More information on goodwill and impairment testing is provided in Note 14, Impairment testing of goodwill. Inventories
Inventories are recognised at acquisition cost or a lower probable net realisable value. The acquisition cost of raw materials and supplies
is determined by the weighted average method. The acquisition cost of finished and unfinished products is based on actual costs and manufacturing volumes and comprises
raw materials, direct expenses due to work performed, other direct expenses, as well as a proportion of the variable and fixed over-heads of manufacturing based on actual manufacturing volumes. Net realisable value refers to estimated sales price available through normal business operations, deduct-
ed by estimated costs of finishing the prod-uct and costs of sale. Pension obligations
The Group‘s pension schemes are defined
contribution plans. Contributions paid to de-fined contribution pension plans are recog-nised in the income statement during the pe-riod to which the charge applies. Share-based payments
The Group applies the standard IFRS 2 Share-based Payment to all share-based business transactions. Arrangements settled in equity instruments are measured at fair value on the date of
granting and recognised as expenses in the
income statement in equal instalments over
Olvi plc – Financial Statements 2014
23 | page
the validity period of the right. Arrangements settled in cash are measured at fair value at
each closing of the accounts, and changes in
the fair value of the liability are recognised in the income statement. The earnings effect of the arrangement is presented in the income statement under the costs of employee bene-fits.
The cost determined at the time of granting the share-based bonuses is based on the Group management‘s estimate of the num-ber of shares that are expected to become vested at the end of the vesting period. The Group updates the expectation of the final number of shares on each balance sheet
date. The changes in the estimates are rec-
ognised in the income statement. Provisions A provision is recognised in the balance sheet when the Group has a legal or factual
obligation based on a previous event, it is probable that the fulfilment of the obligation requires payment or causes a financial loss, and the amount of the obligation can be reli-ably estimated. If there is a possibility to re-ceive compensation for part of the obligation
from a third party, the compensation is rec-ognised as a separate asset item but this is only done once the possibility of receiving
compensation is practically certain. Provi-sions are measured at the present value of the costs required to cover the obligation.
A provision is recognised for onerous con-tracts if the costs necessary for fulfilling the obligations exceed the benefits available from the contract. A provision for obligations associated with decommissioning and restoration is recog-
nised when the Group has an obligation based on environmental legislation and the Group‘s environmental responsibility policy that is associated with the decommissioning
of a production facility, remedy of environ-mental damage or transfer of equipment to
another location. Taxes The tax expenses in the income statement comprise tax based on the taxable income for the period and change in deferred tax.
The tax based on the taxable income for the period is calculated on the basis of taxable income in accordance with the tax rate valid in each country. The tax is adjusted by any taxes associated with previous periods.
Deferred taxes are calculated on all tempo-
rary differences between book value and tax
base. No deferred tax is recognised on im-pairment losses on goodwill that are not tax
deductible, and no deferred tax is recognised
on undistributed accrued profits of subsidiar-ies to the extent that the difference will probably not be eliminated during the fore-seeable future. The most substantial tempo-rary differences arise from depreciation on property, plant and equipment, arrange-
ments settled in equity instruments, as well as the fair valuation of derivative contracts. Deferred taxes are calculated at tax rates enacted or practically approved by the bal-ance sheet date, which are expected to be applicable when the deferred tax receivable
is realised or the deferred tax liability is paid.
Deferred tax receivables are recognised up to the probable amount of taxable income in the future against which the temporary dif-ference can be utilised. The amount of de-ferred tax receivables and the probability of
utilisation are assessed at every closing of the accounts. Deferred tax receivables and liabilities are presented in the balance sheet as separate items under non-current assets or liabilities.
Principles for recognition of income
Net sales consist of consideration received for the sales of beverages and other brew-ery-related commodities during the course of the Group‘s ordinary business, measured at
fair value. Income is presented less value-added tax, indirect taxes, refunds and discounts, with intra-Group sales eliminated. Income is recognised when it can be reliably
determined and when it is probable that fu-ture economic benefit will be gained. Products sold
The Group manufactures different kinds of
alcoholic and non-alcoholic beverages and sells them, along with other products related to the beverage industry, to customers who have a retail or wholesale licence to sell al-cohol for consumption on or off their premis-es. Product sales are recognised when the Group has delivered the products to the cus-
tomer and when substantial risks and bene-fits related to their ownership have been transferred to the customer, and there are no outstanding obligations that could affect the customer‘s acceptance of the products. Delivery is considered to be realised only
once the products have been delivered to the
location agreed with the customer, the risk of

Olvi plc – Financial Statements 2014
24 | page
non-marketability and damage has been transferred to the customer, and the cus-
tomer has either accepted the products in
accordance with the sales contract, the ac-ceptance-related terms and conditions have expired, or the Group has objective proof that all of the acceptance criteria are fulfilled. The sales of beverages often carry annual
discounts, and customers are entitled to re-turn any defective products. Sales are recog-nised at the price specified in the sales con-tract less annual discounts and returns of de-fective products estimated at the time of sale.
Discounts are estimated and recognised on
the basis of actual purchases and expected annual purchases in accordance with the terms and conditions of the sales contracts. Rental income
The Group rents out beverage-serving equipment to its HoReCa customers and coolers to its retailers. Rental income is rec-ognised in equal instalments over the rental period.
Interest Interest income is recognised on the basis of
elapsed time using the effective interest method. If a loan receivable or other receiv-able becomes impaired, its book value is re-duced to correspond to the recoverable
amount. Interest income from impaired loan receivables is recognised in accordance with original effective interest. Dividends Dividend income is recognised when the right
to dividend becomes vested. Non-current assets held for sale and discontinued operations
Non-current assets held for sale and assets
associated with discontinued operations are classified as assets held for sale and meas-ured at book value or a lower fair value de-ducted by sales costs if the amount corre-sponding to the book value is going to be ac-crued mostly from the sale of the asset in-stead of continuous use. The prerequisites
for classification as an item held for sale are considered to be fulfilled when a sale is high-ly probable and the asset can be immediately sold in its current condition on usual and conventional terms, management is commit-ted to the sale, and it is expected to be car-
ried out within one year of classification. De-
preciation of these assets will be discontin-ued at the time of classification.
Financial assets and liabilities Financial assets The Group‘s financial assets are classified in accordance with the standard IAS 39 Finan-
cial Instruments: Disclosure and Presenta-tion. At present, the Group‘s financial assets are classified as either loans and receivables or financial assets available for sale. The classification is based on the purpose of ac-quiring the financial assets and carried out upon original acquisition. All purchases and
sales of financial assets are recognised based
on the transaction date. Transaction costs are included in the original book value of fi-nancial assets. Loans and receivables
The group of loans and receivables includes the Group‘s accounts receivable and other receivables. They are measured at original amortised cost using the effective interest method. On the balance sheet, they are in-cluded in current or non-current assets ac-
cording to their nature. Accounts receivable are originally recognised at fair value and subsequently measured at original amortised
cost using the effective interest method, tak-ing any impairment into account. Factors suggesting impairment of an account receiv-able include the debtor‘s substantial financial
difficulties, a threat of bankruptcy or a pay-ment delay exceeding 60 days. Financial assets available for sale The Group‘s other financial assets are classi-fied as financial assets available for sale. Fi-
nancial assets available for sale may com-prise equities and interest-bearing invest-ments. They are recognised at fair value or, if the fair value cannot be determined relia-
bly, at purchase price. Changes in the fair value of financial assets available for sale are
booked in the fair value reserve within shareholders‘ equity, taking the tax effect in-to account. Changes in fair value are trans-ferred from shareholders‘ equity to the in-come statement when the investment is sold or its value has reduced so that an impair-ment loss must be recognised.
Financial assets are derecognised once the rights to the investment‘s cash flows have ceased or have been transferred to another party, and the Group has transferred any substantial risks and benefits of ownership.

Olvi plc – Financial Statements 2014
25 | page
Financial assets available for sale are includ-ed in non-current assets except if the inten-
tion is to hold them for less than 12 months
from the balance sheet date, in which case they are included in current assets. Liquid assets Liquid assets comprise cash, bank deposits
withdrawable on demand, as well as other short-term very liquid investments. Items classified as liquid assets have a maturity of no more than three months calculated from the date of acquisition. Account overdraft fa-cilities in use are presented under other cur-rent liabilities.
Impairment of financial assets On each balance sheet date, the Group esti-mates whether there is objective evidence that the value of a financial asset item or fi-nancial asset group may have been impaired.
If there is evidence of potential impairment, the amount of loss is determined as the dif-ference between the book value of the asset and its fair value or the present value of es-timated future cash flows discounted at the original effective interest rate. Impairment
losses are recognised in financial items through profit or loss.
Financial liabilities Financial liabilities are initially recognised at fair value increased by transaction costs aris-
ing from the acquisition of debt. Financial li-abilities will subsequently be measured at original amortised cost using the effective in-terest method. Financial liabilities are divided into non-current and current liabilities on the basis of
the period of realisation, and may constitute interest-bearing or interest-free liabilities. Financial liabilities are derecognised once the
liability or a part thereof has ceased to exist – in other words, once the obligation speci-
fied in the contract has been fulfilled or an-nulled or it has ceased to be valid. Derivative contracts and hedge account-ing Olvi Group treats derivative contracts in the
manner prescribed in the standard IAS 39 Financial Instruments: Disclosure and Presentation. All interest rate derivatives have been classified as assets held for trad-ing because the Group does not apply hedge accounting in accordance with IAS 39. Deriv-
atives held for trading are interest rate
swaps recognised at fair value. The fair value
of interest rate swaps is recognised in other current assets or liabilities. Both realised and
unrealised gains and losses arising from
changes in fair value are recognised in finan-cial items within the income statement for the accounting period during which they arise. Fixed currency swaps taken out for the pur-
pose of hedging against foreign exchange risk associated with loans denominated in foreign currency are recognised at original cost. Share capital and treasury shares
Outstanding Series K and Series A shares are
presented as share capital. Any transaction costs immediately arising from the issuance of new shares or options, after being adjust-ed for tax effects, are presented in share-holders‘ equity as a deduction of payments received.
If the Group acquires the company‘s own shares, the consideration paid and the im-mediate costs of acquisition are deducted from shareholders‘ equity until the shares are annulled or re-released to circulation.
If the shares are re-released, the considera-tion received less immediate transaction
costs is included in shareholders‘ equity. Payment of dividends
The dividend proposed by the Board of Direc-tors to the General Meeting of Shareholders has not been recognised in the financial statements. Dividends will only be recog-nised on the basis of the General Meeting‘s decision.
Operating profit The standard IAS 1 Presentation of Financial Statements does not define the concept of
operating profit. The Group has defined it as follows: operating profit is the net amount
created by adding other operating income to net sales, subtracting purchase costs adjust-ed by change in inventories of finished and unfinished products and costs of manufacture for own use, and subtracting costs of em-ployee benefits, depreciation and amortisa-tion, any impairment losses and other oper-
ating expenses. ……………………………………………… All income statement items other than the above are presented below operating profit. Exchange rate differences are included in op-erating profit if they arise from items associ-
ated with business operations, otherwise
they are recognised in financial items.

Olvi plc – Financial Statements 2014
26 | page
Earnings per share
Earnings per share is calculated by dividing
the profit for the period belonging to the par-ent company‘s shareholders by the average weighted number of shares outstanding dur-ing the accounting period. When calculating the average, the number of treasury shares in the company‘s possession is deducted
from the number of shares. The average weighted number of shares used for the calculation of diluted earnings per share includes the dilution effect of op-tions outstanding during the accounting peri-od.
The calculation of the dilution effect includes consideration for the number of treasury shares acquired using funds received from the exchange of options. Olvi Group has no warrants or options on 31 December 2014.
Accounting policies requiring considera-tion by management and crucial factors of uncertainty associated with estimates Estimates and assumptions regarding the fu-ture have to be made during preparation of
the financial statements. These are based on previous experience and expectations of fu-ture events, but the outcome may differ from
the estimates and assumptions. Further-more, the application of accounting policies requires choice and consideration.
Management consideration associated with the selection and application of ac-counting policies Group management makes consideration-based choices with regard to the selection and application of accounting policies. This
applies particularly to cases in which valid IFRS standards provide for alternative meth-ods of recognition, measurement or presen-tation.
The most important sectors in which man-
agement has applied said consideration are goodwill testing and deferred tax receivables. Factors of uncertainty associated with estimates Estimates made in connection with the prep-
aration of financial statements are based on the management‘s best understanding on the balance sheet date. The background of the estimates includes previous experience and assumptions concerning the future that are deemed most probable on the balance sheet
date with regard to issues such as the ex-
pected development of the Group‘s financial
operating environment concerning sales and the level of costs. The Group, regularly and jointly with the management of subsidiaries, assesses the realisation of estimates and as-sumptions, as well as changes in the under-lying factors, by applying several sources of
information, both internal and external. Any changes in the estimates and assump-tions are recognised in the accounting period during which the estimates and assumptions are adjusted and in all subsequent account-ing periods.
Those substantial assumptions concerning the future and crucial factors of uncertainty associated with estimates made on the date of closing the accounts that impose a signifi-cant risk of substantial changes in the book values of the Group‘s assets and liabilities
during the next accounting period are pre-sented below. The Group‘s management has considered these sections of the financial statements as being the most crucial be-cause, from the Group‘s point of view, the applicable accounting policies are the most
complex, and their application requires the use of most significant estimates and as-sumptions in the measurement of assets, for
example. Furthermore, it is estimated that the effect of any changes in the assumptions and estimates used in these sections of the financial statements would be the greatest.
Determining the fair value of assets ac-quired in a business combination In case of substantial business combinations, the Group has used the services of an exter-nal advisor for the assessment of fair values
of tangible and intangible assets. With regard to tangible assets, comparisons have been made against the market prices of similar as-sets, estimating the devaluation of the ac-
quired assets due to age, wear and tear and other similar factors. The determination of
fair values for intangible assets is based on estimates of cash flows associated with the assets because no information on transac-tions concerning similar assets has been available from the markets. The management believes that the estimates
and assumptions used are sufficiently accu-rate to serve as the basis for determining fair value. Furthermore, at least on each closing of the accounts, the Group reviews any indi-cations of impairment of either tangible or in-tangible assets.
Olvi plc – Financial Statements 2014
27 | page
New and upcoming IFRS standards applicable to accounting periods beginning on or af-
ter 1 January 2014
The consolidated financial statements have been prepared in accordance with the same accounting policies used in 2013, with the exception of the following new standards, interpretations and revi-sions to existing standards that the Group has applied since 1 January 2014.
Subject Crucial requirements Effective date
IFRS 10 Consolidated Fi-nancial Statements
The aim of IFRS 10 is to establish principles for the presentation and preparation of consolidated finan-cial statements when an entity controls one or more other entities. The principles of control are defined,
and control is established as the basis for consolida-tion. The standard sets out how to apply the principle of control to identify whether an investor controls an investee and therefore must consolidate the inves-
tee. The standard also sets out the accounting re-quirements for the preparation of consolidated finan-cial statements. The standard does not have any effect on the Group‘s consolidated financial statements.
Applicable in the EU as of 1 January 2014
IFRS 11 Joint Arrange-ments
IFRS 11 is a more realistic reflection of joint ar-rangements. It focuses on the rights and obligations
arising from the arrangement rather than its legal
form. There are two types of joint arrangement: joint operations and joint ventures. Joint operations arise where a joint operator has rights to the assets and obligations relating to the arrangement and hence accounts for its interest in assets, liabilities, revenue and expenses. Joint ventures arise where the joint
operator has rights to the net assets of the arrange-ment and hence equity accounts for its interest. Pro-portional consolidation of joint ventures is no longer allowed. The standard does not have any effect on the Group‘s consolidated financial statements.
Applicable in the EU as of
1 January
2014
IFRS 12 Disclosures of
Interests in Other Enti-ties
IFRS 12 includes the disclosure requirements for all
forms of interests in other entities, including joint ar-rangements, associates, special purpose vehicles and other off balance sheet vehicles. The Group has observed the revised disclosure re-quirements in its financial statements.
Applicable in
the EU as of 1 January 2014
IAS 28 (Revised 2011) Investments in Associ-
ates and Joint Ventures
The revised standard includes the accounting re-quirements for both associates and joint ventures. As
a consequence of the publication of IFRS 11, the eq-uity method shall apply to both. The revision does not have any effect on the Group‘s consolidated financial statements.
Applicable in the EU as of
1 January 2014

Olvi plc – Financial Statements 2014
28 | page
Amendments to IFRS 10, IFRS 12 and IAS 27 con-cerning consolidation for investment entities
These amendments mean that many funds and similar entities will be exempt from consolidating most of their subsidiaries. Instead, they will measure them at fair value through profit or loss. The amendments give an exception to entities that meet an ‗investment entity‘ definition and that display particular characteristics. Additional requirements regarding notes to the financial
statements of investment entities have been added to IFRS 12. The amendment does not have any effect on the Group‘s consolidated financial statements.
1 January 2014
Amendment to IAS 32 ―Financial Instruments:
Presentation‖ concerning
the offset of assets and li-abilities
The amendments are related to the IAS 32 application guidance. They clarify some of the requirements for
offsetting financial assets and financial liabilities on the
balance sheet. The amendment does not have any effect on the Group‘s consolidated financial statements.
1 January 2014
Amendment to IAS 36, ―Impairment of Assets‖ concerning recoverable amount disclosures
This amendment addresses the disclosure of infor-mation about the recoverable amount of impaired assets if that amount is based on fair value less costs of disposal.
The amendment does not have any effect on the Group‘s consolidated financial statements.
1 January 2014
Amendment to IAS 39, ―Financial Instruments:
Recognition and Meas-urement‖ concerning the novation of derivatives
This amendment provides relief from discontinuing hedge accounting when novation of a hedging instru-
ment to a central counterparty meets specified criteria. The amendment does not have any effect on the
Group‘s consolidated financial statements.
1 January 2014
IFRS standards, interpretations and amendments coming into force later
The following is a list of standards and interpretations that have been published but will enter into force on a date later than 1 January 2014.
Subject Crucial requirements Effective date
Annual improvements
2012
These annual improvements amend standards from the
2010–2012 reporting cycle. Changes to the following standards are included: IFRS 2 ―Share-based Payments‖: Clarifying the defini-
tion of a ―vesting condition‖ and separately defining ―performance condition‖ and ―service condition‖.
IFRS 3 ―Business Combinations‖: Clarifying that an ob-
ligation to pay contingent consideration that meets the definition of a financial instrument is classified either as a financial liability or equity on the basis of the defini-tions in IAS 32, ―Financial Instruments: Presentation.‖ It is also clarified that all non-equity contingent consid-eration is measured at fair value at each reporting date, with changes in value recognised through profit and
loss.
1 July 2014

Olvi plc – Financial Statements 2014
29 | page
Subject Crucial requirements Effective date
IFRS 8 ―Operating Segments‖: Amended to require dis-closure of the judgments made by management in ag-gregating operating segments. A reconciliation of seg-
ment assets against the entity‘s total assets is also re-quired whenever segment assets are reported.
IFRS 13 ―Fair Value Measurement‖: Amended the basis of conclusions to clarify that it was not intended to re-
move the ability to measure short term receivables and payables at invoice amounts where the effect of dis-counting is immaterial.
IAS 16 ―Property, Plant and Equipment‖ and IAS 38 ―Intangible Assets‖: Clarifying how the gross carrying
amount and the accumulated depreciation are treated
where an entity uses the revaluation model. IAS 24 ―Related Party Disclosures‖: Related parties also
include entities that provide key management person-
nel services to the reporting entity or to the parent of the reporting entity (―management entities‖). Disclo-sure of the amounts charged to the reporting entity is required.
The Group estimates that the revisions to the standards will not have any substantial effect on the consolidated
financial statements.
Annual improvements 2013
These annual improvements amend standards from the 2011-2013 reporting cycle. Changes to the following stand-
ards are included: IFRS 3 ―Business Combinations‖: The amendment
clarifies that IFRS 3 does not apply to the formation of any joint venture under IFRS 11.
IFRS 13 ―Fair Value Measurement‖. The standard is amended to clarify that the portfolio exception in IFRS
13 applies to all contracts (including non-financial contracts) within the scope of IAS 39 or IFRS 9.
IAS 40, ―Investment Property‖: It is clarified that IAS 40 and IFRS 3 are not mutually exclusive. IAS 40
helps in distinguishing between investment property and owner-occupied property. The guidance in IFRS 3 must also be considered to determine whether the acquisition of an investment property is a business
combination.
The Group estimates that the revisions to the standards
will not have any substantial effect on the consolidated financial statements.
1 July 2014
Amendment to IAS 19,
―Employee benefits‖ re-garding employee or third party contributions to defined benefit plans
The amendment applies to contributions from employees or
third parties to defined benefit plans and clarifies the ac-counting for such contributions. The amendment distin-guishes between contributions that are linked to service on-ly in the period in which they arise and those linked to ser-vice in more than one period. The objective is to simplify the accounting for contributions that are independent of the
number of years of service, for example employee contribu-tions that are calculated according to a fixed percentage of
salary.
1 July 2014
Olvi plc – Financial Statements 2014
30 | page
Subject Crucial requirements Effective date
Entities with plans where the contributions vary with dura-tion of service will be required to recognise the benefit of those contributions over the employees‘ entire period of service.
The Group estimates that the revisions to the standards will not have any substantial effect on the consolidated financial statements.
IFRIC 21 Levies The interpretation applies to IAS 37, ―Provisions, Contin-gent Liabilities and Contingent Assets‖. IAS 37 outlines the recognition criteria for liabilities. One of the criteria is the
requirement that the company has an existing liability which is a result of an earlier event (obligating event).
The interpretation identifies the obligating event for the recognition of a liability as the activity that triggers the payment of the levy in accordance with the relevant legisla-tion. The Group estimates that the revisions to the standards will not have any substantial effect on the consolidated
financial statements.
17 June 2014
Amendment to IFRS 11, ―Joint arrangements‖
regarding acquisition of an interest in a joint op-
eration
The amendment provides new guidance on how to account for the acquisition of an interest in a joint venture operation
that constitutes a business. In such a case the investor has to apply the principles of business combination accounting.
The amendment is applicable to both the acquisition of the initial interest and the acquisition of additional interest in the same joint operation. However, a previously held inter-est is not re-measured when the acquisition of an additional
interest in the same joint operation results in joint control. The Group estimates that the revisions to the standards will not have any substantial effect on the consolidated financial statements.
1 January 2016
(not yet en-dorsed in the
EU)
Amendment to IAS 16, ―Property, plant and equipment‖ and IAS 38, ―Intangible assets‖ re-garding depreciation and
amortisation
This amendment clarifies that the use of revenue-based methods to calculate the depreciation of an asset is not ap-propriate because revenue generated by an activity that in-cludes the use of an asset generally reflects factors other than the consumption of the economic benefits embodied in
the asset. This has also clarified that revenue is generally presumed to be an inappropriate basis for measuring the consumption of the economic benefits embodied in an intangible asset. The presumption may only be overruled in certain limited
circumstances. These are where the intangible asset is ex-pressed as a measure of revenue or where it can be demonstrated that revenue and the consumption of the economic benefits of the intangible asset are highly corre-lated. The Group estimates that the revisions to the standards
will not have any substantial effect on the consolidated financial statements.
1 January 2016 (not yet en-dorsed in the EU)

Olvi plc – Financial Statements 2014
31 | page
Subject Crucial requirements Effective date
Amendments to IFRS 10 and IAS 28 regarding the sale or contribution of assets between an in-vestor and its associate or joint venture
These amendments address an inconsistency between IFRS 10 and IAS 28 in the sale or contribution of assets between an investor and its associate or joint venture. A full gain or loss is recognised when a transaction involves a business. A partial gain or loss is recognised when a
transaction involves assets that do not constitute a busi-ness, even if those assets are in a subsidiary. The Group estimates that the revisions to the standards will not have any substantial effect on the consolidated financial statements.
1 January 2016 (not yet en-dorsed in the EU)
Annual improvements 2014
These annual improvements amend standards from the 2012-2014 reporting cycle. Changes to the following stand-ards are included: IFRS 5 ―Non-current Assets Held for Sale and Discon-
tinued Operations‖: The amendment clarifies that when an asset (or disposal group) is reclassified from ―held for sale‖ to ―held for distribution,‖ or vice versa, this does not constitute a change to a plan of sale or distri-bution, and does not have to be accounted for as such. This means that the asset (or disposal group) does not
need to be reinstated in accounting as if it had never been classified as ―held for sale‖ or ―held for distribu-tion‖ simply because the manner of disposal has changed. The amendment also explains that the guid-ance on changes in a plan of sale should be applied to
an asset (or disposal group) which ceases to be held for
distribution but is not re-classified as held for sale. IFRS 7 ―Financial Instruments: Disclosures‖: There are
two amendments: – Servicing contracts – If an entity transfers a fi-
nancial asset to a third party under conditions which allow the transferor to derecognise the as-set, IFRS 7 requires disclosure of all types of con-
tinuing involvement that the entity might still have in the transferred assets. The standard provides guidance about what is meant by continuing in-volvement. The amendment is prospective with an option to apply retrospectively. There is a conse-quential amendment to IFRS 1 to give the same relief to first time adopters.
– Interim financial statements – The amendment clarifies that the additional disclosure required by the amendments to IFRS 7, ―Disclosure – Offset-ting financial assets and financial liabilities‖ is not specifically required for all interim periods unless required by IAS 34. This amendment is retrospec-tive.
IAS 19 ―Employee benefits‖: The amendment clarifies that when determining the discount rate for defined benefit obligations, it is the currency that the liabilities are denominated in that is important, not the country where they arise. The assessment of whether there is a deep market in high-quality corporate bonds is based
on corporate bonds in that currency, not corporate bonds in a particular country. Similarly, where there is
no deep market in high-quality corporate bonds in that currency, government bonds in the relevant currency should be used.
1 January 2016 (not yet en-
dorsed in the EU)
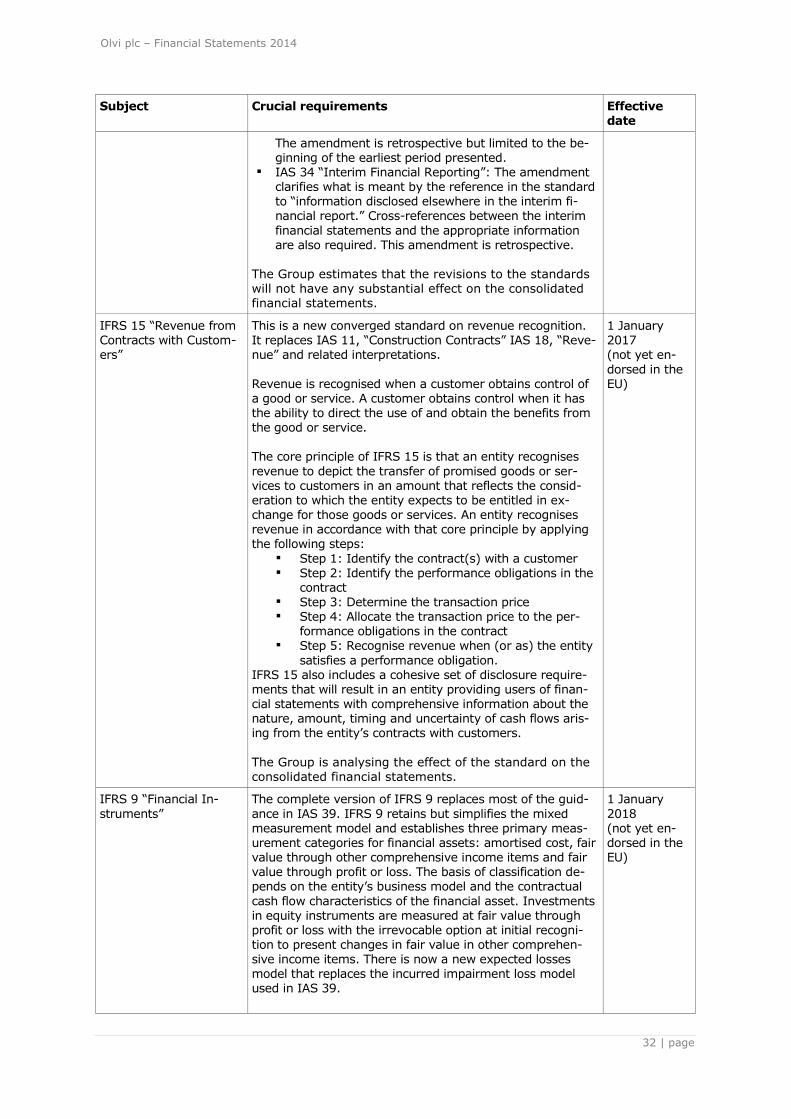
Olvi plc – Financial Statements 2014
32 | page
Subject Crucial requirements Effective date
The amendment is retrospective but limited to the be-ginning of the earliest period presented.
IAS 34 ―Interim Financial Reporting‖: The amendment clarifies what is meant by the reference in the standard to ―information disclosed elsewhere in the interim fi-nancial report.‖ Cross-references between the interim
financial statements and the appropriate information are also required. This amendment is retrospective.
The Group estimates that the revisions to the standards will not have any substantial effect on the consolidated financial statements.
IFRS 15 ―Revenue from Contracts with Custom-ers‖
This is a new converged standard on revenue recognition. It replaces IAS 11, ―Construction Contracts‖ IAS 18, ―Reve-nue‖ and related interpretations.
Revenue is recognised when a customer obtains control of a good or service. A customer obtains control when it has the ability to direct the use of and obtain the benefits from the good or service. The core principle of IFRS 15 is that an entity recognises
revenue to depict the transfer of promised goods or ser-vices to customers in an amount that reflects the consid-eration to which the entity expects to be entitled in ex-change for those goods or services. An entity recognises revenue in accordance with that core principle by applying
the following steps: Step 1: Identify the contract(s) with a customer Step 2: Identify the performance obligations in the
contract Step 3: Determine the transaction price Step 4: Allocate the transaction price to the per-
formance obligations in the contract Step 5: Recognise revenue when (or as) the entity
satisfies a performance obligation. IFRS 15 also includes a cohesive set of disclosure require-ments that will result in an entity providing users of finan-cial statements with comprehensive information about the nature, amount, timing and uncertainty of cash flows aris-ing from the entity‘s contracts with customers.
The Group is analysing the effect of the standard on the consolidated financial statements.
1 January 2017 (not yet en-
dorsed in the EU)
IFRS 9 ―Financial In-
struments‖
The complete version of IFRS 9 replaces most of the guid-
ance in IAS 39. IFRS 9 retains but simplifies the mixed measurement model and establishes three primary meas-urement categories for financial assets: amortised cost, fair value through other comprehensive income items and fair value through profit or loss. The basis of classification de-pends on the entity‘s business model and the contractual
cash flow characteristics of the financial asset. Investments in equity instruments are measured at fair value through profit or loss with the irrevocable option at initial recogni-tion to present changes in fair value in other comprehen-sive income items. There is now a new expected losses
model that replaces the incurred impairment loss model used in IAS 39.
1 January
2018 (not yet en-dorsed in the EU)
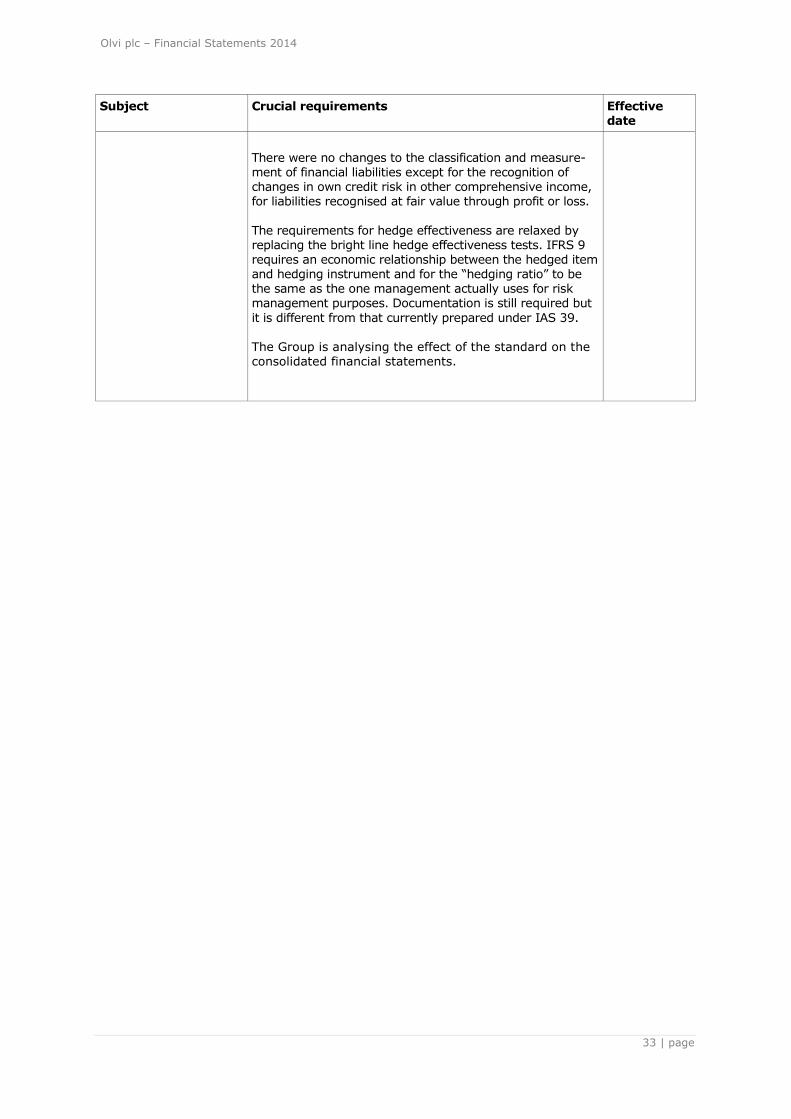
Olvi plc – Financial Statements 2014
33 | page
Subject Crucial requirements Effective date
There were no changes to the classification and measure-ment of financial liabilities except for the recognition of changes in own credit risk in other comprehensive income, for liabilities recognised at fair value through profit or loss.
The requirements for hedge effectiveness are relaxed by replacing the bright line hedge effectiveness tests. IFRS 9 requires an economic relationship between the hedged item and hedging instrument and for the ―hedging ratio‖ to be the same as the one management actually uses for risk management purposes. Documentation is still required but
it is different from that currently prepared under IAS 39.
The Group is analysing the effect of the standard on the consolidated financial statements.

Olvi plc – Financial Statements 2014
34 | page
Notes to the Consolidated Financial Statements
1. Segment information
Segment information is presented in accordance with the Group‘s geographical operating seg-ments. Operating segments are defined on the basis of reports utilised by the Group‘s top man-
agement for strategic decisions. Olvi Group‘s operating segments consist of the Group‘s geograph-ical operating areas, which are Finland, Estonia, Latvia, Lithuania and Belarus. The products and services of geographical segments are produced in a specific economic environ-ment with risks and profitability deviating from the risks and profitability of the economic envi-ronment of other geographical segments.
Net sales in the reported operating segments are mostly generated from the manufacture and
wholesale of various beverages. The net sales also include a minor amount of services to licensed restaurants in relation to beverage-serving equipment. The Group's management assesses the operating segments' performance through operating profit (EBIT). Interest income and expenses are not allocated to segments because responsibility for the Group's financing tasks is centralised in the parent company Olvi plc.
A segment‘s assets and liabilities refer to business items that the segment uses in its business op-erations or that can be allocated to segments on reasonable grounds. Unallocated items include tax and financial items, as well as items common to the entire Group. Investments include in-creases in property, plant and equipment items and intangible assets that are used during more than one accounting period.
Pricing between segments is based on market terms.
Sales of geographical segments in 2014 and 2013
1,000 litres Finland Estonia Latvia Lithuania Belarus
Elimin-
ations Group
Sales in 2014 151,828 131,550 76,096 81,054 169,919 -33,969 576,478
Sales in 2013 159,909 129,314 79,724 69,554 156,523 -37,792 557,232

Olvi plc – Financial Statements 2014
35 | page
Geographical segments 2014 in accordance with asset locations
EUR 1,000 Finland Estonia Latvia Lithuania Belarus
Elimin-
ations Group
INCOME
External sales 107,445 77,149 27,986 36,899 78,760 328,239
Internal sales 230 5,358 6,950 1,457 11 -14,006 0
Total net sales 107,675 82,507 34,936 38,356 78,771 -14,006 328,239
EARNINGS
Operating profit for
the segment 7,436 16,504 2,058 2,356 13,117 -471 41,000
Financial income 3,990
Financial expenses -3,985
Share of profit in
associates 48
Income taxes -7,974
Net profit for the
period 33,079
OTHER
INFORMATION
Segment assets 176,057 69,108 30,330 38,398 83,636 -66,565 330,964
Unallocated assets 1,791
Total
consolidated
assets 332,755
Segment liabilities 44,567 11,205 4,140 4,705 9,011 -1,152 72,476
Unallocated
liabilities 67,740
Total
consolidated
liabilities 140,216
Segment
investments 15,591 2,192 2,196 6,311 15,343 0 41,633
Unallocated
investments 0
Total
investments 41,633
Depreciation 4,736 2,856 1,508 1,600 4,372 -165 14,907
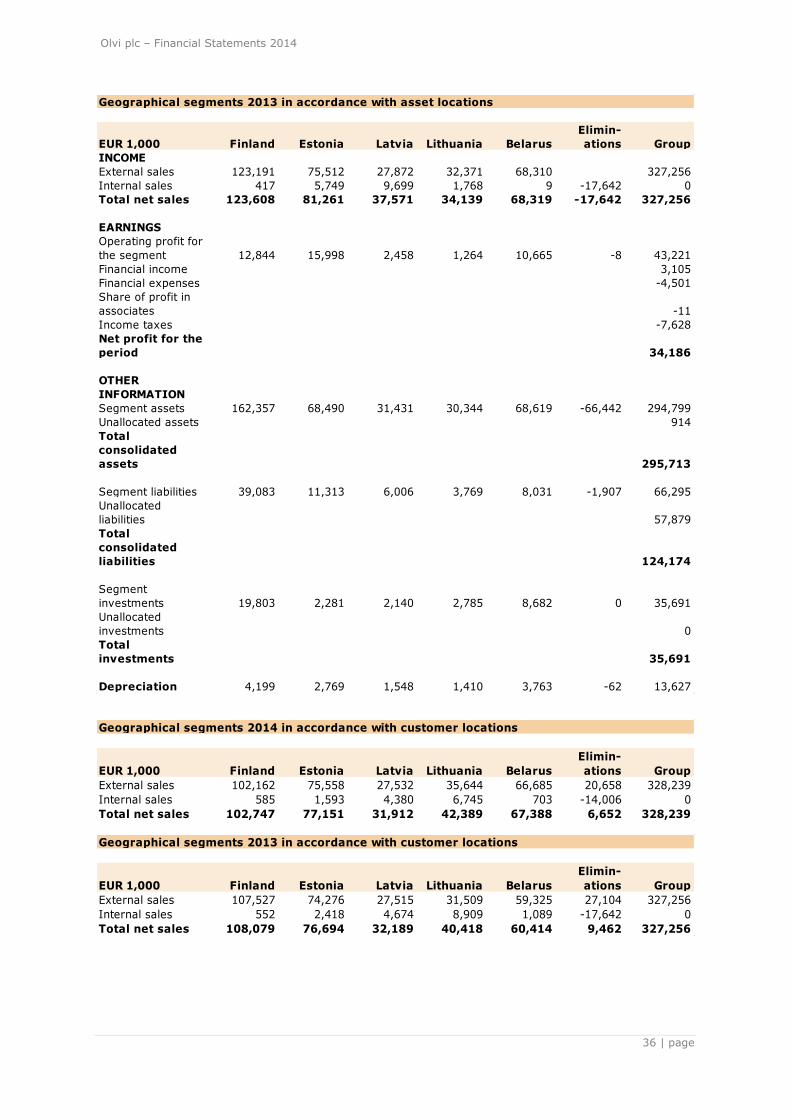
Olvi plc – Financial Statements 2014
36 | page
Geographical segments 2013 in accordance with asset locations
EUR 1,000 Finland Estonia Latvia Lithuania Belarus
Elimin-
ations Group
INCOME
External sales 123,191 75,512 27,872 32,371 68,310 327,256
Internal sales 417 5,749 9,699 1,768 9 -17,642 0
Total net sales 123,608 81,261 37,571 34,139 68,319 -17,642 327,256
EARNINGS
Operating profit for
the segment 12,844 15,998 2,458 1,264 10,665 -8 43,221
Financial income 3,105
Financial expenses -4,501
Share of profit in
associates -11
Income taxes -7,628
Net profit for the
period 34,186
OTHER
INFORMATION
Segment assets 162,357 68,490 31,431 30,344 68,619 -66,442 294,799
Unallocated assets 914
Total
consolidated
assets 295,713
Segment liabilities 39,083 11,313 6,006 3,769 8,031 -1,907 66,295
Unallocated
liabilities 57,879
Total
consolidated
liabilities 124,174
Segment
investments 19,803 2,281 2,140 2,785 8,682 0 35,691
Unallocated
investments 0
Total
investments 35,691
Depreciation 4,199 2,769 1,548 1,410 3,763 -62 13,627
Geographical segments 2014 in accordance with customer locations
EUR 1,000 Finland Estonia Latvia Lithuania Belarus
Elimin-
ations Group
External sales 102,162 75,558 27,532 35,644 66,685 20,658 328,239
Internal sales 585 1,593 4,380 6,745 703 -14,006 0
Total net sales 102,747 77,151 31,912 42,389 67,388 6,652 328,239
Geographical segments 2013 in accordance with customer locations
EUR 1,000 Finland Estonia Latvia Lithuania Belarus
Elimin-
ations Group
External sales 107,527 74,276 27,515 31,509 59,325 27,104 327,256
Internal sales 552 2,418 4,674 8,909 1,089 -17,642 0
Total net sales 108,079 76,694 32,189 40,418 60,414 9,462 327,256
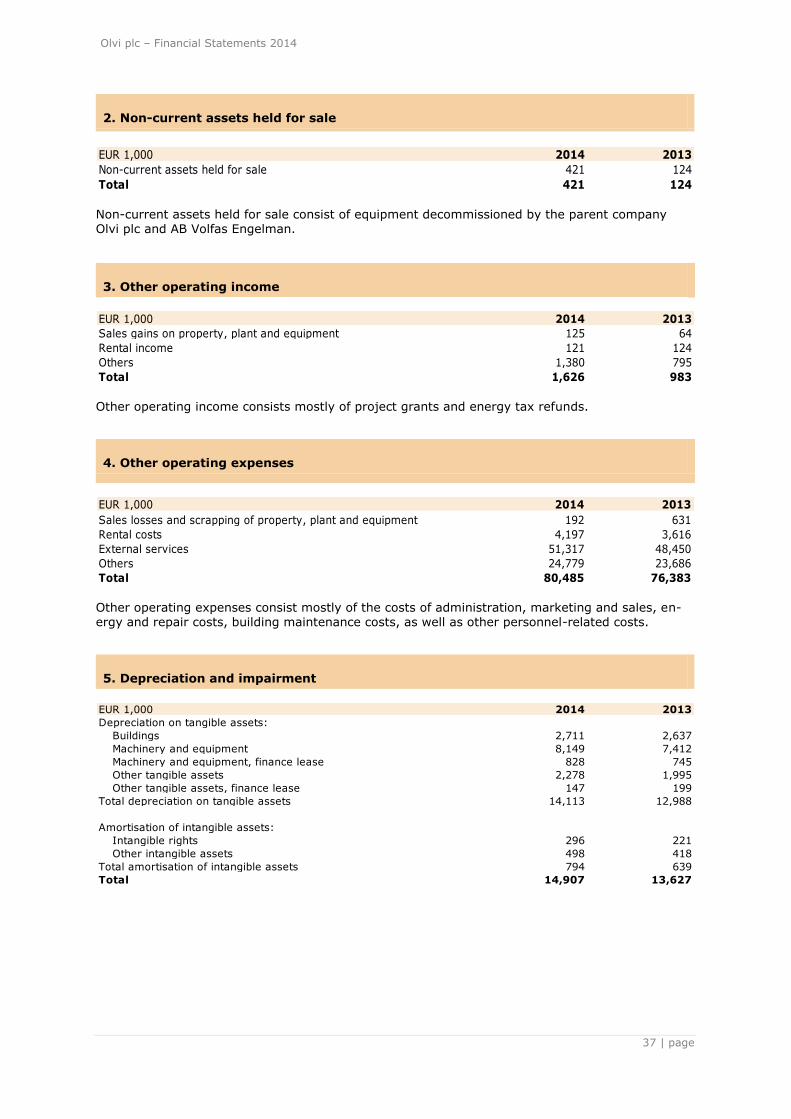
Olvi plc – Financial Statements 2014
37 | page
2. Non-current assets held for sale
EUR 1,000 2014 2013
Non-current assets held for sale 421 124
Total 421 124
Non-current assets held for sale consist of equipment decommissioned by the parent company Olvi plc and AB Volfas Engelman.
3. Other operating income
EUR 1,000 2014 2013
Sales gains on property, plant and equipment 125 64
Rental income 121 124
Others 1,380 795
Total 1,626 983
Other operating income consists mostly of project grants and energy tax refunds.
4. Other operating expenses
EUR 1,000 2014 2013
Sales losses and scrapping of property, plant and equipment 192 631
Rental costs 4,197 3,616
External services 51,317 48,450
Others 24,779 23,686
Total 80,485 76,383 Other operating expenses consist mostly of the costs of administration, marketing and sales, en-ergy and repair costs, building maintenance costs, as well as other personnel-related costs.
5. Depreciation and impairment
EUR 1,000 2014 2013
Depreciation on tangible assets:
Buildings 2,711 2,637
Machinery and equipment 8,149 7,412
Machinery and equipment, finance lease 828 745
Other tangible assets 2,278 1,995
Other tangible assets, finance lease 147 199
Total depreciation on tangible assets 14,113 12,988
Amortisation of intangible assets:
Intangible rights 296 221
Other intangible assets 498 418
Total amortisation of intangible assets 794 639
Total 14,907 13,627

Olvi plc – Financial Statements 2014
38 | page
6. Costs of employee benefits
EUR 1,000 2014 2013
Wages and salaries 33,779 33,388
Pension costs - defined contribution 2,687 2,927
Benefits exercised and payable in stock 27 0
Benefits payable in cash 17 0
Other personnel expenses 5,996 5,419
Total 42,506 41,734
Group personnel on average during the period:
Finland 369 401
Estonia 331 314
Latvia 214 215
Lithuania 214 216
Belarus 830 853
Total 1,958 1,999
Information on employee benefits and loans to management is presented in Note 30, Related par-ty transactions.
7. Research and development costs
The income statement includes 412 thousand euro of R&D costs recognised as expenses in 2014 (345 thousand euro in 2013), which is 0.1 (0.1) percent of net sales.
8. Financial income
EUR 1,000 2014 2013
Dividend income from investments held as fixed assets 4 6
Interest income from bank deposits 263 8
Adjustment for hyperinflation: effect on the company‘s
monetary net position 2,845 2,575
Other interest and financial income 878 516
Total 3,990 3,105
9. Financial expenses
EUR 1,000 2014 2013
Interest expenses on finance lease contracts 100 48
Interest expenses on financial liabilities measured
at original amortised cost 1,084 829
Net gains (-) / losses (+) from interest derivatives -171 387
Other financial expenses 2,972 3,237
Total 3,985 4,501

Olvi plc – Financial Statements 2014
39 | page
10. Income taxes
EUR 1,000 Note 2014 2013
Tax based on taxable income for the period 6,316 7,144
Taxes from previous accounting periods -95 -74
Deferred taxes 19 1,753 558
Total 7,974 7,628
Reconciliation between the tax expenses in the income statement and taxes calculated in accord-ance with the tax rate in the Group's home country 20.0 % (24.5 %):
EUR 1,000 2014 2013
Earnings before tax 41,053 41,814
Taxes calculated at the home country‘s rate 8,211 10,244
Effect of different tax rates for foreign subsidiaries -251 -1,898
Tax effect of tax-free items -136 -63
Tax effect of non-deductible items 245 86
Change in deferred tax - Change in Finnish tax rate 0 -667
Taxes from previous accounting period -95 -74
Taxes in income statement 7,974 7,628
Undiluted earnings per share are calculated by dividing the profit for the accounting period belong-ing to the parent company‘s shareholders by the weighted average of shares outstanding during the accounting period. When calculating the weighted average, the number of treasury shares in
the company‘s possession is deducted from the number of shares. Olvi plc held a total of 1,124 of its own Series A shares on 31 December 2014. Detailed information on treasury shares can be found in Note 21, Notes concerning shareholders‘
equity.
2014 2013
Profit belonging to parent company shareholders (EUR 1,000) 32,522 33,520
Weighted average number of shares during the period (1,000) 20,759 20,759
Effect of treasury shares (1,000) -1 -1
Weighted average number of shares
for the calculation of EPS (1,000) 20,758 20,758
Undiluted/diluted earnings per share (euro per share) 1.57 1.61
In the calculation of earnings per share adjusted for dilution, the weighted average number of
shares includes the diluting effect of the conversion of all potential options outstanding during the
period. When calculating the weighted average number of shares adjusted for dilution, the number of treasury shares in the company‘s possession is deducted from the number of shares. The calcu-lation of the dilution effect includes consideration for the number of treasury shares acquired using funds received from the exchange of options. Between 2005 and 2014, Olvi Group has not had options or any other schemes having a diluting effect, which means that undiluted earnings per share and earnings per share adjusted for dilution
have been equal during these years.
11. Earnings per share

Olvi plc – Financial Statements 2014
40 | page
12. Property, plant and equipment
EUR 1,000
Land and
water
properties Buildings
Machinery
and
equipment
Machinery
and
equipment,
finance
lease
Other
tangible
assets
Other
tangible
assets,
finance
lease
Advance
payments
and
unfinished
purchases Total
Acquisition cost
1 Jan 2014 1,862 98,813 223,252 7,502 15,646 980 23,376 371,431
Adjustment for
hyperinflation 0 2,277 4,333 0 1,342 0 656 8,607
Additions 0 1,008 1,987 485 991 294 34,233 38,998
Transfer to non-
current assets held for
sale 0 0 -1,008 0 0 0 0 -1,008
Deductions 0 0 -2,409 -147 -1,834 -84 -99 -4,572
Transfers between
items 0 1,170 12,326 -242 2,216 3 -15,473 0
Exchange rate
differences 0 -1,389 -2,643 0 -819 0 -580 -5,431
Acquisition cost
31 Dec 2014 1,862 101,878 235,838 7,599 17,542 1,193 42,113 408,025
Accumulated
depreciation and
impairment
1 Jan 2014 0 43,383 148,200 3,778 9,658 629 0 205,648
Adjustment for
hyperinflation 0 257 1,273 0 654 0 0 2,184
Depreciation 0 2,711 8,175 828 2,278 147 0 14,139Transfer to non-
current assets held for
sale, accumulated
depreciation 0 0 -592 0 0 0 0 -592
Accumulated
depreciation on
deductions 0 0 -2,068 -111 -1,722 -84 0 -3,986
Accumulated
depreciation on
transfers 0 0 -185 -235 237 -2 0 -185
Exchange rate
differences 0 -157 -776 0 -399 0 0 -1,332
Accumulated
depreciation and
impairment
31 Dec 2014 0 46,194 154,026 4,261 10,706 690 0 215,876
Book value
1 Jan 2014 1,862 55,430 75,052 3,724 5,988 351 23,376 165,783
Book value
31 Dec 2014 1,862 55,684 81,811 3,338 6,837 503 42,113 192,149
Other tangible assets consist mainly of vehicles, equipment included in equipment service, as well as office furniture.

Olvi plc – Financial Statements 2014
41 | page
EUR 1,000
Land and
water
properties Buildings
Machinery
and
equipment
Machinery
and
equipment,
finance
lease
Other
tangible
assets
Other
tangible
assets,
finance
lease
Advance
payments
and
unfinished
purchases Total
Acquisition cost
1 Jan 2013 1,863 97,903 215,691 7,440 13,082 1,330 6,089 343,399
Adjustment for
hyperinflation 0 2,201 4,066 0 1,088 0 62 7,417
Additions 0 1,186 7,793 242 2,434 121 28,772 40,548
Transfer to non-
current assets held for
sale 0 0 -3,153 0 0 0 0 -3,153
Deductions 0 -523 -519 0 -578 -17 -7,632 -9,270
Transfers between
items 0 173 3,315 -180 583 -444 -3,547 -102
Exchange rate
differences -1 -2,128 -3,941 0 -962 -9 -368 -7,409
Acquisition cost
31 Dec 2013 1,862 98,813 223,252 7,502 15,646 980 23,376 371,431
Accumulated
depreciation and
impairment
1 Jan 2013 0 40,959 144,316 2,936 7,542 898 0 196,650
Adjustment for
hyperinflation 0 199 1,018 0 431 0 0 1,647
Depreciation 0 2,637 7,412 745 1,995 199 0 12,988
Accumulated
depreciation on
deductions 0 206 361 278 -131 -17 0 697
Accumulated
depreciation on
transfers 0 -199 -2,038 -180 669 -444 0 -2,192
Exchange rate
differences 0 -420 -2,868 0 -848 -6 0 -4,142
Accumulated
depreciation and
impairment
31 Dec 2013 0 43,383 148,200 3,778 9,658 629 0 205,648
Book value
1 Jan 2013 1,863 56,944 71,375 4,505 5,540 432 6,089 146,749
Book value
31 Dec 2013 1,862 55,430 75,052 3,724 5,988 351 23,376 165,783
Other tangible assets consist mainly of vehicles, equipment included in equipment service, as well
as office furniture.

Olvi plc – Financial Statements 2014
42 | page
13. Intangible assets
EUR 1,000 Goodwill
Intangible
rights
Other
intangible
assets Total
Acquisition cost 1 Jan 2014 22,782 10,773 11,385 44,939
Adjustment for hyperinflation 1,057 57 0 1,114
Additions 0 2,196 439 2,635
Deductions 0 -100 0 -100
Exchange rate differences -645 -35 0 -680
Acquisition cost 31 Dec 2014 23,194 12,890 11,824 47,908
Accumulated depreciation and
impairment 1 Jan 2014 4,977 9,605 9,851 24,433
Adjustment for hyperinflation 0 5 0 5
Depreciation 0 296 498 794
Accumulated depreciation on deductions 0 -100 0 -100
Exchange rate differences 0 -3 0 -3
Accumulated depreciation and
impairment 31 Dec 2014 4,977 9,802 10,349 25,129
Book value 1 Jan 2014 17,805 1,168 1,534 20,506
Book value 31 Dec 2014 18,217 3,088 1,475 22,779
Intangible rights consist mainly of trademarks and leases on land areas. Other intangible assets consist mainly of computer software.
EUR 1,000 Goodwill
Intangible
rights
Other
intangible
assets Total
Acquisition cost 1 Jan 2013 22,707 10,203 10,735 43,645
Adjustment for hyperinflation 173 1 0 174
Additions 0 588 649 1,237
Deductions 0 0 0 0
Transfers between items 0 21 0 21
Exchange rate differences -98 -41 0 -139
Acquisition cost 31 Dec 2013 22,782 10,773 11,385 44,939
Accumulated depreciation and
impairment 1 Jan 2013 4,977 9,386 9,433 23,796
Adjustment for hyperinflation 0 0 0 0
Depreciation 0 221 418 639
Exchange rate differences 0 -2 0 -2
Accumulated depreciation and
impairment 31 Dec 2013 4,977 9,605 9,851 24,433
Book value 1 Jan 2013 17,730 817 1,303 19,849
Book value 31 Dec 2013 17,805 1,168 1,534 20,506
Intangible rights consist mainly of trademarks. Other intangible assets consist mainly of computer software.
14. Impairment testing of goodwill
Goodwill allocated to the Estonian segment amounts to 8,146 thousand euro, to the Latvian seg-ment 287 thousand euro, to the Lithuanian segment 2,241 thousand euro and to the Belarusian segment 7,543 thousand euro.
The estimated future cash flows used for impairment testing are based on the financial plans of the geographical segments approved by Group management. The cash flow estimates are based on financial plans for the next four years. Cash flow estimates due later than four years are ex-trapolated using estimated growth rates that do not exceed the estimated long-term growth rates of the cash generating units. The growth rates applied to each segment were as follows: Estonia
2.0% (2.0%), Latvia 2.0% (3.5%), Lithuania 3.0% (4.5%) and Belarus 7.0% (8.5%). In the as-
sessment of future cash flows, management has also compared previous financial plans with actu-al development.

Olvi plc – Financial Statements 2014
43 | page
The discount rate is weighted average cost of capital (WACC) before taxes: in Estonia 11.12
(10.80 in 2013), in Latvia 11.70 (11.50), in Lithuania 11.87 (12.02) and in Belarus 17.11 (16.82) percent.
In the management‘s opinion, any reasonably potential change in any of the variables used for as-sessing each segment‘s recoverable amount could not lead into a situation in which the segments‘ recoverable amounts would be lower than their book values. According to sensitivity analysis applied to impairment testing, there is currently no need for recognition of impairment. The Board of Directors of Olvi plc is actively monitoring the develop-ment of the economic situation in the subsidiary countries and any effects this may have.
15. Financial assets available for sale
Other financial assets consist mostly of unquoted equity investments contributing to the Group company's operations, as well as shares in a housing corporation. Financial assets available for sale are recognised at fair value. If fair value cannot be reliably determined, the assets are recog-
nised at original cost. EUR 1,000 Note 2014 2013
Book value 1 January 549 549
Additions 0 0
Book value 31 December 26 549 549
16. Loans receivable and other non-current receivables
EUR 1,000 Note 2014 2013
Loans receivable 26 195 211
Other non-current receivables 26 138 138
Total 333 349
Other non-current receivables consist mainly of security deposits.
17. Inventories
EUR 1,000 2014 2013
Materials and supplies 29,741 27,106
Unfinished products 2,034 2,140
Finished products/goods 9,169 9,947
Other inventories 2,578 1,985
Total 43,522 41,178
Non-marketability deductions on inventories have been booked for 3,339 thousand euro in 2014 (2,256 thousand euro in 2013).
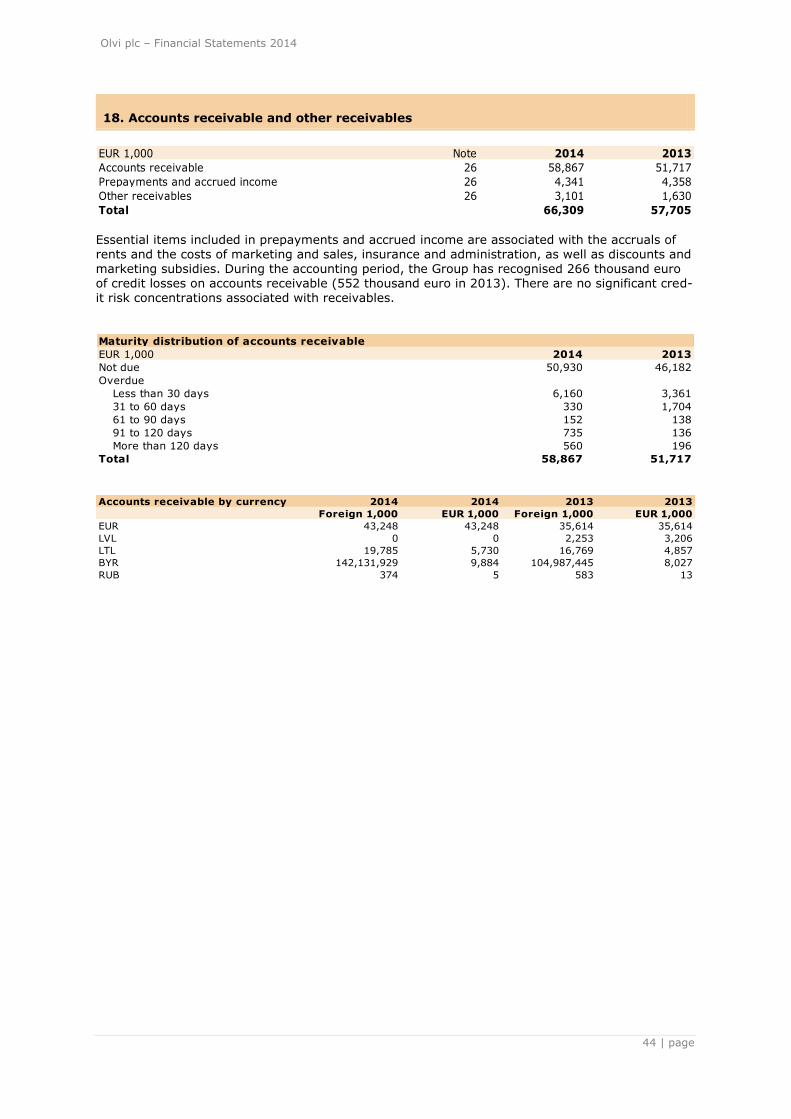
Olvi plc – Financial Statements 2014
44 | page
18. Accounts receivable and other receivables
EUR 1,000 Note 2014 2013
Accounts receivable 26 58,867 51,717
Prepayments and accrued income 26 4,341 4,358
Other receivables 26 3,101 1,630
Total 66,309 57,705 Essential items included in prepayments and accrued income are associated with the accruals of rents and the costs of marketing and sales, insurance and administration, as well as discounts and marketing subsidies. During the accounting period, the Group has recognised 266 thousand euro of credit losses on accounts receivable (552 thousand euro in 2013). There are no significant cred-it risk concentrations associated with receivables.
Maturity distribution of accounts receivable
EUR 1,000 2014 2013
Not due 50,930 46,182
Overdue
Less than 30 days 6,160 3,361
31 to 60 days 330 1,704
61 to 90 days 152 138
91 to 120 days 735 136
More than 120 days 560 196
Total 58,867 51,717
Accounts receivable by currency 2014 2014 2013 2013
Foreign 1,000 EUR 1,000 Foreign 1,000 EUR 1,000
EUR 43,248 43,248 35,614 35,614
LVL 0 0 2,253 3,206
LTL 19,785 5,730 16,769 4,857
BYR 142,131,929 9,884 104,987,445 8,027
RUB 374 5 583 13
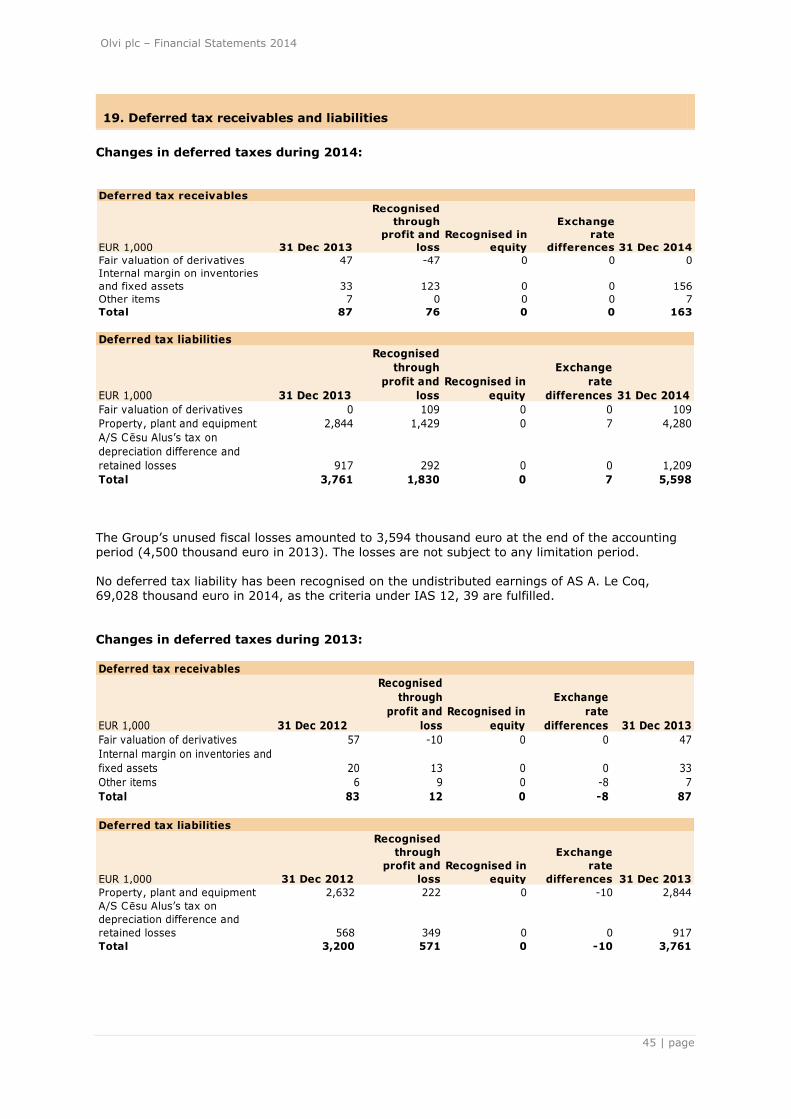
Olvi plc – Financial Statements 2014
45 | page
19. Deferred tax receivables and liabilities
Changes in deferred taxes during 2014:
Deferred tax receivables
EUR 1,000 31 Dec 2013
Recognised
through
profit and
loss
Recognised in
equity
Exchange
rate
differences 31 Dec 2014
Fair valuation of derivatives 47 -47 0 0 0
Internal margin on inventories
and fixed assets 33 123 0 0 156
Other items 7 0 0 0 7
Total 87 76 0 0 163
Deferred tax liabilities
EUR 1,000 31 Dec 2013
Recognised
through
profit and
loss
Recognised in
equity
Exchange
rate
differences 31 Dec 2014
Fair valuation of derivatives 0 109 0 0 109
Property, plant and equipment 2,844 1,429 0 7 4,280
A/S Cēsu Alus‘s tax on
depreciation difference and
retained losses 917 292 0 0 1,209
Total 3,761 1,830 0 7 5,598
The Group‘s unused fiscal losses amounted to 3,594 thousand euro at the end of the accounting period (4,500 thousand euro in 2013). The losses are not subject to any limitation period. No deferred tax liability has been recognised on the undistributed earnings of AS A. Le Coq, 69,028 thousand euro in 2014, as the criteria under IAS 12, 39 are fulfilled.
Changes in deferred taxes during 2013:
Deferred tax receivables
EUR 1,000 31 Dec 2012
Recognised
through
profit and
loss
Recognised in
equity
Exchange
rate
differences 31 Dec 2013
Fair valuation of derivatives 57 -10 0 0 47
Internal margin on inventories and
fixed assets 20 13 0 0 33
Other items 6 9 0 -8 7
Total 83 12 0 -8 87
Deferred tax liabilities
EUR 1,000 31 Dec 2012
Recognised
through
profit and
loss
Recognised in
equity
Exchange
rate
differences 31 Dec 2013
Property, plant and equipment 2,632 222 0 -10 2,844
A/S Cēsu Alus‘s tax on
depreciation difference and
retained losses 568 349 0 0 917
Total 3,200 571 0 -10 3,761
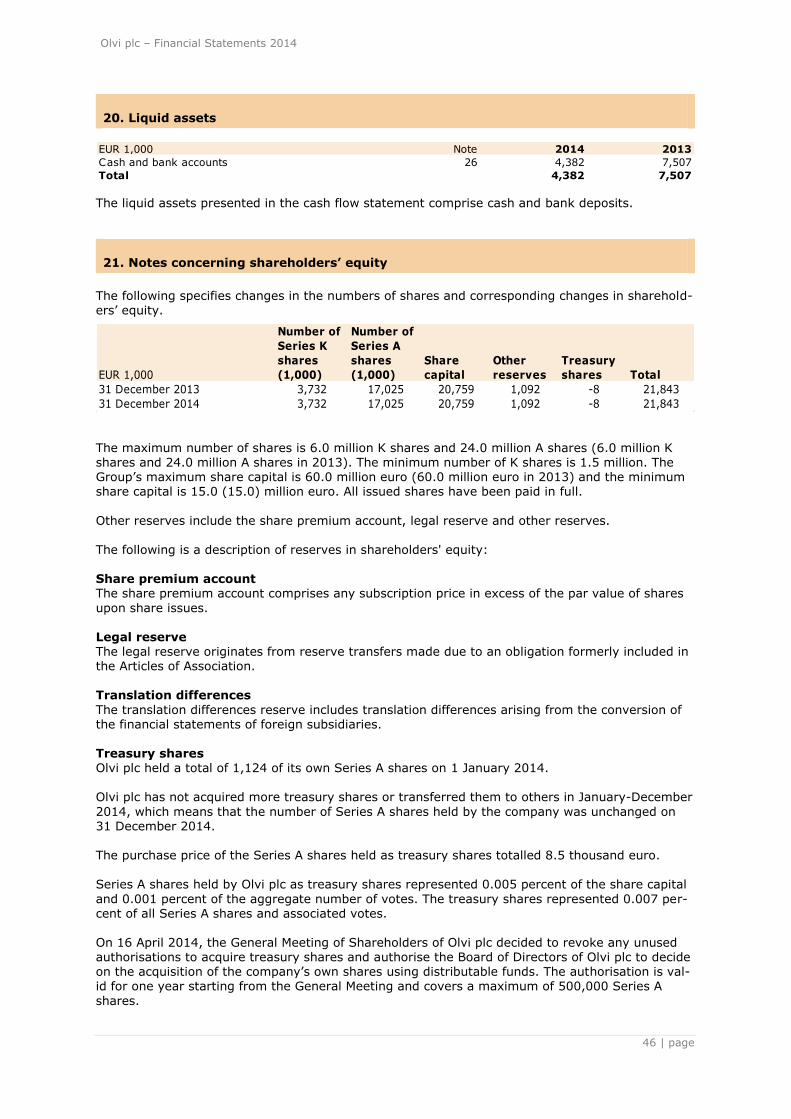
Olvi plc – Financial Statements 2014
46 | page
20. Liquid assets
EUR 1,000 Note 2014 2013
Cash and bank accounts 26 4,382 7,507
Total 4,382 7,507
The liquid assets presented in the cash flow statement comprise cash and bank deposits.
21. Notes concerning shareholders’ equity
The following specifies changes in the numbers of shares and corresponding changes in sharehold-ers‘ equity.
The maximum number of shares is 6.0 million K shares and 24.0 million A shares (6.0 million K shares and 24.0 million A shares in 2013). The minimum number of K shares is 1.5 million. The Group‘s maximum share capital is 60.0 million euro (60.0 million euro in 2013) and the minimum share capital is 15.0 (15.0) million euro. All issued shares have been paid in full.
Other reserves include the share premium account, legal reserve and other reserves.
The following is a description of reserves in shareholders' equity: Share premium account The share premium account comprises any subscription price in excess of the par value of shares
upon share issues. Legal reserve The legal reserve originates from reserve transfers made due to an obligation formerly included in the Articles of Association. Translation differences
The translation differences reserve includes translation differences arising from the conversion of the financial statements of foreign subsidiaries. Treasury shares
Olvi plc held a total of 1,124 of its own Series A shares on 1 January 2014. Olvi plc has not acquired more treasury shares or transferred them to others in January-December
2014, which means that the number of Series A shares held by the company was unchanged on 31 December 2014. The purchase price of the Series A shares held as treasury shares totalled 8.5 thousand euro. Series A shares held by Olvi plc as treasury shares represented 0.005 percent of the share capital
and 0.001 percent of the aggregate number of votes. The treasury shares represented 0.007 per-cent of all Series A shares and associated votes. On 16 April 2014, the General Meeting of Shareholders of Olvi plc decided to revoke any unused authorisations to acquire treasury shares and authorise the Board of Directors of Olvi plc to decide on the acquisition of the company‘s own shares using distributable funds. The authorisation is val-
id for one year starting from the General Meeting and covers a maximum of 500,000 Series A
shares.
EUR 1,000
Number of
Series K
shares
(1,000)
Number of
Series A
shares
(1,000)
Share
capital
Other
reserves
Treasury
shares Total
31 December 2013 3,732 17,025 20,759 1,092 -8 21,843
31 December 2014 3,732 17,025 20,759 1,092 -8 21,843

Olvi plc – Financial Statements 2014
47 | page
The Annual General Meeting also decided to revoke all existing unused authorisations for the
transfer of own shares and authorise the Board of Directors to decide on the issue of a maximum of 1,000,000 new Series A shares and the transfer of a maximum of 500,000 Series A shares held as treasury shares. In January-December 2014, the Board of Directors of Olvi plc has not exer-
cised the authorisations granted by the General Meeting. Dividends After the balance sheet date, the Board of Directors has proposed a dividend of 0.65 euro per share for both Series K and Series A shares for 2014, totalling 13.5 million euro. Dividend for 2013 was paid at 0.65 euro per share, totalling 13.5 million euro. The dividends were paid on 30 April 2014.
22. Share-based payments
On 29 April 2014, Olvi plc‘s Board of Directors decided on a new share-based incentive plan for the Group‘s key personnel. The aim of the new plan is to combine the objectives of the sharehold-ers and the key employees in order to increase the value of the company, to commit the key em-ployees to the company, and to offer them a competitive reward plan based on earning the com-pany‘s shares. The new share-based incentive plan includes one three-year performance period, calendar years
2014—2016. The potential reward from the performance period 2014—2016 will be based on Olvi Group‘s cumulative operating profit, also known as earnings before interest and taxes (EBIT) Fur-thermore, the new plan includes one three-year performance period, beginning on 1 July 2014 and ending on 30 June 2017. The prerequisite for receiving reward on the basis of this performance period is that a key employee purchases the company‘s series A shares up to the number deter-mined by the Board of Directors. Furthermore, entitlement to a reward is tied to the continuance
of employment or service upon reward payment.
Rewards from both performance periods will be paid partly in the company‘s series A shares and partly in cash in 2017. The cash proportion is intended to cover taxes and tax-related costs arising from the rewards to the key employees. As a rule, no reward will be paid if the key employee‘s employment or service ends before the reward payment. Members of the Management Group must hold one half of the shares received on the basis of the performance period 2014—2016 for
the entire validity of their employment or service. The plan is directed to approximately 50 people. The rewards to be paid on the basis of the plan are in total an approximate maximum of 40,000 series A shares in Olvi plc and a cash payment needed for taxes and tax-related costs arising from the shares. From January to December 2014, accounting entries associated with the performance period from
1 July 2014 to 30 June 2017 were recognised for a total of 44.7 thousand euro.
Olvi Group does not have any other share-based plans or option plans.
23. Financial liabilities
EUR 1,000 Book values Fair values Book values Fair values
Note 2014 2014 2013 2013
Non-current liabilities
Loans from financial institutions 26 27,344 26,418 25,638 24,582
Finance lease liabilities 26 2,680 2,680 2,829 2,829
Other liabilities 26 16 16 16 16
Total 30,040 29,114 28,483 27,427
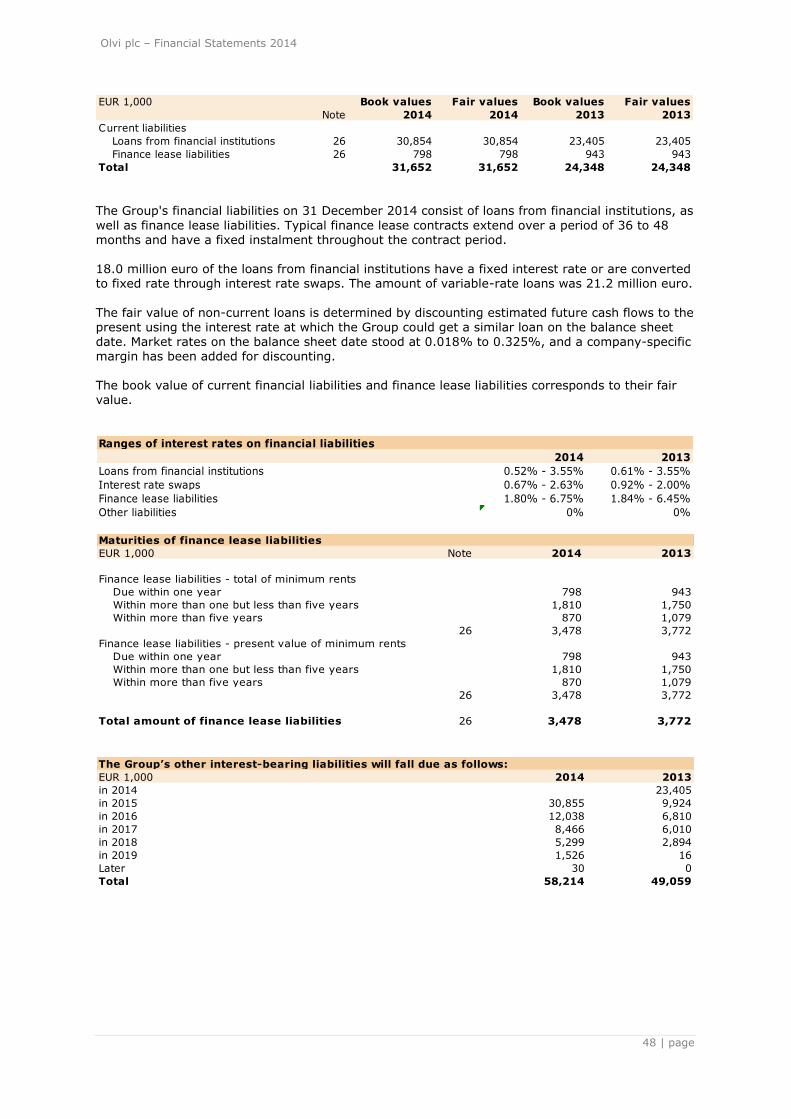
Olvi plc – Financial Statements 2014
48 | page
EUR 1,000 Book values Fair values Book values Fair values
Note 2014 2014 2013 2013
Current liabilities
Loans from financial institutions 26 30,854 30,854 23,405 23,405
Finance lease liabilities 26 798 798 943 943
Total 31,652 31,652 24,348 24,348 The Group's financial liabilities on 31 December 2014 consist of loans from financial institutions, as
well as finance lease liabilities. Typical finance lease contracts extend over a period of 36 to 48 months and have a fixed instalment throughout the contract period. 18.0 million euro of the loans from financial institutions have a fixed interest rate or are converted to fixed rate through interest rate swaps. The amount of variable-rate loans was 21.2 million euro.
The fair value of non-current loans is determined by discounting estimated future cash flows to the
present using the interest rate at which the Group could get a similar loan on the balance sheet date. Market rates on the balance sheet date stood at 0.018% to 0.325%, and a company-specific margin has been added for discounting. The book value of current financial liabilities and finance lease liabilities corresponds to their fair value.
Ranges of interest rates on financial liabilities
2014 2013
Loans from financial institutions 0.52% - 3.55% 0.61% - 3.55%
Interest rate swaps 0.67% - 2.63% 0.92% - 2.00%
Finance lease liabilities 1.80% - 6.75% 1.84% - 6.45%
Other liabilities 0% 0%
Maturities of finance lease liabilities
EUR 1,000 Note 2014 2013
Finance lease liabilities - total of minimum rents
Due within one year 798 943
Within more than one but less than five years 1,810 1,750
Within more than five years 870 1,079
26 3,478 3,772
Finance lease liabilities - present value of minimum rents
Due within one year 798 943
Within more than one but less than five years 1,810 1,750
Within more than five years 870 1,079
26 3,478 3,772
Total amount of finance lease liabilities 26 3,478 3,772 The Group’s other interest-bearing liabilities will fall due as follows:
EUR 1,000 2014 2013
in 2014 23,405
in 2015 30,855 9,924
in 2016 12,038 6,810
in 2017 8,466 6,010
in 2018 5,299 2,894
in 2019 1,526 16
Later 30 0
Total 58,214 49,059

Olvi plc – Financial Statements 2014
49 | page
24. Accounts payable and other liabilities
EUR 1,000 Note 2014 2013
Current
Accounts payable 26 35,702 34,501
Accrued expenses 26 8,183 9,235
Other liabilities 26 29,014 22,968
Total 72,899 66,704
Essential items included in accrued expenses are associated with subsequent remuneration and salary obligations. Other liabilities include, among other things, accruals related to indirect taxes. Distribution of accounts payable by currency
2014 2014 2013 2013
Foreign 1,000 EUR 1,000 Foreign 1,000 EUR 1,000
EUR 30,234 30,234 29,155 29,155
LVL 0 0 897 1,277
LTL 7,480 2,166 4,177 1,210
USD 86 71 34 24
CHF 0 0 9 7
BYR 45,962,289 3,196 36,694,720 2,805
GBP 1 1 19 23
RUB 2,493 34 0 0
25. Management of financing risks
The Group is exposed to several financing risks in its normal course of business: market risk (in-
cluding foreign exchange risk as well as interest rate risk on cash flow and fair value), credit risk
and liquidity risk. The objective of financing risk management is to minimise the adverse effects of changes in the financial markets on the Group‘s financial performance, shareholders' equity and liquidity. The general principles of the Group‘s risk management are approved by the Board of Directors of the parent company, and the parent company‘s management together with the management of sub-
sidiaries is responsible for their practical implementation. Responsibility for Olvi Group‘s financing tasks is centralised in the parent company Olvi plc. The objectives of centralisation include optimi-sation of cash flows and financing costs, as well as efficient risk management. I Market risk
I 1. Foreign exchange risk Olvi Group operates internationally, and its business involves risks arising from exchange rate
fluctuations. Foreign exchange risks arise from commercial transactions, in other words cash flows
from purchases and sales, as well as investments in foreign subsidiaries and the conversion of their balance sheet items into euro. Due to the nature of the business, the time between order and delivery is short, which results in minor operations-related foreign exchange risk. Foreign exchange risk is also reduced by the fact that most of the Group‘s product sales and purchases of raw materials are denominated in euro.
The Group‘s ordinary operations made 2,961 thousand euro of exchange rate losses in 2014 (3,170 thousand euro in 2013). Financial income includes 3,605 thousand euro of exchange rate gains (2,580 thousand euro in 2013). The Group has investments in foreign subsidiaries in Estonia, Latvia, Lithuania and Belarus. The Estonian and Latvian currency is the euro, and Lithuania will adopt the euro as of the beginning of 2015. With regard to the investment in Belarus, the Group is exposed to risk arising from the con-
version of the subsidiary investment made in BYR into the parent company‘s functional currency.
With regard to the net investment in the Belarusian subsidiary, the Group is exposed to balance sheet conversion risk. The translation position (BYR) on 31 December 2014 was EUR 49.1 million (37.3 million in 2013). An exchange rate change of +/- 10 percent would impact consolidated

Olvi plc – Financial Statements 2014
50 | page
shareholders' equity by approximately +5.9/-4.1 million euro. The Belarusian currency also carries
a risk of devaluation; if realised, this would result in a decline in Olvi Group‘s operating profit de-nominated in euro. Hyperinflationary accounting in accordance with IAS 29 is observed with re-gard to Belarus. This is described in the consolidated accounting policies and, along with the risk
of devaluation, may have an impact on the Group‘s operating profit denominated in euro. Olvi Group regularly assesses the exchange rate risks related to operations and financing. Ex-change rates can be hedged if required by the situation at hand. Foreign currency accounts receivable and payable are presented in Notes 18, Accounts receivable and other receivables and 24, Accounts payable and other liabilities.
I 2. Interest rate risk on cash flow and fair value The Group‘s interest rate risk arises from non-current liabilities. Most of the Group‘s income and
operational cash flows are independent of market interest rate fluctuations.
The Group has diversified its borrowing between fixed- and variable-rate loans. The Group uses in-terest rate swaps to reduce interest rate risk if required by the debt market conditions. On the balance sheet date, fixed-rate loans accounted for 24.5 percent (51.2 in 2013) of interest-bearing loans. Variable-rate loans accounted for 75.5 (48.8) percent of all interest-bearing loans. The principal-weighted average maturity of interest-bearing loans was 3.3 (3.7) years. Fixed currency swaps taken out for the purpose of hedging against foreign exchange risk associat-
ed with loans denominated in foreign currency are recognised at fair value. The Group does not apply hedge accounting in accordance with IAS 39. The amount of payment obligations under finance lease contracts on 31 December 2014 was 3.5 million euro (3.8 million euro in 2013).
The Group aims to optimise financing costs through operational measures and to manage interest
rate risk using available means. The maturity distribution of financial liabilities is presented in Note 23, Financial liabilities. Sensitivity analysis of interest rate risks according to IFRS 7 The following assumptions have been used when preparing the interest rate risk analysis: The
sensitivity analysis represents the pre-tax net earnings effect of a reasonably potential change (= +/- 2%). The effect of a change in the interest rate level is calculated on the amount of interest-bearing variable-rate debt at year-end, in other words, net debt is assumed to remain at the year-end level for the entire accounting period. Variable-rate net debt on 31 December 2014 amounted to 21,153 thousand euro (23,930). A change of two (2) percent in the interest rate level would cause a change of +/- 423 thousand eu-
ro in financial expenses. The change does not have any essential effect on consolidated net profit
before tax or the consolidated balance sheet. II Credit risk
The Group's credit risk arises from wholesale and HoReCa (hotel, restaurant, catering) customers with outstanding accounts receivable.
Creditworthiness requirements for the Group‘s customers are reviewed annually and always when entering into agreements with new customers. The Group only extends credit to businesses with flawless credit ratings. Furthermore, the Group aims to control credit risks through efficient collec-tion of receivables. The amount of customer-specific accounts receivable is monitored regularly, and the customer‘s
creditworthiness is re-assessed if necessary.
The Group does not have any significant concentrations of credit risk on receivables because its accounts receivable are distributed across a wide and geographically diversified customer base.

Olvi plc – Financial Statements 2014
51 | page
Investments related to cash management are made in liquid money market instruments having a
fundamentally low risk. The largest customer accounts for 10.6 percent (12.1 in 2013) of the Group‘s total sales. The
amount of credit losses recognised in 2014 was 266 (552) thousand euro. The maturity distribution of accounts receivable is presented in Note 18, Accounts receivable and other receivables. III Liquidity risk
Olvi Group's parent company and subsidiaries prepare monthly rolling cash flow estimates that the Group uses for assessing the amount of financing required for business operations in order to maintain sufficient liquid assets to fund everyday operations and investments, as well as to repay any loans falling due.
The Group aims to secure the availability and flexibility of funding by centralising the management of the Group's liquid assets with the parent company. The Group uses several banks and several forms of financing. The Group aims to secure the availability and flexibility of funding with an ac-count overdraft facility and credit limits. On the date of closing the accounts, the Group had 24 million euro of unused credit limits and an
account overdraft facility of 5 million euro, 3.7 million euro of which was unused. Some of the fa-cilities are valid until further notice, while some are renewed annually. On the balance sheet date, 10 million euro of the limits was binding and was renewed on 25 February 2014 for the next two years. 14 million euro was unbinding. The parent company Olvi plc issued a 20 million euro commercial paper programme in 2002 in or-der to secure short-term liquidity needs quickly and cost-efficiently. At the time of closing the ac-
counts, Olvi plc had 17.0 million euro of short-term loans withdrawn under the commercial paper
programme. In order to secure short-term liquidity, operating capital is monitored regularly, and the aim is to reduce the amount of money tied in operating capital. Key factors include monitoring the turnover rate of receivables and improving the efficiency of credit control.
The Group had 4,382 thousand euro of liquid assets on 31 December 2014 (7,507 thousand euro in 2013). The Group‘s liquidity on the balance sheet date was good. The current ratio on 31 De-cember 2014 was 1.1 (1.2 in 2013). Note 23, Financial liabilities, presents the maturity distribution of financial liabilities. IV Capital risk management
Olvi Group‘s long-term objective is to generate the highest possible added value on invested capi-tal, taking into account the expectations imposed on the Group by various parties. The main prin-ciple of capital management is to maintain Olvi Group‘s strong financial position and to ensure that the Group‘s financing needs can be fulfilled cost-efficiently also under critical financial market con-ditions.
Another objective is to maintain an optimal capital structure in order to manage and reduce the cost of capital. In order to maintain or change its capital structure, the Group may change the amount of divi-dends paid to shareholders, repay capital to shareholders, issue new shares, acquire treasury shares and annul them, or sell its assets to reduce debt.
Capital is monitored through the equity to total assets ratio and the gearing ratio. Olvi Group‘s eq-uity to total assets ratio in 2014 stood at 57.9 (58.0) percent and the gearing ratio was 29.8
(26.4) percent.

Olvi plc – Financial Statements 2014
52 | page
26. Fair values of financial assets and liabilities
The fair values of Olvi Group's financial assets and liabilities do not substantially deviate from their book values. The face value of interest rate swaps was 17.4 million euro in 2014 and 24.1 million euro in 2013.
Financial assets Unquoted equity investments are recognised at purchase price as they cannot be recognised at fair value using the valuation methods. The original book value of receivables corresponds to their fair value. Financial liabilities The fair values of interest rate swaps have been determined using the method of present value of
future cash flows, supported by market interest rates and other market information on the balance
sheet date. The fair values of loans from financial institutions, finance lease liabilities, accounts payable and other liabilities do not substantially deviate from their balance sheet values. The fair values are presented in Note 23, Financial liabilities.
27. Adjustments to business cash flows
EUR 1,000 2014 2013
Transactions with no associated payment:
Depreciation 14,907 13,627
Unrealised foreign exchange gains and losses 2,388 2,984
Financial income -3,990 -3,105
Adjustment for hyperinflation -475 -2,949
Financial expenses 3,985 4,501
Income taxes 7,974 7,628
Other adjustments 910 1,528
Total 25,699 24,214
28. Other lease contracts
The Group as a lessee: EUR 1,000 2014 2013
Minimum rents payable on the basis of other
non-cancellable leases:
Due within one year 1,143 1,238
Within more than one but less than five years 758 637
Within more than five years 5 6
Total 1,906 1,881 The Group has leased operating premises and storage terminal facilities in different parts of Fin-land, as well as production machinery and equipment. The Group as a lessor: EUR 1,000 2014 2013
Minimum rents receivable on the basis of other
non-cancellable leases:
Due within one year 1,058 1,005
Within more than one but less than five years
Within more than five years
Total 1,058 1,005
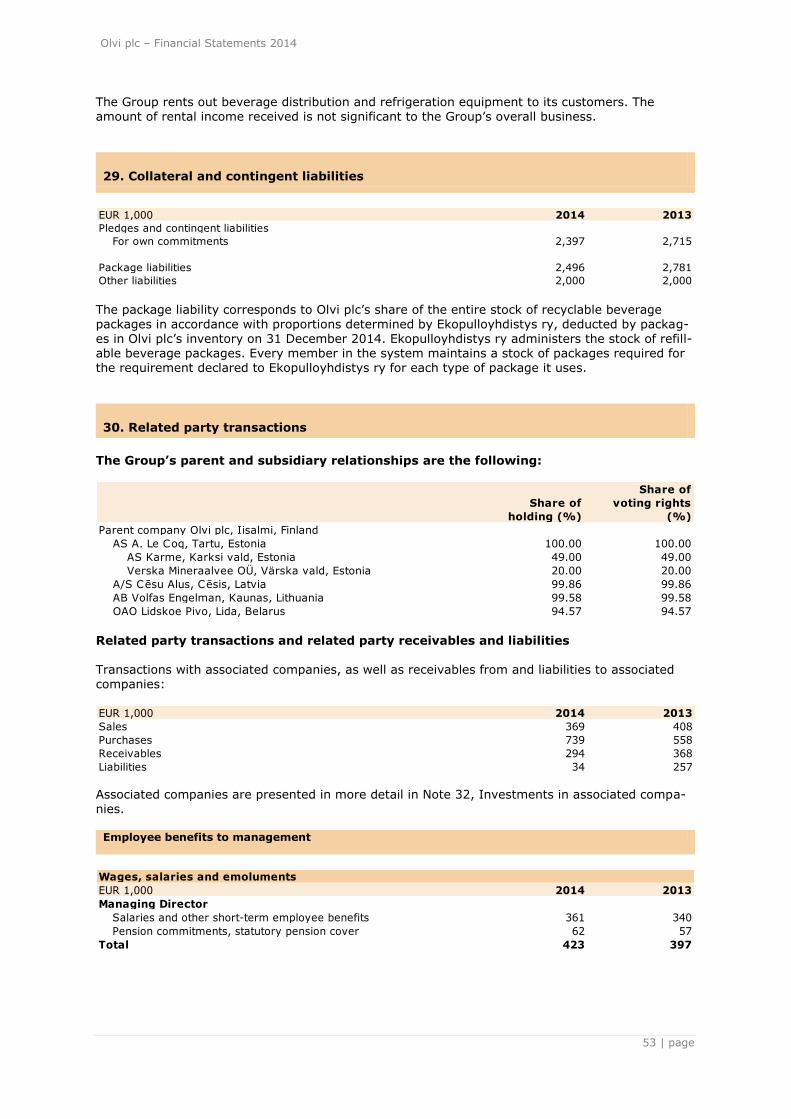
Olvi plc – Financial Statements 2014
53 | page
The Group rents out beverage distribution and refrigeration equipment to its customers. The
amount of rental income received is not significant to the Group‘s overall business.
29. Collateral and contingent liabilities
EUR 1,000 2014 2013
Pledges and contingent liabilities
For own commitments 2,397 2,715
Package liabilities 2,496 2,781
Other liabilities 2,000 2,000
The package liability corresponds to Olvi plc‘s share of the entire stock of recyclable beverage
packages in accordance with proportions determined by Ekopulloyhdistys ry, deducted by packag-es in Olvi plc‘s inventory on 31 December 2014. Ekopulloyhdistys ry administers the stock of refill-able beverage packages. Every member in the system maintains a stock of packages required for the requirement declared to Ekopulloyhdistys ry for each type of package it uses.
30. Related party transactions
The Group’s parent and subsidiary relationships are the following:
Share of
holding (%)
Share of
voting rights
(%)
Parent company Olvi plc, Iisalmi, Finland
AS A. Le Coq, Tartu, Estonia 100.00 100.00
AS Karme, Karksi vald, Estonia 49.00 49.00
Verska Mineraalvee OÜ, Värska vald, Estonia 20.00 20.00
A/S Cēsu Alus, Cēsis, Latvia 99.86 99.86
AB Volfas Engelman, Kaunas, Lithuania 99.58 99.58
OAO Lidskoe Pivo, Lida, Belarus 94.57 94.57 Related party transactions and related party receivables and liabilities Transactions with associated companies, as well as receivables from and liabilities to associated companies: EUR 1,000 2014 2013
Sales 369 408
Purchases 739 558
Receivables 294 368
Liabilities 34 257
Associated companies are presented in more detail in Note 32, Investments in associated compa-nies. Employee benefits to management
Wages, salaries and emoluments
EUR 1,000 2014 2013
Managing Director
Salaries and other short-term employee benefits 361 340
Pension commitments, statutory pension cover 62 57
Total 423 397

Olvi plc – Financial Statements 2014
54 | page
Compensation paid to members of the Board of Directors for
Board duties
Heikki Hortling 84 85
Esa Lager 36 37
Heikki Sinnemaa 30 31
Jaakko Autere 30 31
Tarja Pääkkönen 30 31
Total 209 215
No loans have been granted to management.
31. Costs arising from audit
EUR 1,000 2014 2013
Fees for statutory audit 102 133
Other services 88 93
Total 190 226
32. Shares in associates
Information on the Group‘s associated companies and their aggregate assets, liabilities, net sales and profit/loss:
EUR 1,000
Share of
holding (%) 2014 2013
AS Karme, Karksi vald, Estonia 49.00
Current assets 378 446
Non-current assets 745 779
Current liabilities 335 491
Non-current liabilities 2 8
Net sales 1,579 1,733
Profit/loss 51 -8
Verska Mineraalvee OÜ, Värska vald, Estonia 20.00
Current assets 149 104
Non-current assets 440 442
Current liabilities 138 184
Non-current liabilities 171 196
Net sales 584 438
Profit/loss 114 42

Olvi plc – Financial Statements 2014
55 | page
Consolidated Financial Ratios 2012 to 2014 BUSINESS VOLUME AND PROFITABILITY
EUR 1,000 2014 2013 2012
IFRS IFRS IFRS
Net sales 328,239 327,256 304,891
Change, % 0.3 7.3 9.3
Operating profit 41,000 43,221 30,537
% of net sales 12.5 13.2 10.0
Financial income and expenses 5 -1,396 1,778
Profit before tax 41,053 41,814 32,315
% of net sales 12.5 12.8 10.6
Net profit for the period 33,079 34,186 26,164
% of net sales 10.1 10.4 8.6
Balance sheet total 332,755 295,713 269,197
Cash flow ratio, % 14.6 14.6 15.7
Return on investment, % (ROI) 18.8 21.5 18.0
Return on equity, % (ROE) 18.2 21.4 19.0
Equity to total assets, % 57.9 58.0 54.8
Current ratio 1.1 1.2 1.3
Gearing, % 29.8 26.4 35.8
Gross capital expenditure on fixed assets 41,633 35,691 29,832
% of net sales 12.7 10.9 9.8
Net capital expenditure on fixed assets 41,047 35,484 29,351
% of net sales 12.5 10.8 9.6
Average number of personnel:
Olvi plc 369 401 401
Personnel in Estonia, Latvia,
Lithuania and Belarus 1,589 1,598 1,576
Total employees 1,958 1,999 1,977
PER-SHARE RATIOS
2014 2013 2012
IFRS IFRS IFRS
Earnings per share (EPS), euro 1.57 1.61 1.24
EPS adjusted for dilution
from warrants, euro 1.57 1.61 1.24
Equity per share, euro 9.17 8.14 7.01
*) Pay-out ratio, % 41.49 40.25 40.44
Price/Earnings ratio (P/E) 13.4 17.7 15.9 *) The amount of dividend used for calculating the 2014 ratios is the Board of Directors‘ proposal to the Annual General Meeting.

Olvi plc – Financial Statements 2014
56 | page
OLVI PLC
Parent Company's Income Statement (FAS)
1 JAN TO 31 DEC 2014 1 JAN TO 31 DEC 2013
Note EUR 1,000 % EUR 1,000 %
NET SALES 1 107,675 100.0 123,608 100.0
Increase (+)/decrease(-) in
inventories of finished and
unfinished products -220 -0.2 812 0.7
Manufacture for own use 68 0.1 96 0.1
Other operating income 2 1,415 1.3 491 0.4
Materials and services 3 45,683 42.4 53,681 43.4
Personnel expenses 4 18,938 17.6 20,602 16.7
Depreciation and impairment 8 4,232 3.9 3,803 3.1
Other operating expenses 9 32,736 30.4 34,115 27.6
OPERATING PROFIT 7,350 6.8 12,805 10.4
Financial income and expenses 10 9,176 8.5 9,131 7.4
PROFIT BEFORE
APPROPRIATIONS
AND TAXES 16,525 15.3 21,936 17.7
Appropriations 11 -3,531 -3.3 -4,302 -3.5
Income taxes 12 -536 -0.5 -1,811 -1.5
NET PROFIT FOR THE PERIOD 12,458 11.6 15,823 12.8
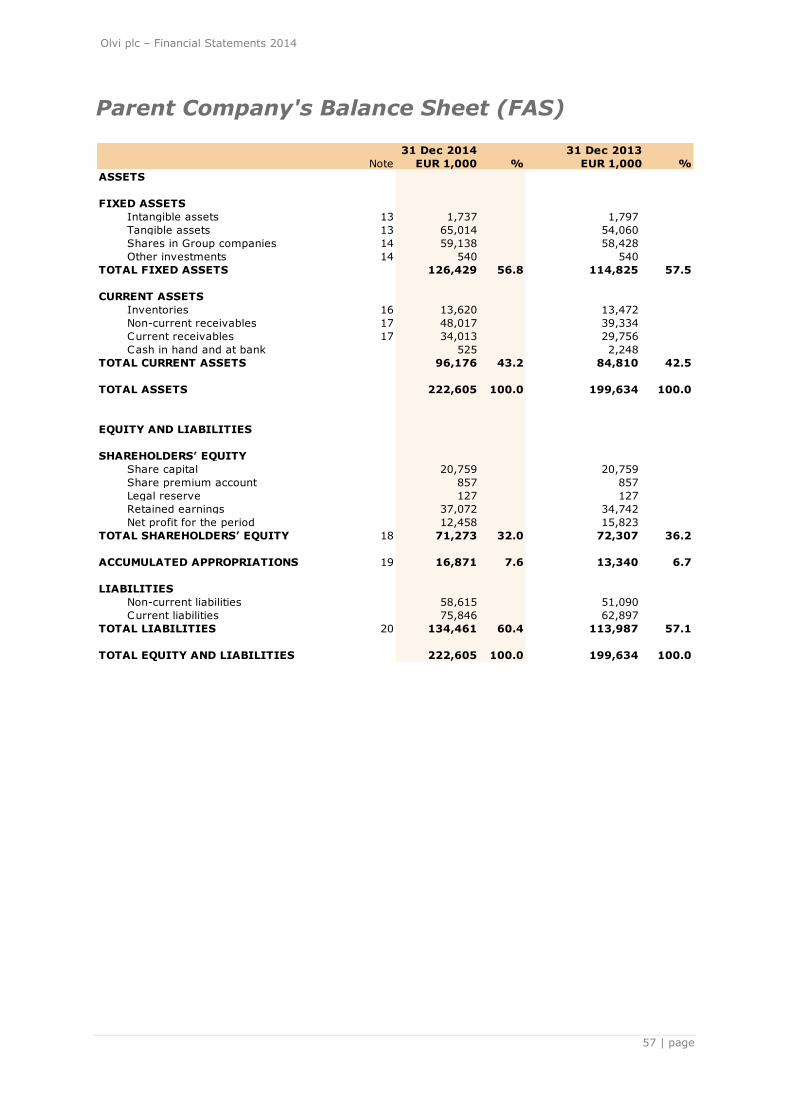
Olvi plc – Financial Statements 2014
57 | page
Parent Company's Balance Sheet (FAS)
31 Dec 2014 31 Dec 2013
Note EUR 1,000 % EUR 1,000 %
ASSETS
FIXED ASSETS
Intangible assets 13 1,737 1,797
Tangible assets 13 65,014 54,060
Shares in Group companies 14 59,138 58,428
Other investments 14 540 540
TOTAL FIXED ASSETS 126,429 56.8 114,825 57.5
CURRENT ASSETS
Inventories 16 13,620 13,472
Non-current receivables 17 48,017 39,334
Current receivables 17 34,013 29,756
Cash in hand and at bank 525 2,248
TOTAL CURRENT ASSETS 96,176 43.2 84,810 42.5
TOTAL ASSETS 222,605 100.0 199,634 100.0
EQUITY AND LIABILITIES
SHAREHOLDERS’ EQUITY
Share capital 20,759 20,759
Share premium account 857 857
Legal reserve 127 127
Retained earnings 37,072 34,742
Net profit for the period 12,458 15,823
TOTAL SHAREHOLDERS’ EQUITY 18 71,273 32.0 72,307 36.2
ACCUMULATED APPROPRIATIONS 19 16,871 7.6 13,340 6.7
LIABILITIES
Non-current liabilities 58,615 51,090
Current liabilities 75,846 62,897
TOTAL LIABILITIES 20 134,461 60.4 113,987 57.1
TOTAL EQUITY AND LIABILITIES 222,605 100.0 199,634 100.0

Olvi plc – Financial Statements 2014
58 | page
Parent Company’s Cash Flow Statement
1-12/2014 1-12/2013
Note EUR 1,000 EUR 1,000
Cash flow from operations
Profit before extraordinary items 15,989 21,936
Adjustments:
Depreciation according to plan and impairment 8 4,232 3,803
Financial income and expenses 10 -9,176 -9,131
Other adjustments -412 -30
Cash flow before change in working capital 10,633 16,578
Change in net working capital:
Increase (-) / decrease (+) in current interest-free accounts
receivable and other receivables -3,907 -1,630
Increase (-) / decrease (+) in inventories -149 527
Increase (+) / decrease (-) in current interest-free liabilities 6,104 2,299
Interest paid -926 -1,296
Interest received 118 69
Dividends received 10,073 10,098
Taxes paid 46 -1,956
Cash flow from operations (A) 21,993 24,690
Cash flow from investments
Investments in tangible and intangible assets -16,013 -18,525
Capital gains on disposal of tangible and intangible assets 874 131
Expenditure on other investments -710 -18
Cash flow from investments (B) -15,850 -18,411
Cash flow from financing
Withdrawals of loans 37,700 11,071
Repayments of loans -24,091 -10,242
Dividends paid -13,469 -10,361
Increase (-)/decrease (+) in current interest-bearing business
receivables 1 1
Increase (-)/decrease (+) in non-current loan receivables -8,007 5,077
Cash flow from financing (C) -7,865 -4,453
Increase (+)/decrease (-) in liquid assets (A+B+C) -1,722 1,826
Liquid assets 1 January 2,248 422
Liquid assets 31 December 525 2,248
Change in liquid assets -1,722 1,826
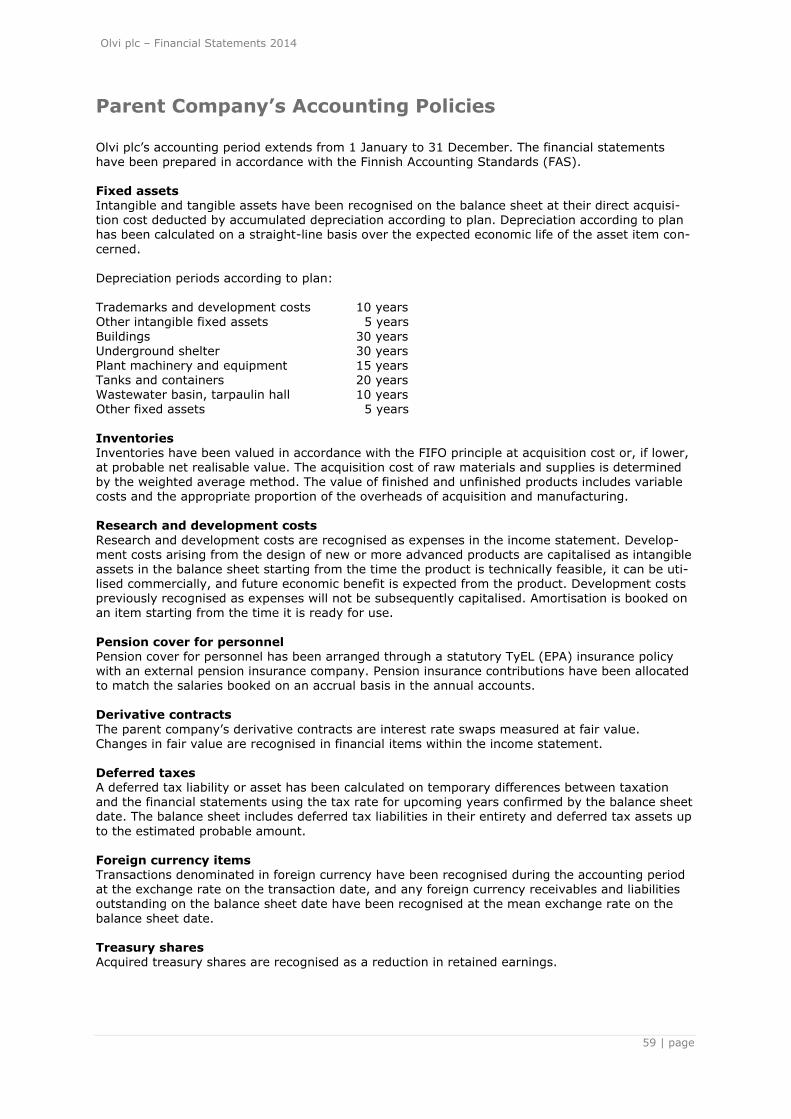
Olvi plc – Financial Statements 2014
59 | page
Parent Company’s Accounting Policies Olvi plc‘s accounting period extends from 1 January to 31 December. The financial statements have been prepared in accordance with the Finnish Accounting Standards (FAS). Fixed assets Intangible and tangible assets have been recognised on the balance sheet at their direct acquisi-tion cost deducted by accumulated depreciation according to plan. Depreciation according to plan has been calculated on a straight-line basis over the expected economic life of the asset item con-
cerned. Depreciation periods according to plan: Trademarks and development costs 10 years
Other intangible fixed assets 5 years
Buildings 30 years Underground shelter 30 years Plant machinery and equipment 15 years Tanks and containers 20 years Wastewater basin, tarpaulin hall 10 years Other fixed assets 5 years
Inventories Inventories have been valued in accordance with the FIFO principle at acquisition cost or, if lower, at probable net realisable value. The acquisition cost of raw materials and supplies is determined by the weighted average method. The value of finished and unfinished products includes variable costs and the appropriate proportion of the overheads of acquisition and manufacturing. Research and development costs
Research and development costs are recognised as expenses in the income statement. Develop-ment costs arising from the design of new or more advanced products are capitalised as intangible assets in the balance sheet starting from the time the product is technically feasible, it can be uti-lised commercially, and future economic benefit is expected from the product. Development costs previously recognised as expenses will not be subsequently capitalised. Amortisation is booked on an item starting from the time it is ready for use.
Pension cover for personnel Pension cover for personnel has been arranged through a statutory TyEL (EPA) insurance policy with an external pension insurance company. Pension insurance contributions have been allocated to match the salaries booked on an accrual basis in the annual accounts. Derivative contracts
The parent company‘s derivative contracts are interest rate swaps measured at fair value. Changes in fair value are recognised in financial items within the income statement.
Deferred taxes A deferred tax liability or asset has been calculated on temporary differences between taxation and the financial statements using the tax rate for upcoming years confirmed by the balance sheet date. The balance sheet includes deferred tax liabilities in their entirety and deferred tax assets up
to the estimated probable amount. Foreign currency items Transactions denominated in foreign currency have been recognised during the accounting period at the exchange rate on the transaction date, and any foreign currency receivables and liabilities outstanding on the balance sheet date have been recognised at the mean exchange rate on the
balance sheet date. Treasury shares Acquired treasury shares are recognised as a reduction in retained earnings.

Olvi plc – Financial Statements 2014
60 | page
NOTES TO THE PARENT COMPANY'S FINANCIAL STATE-MENTS Notes to the Income Statement and Balance Sheet (EUR 1,000) 1. Net sales by market area 2014 2013
Finland 101,890 106,955
Belarus 765 11,818
Estonia 2,345 3,065
Other exports 2,675 1,770
Total 107,675 123,608
2. Other operating income 2014 2013
Capital gains on disposals of fixed assets 737 100
Other 678 391
Total 1,415 491
3. Materials and services 2014 2013
Materials and supplies (goods):
Purchases during the year 43,876 49,998
Change in stocks -369 1,339
Outsourced services 2,175 2,344
Total 45,683 53,681
4. Personnel expenses 2014 2013
Wages, salaries and emoluments 15,297 16,555
Profit-sharing contribution to personnel fund 0 80
Pension expenses 2,687 2,927
Other personnel expenses 954 1,040
Total 18,938 20,602
5. Management salaries and emoluments 2014 2013
Managing Director 361 340
Chairman of the Board 84 85
Other members of the Board 125 130
Total 570 555
6. Parent company’s personnel on average during the period 2014 2013
Full-time
clerical employees 129 131
workers 177 189
Part-time
clerical employees 0 0
workers 63 81
Total 369 401
7. Auditors’ fees 2014 2013
Fees for statutory audit 47 68
Other services 69 49
Total 116 118
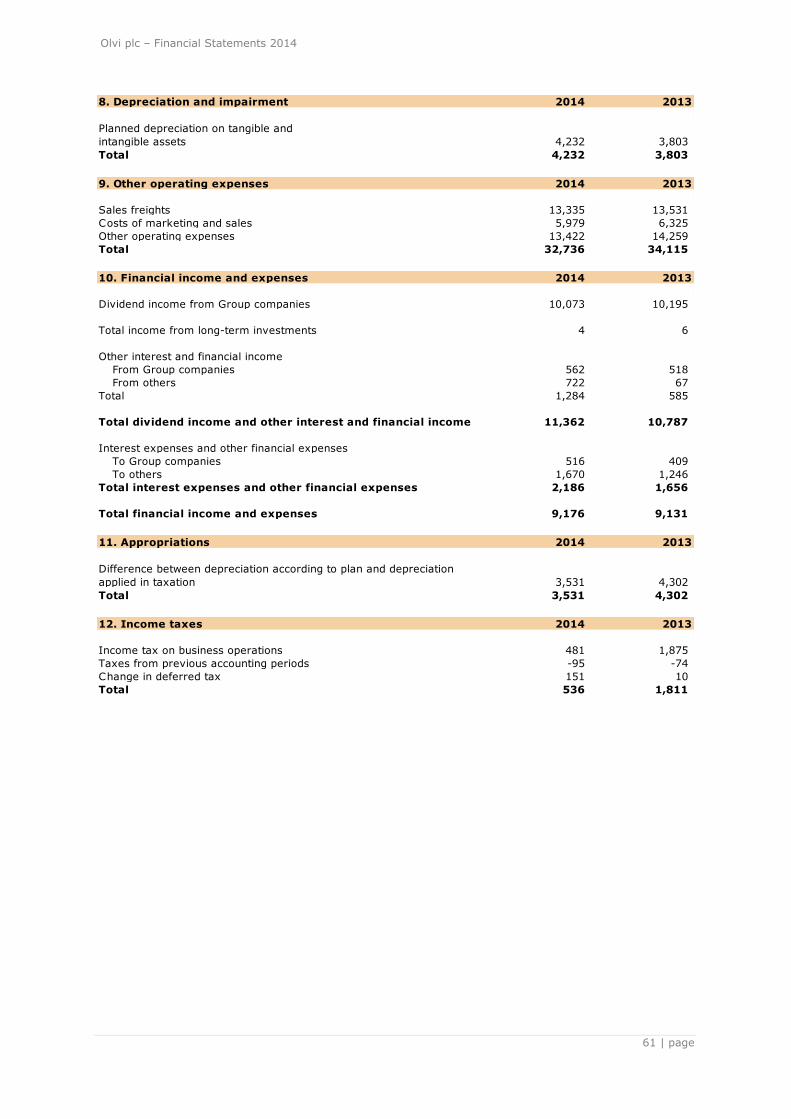
Olvi plc – Financial Statements 2014
61 | page
8. Depreciation and impairment 2014 2013
Planned depreciation on tangible and
intangible assets 4,232 3,803
Total 4,232 3,803
9. Other operating expenses 2014 2013
Sales freights 13,335 13,531
Costs of marketing and sales 5,979 6,325
Other operating expenses 13,422 14,259
Total 32,736 34,115
10. Financial income and expenses 2014 2013
Dividend income from Group companies 10,073 10,195
Total income from long-term investments 4 6
Other interest and financial income
From Group companies 562 518
From others 722 67
Total 1,284 585
Total dividend income and other interest and financial income 11,362 10,787
Interest expenses and other financial expenses
To Group companies 516 409
To others 1,670 1,246
Total interest expenses and other financial expenses 2,186 1,656
Total financial income and expenses 9,176 9,131
11. Appropriations 2014 2013
Difference between depreciation according to plan and depreciation
applied in taxation 3,531 4,302
Total 3,531 4,302
12. Income taxes 2014 2013
Income tax on business operations 481 1,875
Taxes from previous accounting periods -95 -74
Change in deferred tax 151 10
Total 536 1,811
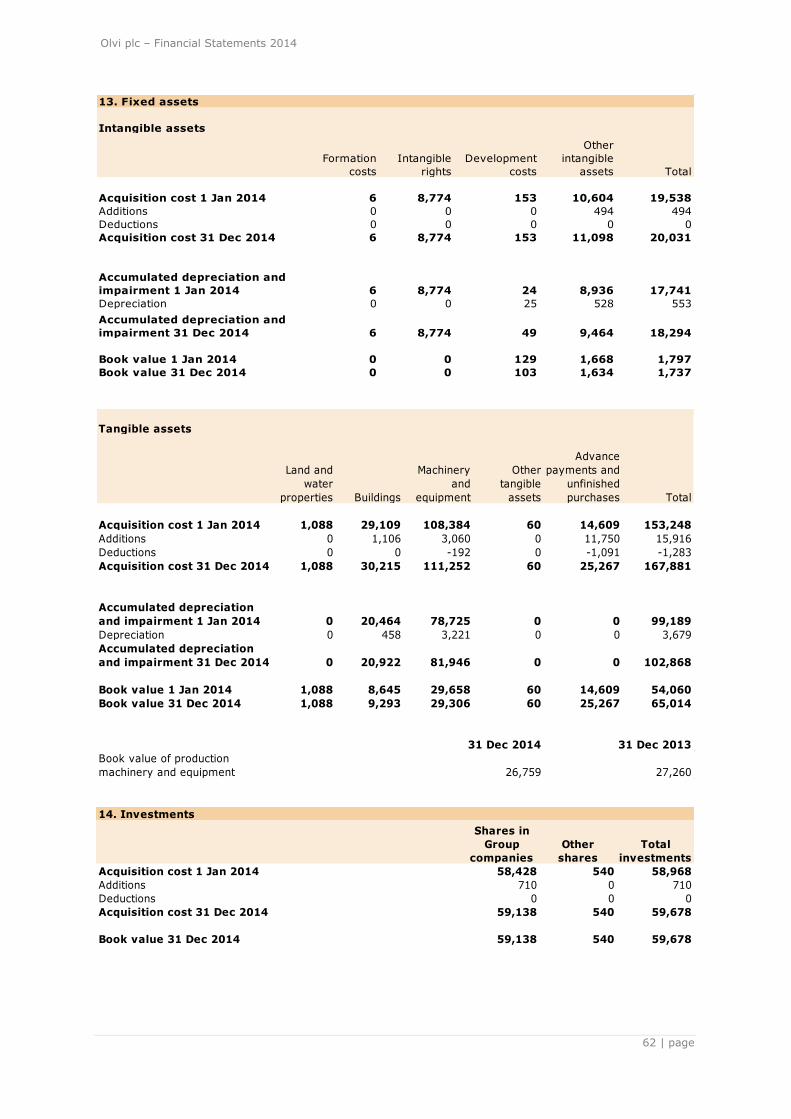
Olvi plc – Financial Statements 2014
62 | page
13. Fixed assets
Intangible assets
Formation
costs
Intangible
rights
Development
costs
Other
intangible
assets Total
Acquisition cost 1 Jan 2014 6 8,774 153 10,604 19,538
Additions 0 0 0 494 494
Deductions 0 0 0 0 0
Acquisition cost 31 Dec 2014 6 8,774 153 11,098 20,031
Accumulated depreciation and
impairment 1 Jan 2014 6 8,774 24 8,936 17,741
Depreciation 0 0 25 528 553
Accumulated depreciation and
impairment 31 Dec 2014 6 8,774 49 9,464 18,294
Book value 1 Jan 2014 0 0 129 1,668 1,797
Book value 31 Dec 2014 0 0 103 1,634 1,737
Tangible assets
Land and
water
properties Buildings
Machinery
and
equipment
Other
tangible
assets
Advance
payments and
unfinished
purchases Total
Acquisition cost 1 Jan 2014 1,088 29,109 108,384 60 14,609 153,248
Additions 0 1,106 3,060 0 11,750 15,916
Deductions 0 0 -192 0 -1,091 -1,283
Acquisition cost 31 Dec 2014 1,088 30,215 111,252 60 25,267 167,881
Accumulated depreciation
and impairment 1 Jan 2014 0 20,464 78,725 0 0 99,189
Depreciation 0 458 3,221 0 0 3,679
Accumulated depreciation
and impairment 31 Dec 2014 0 20,922 81,946 0 0 102,868
Book value 1 Jan 2014 1,088 8,645 29,658 60 14,609 54,060
Book value 31 Dec 2014 1,088 9,293 29,306 60 25,267 65,014
31 Dec 2014 31 Dec 2013
Book value of production
machinery and equipment 26,759 27,260
14. Investments
Shares in
Group
companies
Other
shares
Total
investments
Acquisition cost 1 Jan 2014 58,428 540 58,968
Additions 710 0 710
Deductions 0 0 0
Acquisition cost 31 Dec 2014 59,138 540 59,678
Book value 31 Dec 2014 59,138 540 59,678

Olvi plc – Financial Statements 2014
63 | page
15. Group companies
Group’s
holding (%)
Parent
company’s
holding (%)
AS A. Le Coq, Tartu, Estonia 100.00 100.00
AS Karme, Karksi vald, Estonia 49.00 0.00
Verska Mineraalvee OÜ, Värska vald, Estonia 20.00 0.00
A/S Cēsu Alus, Cēsis, Latvia 99.86 99.86
AB Volfas Engelman, Kaunas, Lithuania 99.58 99.58
OAO Lidskoe Pivo, Lida, Belarus 94.57 94.57
16. Inventories 2014 2013
Materials and supplies 9,410 9,041
Unfinished products 702 885
Finished products / goods 3,509 3,546
Total 13,620 13,472
17. Receivables 2014 2013
Non-current receivables
Loans receivable from Group companies 47,878 39,196
Deposits pledged as collateral 119 119
Prepayments and accrued income 20 20
Total non-current receivables 48,017 39,334
Current receivables
Receivables from Group companies
Accounts receivable 467 466
Prepayments and accrued income 0 112
Total receivables from Group companies 467 578
Receivables from non-Group companies
Accounts receivable 30,042 25,872
Other receivables 1 4
Prepayments and accrued income 3,504 3,256
Deferred tax receivables 0 47
Total receivables from non-Group companies 33,547 29,178
Total current receivables 34,013 29,756
Total receivables 82,030 69,090
Deferred tax receivables
Deferred tax receivables 1 January 47 57
Fair valuation of derivatives, change in deferred tax -47 -10
Deferred tax receivables 31 December 0 47
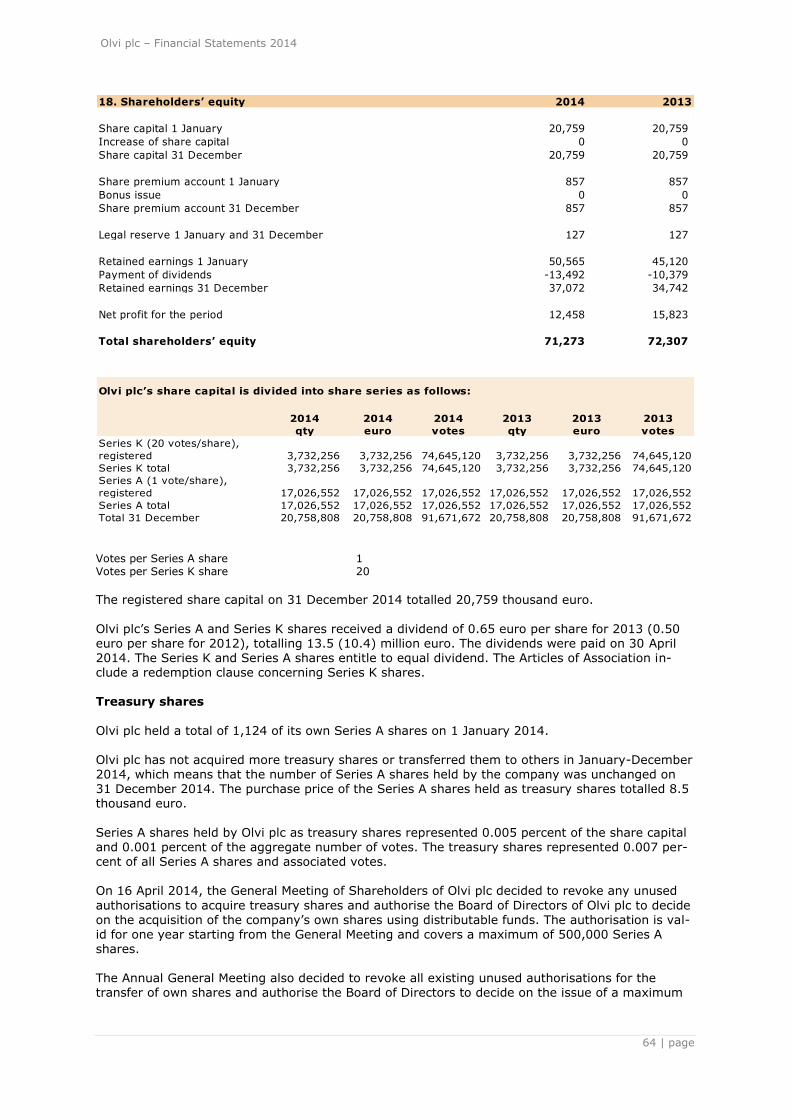
Olvi plc – Financial Statements 2014
64 | page
18. Shareholders’ equity 2014 2013
Share capital 1 January 20,759 20,759
Increase of share capital 0 0
Share capital 31 December 20,759 20,759
Share premium account 1 January 857 857
Bonus issue 0 0
Share premium account 31 December 857 857
Legal reserve 1 January and 31 December 127 127
Retained earnings 1 January 50,565 45,120
Payment of dividends -13,492 -10,379
Retained earnings 31 December 37,072 34,742
Net profit for the period 12,458 15,823
Total shareholders’ equity 71,273 72,307
Olvi plc’s share capital is divided into share series as follows:
2014
qty
2014
euro
2014
votes
2013
qty
2013
euro
2013
votes
Series K (20 votes/share),
registered 3,732,256 3,732,256 74,645,120 3,732,256 3,732,256 74,645,120
Series K total 3,732,256 3,732,256 74,645,120 3,732,256 3,732,256 74,645,120
Series A (1 vote/share),
registered 17,026,552 17,026,552 17,026,552 17,026,552 17,026,552 17,026,552
Series A total 17,026,552 17,026,552 17,026,552 17,026,552 17,026,552 17,026,552
Total 31 December 20,758,808 20,758,808 91,671,672 20,758,808 20,758,808 91,671,672
Votes per Series A share 1 Votes per Series K share 20
The registered share capital on 31 December 2014 totalled 20,759 thousand euro.
Olvi plc‘s Series A and Series K shares received a dividend of 0.65 euro per share for 2013 (0.50 euro per share for 2012), totalling 13.5 (10.4) million euro. The dividends were paid on 30 April 2014. The Series K and Series A shares entitle to equal dividend. The Articles of Association in-clude a redemption clause concerning Series K shares. Treasury shares
Olvi plc held a total of 1,124 of its own Series A shares on 1 January 2014.
Olvi plc has not acquired more treasury shares or transferred them to others in January-December 2014, which means that the number of Series A shares held by the company was unchanged on 31 December 2014. The purchase price of the Series A shares held as treasury shares totalled 8.5 thousand euro.
Series A shares held by Olvi plc as treasury shares represented 0.005 percent of the share capital and 0.001 percent of the aggregate number of votes. The treasury shares represented 0.007 per-cent of all Series A shares and associated votes. On 16 April 2014, the General Meeting of Shareholders of Olvi plc decided to revoke any unused
authorisations to acquire treasury shares and authorise the Board of Directors of Olvi plc to decide on the acquisition of the company‘s own shares using distributable funds. The authorisation is val-id for one year starting from the General Meeting and covers a maximum of 500,000 Series A shares.
The Annual General Meeting also decided to revoke all existing unused authorisations for the transfer of own shares and authorise the Board of Directors to decide on the issue of a maximum

Olvi plc – Financial Statements 2014
65 | page
of 1,000,000 new Series A shares and the transfer of a maximum of 500,000 Series A shares held
as treasury shares. In January-December 2014, the Board of Directors of Olvi plc has not exercised the authorisations
granted by the General Meeting.
19. Accumulated appropriations Accumulated appropriations consist of accumulated depreciation difference. 20. Liabilities 2014 2013
Non-current liabilities
Loans from financial institutions 27,331 25,625
Deferred tax liabilities 104 0
Other liabilities 29 29
Total 27,464 25,654
Liabilities to Group companies
Other liabilities 31,151 25,436
Total 31,151 25,436
Total non-current liabilities 58,615 51,090
Current liabilities
Loans from financial institutions 30,855 23,405
Accounts payable 18,984 18,554
Accrued expenses 5,004 5,354
Other liabilities 20,852 15,431
Total 75,695 62,744
Liabilities to Group companies
Accounts payable 151 153
Total 151 153
Total current liabilities 75,846 62,897
Total liabilities 134,461 113,987
Accrued expenses
Provisions for personnel costs 2,917 3,973
Provision for interest on loans 273 276
Other accrued expenses 1,814 1,105
Total accrued expenses 5,004 5,354
Interest-free liabilities 31 December 44,991 39,492
Liabilities falling due later than five years from now:
Loans from financial institutions and other loans 104 29
Deferred tax liabilities
Deferred tax liabilities 1 January 0 0
Fair valuation of derivatives, 104 0
change in deferred tax
Deferred tax liabilities 31 December 104 0
21. Share-based payments On 29 April 2014, Olvi plc‘s Board of Directors decided on a new share-based incentive plan for the Group‘s key personnel. The aim of the new plan is to combine the objectives of the sharehold-ers and the key employees in order to increase the value of the company, to commit the key em-
ployees to the company, and to offer them a competitive reward plan based on earning the com-
pany‘s shares.

Olvi plc – Financial Statements 2014
66 | page
The new share-based incentive plan includes one three-year performance period, calendar years
2014—2016. The potential reward from the performance period 2014—2016 will be based on the Group‘s cumulative operating profit. Furthermore, the new plan includes one three-year perfor-mance period, beginning on 1 July 2014 and ending on 30 June 2017. The prerequisite for receiv-
ing reward on the basis of this performance period is that a key employee purchases the compa-ny‘s series A shares up to the number determined by the Board of Directors. Furthermore, enti-tlement to a reward is tied to the continuance of employment or service upon reward payment. Rewards from both performance periods will be paid partly in the company‘s series A shares and partly in cash in 2017. The cash proportion is intended to cover taxes and tax-related costs arising from the rewards to the key employees. As a rule, no reward will be paid if the key employee‘s
employment or service ends before the reward payment. Members of the Management Group must hold one half of the shares received on the basis of the performance period 2014—2016 for the entire validity of their employment or service.
The plan is directed to approximately 50 people. The rewards to be paid on the basis of the plan are in total an approximate maximum of 40,000 series A shares in Olvi plc and a cash payment
needed for taxes and tax-related costs arising from the shares. From January to December 2014, accounting entries associated with the performance period from 1 July 2014 to 30 June 2017 were recognised in Olvi plc for 26,438.01 euro. Olvi Group does not have any other share-based plans or option plans. 22. Pledges, contingent liabilities and other commitments 2014 2013
Pledges and contingent liabilities
For own commitments
Mortgages on land and buildings 1,336 1,336
Other off-balance sheet liabilities
Package liabilities 2,496 2,781
Rental liabilities on business premises and land areas 295 396
Other liabilities 5,382 5,806
Total pledges, contingent liabilities and
other commitments 9,510 10,319
23. Leasing liabilities 2014 2013
Due within one year 274 422
Due later 183 248
Total 457 670 24. Derivative contracts
Nominal
value 2014
Fair value
2014
Nominal value
2013
Fair value
2013
Derivatives 17,371 544 24,100 -235
The business significance of the derivative contracts is minor. The derivative contracts are interest rate swaps on loans and will reach maturity in 2015, 2017 and 2018.

Olvi plc – Financial Statements 2014
67 | page
OLVI PLC Shares and share capital 31 December 2014
Shares % Votes %
Series K shares, registered 3,732,256 18.0 74,645,120 81.4
Series A shares, registered 17,026,552 82.0 17,026,552 18.6
Total 20,758,808 100.0 91,671,672 100.0 Registered share capital, EUR 1,000 20,759
Olvi plc‘s Series A and Series K shares received a dividend of 0.65 euro per share for 2013 (0.50 euro per share for 2012), totalling 13.5 (10.4) million euro. The dividends were paid on 30 April 2014. Votes per Series A share 1 Votes per Series K share 20 The Series K and Series A shares entitle to equal dividend. The Articles of Association include a redemption clause concerning Series K shares.
DISTRIBUTION OF HOLDINGS AND INFORMATION ON SHAREHOLDERS
Largest shareholders on 31 December 2014
Series K Series A Total % Votes %
1. Olvi Foundation 2,363,904 890,613 3,254,517 15.68 48,168,693 52.54
2. Hortling Heikki Wilhelm *) 903,488 103,280 1,006,768 4.85 18,173,040 19.82
3. The Heirs of Hortling Kalle Einari 187,104 25,248 212,352 1.02 3,767,328 4.11
4. Hortling Timo Einari 165,824 35,308 201,132 0.97 3,351,788 3.66
5. Hortling-Rinne Laila Marit 102,288 2,980 105,268 0.51 2,048,740 2.23
6. Pohjola Bank plc, nominee register 1,902,900 1,902,900 9.17 1,902,900 2.08
1,308,666 1,308,666 6.30 1,308,666 1.43
8. Ilmarinen Mutual Pension Insurance Company 849,218 849,218 4.09 849,218 0.93
788,075 788,075 3.80 788,075 0.86
481,612 481,612 2.32 481,612 0.53
460,000 460,000 2.22 460,000 0.50
310,000 310,000 1.49 310,000 0.34
216,072 216,072 1.04 216,072 0.24
196,000 196,000 0.94 196,000 0.21
180,000 180,000 0.87 180,000 0.20
147,696 147,696 0.71 147,696 0.16
146,500 146,500 0.71 146,500 0.16
142,796 142,796 0.69 142,796 0.16
111,926 111,926 0.54 111,926 0.12
110,798 110,798 0.53 110,798 0.12
Others 9,648 8,616,864 8,626,512 41.55 8,809,824 9.60
Total 3,732,256 17,026,552 20,758,808 100.00 91,671,672 100.00
18. Odin Finland mutual fund
19. Aktia Secura mutual fund
20. Säästöpankki Kotimaa mutual fund
11. AC Invest Oy
12. Fondita Nordic Micro Cap mutual fund
13. Laakkonen Hannu Markus
14. Aktia Capital mutual fund
15. Lahti Ari
16. Veritas Pension Insurance Company
7. Nordea Bank Finland plc, nominee register
9. Varma Mutual Pension Insurance Company
10. Skandinaviska Enskilda Banken Ab (publ)
Helsinki branch, nominee register
17. Kamprad Ingvar
*) The figures include the shareholder‘s own holdings and shares held by parties in his control. Olvi plc had 10,021 (9,522) shareholders registered in the book-entry system on 31 December 2014, 8 (8) of them nominee-registered.
Insiders Olvi plc adopted the insider guidelines drawn up and recommended by the Nasdaq OMX Helsinki
Stock Exchange on 1 September 2005.
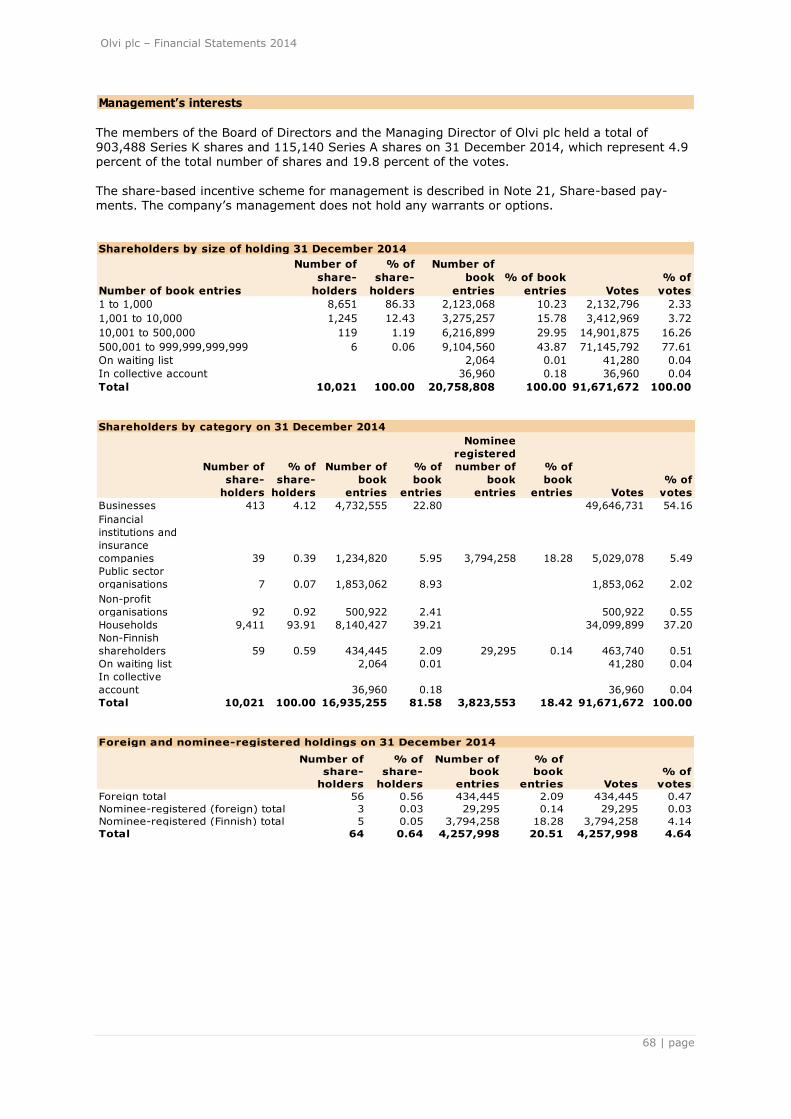
Olvi plc – Financial Statements 2014
68 | page
Management’s interests The members of the Board of Directors and the Managing Director of Olvi plc held a total of 903,488 Series K shares and 115,140 Series A shares on 31 December 2014, which represent 4.9 percent of the total number of shares and 19.8 percent of the votes.
The share-based incentive scheme for management is described in Note 21, Share-based pay-ments. The company‘s management does not hold any warrants or options. Shareholders by size of holding 31 December 2014
Number of book entries
Number of
share-
holders
% of
share-
holders
Number of
book
entries
% of book
entries Votes
% of
votes
1 to 1,000 8,651 86.33 2,123,068 10.23 2,132,796 2.33
1,001 to 10,000 1,245 12.43 3,275,257 15.78 3,412,969 3.72
10,001 to 500,000 119 1.19 6,216,899 29.95 14,901,875 16.26
500,001 to 999,999,999,999 6 0.06 9,104,560 43.87 71,145,792 77.61
On waiting list 2,064 0.01 41,280 0.04
In collective account 36,960 0.18 36,960 0.04
Total 10,021 100.00 20,758,808 100.00 91,671,672 100.00
Shareholders by category on 31 December 2014
Number of
share-
holders
% of
share-
holders
Number of
book
entries
% of
book
entries
Nominee
registered
number of
book
entries
% of
book
entries Votes
% of
votes
Businesses 413 4.12 4,732,555 22.80 49,646,731 54.16
Financial
institutions and
insurance
companies 39 0.39 1,234,820 5.95 3,794,258 18.28 5,029,078 5.49
Public sector
organisations 7 0.07 1,853,062 8.93 1,853,062 2.02
Non-profit
organisations 92 0.92 500,922 2.41 500,922 0.55
Households 9,411 93.91 8,140,427 39.21 34,099,899 37.20
Non-Finnish
shareholders 59 0.59 434,445 2.09 29,295 0.14 463,740 0.51
On waiting list 2,064 0.01 41,280 0.04
In collective
account 36,960 0.18 36,960 0.04
Total 10,021 100.00 16,935,255 81.58 3,823,553 18.42 91,671,672 100.00
Foreign and nominee-registered holdings on 31 December 2014
Number of
share-
holders
% of
share-
holders
Number of
book
entries
% of
book
entries Votes
% of
votes
Foreign total 56 0.56 434,445 2.09 434,445 0.47
Nominee-registered (foreign) total 3 0.03 29,295 0.14 29,295 0.03
Nominee-registered (Finnish) total 5 0.05 3,794,258 18.28 3,794,258 4.14
Total 64 0.64 4,257,998 20.51 4,257,998 4.64
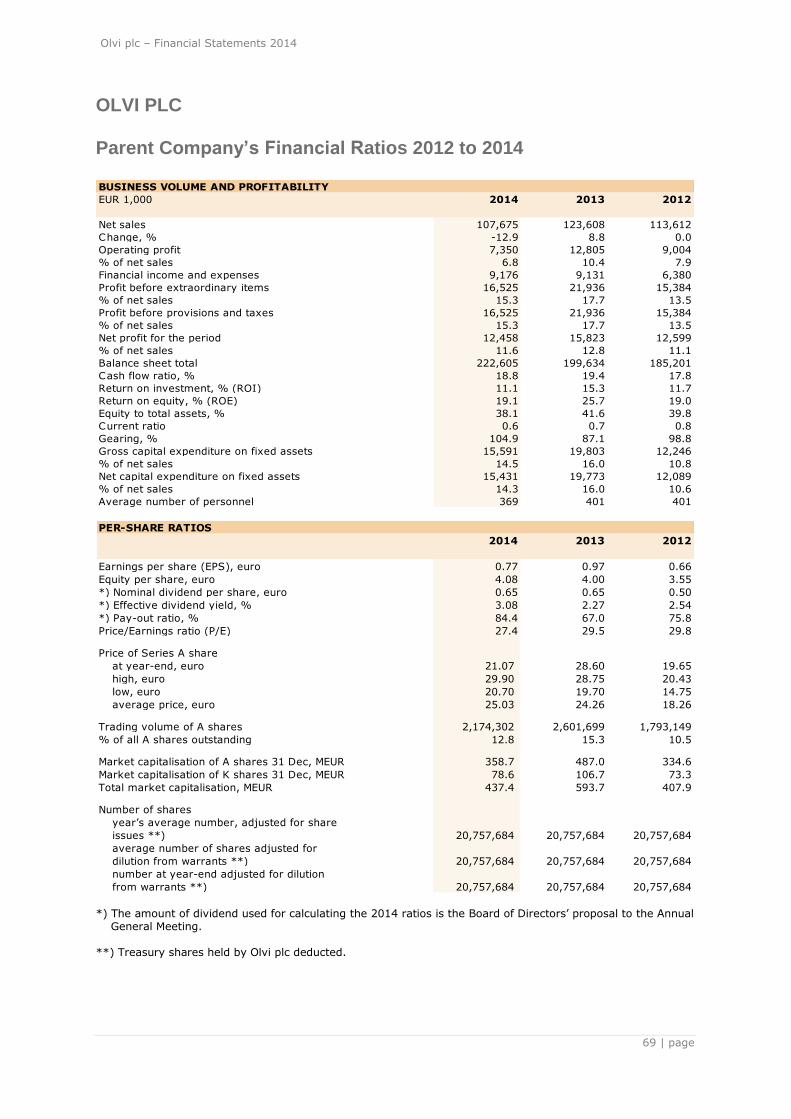
Olvi plc – Financial Statements 2014
69 | page
OLVI PLC Parent Company’s Financial Ratios 2012 to 2014 BUSINESS VOLUME AND PROFITABILITY
EUR 1,000 2014 2013 2012
Net sales 107,675 123,608 113,612
Change, % -12.9 8.8 0.0
Operating profit 7,350 12,805 9,004
% of net sales 6.8 10.4 7.9
Financial income and expenses 9,176 9,131 6,380
Profit before extraordinary items 16,525 21,936 15,384
% of net sales 15.3 17.7 13.5
Profit before provisions and taxes 16,525 21,936 15,384
% of net sales 15.3 17.7 13.5
Net profit for the period 12,458 15,823 12,599
% of net sales 11.6 12.8 11.1
Balance sheet total 222,605 199,634 185,201
Cash flow ratio, % 18.8 19.4 17.8
Return on investment, % (ROI) 11.1 15.3 11.7
Return on equity, % (ROE) 19.1 25.7 19.0
Equity to total assets, % 38.1 41.6 39.8
Current ratio 0.6 0.7 0.8
Gearing, % 104.9 87.1 98.8
Gross capital expenditure on fixed assets 15,591 19,803 12,246
% of net sales 14.5 16.0 10.8
Net capital expenditure on fixed assets 15,431 19,773 12,089
% of net sales 14.3 16.0 10.6
Average number of personnel 369 401 401
PER-SHARE RATIOS
2014 2013 2012
Earnings per share (EPS), euro 0.77 0.97 0.66
Equity per share, euro 4.08 4.00 3.55
*) Nominal dividend per share, euro 0.65 0.65 0.50
*) Effective dividend yield, % 3.08 2.27 2.54
*) Pay-out ratio, % 84.4 67.0 75.8
Price/Earnings ratio (P/E) 27.4 29.5 29.8
Price of Series A share
at year-end, euro 21.07 28.60 19.65
high, euro 29.90 28.75 20.43
low, euro 20.70 19.70 14.75
average price, euro 25.03 24.26 18.26
Trading volume of A shares 2,174,302 2,601,699 1,793,149
% of all A shares outstanding 12.8 15.3 10.5
Market capitalisation of A shares 31 Dec, MEUR 358.7 487.0 334.6
Market capitalisation of K shares 31 Dec, MEUR 78.6 106.7 73.3
Total market capitalisation, MEUR 437.4 593.7 407.9
Number of shares
year‘s average number, adjusted for share
issues **) 20,757,684 20,757,684 20,757,684
average number of shares adjusted for
dilution from warrants **) 20,757,684 20,757,684 20,757,684
number at year-end adjusted for dilution
from warrants **) 20,757,684 20,757,684 20,757,684 *) The amount of dividend used for calculating the 2014 ratios is the Board of Directors‘ proposal to the Annual General Meeting. **) Treasury shares held by Olvi plc deducted.
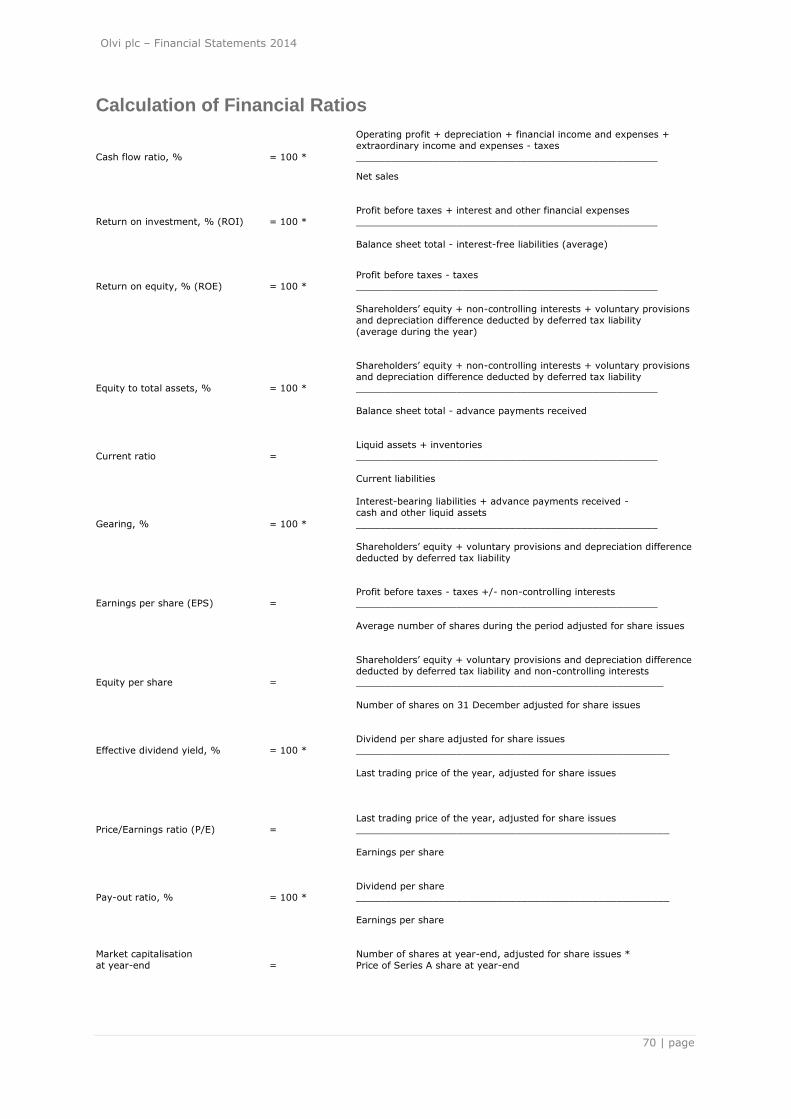
Olvi plc – Financial Statements 2014
70 | page
Calculation of Financial Ratios
Operating profit + depreciation + financial income and expenses +
extraordinary income and expenses - taxes
Cash flow ratio, % = 100 * ___________________________________________________
Net sales
Profit before taxes + interest and other financial expenses
Return on investment, % (ROI) = 100 * ___________________________________________________
Balance sheet total - interest-free liabilities (average)
Profit before taxes - taxes
Return on equity, % (ROE) = 100 * ___________________________________________________
Shareholders‘ equity + non-controlling interests + voluntary provisions
and depreciation difference deducted by deferred tax liability
(average during the year)
Shareholders‘ equity + non-controlling interests + voluntary provisions
and depreciation difference deducted by deferred tax liability
Equity to total assets, % = 100 * ___________________________________________________
Balance sheet total - advance payments received
Liquid assets + inventories
Current ratio = ___________________________________________________
Current liabilities
Interest-bearing liabilities + advance payments received -
cash and other liquid assets
Gearing, % = 100 * ___________________________________________________
Shareholders‘ equity + voluntary provisions and depreciation difference
deducted by deferred tax liability
Profit before taxes - taxes +/- non-controlling interests
Earnings per share (EPS) = ___________________________________________________
Average number of shares during the period adjusted for share issues
Shareholders‘ equity + voluntary provisions and depreciation difference
deducted by deferred tax liability and non-controlling interests Equity per share = ____________________________________________________
Number of shares on 31 December adjusted for share issues
Dividend per share adjusted for share issues
Effective dividend yield, % = 100 * _____________________________________________________
Last trading price of the year, adjusted for share issues
Last trading price of the year, adjusted for share issues
Price/Earnings ratio (P/E) = _____________________________________________________
Earnings per share
Dividend per share Pay-out ratio, % = 100 * _____________________________________________________
Earnings per share
Market capitalisation Number of shares at year-end, adjusted for share issues *
at year-end = Price of Series A share at year-end
Olvi plc – Financial Statements 2014
71 | page
Board of Directors’ proposal for the distribution of profit The parent company Olvi plc had 49.5 (50.6) million euro of distributable funds on 31 December 2014, of which profit for the period accounted for 12.5 (15.8) million euro. The company‘s Board of Directors proposes to the Annual General Meeting that distributable funds be used as follows: • A dividend of 0.65 euro shall be paid for 2014 on each Series K and Series A share, totalling 13.5 (13.5) mil-lion euro. The dividend represents 41.4 (40.4) percent of Olvi Group‘s earnings per share.
It is proposed that the dividend be paid to shareholders registered in Olvi plc‘s register of shareholders held by Euroclear Finland Ltd on the record date of the dividend payment, 20 April 2015. It is proposed that the dividend be paid on 30 April 2015. • 36.0 million euro shall be retained in the parent company‘s non-restricted equity. Date and Signatures Signed in Iisalmi, this 23th day of February 2015 Heikki Hortling Esa Lager Chairman of the Board Vice Chairman of the Board
Tarja Pääkkönen Heikki Sinnemaa Member of the Board Member of the Board
Jaakko Autere Lasse Aho Member of the Board Managing Director
Auditor’s Note A report of the audit has been submitted today. Signed in Iisalmi, this 20th day of March 2015 PricewaterhouseCoopers Oy Sami Posti
Authorised Public Accountant

Olvi plc – Financial Statements 2014
72 | page
Olvi plc’s Board of Directors 2014 Heikki Hortling Born 1951 Honorary Industrial Counsellor Master of Science (Economics) Chairman of the Board of Olvi plc since 1998 Vice Chairman of the Board of Olvi plc 1987–1997 Important positions in other organisations: Vice Chairman of the Board of Ponsse Plc Member of the Board of Puhelinosuuskunta IPY (telecom co-operative)
Work experience in brief: Several positions in Olvi plc, including marketing and materials management. Esa Lager Born 1959 Master of Laws Master of Science (Economics) Member of Olvi plc‘s Board of Directors since 2002 Chairman of Olvi plc‘s Board of Directors 14 April 2004 to 2 September 2004 Vice Chairman of Olvi plc‘s Board of Directors Important positions in other organisations: Vice Chairman of the Board of SATO Corporation, Member of the Board since 2014 Vice Chairman of the Board of Ilkka-Yhtymä Oyj, Member of the Board since 2011 Member of the Board of Alma Media Corporation since 2014 Member of the Board of Finnish Industry Investment Ltd since 2014 Member of the Board of Fennovoima Ltd since 2014 Work experience in brief: Outokumpu Oyj, Chief Financial Officer (CFO), deputy to the CEO Outokumpu Oyj, Director of Finance Kansallis-Osake-Pankki, various expert and manage-rial positions in international operations. Heikki Sinnemaa Born 1949 Master of Laws trained on the bench Member of Olvi plc‘s Board of Directors since 2004 Important positions in other organisations: Member of the Board of Olvi Foundation Chairman of the Board of Puhelinosuuskunta IPY (telecom co-operative) Member of the Board of T. Makkonen Oy Member of the Board of Iisalmen Osuuspankki co-
operative bank (1987–1995) Chairman of the Board of Iisalmen Osuuspankki co-operative bank (1995–2000) Work experience in brief: Heikki Sinnemaa Attorney‘s office, attorney-at-law from 1975 to 2012.
Jaakko Autere Born 1963 Master of Science (Economics) Gogrow Oy, CEO Member of Olvi plc‘s Board of Directors since 2011 Work experience in brief: 2009–2011 President, Fiskars Home Business Area, CEO of Iittala Group Oy Ab 2005–2009 Managing Director, Orkla AS, Biscuit Division (Göteborgs Kex, Saetre, Kantolan) 2004–2005 Managing Director, L‘Oreal Norway
2000–2005 Managing Director/General Manager, L‘Oreal Sweden 1997–2000 Marketing Manager, Kellogg‘s Marketing & Sales Company UK & ROI Ltd 1991–1997 Marketing Manager, Product Manager Nordisk Kellogg‘s, Denmark 1989–1991 Product Group Manager, Olvi plc, Iisalmi. Tarja Pääkkönen Born 1962 Doctor of Technology (Business strategy) Master of Science in Engineering (Construction) Studies in international marketing Boardman Oy, partner and the Chair of the Brand Compass management group since 2010 Member of Olvi plc‘s Board of Directors since 2010 Important positions in other organisations: Member of the Board of SATO Corporation and mem-ber of the audit committee since 2013 Member of the Board of Wulff plc since 2013 Member of the Board of Marimekko Corporation 2006–2011 Member of the Board of Panostaja/Flexim Security Oy since 2011 Member of the Board of Idean Oy since 2011 Member of the Board of Spinverse Oy since 2011 Vice Chairman of the Board of the software company Sunduka Oy since 2010 Member of the Board of Boardman Oy since 2010 Directors‘ Institute of Finland, DIF, member since 2009 Member of the Board of HYY Group (business opera-tions of the Student Union of the University of Hel-sinki) since 2008 Work experience in brief: Member of the Board of Itella and Director of the corporate sales and marketing unit Nokia Corporation, member of the management group of Nokia Mobile Phones and service in several global Senior Vice President positions in Europe, the
USA and Japan Mecrastor Oy (PricewaterhouseCoopers), Manage-ment Consultant Kienbaum GmbH, Germany, Management Consultant BE & K, USA, Marketing & Business Manager.