financial statement with independent auditor's report of ... reports/financial... · audit in...
TRANSCRIPT
NORTH CAROLINA DEPARTMENT OF
STATE TREASURER INVESTMENTS
FINANCIAL STATEMENTS WITH INDEPENDENT AUDITORS’ REPORT
FISCAL YEAR ENDED JUNE 30, 2015

North Carolina Department of State Treasurer Investments Fiscal Year Ended June 30, 2015
This audit required approximately 590 hours at a cost of $89,350
Contents
Independent Auditors’ Report ......................................................................................................... 1 Management’s Discussion and Analysis ........................................................................................ 3
Financial Statements
Statement of Fiduciary Net Position ............................................................................................... 9 Statement of Changes in Fiduciary Net Position .......................................................................... 10 Notes to Financial Statements ....................................................................................................... 11
Supplementary Information .......................................................................................................... 31

1
Independent Auditors' Report
The Honorable Janet Cowell, State Treasurer North Carolina Department of State Treasurer and The Honorable Beth A. Wood, State Auditor Report on the Financial Statements We have audited the financial statements of the North Carolina Department of State Treasurer Investments (the “Funds”), a component unit of the State of North Carolina, which comprise the statement of fiduciary net position as of June 30, 2015, and the related statement of changes in fiduciary net position for the year then ended, and the related notes to the basic financial statements, as listed in the table of contents. Management’s Responsibility for the Financial Statements Management is responsible for the preparation and fair presentation of these financial statements in accordance with accounting principles generally accepted in the United States of America; this includes the design, implementation, and maintenance of internal control relevant to the preparation and fair presentation of financial statements that are free from material misstatement, whether due to fraud or error. Auditors’ Responsibility Our responsibility is to express an opinion on these financial statements based on our audit. We conducted our audit in accordance with auditing standards generally accepted in the United States of America and the standards applicable to financial audits contained in Government Auditing Standards, issued by the Comptroller General of the United States. Those standards require that we plan and perform the audit to obtain reasonable assurance about whether the financial statements are free from material misstatement. An audit involves performing procedures to obtain audit evidence about the amounts and disclosures in the financial statements. The procedures selected depend on the auditors’ judgment, including the assessment of the risks of material misstatement of the financial statements, whether due to fraud or error. In making those risk assessments, the auditor considers internal control relevant to the Funds’ preparation and fair presentation of the financial statements in order to design audit procedures that are appropriate in the circumstances, but not for the purpose of expressing an opinion on the effectiveness of the Funds’ internal control. Accordingly, we express no such opinion. An audit also includes evaluating the appropriateness of accounting policies used and the reasonableness of significant accounting estimates made by management, as well as evaluating the overall presentation of the financial statements. We believe that the audit evidence we have obtained is sufficient and appropriate to provide a basis for our audit opinion. Opinion In our opinion, the financial statements referred to above present fairly, in all material respects, the net position of the Funds as of June 30, 2015, and the respective changes in its net position for the year then ended in accordance with accounting principles generally accepted in the United States of America.
CliftonLarsonAllen LLP www.CLAconnect.com
An independent member of Nexia International
2
Other Matters Required Supplementary Information Accounting principles generally accepted in the United States of America require that the management’s discussion and analysis, as listed in the table of contents, be presented to supplement the financial statements. Such information, although not a part of the financial statements, is required by the Governmental Accounting Standards Board who considers it to be an essential part of financial reporting for placing the financial statements in an appropriate operational, economic, or historical context. We have applied certain limited procedures to the required supplementary information in accordance with auditing standards generally accepted in the United States of America, which consisted of inquiries of management about the methods of preparing the information and comparing the information for consistency with management’s responses to our inquiries, the financial statements, and other knowledge we obtained during our audit of the financial statements. We do not express an opinion or provide any assurance on the information because the limited procedures do not provide us with sufficient evidence to express an opinion or provide any assurance. Other Information Our audit was conducted for the purpose of forming an opinion on the financial statements. The supplementary information is presented for purposes of additional analysis and is not a required part of the financial statements. The supplementary information is the responsibility of management and was derived from and relates directly to the underlying accounting and other records used to prepare the financial statements. Such information has been subjected to the auditing procedures applied in the audit of the financial statements and certain additional procedures, including comparing and reconciling such information directly to the underlying accounting and other records used to prepare the financial statements or to the financial statements themselves, and other additional procedures in accordance with auditing standards generally accepted in the United States of America. In our opinion, the supplementary Information is fairly stated, in all material respects, in relation to the financial statements as a whole. Other Reporting Required by Government Auditing Standards In accordance with Government Auditing Standards, we have also issued our report dated December 21, 2015 on our consideration of the internal control over financial reporting and on our tests of its compliance with certain provisions of laws, regulations, contracts, and grant agreements and other matters. The purpose of that report is to describe the scope of our testing of internal control over financial reporting and compliance and the results of that testing, and not to provide an opinion on internal control over financial reporting or on compliance. That report is an integral part of an audit performed in accordance with Government Auditing Standards in considering the internal control over financial reporting and compliance.
a CliftonLarsonAllen LLP Baltimore, Maryland December 21, 2015
North Carolina Department of State Treasurer Investments Management’s Discussion and Analysis
Fiscal Year Ended June 30, 2015
3
Introduction
This section of the financial statements of the investments of the North Carolina Department of State Treasurer (the “Funds”) presents our discussion and analysis of the Funds’ financial position as of June 30, 2015 and 2014. Since this discussion and analysis is designed to focus on current activities, it should be read in conjunction with the Funds’ basic financial statements, which follow this section.
For the purposes of presenting the basic financial statements, investments are allocated to broad classifications that follow the North Carolina General Statutes definitions in Section 147-69 (2)(b). These “portfolios” are described in Note 3 and include the Short Term Investment Fund (STIF), Long Term Investment Fund (LTIF), External Fixed Income portfolio, Equity Investment portfolio, Real Estate Investment portfolio, Alternative Investment portfolio, Credit Investment portfolio, Inflation Protection Investment portfolio, and OPEB Equity Investment portfolio. Amounts associated with these portfolios are presented in the tables in Note 3. The classifications defined in the Investment Policy Statement of the Department of State Treasurer Investments are used for the purposes of Management’s Discussion and Analysis of the economic and financial environment, investment performance, and risk management of the Funds. The Supplementary Information contains a mapping of the Investment Policy Statement’s classifications to the statutory classifications which are used to prepare the basic financial statements as of June 30, 2015.
Financial Statements
The Funds’ basic financial statements include the statement of fiduciary net position and statement of changes in fiduciary net position, which have been presented in accordance with accounting principles generally accepted in the United States as applicable to governmental entities.
The statement of fiduciary net position provides information on the financial position of the Funds for the fiscal year ended June 30, 2015. The statement of changes in fiduciary net position presents the results of the investing activities during the fiscal year ended June 30, 2015. The notes to the financial statements offer additional discussion that is essential to the full understanding of the data presented in the financial statements. The notes give more detail about accounting policies, significant account balances and activities, material risks, obligations, contingencies and subsequent events, if any.
North Carolina Department of State Treasurer Investments Management’s Discussion and Analysis
Fiscal Year Ended June 30, 2015
4
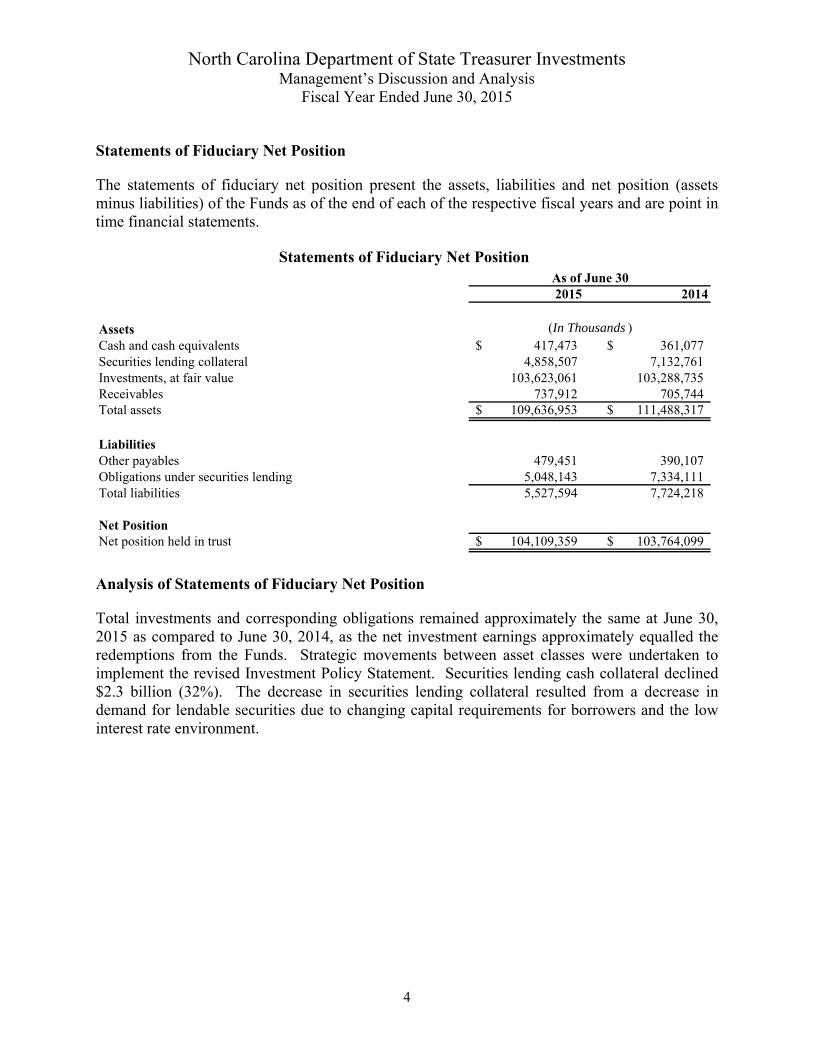
Statements of Fiduciary Net Position
The statements of fiduciary net position present the assets, liabilities and net position (assets minus liabilities) of the Funds as of the end of each of the respective fiscal years and are point in time financial statements.
2015 2014
AssetsCash and cash equivalents 417,473$ 361,077$ Securities lending collateral 4,858,507 7,132,761 Investments, at fair value 103,623,061 103,288,735 Receivables 737,912 705,744 Total assets 109,636,953$ 111,488,317$
LiabilitiesOther payables 479,451 390,107 Obligations under securities lending 5,048,143 7,334,111 Total liabilities 5,527,594 7,724,218
Net PositionNet position held in trust 104,109,359$ 103,764,099$
As of June 30
(In Thousands )
Statements of Fiduciary Net Position
Analysis of Statements of Fiduciary Net Position
Total investments and corresponding obligations remained approximately the same at June 30, 2015 as compared to June 30, 2014, as the net investment earnings approximately equalled the redemptions from the Funds. Strategic movements between asset classes were undertaken to implement the revised Investment Policy Statement. Securities lending cash collateral declined $2.3 billion (32%). The decrease in securities lending collateral resulted from a decrease in demand for lendable securities due to changing capital requirements for borrowers and the low interest rate environment.

North Carolina Department of State Treasurer Investments Management’s Discussion and Analysis
Fiscal Year Ended June 30, 2015
5
Statements of Changes in Fiduciary Net Position
Changes in net position are presented in the statements of changes in net position. The purpose of these statements is to present the net investment income earned by the Funds as well as expenses, net pension fund and other withdrawals.
2015 2014
AdditionsInvestment income
Interest and dividend income 2,179,135$ 2,278,481$ Net appreciation in fair value of investments 362,255 10,835,020 Other investment income 134,442 99,926 Securities lending income 36,846 58,825
Total investment income 2,712,678 13,272,252
DeductionsInvestment management expenses 489,629 471,306 Other and administrative expenses 91,636 83,200 Securities lending expenses 6,360 3,550 Total deductions 587,625 558,056 Net increase in net position resulting from operations 2,125,053 12,714,196 Distributions to participants Distributions paid and payable (2,125,053) (12,714,196) Share transactionsReinvestment of distributions 2,124,772 12,714,131 Net share redemptions (1,779,512) (2,482,362)
Changes in net position 345,260 10,231,769 Net position held in trust:
Beginning of year 103,764,099 93,532,330 End of year 104,109,359$ 103,764,099$
Fiscal Years Ended June 30
(In Thousands )
Statements of Changes in Fiduciary Net Position
Analysis of Changes in Fiduciary Net Position
The Funds had net appreciation in fair value of $362 million in fiscal 2015 and $10.8 billion in fiscal 2014, a decline of $10.5 billion (96.7%). The decline was primarily due to unrealized losses on equities and long-term fixed income caused by general stock market declines, appreciation of the U.S. dollar, and higher interest rates on investment grade corporate bonds. Both fiscal years included approximately $2 billion of interest and dividends.
Net withdrawals from the Funds decreased $703 million (28%) in part due to an increase in contributions to STIF from participants other than the pension plans while withdrawals to fund pension benefit payments remained approximately the same.
North Carolina Department of State Treasurer Investments Management’s Discussion and Analysis
Fiscal Year Ended June 30, 2015
6
Economic and Portfolio Discussion
Roughly six years have passed since the “Great Financial Crisis” of 2007 to 2009 and the U.S. economy continues to modestly grow with falling unemployment rates and low inflation. For the year ended June 30, 2015, Gross Domestic Product (GDP) adjusted for inflation increased at an annualized rate of 2.7%; the unemployment rate dropped to a six-year low of 5.3%; consumer price inflation was a modest 0.2%; and core consumer price inflation (i.e., removing the volatile food and energy sectors) was 1.8%. While the Federal Reserve ended its Quantitative Easing program in October 2014, given waning economic growth in early 2015, the Federal Reserve refrained from increasing short-term interest rates for yet another year. After peaking at $107 per barrel in July 2014, the approximate 40% decline in oil prices impacted many sectors in the economy and financial markets. Modest economic growth and limited inflation concerns resulted in market interest rates ending the year largely unchanged from the prior fiscal year end. As the fiscal year came to a close, the implied probability of the first Federal Reserve interest rate increase by the end of 2015 was 65%. This increase would be the first rate increase (tightening) since 2006. At June 30, 2015, the short end of the yield curve was unchanged, while 10- and 30-year U.S. Treasury yields declined by roughly 20 basis points compared to the prior fiscal year-end. Both investment grade and high-yield corporate bonds (i.e., credit quality ratings) experienced notably wider yield premiums compared to similar duration U.S. Treasury bonds during the year (meaning they underperformed U.S. Treasury bonds). Bonds issued by companies in the energy and basic industry sectors were some of the worst performers due to declining commodity prices. Corporate default rates remained low at year-end, but are trending upwards.
The discussion below refers to classifications in the Investment Policy Statement. The Supplementary Information contains a mapping of the Investment Policy Statement’s classifications to the statutory classifications.
The Investment Grade Fixed Income asset class returned 2.1% for the fiscal year versus a benchmark return of 2.3%. The underperformance was driven by a mild overweight to weak performing corporate bonds and underexposure to the long end of the yield curve. After several years of strong performance, the Opportunistic Fixed Income asset class return was (0.5%) for the fiscal year versus a benchmark return of (2.9%). Several long/short credit funds posted disappointing absolute and relative performance, but special situation and distressed strategies performed well.
Global equity markets, as measured by the benchmark, gained only 0.85% for the fiscal year. Stock returns were better in the United States than elsewhere in the world. U.S. equity returns were more in line with long-term expectations with the Russell 3000 index returning 7.29% for the fiscal year. Outside the United States, the benchmark MSCI ACWI IMI fell 4.97%. A rally in the U.S. dollar negated returns in local non-U.S. equity markets. Factors behind the rally in the U.S. dollar included the loosening of monetary policy by both the European Central Bank and the Bank of Japan while the Federal Reserve ended its Quantitative Easing program in October 2014. Slowing growth in emerging market economies negatively impacted returns in those equity markets and in securities issued by global companies that export to emerging markets.
North Carolina Department of State Treasurer Investments Management’s Discussion and Analysis
Fiscal Year Ended June 30, 2015
7
Despite an environment that was generally difficult for active investing, the Public Equity Investment portfolio outperformed its benchmark for the fiscal year by 29 basis points. The U.S. equity asset class underperformed its benchmark by 44 basis points with the closing and winding down of a long only equity activist manager being a major detractor. The Non-U.S. equity asset class outperformed its benchmark by 15 basis points. Finally, the Global Equity asset class beat its benchmark by an impressive 556 basis points which was attributable to one global manager.
Commercial real estate fundamentals remained healthy throughout the year across the different property types. Job growth boosted demand for space in all types of commercial real estate. Demand for retail and industrial space also benefited from strong consumer spending. Within the multifamily residential sector, as employment improved, there was an increase in household formations as millennials who have been doubling up or living with their parents moved out. The secular themes of demographics, technology, and urbanization continued to drive the demand for space in specific markets and submarkets. New commercial real estate construction continues to ramp-up slowly, although multifamily and some hotel markets are further along in the cycle. The Non-core Real Estate asset class had a 19.6% return for the fiscal year, handily beating the 8.8% return of the benchmark. The Core Real Estate asset class had a 7% annual return, lagging the 10.6% return of the benchmark.
For the fiscal year, Private Equity buyout funds generally had more moderated performance relative to the past few years, while venture capital and growth capital funds continued to record strong performance. Many Private Equity funds sold investments into an environment of higher valuations. However, rising volatility in the public equity markets hurt the ability of venture capital backed companies to exit through initial public offerings. Corporate mergers and acquisitions activity also trended down. Reliance on leverage by Private Equity funds has declined which is viewed positively from a risk standpoint, although potentially at the cost of higher returns. For the fiscal year, the Private Equity asset class had a 9.6% annual return, beating the 6.3% return of the benchmark. The venture and growth capital funds posted a strong 19.3% rate of return, due in part to biotech sector investments.
Large declines in commodity prices, notably energy, created a challenging environment for the Inflation Sensitive asset class. The asset class had a (8.0%) return for the fiscal year, beating the (9.4%) return of its benchmark. The weakest subcomponents of the asset class were commodities with a return of (20.5%) and private energy with a return of (10.5%). The strongest subcomponents of the asset class were timber with a return of 10.5% and real assets & diversifiers with a return of 8.8%.
The North Carolina Department of State Treasurer (“Department”) invests the STIF with the objectives of preservation of capital, liquidity, and competitive relative returns. The portfolio is managed with a laddering strategy out to one year that is designed to provide consistent liquidity for short-term cash needs, but allows the portfolio manager to take advantage of investing out the yield curve with a portion of the assets. The STIF return for the year ended June 30, 2015 was 0.49%.
North Carolina Department of State Treasurer Investments Management’s Discussion and Analysis
Fiscal Year Ended June 30, 2015
8
Looking forward, the major initiatives of the Department’s investment programs for the next several years include: implementing a managed account platform to improve control, transparency, and cost of hedge funds; implementing an internally-managed equity index fund; codifying investment beliefs and updating related policies; restructuring/exiting certain fund of funds and legacy low-conviction funds; strategically reviewing the Core Real Estate asset class; finalizing a custom risk system and related processes; and adopting new processes for oversight of the newly unbundled Supplemental Retirement Plans’ investments.
Request for Information
This financial report is designed to provide our citizens, taxpayers, customers, investors, and creditors with a general overview of the North Carolina Department of State Treasurer’s (the “Treasurer”) investment finances and to demonstrate the Treasurer’s accountability for the money it receives. If you have questions about this report or need additional financial information, contact the North Carolina Department of State Treasurer, 3200 Atlantic Avenue, Raleigh, NC 27604, United States (https://www.nctreasurer.com).

North Carolina Department of the State Treasurer Investments Statement of Fiduciary Net Position
As of June 30, 2015 (In Thousands)
9
AssetsCash and cash equivalents 417,473$ Securities lending collateral 4,858,507 Investments, at fair value 103,623,061
Receivables:Accrued interest and dividends 317,222 Investments sold, but not settled 420,690 Other receivables -
Total receivables 737,912 Total assets 109,636,953$
LiabilitiesAccounts payable and accrued liabilities 40,732 Investments purchased, but not settled 438,719 Obligations under securities lending 5,048,143 Total liabilities 5,527,594$
Net PositionNet position held in trust 104,109,359$
The accompanying notes are an integral part of these financial statements.

North Carolina Department of the State Treasurer Investments Statement of Changes in Fiduciary Net Position
Fiscal Year Ended June 30, 2015 (In Thousands)
10
Additions:Investment income:
Interest and dividend income 2,179,135$ Net appreciation in fair value of investments 362,255 Other investment income 134,442 Securities lending income 36,846
Total investment income 2,712,678
DeductionsInvestment management expenses 489,629 Administrative and other expenses 91,636 Securities lending expense 6,360 Total deductions 587,625 Net increase in net position resulting from operations 2,125,053 Distributions to participants Distributions paid and payable (2,125,053) Share transactionsReinvestment of distributions 2,124,772 Net share redemptions (1,779,512)
Change in net position 345,260 Net position held in trust:
Beginning of year 103,764,099 End of year 104,109,359$
The accompanying notes are an integral part of these financial statements.
North Carolina Department of the State Treasurer Investments Notes to Financial Statements
Fiscal Year Ended June 30, 2015
11
1. Financial Reporting Entity
The investments of the North Carolina Department of State Treasurer (the “Funds”) contain deposits from funds and component units of the State of North Carolina, except for the Public Hospitals, certain investments of the Escheat Fund, Bond Proceeds Investment Accounts, and certain legally separate organizations outside the State of North Carolina. The participants of the Funds include Teachers’ and State Employees’ Retirement System, Consolidated Judicial Retirement System, Legislative Retirement System, Firefighters’ and Rescue Squad Workers’ Pension Fund, North Carolina National Guard Pension Fund, Local Governmental Employees’ Retirement System, Teachers and State Employees’ Benefit Trust, Retiree Health Benefit Fund, Disability Income Plan of N.C., and Register of Deeds’ Supplemental Pension Fund as well as component units of the State of North Carolina and other external entities. The deposits are commingled; therefore, the North Carolina Department of State Treasurer (the “Treasurer”) considers all investment portfolios to be part of the Funds. The Funds are not a legally separate entity within the State of North Carolina. Also, the Funds are not registered with the Securities and Exchange Commission and are not subject to any formal oversight other than that of the State of North Carolina.
The Funds, a governmental set of investments of the Treasurer, consist of the following individual investment portfolios: Short-term Investment Fund (“STIF”), Long-term Investment Fund (“LTIF”), External Fixed Income Portfolio, Equity Investment Portfolio, Real Estate Investment Portfolio, Alternative Investment Portfolio, Credit Investment Portfolio, Inflation Protection Investment Portfolio, and OPEB Equity Investment Portfolio.
The accompanying financial statements present only the net position of the Funds and do not purport to, and do not, present fairly the financial position of the State of North Carolina as of June 30, 2015, and the changes in its financial position for the year then ended in conformity with accounting principles generally accepted in the United States.
2. Summary of Significant Accounting Policies
Basis of Presentation
The accompanying financial statements were prepared in accordance with accounting principles generally accepted in the United States (“GAAP”) for governments as applicable to governmental units. The Governmental Accounting Standards Board (“GASB”) is the accepted standard-setting body for establishing governmental accounting and reporting principles. Measurement Focus and Basis of Accounting
The financial statements are reported using the economic resources measurement focus and the accrual basis of accounting. Under this method, additions are recorded when earned and deductions are recorded at the time liabilities are incurred, regardless of the timing of related cash flows.

North Carolina Department of the State Treasurer Investments Notes to Financial Statements
Fiscal Year Ended June 30, 2015
12
New Accounting Standards
In February 2015, the GASB issued Statement No. 72, Fair Value Measurement and Application, (“GASB 72”). This statement defines fair value and describes how state and local governments should define and measure fair value, what assets and liabilities should be measured at fair value, and what information about fair value measurements should be disclosed in the notes to the financial statements. GASB 72 is effective for financial statements for reporting periods beginning after June 15, 2015. As this standard is not yet effective, management has not evaluated the impact on the financial statements, footnotes and related disclosures.
Cash and Cash Equivalents
The Fund reports all cash on hand and deposits in banks, including demand deposits and time deposits as cash and cash equivalents. Restricted cash represents the Funds’ cash held by counterparties as collateral against the Funds’ derivatives. Cash held by counterparties as collateral is not available to the Funds for general operating purposes, but may be applied against amounts due to derivative or securities repurchase agreement counterparties or returned to the Funds when the collateral requirements are exceeded or at the maturity of the derivatives or securities repurchase agreements. Cash equivalents are highly liquid investments with an original maturity of ninety days or less when purchased.
Securities Lending
Cash received as collateral on securities lending transactions is used to purchase investments. These investments are reported as securities lending collateral in the accompanying financial statements and are generally measured at fair value with the exception of repurchase agreements, which are reported at cost. A corresponding liability is also reported as obligations under securities lending in the accompanying financial statements for the amount owed to the broker at the termination of the lending agreement. Income and expenses related to securities lending are reported at gross amount.
Valuation of Investments and Derivatives
Investments and derivatives are generally reported at fair value (predominantly based on quoted market prices) with significant exceptions noted below. Investments held by the Treasurer in the STIF are reported at cost or amortized cost which approximates fair value. Repurchase agreements and non-negotiable certificates of deposit in the STIF are reported at cost which approximates fair value. U.S. Treasuries, U.S. Agencies and domestic corporate bonds in the STIF are reported at amortized cost, which approximates fair value. For most investment holdings, fair values are determined daily for the LTIF, Equity Investment, and OPEB Equity Investment portfolios and quarterly for the Real Estate Investment and Alternative Investment portfolios. The Credit Investment portfolio is valued quarterly except for hedge fund investments which are valued monthly. The Inflation Protection Investment portfolio
North Carolina Department of the State Treasurer Investments Notes to Financial Statements
Fiscal Year Ended June 30, 2015
13
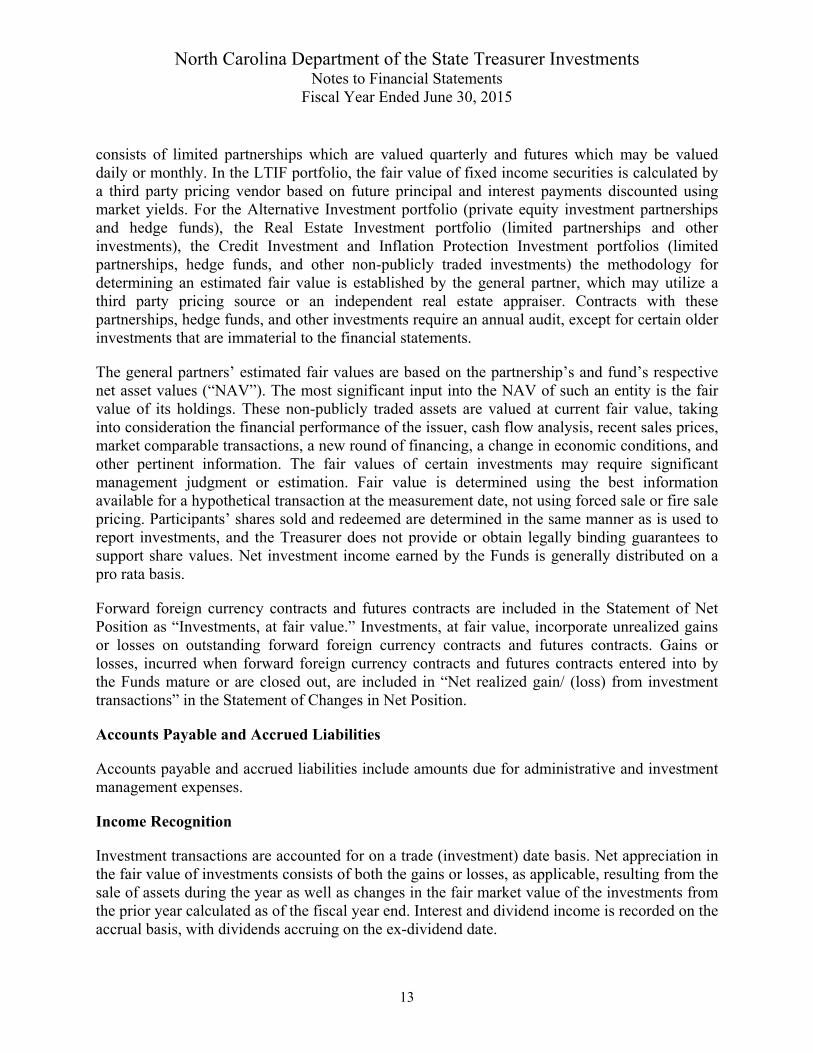
consists of limited partnerships which are valued quarterly and futures which may be valued daily or monthly. In the LTIF portfolio, the fair value of fixed income securities is calculated by a third party pricing vendor based on future principal and interest payments discounted using market yields. For the Alternative Investment portfolio (private equity investment partnerships and hedge funds), the Real Estate Investment portfolio (limited partnerships and other investments), the Credit Investment and Inflation Protection Investment portfolios (limited partnerships, hedge funds, and other non-publicly traded investments) the methodology for determining an estimated fair value is established by the general partner, which may utilize a third party pricing source or an independent real estate appraiser. Contracts with these partnerships, hedge funds, and other investments require an annual audit, except for certain older investments that are immaterial to the financial statements.
The general partners’ estimated fair values are based on the partnership’s and fund’s respective net asset values (“NAV”). The most significant input into the NAV of such an entity is the fair value of its holdings. These non-publicly traded assets are valued at current fair value, taking into consideration the financial performance of the issuer, cash flow analysis, recent sales prices, market comparable transactions, a new round of financing, a change in economic conditions, and other pertinent information. The fair values of certain investments may require significant management judgment or estimation. Fair value is determined using the best information available for a hypothetical transaction at the measurement date, not using forced sale or fire sale pricing. Participants’ shares sold and redeemed are determined in the same manner as is used to report investments, and the Treasurer does not provide or obtain legally binding guarantees to support share values. Net investment income earned by the Funds is generally distributed on a pro rata basis.
Forward foreign currency contracts and futures contracts are included in the Statement of Net Position as “Investments, at fair value.” Investments, at fair value, incorporate unrealized gains or losses on outstanding forward foreign currency contracts and futures contracts. Gains or losses, incurred when forward foreign currency contracts and futures contracts entered into by the Funds mature or are closed out, are included in “Net realized gain/ (loss) from investment transactions” in the Statement of Changes in Net Position.
Accounts Payable and Accrued Liabilities
Accounts payable and accrued liabilities include amounts due for administrative and investment management expenses.
Income Recognition
Investment transactions are accounted for on a trade (investment) date basis. Net appreciation in the fair value of investments consists of both the gains or losses, as applicable, resulting from the sale of assets during the year as well as changes in the fair market value of the investments from the prior year calculated as of the fiscal year end. Interest and dividend income is recorded on the accrual basis, with dividends accruing on the ex-dividend date.
North Carolina Department of the State Treasurer Investments Notes to Financial Statements
Fiscal Year Ended June 30, 2015
14
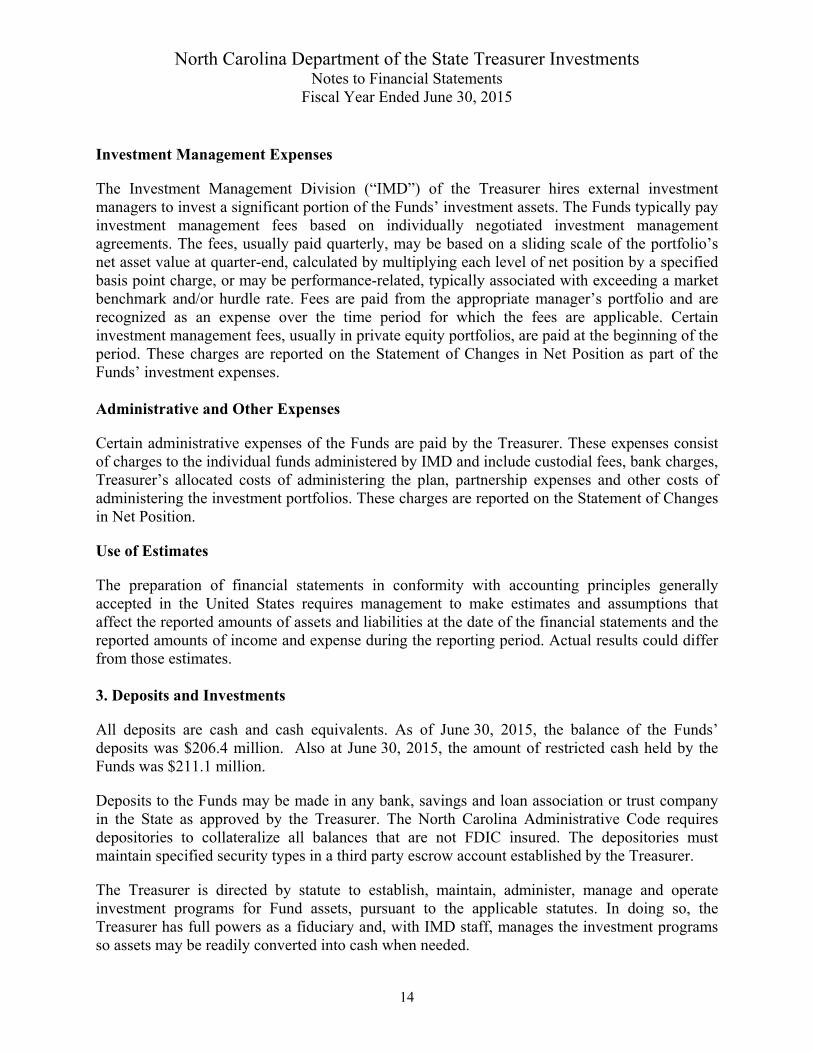
Investment Management Expenses
The Investment Management Division (“IMD”) of the Treasurer hires external investment managers to invest a significant portion of the Funds’ investment assets. The Funds typically pay investment management fees based on individually negotiated investment management agreements. The fees, usually paid quarterly, may be based on a sliding scale of the portfolio’s net asset value at quarter-end, calculated by multiplying each level of net position by a specified basis point charge, or may be performance-related, typically associated with exceeding a market benchmark and/or hurdle rate. Fees are paid from the appropriate manager’s portfolio and are recognized as an expense over the time period for which the fees are applicable. Certain investment management fees, usually in private equity portfolios, are paid at the beginning of the period. These charges are reported on the Statement of Changes in Net Position as part of the Funds’ investment expenses. Administrative and Other Expenses
Certain administrative expenses of the Funds are paid by the Treasurer. These expenses consist of charges to the individual funds administered by IMD and include custodial fees, bank charges, Treasurer’s allocated costs of administering the plan, partnership expenses and other costs of administering the investment portfolios. These charges are reported on the Statement of Changes in Net Position.
Use of Estimates
The preparation of financial statements in conformity with accounting principles generally accepted in the United States requires management to make estimates and assumptions that affect the reported amounts of assets and liabilities at the date of the financial statements and the reported amounts of income and expense during the reporting period. Actual results could differ from those estimates. 3. Deposits and Investments
All deposits are cash and cash equivalents. As of June 30, 2015, the balance of the Funds’ deposits was $206.4 million. Also at June 30, 2015, the amount of restricted cash held by the Funds was $211.1 million.
Deposits to the Funds may be made in any bank, savings and loan association or trust company in the State as approved by the Treasurer. The North Carolina Administrative Code requires depositories to collateralize all balances that are not FDIC insured. The depositories must maintain specified security types in a third party escrow account established by the Treasurer.
The Treasurer is directed by statute to establish, maintain, administer, manage and operate investment programs for Fund assets, pursuant to the applicable statutes. In doing so, the Treasurer has full powers as a fiduciary and, with IMD staff, manages the investment programs so assets may be readily converted into cash when needed.
North Carolina Department of the State Treasurer Investments Notes to Financial Statements
Fiscal Year Ended June 30, 2015
15
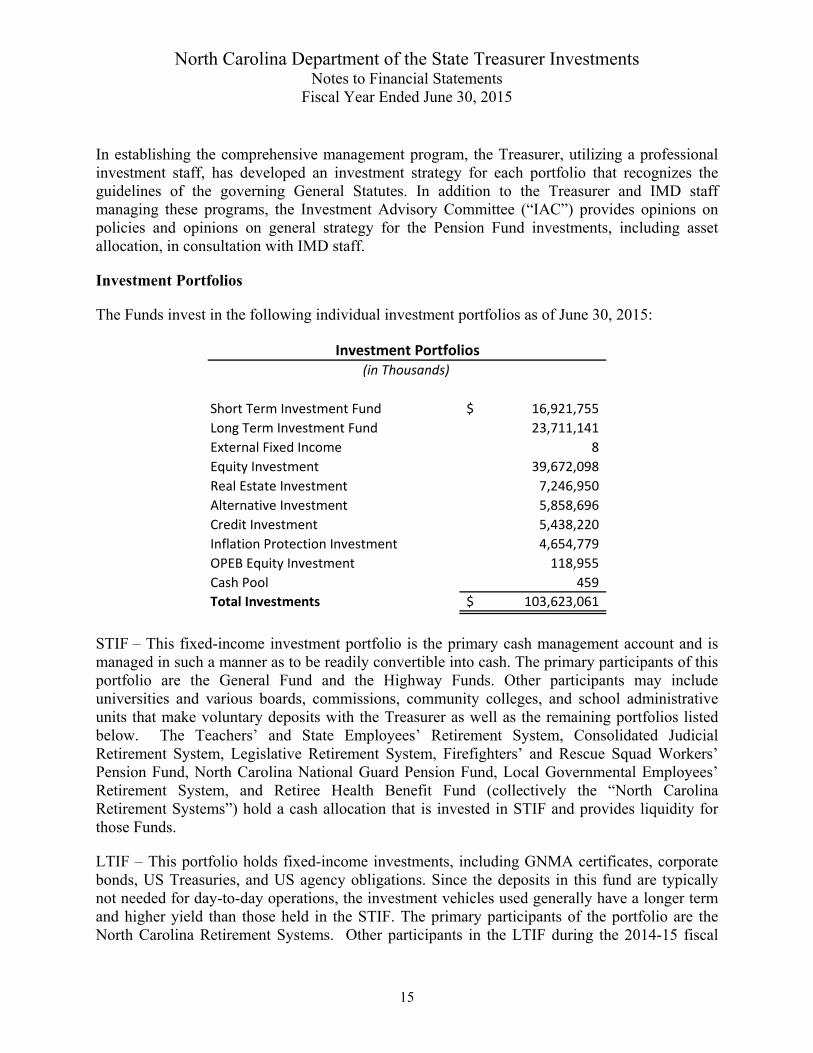
In establishing the comprehensive management program, the Treasurer, utilizing a professional investment staff, has developed an investment strategy for each portfolio that recognizes the guidelines of the governing General Statutes. In addition to the Treasurer and IMD staff managing these programs, the Investment Advisory Committee (“IAC”) provides opinions on policies and opinions on general strategy for the Pension Fund investments, including asset allocation, in consultation with IMD staff.
Investment Portfolios
The Funds invest in the following individual investment portfolios as of June 30, 2015:
Short Term Investment Fund 16,921,755$
Long Term Investment Fund 23,711,141
External Fixed Income 8
Equity Investment 39,672,098
Real Estate Investment 7,246,950
Alternative Investment 5,858,696
Credit Investment 5,438,220
Inflation Protection Investment 4,654,779
OPEB Equity Investment 118,955
Cash Pool 459
Total Investments 103,623,061$
Investment Portfolios(in Thousands)
STIF – This fixed-income investment portfolio is the primary cash management account and is managed in such a manner as to be readily convertible into cash. The primary participants of this portfolio are the General Fund and the Highway Funds. Other participants may include universities and various boards, commissions, community colleges, and school administrative units that make voluntary deposits with the Treasurer as well as the remaining portfolios listed below. The Teachers’ and State Employees’ Retirement System, Consolidated Judicial Retirement System, Legislative Retirement System, Firefighters’ and Rescue Squad Workers’ Pension Fund, North Carolina National Guard Pension Fund, Local Governmental Employees’ Retirement System, and Retiree Health Benefit Fund (collectively the “North Carolina Retirement Systems”) hold a cash allocation that is invested in STIF and provides liquidity for those Funds.
LTIF – This portfolio holds fixed-income investments, including GNMA certificates, corporate bonds, US Treasuries, and US agency obligations. Since the deposits in this fund are typically not needed for day-to-day operations, the investment vehicles used generally have a longer term and higher yield than those held in the STIF. The primary participants of the portfolio are the North Carolina Retirement Systems. Other participants in the LTIF during the 2014-15 fiscal

North Carolina Department of the State Treasurer Investments Notes to Financial Statements
Fiscal Year Ended June 30, 2015
16
year included the Escheat Fund, Disability Income Plan of NC, and other boards, commissions, community colleges, school administrative units, and public authorities of the State.
External Fixed Income – This portfolio primarily holds a portion of the STIF portfolio. The North Carolina Retirement Systems are the sole participants in the portfolio.
Equity Investment – This portfolio primarily holds an equity-based trust. The North Carolina Retirement Systems are the sole participants in the portfolio.
Real Estate Investment – This portfolio holds investments in real estate-based trust funds, limited partnerships and other limited liability investment vehicles, group annuity contracts, and accounts managed under contractual relationships giving an external investment manager discretion. The North Carolina Retirement Systems are the sole participants in the portfolio.
Alternative Investment – This portfolio holds investments in limited partnerships and other limited liability investment vehicles, hedge funds, US Treasuries, and equities received in the form of distributions from its primary investments. The North Carolina Retirement Systems are the sole participants in the portfolio.
Credit Investment – This portfolio holds investments in debt-related strategies made primarily through limited partnerships or other limited liability vehicles. The North Carolina Retirement Systems are the sole participants in the portfolio.
Inflation Protection Investment – This portfolio holds investments in assets that are acquired for the primary purpose of providing protection against risks associated with inflation made primarily through limited partnerships or other limited liability vehicles. The North Carolina Retirement Systems are the sole participants in the portfolio.
OPEB Equity Investment – This portfolio holds equity-based trusts. These trusts are established for local governments, public authorities, any entity eligible to participate in the State’s Local Governmental Employees’ Retirement System, and local school administrative units. Eligible participants make voluntary contributions to the trusts for the purpose of depositing and investing all or part of the contribution from their other postemployment benefit plans. As of June 30, 2015, there were sixteen participants. Each participant is responsible for making its own investment decision. However, through signed agreements with the Treasurer, most participants have delegated certain investment authority to the Treasurer.

North Carolina Department of the State Treasurer Investments Notes to Financial Statements
Fiscal Year Ended June 30, 2015
17
Investments by Type
The following schedule discloses the investments, by investment type, as of June 30, 2015. Other Investment Portfolios in the following schedule consist of all portfolios previously defined in the Statutory Asset Allocation schedule above, excluding STIF and LTIF.
Investment Type TotalSTIF (In Thousands)U.S. treasuries 7,504,289$ U.S. agencies 7,119,159 Domestic corporate bonds 54,955 Certificates of deposit 13,600 Securities purchased with cash collateral under securities lending program
U.S. agenciesAsset-backed securities 77,774 Negotiable certificates of deposit 135,503 Repurchase agreements 97,732 Money market mutual fund 40,360 Commercial paper 47,122 Domestic corporate bonds 729,964
Repurchase agreements 2,188,000 Collective investment funds 41,750
Subtotal 18,050,208$
LTIFU.S. treasuries 5,383,084$ U.S. agencies 928,799 Mortgage pass-through 8,681,196 Securities purchased with cash collateral under securities lending program
U.S. agenciesAsset-backed securities 107,093 Negotiable certificates of deposit 193,093 Repurchase agreements 533,732 Money market mutual fund 92,425 Commercial paper 20,380 Domestic corporate bonds 1,212,648
Collective investment funds 145,660 Domestic corporate bonds 8,547,381 Foreign government bonds 25,021
Subtotal 25,870,512$

North Carolina Department of the State Treasurer Investments Notes to Financial Statements
Fiscal Year Ended June 30, 2015
18
Investments by Type (Continued)
Investment Type TotalO ther investment portfoliosU.S. treasuries 1,314,409 U.S. agencies 776,231 Collective investment funds 16,316 Securities purchased with cash collateral under securities lending program
U.S. agencies 22,000 U.S. treasuries 14,800 Asset-backed securities 269,232 Negotiable certificates of deposit 65,998 Euro certificate of deposit 65,000 Yankee certificate of deposit 782,055 Bank notes 39,997 Commercial paper 54,972 Repurchase agreements 256,628
Equity based trust-domestic 24,961,634 Equity based trust-international 14,188,493 OPEB equity based trust-domestic 90,197 OPEB equity based trust-international 28,758 Alternative investments
Hedge funds 277,024 Private equity investment partnerships 4,726,969 Stock distributions 20,074
Real estate trust funds 7,246,950 Credit investments 5,438,220 Inflation protection investments 3,904,891
Subtotal 64,560,848 Total investments 108,481,568$
Recon to Investments on NP 108,481,568$ Sec Lending collateral (4,858,507) Investments on statement of net position 103,623,061$
Interest Rate Risk
Interest rate risk is the risk that changes in interest rates will adversely affect the fair value of debt instruments. There is no formally adopted investment policy to manage interest rate risk. Fixed income assets of the STIF are invested in a laddered maturity approach that focuses on short maturity securities with ample liquidity. The STIF had a weighted average maturity of 1.5 years as of June 30, 2015. Most of the cash and cash equivalents of the major governmental and enterprise funds are invested in this portfolio.

North Carolina Department of the State Treasurer Investments Notes to Financial Statements
Fiscal Year Ended June 30, 2015
19
The Funds maintained by the Treasurer had the following investments and maturities in the STIF as of June 30, 2015:
Investment Maturities (in Years)
STIF Carry Amount Less Than 1 1 to 5 6 to 10 More Than 10
(In Thousands)As of June 30, 2015U.S. treasuries 7,504,289$ 7,203,867$ 300,422$ -$ -$ U.S. agencies 7,119,159 250,039 6,869,120 - - Domestic corporate bonds 54,955 - 54,955 - - Securities purchased with cash collateral under securities lending program:
Asset-backed securities 77,774 77,774 - - - Negotiable certificates of deposit 135,503 135,503 - - - Repurchase agreements 97,732 97,732 - - - Money market mutual funds 40,360 40,360 - - - Commercial paper 47,122 47,122 - - - Domestic corporate bonds 729,964 729,964 - - -
Collective investment funds 41,750 41,750 - - - Repurchase agreements 2,188,000 2,188,000 - - - Total short-term investment fund assets 18,036,608$ 10,812,111$ 7,224,497$ -$ -$
The assets of the LTIF are primarily invested in securities with maturities longer than five years. The longer maturity range is more sensitive to interest rate changes; however, the longer duration structure of the portfolio provides a better match to the long duration characteristics of the retirement systems’ liabilities. The Treasurer considers the maturity for interest rate risk purposes to be the length of time to the next reset date rather than the stated maturity. The LTIF had a weighted average maturity of 18.0 years as of June 30, 2015.
The LTIF holds investments in Government National Mortgage Association (GNMA) mortgage pass-through funds. Critical to the pricing of these securities are the specific features of the cash flows from the interest and principal payments of the underlying mortgages. Therefore, these valuations are sensitive to the potential of principal prepayments by mortgagees in periods of changing interest rates. Also, included within the LTIF are U.S. government agencies and corporate bonds which may carry call options in which the issuer has the option to prepay the principal at certain dates over the life of the security. As such, these types of securities are more sensitive to the decline in long-term interest rates than similar securities without call options. In addition to the corporate bonds with call options, there are corporate bonds with variable coupon rates that reset on specific dates. The cash collateral received from securities lending has also been invested in corporate bonds and asset-backed securities with floating rates. Critical to the cash flows and pricing of these securities are the changes in interest rates.

North Carolina Department of the State Treasurer Investments Notes to Financial Statements
Fiscal Year Ended June 30, 2015
20
The Funds maintained by the Treasurer had the following investments and maturities in the LTIF as of June 30, 2015:
Investment Maturities (in Years)LTIF Carry Amount Less Than 1 1 to 5 6 to 10 More Than 10
(In Thousands)As of June 30, 2015U.S. treasuries 5,383,084$ -$ 175,473$ 2,624,394$ 2,583,217$ U.S. agencies 928,799 - - 152,325 776,474 Mortgage pass-through 8,681,196 - 293 17,686 8,663,217 Securities purchased with cash collateral under securities lending program:
Asset-backed securities 107,093 107,093 - - - Negotiable certificates of deposit 193,093 193,093 - - - Repurchase agreements 533,732 533,732 - - - Commercial paper 20,380 20,380 - - - Money market mutual funds 92,425 92,425 - - - Domestic corporate bonds 1,212,648 1,212,648 - - -
Collective investment funds 145,660 145,660 - - - Domestic corporate bonds 8,547,381 4,975 617,087 4,297,749 3,627,570 Foreign government bonds 25,021 - - 25,021 - Total long-term investment fund assets 25,870,512$ 2,310,006$ 792,853$ 7,117,175$ 15,650,478$
The Other Investment Portfolios hold fixed income investments in U.S. treasuries and U.S. agencies. The Funds maintained by the Treasurer had the following investments and maturities separated by Other Investment Portfolios as of June 30, 2015:
Investment Maturities (in Years)
Other Investment Portfolios Carry Amount Less Than 1 1 to 5 6 to 10 More Than 10
(In Thousands)As of June 30, 2015U.S. treasuries 1,314,409$ 1,280,650$ 33,759$ -$ -$ U.S. agencies 776,231 631,416 144,815 - - Collective investment funds 16,316 16,316 - - - Securities purchased with cash collateral under securities lending program:
U.S. agencies 22,000 22,000 - - - U.S. treasuries 14,800 14,800 - - - Asset-backed securities 269,232 269,232 - - - Negotiable certificates of deposit 65,998 65,998 - - - Euro certificate of deposit 65,000 65,000 - - - Yankee certificate of deposit 782,055 782,055 - - - Bank notes 39,997 39,997 - - - Commercial paper 54,972 54,972 - - - Repurchase agreements 256,628 256,628 - - -
Total other investment portfolios assets 3,677,638$ 3,499,064$ 178,574$ -$ -$
North Carolina Department of the State Treasurer Investments Notes to Financial Statements
Fiscal Year Ended June 30, 2015
21
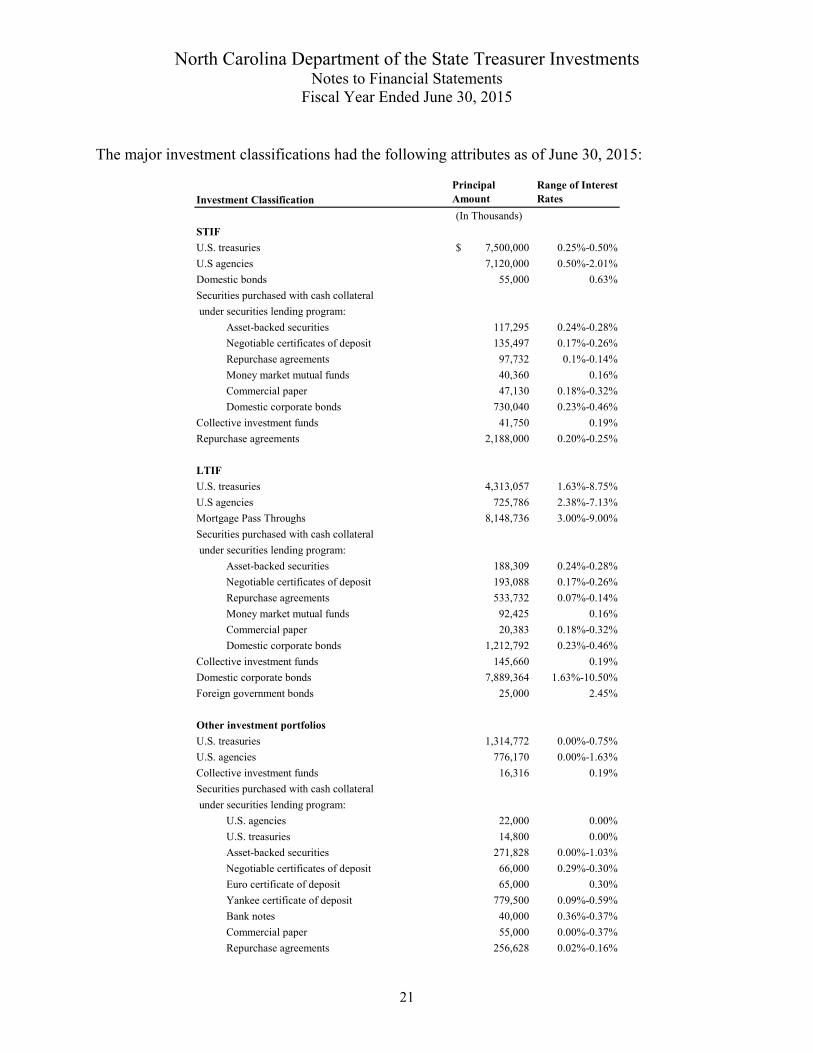
The major investment classifications had the following attributes as of June 30, 2015:
Investment ClassificationPrincipal Amount
Range of Interest Rates
(In Thousands)
STIF
U.S. treasuries 7,500,000$ 0.25%-0.50%
U.S agencies 7,120,000 0.50%-2.01%
Domestic bonds 55,000 0.63%
Securities purchased with cash collateral
under securities lending program:
Asset-backed securities 117,295 0.24%-0.28%
Negotiable certificates of deposit 135,497 0.17%-0.26%
Repurchase agreements 97,732 0.1%-0.14%
Money market mutual funds 40,360 0.16%
Commercial paper 47,130 0.18%-0.32%
Domestic corporate bonds 730,040 0.23%-0.46%
Collective investment funds 41,750 0.19%
Repurchase agreements 2,188,000 0.20%-0.25%
LTIF
U.S. treasuries 4,313,057 1.63%-8.75%
U.S agencies 725,786 2.38%-7.13%
Mortgage Pass Throughs 8,148,736 3.00%-9.00%
Securities purchased with cash collateral
under securities lending program:
Asset-backed securities 188,309 0.24%-0.28%
Negotiable certificates of deposit 193,088 0.17%-0.26%
Repurchase agreements 533,732 0.07%-0.14%
Money market mutual funds 92,425 0.16%
Commercial paper 20,383 0.18%-0.32%
Domestic corporate bonds 1,212,792 0.23%-0.46%
Collective investment funds 145,660 0.19%
Domestic corporate bonds 7,889,364 1.63%-10.50%
Foreign government bonds 25,000 2.45%
Other investment portfolios
U.S. treasuries 1,314,772 0.00%-0.75%
U.S. agencies 776,170 0.00%-1.63%
Collective investment funds 16,316 0.19%
Securities purchased with cash collateral
under securities lending program:
U.S. agencies 22,000 0.00%
U.S. treasuries 14,800 0.00%
Asset-backed securities 271,828 0.00%-1.03%
Negotiable certificates of deposit 66,000 0.29%-0.30%
Euro certificate of deposit 65,000 0.30%
Yankee certificate of deposit 779,500 0.09%-0.59%
Bank notes 40,000 0.36%-0.37%
Commercial paper 55,000 0.00%-0.37%
Repurchase agreements 256,628 0.02%-0.16%

North Carolina Department of the State Treasurer Investments Notes to Financial Statements
Fiscal Year Ended June 30, 2015
22
Credit Risk
Credit risk is the risk an issuer or other counterparty to an investment will not fulfill its obligations such as the chance that a bond issuer will fail to pay interest or principal in a timely manner, or that negative perceptions of the issuer’s ability to make these payments will cause security prices to decline. These circumstances may arise due to a variety of factors such as financial weakness, bankruptcy, litigation and/or adverse political developments. Certain fixed income securities, including obligations of the U.S. government or those explicitly guaranteed by the U.S. government, are not considered to have credit risk.
The Treasurer limits credit risk by restricting the STIF’s corporate obligations, asset-backed securities, and commercial paper to securities that bear the highest rating of at least one nationally recognized rating service and do not bear a rating below the highest by any nationally recognized rating service.
The STIF had the following credit quality distribution for securities with credit exposure as of June 30, 2015:
STIF Aaa/AAA Aa/AA A Baa/BBB
Less than Investment
Grade Unrated
As of June 30, 2015U.S. agencies -$ 7,119,159$ -$ -$ -$ -$ Domestic bonds 54,955 - - - - - Securities purchased with cash collateral under securities lending program:
Asset-backed securities - - - - 77,774 - Negotiable certificates of deposit - - 135,503 - - - Repurchase agreements - 97,732 - - - - Money market mutual funds 40,360 - - - - - Commercial paper - - 47,122 - - - Domestic corporate bonds - 205,320 524,644 - - -
Collective investment funds - - - - - 41,750 Repurchase agreements - 2,188,000 - - - - Total short-term investment fund assets 95,315$ 9,610,211$ 707,269$ -$ 77,774$ 41,750$
(In Thousands)
The Treasurer specifies the cash investment options for the LTIF and limits credit risk by restricting the LTIF’s asset-backed securities and corporate obligations to securities that bear one of the four highest ratings of at least one nationally recognized rating service. In the LTIF, all holdings were rated BBB (or equivalent) or higher at the time of purchase by at least one of the nationally recognized rating agencies.

North Carolina Department of the State Treasurer Investments Notes to Financial Statements
Fiscal Year Ended June 30, 2015
23
The LTIF had the following credit quality distribution for securities with credit exposure as of June 30, 2015:
LTIF Aaa/AAA Aa/AA A Baa/BBB
Less than Investment
Grade Unrated
As of June 30, 2015U.S. agencies -$ 928,799$ -$ -$ -$ -$ Collateralized mortgage obligations - - - - - - Commercial mortgage-backed securities - - - - - - Asset-backed securities - - - - - - Repurchase agreements - - - - - - Collective investment funds - - - - - 145,660 Domestic corporate bonds 70,388 598,769 4,145,716 3,428,539 303,969 - Foreign government bonds - - 25,021 - - - Securities purchased with cash collateral under securities lending program:
Asset-backed securities - - - - 107,093 - Negotiable certificates of deposit - - 193,093 - - - Repurchase agreements - 533,732 - - - - Money market mutual fund 92,425 - - - - - Commercial paper - - 20,380 - - - Domestic corporate bonds - 332,806 879,842 - - -
Total long-term investment fund assets 162,813$ 2,394,106$ 5,264,052$ 3,428,539$ 411,062$ 145,660$
(In Thousands)
The Other Investment Portfolios of the Funds had the following credit quality distribution for securities with credit exposure as of June 30, 2015:
Other Investment Portfolios Aaa/AAA Aa/AA A Baa/BBB
Less than Investment
Grade Unrated
As of June 30, 2015U.S. agencies -$ 776,231 -$ -$ -$ -$ Collective investment funds - - - - - 16,316 Securities purchased with cash collateral under securities lending program:
U.S. agencies - 22,000 - Asset-backed securities 7,691 25,620 230,983 641 4,297 - Negotiable certificates of deposit - 65,998 - - - - Euro certificate of deposit - - 65,000 - - - Yankee certificate of deposit - 26,495 755,560 - - - Bank notes - 39,997 - - - - Commercial paper - - 54,972 - - - Repurchase agreements - - 256,628 - - -
Total other investment portfolios assets 7,691$ 956,341$ 1,363,143$ 641$ 4,297$ 16,316$
(In Thousands)
Custodial Credit Risk
Custodial credit risk for deposits is the risk that, in the event of a bank failure, the Funds’ deposits may not be recovered. As of June 30, 2015, the Funds’ deposits were exposed to custodial credit risk for non-negotiable certificates of deposit in the amount of $13.6 million. The non-negotiable certificates of deposit were uninsured and were collateralized with securities not in the name of the Treasurer and held by an agent.
North Carolina Department of the State Treasurer Investments Notes to Financial Statements
Fiscal Year Ended June 30, 2015
24
For an investment, custodial credit risk is the risk that, in the event of the failure of the counterparty, the Treasurer will not be able to recover the value of its investments or collateral securities that are in the possession of an outside party. As of June 30, 2015, the investments purchased with cash collateral under the securities lending programs of $4.9 billion were not exposed to custodial credit risk since the securities were held by the counterparty in separate accounts in the name of the Treasurer. All other investments of the Funds were not exposed to custodial credit risk at year-end. There is no formally adopted investment policy to manage custodial credit risk policy for these investment types.
The Treasurer’s deposit policy for custodial credit risk is limited to complying with the collateralization rules of the North Carolina Administrative Code (Chapter 20 NCAC 7).
Concentration of Credit Risk
Concentration of credit risk is the risk of loss attributed to the magnitude of a government’s investment in a single issuer. Mutual funds, money market funds, and external pooled accounts are excluded from this disclosure requirement. Obligations explicitly guaranteed by the U.S. Government are not considered to have credit risk. At fiscal year-end, no more than 5% of the securities of the Funds were invested in a single issuer.
Foreign Currency Risk
Foreign currency risk is the risk that changes in exchange rates will adversely affect the fair value of an investment or a deposit. There is no formally adopted investment policy to limit foreign currency exposure.
North Carolina Department of the State Treasurer Investments Notes to Financial Statements
Fiscal Year Ended June 30, 2015
25
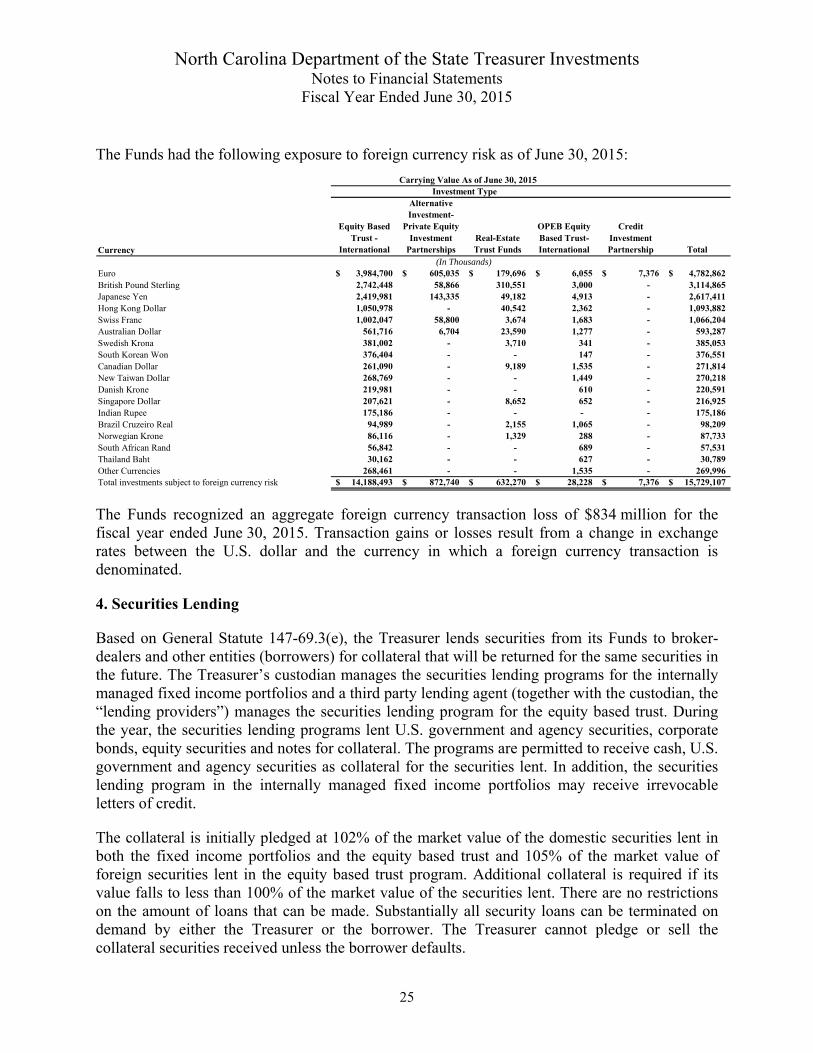
The Funds had the following exposure to foreign currency risk as of June 30, 2015:
Carrying Value As of June 30, 2015
Currency
Equity Based Trust -
International
Alternative Investment-
Private Equity Investment
PartnershipsReal-Estate Trust Funds
OPEB Equity Based Trust-International
Credit Investment Partnership Total
Euro 3,984,700$ 605,035$ 179,696$ 6,055$ 7,376$ 4,782,862$ British Pound Sterling 2,742,448 58,866 310,551 3,000 - 3,114,865 Japanese Yen 2,419,981 143,335 49,182 4,913 - 2,617,411 Hong Kong Dollar 1,050,978 - 40,542 2,362 - 1,093,882 Swiss Franc 1,002,047 58,800 3,674 1,683 - 1,066,204 Australian Dollar 561,716 6,704 23,590 1,277 - 593,287 Swedish Krona 381,002 - 3,710 341 - 385,053 South Korean Won 376,404 - - 147 - 376,551 Canadian Dollar 261,090 - 9,189 1,535 - 271,814 New Taiwan Dollar 268,769 - - 1,449 - 270,218 Danish Krone 219,981 - - 610 - 220,591 Singapore Dollar 207,621 - 8,652 652 - 216,925 Indian Rupee 175,186 - - - - 175,186 Brazil Cruzeiro Real 94,989 - 2,155 1,065 - 98,209 Norwegian Krone 86,116 - 1,329 288 - 87,733 South African Rand 56,842 - - 689 - 57,531 Thailand Baht 30,162 - - 627 - 30,789 Other Currencies 268,461 - - 1,535 - 269,996 Total investments subject to foreign currency risk 14,188,493$ 872,740$ 632,270$ 28,228$ 7,376$ 15,729,107$
Investment Type
(In Thousands)
The Funds recognized an aggregate foreign currency transaction loss of $834 million for the fiscal year ended June 30, 2015. Transaction gains or losses result from a change in exchange rates between the U.S. dollar and the currency in which a foreign currency transaction is denominated.
4. Securities Lending
Based on General Statute 147-69.3(e), the Treasurer lends securities from its Funds to broker-dealers and other entities (borrowers) for collateral that will be returned for the same securities in the future. The Treasurer’s custodian manages the securities lending programs for the internally managed fixed income portfolios and a third party lending agent (together with the custodian, the “lending providers”) manages the securities lending program for the equity based trust. During the year, the securities lending programs lent U.S. government and agency securities, corporate bonds, equity securities and notes for collateral. The programs are permitted to receive cash, U.S. government and agency securities as collateral for the securities lent. In addition, the securities lending program in the internally managed fixed income portfolios may receive irrevocable letters of credit.
The collateral is initially pledged at 102% of the market value of the domestic securities lent in both the fixed income portfolios and the equity based trust and 105% of the market value of foreign securities lent in the equity based trust program. Additional collateral is required if its value falls to less than 100% of the market value of the securities lent. There are no restrictions on the amount of loans that can be made. Substantially all security loans can be terminated on demand by either the Treasurer or the borrower. The Treasurer cannot pledge or sell the collateral securities received unless the borrower defaults.

North Carolina Department of the State Treasurer Investments Notes to Financial Statements
Fiscal Year Ended June 30, 2015
26
The cash collateral received is invested by the lending provider and held in a separate account in the name of the Treasurer. The policies for investments purchased with cash collateral under the securities lending program are set forth in the contracts with the lending providers. The weighted average maturities of the cash collateral investments are more than the weighted average maturities of the securities loans.
As of June 30, 2015, the Treasurer had no credit risk exposure to borrowers because the amounts the Treasurer owed the borrowers exceeded the amounts the borrowers owed the Treasurer. The lending providers are contractually obligated to indemnify the Treasurer for certain conditions, the most important is default on the part of the borrowers.
Securities Lending - Internally Managed Fixed Income
Under the prior securities lending guidelines for the internally managed fixed income portfolios, asset-backed securities must bear the highest rating of at least one nationally recognized rating service. The expected maturity shall not exceed five years and securities having a final maturity greater than two years will be in floating rate instruments with interest rate resets occurring at no greater than 90-day intervals to minimize the effect of interest rate fluctuations on their valuations. Corporate bonds and notes, including bank holding company obligations, rated AA must have a final maturity no greater than three years. Securities rated A must have a final maturity no greater than two years. No more than five percent of the cash collateral may be invested in a single issue.
During the market crisis of late 2008, there was a default in a Lehman Brothers floating rate note in which securities lending collateral had been invested in the fixed income securities lending program. Since that time, several other investments with potential losses were identified. The Treasurer directed that all securities lending revenues would be deposited into a separate account. These funds are invested into a collective investment trust fund, and are included on the Statement of Net Position. The purpose of the separate account is to provide a reserve account to offset expected losses. As of June 30, 2015, the Treasurer had an unrealized loss in the Securities Lending Collateral Fund of $189.2 million and had accumulated $187.4 million in the separate account.
Securities purchased under the current securities lending program for the internally managed fixed income portfolios will not have a final maturity greater than 397 days. The custodian is not permitted to make investments where the weighted average maturity of all investments exceeds 60 days. As of June 30, 2015, the weighted average maturity of investments was approximately 25 days. The securities pledged as collateral for repurchase agreements are limited to securities issued or guaranteed by the U.S. government or its agencies. At the time of purchase, asset-backed securities are required to have an AAA rating by at least two of the rating agencies. All other eligible securities must have a minimum short-term rating of A-1/P-1 or a long-term rating of A/A2. No more than 5% of the collateral account’s total assets may be invested in a corporate or bank obligation, or asset-backed securities of a single issuer or sponsor.

North Carolina Department of the State Treasurer Investments Notes to Financial Statements
Fiscal Year Ended June 30, 2015
27
As of June 30, 2015, the fair value of loaned securities in the fixed income program was $6.5 billion; the fair value of the associated collateral was $6.5 billion of which $3.3 billion was cash.
Securities Lending - Equity Based Trust
Under the prior securities lending guidelines, cash collateral was invested by the lending provider in a variety of permitted investments including asset backed securities, U.S. Treasuries and commingled or mutual funds. These investments had certain credit and concentration restrictions and were managed such as to ensure that the average effective duration of the fund would not exceed 120 days. In 2010, when the current guidelines were adopted, the remaining balance of these assets was transferred in kind to a separate account in the name of the State Treasurer with the remainder in a legacy portfolio. As of June 30, 2015, the average duration of these investments was approximately 43 days and an average weighted final maturity of 2,126 days.
Under the current securities lending guidelines for the equity based trust adopted in 2010, all eligible investments must be rated at least A1, P1 or F1 by at least two nationally recognized rating organizations, except for repurchase agreements which require the counterparty to have a short-term rating of at least A2, P2 or F2 by at least one of the nationally recognized rating agencies. All eligible securities must be acquired with no more than 13 months remaining to legal final maturity. The dollar-weighted average maturity of the cash collateral account should not exceed 60 days and should not have a dollar-weighted average maturity to final in excess of 120 days. The average weighted duration of the investments was approximately 23 days and an average weighted final maturity of approximately 89 days. The securities pledged as collateral for repurchase agreements are limited to securities issued or guaranteed by the U.S. government or its agencies. No more than five percent of the cash collateral may be invested in a single issue.
As of June 30, 2015, the fair value of loaned securities in the equity based trust program was $1.7 billion; the fair value of the associated collateral was $1.8 billion, of which $1.6 billion was cash. As of June 30, 2015, noncash collateral of $227.0 million was invested in U.S. government guaranteed securities and government agency securities which are not subject to credit risk.
5. Derivatives
Derivative instruments are securities that derive value from another asset and are in the form of a contract between two or more parties. Common derivatives are futures contracts, forwards contracts, options and swaps.
The Funds maintained by the Treasurer have investments in equity, commodity, and foreign currency futures, foreign currency forward and spot currency contracts and options. All of these derivative instruments are designated as investment derivatives; they are used to implement portfolio strategies, capture valuation opportunities, and to exploit market inefficiencies. The primary risks managed by using these derivative instruments include foreign exchange rate and market price risks.

North Carolina Department of the State Treasurer Investments Notes to Financial Statements
Fiscal Year Ended June 30, 2015
28
Futures contracts are standardized, exchange-traded contracts to purchase or sell a specific financial instrument at a predetermined price. Gains and losses on futures contracts are settled daily based on underlying principal value and do not involve an actual transfer of the specific instrument. The exchange assumes the risk that the counterparty will not pay and generally requires margin payments to minimize such risk. Futures are generally used to achieve the desired market exposure of a security or index or to rebalance the total portfolio.
Forward currency contracts are agreements to exchange the currency of one country for the currency of another currency at an agreed-upon price and settlement date. These forward commitments are not standardized and carry credit risk due to the possible non-performance of one of the counterparties. The maximum potential loss is the aggregate face value in U.S. dollars at the time the contract was opened; however, the likelihood of such a loss is remote. In addition to forward currency contracts, the Funds also utilize spot currency contracts. Spot currency contracts are used primarily for trade settlement and currency repatriation.
As of June 30, 2015, the counterparties’ credit ratings for forward currency contracts that are subject to credit risk had a rating of no less than BBB by one of the nationally recognized ratings agencies or were not rated.
An option gives the buyer a stipulated privilege of buying or selling a stated property, security, or commodity at a given price (strike price) within a specified time. A securities option is a negotiable contract in which the seller (writer), for a certain sum of money called the option premium, gives the buyer the right to demand within a specified time the purchase (call) from or sale (put) to the option seller of a specified number of bonds, currency units, index units, or shares of stock, at a fixed price or rate, called the strike price.
The following table is a summary of derivative instrument activity during the fiscal year and balances at year-end, classified by type with notional amount for the year ending June 30, 2015:
Investment Derivatives ClassificationAmount
(In U.S. $) ClassificationAmount
(In U.S. $)Notional
(In U.S. $)
US dollar equity futures Investment Income (16,254)$ Investment (16,254)$ 1,263,527$
Foreign equity futures Investment Income (14,567) Investment (14,567) 941,764
Commodity futures Investment Income 3,690 Investment 3,690 861,448
Foreign currency futures Investment Income 2,501 Investment 2,501 144,334 Forward currency contracts Investment Income 7,663 Investment 7,663 993,313 US dollar options Investment Income (1,032) Investment (1,032) 138,500
Foreign currency options Investment Income (3,119) Investment (3,119) 516,980
Spot currency contracts Investment Income 709 Investment 709 457,010
in Fair Value Fair Value
(In Thousands)
North Carolina Department of the State Treasurer Investments Notes to Financial Statements
Fiscal Year Ended June 30, 2015
29
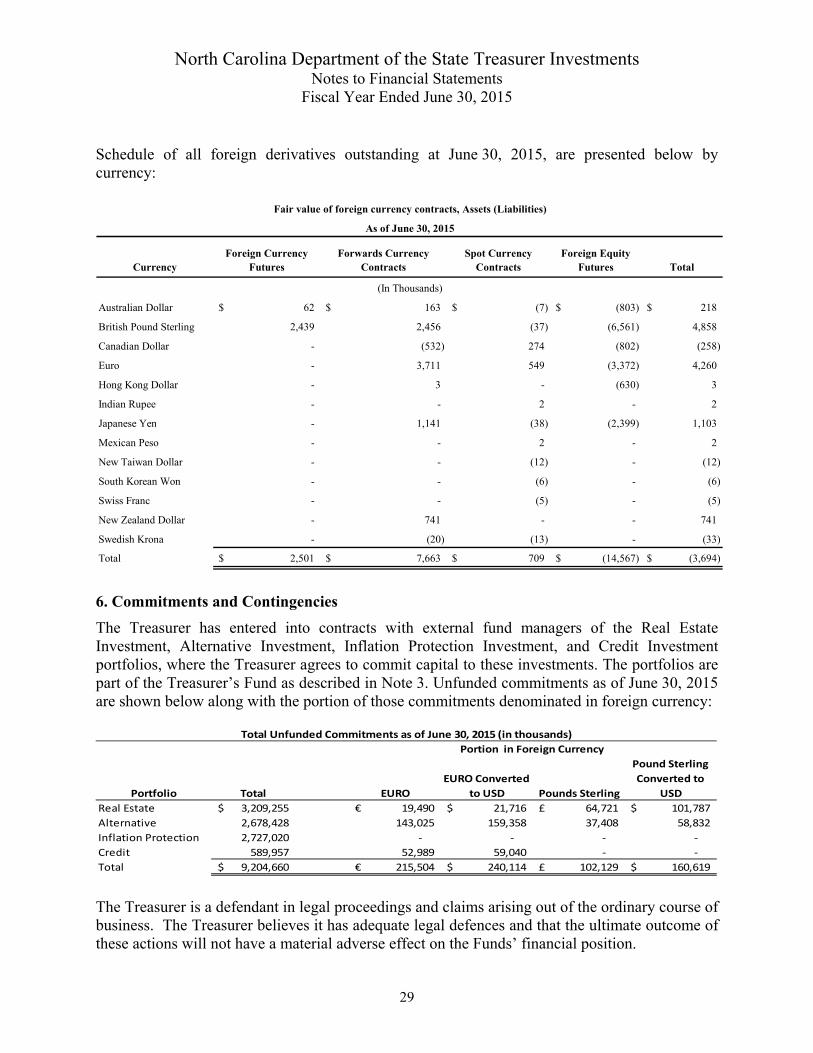
Schedule of all foreign derivatives outstanding at June 30, 2015, are presented below by currency:
CurrencyForeign Currency
FuturesForwards Currency
ContractsSpot Currency
ContractsForeign Equity
Futures Total
Australian Dollar 62$ 163$ (7)$ (803)$ 218$
British Pound Sterling 2,439 2,456 (37) (6,561) 4,858
Canadian Dollar - (532) 274 (802) (258)
Euro - 3,711 549 (3,372) 4,260
Hong Kong Dollar - 3 - (630) 3
Indian Rupee - - 2 - 2
Japanese Yen - 1,141 (38) (2,399) 1,103
Mexican Peso - - 2 - 2
New Taiwan Dollar - - (12) - (12)
South Korean Won - - (6) - (6)
Swiss Franc - - (5) - (5)
New Zealand Dollar - 741 - - 741
Swedish Krona - (20) (13) - (33)
Total 2,501$ 7,663$ 709$ (14,567)$ (3,694)$
As of June 30, 2015
Fair value of foreign currency contracts, Assets (Liabilities)
(In Thousands)
6. Commitments and Contingencies
The Treasurer has entered into contracts with external fund managers of the Real Estate Investment, Alternative Investment, Inflation Protection Investment, and Credit Investment portfolios, where the Treasurer agrees to commit capital to these investments. The portfolios are part of the Treasurer’s Fund as described in Note 3. Unfunded commitments as of June 30, 2015 are shown below along with the portion of those commitments denominated in foreign currency:
Portfolio Total EURO
EURO Converted
to USD Pounds Sterling
Pound Sterling
Converted to
USD
Real Estate 3,209,255$ 19,490€ 21,716$ 64,721£ 101,787$
Alternative 2,678,428 143,025 159,358 37,408 58,832
Inflation Protection 2,727,020 ‐ ‐ ‐ ‐
Credit 589,957 52,989 59,040 ‐ ‐
Total 9,204,660$ 215,504€ 240,114$ 102,129£ 160,619$
Portion in Foreign Currency
Total Unfunded Commitments as of June 30, 2015 (in thousands)
The Treasurer is a defendant in legal proceedings and claims arising out of the ordinary course of business. The Treasurer believes it has adequate legal defences and that the ultimate outcome of these actions will not have a material adverse effect on the Funds’ financial position.

North Carolina Department of the State Treasurer Investments Notes to Financial Statements
Fiscal Year Ended June 30, 2015
30
7. Subsequent Events
The Funds evaluated subsequent events through the date the financial statements were available to be issued. Events or transactions occurring after June 30, 2015, but prior to December 21, 2015 that provided additional evidence about conditions that existed at June 30, 2015, have been recognized in the financial statements for the fiscal year ended June 30, 2015. Events or transactions that provided evidence about conditions that did not exist at June 30, 2015, but arose before the financial statements were available to be issued have not been recognized in the financial statements for the year ended June 30, 2015.
The Treasurer’s settlement with the custodian BNY Mellon became fully executed on July 1, 2015, and on the same day the Treasurer received the settlement payment in that matter, a $30 million wire transfer. In addition to this cash payment, discounts on BNY Mellon’s services will be provided over time under the terms of the settlement agreement.
North Carolina Department of the State Treasurer Investments Supplementary Information
Fiscal Year Ended June 30, 2015
31
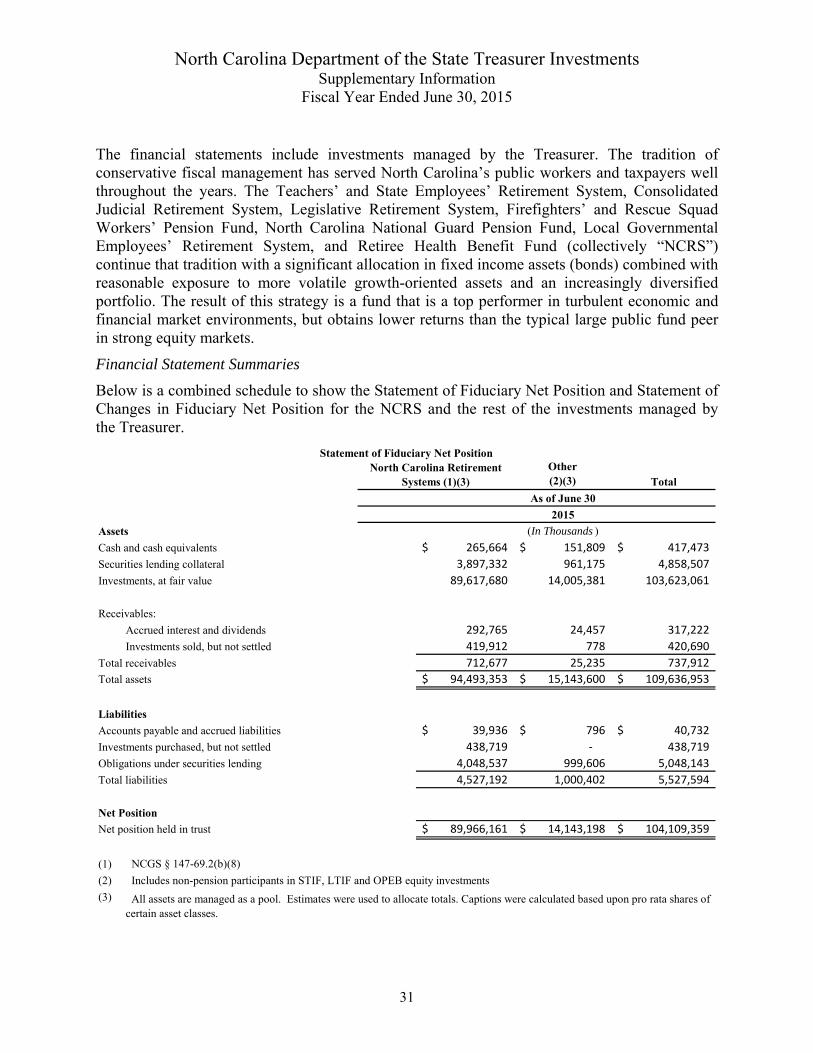
The financial statements include investments managed by the Treasurer. The tradition of conservative fiscal management has served North Carolina’s public workers and taxpayers well throughout the years. The Teachers’ and State Employees’ Retirement System, Consolidated Judicial Retirement System, Legislative Retirement System, Firefighters’ and Rescue Squad Workers’ Pension Fund, North Carolina National Guard Pension Fund, Local Governmental Employees’ Retirement System, and Retiree Health Benefit Fund (collectively “NCRS”) continue that tradition with a significant allocation in fixed income assets (bonds) combined with reasonable exposure to more volatile growth-oriented assets and an increasingly diversified portfolio. The result of this strategy is a fund that is a top performer in turbulent economic and financial market environments, but obtains lower returns than the typical large public fund peer in strong equity markets.
Financial Statement Summaries
Below is a combined schedule to show the Statement of Fiduciary Net Position and Statement of Changes in Fiduciary Net Position for the NCRS and the rest of the investments managed by the Treasurer.
Other (2)(3) Total
As of June 30
2015
Assets (In Thousands )
Cash and cash equivalents 265,664$ 151,809$ 417,473$
Securities lending collateral 3,897,332 961,175 4,858,507
Investments, at fair value 89,617,680 14,005,381 103,623,061
Receivables:
Accrued interest and dividends 292,765 24,457 317,222
Investments sold, but not settled 419,912 778 420,690
Total receivables 712,677 25,235 737,912
Total assets 94,493,353$ 15,143,600$ 109,636,953$
Liabilities
Accounts payable and accrued liabilities 39,936$ 796$ 40,732$
Investments purchased, but not settled 438,719 ‐ 438,719
Obligations under securities lending 4,048,537 999,606 5,048,143
Total liabilities 4,527,192 1,000,402 5,527,594
Net Position
Net position held in trust 89,966,161$ 14,143,198$ 104,109,359$
(1) NCGS § 147-69.2(b)(8)
(2) Includes non-pension participants in STIF, LTIF and OPEB equity investments
(3)
Statement of Fiduciary Net PositionNorth Carolina Retirement
Systems (1)(3)
All assets are managed as a pool. Estimates were used to allocate totals. Captions were calculated based upon pro rata shares of certain asset classes.

North Carolina Department of the State Treasurer Investments Supplementary Information
Fiscal Year Ended June 30, 2015
32
2015
North Carolina
Retirement Systems (1)(3) Other(2)(3) Total
Additions: (In Thousands )
Investment income:
Interest and dividend income 2,039,753$ 139,382$ 2,179,135$
Net appreciation (depreciation) in fair value of investments 394,459 (32,204) 362,255
Other investment income 134,342 100 134,442
Securities lending income 29,643 7,203 36,846
Total investment income 2,598,197 114,481 2,712,678
-
Deductions -
Investment management expenses 489,184 445 489,629
Other and administrative fees and expenses 87,393 4,243 91,636
Securities lending expense 4,424 1,936 6,360
Total deductions 581,001 6,624 587,625
Net increase in net position resulting from operations 2,017,196 107,857 2,125,053
Distributions to participants
Distributions paid and payable (2,017,196) (107,857) (2,125,053)
Share transactions -
Reinvestment of distributions 2,017,578 107,194 2,124,772
Net share redemptions (2,503,001) 723,489 (1,779,512)
Changes in net position (485,423) 830,683 345,260
Net position held in trust:
Beginning of year 90,451,584 13,312,515 103,764,099
End of year 89,966,161$ 14,143,198$ 104,109,359$
(1) NCGS § 147-69.2(b)(8)
(2) Includes non-pension participants in STIF, LTIF and OPEB equity investments
(3)
Statement of Change in Fiduciary Net Position
Fiscal Year Ended June 30
All assets are managed as a pool. Estimates were used to allocate totals. Captions were calculated based upon pro rata shares of certain asset classes.
Investment Policy Statement
In July 2013, the General Assembly passed Senate Bill 558. Under this bill, the Investment Management Division was granted greater authority and flexibility with respect to investments by increasing the percentage limitations on various individual alternative investment asset classes as well as in the aggregate. During the year ended June 30, 2014, the Investment Management Division continued to diversify the NCRS investments and conducted an asset liability study to develop a new investment policy statement (“IPS”) that would utilize some of the additional investment flexibility created by Senate Bill 558. A new investment policy statement was finalized and became effective July 1, 2014. The table below maps the investment policy statement’s classifications to the statutory classifications which are used to prepare the financial statements as of June 30, 2015. The numbers reflect net assets owned only by the NCRS funds in the statutory asset classes excluding securities lending. The Investment Portfolios chart in Note 3 for these portfolios reflects gross investments for all of the State Treasurer Funds.

North Carolina Department of the State Treasurer Investments Supplementary Information
Fiscal Year Ended June 30, 2015
33
Public Equity 1 Long Term 2 Cash 2
External Fixed
Income 2 Alternatives 3 Real Estate 4 Inflation 5 Credit 6 Total
Public Equity 39,792,298,238$ 39,792,298,238$
Private Equity 4,174,259,796$ 4,174,259,796
Non‐Core Real Estate 3,652,612,081$ 3,652,612,081
Opportunistic Fixed Income 5,438,219,654$ 5,438,219,654
IG Fixed Income 22,729,477,671$ 2,683,084,790$ 25,412,562,461
Cash 1,060,870,637$ 1,060,870,637
Inflation Sensitive 4,763,776,475$ 4,763,776,475
Core Real Estate 3,594,338,234$ 3,594,338,234
Multi‐Strategy 1,686,814,658$ 1,686,814,658
Total 39,792,298,238$ 22,729,477,671$ 1,060,870,637$ 2,683,084,790$ 5,861,074,454$ 7,246,950,315$ 4,763,776,475$ 5,438,219,654$ 89,575,752,234$
1. NCGS § 147‐69.2(b)(8)
2. NCGS §§ 147‐69.1(c) and 147‐69.2(b)(1)‐(6b)
3. NCGS § 147‐69.2(b)(9)
4. NCGS § 147‐69.2(b)(7)
5. NCGS § 147‐69.2(b)(9a)
6. NCGS § 147‐69.2(b)(6c)
IPS Classification
Statutory Classification

North Carolina Department of the State Treasurer Investments Supplementary Information
Fiscal Year Ended June 30, 2015
34
Investment Returns
The following supplementary information includes a discussion of the retirement system’s risk and returns compared to benchmarks, total management and incentive fees paid, and comparisons to peer cost benchmarks. As of June 30, 2015 and June 30, 2014, the Retirement System (NCRS) had the following investment returns over applicable 1, 3, 5 and 10 year periods: Investment Returns (net of fees) as of June 30, 2015
Asset Classification 1 YR 3 YR 5YR 10 YR
Growth 2.91% 13.80% 12.79% 6.16%
Benchmark 1.40% 12.03% 11.85% 5.76%
Public Equity 1.14% 14.46% 12.95% 6.26%
Benchmark 0.85% 13.32% 12.22% 5.71%
Private Equity 9.58% 11.08% 10.97% 8.86%
Benchmark 6.27% 11.71% 12.44% 11.33%
Non-Core Real Estate 19.60% 14.98% 14.63% 5.15%
Benchmark 8.80% 11.01% 11.86% 5.06%
Opportunistic Fixed Income -0.52% 9.67% 8.92% -
Benchmark -2.85% 2.77% 3.08% -
Rates & Liquidity 2.07% 2.38% 4.76% 5.62%
Benchmark 2.24% 2.06% 4.60% 5.22%
Investment Grade Fixed Income 2.09% 2.42% 4.79% 5.63%
Benchmark 2.32% 2.15% 4.66% 5.25%
Cash 0.48% - - -
Benchmark 0.03% - - -
Inflation Sensitive & Diversifiers -1.98% 3.43% 2.17% 2.59%
Benchmark -0.72% 4.14% 5.10% 2.15%
Inflation Sensitve -8.01% -1.05% -4.75% 2.01%
Benchmark -9.41% -1.27% -2.00% 4.28%
Core Real Estate 7.00% 10.31% 11.85% 5.55%
Benchmark 10.55% 11.32% 13.34% 6.03%
Multi-Strategy 1.48% 11.84% 10.30% 6.25%
Benchmark 0.30% 11.37% 8.65% 8.48%
Total Plan 2.25% 9.08% 9.46% 6.17%
Implementation Benchmark 1.46% 7.78% 8.83% 5.69%
Long-Term Policy Benchmark 0.32% 7.39% 8.52% 6.02%

North Carolina Department of the State Treasurer Investments Supplementary Information
Fiscal Year Ended June 30, 2015
35
Investment Returns (net of fees) as of June 30, 2014
Asset Classification 1 YR 3 YR 5YR 10 YR
Growth 22.60% 11.28% 14.71% 6.83%
Benchmark 20.87% 10.10% 13.99% 7.82%
Public Equity 24.78% 11.60% 15.75% 7.11%
Benchmark 23.28% 10.33% 14.75% 7.80%
Private Equity 18.27% 10.05% 11.06% 8.37%
Benchmark 18.95% 12.06% 16.02% 12.87%
Non-Core Real Estate 15.30% 12.00% 4.65% 4.64%
Benchmark 13.83% 10.79% 5.08% 6.74%
Opportunistic Fixed Income 12.90% 10.00% 15.71% -
Benchmark 8.11% 3.00% 6.15% -
Rates & Liquidity 5.94% 5.49% 7.02% 6.43%
Benchmark 6.01% 5.47% 6.68% 6.05%
Investment Grade Fixed Income 6.04% 5.53% 7.04% 6.44%
Benchmark 6.23% 5.54% 6.72% 6.07%
Cash 0.46% - - -
Benchmark 0.02% - - -
Inflation Sensitive & Diversifiers 8.00% 2.92% 2.01% 3.91%
Benchmark 10.11% 4.31% 2.89% 3.60%
Inflation Sensitve 6.34% -1.35% -3.60% 3.40%
Benchmark 8.19% -0.80% -0.56% 6.41%
Core Real Estate 10.41% 10.26% 9.61% 5.99%
Benchmark 12.78% 11.64% 8.51% 6.40%
Multi-Strategy 18.83% 14.62% 12.14% 6.39%
Benchmark 18.49% 12.40% 10.33% 9.18%
Total Plan 15.88% 9.06% 11.47% 6.94%
Implementation Benchmark 14.62% 8.24% 10.91% 7.31%
Long-Term Policy Benchmark 14.96% 7.75% 10.88% 7.19%
The Public Equity benchmark is a dynamically weighted combination of the MSCI ACWI IMI Net (Long-Only) and a beta adjusted MSCI ACWI IMI Net (Hedged Equity). Private Equity’s benchmark is comprised of the following Burgiss Group Private iQ indices: 50% buyout, 20% venture capital, and 30% special situations and distressed securities. The Non-Core Real Estate benchmark is comprised of the following Burgiss Group Private iQ indices: 80% US Non-Core Real Estate (Opportunistic and Value-Added) and 20% Non-US Non-Core Real Estate (Opportunistic and Value-Added). Opportunistic Fixed Income’s benchmark is comprised of 50% HFRX Distressed Securities Index, 20% HFRX Relative Value Index, and 15% Credit Suisse Leveraged Loan Index, and 15% BOAML High Yield Index. The Growth benchmark used is a blend of the Public Equity, Private Equity, Non-Core Real Estate and Opportunistic Fixed Income benchmarks policy weights.

North Carolina Department of the State Treasurer Investments Supplementary Information
Fiscal Year Ended June 30, 2015
36
The benchmark used for IG Fixed Income is comprised of 10% iMoneyNet First Tier Institutional Money Market Funds Net Index and 90% custom BOAML Core Investment Grade Index. The Custom BOAML index is comprised of the following weightings: 30% BOAML 5+ Years Governments, 35% BOAML 5+ Years Investment Grade Corporates, and 35% BOAML Mortgage Master. The Cash benchmark used is the iMoneyNet First Tier Institutional Money Market Net Index. The overall Rates & Liquidity benchmark is a blend of the IG Fixed Income and Cash benchmarks at policy weights.
The Inflation Sensitive benchmark is a dynamically weighted combination of the Bank of America Merrill Lynch 1-3 Years US Inflation -Linked Treasury Index (TIPS), the Bloomberg Commodities Index Commodities, and a combination of benchmarks of investments classified within the Private Natural Resources or Other Real Assets and Diversifiers. The Core Real Estate Benchmark is comprised of 80% NCREIF ODCE Net and 20% FTSEEPRA NAREiT Global Index. The Inflation Sensitive & Diversifiers benchmark used is a blend of the Inflation Sensitive and Core Real Estate benchmarks at policy weights.
The Multi-Strategy benchmark is comprised of a dynamically weighted combination of the HFRX Multi-Strategy Hedge Fund Index, net of fees, and the market value weighted benchmarks for any other total fund strategies within the portfolio.
The Benchmarks used for the total plan are the Implementation, and Long-Term Policy Benchmarks. The Implementation Benchmark is a blend of the asset class benchmarks at policy weights. It is currently as follows: 58% growth, 29% Rates and Liquidity, 11% Inflation Sensitive & Diversifiers, and 2% Multi-Strategy. Lastly, the Long-Term Policy Benchmark is comprised of 57% MSCI ACWI IMI Net, 33% BOAML 5+ Years US Treasury Index, 6% Bloomberg Commodity Index, and 4% BOAML 1-3 Years US Inflation Linked Treasury Index.
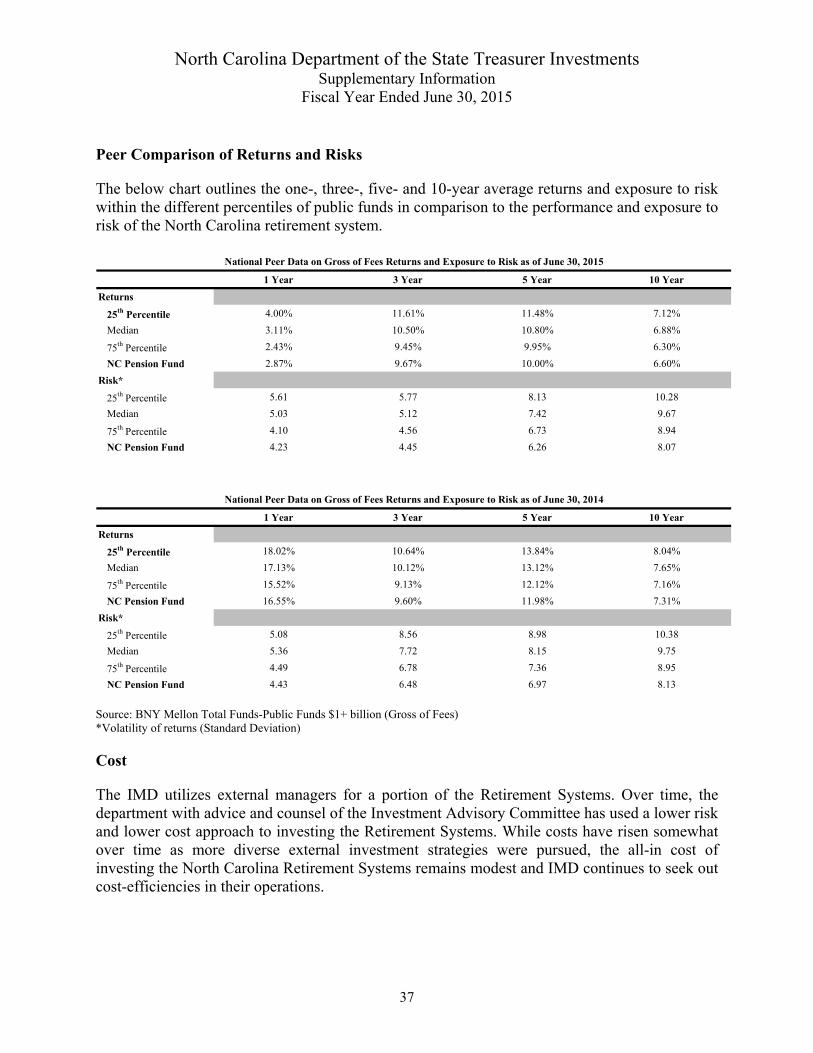
North Carolina Department of the State Treasurer Investments Supplementary Information
Fiscal Year Ended June 30, 2015
37
Peer Comparison of Returns and Risks
The below chart outlines the one-, three-, five- and 10-year average returns and exposure to risk within the different percentiles of public funds in comparison to the performance and exposure to risk of the North Carolina retirement system.
1 Year 3 Year 5 Year 10 Year
Returns
25th Percentile 4.00% 11.61% 11.48% 7.12%
Median 3.11% 10.50% 10.80% 6.88%
75th Percentile 2.43% 9.45% 9.95% 6.30%
NC Pension Fund 2.87% 9.67% 10.00% 6.60%
Risk*
25th Percentile 5.61 5.77 8.13 10.28
Median 5.03 5.12 7.42 9.67
75th Percentile 4.10 4.56 6.73 8.94
NC Pension Fund 4.23 4.45 6.26 8.07
National Peer Data on Gross of Fees Returns and Exposure to Risk as of June 30, 2015
1 Year 3 Year 5 Year 10 Year
Returns
25th Percentile 18.02% 10.64% 13.84% 8.04%
Median 17.13% 10.12% 13.12% 7.65%
75th Percentile 15.52% 9.13% 12.12% 7.16%
NC Pension Fund 16.55% 9.60% 11.98% 7.31%
Risk*
25th Percentile 5.08 8.56 8.98 10.38
Median 5.36 7.72 8.15 9.75
75th Percentile 4.49 6.78 7.36 8.95
NC Pension Fund 4.43 6.48 6.97 8.13
National Peer Data on Gross of Fees Returns and Exposure to Risk as of June 30, 2014
Source: BNY Mellon Total Funds-Public Funds $1+ billion (Gross of Fees) *Volatility of returns (Standard Deviation)
Cost
The IMD utilizes external managers for a portion of the Retirement Systems. Over time, the department with advice and counsel of the Investment Advisory Committee has used a lower risk and lower cost approach to investing the Retirement Systems. While costs have risen somewhat over time as more diverse external investment strategies were pursued, the all-in cost of investing the North Carolina Retirement Systems remains modest and IMD continues to seek out cost-efficiencies in their operations.

North Carolina Department of the State Treasurer Investments Supplementary Information
Fiscal Year Ended June 30, 2015
38
Management and Incentive Fees
The management and incentive fees incurred to external investment managers, by asset class, were as follows for the year ended June 30, 2015.
Total Investment Management Fees Incurred as of June 30, 2015
Asset Classification Management Fees Incentive Fees Total Fees Portfolio Market Value (1)Ratio of Fees to Market Value
Global Equity 101,792,326$ -$ 101,792,326$ 39,792,298,238$ 0.26%
Private Equity 60,881,798 35,956,836 96,838,634 4,174,259,796 2.32%
Real Estate 77,683,204 58,777,308 136,460,512 7,246,950,315 1.88%
Hedged Strategies 3,051,580 - 3,051,580 1,686,814,658 0.18%
External Fixed Income 3,836,473 - 3,836,473 2,683,084,790 0.14%
Credit 59,103,606 42,076,138 101,179,744 5,438,219,654 1.86%
Inflation 42,190,448 3,834,342 46,024,790 4,763,776,475 0.97%
Internally Managed - - - 23,790,348,308 0.00%
Total 348,539,435$ 140,644,624$ 489,184,059$ 89,575,752,234$ 0.55%
(1) NCRS assets only
In addition to the fees shown in this table, internal administrative expenses of the Funds and (for the internally managed fixed income portfolio) trade transaction costs are paid by the Treasurer. These charges are reported on the Statement of Changes in Fiduciary Net Position.
Peer Cost Comparison
For the years ended December 31, 2014 and 2013, the Treasurer’s cost of investment can be compared to the median peer amount utilizing the following table.
2014 2013
Median Peer 63.4 58.8
North Carolina Retirement Systems 49.9 45.9
Percentile 36% 33%
Cost of Investment Compared to Peers as of December 31Total (bps)
Source: CEM [Cost Effectiveness Measurement]
For the calendar year ended 2014 and 2013, the peer group consisted of 15 U.S. public pension funds managing $42 billion to $158 billion and 16 U.S. public pension funds managing $41 billion to $150 billion, respectively. The median peer managed $74 billion versus North Carolina’s $89 billion and $68 billion versus North Carolina’s $82 billion for the years ended December 31, 2014 and 2013, respectively. The CEM benchmarking methodology excludes carry/performance fees for private investments because most peers do not provide such data. All such fees and expenses have been deducted from all reported investment returns. The CEM methodology differs from that used by the Department in preparing the data in the section titled “Management and Incentive Fees.”