financial statement analysis of cvp contractors -...
TRANSCRIPT
ENTRIX, Inc. 1
Financial Statement Analysis of CVP Contractors
DRAFT
Prepared for:
John Kirlin Delta Vision
Resources Building 1416 Ninth Street, Suite 1311/
Sacramento CA 95814
By ENTRIX, Inc.
701 University Avenue, Suite 200 Sacramento CA 95825
July 20, 2008

ENTRIX, Inc. i
Table of Contents
Financial Statement Analysis of CVP Contractors 1
Background ............................................................................................................................................ 1 Financial Statement Background ..................................................................................................... 2
The Ten Largest CVP Irrigation Contractors in the San Joaquin Valley ............................................... 2 Westlands Water District ................................................................................................................. 3 Madera Irrigation District ................................................................................................................ 6 Lower Tule River Irrigation District................................................................................................ 8 Arvin-Edison Water Storage District............................................................................................. 10 Delano Earlimart Irrigation District ............................................................................................... 12 Chowchilla Water District ............................................................................................................. 14 Southern San Joaquin Municipal Utility District........................................................................... 16 Tulare Irrigation District ................................................................................................................ 18 Del Puerto Water District............................................................................................................... 20 San Luis Water District.................................................................................................................. 22
Comparison of the Ten Contractors ..................................................................................................... 24 Appendix A .......................................................................................................................................... 26

ENTRIX, Inc. 1
Financial Statement Analysis of CVP Contractors
This report provides an analysis of the condensed financial statements of the 10 largest Central Valley Project (CVP) irrigation contractors in the San Joaquin Valley (Valley). The 10 were selected because of their size measured by CVP water deliveries, relative to both aggregate CVP deliveries in the Valley and for all of California. The report includes, for those contractors, a summary of those financial statements for eight years,1 respective net capital repayment obligations, and acre-feet (AF) of water delivered.2 This is the third of several written reports which ENTRIX will complete relative to CVP Financing and Repayment Issues. Subsequent reports will include an analysis and discussion of the generation and distribution of hydroelectric power from CVP facilities and a comprehensive document summarizing revised forms of all reports submitted.
Background
The CVP is the largest surface water storage and delivery system in California and is also the largest irrigation water supply project constructed and operated by U.S. Bureau of Reclamation (Reclamation). It includes 20 reservoirs, with a combined storage capacity of approximately 11 million AF; eight power plants and two pumping-generating plants with a combined capacity of approximately two million kilowatts; two pumping plants; and approximately 500 miles of major canals and aqueducts. The CVP supplies water to more
1 From the Special Districts Annual Report, published by the California State Controller’s office. A complete set of the audited financial statements for the individual districts was not available.
2 Projected deliveries for 2007, taken from United States Department of the Interior, Bureau of Reclamation, Mid-Pacific Regional Office, “Schedule of Historical (1981-2006) & Projected (2007-2030) Irrigation Water Deliveries For Calculation of Individual Contractor Prorated Capital Costs,” Irrigation, 2008 Schedule A-14 (accessed July 15, 2008).
ENTRIX, Inc. 2
than 250 long term water contractors in the Central Valley, San Francisco Bay Area, and the Santa Clara Valley.3
Financial Statement Background
The financial statements of California’s public water agencies are generally developed using fund concepts following the Governmental Accounting Standards Board (GASB). Condensed financial statements are published by the California State Controller in the “Special Districts Annual Report.” Reports are compiled from standardized documents utilizing accounting and reporting procedures in accordance with the Uniform Accounting Systems of Special Districts, prescribed in Section 1113.1 of the California Code of Regulations. The financial statements are based on a fiscal year beginning July 1st and ending June 30th. The most recent report was published in March 2008 and contains data for FY 2005-06.4 The earliest available report including detailed financial information for special districts is for FY 1999-98.
The Ten Largest CVP Irrigation Contractors in the San Joaquin Valley
This section includes a review of the condensed financial information for the largest ten CVP irrigation contractors in the Valley. The contractors and information on their respective 2007 CVP deliveries are shown in Table 1. In the financial review for the period from 1998-1999 through 2005-2006, the focus was on the largest sources of revenue and expenses, as well as on operating and non-operating net incomes. The analysis also includes an examination of trends for the contractors.
Collectively, the 10 irrigation contractors shown in Table 1 received over 1.8 million AF of CVP water in 2007, representing 77.5 percent of CVP water for the Valley. The 1.8 million AF also accounted for 51.5 percent of all 2007 CVP water deliveries5.
3 United States Department of the Interior, Bureau of Reclamation, Mid-Pacific Regional Office, May 2001, “CVP Cost Allocation Study,” Final Report, Sacramento.
4 In some cases the actual reports of water agencies are on a calendar year basis and the Special District reports data in the fiscal year.
5 Excluding water deliveries for the Delta-Mendota Exchange Contractors.

ENTRIX, Inc. 3
Table 1 Largest San Joaquin Valley CVP Contractors Based Upon 2007 Projected
Water Deliveries
Contractor Projected Acre-Feet
Delivered Percentage of San
Joaquin CVP Water
Westlands Water District 701,134 30.0%
Madera Irrigation District 176,103 7.5%
Lower Tule River Irrigation District 160,450 6.9%
Arvin-Edison Water Storage District 159,271 6.8%
Delano-Earlimart Irrigation District 131,953 5.6%
Chowchilla Water District 131,175 5.6%
Southern San Joaquin Municipal Utility District 111,315 4.8%
Tulare Irrigation District 83,763 3.6%
Del Puerto Water District 82,712 3.5%
San Luis Water District 73,325 3.1%
Top Ten Total 1,811,201 77.5%
Source: United States Department of the Interior, Bureau of Reclamation, Mid-Pacific Regional Office, “Schedule of Historical (1981-2006) & Projected (2007-2030) Irrigation Water Deliveries For Calculation of Individual Contractor Prorated Capital Costs,” Irrigation, 2008 Schedule A-14 (accessed July 15, 2008).
Westlands Water District
Westlands Water District (Westlands) is the largest CVP water user in the Valley and receives water by the San Luis Canal. In 2007, its projected water delivery was 701,134 AF; accounting for 30.0 percent of total water for the Valley. Among the 10 districts, Westlands carries the greatest amount of long-term debt. Total outstanding long-term debt in at the end of FY 2005-2006 was nearly $190 million; representing 75 percent of the total long-term debt among the ten contractors.6 Westlands also owed $54.3 million in construction costs financed by the Federal and State government in FY 2005-2006, accounting for 83.4 percent of the total for the agencies. The net capital cost allocated to Westland irrigation contractors for CVP repayment was $373.7 million in 2008.7
6 See Appendix A, Table A.1
7 See Appendix A, Table A.2

ENTRIX, Inc. 4
Table 2 shows operating and non-operating income for Westlands from FY 1998-1999 to 2005-2006. The largest source of operating revenue has consistently been irrigation water sales, averaging 94.3 percent of the total. Other revenue sources are water services8 averaging 3.2 percent and others/miscellaneous, averaging 2.5 percent. The largest operating expense is source of supply, averaging 72.3 percent. Transmission and distribution averaged 9.6 percent; all other averaged 9.4 percent; and administration and general averaged 8.7 percent.
Between FY 1998-1999 and FY 2005-2006, operating revenue from irrigation water sales increased 65.2 percent, while that from Water Services declined 7.7 percent and other operating revenue increased 63.2 percent. Total operating revenue increased 63.1 percent. Among operating expenses, administrative and general and source of supply increased 68.1 and 65.2 percent, respectively. Operating expenses for Transmission and Distribution decreased 5.2 percent, and all other expenses increased 91.1 percent. Total operating expenses increased 62.2 percent.
8 Water services may include services such as ground water recharge, water for fire services, and others.

ENTRIX, Inc. 5
Table 2 Westlands Water District Financial Statement Review,
FY 1998-99 to FY 2005-06
Average Annual
Composition Percent Change FY 98-99 -
FY 2005-06
Operating Revenues
Water Sales
Irrigation 94.3% 65.2%
Water Services 3.2% -7.7%
All Other 2.5% 63.2%
Total Operating Revenues 100.0% 63.1%
Operating Expenses
Source of Supply 72.3% 65.2%
Administration and General 8.7% 68.1%
Transmission and Distribution 9.6% -5.2%
All Other 9.4% 91.1%
Total Operating Expenses 100.0% 62.2%
Non-Operating Revenues Interest Income 17.5% 198.2%
Property Assessments 58.5% 351.1%
All Other 24.0% -81.6%
Total Non-Operating Revenues 100.0% -81.6%
Non-Operating Expenses
Interest Expenses 98.1% 3,270.7% All Other 1.9% -100.0% Total Non-Operating Expenses 100.0% 2,109.7%
Over the eight years, the largest sources of non-operating revenue for Westlands were property assessments, averaging 58.5 percent, followed by interest income averaging 17.5 percent, and others averaging 24.0 percent. The largest non-operating expense over the same period was for interest, averaging 98.1 percent.

ENTRIX, Inc. 6
Interest income increased 198.2 percent, property assessments increased 351.1 percent, and other non-operating revenues decreased 81.6 percent. Total non-operating revenues decreased 81.6 percent. Total interest expense increased 3,270.7 percent9 and all other non-operating expenses decreased 100.0 percent. Total non-operating expenses decreased 2,109.7 percent.
Madera Irrigation District
Madera Irrigation District (Madera) is the second largest recipient of CVP water in the Valley and receives water by the Madera Canal. In 2007, its projected water delivery was 176,103 AF, accounting for 7.5 percent of total water for the Valley. Madera also carried the second largest amount of long-term debt. Total outstanding long-term debt at the end of FY 2005-2006 was $47.9 million, 18.9 percent of the 10 Valley contractors.10 Madera also owed $1.9 million in construction costs financed by the Federal and State government in FY 2005-2006, accounting for 3.0 percent of the total for the 10 contractors. The net capital cost allocated to Madera irrigation contractors for CVP repayment was $33.8 million in 2008.11
As shown in Table 3, Madera’s largest sources of operating revenue for the eight years were irrigation water sales, averaging 58.9 percent; water services, averaging 37.9 percent; and others, averaging 3.2 percent. Madera’s largest operating expenses over the same period were source of supply, averaging 51.3 percent; transmission and distribution, averaging 20.9 percent; administration and general, averaging 17.1 percent; and others, averaging 10.7 percent.
9 Interest expense increased because Westlands issued long-term debt of more than $222 million between 1999 and 2005. See California State Controller, 2008, Special Districts Annual Report, Sacramento, Table 14.
10 See Appendix A, Table A.1
11 See Appendix A, Table A.2

ENTRIX, Inc. 7
Table 3 Madera Irrigation District Financial Statement Review, FY 1998-1999 to FY
2005-2006
Average Annual
Composition Percent Change FY 98-99 - FY
2005-06
Operating Revenues
Irrigation 58.9% 115.3%
Water Services 37.9% 118.8
All Other 3.2% -57.7%
Total Operating Revenues 100.0% 107.7
Operating Expenses
Source of Supply 51.3% 43.3%
Administration and General 17.1% 62.5%
Transmission and Distribution 20.9% 2.7%
All Other 10.7% 71.2%
Total Operating Expenses 100.0% 39.7%
Non-Operating Revenues
Interest Income 10.9% -4.2%
Property Assessments 55.8% -100%
Other Non-Operating Revenues 33.3% -12.6
Total Non-Operating Revenues 100.0% -69.1%
Non-Operating Expenses
Interest Expenses 66.6% 2,509.2%
Other Non-Operating Expenses 33.4% 51.0%
Total Non-Operating Expenses 100.0% 3,256.9%
From FY 1998-1999 to FY 2005-2006 operating revenue increased 118.8 percent from water services, while irrigation water sales increased 115.3 percent and other decreased 57.7 percent. Overall, total operating revenue increased 107.7 percent. Among operating expenses, other/miscellaneous increased 71.2 percent, administration and general increased 62.5 percent, and transmission and distribution increased 2.7 percent. Total operating expenses increased 39.7 percent.

ENTRIX, Inc. 8
The largest sources of non-operating revenue for Madera were property assessments, averaging 55.8 percent; other, averaging 33.3 percent; and interest income, averaging 10.9 percent. Madera’s largest sources of non-operating expenses over the same period were interest expense, averaging 66.6 percent; and other, averaging 33.4 percent.
Over the eight years, non-operating revenue from property assessments decreased 100.0 percent, others decreased 12.6 percent and interest decreased 4.2 percent. Total non-operating revenues decreased 69.1 percent. Non-operating expenses increased 3,256.9 percent. Interest expense rose 2,509.2 percent12 and other expense increased 51.0 percent..
Lower Tule River Irrigation District
Lower Tule River Irrigation District (Lower Tule) is the third largest recipient of CVP water in the Valley and receives water from the Friant-Kern and Cross Valley Canals. In 2007, its projected water delivery was 160,450 AF, accounting for 6.9 percent of total water for the Valley. Among the 10 contractors, Lower Tule carries the least long-term debt. Total outstanding long-term debt at the end of FY 2005-2006 was $305,000. Moreover, in contrast to other contractors, Lower Tule does not owe the United States or California for construction costs.13 The net capital cost allocated to Lower Tule irrigation contractors for CVP repayment was $27.5 million in 2008.14
As shown in Table 4, the largest sources of operating revenue over the eight years were irrigation water sales, averaging 86.1 percent; water services, averaging 11.3 percent; and others, averaging 2.6 percent. The largest sources of operating expenses were source of supply, averaging 69.1 percent; administration and general, averaging 17.6 percent; transmission and distribution, averaging 11.5 percent; and others, averaging 2.6 percent.
Between FY 1998-1999 and FY 2005-2006, operating revenue from irrigation water sales increased 209.6 percent and water services decreased 17.4 percent; other water revenues fell 100 percent. Overall, total operating revenue increased 181.2 percent. Among operating expenses, source of supply increased 149.9 percent, administration and general increased 55.3 percent, other increased 51.2 percent, and transmission and distribution increased 2.2 percent. Overall, total operating expenses increased 101.6 percent.
12 Interest expense increased because Madera issued more than $47 million of long-term debt in 2005. See California State Controller, 2008, Special Districts Annual Report, Sacramento, Table 14.
13 See Appendix A, Table A.1
14 See Appendix A, Table A.2

ENTRIX, Inc. 9
Table 4 Lower Tule River Irrigation District Financial Statement Review, FY 1998-1999
to FY 2005-2006
Average Annual Composition Percent Change FY 98-99 - FY
2005-06
Operating Revenues
Irrigation 86.1% 209.6%
Water Services 11.3% -17.4%
All Other 2.6% -100%
Total Operating Revenues 100.0% 181.2%
Operating Expenses
Source of Supply 69.1% 149.9%
Administration and General 17.6% 55.3%
Transmission and Distribution 11.5% 2.2%
All Other 1.8% 51.2%
Total Operating Expenses 100.0% 101.6%
Non-Operating Revenues
Interest Income 6.7% -69.1%
Property Assessments 86.2% -0.2%
All Other 7.1% 27.1%
Total Non-Operating Revenues 100.0% -7.5%
Non-Operating Expenses
Interest Expenses 13.6% 64.4%
All Other 86.4% -100%
Total Non-Operating Expenses 100.0% -96.8%
As shown in Table 4, the largest sources of non-operating income were property assessments, averaging 86.2 percent; other, averaging 7.1 percent; and interest, averaging 6.7 percent. Among non-operating expenses, the largest sources were other, averaging 86.4 percent, and interest, averaging 13.6 percent.
Between FY 1998-1999 and FY 2005-2006, non-operating revenue from interest decreased 69.1 percent, others decreased 27.1 percent, and property assessments decreased 0.2 percent.

ENTRIX, Inc. 10
Overall, total non-operating revenues decreased 7.5 percent. Among non-operating expenses, interest increased 64.4 percent and other decreased 100.0 percent. Overall, total non-operating expenses decreased 96.8 percent.
Arvin-Edison Water Storage District
Arvin-Edison Water Storage District (Arvin-Edison) is the fourth largest recipient of CVP water in the Valley and receives water from the Friant-Kern Canal. In 2007, its projected water delivery was 159,271 AF, accounting for 6.8 percent of total water for the Valley. Total outstanding long-term debt at the end of FY 2005-2006 was $10.2 million, representing 4.0 percent of the total long-term debt among 10 contractors.15 Arvin-Edison also owed $4.1 million in construction costs financed by the United States and California. The net capital cost allocated to Arvin-Edison for CVP repayment was $24.6 million in 2008.16
As shown in Table 5, the largest source of operating revenue for the eight years was irrigation water sales, averaging 55.0 percent. Water services averaged 42.3 percent, and others averaged 2.7 percent. The largest operating expenses over the same period were source of supply, averaging 46.4 percent; transmission and distribution, averaging 25.5 percent; others, averaging 14.8 percent; and administration and general expenses, averaging 13.3 percent.
15 See Appendix A, Table A.1
16 See Appendix A, Table A.2

ENTRIX, Inc. 11
Table 5 Arvin-Edison Water Storage District Financial Statement Review, FY 1998-1999
to FY 2005-2006
Average Annual Composition
Percent Change FY 98-99 - FY 2005-06
Operating Revenues
Water Sales
Irrigation 55.0% 39.7%
Water Services 42.3% -77.5%
All Other 2.7% -81.1%
Total Operating Revenues 100.0% -20.2%
Operating Expenses
Source of Supply 46.4% 115.3%
Administration and General 13.3% 86.7%
Transmission and Distribution 25.5% 214.6%
All Other 14.8% 104.9%
Total Operating Expenses 100.0% 135.6%
Non-Operating Revenues
Interest Income 23.3% -68.1%
Property Assessments 44.0% 2.3%
All Other 32.7% 189.1%
Total Non-Operating Revenues 100.0% -8.5%
Non-Operating Expenses
Interest Expenses 30.4% 2,939.0%
All Other 69.6% -100.0%
Total Non-Operating Expenses 100.0% -2,752.4%
Over the eight years, operating revenue from irrigation water sales increased 39.7 percent. Operating revenue from water services declined 77.5 percent, and other operating revenue decreased 81.1 percent. Overall, total operating revenue decreased 20.2 percent. Among operating expenses, transmission and distribution increased 214.6 percent, source of supply increased 115.3 percent, others increased 104.9 percent, and administrative and general increased 86.7 percent. Total operating expenses increased 135.6 percent.

ENTRIX, Inc. 12
The largest sources of non-operating revenue over the eight years were property assessments, averaging 44.0 percent; other, averaging 32.7 percent; and interest income, averaging 23.3 percent. The principal non-operating expenses over the eight years were other, averaging 69.9 percent; and interest expense, averaging 30.4 percent.
Non-operating revenue from other increased 189.1 percent, interest income decreased 68.1 percent, and property assessments increased 2.3 percent. Total non-operating revenues decreased 8.5 percent. Non-operating expenses rose 2,752.4 percent. Interest expense increased 2,939 percent17 and other decreased 100.0 percent.
Delano Earlimart Irrigation District
Delano-Earlimart Irrigation District (Delano-Earlimart) is the fifth largest recipient of CVP water in the Valley and receives water from the Friant-Kern Canal. In 2007, its projected water delivery was 131,953 AF, accounting for 5.6 percent of total water for the Valley. Among the ten contractors, Delano-Earlimart carried the second lowest amount of long-term debt. Total outstanding long-term debt at the end of FY 2005-2006 was $1,871,392. Delano-Earlimart does not owe the United States or California government for construction costs.18 The net capital cost allocated to Delano-Earlimart irrigation contractors for CVP repayment was $29.2 million in 2008.19
As shown in Table 6, Delano-Earlimart’s largest sources of operating revenue for the eight years were irrigation water sales, averaging 58.9 percent; water services, averaging 33.2 percent; and others, averaging 7.9 percent. The largest sources of operating expenses were source of supply, averaging 76.5 percent; administration and general, averaging 12.2 percent; transmission and distribution, averaging 6.2 percent; and others, averaging 5.1 percent.
Between FY 1998-1999 and FY 2005-2006, operating revenue from water service increased 454.3 percent, irrigation water sales increased 117.0 percent, and other decreased 69.4 percent. Total operating revenue increased 199.0 percent. Among operating expenses, source of supply increased 165.4 percent, administration and general increased 61.8 percent, other decreased 47.5 percent, and transmission and distribution decreased 30.0 percent. Total operating expenses increased 69.8 percent.
17 Interest expense increased because Arvin-Edison issued more than $10 million of long-term debt in 2005-2006. See California State Controller, 2008, Special Districts Annual Report, Sacramento, Table 14.
18 See Appendix A, Table A.1
19 See Appendix A, Table A.2

ENTRIX, Inc. 13
Table 6 Delano-Earlimart Irrigation District Financial Statement Review, FY 1998-1999
to FY 2005-2006
Average Annual Composition Percent Change FY 98-99 - FY
2005-06
Operating Revenues
Irrigation 58.9% 117.0%
Water Services 33.2% 454.3%
All Other 7.9% -69.4%
Total Operating Revenues 100.0% 199.0%
Operating Expenses
Source of Supply 76.5% 165.4%
Administration and General 12.2% 61.8%
Transmission and Distribution 6.2% -30.0%
All Other 5.1% -47.5%
Total Operating Expenses 100.0% 69.8%
Non-Operating Revenues
Interest Income 29.2% -29.6%
Property Assessments 49.5% -100.0%
All Other 21.3% 423.6%
Total Non-Operating Revenues 100.0% -82.3%
Non-Operating Expenses
Interest Expenses 90.7% 721.1%
All Other 9.3% -100.0%
Total Non-Operating Expenses 100.0% 284.2%
Over the eight years, the largest sources of non-operating revenue were property assessments, averaging 49.5 percent; interest, averaging 29.2 percent, and other, averaging 21.3 percent. The largest sources of non-operating expenses were interest, averaging 90.7 percent and other, averaging 9.3 percent.
Over the eight years, non-operating revenues from other increased 423.6 percent, property assessments decreased 100.0 percent, and interest decreased 29.6 percent. Total non-

ENTRIX, Inc. 14
operating revenues decreased 82.3 percent. Among non-operating expenses, interest increased 721.1 percent20 and other decreased 100.0 percent. Overall, total non-operating expenses increased 284.2 percent.
Chowchilla Water District
Chowchilla Water District (Chowchilla) is the sixth largest recipient of CVP water in the Valley and receives water from the Madera Canal. In 2007, its projected water delivery was 131,175 AF, accounting for 5.6 percent of total water for the Valley. Chowchilla did not carry any long-term debt nor does it owe the United States or California government for construction costs.21 The net capital cost allocated to Chowchilla irrigation contractors for CVP repayment was $23.7 million in 2008.22
As shown in Table 7, the largest sources of operating revenue for the eight years were irrigation water sales, averaging 98.4 percent; and others averaging 1.6 percent. The largest sources of operating expenses were source of supply, averaging 64.6 percent; transmission and distribution, averaging 13.1 percent; administration and general, averaging 12.7 percent; and others, averaging 9.6 percent.
Between FY 1998-1999 and FY 2005-2006, irrigation water sales increased 57.4 percent and total operating revenue increased 58.5 percent. Operating expenses increased 121 percent, with source of supply increasing 196.4 percent, transmission and distribution increasing 76.5 percent, administration and general rising 43.6 percent, and other rising 18.6 percent.
20 Interest expense increased because Delano-Earlimart issued more than $3.0 million of long-term debt in 2005-2006. See California State Controller, 2008, Special Districts Annual Report, Sacramento, Table 14.
21 See Appendix A, Table A.1
22 See Appendix A, Table A.2

ENTRIX, Inc. 15
Table 7 Chowchilla Water District Financial Statement Review, FY 1998-1999 to FY
2005-2006
Average Annual Composition Percent Change FY 98-99 - FY
2005-06
Operating Revenues
Irrigation 98.4% 57.4%
All Other 1.6% 0.0%
Total Operating Revenues 100.0% 58.5%
Operating Expenses
Source of Supply 64.6% 196.4%
Administration and General 12.7% 43.6%
Transmission and Distribution 13.1% 76.5%
All Other 9.6% 18.6%
Total Operating Expenses 100.0% 121.0%
Non-Operating Revenues
Interest Income 8.7% -57.5%
Property Assessments 79.8% 65.6%
All Other 11.5% 204.1%
Total Non-Operating Revenues 100.0% 67.3%
Non-Operating Expenses
Interest Expenses 0.3% 0.0%
All Other 99.7% -100.0%
Total Non-Operating Expenses 100.0% -100.0%
Over the eight years, the largest sources of non-operating revenue were property assessments, averaging 65.6 percent; other, averaging 11.5 percent; and interest, averaging 8.7 percent. The largest sources of non-operating expenses were other, averaging 99.7 percent and interest, averaging 0.3 percent.
Non-operating revenue from other increased 204.1 percent, property assessments increased 65.6 percent, and interest income decreased 57.5 percent. Total non-operating revenues

ENTRIX, Inc. 16
increased 67.3 percent. Non-operating expenses from other decreased 100.0 percent. Total non-operating expenses decreased 100.0 percent.
Southern San Joaquin Municipal Utility District
Southern San Joaquin Municipal Utility District (S. San Joaquin) is the seventh largest recipient of CVP water in the Valley and receives water from the Friant-Kern Canal. In 2007, its projected water delivery was 111,315 AF, accounting for 4.8 percent of the total water for the Valley. S. San Joaquin carries no long-term debt, nor does it owe the United States or California government for construction costs.23 The net capital costs allocated to the district for CVP repayment was $26.8 million in 2008.24
As shown in Table 8, the largest average sources of operating revenue for the eight years were irrigation water sales, averaging 68.0 percent; and water services, averaging 32.0 percent. The largest sources of operating expenses were source of supply, averaging 63.8 percent; others, averaging 12.9 percent; pumping, averaging 12.7 percent; and administration and general, averaging 10.6 percent.
Over the eight years, operating revenue from irrigation water sales increased 47.7 percent and water services increased 37.1 percent. Total operating revenue increased 44.1 percent. Operating expenses for pumping increased 141.1 percent, source of supply increased 96.9 percent, administration and general increased 75.3 percent, and other increased 40.4 percent. Total operating expenses increased 80.6 percent.
23 See Appendix A, Table A.1
24 See Appendix A, Table A.2

ENTRIX, Inc. 17
Table 8 Southern San Joaquin Municipal Utility District Financial Statement Review, FY
1998-1999 to FY 2005-2006
Average Annual Composition Percent Change FY 98-99 - FY
2005-06
Operating Revenues
Irrigation 68.0% 47.7%
Water Services 32.0% 37.1%
Total Operating Revenues 100.0% 44.1%
Operating Expenses
Source of Supply 63.8% 96.9%
Pumping 12.7% 141.1%
Administration and General 10.6% 75.3%
All Other 12.9% 40.4%
Total Operating Expenses 100.0% 80.6%
Non-Operating Revenues
Interest Income 16.8% 46.6%
Current and Unsecured Debt (1%) 25.0% 76.9%
Property Assessments 5.2% 0%
All Other 53.0% 229.7%
Total Non-Operating Revenues 100.0% 183.7%
Non-Operating Expenses
All Other 100.0% -100.0%
Total Non-Operating Expenses 100.0% -100.0%
As shown in Table 8, the largest sources of non-operating revenue were other, averaging 53.0 percent; current and unsecured debt, averaging 25.0 percent; interest, averaging 16.8 percent; and property assessments, averaging 5.2 percent. The largest sources of non-operating expenses were others, averaging 100.0 percent.
Between FY 1998-1999 and FY 2005-2006, non-operating revenue from other increased 229.7 percent, current and unsecured debt increased 76.9 percent, and interest increased 46.6

ENTRIX, Inc. 18
percent. Overall, total non-operating revenues increased 183.7 percent. Overall, total non-operating expenses decreased 100.0 percent.
Tulare Irrigation District
Tulare Irrigation District (Tulare) is the eighth largest recipient of CVP water in the Valley and receives water from the Friant-Kern Canal. In 2007, its projected water delivery was 83,763 AF, accounting for 3.6 percent of total water for the Valley. Total outstanding long-term debt at the end of FY2005-2006 was $3.1 million, but Tulare does not owe the United States or California government for construction costs.25 The net capital cost allocated to the district for CVP repayment was $13.0 million in 2008.26
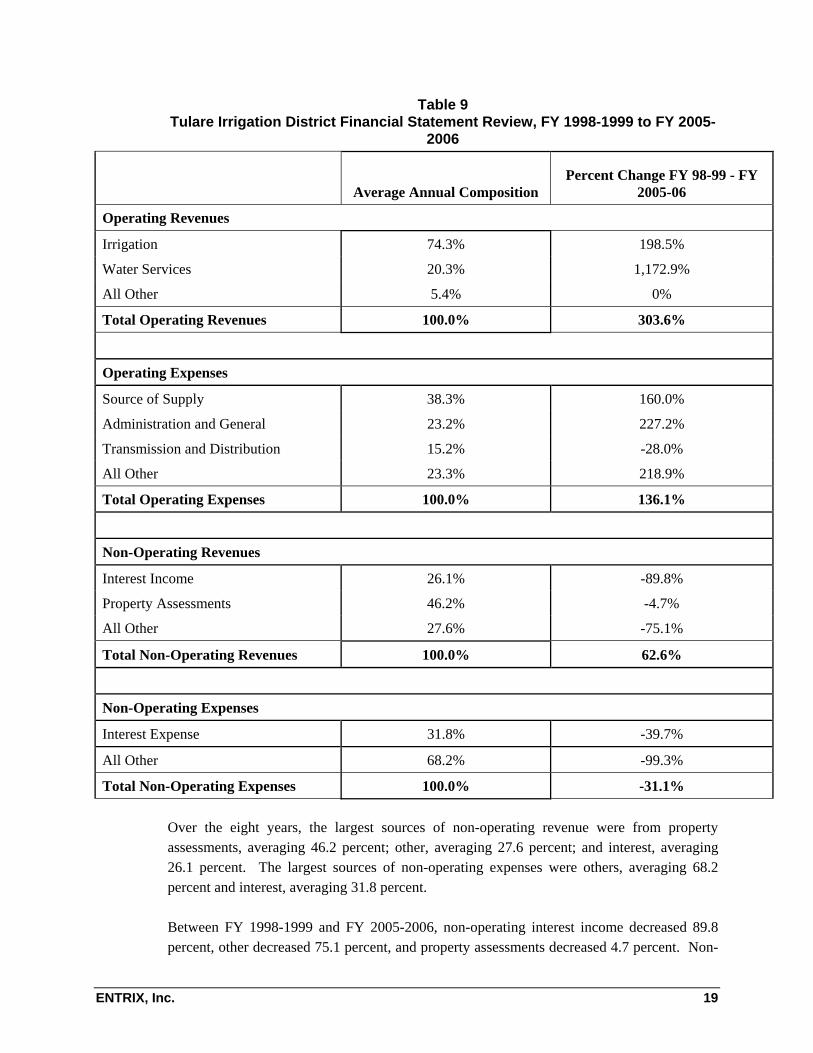
As shown in Table 9, the largest sources of operating revenue for the eight years were irrigation water sales, averaging 74.3 percent; water services, averaging 20.3 percent; and other averaging 5.4 percent. The largest sources of operating expenses were source of supply, averaging 38.3 percent; other, averaging 23.3 percent; administration and general, averaging 23.2 percent; and transmission and distribution, averaging 15.2 percent.
Between FY 1998-1999 and FY 2005-2006, operating revenue from water services increased 1,172.9 percent and irrigation water sales increased 198.5 percent. Overall, total operating revenue increased 303.6 percent. Administration and General operating expenses increased 227.2 percent, other increased 218.9 percent, source of supply increased 160.0 percent, and transmission and distribution decreased 28.0 percent. Overall, total operating expenses increased 136.1 percent.
25 See Appendix A, Table A.1
26 See Appendix A, Table A.2
ENTRIX, Inc. 19
Table 9 Tulare Irrigation District Financial Statement Review, FY 1998-1999 to FY 2005-
2006
Average Annual Composition Percent Change FY 98-99 - FY
2005-06
Operating Revenues
Irrigation 74.3% 198.5%
Water Services 20.3% 1,172.9%
All Other 5.4% 0%
Total Operating Revenues 100.0% 303.6%
Operating Expenses
Source of Supply 38.3% 160.0%
Administration and General 23.2% 227.2%
Transmission and Distribution 15.2% -28.0%
All Other 23.3% 218.9%
Total Operating Expenses 100.0% 136.1%
Non-Operating Revenues
Interest Income 26.1% -89.8%
Property Assessments 46.2% -4.7%
All Other 27.6% -75.1%
Total Non-Operating Revenues 100.0% 62.6%
Non-Operating Expenses
Interest Expense 31.8% -39.7%
All Other 68.2% -99.3%
Total Non-Operating Expenses 100.0% -31.1%
Over the eight years, the largest sources of non-operating revenue were from property assessments, averaging 46.2 percent; other, averaging 27.6 percent; and interest, averaging 26.1 percent. The largest sources of non-operating expenses were others, averaging 68.2 percent and interest, averaging 31.8 percent.
Between FY 1998-1999 and FY 2005-2006, non-operating interest income decreased 89.8 percent, other decreased 75.1 percent, and property assessments decreased 4.7 percent. Non-

ENTRIX, Inc. 20
operating expenses from other decreased 99.3 percent and interest decreased 39.7 percent. Overall, total non-operating expenses decreased 31.1 percent.
Del Puerto Water District
Del Puerto Water District (Del Puerto) is the ninth largest recipient of CVP water in the Valley and receives water from the Delta-Mendota Canal. In 2007, its projected water delivery was 82,712 AF, accounting for 3.5 percent of total water for the Valley. At the end of FY2005-2006, Del Puerto carried no long-term debt, but owes the United States or California government $3.5 million for construction costs.27 The net capital costs allocated to the district for CVP repayment was $26.9 million in 2008.28
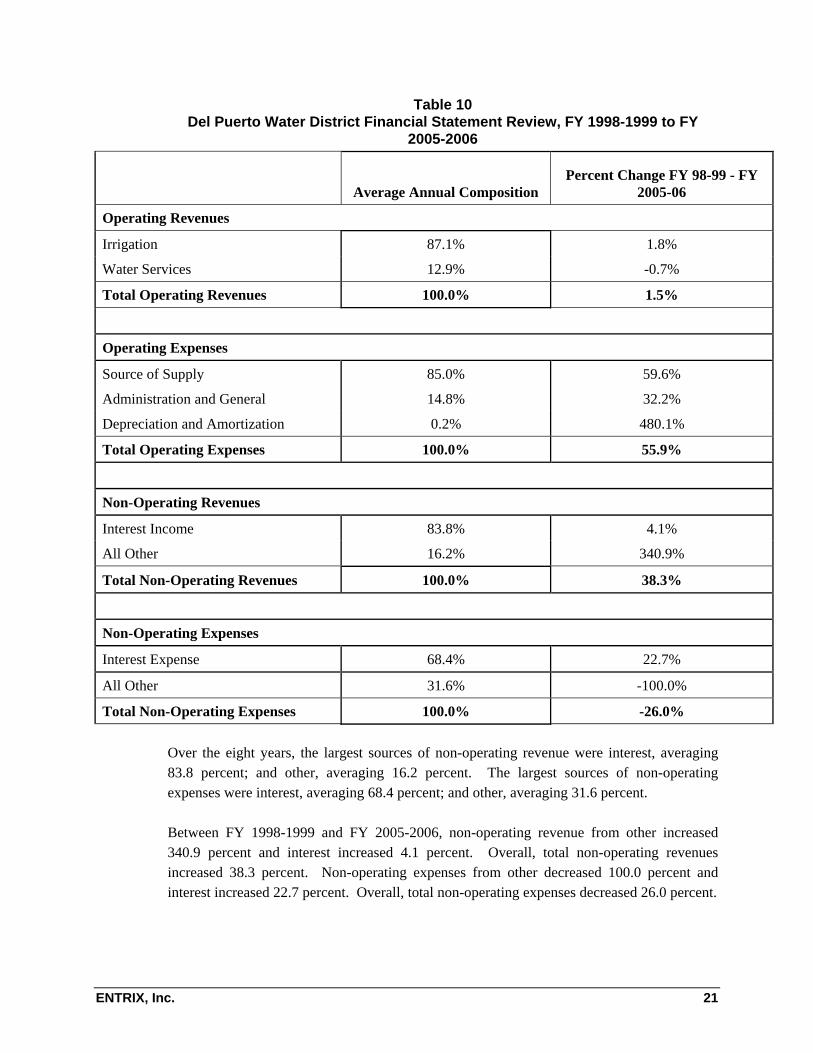
As shown in Table 10, the largest sources of operating revenues were irrigation water sales, averaging 87.1 percent; and water services averaging 12.9 percent. The largest sources of operating expenses were source of supply, averaging 85.0 percent; administration and general, averaging 14.8 percent; and depreciation and amortization, averaging 0.2 percent.
Between FY 1998-1999 and FY 2005-2006, operating revenue from irrigation water sales increased 1.8 percent and water services decreased 0.7 percent. Overall, total operating revenue increased 1.5 percent. Among operating expenses, depreciation and amortization increased 480.1 percent, source of supply increased 59.6 percent, and administration and general increased 32.2 percent. Overall, total operating expenses increased 55.9 percent.
27 See Appendix A, Table A.1
28 See Appendix A, Table A.2
ENTRIX, Inc. 21
Table 10 Del Puerto Water District Financial Statement Review, FY 1998-1999 to FY
2005-2006
Average Annual Composition Percent Change FY 98-99 - FY
2005-06
Operating Revenues
Irrigation 87.1% 1.8%
Water Services 12.9% -0.7%
Total Operating Revenues 100.0% 1.5%
Operating Expenses
Source of Supply 85.0% 59.6%
Administration and General 14.8% 32.2%
Depreciation and Amortization 0.2% 480.1%
Total Operating Expenses 100.0% 55.9%
Non-Operating Revenues
Interest Income 83.8% 4.1%
All Other 16.2% 340.9%
Total Non-Operating Revenues 100.0% 38.3%
Non-Operating Expenses
Interest Expense 68.4% 22.7%
All Other 31.6% -100.0%
Total Non-Operating Expenses 100.0% -26.0%
Over the eight years, the largest sources of non-operating revenue were interest, averaging 83.8 percent; and other, averaging 16.2 percent. The largest sources of non-operating expenses were interest, averaging 68.4 percent; and other, averaging 31.6 percent.
Between FY 1998-1999 and FY 2005-2006, non-operating revenue from other increased 340.9 percent and interest increased 4.1 percent. Overall, total non-operating revenues increased 38.3 percent. Non-operating expenses from other decreased 100.0 percent and interest increased 22.7 percent. Overall, total non-operating expenses decreased 26.0 percent.

ENTRIX, Inc. 22
San Luis Water District
San Luis Water District (San Luis) is the tenth largest recipient of CVP water in the Valley and receives water from the Delta-Mendota and San Luis Canals. In 2007, its projected water delivery was 73,325 AF, accounting for 3.1 percent of the total water for the Valley. At the end of FY2005-2006, San Luis carried $5.7 million in long-term debt and owes the United States or California government $4.2 million for construction costs.29 The net capital cost allocated to the district for CVP repayment was over $46.4 million in 2008.30
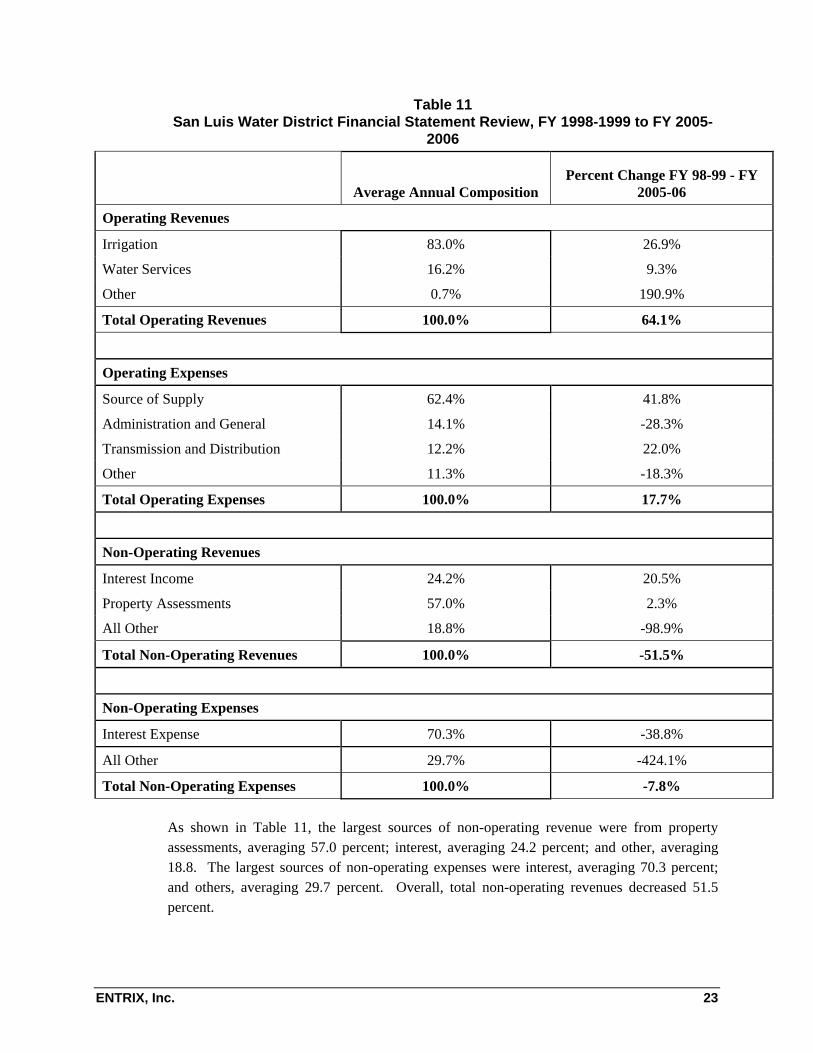
As shown in Table 11, the largest sources of operating revenue for the district over the eight fiscal years were irrigation water sales, averaging 83.0 percent; water services, averaging 16.2 percent; and other, averaging 0.7 percent. The largest sources of operating expenses were source of supply, averaging 62.4 percent; administration and general, averaging 14.1 percent; transmission and distribution, averaging 12.2 percent; and other, averaging 11.3 percent.
Between FY 1998-1999 and FY 2005-2006, other operating revenue increased 190.9 percent, irrigation water sales increased 26.9 percent, and water services increased 9.3 percent. Overall, total operating revenue increased 64.1 percent. Among operating expenses, source of supply increased 41.8 percent, administration and general decreased 28.3 percent, transmission and distribution increased 22.0 percent; and other decreased 18.3 percent. Overall, total operating expenses increased 17.7 percent.
29 See Appendix A, Table A.1
30 See Appendix A, Table A.2
ENTRIX, Inc. 23
Table 11 San Luis Water District Financial Statement Review, FY 1998-1999 to FY 2005-
2006
Average Annual Composition Percent Change FY 98-99 - FY
2005-06
Operating Revenues
Irrigation 83.0% 26.9%
Water Services 16.2% 9.3%
Other 0.7% 190.9%
Total Operating Revenues 100.0% 64.1%
Operating Expenses
Source of Supply 62.4% 41.8%
Administration and General 14.1% -28.3%
Transmission and Distribution 12.2% 22.0%
Other 11.3% -18.3%
Total Operating Expenses 100.0% 17.7%
Non-Operating Revenues
Interest Income 24.2% 20.5%
Property Assessments 57.0% 2.3%
All Other 18.8% -98.9%
Total Non-Operating Revenues 100.0% -51.5%
Non-Operating Expenses
Interest Expense 70.3% -38.8%
All Other 29.7% -424.1%
Total Non-Operating Expenses 100.0% -7.8%
As shown in Table 11, the largest sources of non-operating revenue were from property assessments, averaging 57.0 percent; interest, averaging 24.2 percent; and other, averaging 18.8. The largest sources of non-operating expenses were interest, averaging 70.3 percent; and others, averaging 29.7 percent. Overall, total non-operating revenues decreased 51.5 percent.

ENTRIX, Inc. 24
Between FY 1998-1999 and FY 2005-2006, non-operating expenses from other decreased 424.1 percent and interest decreased 38.8 percent. Overall, total non-operating expenses decreased 7.8 percent.
Comparison of the Ten Contractors
Collectively, the 10 irrigation contractors shown in Table 12 received over 1.8 million AF of CVP water in 2007, representing 77.5 percent of CVP water for the Valley. The 1.8 million AF was 51.5 percent of all 2007 CVP water deliveries31. The three largest water contractors in the Valley were Westlands, Madera, and Lower Tule, receiving 701,000, 176,000, and 160,000 AF, respectively, of CVP water in 2007. The three contractors with the greatest CVP capital cost repayment obligations are Westlands, San Luis, and Madera owing $373.7, $46.4, and $33.8 million respectively.
Among the 10 contractors, all but two had negative operating incomes. The three contractors with the highest average operating income were San Luis, Del Puerto, and S. San Joaquin netting $3.9, $3.3, and $-1.4 million respectively. The three contractors with the lowest average operating income were Westlands, Arvin-Edison, and Tulare, netting $-23.8, $-20.2, and $-18.4 million respectively.
Of the 10 contractors, all had positive non-operating and net incomes. Contractors with the highest average non-operating incomes were Westlands, averaging $55.6 million; Arvin-Edison, averaging $36.3 million; and Tulare, averaging $34.6 million. Contractors with the lowest average non-operating incomes were Del Puerto, S. San Joaquin, and Delano-Earlimart, averaging $969,000, $7.2 million, and $9.3 million respectively. The highest average net incomes were for Westlands, San Luis, and Arvin-Edison, averaging $32.7, $19.5, and $16.2 million, respectively. The lowest average net incomes were for Madera, Chowchilla, and Lower Tule, averaging $13,500, $1.5 million, and $2.8 million respectively.
31 Water deliveries do not include water for the Delta-Mendota Exchange Contractors.

ENTRIX, Inc. 25
Table 12 Comparison of the Largest Irrigation Contractors in the San Joaquin Valley
Water District
Projected Water
Deliveries1 (Acre-Feet)
CVP Repayment Obligation2
Average Operating Income3
Average Non-Operating Income4
Average Net Income5
Arvin-Edison 159,271 $24,594,454 $ (20,163,165) $36,343,853 $16,180,688
Chowchilla 131,175 $23,680,986 $ (17,707,247) $19,168,254 $1,461,007
Del Puerto 82,712 $26,918,979 $3,342,353 $969,736 $4,312,089
Delano-Earlimart 131,953 $29,239,005 $ (3,297,103) $9,252,077 $5,954,974
Lower Tule 160,450 $27,534,146 $ (13,426,383) $16,204,348 $2,777,965
Madera 176,103 $33,811,684 $ (14,939,519) $14,952,999 $13,480
San Luis 73,325 $46,361,200 $3,908,755 $15,571,088 $19,479,843
South Joaquin 111,315 $26,795,785 $ (1,415,532) $7,176,600 $5,761,068
Tulare 83,763 $13,042,648 $ (18,438,071) $34,593,004 $16,154,933
Westlands 701,134 $373,773,467 $ (23,864,158) $56,555,467 $32,691,309
Total
1,811,201 $625,752,354 $ (106,000,070) $210,787,426 $104,787,356
1/ Water deliveries for 2007
2/ Repayment obligation as of 2008
3/ Average of fiscal years 2005-2006 through 1998-1999
4/ Average of fiscal years 2005-2006 through 1998-1999
5/ Average of fiscal years 2005-2006 through 1998-1999

ENTRIX, Inc. 26
Appendix A
Table A.1 Long-Term Debt of Largest 10 CVP Irrigation Water Contractors in the San
Joaquin Valley FY 2005-2006
District
Outstanding Debt at End of
Year Percentage of Top Ten
Construction Financed by U.S. or State
Percentage of Top Ten
Arvin-Edison Water Storage District $ 10,213,542 4.0% $ 4,090,485 6.0%
Chowchilla Water District
Del Puerto Water District $ 3,456,811 5.1%
Delano-Earlimart Irrigation District $ 1,871,392 0.7%
Lower Tule River Irrigation District $ 304,999 0.1%
Madera Irrigation District $ 47,920,000 18.7% $ 1,952,114 2.9%
San Luis Water District $ 2,967,500 1.2% $ 4,191,548 6.2%
South San Joaquin Municipal Utility District
Tulare Irrigation District $ 3,055,015 1.2%
Westlands Water District $ 189,991,829 74.1% $ 54,348,623 79.9%
Total $ 253,356,777 100.0% $ 65,171,190 100.0%

ENTRIX, Inc. 27
Table A.2 Allocated Capital Costs and Repayment of the Largest Ten CVP Irrigation
Water Contractors in the San Joaquin Valley 2007
District Allocated
Capital Cost Repayment as of
9/30/06 (Sch A-6A) Net Capital
Cost
Percentage of Net
Capital Cost Westlands Water District $447,921,861 $ 74,148,394 $ 373,773,467 59.7%
Arvin-Edison Water Storage District $ 32,862,312 $ 8,267,858 $ 24,594,454 3.9%
Madera Irrigation District $ 42,386,719 $ 8,575,035 $ 33,811,684 5.4%
Lower Tule River Irrigation District $ 38,333,059 $ 10,798,913 $ 27,534,146 4.4%
Delano-Earlimart Irrigation District $ 40,838,450 $ 11,599,444 $ 29,239,005 4.7%
Chowchilla Water District $ 31,019,003 $ 7,338,017 $ 23,680,986 3.8%
South San Joaquin MUD $ 35,624,145 $ 8,828,360 $ 26,795,785 4.3%
Tulare Irrigation District $ 18,893,365 $ 5,850,718 $ 13,042,648 2.1%
Del Puerto Water District $ 33,039,984 $ 6,121,005 $ 26,918,979 4.3%
San Luis Water District $ 48,905,753 $ 2,544,553 $ 46,361,200 7.4%
Total Top Ten $769,824,651 $ 144,072,297 $ 625,752,354 100.0%
Source: United States Department of the Interior, Bureau of Reclamation, Mid-Pacific Regional Office, “Central Valley Project Schedule of Irrigation Capital Allocation by Contractor, 2008 Irrigation Water Rates.” Irrigation Schedule A-2Bb (accessed July 17, 2008).
ENTRIX, Inc. 28
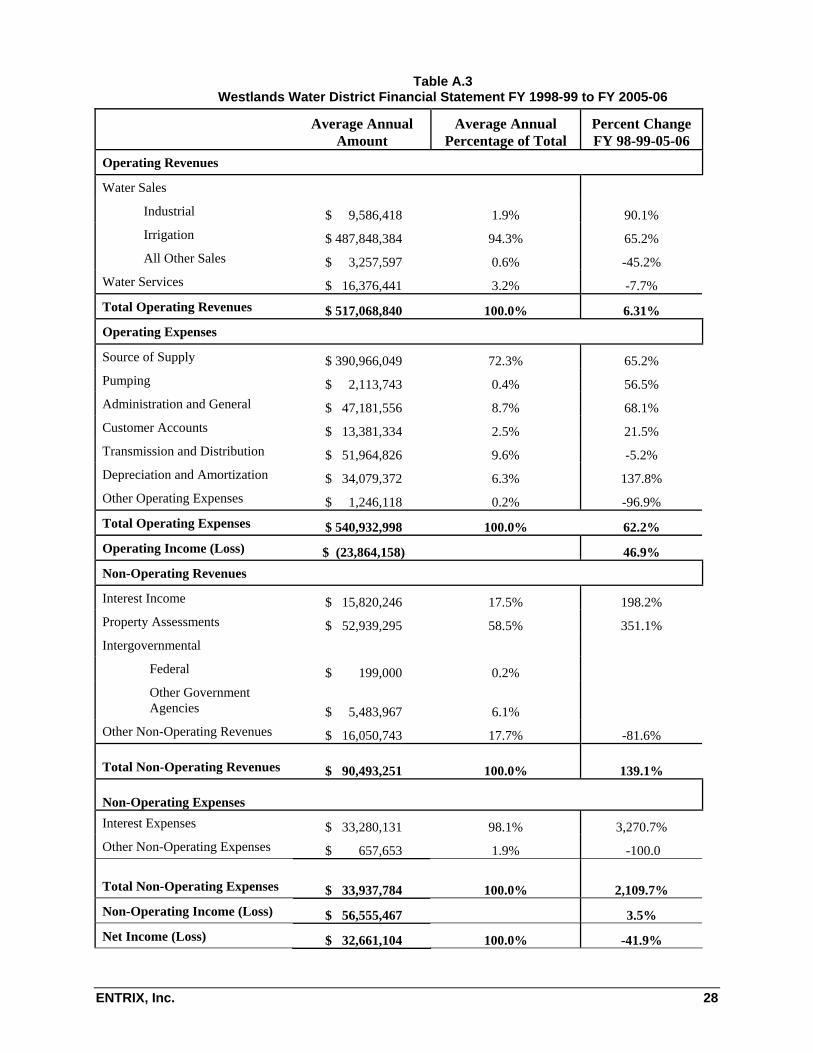
Table A.3 Westlands Water District Financial Statement FY 1998-99 to FY 2005-06
Average Annual
Amount Average Annual
Percentage of Total Percent Change FY 98-99-05-06
Operating Revenues
Water Sales Industrial $ 9,586,418 1.9% 90.1% Irrigation $ 487,848,384 94.3% 65.2% All Other Sales $ 3,257,597 0.6% -45.2%
Water Services $ 16,376,441 3.2% -7.7% Total Operating Revenues $ 517,068,840 100.0% 6.31% Operating Expenses
Source of Supply $ 390,966,049 72.3% 65.2% Pumping $ 2,113,743 0.4% 56.5% Administration and General $ 47,181,556 8.7% 68.1% Customer Accounts $ 13,381,334 2.5% 21.5% Transmission and Distribution $ 51,964,826 9.6% -5.2% Depreciation and Amortization $ 34,079,372 6.3% 137.8% Other Operating Expenses $ 1,246,118 0.2% -96.9% Total Operating Expenses $ 540,932,998 100.0% 62.2% Operating Income (Loss) $ (23,864,158) 46.9% Non-Operating Revenues
Interest Income $ 15,820,246 17.5% 198.2% Property Assessments $ 52,939,295 58.5% 351.1% Intergovernmental
Federal $ 199,000 0.2% Other Government Agencies $ 5,483,967 6.1%
Other Non-Operating Revenues $ 16,050,743 17.7% -81.6%
Total Non-Operating Revenues $ 90,493,251 100.0% 139.1%
Non-Operating Expenses Interest Expenses $ 33,280,131 98.1% 3,270.7% Other Non-Operating Expenses $ 657,653 1.9% -100.0
Total Non-Operating Expenses $ 33,937,784 100.0% 2,109.7% Non-Operating Income (Loss) $ 56,555,467 3.5% Net Income (Loss) $ 32,661,104 100.0% -41.9%

ENTRIX, Inc. 29
Table A.4 Arvin-Edison Water Storage District Financial Statement FY 1998-99 to FY 2005-06
Average Annual
Amount Average Annual
Percentage of Total Percent Change FY 98-99-05-06
Operating Revenues
Water Sales
Industrial $ 1,666,892 1.4% -90.1%
Irrigation $ 64,687,499 55.0% 39.7%
All Other Sales $ 1,471,570 1.3% 30.5%
Water Services $ 49,770,445 42.3% -77.5%
Total Operating Revenues $117,596,406 100.0% 20.2%
Operating Expenses
Source of Supply $ 63,895,686 46.4% 115.3%
Pumping $ 8,012,398 5.8% 118.3%
Administration and General $ 18,288,214 13.3% 86.7%
Customer Accounts $ 1,315,540 1.0% 49.4%
Transmission and Distribution $ 35,130,677 25.5% 214.6%
Depreciation and Amortization $ 10,250,593 7.4% 31.9%
Other Operating Expenses $ 866,463 0.6% 0.0%
Total Operating Expenses $137,759,571 100.0% 135.6%
Operating Income (Loss) $ (20,163,165) -241.8%
Non-Operating Revenues
Interest Income $ 9,054,317 23.3% -68.1%
Rents, Leases, and Franchises $ 40,000 0.1% -100.0
Property Assessments $ 17,133,782 44.0% 2.3%
Intergovernmental
Other Agencies $ 8,002,002 20.6% 0%
Other Non-Operating Revenues $ 4,690,560 12.1% 189.1%
Total Non-Operating Revenues $ 38,920,661 100.0% -18.5%
Non-Operating Expenses
Interest Expenses $ 783,563 30.4% 2,939.0%
Other Non-Operating Expenses $ 1,793,245 69.6% -100.0%
Total Non-Operating Expenses $ 2,576,808 100.0% 2752.4%
Non-Operating Income (Loss) $ 36,343,853 -12.5%
Net Income (Loss) $ 16,180,688 -144.8%

ENTRIX, Inc. 30
Table A.5 Madera Irrigation District Financial Statement FY 1998-99 to FY 2005-06
Average Annual
Amount Average Annual
Percentage Percent Change FY 98-99-05-06
Operating Revenues
Water Sales Industrial $ 41,100 0.1% 127.0%
Irrigation $ 37,369,076 58.9% 115.3%
Sales for Resale $ 2,002,146 3.2%
Water Services $ 24,025,463 37.9% 118.8%
Total Operating Revenues $ 63,437,785 100.0% 107.7%
Operating Expenses
Source of Supply $ 40,194,424 51.3% 43.3%
Administration and General $ 13,423,818 17.1% 62.5%
Transmission and Distribution $ 16,361,087 20.9% 2.7%
Depreciation and Amortization $ 5,446,263 6.9% 80.4%
Other Operating Expenses $ 2,951,712 3.8%
Total Operating Expenses $ 78,377,304 100.0% 39.7%
Operating Income (Loss) $ (14,939,519) -77.4%
Non-Operating Revenues
Interest Income $ 1,713,706 10.9% -4.2%
Rents, Leases, and Franchises $ 301,877 1.9% 523.8%
Current Secured and Unsecured Debt (1%) $ 357,550 2.3%
Voter Approved Taxes $ 486,513 3.1%
Property Assessments $ 8,772,771 55.8% -100.0%
Intergovernmental
Federal $ 664,088 4.2%
State $ 112,039 0.7%
Other Agencies $ 726,653 4.6%
Other Non-Operating Revenues $ 2,587,306 16.5% 149.1%
Total Non-Operating Revenues $ 15,722,503 100.0% -69.1%
Non-Operating Expenses
Interest Expenses $ 512,668 66.6% 2509.2%
Other Non-Operating Expenses $ 256,836 33.4% 51.0%
Total Non-Operating Expenses $ 769,504 100.0% 3256.9%
Non-Operating Income (Loss) $ 14,952,999 -81.5%
Net Income (Loss) $ 13,480 100.0% -88.6%
ENTRIX, Inc. 31
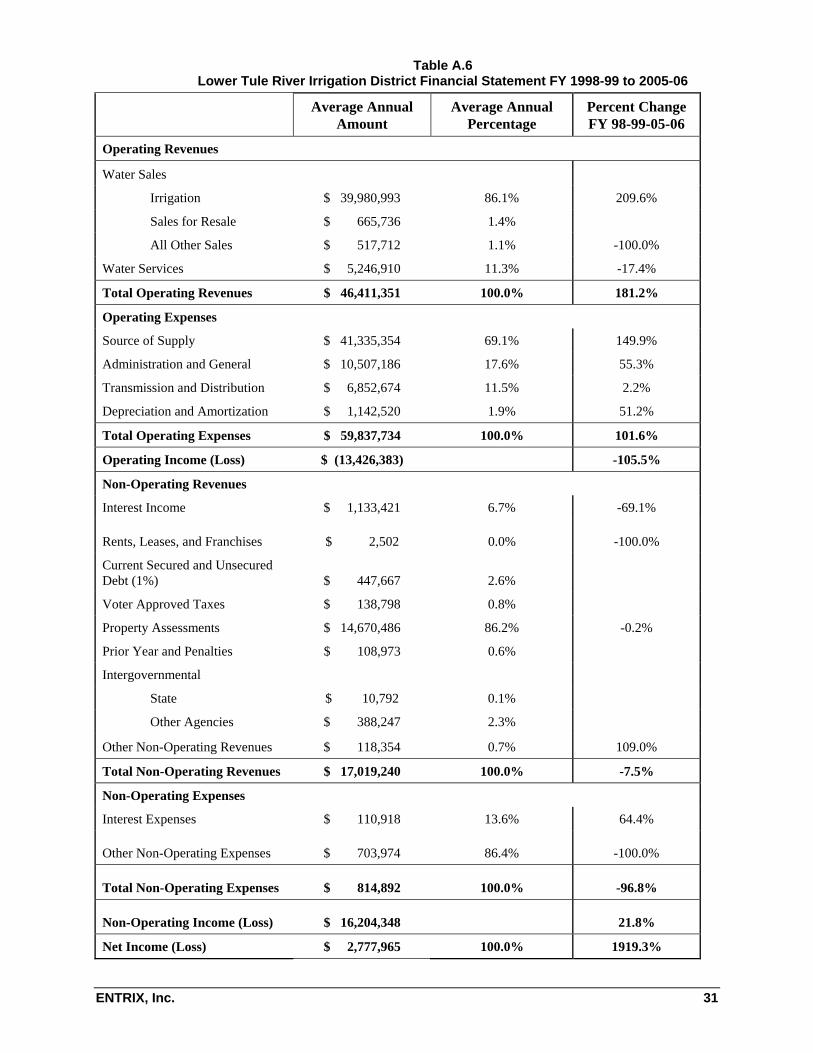
Table A.6 Lower Tule River Irrigation District Financial Statement FY 1998-99 to 2005-06
Average Annual
Amount Average Annual
Percentage Percent Change FY 98-99-05-06
Operating Revenues
Water Sales Irrigation $ 39,980,993 86.1% 209.6%
Sales for Resale $ 665,736 1.4%
All Other Sales $ 517,712 1.1% -100.0%
Water Services $ 5,246,910 11.3% -17.4%
Total Operating Revenues $ 46,411,351 100.0% 181.2%
Operating Expenses
Source of Supply $ 41,335,354 69.1% 149.9%
Administration and General $ 10,507,186 17.6% 55.3%
Transmission and Distribution $ 6,852,674 11.5% 2.2%
Depreciation and Amortization $ 1,142,520 1.9% 51.2%
Total Operating Expenses $ 59,837,734 100.0% 101.6%
Operating Income (Loss) $ (13,426,383) -105.5%
Non-Operating Revenues
Interest Income $ 1,133,421 6.7% -69.1%
Rents, Leases, and Franchises $ 2,502 0.0% -100.0%
Current Secured and Unsecured Debt (1%) $ 447,667 2.6%
Voter Approved Taxes $ 138,798 0.8%
Property Assessments $ 14,670,486 86.2% -0.2%
Prior Year and Penalties $ 108,973 0.6%
Intergovernmental
State $ 10,792 0.1%
Other Agencies $ 388,247 2.3%
Other Non-Operating Revenues $ 118,354 0.7% 109.0%
Total Non-Operating Revenues $ 17,019,240 100.0% -7.5%
Non-Operating Expenses
Interest Expenses $ 110,918 13.6% 64.4%
Other Non-Operating Expenses $ 703,974 86.4% -100.0%
Total Non-Operating Expenses $ 814,892 100.0% -96.8%
Non-Operating Income (Loss) $ 16,204,348 21.8%
Net Income (Loss) $ 2,777,965 100.0% 1919.3%

ENTRIX, Inc. 32
Table A.7 Delano-Earlimart Irrigation District Financial Statement FY 1998-99 to 2005-06
Average Annual
Amount Average Annual
Percentage Percent Change FY 98-99-05-06
Operating Revenues
Water Sales
Irrigation $ 34,087,018 58.9% 117.0%
All Other Sales $ 4,548,255 7.9% -69.4%
Water Services $ 19,214,653 33.2% 454.3%
Total Operating Revenues $ 57,849,926 100.0% 199.0%
Operating Expenses
Source of Supply $ 46,759,214 76.5% 165.4%
Pumping $ 1,163,697 1.9%
Administration and General $ 7,437,806 12.2% 61.8%
Transmission and Distribution $ 3,769,340 6.2% -30.0%
Depreciation and Amortization $ 799,733 1.3% 223.0%
Other Operating Expenses $ 1,217,239 2.0%
Total Operating Expenses $ 61,147,029 100.0% 69.8%
Operating Income (Loss) $ (3,297,103) -108.4%
Non-Operating Revenues
Interest Income $ 2,868,710 29.2% -29.6%
Rents, Leases, and Franchises $ 8,600 0.1%
Property Assessments $ 4,856,314 49.5% -100.0%
Intergovernmental
State $ 99,517 1.0%
Other Agencies $ 390,453 4.0%
Other Non-Operating Revenues $ 1,596,163 16.3% 1151.7%
Total Non-Operating Revenues $ 9,819,757 100.0% -82.3%
Non-Operating Expenses
Interest Expenses $ 515,099 90.7% 721.1%
Other Non-Operating Expenses $ 52,581 9.3% -100.0%
Total Non-Operating Expenses $ 567,680 100.0% 284.2%
Non-Operating Income (Loss) $ 9,252,077 -85.9%
Net Income (Loss) $ 5,954,974 100.0% 20.1%
ENTRIX, Inc. 33
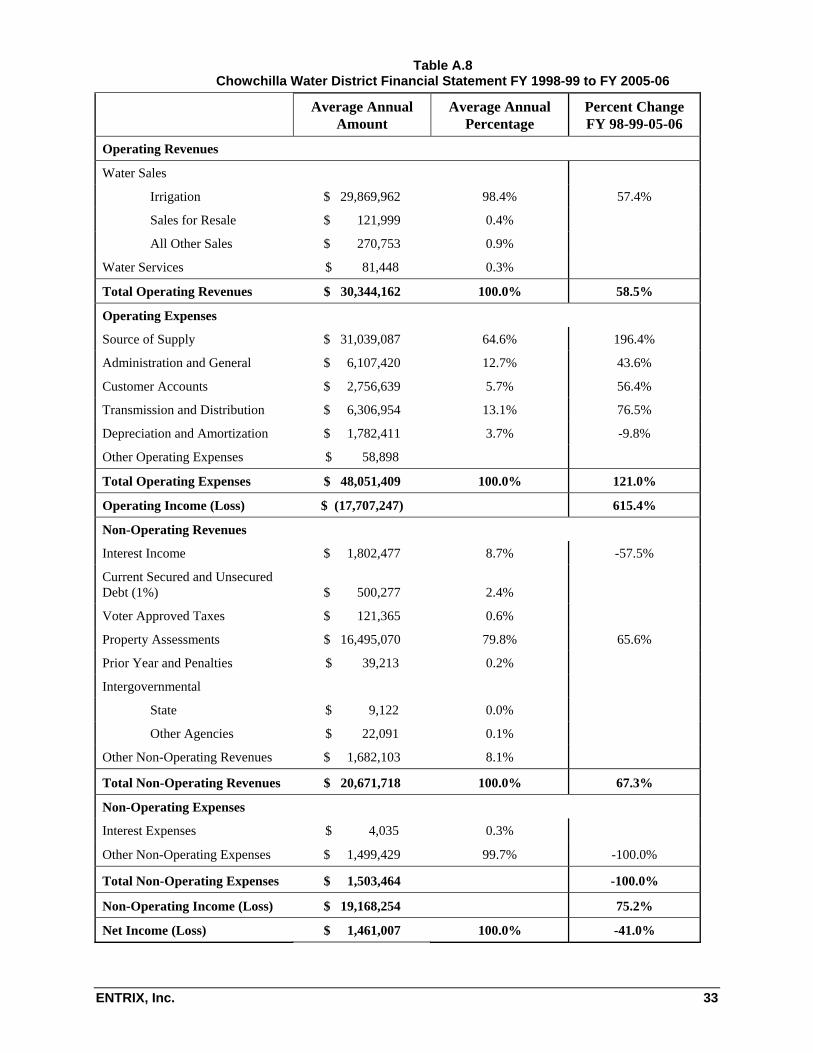
Table A.8 Chowchilla Water District Financial Statement FY 1998-99 to FY 2005-06
Average Annual
Amount Average Annual
Percentage Percent Change FY 98-99-05-06
Operating Revenues
Water Sales
Irrigation $ 29,869,962 98.4% 57.4%
Sales for Resale $ 121,999 0.4%
All Other Sales $ 270,753 0.9%
Water Services $ 81,448 0.3%
Total Operating Revenues $ 30,344,162 100.0% 58.5%
Operating Expenses
Source of Supply $ 31,039,087 64.6% 196.4%
Administration and General $ 6,107,420 12.7% 43.6%
Customer Accounts $ 2,756,639 5.7% 56.4%
Transmission and Distribution $ 6,306,954 13.1% 76.5%
Depreciation and Amortization $ 1,782,411 3.7% -9.8%
Other Operating Expenses $ 58,898
Total Operating Expenses $ 48,051,409 100.0% 121.0%
Operating Income (Loss) $ (17,707,247) 615.4%
Non-Operating Revenues
Interest Income $ 1,802,477 8.7% -57.5%
Current Secured and Unsecured Debt (1%) $ 500,277 2.4%
Voter Approved Taxes $ 121,365 0.6%
Property Assessments $ 16,495,070 79.8% 65.6%
Prior Year and Penalties $ 39,213 0.2%
Intergovernmental
State $ 9,122 0.0%
Other Agencies $ 22,091 0.1%
Other Non-Operating Revenues $ 1,682,103 8.1%
Total Non-Operating Revenues $ 20,671,718 100.0% 67.3%
Non-Operating Expenses
Interest Expenses $ 4,035 0.3%
Other Non-Operating Expenses $ 1,499,429 99.7% -100.0%
Total Non-Operating Expenses $ 1,503,464 -100.0%
Non-Operating Income (Loss) $ 19,168,254 75.2%
Net Income (Loss) $ 1,461,007 100.0% -41.0%

ENTRIX, Inc. 34
Table A.9 Southern San Joaquin Municipal Utility District Financial Statement FY 1998-99 to
2005-06
Average Annual
Amount Average Annual
Percentage Percent Change FY 98-99-05-06
Operating Revenues
Water Sales
Irrigation $ 39,056,500 68.0% 47.7%
Water Services $ 18,338,374 32.0% 37.1%
Total Operating Revenues $ 57,394,874 100.0% 44.1%
Operating Expenses
Source of Supply $ 37,498,738 63.8% 96.9%
Pumping $ 7,458,532 12.7% 141.1%
Administration and General $ 6,259,389 10.6% 75.3%
Transmission and Distribution $ 5,571,075 9.5% 32.9%
Depreciation and Amortization $ 2,013,458 3.4% -40.6%
Other Operating Expenses $ 9,214 0.0%
Total Operating Expenses $ 58,810,406 100.0% 80.6%
Operating Income (Loss) $ (1,415,532) -186.4%
Non-Operating Revenues
Interest Income $ 1,205,040 16.8% 46.6%
Rents, Leases, and Franchises $ 52,159 0.7% 16.7%
Current Secured and Unsecured Debt (1%) $ 1,799,623 25.0% -76.9%
Voter Approved Taxes $ 348,198 4.8%
Property Assessments $ 372,837 5.2%
Prior Year and Penalties $ 12,242 0.2%
Intergovernmental
State $ 49,808 0.7%
Other Non-Operating Revenues $ 3,352,308 46.6% 4531.8%
Total Non-Operating Revenues $ 7,192,215 100.0% 183.7%
Non-Operating Expenses
Interest Expenses
Other Non-Operating Expenses $ 15,615 100.0% -100.0%
Total Non-Operating Expenses $ 15,615 100.0% -100.0%
Non-Operating Income (Loss) $ 7,176,600 185.4%
Net Income (Loss) $ 5,761,068 -36.5%

ENTRIX, Inc. 35
Table A.10 Tulare Irrigation District Financial Statement FY 1998-99 to 2005-06
Average Annual
Amount Average Annual
Percentage Percent Change FY 98-99-05-06
Operating Revenues
Water Sales
Irrigation $ 21,595,935 74.3% 198.5%
Sales for Resale 0.0%
All Other Sales $ 1,587,775 5.5%
Water Services $ 5,890,621 20.3% 1172.9%
Total Operating Revenues $ 29,074,331 100.0% 303.6%
Operating Expenses
Source of Supply $ 18,220,224 38.3% 160.0%
Pumping $ 10,982 0.0%
Administration and General $ 11,028,086 23.2% 227.2%
Transmission and Distribution $ 7,211,036 15.2% -28.0%
Depreciation and Amortization $ 2,219,041 4.7% 304.3%
Other Operating Expenses $ 8,823,033 18.6%
Total Operating Expenses $ 47,512,402 100.0% 136.1%
Operating Income (Loss) $ (18,438,071) -97.2%
Non-Operating Revenues
Interest Income $ 9,977,477 26.1% -89.8%
Rents, Leases, and Franchises $ 42,142 0.1% -100.0%
Current Secured and Unsecured Debt (1%) $ 783,252 2.0% -86.8%
Voter Approved Taxes $ 289,220 0.8%
Property Assessments $ 17,675,030 46.2% -4.7%
Prior Year and Penalties $ 78,269 0.2%
Intergovernmental
State $ 17,651 0.0%
Other Non-Operating Revenues $ 9,358,778 24.5% -75.4%
Total Non-Operating Revenues $ 38,221,819 100.0% -62.6%
Non-Operating Expenses
Interest Expenses $ 1,155,772 31.8% -39.7%
Other Non-Operating Expenses $ 2,473,043 68.2% -99.3%
Total Non-Operating Expenses $ 3,628,815 100.0% -31.1%
Non-Operating Income (Loss) $ 34,593,004 -63.2%
Net Income (Loss) $ 16,154,933 -55.1%

ENTRIX, Inc. 36
Table A.11 Del Puerto Water District Financial Statement FY 1998-99 to 2005-06
Average Annual
Amount Average Annual
Percentage Percent Change FY 98-99-05-06
Operating Revenues
Water Sales
Irrigation $ 27,584,412 87.1% 1.8%
Water Services $ 4,094,483 12.9% -0.7%
Total Operating Revenues $ 31,678,895 100.0% 1.5%
Operating Expenses
Source of Supply $ 24,077,835 85.0% 59.6%
Administration and General $ 4,204,507 14.8% 32.3%
Depreciation and Amortization $ 54,200 0.2% 480.1%
Total Operating Expenses $ 28,336,542 100.0% 55.9%
Operating Income (Loss) $ 3,342,353 -103.3%
Non-Operating Revenues
Interest Income $ 1,210,199 83.8% 4.1%
Rents, Leases, and Franchises $ 5,250 0.4% -100.0%
Other Non-Operating Revenues $ 229,069 15.9% 408.6%
Total Non-Operating Revenues $ 1,444,518 100.0% 38.3%
Non-Operating Expenses
Interest Expenses $ 324,529 68.4% 22.7%
Other Non-Operating Expenses $ 150,253 31.6% -100.0%
Total Non-Operating Expenses $ 474,782 100.0% -26.0%
Non-Operating Income (Loss) $ 969,736 160.8%
Net Income (Loss) $ 4,312,089 100.0% -94.2%

ENTRIX, Inc. 37
Table A.12 San Luis Water District Financial Statement FY 1998-99 to 2005-06
Average Annual
Amount Average Annual
Percentage Percent Change FY
98-99-05-06
Operating Revenues
Water Sales
Industrial $ 418,035 0.7% 190.9%
Irrigation $ 48,177,637 83.0% 26.6%
Water Services $ 9,417,500 16.2% 9.3%
Total Operating Revenues $ 58,013,172 100.0% 64.1%
Operating Expenses
Source of Supply $ 33,770,084 62.4% 41.8%
Pumping $ 466,644 0.9 378.3
Water Treatment $ 126,918 0.2 -100.0
Administration and General $ 7,626,044 14.1% -28.3%
Transmission and Distribution $ 6,587,552 12.2% 22.0%
Depreciation and Amortization $ 5,527,175 10.2% -11.9%
Total Operating Expenses $ 5,410,4417 100.0% 17.7%
Operating Income (Loss) $ 3,908,755 -360.7%
Non-Operating Revenues
Interest Income $ 5,531,380 24.2% 20.5%
Rents, Leases, and Franchises $ 114,166 0.5% -100.0%
Voter Approved Taxes $ 28,884 0.1% -100.0%
Property Assessments $ 13,024,644 57.0% 2.3%
Intergovernmental
State $ 432
Other Non-Operating Revenues $ 4,135,748 18.1% -98.9%
Total Non-Operating Revenues $ 22,835,254 -51.5%
Non-Operating Expenses
Interest Expenses $ 5,105,466 70.3% -38.8%
Other Non-Operating Expenses $ 2,158,700 29.7% -424.1%
Total Non-Operating Expenses $ 7,264,166 100.0% -7.8%
Non-Operating Income (Loss) $ 15,571,088 -60.3%
Net Income (Loss) $ 16,912,987 -3.8%

ENTRIX, Inc. 38