financial stability review · under state bank of pakistan (sbp) act, 1956 the sbp is responsible...
TRANSCRIPT

i
State Bank of Pakistan
FIRST HALF
2013 FINANCIAL STABILITY REVIEW

ii

iii
FSR Team
Team Leader
Muhammad Javaid Ismail [email protected]
Team Members
Muhammad Shamil Akbar [email protected]
Muhammad Sadiq Ansari [email protected]
Ghulam Khadija [email protected]
Shereen Baloch [email protected]
Muhammad Inaam Ashraf [email protected]

iv
Acknowledgements
The FSR team is highly indebted to the Governor, State Bank of Pakistan for his encouragement and guidance. We are
also thankful to Executive Director, Banking Supervision Group and Lubna Farooq Malik, Director Off-Site Supervision
and Enforcement Department for their continuous support and supervision in the preparation of this report. The team
is also grateful to members of Publications Review Committee (PRC) for providing invaluable feedback on the report.
The team would also like to thank data support from Payment Systems Department, Statistics and Data Warehouse
Department, Monetary Policy Department, and Domestic Markets and Monetary Management Department.
We are also grateful to the Securities & Exchange Commission of Pakistan for providing relevant data and technical
information on Insurance sector and Non-banking Financial Institutions.

v
Financial Stability and State Bank of Pakistan
Under State Bank of Pakistan (SBP) Act, 1956 the SBP is responsible for securing monetary stability and soundness of
the financial system.
Financial stability is defined as a situation in which the function of efficient financial intermediation and payment
services continues without disruptions despite internal and external shocks, and financial risks are monitored and
managed so well that the possibility of systemic crisis is minimized. The SBP sees financial stability as an evolving
process, as the financial sector adapts itself to the needs of the economy and financial globalization.
Efficient financial intermediation and access to financial services across all segments of the population is the ideal
situation in which economic growth can thrive. The significance of the financial sector is even more crucial given its
inter-linkages with the real sector. SBP being the leading regulator of the financial sector strives to play a facilitating
role in the growth of the sector. The confidence of economic agents in the financial sector’s ability to meet their
financial needs in a convenient and secure manner is also important for maintaining and promoting financial stability.
The SBP works closely with the Securities and Exchange Commission of Pakistan (SECP), Pakistan Banks’ Association
(PBA), the Federal Government, and other regulatory bodies in achieving this goal.
Ensuring financial stability also complements another important SBP objective of securing monetary stability. It is
hard to imagine monetary stability in absence of financial stability. Financial Stability Report (FSR), a biannual
publication provides an assessment of financial stability issues and pitches input for policy initiatives. The report
gives an independent perspective and commentary on the state of financial stability by providing an objective view on
the developments in the financial sector, and giving an in-depth analysis of issues relevant to the financial institutions
and markets. It also endeavors to promote informed public debate on various aspects of the financial system.
State Bank of Pakistan welcomes feedback and comments on the FSR.

vi
Data Conventions & Coverage
The Financial Stability Review (FSR) examines performance and risk analysis of various components of the financial
sector on half yearly basis. The report uses two terminologies; CY for Calendar Year and FY interchangeably for
Financial Year (in case of NBFCs) and Fiscal Year (July 1 – June 30).
The review is based on the data reported in audited or unaudited accounts for each component as follows:
Banks (Conventional and Islamic), Development Finance Institutions (DFIs), Microfinance Banks, Financial
Markets, Mutual Funds, Payment Systems and Insurance industry data is based on half-yearly accounts ended
June 30, 2013.
Data on NBFC’s including Leasing, Investment Finance Companies and Modarabas is based on annual audited
accounts for financial year ended June 2013.
.

vii
Contents
Financial Stability: Overview 01
Chapter 1: Financial Intermediation 05
Chapter 2: Risk Analysis of the Banking Sector 12
Chapter 3: Profitability, Soundness, and Resilience 22
Chapter 4: Islamic Banking 28
Chapter 5: Financial Markets 32
Chapter 6: Non-Bank Financial Institutions 39
Chapter 7: Insurance Sector 51
Chapter 8: Payment Systems 55
Annexures 61
Acronyms 91

1
The domestic macroeconomic environment remained sluggish for yet another year as GDP grew by a modest 3.7
percent well below the target of 4.3 percent. Severe energy shortages, challenging economic environment, and law
and order conditions hampered economic activities in the country. However, decrease in inflation to 7.4 percent
during H2FY131 was an achievement thanks largely to stable international food and oil prices. Moreover, the twin
deficits kept on posing challenges to relatively constrained market liquidity and depleting international reserves.
Though, current account deficit was still manageable, the fiscal deficit worsened to 8 percent of GDP against the target
of 4.7 percent leading to crowding-out of private sector lending and limiting economic recovery prospects.
In stark contrast, the financial sector of the country presented somewhat stable outlook, though its risk appetite
remained largely averse and consequently stayed least affected from relatively restrained real sector. The asset base
of the financial sector increased by 4.2 percent during H1-CY13, which also enhanced its share in GDP from 57.5
percent to 60 percent (Table 1). Improvements in the asset base were broad based as all segments of the financial
sector increased in size. Assets of banks increased largely on account of healthy build up in deposits that translated
into further accumulation of Government securities, with some increase coming from settlement of circular debt in
June-July, 2013. Further, with high fiscal needs and drying external inflows such as loans and grants, the domestic
debt in form of National Savings instruments issued by the CDNS posted major increase as banks provided households
and businesses an alternate avenue for savings at reasonably higher returns. Similarly, the insurance sector thrived as
its asset base augmented due to improved life insurance business during the period. The growth in assets of NBFIs
came at the back of healthy increase in the NAV of the mutual funds.
Banking Sector, which is the backbone of the financial sector due to its immense share and strong forward and
backward linkages with the rest of the sector, witnessed a 3.9 percent increase in its asset base. The modest growth
was contributed by an expansion in deposits by 6.2 percent which also helped banks to retire loans in the interbank
1 Inflation stood at 9.7 percent as of December 31, 2012.
Financial Stability Overview
CY06 CY07 CY08 CY09 CY10 CY11 H1CY12 H2CY12 H1CY13
Assets (PKR Billion) 6,028 7,117 7,712 8,867 9,655 11,107 11,818 13,181 13,739
Growth rate (Percent) 14.5 19.4 8.4 15.0 8.9 15.0 6.5 11.5 4.2
MFIs 0.2 0.2 0.2 0.2 0.2 0.2 0.3 0.3 0.4
NBFIs 7.8 8.0 7.6 5.3 4.4 4.7 5.2 4.2 4.2
Insurance 4.1 4.6 4.4 4.4 4.4 4.3 4.3 4.3 4.5
CDNS 16.1 14.6 14.8 16.6 17.3 17.2 17.0 17.2 17.4
Banks 71.9 72.7 73.0 73.5 73.8 73.6 73.2 74.0 73.4
MFIs 0.1 0.1 0.1 0.1 0.1 0.1 0.2 0.2 0.3
NBFIs 5.7 6.0 5.1 3.4 2.6 2.7 3.0 2.4 2.5
Insurance 3.0 3.4 3.0 2.8 2.6 2.5 2.5 2.5 2.7
CDNS 11.8 11.0 9.9 10.7 10.2 9.9 9.7 9.9 10.5
Banks 53.4 54.7 49.0 47.3 43.3 42.2 41.9 42.6 44.0
Overall assets 74.0 75.2 67.2 64.4 58.8 57.4 57.2 57.5 60.0
Percent of Total Assets
Assets as Percent of GDP
Table 1: Assets Composition of the Financial Sector

2
market and repo borrowings from the central bank. With an increase in financing to public sector enterprises (PSEs)
and growing fiscal needs of the Government, the public sector exposure gained further weight on banks’ balance sheet
to reach 44.5 percent of the total credit extended. This, while limiting the availability of funds to private sector also
compromised the financial intermediation function as reflected in further decline in Advances to Deposit Ratio (ADR)
to 48.1 percent during H1-CY13.
The advances to private sector, which remained quite subdued during the last few years, further declined by 2.4
percent resulting in 0.5 percent dip in overall lending portfolio. A host of factors contributed to this decrease viz:
deceleration of credit demand from sugar sector due to the Government purchases of sugar and exceptional growth in
sugar export2, seasonal net-retirement by textile sector3, repayments by the energy sector subsequent to settlement of
circular debt, and banks’ cautious approach in extending fresh advances due to high credit risk, in addition to lower
credit demand in the wake of challenging business conditions. Given the concentration of majority assets in top 5
banks, the bulk of retirements remained confined to these banks.
The seasonal credit for financing public sector commodity procurement operations was the only prominent flow
during the year. The commodity finance, with an increase of 7.2 percent, saw a new peak in H1-CY13 as wheat
financing increased by 26 percent due to increase in support price4. As highlighted in the earlier FSRs, this self-
liquidating financing is on the rise and a key source of concentration in banks’ balance sheet. Non-payment of the
piling up subsidies is the major issue, which accounted for 37.6 percent of the total outstanding finance, in addition to
stock losses due to multiple reasons5 and increase in administrative prices of wheat. Given the importance of
commodity procurement, it is imperative to address the above issues, particularly its liquidation mechanism needs
reconsideration to mitigate risks arising from its continuous growth and concentration on banks’ balance sheets.
Another area of concern has been the increasing concentration of loans in few economic sectors, particularly in
“Production & Transmission of Energy Sector (PTES)”. Historically, the textile sector is the key user of the advances;
however, over the last few years and more specifically during CY12, banks’ credit exposure in PTES increased
significantly and touched 12.3 percent of the gross loan portfolio. However, government settled inter corporate
circular debt in June-July, 2013, which led to net retirement of PKR 50 billion in PTES and decreased its share in
advances to 10.6 percent during the period under review. Although settlement of circular debt is expected to improve
energy supply in the short term, resolution of the structural issues is necessary from long term perspective that will
create financing space for banks to enhance private sector credit.
The asset quality of banks’ portfolio marginally deteriorated as NPL to loan ratio increased by 26 bps to 14.8 percent
during the first half of CY13. With phasing out of Forced Sale Value (FSV) benefit and significant downgrades in
infected portfolio, the provisioning requirements also increased. Nonetheless, banks maintained provisions of almost
104 percent of the required level largely due to general reserve created by banks for consumer finance portfolio6.
Similarly, an increase in specific provisions improved provision coverage ratio to 73.2 percent in H1-CY13 compared
to 71.5 percent in H2-CY12. Higher provisions also reduced the Net NPL to loan ratio to 4.4 percent and with an
2
SBP third Quarterly Report – CY13. 3The amount of retirements during H1-CY13 was lower than in H1-CY12.
4 In Sep-12 support price for wheat was increased from PKR 1050/40kg to PKR 1200/40kg. 5 Annual Report on State of Pakistan’s Economy 2012-13. 6 Total provision exceed the required provisions as bank create general provision under various Prudential Regulations, particularly for the Consumer Finance(CF) portfolio to protect banks from the risks associated with the economic cyclical nature of this business. In terms of regulation R-4 of the Prudential Regulation for CF, banks are required to maintain a general reserve at least equivalent to 1.5 percent of the consumer portfolio which is fully secured and 5 percent of the consumer portfolio which is unsecured.

3
increase in the equity base by 2.3 percent, the risk to capital decreased as capital impairment (Net NPL to Capital)
ratio improved to 18.3 percent.
Importantly, the accumulation of infected portfolio decelerated in recent times. Among various reasons, banks
restructured lending portfolio of promising borrowers affected by economic factors, which lowerd the stock of
infected portfolio. The slowdown positivly impacted the overall infections ratios; the gross infections ratio saw a
steady decline from a peak of 16.7 percent in Sep-11 to 14.8 percent in Jun-13. Provisions coverage ratio also
improved as partially provided for the portfolio moved into fully provided for category. With dampening credit flows,
incidence of NPLs lowered on bank gross income. The provisions charge came down to 7.8 percent of gross income in
Jun-13, which consistently stayed above 10 percent for CY07-CY11 (see Box 2.1).
The overall liquidity profile of the banking sector remained steady during the first half of CY13 on account of healthy
deposit inflows. Further, settlement of circular debt partially in cash and net retirement of private sector loans
improved the funding liquidity of the banks. Consequently, the liquidity indicators continued to remain strong
resulting in an overall stable liquidity position, though fiscal funding need and limited foreign financial flows kept the
government borrowing needs high and market liquidity under stress. Meanwhile, the market risk increased
marginally as a result of accumulation of longer term of PIBs, which increased the interest rate risk of banks. Further,
as equity markets continued on bullish run thereby attracting institutional investors seeking higher returns, banks
increased equity exposures by 14.5 percent. However, the regulatory limits placed by the State Bank on such
exposures kept the equity exposures and related risk quite confined.
Banks had reasonable earning during H1-CY13 (pre-tax amount of PKR 82.1 billion) though 16.7 percent less
compared to the corresponding half year of CY12. Still, the banking sector remained second highest in terms of profit
accumulation among various sectors listed on the equity market. The drop in profits was largely on account of decline
in net mark up income, higher provisioning charge and expensive repo borrowings. The declining interest rate
environment on the one end decreased the returns on KIBOR linked financial products while on the other side
reduced returns on the rising stock of short terms investment in T-Bills. Accordingly, Net Interest Margins (NIM)
lowered by 90 bps to 3.9 percent and ROA dipped by 30 bps to 1.1 percent.
The solvency profile of the banks remained steady as CAR of the banking industry stood at 15.5 percent during the
first half CY13, well above required minima of 10 percent. The buildup of profit and increase in Minimum Capital
Requirements facilitated industry in maintaining such a high CAR. Further, the Leverage Ratio (Tier-1 Capital to total
assets ratio) improved to 4.4 percent due to inhibited growth in the on-balance sheet exposures. The results of stress
test exercise further substantiated resilience of the banking sector, though concentrated exposures to top corporate
borrowers did pose significant risk, which require vigilant monitoring.
The Islamic banking exhibited a stronger growth of 7.9 percent in assets buildup during H1-CY13 outpacing 3.9
percent growth in conventional banking. The share of Islamic banking assets also inched up to 9.0 percent7, while that
of deposits crossed 10 percent mark. Both investment and financing activities facilitated the surge in share of Islamic
banking industry; financing activities increased by 11.2 percent due to doubling of Musharikah financing (sharing
based mode) and healthy growth in long term Ijarah and Diminishing Musharikah (DM) along with Murabah financing
for commodity procurement operations. Meanwhile, the investment grew by 11.2 percent largely confined to Ijara
Sukuks. The asset quality indicators improved marginally on account of higher growth in financing. The liquidity
7 As of December 31, 2012, share of Islamic banking assets and deposits was 8.6 percent and 9.7 percent respectively.
4
management and higher operating and provisioning expenses remained major challenges for the Islamic banks which
also declined the profitability of the Islamic banking by 27 percent over the review period.
The domestic financial markets presented a mixed picture during the period under review. The money market
witnessed frequent episodes of strain on market liquidity due to unpredictable government borrowings. However,
timely liquidity provision by the central and heavy discounting alleviated the market liquidity stress. Similarly, the
foreign exchange market also observed volatility due to drying up of Foreign Exchange (FX) inflows amid unfavorable
Balance of Payment (BOP) situation and declining FX reserves held with the SBP. As a result, the FX market witnessed
increased volatility though prudent interventions by the SBP enabled the PKR/USD exchange rate to depreciate only
modestly by 2.5 percent. Meanwhile, bullish run continued in the equity market as KSE-100 index surged by yet
another 24.2 percent on strong corporate sector profitability, expectations of higher dividend payouts and smooth
political transition after the general elections in May CY13.
The NBFIs also witnessed moderate growth in the asset base at the back of favorable developments in mutual funds
industry. The asset base of NBFIs increased by 4.7 percent to PKR 577 billion of which the Net Asset Value (NAV) of
the mutual funds shared 62.7 percent increase. In addition, the performance of leasing, DFIs and Modarabas also
improved, while Investment Finance Companies (IFCs) continued to face the survival challenge. The mutual funds
thrived at the back of booming equity market funds while NAV of money market funds decelerated. Similarly, the
leasing companies witnessed a 4.1 percent growth in its business mainly in vehicle and machinery leasing activities.
The operating performance of the NBFIs (excluding Mutual Funds) improved significantly during H1-CY13 owing to
prudent expense management and increased profitability to PKR 3.8 billion as against PKR 0.9 billion during last year.
The insurance sector further expanded its asset size and improved penetration during the period under review. The
assets of insurance and reinsurance increased by 8.4 percent with a significant contribution coming from the life
insurance segment. Similarly, the penetration of the sector also improved as it accumulated 16.8 percent higher gross
premiums during H1-CY13. The robust growth in premiums was largely due to rising concerns for security against
financial losses as well as increasing auto finance and personal loans by banks. The life insurance business witnessed
an increase of 17.4 percent in gross premiums, however, rising claims ratio and increased underwriting expenses
contained the growth in its profitability. In contrast, the non life service providers posted substantially higher profits,
due to decline in claims ratio at the back of high reinsurance coverage and capital gains from equity market
investments.
The payment system continued to remain efficient and more reliable while ensuring mitigation of settlement, IT
security and other related risks. Pakistan Real time Interbank Settlement System (PRISM) continued to perform
efficiently in managing high value interbank settlements. Further, with the support from timely Intra-day Liquidity
Facility (ILF) the downtime and gridlocks in the PRISM virtually diminished. Meanwhile in retail payments, the
conventional paper based transaction dominated including cheques and other bank instruments. The e-banking
modes witnessed increased share in retail payments as its share in transaction increased to 22.6 percent in H1-CY13.
Though the payment system performance continued uphill, the high downtime of ATMs pose concern over the
reliability of technology used in the banking sector.

5
The asset base of the banking system observed modest increase of 3.9 percent in the wake of challenging economic
environment, partial settlement of circular debt and moderating reliance on banking sector for funding fiscal deficit. A
decent growth in customer deposits provided for funding needs. Despite decrease in the Government borrowing from the
banking sector, investment in Government papers surged partially due to settlement of circular debt. The flow of
advances subsided due to dampening private sector credit, though public sector enterprises enhanced borrowing to
finance commodity procurement operations in line with established seasonal pattern.
Challenging economic and business conditions and relatively
lower reliance of the Federal Government on the banking sector
during the period under review decelerated the banking sector
growth. The asset base observed a modest growth of 3.9 percent
during H1-CY13 as advances declined while investments in
government securities decelerated (Figure 1.1 and 1.2).
Deposits of the system kept a steady growth pace with
composition somewhat tilted towards Current Account Saving
Account (CASA) deposits (Figure 1.3).
Private sector credit flows subsided….
Advances portfolio declined marginally due to net retirements by
private sector. This decline was contributed by host of factors,
amid, partial settlement of circular debt enabling corporate to
fulfill banks’ obligations, seasonal net retirement in textile credit,
and lower credit off-take in sugar sector. The credit to Small and
Medium Enterprises (SME) remained on the downhill due to
banks’ cautious approach while consumer finance observed some
recovery in some of its segments. Among others, the energy
shortfall and security concerns continued to play dampening
effect on credit demand.
….while banks’ exposure on public sector increased
The public sector exposure continued to gain weight on the
banks’ balance sheet largely for financing the funding needs of
the public sector enterprises and fiscal deficit. During H1-CY13,
banking sector extended 7.2 percent advances for public sector
commodity procurement operations. Moreover, banks also
increased their investments in Government securities by 6.3
percent. As a result, share of public sector credit increased to
44.5 percent of the banking sector assets.
The funding needs were largely financed through 6.2 percent
increase in deposit. Most of this increase took place in customer
Chapter 1 Financial Intermediation
-
4
8
12
16
20
0
200
400
600
800
1,000
1,200
H1 H2 H1 H2 H1 H2 H1
CY10 CY11 CY12 CY13
Change in Assets Asset's growth
Figure 1.1
Changes in Banking Sector Assets
PKR billion Percent
435
221
734 244
(34)
224
188
63 74
189
(100)
100
300
500
700
900
1,100
H2-CY11 H1-CY12 H2-CY12 H1-CY13
Lending to FIs Investments-net Advances-net others
Figure 1.2
Flows in Asset Components (PKR billion)
273
559 498 455 119
(167)
527
(201)-220
-20
180
380
580
780
980
1180
H2-CY11 H1-CY12 H2-CY12 H1-CY13
Deposits Financial Borrowing Equity others
Figure 1.3
Flows in Liability Components(PKR billion)
6
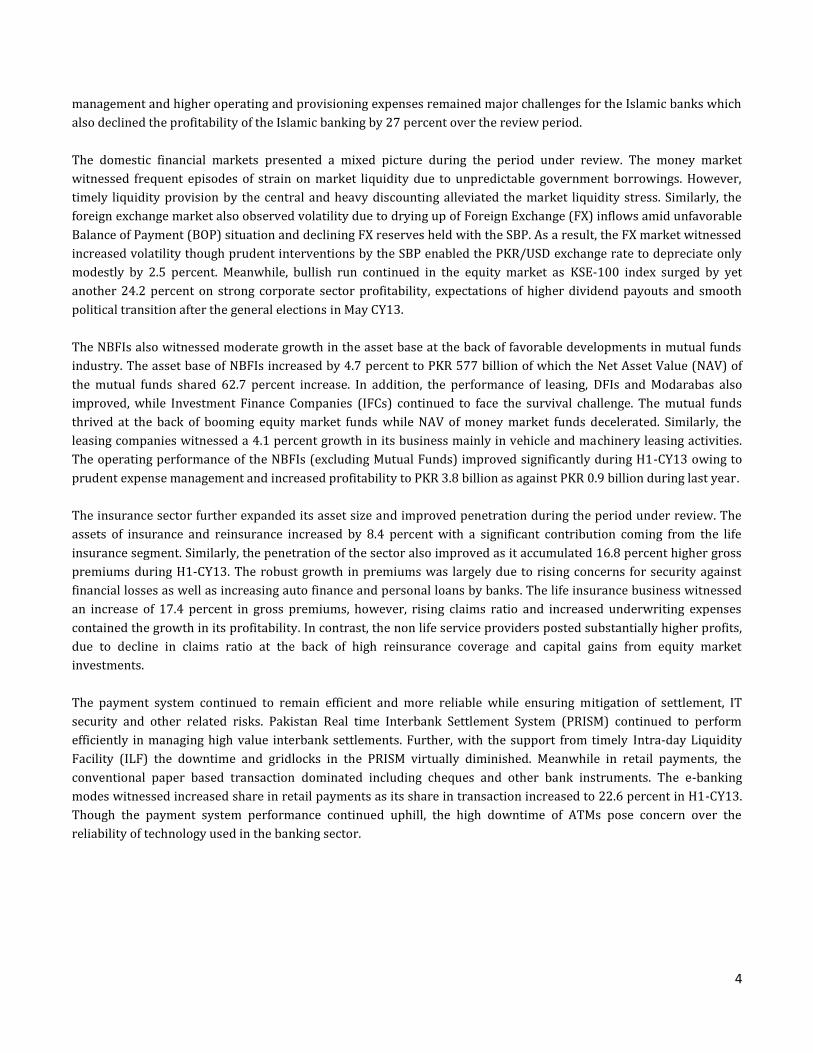
deposits under CASA category, while fixed deposits declined by
1.26 percent. This sluggish trend in fixed deposits seems to be
the result of adjustments made in minimum saving rate8 over the
last year9. The growth in foreign currency deposits remained
very much in line with depreciation in domestic currency, while
remaining within the regulatory limit10. Among other liability
components, borrowings from financial institutions dipped as
banks retired secured borrowings from the central bank, while
equity of the system grew by 2.3 percent due to accumulation of
retained earnings.
ADR is on continuous fall…
Banks’ continued investment in government securities with
slowdown in lending to private sector reshaped the banking
assets in last few years. The tilt of banks’ balance sheet to less
risky assets, given consistent growth in deposit base, well
reflected in declining Advances to Deposit Ratio (ADR) against
almost a parallel rise in Investment to Deposit Ratio (IDR). This
contrasting pattern of ADR and IDR advocates limiting financial
intermediation in the banking system and crowding out of the
private sector credit. Importantly, during H1-CY13, ADR declined
from 50 percent to 48.1 percent (Figure 1.4).
Advances decline as flows to private sector taper ….
The gross advances dipped marginally by 0.5 percent during H1-
CY13 due to decline in credit flows to private sector (Table 1.1).
This decline was contributed by host of factors, like: (a) partial
adjustment of inter-corporate circular debt of PKR 324 billion in
June 2013 that enabled various corporate to retire their
outstanding debt obligations to banks, (b) the deceleration of
demand for credit in sugar sector (specifically in the second
quarter of CY13) due to the government’s purchase of 4.8 million
tons of sugar and exceptional growth in sugar export11, (c) the
seasonal net-retirement in textile sector12; (d) increase in real
cost of borrowing due to decline in inflation; and (e) banks
continued cautious approach in extending fresh advances due to
high credit risk.
8 SBP raised minimum rate on saving deposits to 6 percent p.a. (from previous 5 percent p.a.) in May, 2012 followed by instructions to calculate the rate on monthly average basis effective from April, 2013. 9
The weighted average return on saving deposits of banking sector increased by 20 bps from 6.18 percent on December 2012 to 6.38 percent on
June 2013.Contrary to that, the weighted average return on fixed deposit declined by 61 bps from 7.95 percent on December 2012 to 7.34 percent on June 2013. 10 In terms of Regulation O-5 of the Prudential Regulations for Corporate/Commercial Banking Foreign currency should not at any point exceed twenty percent of the local currency deposits of the banks. 11
SBP third Quarterly Report – 2013. 12The extent of retirements during H1CY13 were lower than H1-CY12.
Table 1.1: Sector-wise Credit Flows in H1-CY13
Public
Sector
Private
Sector
Total
PTES 1.3 (50.9) (49.5)
Sugar 0.6 27.3 27.9
Agri Business 10.2 1.5 11.6
Chemical & Pharmaceuticals (0.0) 0.8 0.8
Financials (0.1) 24.6 24.4
Cement - (4.6) (4.6)
Shoes & Leather - 0.6 0.6
Electronics and Electrical
Appliances
- (3.1) (3.1)
Textile - (18.1) (18.1)
of which -
Spinning - (25.5) (25.5)
Composite - 0.9 0.9
Weaving - (2.5) (2.5)
Others 49.8 (34.7) 15.1
Total 61.7 (83.7) (22.0)
PKR billion
20
30
40
50
60
70
80
Q4
CY
07
Q2
CY
08
Q4
CY
08
Q2
CY
09
Q4
CY
09
Q2
CY
10
Q4
CY
10
Q2
CY
11
Q4
CY
11
Q2
CY
12
Q4
CY
12
Q2
CY
13
ADR IDR
Figure 1.4
Shift in Asset Mix
Percent

7
Bank-wise data of advances showed a skewed distribution, as
overall net-retirement in top-five banks was more than the
decline in credit of entire banking industry (Figure 1.5). The
middle and small sized banks, however, were able to provide
more credit to private sector which is a positive sign. Perhaps,
the declining interest rates on government securities, high cost of
deposits, and moderate credit risk in recent period prompted
these banks to seek high returns through credit expansion.
Structural issues affected demand for credit….
Structural issues particularly lack of adequate energy supply and
security concerns compelled businesses to operate below their
optimal level, which resulted in low credit demand over the
years. Most disbursements merely catered the seasonal and
short-term working capital needs, while, due to underutilized
prevailing production capacity and negligible business
expansion, credit for fixed investment remained nominal. During
H1-CY13, with the exception of commodity finance, most of the
segments generally observed decline (Table 1.2). The credit for
trade finance, however, observed marginal improvement. Owing
to high credit risk and banks cautious approach, the declining
trend in credit outlay to SME sector continued with another
reduction of PKR 32 billion. Consumer financing got momentum
mostly in “personal loans13” and “auto finance” segments.
…as Capital formation yet to pick up…
The decline in fixed investment loans is the reflection of squeeze
in Real Private Investment (RPI) in the economy which, as a
percent of GDP decreased for the fifth consecutive fiscal year to
reach 9.7 percent (Figure 1.6). It is expected that meaningful
efforts to resolve the core issues, amongst others, the energy
crisis and law & order at top, will help kick-start the economic
activities and restore the private sector credit demand.
…and flows to production and transmission of energy
subsided
Another area of concern is increasing concentration of loans in
few economic sectors, particularly in PTES. Historically, the
textile sector is the key user of the advances; however, over last
few years and more specifically during CY12, banks’ credit
exposure in PTES increased significantly and touched 12.3
percent of the gross portfolio. However, government settled inter
corporate circular debt in June-July 2013, which led to net
13 The acceleration in “Personal Loans” segment is not broad based and mostly driven by one bank only.
Table 1.2 Segment-wise credit flows in H1-CY13
Puplic
Sector
Private
Sector
Total
Fixed Investment 5.6 (24.8) (19.3)
Workign Capital 6.1 (107.5) (101.4)
Trade Finance (7.4) 14.5 7.1
Commodity Finance 58.9 (6.3) 52.6
of which - - -
Wheat Finance 64.2 7.8 72.0
Others (0.0) 15.8 15.7
Total 63.1 (108.3) (45.1)
PKR billion
-25
-20
-15
-10
-5
0
5
10
B1
B3
B5
B7
B9
B1
1
B1
3
B1
5
B1
7
B1
9
B2
1
B2
3
B2
5
B2
7
B2
9
B3
1
B3
3
B3
5
B3
7
Figure 1.5
Bank-wise flow of Advances-net in H1-CY13
B stands for Bank and red bars indcates Top-5 large banks
PKR billion
8
9
10
11
12
13
900
960
1020
1080
1140
Real Private Investment (RPI) RPI as % of GDP (R.H.S)
Percent
Real Private Investment and GDP
Figure 1.6
FY09 FY10 FY11 FY12 FY13

8
retirement of PKR 50 billion in PTES and decreased its share in
advances to 10.6 percent during the period under review.
Although settlement of circular debt is expected to improve
energy supply in the short term, addressing structural issues is
necessary from the long term strategy perspective, which will
create financing space for banks to enhance private sector credit
(See Box 1.1).
Commodity financing touched new highs….
As indicated above, the seasonal credit disbursements for public
sector commodity was the only prominent flow during the year.
The self-liquidating commodity finance by public sector saw a
new peak in H1-CY13 (Figure 1.7). Wheat financing (77 percent
share in overall commodity financing) increased by 26 percent,
which largely resulted from increase in support price announced
in Sep-12 from PKR 1050/40 kg to PKR 1200/40kg. Financing to
sugar sector increased as Trading Corporation of Pakistan (TCP)
purchased additional stock in Feb-1314, while financing for
fertilizers reduced owing to seasonal offloading of the fertilizer
stocks15.
Investment in Government papers somewhat decelerated…
The unprecedented and insatiable government funding needs
due to swallowing fiscal overrun16 were mostly met through
schedule banks during the last few years (Table 1.3). Banks’
investment in government papers remained high due to a
number of benefits, i.e., zero credit risk, no capital charge on
domestic sovereign debt, consistent stream of income with
improving NIM, pilling up Statutory Liquidity Requirement (SLR)
eligible securities. On the contrary, fewer funds were available to
finance private sector activities. This has reshaped the balance
sheet of schedule banks. The share of banks’ investment in
government securities to total assets increased to 37 percent in
Jun-13 from 14 percent in June-2008.
The H1-CY13 was not an exception where banks invested
another PKR 219 billion in government securities. The
decomposed data of such investments depicts more buying of
Pakistan Investment Bonds (PIBs) than Market Treasury Bills
14 The TCP commodity financing stock was PKR 50 billion in Mar-13 which, due to TCP’s offloading of the sugar stock reduced to PKR 45 billion in Jun-13 and further reduced to PKR 40 billion in Sep-13. 15 The seasonal peak of fertilizer financing usually comes at the end quarter of CY due to imports of the fertilizer by the government to ensure its availability for harvesting of Rabi crops (mainly wheat). 16 Several factors contributed to large fiscal deficient during last few years including insignificant growth in tax collection, dried up and uncertain foreign inflows, general subsidies especially on electricity, and losses incurred on several PSEs.
H2
CY11
H1
CY12
H2
CY12
H1
CY13
MTBs 321 27 604 87
PIBs 198 38 138 109
Others 118 (7) 42 23
Total Govt. Securities 637 59 784 219
Total Investments 435 222 736 250
Investment in Govt. Securities
to Total Investment (Percent) 147% 26% 106% 88%
Table 1.3: Flow of Banks' Investment in Govt. Securities
PKR billion
0
2
4
6
8
10
12
14
16
0
200
400
600
800
1000
1200
CY07 CY08 CY09 CY10 CY11 CY12
Dep Worker Rem (R.H.S)
USD billionPKR billion
Figure 1.9
Workers' Remittances and Banking Deposits-cumulative Flows
302 271
355 289
363
43
22
36
41
45
-
50
100
150
200
250
300
350
400
450
500
H1CY11 H2CY11 H1CY12 H2CY12 H1CY13
Wheat Sugar Fertilizer Others
Figure 1.7
Public Sector Commodity Finance Break-up
PKR billion
-40
60
160
260
360
460
560
H1-CY11 H2-CY11 H1-CY12 H2-CY12 H1-CY13
Fixed Saving CA -R CA - NR
Figure 1.8
Deposits-Half Yearly FlowsPKR billion

9
(MTBs). This was, perhaps, due to banks’ expectation of interest
rate decline in line with phased reduction in SBP’s policy rate as
well as less government desire to finance its deficit through
short-term funds to avoid frequent roll-overs.
Deposits catered the funding needs of the system..
The overall deposit base posted a steady growth of 6.23 percent
(PKR 455 billion) entirely contributed by customer deposits
(PKR 497 billion) while financial institutions’ deposits declined
by 13 percent (PKR 42 billion). The composition of the customer
deposits reveals some contrasting pattern (Figure 1.8). For
example, while CASA deposits growth was higher than the
overall deposit growth, fixed deposits after observing a
decelerated growth pattern in last couple of years actually
declined by 1.3 percent (PKR 26 billion) in H1-CY13.
The high CASA deposits growth in recent years may be attributed
to multiple factors; (a) SBP enhanced ceiling of minimum rate on
saving deposits to 6 percent in April 2012 which was further
reinforced with the instructions to calculate the rate on monthly
average balance17
which increased real returns on saving
deposits (b) banks concerted efforts to mobilize additional
deposits for gaining reasonable risk free returns through
investing in government securities18, and (c) robust monthly flow
of home remittances etc (Figure 1.9).
Fixed deposits saw a significant fall since SBP raised minimum
rate on saving deposits. Noticeably, funds raised through
National Savings Scheme (NSS) (the nearest substitute of fixed
deposits) remained on rise. The mirror imaged growth pattern
between fixed and saving deposits along with consistent and
growing stream of funds raised under NSS probably shows some
degree of substitution of fixed deposits to either more liquid
saving deposits or higher yielding NSS instruments (Figure
1.10).
However, despite overall decline in the fixed deposits, maturity-
wise flow data reveals growth in short tenor fixed deposits (with
maturity of 6 months or less) while long-term fixed deposits
observed a sharp decline (Figure 1.11). Banks seems to have
focused on managing cost of funds through short term and
transactional deposits (current and saving) to minimize the
impact of increase in minimum saving rate.
17 It was observed that a large number of banks were paying minimum prescribed rate on saving deposits on minimum monthly balance. SBP vide its BPRD’s circular No.1 dated March 15, 2013 instructed to pay minimum 6 percent rate on monthly average balance to safeguard the depositors’ interest. 18
Most of funds were invested in MTBs of shorter maturities (3, 6, and 12 months) than the fixed deposits.
-70
-50
-30
-10
10
30
50
Less than 6 Months 6 Months to 5 Years
Over 5 years
Figure 1.11
Maturity-wise flows in Fixed Deposits during H1CY13
PKR billion
(30)
(10)
10
30
50
70
90
110
B1
B3
B5
B7
B9
B1
1
B1
3
B1
5
B1
7
B1
9
B2
1
B2
3
B2
5
B2
7
B2
9
B3
1
B3
3
B3
5
B3
7
Figure 1.12
Bank-wise distribution of Depsoit Flows in H1CY13
B stands for bank and Red bars shows Top-5 large banks
0%
5%
10%
15%
20%
25%
30%
35%
40%
45%
Q3
CY
08
Q4
CY
08
Q1
CY
09
Q2
CY
09
Q3
CY
09
Q4
CY
09
Q1
CY
10
Q2
CY
10
Q3
CY
10
Q4
CY
10
Q1
CY
11
Q2
CY
11
Q3
CY
11
Q4
CY
11
Q1
CY
12
Q2
CY
12
Q3
CY
12
Q4
CY
12
Q1
CY
13
Q2
CY
13
FD as % of Custumer Dep SD as % of Customer Dep
Figure 1.10
Substitution between Fixed and Saving Deposits
SBP enhanced minimum rate on Saving Deposits to 6% in April 2012 followed by instructions to calculate it on average monthly basis in Mar-13

10
The deposit growth seemed mostly confined to large banks.
Especially, top five banks with 54 percent share in assets of
banking system contributed 69 percent in overall deposit growth
of banking system. Some medium and small sized banks
observed decline in their deposit base (Figure 1.12).
Size-wise deposit details exhibit some unsynchronized deposit
contribution in growth compared to share. Deposit size within
the range of PKR 1-10 million holding only 17.9 percent share in
deposit base contributed 37 percent to deposit growth. In
contrast, the contributions from other size-wise deposit
segments were lesser than their respective shares in overall
deposit base (Figure 1.13). This unparallel growth contribution
may be due to migration of deposits within the size segments
along with new deposits.
Bank borrowings shrink as investment in government
securities decelerated…
Banks made net retirement of PKR 201 billion against
borrowings from the financial institutions during H1-CY13
mostly from the SBP (Figure 1.14). The decline resulted due to
improved liquidity profile of the banks owing to steady deposit
growth, settlement of circular debt including cash in June CY13,
net retirements in private sector loans and moderation in
Federal Government reliance on bank borrowings.
Weekly data19 show that financial borrowings remained below
weekly average of Jan-June, 2013 during Q2-CY13. In the initial
months of H1-CY13, SBP injected liquidity into the market to
ease the liquidity pressures and smoothen the functioning of
payment system. However, SBP reduced such injections in the
second quarter owing to several factors like (a) to curtail
medium term inflation anticipation and (b) to support the
depreciating PKR through return on PKR20.
Equity base of the banking sector grew moderately by 2.3
percent (3.1 percent in H1-CY12) at the back of retained earnings
for H1-CY13. The slower growth seems to be an outcome of
dividend payouts announced in the Annual General Meetings for
the year CY13 and lower return earned by banks during the
period under review.
19 Since borrowing from financial institutions is transitory in nature, a more frequent data (such as weekly) gives a better picture of trend of flow of funds. 20 See Monetary Policy Statement – September 2013.
0%
5%
10%
15%
20%
25%
30%
35%
40%
Up to 0.1 Mln 0.1 Mln to 1 Mln
1 Mln to 10 Mln
Abvoe 10 Mln
Growth Share in Deposits
Figure 1.13
Bank-wise distribution of Depsoit Flows in H1-CY13
(460)
(320)
(180)
(40)
100
240
380
520
H1CY12 H2CY12 H1CY13
Repo Borrowing - SBP Repo Borrowing - Banks
Other Borrowings
Figure 1.14
Borrowing Compositoin - Flow in H1-CY13PKR billion

11
Adjustment of Inter-Corporate Circular Debt in Energy Sector
The deficient energy supplies, kept the businesses operate far below their optimal level since long, which resulted in low credit
demand for long-term funds. Most of the credit during last few years was disbursed for seasonal and short-term working capital
needs, while flow of credit for fixed investment remained sluggish. The credit demand remained stagnant despite decline in the
Weighted Average Lending Rate (WALR) by more than 400 bps due to
slashing of SBP policy rate by 500 bps over the period Dec CY10 – Jun
CY14. This is clearly indicative of the fact that cost of borrowing has not
been the primary issue behind low credit demand. Rather a number of
other issues stymied the private sector credit flows including persistent
energy crisis.
The rising inter-corporate circular debt is one key offshoot of persistent
and severe energy crisis that led to high concentration of bank lending to
PTES. The trend of financing reveal that share of banks’ advances to PTES
grew from 7.2 percent in Sep-08 to 12.3 percent in Mar-13 to reach PKR
512 billion (Figure B1.1).
The Government in order to resolve energy sector related issues settled
inter corporate circular debt in June-July, 2013. The total debt outstanding
was PKR 502 billion as of end May CY13, of which, PKR 342 billion was
adjusted in end-June CY131. The settlement was carried out through a mix
of cash payments, PIBs, and adjustment of dividends to be received by
Government on account of its shareholding in PTES (Table B1.1).
As a result of above adjustments, the PTES advances declined by PKR 69
billion to PKR 443 billion in Jun-13. Consequently, concentration of banks’
gross exposure in the PTES also dropped to 10.6 percent in Jun-13 from
12.3 percent in Mar-13 with most of the retirement observed in large
private sector banks.
Although the settlement of circular debt is a positive development and is expected to improve energy supply, yet this may be
considered only a short-term remedial measure. Incidentally, similar measures were taken in CY11 and CY12. However, higher
customers’ default rate and other structural weaknesses continued to pile up the circular debt. These structural issues revolved
around a highly inefficient transmission and distribution system, high generation cost, electricity theft, subsidies, etc. To
circumvent build up of further circular debt and to avoid concentration of this financing on banks’ balance sheets, the Government
needs to take concerted efforts for improving the overall distribution and collection mechanism2, which will create financing
space for banks and enable them to enhance credit to the private sector.
1 In July 2013, PKR 138.2 billion of circular debt was adjusted through settlement of payables against receivables of the power generation companies. The rest of PKR 23 billion (out of PKR 502 billion) of circular debt was withheld due to cases filed by IPPs in the Supreme Court. 2 The Government of Pakistan formulated a much awaited National Energy Policy (2013-18) in July 2013 which aims at brining several
improvements, including phasing out of subsidies, privatization of state owned power plants and DISCOs, lowering cost of power generation,
restructuring of various related institutions and ministries, and formation of regional transmission and power trading system.
Box 1.1
PKR billion
Cash IPPs 161.23
PIB OGDCL 56.31
PIB PPL 23.36
PSO 81.33
of which
CASH 33.21
PIBs 48.12Adjustment for receivable dividends
by GOP 19.71
Total 341.96
* As of end Jun-CY13
Table B1.1: Adjustment of Inter-Corporate Circular Debt in Energy Sector*
7%
8%
9%
10%
11%
12%
13%
Q3
CY
13
Q4
CY
08
Q1
CY
09
Q2
CY
09
Q3
CY
09
Q4
CY
09
Q1
CY
10
Q2
CY
10
Q3
CY
10
Q4
CY
10
Q1
CY
11
Q2
CY
11
Q3
CY
11
Q4
CY
11
Q1
CY
12
Q2
CY
12
Q3
CY
12
Q4
CY
12
Q1
CY
13
Q2
CY
13
Figugure B1.1
Share of Banks' advances in PTESpercent

12
Asset quality of the banking sector marginally deteriorated during H1-CY13. A slight increase in NPLs coupled with a
meager decline in lending portfolio increased the infection ratios, though provisions coverage and capital impairment
ratios improved. Fund based liquidity profile of the banking sector remained steady; though, market liquidity remained
under pressure which kept the interbank lending rates closer to the ceiling of the interest rate corridor. With decrease in
borrowings, consistent growth in deposits became the sole supporter of the fund based liquidity. Market risk profile of the
banking system stayed well contained despite uncertainties in the local economic environment and continuing stress in
the external position
Credit Risk
Persistent increasing trend in seasonal commodity financing,
significant retirement of energy sector loans, recoveries against
NPLs, and some growth in the consumer segment were the
hallmarks of H1-CY13 (Figure 2.1). The sector continued to
witness stagnancy in private credit flows accompanied by a high
stock of infected portfolio that rose marginally during the review
period.
Credit Risk Weighted Assets (CRWA) declined…
The CRWA decreased by 0.4 percent during H1-CY13 against 3.7
percent increase in corresponding period last year. This decline
in CRWAs was attributable to 2.4 percent dip in fund based
exposure on private sector (Figure 2.2). The off balance sheet
assets, however, grew by 3.5 percent, thus increasing the off
balance sheet CRWA by 6.1 percent. Within off balance sheet
assets, 8.9 percent rise in contingent liabilities was the main
contributing factor towards the growth.
Mix of factors contributed towards nominal rise in infection
ratio…
The asset quality observed marginal deterioration as NPLs
increased by 1.5 percent to PKR 616 billion during the first half
of CY13 (3 percent decline YoY). This coupled with a meager
decline in loans, increased the infection ratio by 26 bps to 14.8
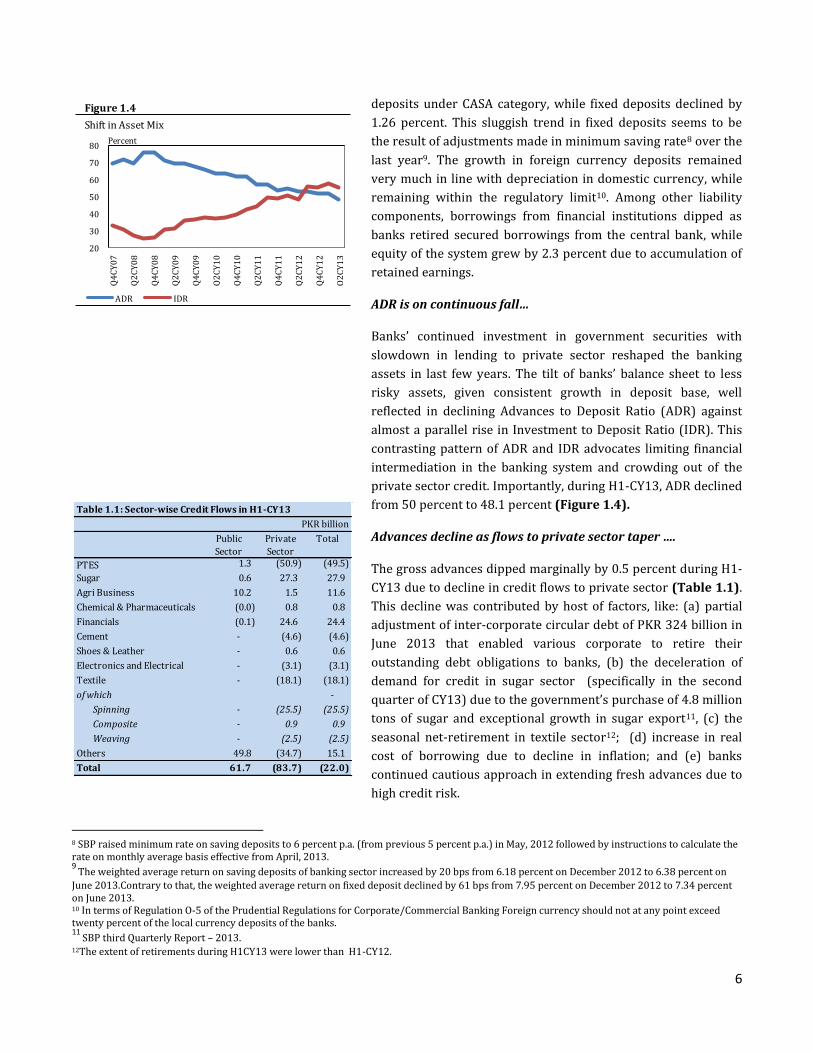
percent (Figure 2.3). Analysis of sources of NPL flows highlight
that recoveries made during H1-CY13 were slightly on the lower
side (1 percent less than H1-CY12), which contributed to minor
rise in NPLs (Figure 2.4).
The accumulation of infected portfolio, receded in recent periods
(Figure 2.5). The slowdown positively impacted the overall
infections ratios; the gross (net) infections ratio saw a steady
decline from a peak of 16.7 (6.4) percent in Sep-11 to 14.8 (4.4)
Chapter 2 Risk Analysis of the Banking Sector
-150
0
150
300
450
600
750
H2-CY11 H1-CY12 H2-CY12
Advances (Public) Advances (Private)
Investments (Public) Investments (Private)
Figure 2.1
Public & Private Sector Credit Flows
PKR billion
-150
0
150
300
450
600
750
H1CY12 H2CY12 H1CY13
Advances (Public) Advances (Private)
Investments (Public) Investments (Private)
Figure 2.1
Public & Private Sector Credit Flows (PKR billion)
-60
-30
0
30
60
90
120
150
H1CY11 H2CY11 H1CY12 H2CY12 H1CY13
CRWA - On Balance Sheet CRWA - Off Balance Sheet
Figure 2.2
Flows in Credit Risk Weighted Assets (CRWA)
PKR billion
0
5
10
15
20
0
100
200
300
400
500
600
700
H1CY11 H2CY11 H1CY12 H2CY12 H1CY13
NPLs Net NPLs
NPLs to Loans (RHS) Net NPLs to Net Loans (RHS)
PKR billion
Figure 2.3Non Performing Loans
percent
13
percent in Jun-13. Provisions coverage ratio also improved as
partially provided for NPLs migrated to fully provided for
category21. With dampening credit flows, incidence of NPLs
lowered on bank gross income. The provisions charge came
down to 7.8 percent of gross income in Jun-13, which
consistently stayed above 10 percent during CY07-CY11 (see
Box 2.1).
Over the last few years, in an effort to resolve NPLs, banks
successfully restructured loan portfolio particularly the
corporate borrowers. This approach facilitated banks in
restricting flow of NPLs, while ensuring that the viable corporate
remained operational. In line with trend in H2-CY12, a significant
amount of NPLs were rescheduled/ restructured by banks during
H1-CY13, which helped in reducing the rate of growth of NPLs
(Figure 2.6).
Moreover, a look at flows in different classification categories
reveals that majority of these rescheduled/ restructured loans
belonged to the Doubtful loans category, as the remaining three
categories exhibited positive flows during H1-CY13 (Figure 2.7).
Interestingly, Other Assets Especially Mentioned (OAEM)
category showed rise mainly resulting from Agriculture sector,
where seasonal factor as well as some other contingent factors
like excessive rain and declaration of certain areas as calamity,
played its part.
Provisioning requirements rose as FSV benefit started
wearing out…
While NPLs slightly rose, required level of provisions
significantly increased due to shifts within different categories of
classification and wearing out of the FSV benefit. Banks kept the
provisions to around 104 percent of the required level largely
due to general reserve created by banks for consumer finance
portfolio22. Increase in specific provisions, improved the
provision coverage to 73.2 percent23 in H1-CY13 compared to
71.5 percent in H2-CY12. Consequently, net infection reduced by
20 bps to 4.4 percent, while capital impairment represented by
21 In terms of R-8 of Prudential Regulations for Corporate, NPLs are classified in to three categories namely Sub-standard (overdue by 90 days, 25% provisions required), Doubtful (overdue by 180 days, 50% provisions required), and Loss (overdue by one year or more, 100% provisions required). 22 Total provision exceed the required provisions as bank create general provision under various Prudential regulations, particularly for the Consumer Finance(CF) portfolio to protect banks from the risks associated with the economic cyclical nature of this business. In terms of regulation R-4 of the Prudential Regulation for CF, banks are required to maintain a general reserve at least equivalent to 1.5% of the consumer portfolio which is fully secured and 5% of the consumer portfolio which is unsecured. 23 It is the highest level of coverage ratio since H1-CY10.
(2.5)
-
2.5
5.0
7.5
-30
0
30
60
90
H1CY11 H2CY11 H1CY12 H2CY12 H1CY13Recovery Against NPLs Flow in NPLs
Recovery to Average NPLs (RHS)
Figure 2.4
Recovery to Flow of NPLsPKR billion percent
(5)
-
5
10
15
20
25
200
300
400
500
600
700
Q4
CY
08
Q1
CY
09
Q2
CY
09
Q3
CY
09
Q4
CY
09
Q1
CY
10
Q2
CY
10
Q3
CY
10
Q4
CY
10
Q1
CY
11
Q2
CY
11
Q3
CY
11
Q4
CY
11
Q1
CY
12
Q2
CY
12
Q3
CY
12
Q4
CY
12
Q1
CY
13
Q2
CY
13
NPLs Growth (QoQ) (RHS)
PKR billion
Figure 2.5
Growth in NPLs (QoQ)
Percent
-
100
200
300
400
500
600
700
0
10
20
30
40
50
60
70
H1
CY
08
H2
CY
08
H1
CY
09
H2
CY
09
H1
CY
10
H2
CY
10
H1
CY
11
H2
CY
11
H1
CY
12
H2
CY
12
H1
CY
13
Flow of Restructured Loans NPLs (RHS)
Figure 2.6
NPLs and Restructured Portfolio (PKR billion)
-15
0
15
30
H2CY11 H1CY12 H2CY12 H1CY13
OAEM Sub-standard Doubtful Loss
Figure 2.7
Category-wise Flow of NPLs (PKR billion)

14
Net NPLs to capital ratio, decreased by 107 bps to 18.3 percent
(Figure 2.8).
Infection rose across the board …
During H1-CY13, the gross infection ratio increased for all
categories of banks, except Foreign Banks (FBs). In case of Local
Private Banks (LPBs), increase in NPLs of both public and private
sector manufacturing concerns was the main reason behind this
rise in infection. In terms of asset size, majority of the banks
exhibited worsening of the infection ratios. However, medium
sized banks ranked from 6 to 10 showed considerable decline in
their infected portfolios as they improved recoveries from some
of their corporate borrowers (Table 2.1).
Textile and PTE sectors exhibited high concentration…
Owing to seasonal pattern of cotton and sugarcane products,
finance to textile and sugar sectors exhibited growth in Q4-CY12
and Q1-CY13 respectively, while second and third quarters of
CY13 observed a decline in lending activities (Figure 2.9). In line
with the established pattern, outstanding exposure of the textile
industry declined by 2.5 percent, as compared to 7.1 percent
decrease in H1-CY12. However, being the largest sector in the
industry, concentration concerns further intensified as its
classified portfolio increased to 30.7 percent in H1-CY13,
compared to 29.6 percent in H2-CY12. Though concentration
concerns in the PTES remained significant, infection ratio of the
sector worsened mainly in private sector as classified loans piled
up (Figure 2.10).
SME portfolio plunged again…
With the overall inhibited activity in advances, SME portfolio also
followed suit and recorded 11.7 percent decrease thus reducing
its share in total outstanding loans of the banking industry to 5.8
percent (6.6 percent in H2-CY12). The textile and sugar sector,
which have direct linkages with or represent some of the SMEs,
made net retirements. Consequently, demand for credit from the
SMEs also subsided and NPLs of the sector increased. As a result,
the infection rate in the SME sector that was already the highest
further increased by 230 bps to 36.9 percent (Figure 2.11).
0
10
20
30
40
50
60
70
80
0
100
200
300
400
500
600
700
CY11 H1CY12 CY12 H1CY13
Provision required Provisions heldNPLs Provisions to NPLs (RHS)Net NPLs to capital (RHS)
Figure 2.8
Provisions against NPLsPKR billion percent
in percent
CY12
Infection
Ratio
Infection
Ratio
Net
Infection
Ratio
Provision
Coverage
Net
NPLs to
Capital
PSCBs 16.9 17.1 6.7 65.2 31.0
LPBs 13.3 13.5 3.3 77.8 13.7
FBs 13.4 11.3 0.5 95.9 0.7
CBs 14.1 14.3 4.1 74.5 16.7
SBs 27.6 30.7 17.2 53.2 100.1
All banks 14.5 14.8 4.4 73.2 18.3
Table 2.1: Asset Quality by Bank Category
H1CY13
-75
-50
-25
0
25
50
75
Textile Energy Sugar Cement Agribusiness
Q3CY12 Q4CY12 Q1CY13 Q2CY13
Figure 2.9
Credit Flows (PKR billion)
0
10
20
30
40
50
0
50
100
150
200
250
300
350
Q2
CY
07
Q4
CY
07
Q2
CY
08
Q4
CY
08
Q2
CY
09
Q4
CY
09
Q2
CY
10
Q4
CY
10
Q2
CY
11
Q4
CY
11
Q2
CY
12
Q4
CY
12
Q2
CY
13
Energy sector loans-public Energy sector loans-privateEnergy sector NPLs-public Energy sector NPLs-private
Figure 2.10
Energy sector growth and NPLs (PKR billion)
(Private sector only)
CY12 H1CY13 CY12 H1CY13
Credit cards 9.25 8.35 21.52 16.41
Auto loans 18.12 19.50 10.26 8.56
Consumer durable 0.05 0.04 71.65 68.34
Mortgage loans 21.17 19.76 31.38 31.10
Other personal loans 51.40 52.35 13.50 12.13
Total 100.00 100.00 17.47 15.56
Table 2.2: NPL Ratio of Consumer Financing
Share Infection Ratio
in percent

15
…while growth in consumer segment hinted at a probable
revival
In contrast to the overall shrinkage in lending portfolio,
consumer finance exhibited gradual improvement. During the
period under review, consumer finance increased by 4.9 percent
to PKR 262 billion. Analysis of various categories shows that auto
and personal loans were mainly responsible for this growth
(Table 2.2). With growth in consumer portfolio and decline in
NPLs, the overall infection ratio reduced to 15.56 percent.
24 Regulation 8 –“Classification and Provisioning” of the Prudential Regulation for Corporate Commercial/Banking 25 BSD Circular Letter No. 03 dated the 22nd January, 2013 URL: http://www.sbp.org.pk/bsrvd/2013/CL3.htm
Asset Quality
The asset quality of the banking industry significantly deteriorated over the last decade owing to constrained socio-political conditions and subdued economic growth. A multitude of factors influenced the growth of infected portfolio of banks including deceleration in GDP, continuing power shortages, security concerns, devastation caused by unusually high floods and torrential rains in 2010 and 2011, and slow pace of decision making in NPLs under litigation (Figure B1). Consequently, non-performing loans (NPLs) surged from PKR 218 billion in CY07 to a peak of PKR 635 billion in Jun-12. However, NPLs declined in recent times as they stood at PKR 616 billion in Jun-13. The decline in NPLs can be attributed to a number of reasons including the following:
Since flow of credit remained subdued over the last few years, banks focused on managing the existing loan portfolio, which allowed them to limit the flow of fresh NPLs.
State Bank rationalized its regulations through enhancing the FSV benefit on collateral held against the NPLs. An obvious outcome was lower provisions charge against the classified portfolio, leading to relatively improved earnings. However, while allowing this benefit, SBP placed bar on use of FSV benefit for dividend payouts24.
In order to streamline and standardize disclosures of Islamic Banks/Islamic Banking Branches, all Financings, Advances, Inventories and any other related item(s) pertaining to Islamic modes of financing, previously reported under „Other Assets‟ were allowed to be reported as a part of the „Islamic Financings and Related Assets‟. These changes in disclosure provided one time enhancement in volume of financing of Islamic banks and dip in infection ratios25.
Owing to multiple issues faced by the large corporate groups, banks pursued restructuring of promising borrowers. Successful restructuring of loan portfolio of such groups helped in restricting flow of NPLs, while ensuring that the viable corporate remained operational.
During the last few years, banks remained focused on recovery of infected loans, which helped them in consistently improving cash recoveries against NPLs. Some banks adopted new and innovative strategies for recovery of NPLs which allowed them to clean up infected portfolio from their books, without incurring material losses (Figure B2).
Box 2.1
0
5
10
15
20
25
30
35
40
0
100
200
300
400
H2CY10 H1CY11 H2CY11 H1CY12 H2CY12 H1CY13
NPLs Loans
NPLR (RHS) Share in Total Loans (RHS)
Figure 2.11
Trends in SME FinancingpercentPKR billion
0
1
2
3
4
5
6
7
8
9
10
0
5
10
15
20
25
CY
01
CY
02
CY
03
CY
04
CY
05
CY
06
CY
07
CY
08
CY
09
CY
10
CY
11
CY
12
H1C
Y13
NPL to Loan ratio GDP growth(RHS)
Figure B1
Trend in GDP growth and NPL to loan ratio (percent)
-60
-40
-20
0
20
40
60
80
Q2
CY
09
Q3
CY
09
Q4
CY
09
Q1
CY
10
Q2
CY
10
Q3
CY
10
Q4
CY
10
Q1
CY
11
Q2
CY
11
Q3
CY
11
Q4
CY
11
Q1
CY
12
Q2
CY
12
Q3
CY
12
Q4
CY
12
Q1
CY
13
Q2
CY
13
Inflows Cash Recovery against NPLsRestructured / Rescheduled loans Amount written off against NPLsNPLs upgraded other reduction in NPLs
PKR billion
Figure B2
NPLs Inflows and Outflows

16
Liquidity Risk
The liquidity profile of the banking sector remained steady
during the first half of CY13 as banks further added to the stock
of risk free government securities. With increased reliance of the
Government on SBP for meeting its fiscal needs and subduing
flows to the private sector, banks made net-retirement of
secured borrowings from the SBP, while a decent deposits
growth provided for most of its funding needs. However,
liquidity strain in the market due to depleting foreign exchange
reserves and unpredictable behavior of Government borrowings
kept the overnight repo rate close to upper bound of interest rate
corridor. Despite constrained market liquidity, rising fund based
liquidity improved the liquidity indicators of the banking sector
in the period under review.
Market liquidity: SBP gradually reduced its influence in the
market…
During the period under review, SBP took various measures
including narrowing down of interest rate corridor by 50 bps
with the objective of managing exchange rate stability and
controlling excess money supply. While these measures
facilitated in limiting exchange rate depreciation, other objective
remained unfulfilled due to heavy budgetary borrowings. In the
meantime, gradual decline in Open Market Operations (OMOs),
led banks to recourse to interbank market for meeting short term
liquidity needs particularly in the second quarter of the CY1326.
Together, these factors resulted in pushing the overnight rates
towards the ceiling of the corridor and on some instances even
crossing it during H1-CY13 (Figure 2.12 & 2.13). Higher
overnight rates meant that during H1-CY13, banks did not utilize
SBP’s discount window as often as they did in H2-CY12.
Since market liquidity continued to remain strained during H1-
CY13, banks persisted with their liquidity preference through
placement of most of the securities into Available for Sale (AFS)
category of investments. Banking sector registered a modest 6.1
percent increase in their investments in MTBs and PIBs (29.5
percent in H2-CY12), as Government was not able to raise the
targeted amount in its auctions during H1-CY13. Given the
unchanged liquidity preference of banks for managing market
liquidity, most of these additional investments were placed in
26 Please see Section 4.1 of Chapter 4 of Annual Report 2012-2013 (State of the Economy).
-
100
200
300
400
500
600
700
0
1,000
2,000
3,000
4,000
5,000
6,000
7,000
8,000
9,000
Q3CY12 Q4CY12 Q1CY13 Q2CY13
Repo Borrowings Net OMOs (RHS)
Figure 2.13
Open Market Operations & Repo Borrowings(PKR billion)
-2
-1
0
1
2
0
2
4
6
8
10
12
Lpremium (RHS) RepoCall Policy CeilingPolicy Floor
Figure 2.12
Trends in O/N rates and Liquidity Premium (percent)
Q2CY12 Q3CY12 Q4CY12 Q1CY13 Q2CY13
0
1000
2000
3000
4000
H1CY11 H2CY11 H1CY12 H2CY12 H1CY13
Available for Sale Held for Trading Held to Maturity
Figure 2.14
Government Securities by category
PKR billion
10.90.7
78.6
3.6
8.76.1
7.61.5
81.4
3.0
8.54.0
Borrowing-Secured
Borrowing-Unsecured
Deposits-customers
Deposits-FIs
Equity
other liabilities
Figure 2.15
Funding structure (in percent)
H2CY12
H1CY13

17
AFS category. In terms of share, 93 percent of MTBs and 73
percent of PIBs were placed in AFS category as of end Jun-13
(Figure 2.14).
Deposits continued to be the mainstay of fund based liquidity
With a growth of 6.3 percent in H1-CY13 (7.2 percent in H2-
CY12), deposits proved to be the sole contributor towards
managing funding requirements (Figure 2.15). With 18.7
percent decline in borrowings further substantiated reliance of
the banking sector on deposits during H1-CY13. Maturity profile
of the deposits indicated that deposits maturing within one
month increased, while the ones having maturity between one
month and one year declined (Figure 2.16). Significant growth
in current deposits (13.7 percent) and decline in fixed deposits
(1.3 percent) was the reason behind this phenomenon.
Moreover, long-term deposits (maturity greater than one year)
registered a rise during the period under review coinciding with
the consistent growth in savings deposits (8.3 percent in H1-
CY13). As highlighted in chapter 1, the tilt in trend toward CASA
was apparently an outcome of strategic marketing efforts of the
banks for increasing non-remunerative low cost deposits
pursuant to increase in minimum saving rate27.
Continuous investment in short-term securities coupled with
substantial growth in CASA deposits resulted in considerable
improvement in up to 3 months maturity gap during H1-CY13
(Figure 2.17). Although lower than H2-CY12, 3 months to 1 year
maturity GAP remained comfortable during H1-CY13 owing to
growing investment in short-term Government securities of up to
12 months maturity. On the other hand, lack of long-term
financing and growth in long-term deposits kept the maturity
gap negative in over 1 year bucket during the period under
review.
Fund based liquidity indicators remained steady…
As mentioned earlier, constrained liquidity conditions led to
higher amount of interbank lending, which together with growth
in Government securities, helped in improving the liquid assets
during H1-CY13 (Figure 2.18). However, the steady increase in
liquid assets was slightly overshadowed by the higher growth in
deposits during H1-CY13, thus resulting in a decline of 71 bps in
27 SBP decided that the minimum profit rate would be 6.0% p.a. on all Pak Rupee saving deposits with effect from May 01, 2012 vide BPRD Circular No. 1 of 2012.
-
500
1,000
1,500
2,000
2,500
3,000
H1CY12 H2CY12 H1CY13
Up to 1m 1m to 3m 3m to 1 yr 1 yr to 5 yrs Over 5 yrs
Figure 2.16
Maturity Profile of Deposits (PKR billlion)
-5 0 5 10
Up to 3m
3m to 1 yr
1 yr to 5 yrs
Over 5 yrs
H1CY13 CY12
Figure 2.17
Maturity Gap (Assets-Liabilities) as percent of Assets
0
10
20
30
40
50
CY09 CY10 H1CY11 CY11 H1CY12 CY12 H1CY13
Government securities Cash & Balances Balances With Other Banks Interbank lending
Figure 2.18
Liquid Assets percent)
20
30
40
50
60
30
40
50
60
70
CY09 CY10 H1CY11 CY11 H1CY12 CY12 H1CY13
Advances to Deposits (ADR) Liquid assets to Deposits
Currency to Deposits (CDR) Liquid assets to Total Assets
Figure 2.19
Liquidity Indicators (percent)

18
liquid assets to deposits ratio which stood at 63.7 percent. Given
the significant decline in borrowings, the liquid assets as a
percentage of total assets rose by 59 bps to 49.0 percent during
the period under review (Figure 2.19). Despite continued
growth in deposits, surplus liquidity maintained by banks
remained more than double the level of SLR of 24 percent
(Figure 2.20). With decline in private sector credit, growth in
deposits further pushed down the ADR by 4.1 percentage points
to 48.1 percent-lowest almost in decade.
Uncovered Liability Ratio (ULR), which measures liquidity
shortage at an institutional level, improved due to ample liquid
assets. Similarly, Liquidity Risk Indicator (LRI), which takes into
account short-term liquidity gap calculated for 30-day time
horizon, also signified lower funding risk due to growing
investment in Government securities. Both of these indicators
further substantiated comfortable funding liquidity position of
banks (Figure 2.21).
Over the last few years, the currency to deposits ratio (CDR) has
exhibited a seasonal trend with a slight drop of 52 bps in Jun
CY13 to 26.3 percent during H1-CY13. The steady growth in
deposits, coupled with the reduction in SBP’s market
interventions led to the aforementioned dip in CDR, which
explained the market liquidity constraints faced by the banking
sector during H1-CY13.
Banks would stand resilient towards various liquidity shocks
Banking sector would remain resilient in the face of different
liquidity shocks. The results of stress tests on the banking sector
reaffirms that system is satisfactorily placed to withstand
liquidity shocks under different stress scenarios28. For instance,
severe liquidity shocks of significant deposit withdrawal for
consecutive five days would have negligible effect on the short-
term liquidity of the banks. Further, the liquidity coverage ratio
(LCR) of the banking system29, remained well above the
acceptable benchmark of 1, as defined under Basel III.
28 For number of banks failing stress scenarios, see Annexure 1.15 29 The Liquidity Coverage Ratio will require banks to have sufficient high quality liquid assets to survive a significant stress scenario lasting 30 calendar days.
24%
34%
44%
54%
64%
-
1,000
2,000
3,000
4,000
Liquidity maintainedRequired LiquidityLiquidity maintained to T&D Liabilities
Figure 2.20
Surplus liquidity of banking system
PKR billion percent
Q2CY12 Q3CY12 Q4CY12 Q1CY13 Q2CY13
(70)
(60)
(50)
(40)
(30)
(20)
(10)
--
20
40
60
80
100
Q2CY11 Q4CY11 Q2CY12 Q4CY12 Q2CY13
Uncovered Liability Ratio-ULR (RHS)
Liquidity Risk Indicator (LRI)
Figure 2.21
Funding Liquidity Risk Indicators (percent)

19
Market Risk
Market risk in the banking system remained manageable during
H1-CY13 despite difficult economic environment and continuous
strain in the external position. The increase in market risk was
reflected by the increase in share of Market Risk Weighted Assets
(MRWA)30 to 8.5 percent (7 percent in H2-CY12) of the overall
risk portfolio (Figure 2.22). Despite a rise in market risk
exposures, SBP’s prudent policies pertaining to limits on foreign
exchange, equity exposures, and interest rate positions, were
largely responsible for keeping the market risk under check.
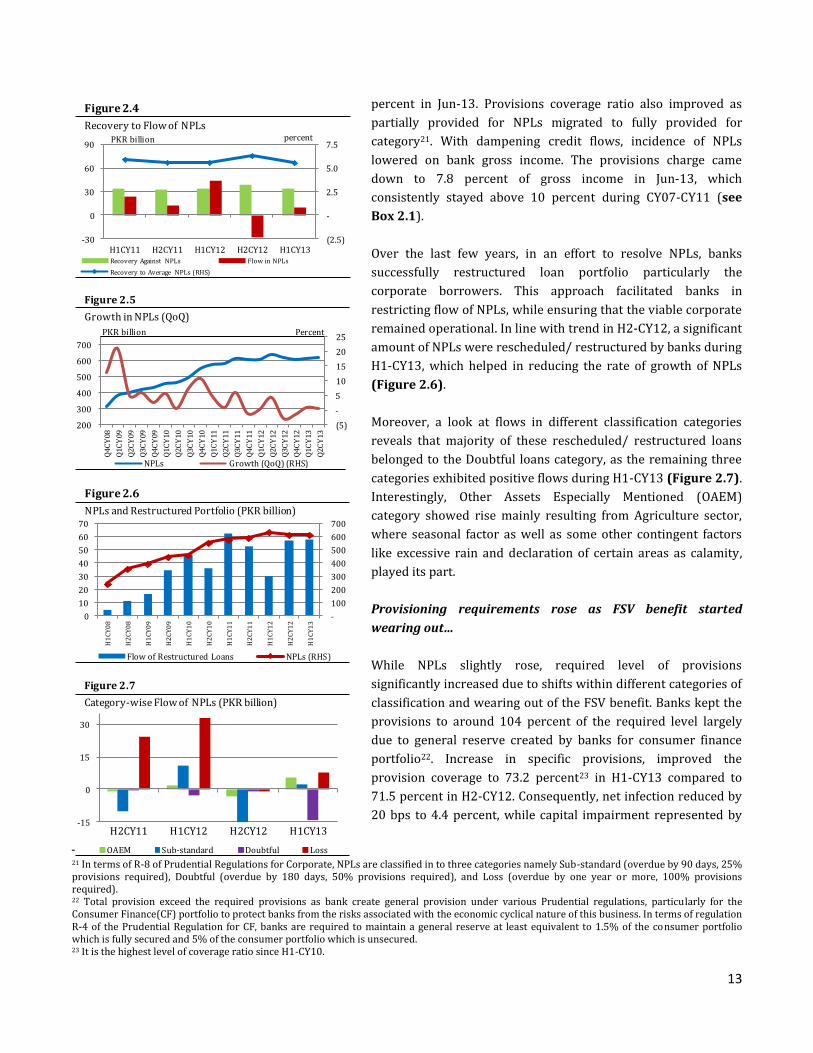
Low policy rate further steepened the yield curve
After reducing the policy discount rate by 2.5 percent during H2-
CY12, SBP maintained the rate at 9.5 percent till the mid of Jun
CY13, when it was further cut down by 50 bps. Several factors
such as decline in inflation rate, lackluster growth in credit to
private sector, and lower GDP growth were the reasons behind
keeping the policy rates low (Figure 2.23). Consequently, with
the increased expectation of further policy rate change, coupled
with higher government borrowings from SBP, the overnight
rates kept hovering around the ceiling of the interest rate
corridor, though they stayed less volatile during H1-CY13 as
compared to H2-CY12.
Following the trend of previous half-year, the yield curve further
shifted downwards, with more pronounced dip over the short-
term to medium-term horizon during H1-CY13 (Figure 2.24).
The 6-month Pakistan Revaluation Rates (PKRV) dropped by 28
basis points as against a drop of 55 basis points in 10 years PKRV
yield, thus steepening the yield curve over the medium to long
term. Consequently, the term spread between 6-month and 10Y
PKRV yields decreased from 230 basis points in Dec CY12 to 203
basis points in Jun CY13 (Figure 2.25).
Net budgetary borrowing shifted from banking system to SBP
In the wake of persistent fiscal pressures, budgetary borrowing
continued to remain high in H1-CY13. However, the focus of
government borrowings shifted from banks to SBP. As a result,
banks’ investments in government papers decelerated in H1-
CY13 compared to H2-CY12 (Figure 2.26). Given the low policy
discount rate and constrained liquidity conditions, banks
30 Risk weighted assets (RWAs) calculated based on Pillar I of Basel II Capital Accord.
77.7
7.1
15.1
CRWA, 76.5
MRWA, 8.5
ORWA, 15.0
CY12
H1CY13
Figure 2.22
Risk Weighted Assets (in percent)
0.0
0.2
0.4
0.6
0.8
1.0
1.2
8
9
10
11
12
13
Policy Rates6M PKRV6M PKRV Volatility over 6M (RHS)
Figure 2.23
6M PKRV & Policy Rates and Volitility percent volatility
Q2CY12 Q3CY12 Q4CY12 Q1CY13 Q2CY13
8.0
9.0
10.0
11.0
12.0
13.0
14.0
3M 6M 1Y 2Y 3Y 5Y 10Y 15Y 20Y 30Y
H2CY11 H1CY12 H2CY12 H1CY13
Figure 2.24
Yield Curves
0
50
100
150
200
250
300
Figure 2.25
Term Spreads: 10Y vs 6M PKRV Ratesbasis points
Q2CY12 Q3CY12 Q4CY12 Q1CY13 Q2CY13

20
continued to prefer AFS category for placing the major portion of
their investments ensuring flexibility in managing short term
liquidity needs. Similar to H2-CY12 (surplus of PKR 22.3 billion)
this preference helped banks in earning surplus of PKR 27.1
billion during H1-CY13.
Positive re-pricing gaps, though within limits, may raise
interest rate risk under an increasing interest rate scenario….
During H1-CY13, the re-pricing gap between the rate sensitive
assets (RSA) and rate sensitive liabilities (RSL) continued to
remain well within tolerable limit of +/- 10 percent (Figure
2.27). Not only that the gap reduced compared to H2-CY12, it
also remained positive for the entire portfolio, which meant that
the interest rate exposures of the banking system stayed within
manageable limits. However, the positive gap across all maturity
buckets mainly driven by fixed income securities, may pose
revaluation risk under an increasing interest rate scenario.
KSE outperformed, bank’s exposures stayed contained despite
buoyant equity market
Following the trend of CY12, KSE index reached all time high
during H1-CY13, posting 24.3 percent gain over H2-CY12 to cross
21,000 levels (16,905 as of end CY12). The index experienced a
steep rise towards the end of the half year, which increased the
volatility in the stock indices (Figure 2.28). Much of this rise
coincided with the elections as market positive expectations
surged due to smooth political transition. In line with the
increased activity in the stock exchange, equity exposure of
banks rose by 14.5 percent during H1-CY13. In addition, strong
performance of the equity market allowed banks to book healthy
gains on sale of quoted shares. However, regulatory limit31
imposed on investment in equities ensured that the overall
exposure of banks remained well contained, i.e., only 1.5 percent
of total assets and 17.1 percent of the capital (Figure 2.29).
Rupee continued to depreciate though the Rupee-dollar
volatility stayed lower
During H1-CY13, PKR posted a relatively stable outlook with a
modest depreciation of 2.04 percent as compared to a
depreciation of 2.65 percent in H2-CY12 (Figure 2.30). The PKR
31 In terms of Regulation R-6 of the Prudential Regulations for Corporate/Commercial banking, “the total investments of banks in shares should not exceed 20% of their own equity.”
0
500
1000
1500
2000
2500
3000
3500
4000
4500
5000
H1CY11 CY11 H1CY12 CY12 H1CY13
Govt. Sec Shares Bonds & TFCs Others
Figure 2.26
Break-up of InvestmentsPKR billion
-5 0 5 10 15
upto 3m
3m to 6m
6m to 1y
1y to 5y
Over 5y
H1CY13 CY12
Figure 2.27
Gap (RSA-RSL) to Asset Ratio percent
0.00
0.05
0.10
0.15
0.20
0.25
0.30
0.35
0.40
10,000
12,000
14,000
16,000
18,000
20,000
22,000
24,000
KSE 100 Daily Volitility of Returns over 6M
Figure 2.28
KSE 100 Index and VolitilityvolatalityIndex
Q2CY12 Q3CY12 Q4CY12 Q1CY13 Q2CY13
0
1000
2000
3000
4000
5000
H1CY11 CY11 H1CY12 CY12 H1CY13
Listed Shares Capital RWA
Figure 2.29
Stock Market Exposure of Banking Sector PKR billion

21
came under pressure in the interbank and Kerb markets and
touched all-time low of 99.1 in Jun CY13; however, the volatility
in the exchange rate remained lower than the previous half year.
Low policy rate, mounting public debt, and current account
deficit were the factors contributing towards depreciation of
PKR. Moreover, the excessive demand and supply mismatches
driven by uncertain foreign flows and negative sentiments
prevailing in the market negatively affected the exchange rate
parity.
Foreign currency positions largely remained short, though
well contained
Owing to the higher foreign currency payments compared to
inflows, the overall Net Open Position (NOP) of the banking
system remained on the shorter side with declining volatility
during H1-CY13. Though, the depreciating value of local currency
exposes the banks to currency risk especially when they are
running net short positions, the exposures were well within
manageable bounds of around 2 percent of the bank’s capital
(Figure 2.31).
0.00
0.02
0.04
0.06
0.08
0.10
0.12
0.14
0.16
0.18
0.20
92
93
94
95
96
97
98
99
100
PKR/USD Daily Volitility over 6M (RHS)
Figure 2.30
Evolution of PKR/USD Exchange Ratesexchange rate
Q2CY12 Q3CY12 Q4CY12 Q1CY13 Q2CY13
-200
-150
-100
-50
0
50
100
150
200
NOP of All banks 1D Volatility over 6M
Figure 2.31
NOP of All Banks (USD million)
Q2CY12 Q3CY12 Q4CY12 Q1CY13 Q2CY13

22
The banking sector continued to post reasonable profits; though at a slower pace, due to higher provisions charge and
shrinking interest margins. The solvency of the system improved further due to increase in capital base; Capital Adequacy
Ratio stood well above the minimum benchmark, while a few banks find it challenging to comply with capital
requirements. With strong capital position, the banking sector is expected to remain resilient to various stress scenarios;
however, credit concentration remains the key risk factor that needs continuous vigilance.
Earnings deteriorated due to squeezing interest margins …
Profitability of the banking sector declined by 16.5 percent
during H1-CY13 compared to the first half of CY12, largely due to
higher provisions charge against the classified portfolio, increase
in cost of borrowings and a decline in returns on lending
activities. Nevertheless, the banking sector with a profit of PKR
82.1 billion remained the second best performing sector32 among
the various sectors of the economy33. The earning indicators of
ROA and ROE also declined by 70bps and 640bps to 1.7 percent
and 18.5 percent respectively (Figure 3.1).
Analysis of concentration in profitability showed top five banks
lead in most of the earnings indicators followed by top 6-10
banks (Table 3.1). The share of large 5 banks in total
profitability enhanced to 74.2 percent against 70.9 percent in
corresponding period last year. The higher concentration mainly
resulted from increase in loss making banks that provided for
higher provisions against infected portfolio during H1-CY13
(Figure 3.2).
The declining interest rates along with increase in borrowing
cost squeezed the interest margins over the last couple of years.
Net Interest Margin (NIM) of the banking sector maintained this
downward trend during H1-CY13 as it decreased to 3.9 percent
against 4.8 percent in H1-CY12 (Figure 3.3).
32 The Oil and Gas sector was the largest in terms of profitability. During H1-CY13, the Profits before tax of the sector were in excess of PKR 250 billion. 33 See Table 5.2 for sector-wise profitability.
Chapter 3 Profitability, Soundness and Resilience
0
5
10
15
20
25
30
40
60
80
100
120
140
160
180
200
H1 H2 H1 H2 H1 H2 H1 H2 H1 H2 H1
CY08 CY09 CY10 CY11 CY12 CY13
Profits (pre-tax) ROA ROE
Figure 3.1
Trends in Bank Profitability
PAT(PKR billion) ROA, ROE ( Percent)
H1CY13 Share ROA ROE AU PM NIM
Top 5 74.2 2.5 23.6 9.8 25.1 4.2
Top 6 to 10 21.1 1.7 23.9 9.0 18.6 3.4
Top 11 to 20 1.6 0.1 1.9 9.4 1.6 3.3
Top 21 to 30 3.1 0.8 7.0 8.8 9.1 4.1
Public Sector 14.6 1.3 13.3 9.2 14.1 3.2
Local Private 78.9 1.7 20.1 9.2 18.5 3.9
Foreign 2.8 1.9 11.2 7.9 23.7 4.7
Specialized 3.7 3.8 40.2 13.3 28.3 8.3
All Banks 100.0 1.7 18.6 9.5 18.0 3.9
Table 3.1: Concentration of Earnings (percent share)
8
25
1
2
2
10
22
3
2
1
0 5 10 15 20 25 30
[-10, 0]
[0, 5]
[5, 10]
[10, 15]
[15, 20]
[-10, 0]
[0, 5]
[5, 10]
[10, 15]
[15, 20]
H1
CY
12
H1
CY
13
Figure 3.2
Loss Making Banks Increase Range in PKR billion
No. of Banks

23
Declining returns on loans and increasing repo expenses
reduced the NII.
During the first half CY13, the banks’ Net Interest Income (NII)
declined by 18.4 percent (YoY) due to reduction in markup
income on loans and advances (Figure 3.4). This decrease was
no surprise given 300 bps cumulative decline in policy rate over
the period July-12 to June-13, which impacted the returns on
KIBOR linked earning assets. Meanwhile, an increase in volume
based earnings on investments mostly in government securities
curtailed the decline in the markup / interest earnings to just 1.1
percent (YoY).
In addition, the mark up expense increased by 1.4 percent (YoY)
on account of heavy repo borrowings from the SBP. The level of
borrowings almost doubled that led to an increase in overall
expense. Interestingly, expense on deposits decreased by 1.3
percent (YoY) despite an increase in minimum saving rate (MSR)
over the year. Analysis of the issue highlighted that cost of
deposits decelerated over the last few years. It declined to 7
percent in Jun-13 from 8.1 percent a year ago. Further, the share
of deposit cost in overall mark-up/interest expense reduced to
80.4 percent in Jun-13 from 82.6 percent in Jun-12.
Minimum saving rate policy curtailed decline in WADR ….
The trend of Weighted Average Lending Rate (WALR) and
Weighted Average Deposit Rate (WADR) was quite synchronized
with the SBP policy rate. Against the policy rate decline of 5
percentage points over Jun-11 to Jun-13, the WALR declined by
3.96 percentage points to 10.80 percent. The WADR also declined
by 2.15 percentage points to 4.72 percent in Jun-13, which was
relatively lower than the decrease in lending rates, a possible
outcome of lifting up the minimum saving rate (Figure 3.5).
In addition to decline in interest income, increase in provisioning
charge also dented the earnings of the banking system. After a
significant decline in the provisioning and write-offs during H1-
CY12, the provisions increased by 59 percent (YoY) in H1-CY13.
The gradual wearing out of the FSV benefit and flow of fresh
NPLs mainly increased the charge over the period under review
(Figure 3.6).
3.0
3.5
4.0
4.5
5.0
5.5
6.0
H1CY10 H2CY10 H1CY11 H2CY11 H1CY12 H2CY12 H1CY13
Figure 3.3
Net Interest Margin (Percent)
125
130
135
140
145
150
155
160
165
170
175
(250)
(150)
(50)
50
150
250
350
450
H1CY10 H1CY11 H1CY12 H1CY13
Repo expense Deposits expenseRepo income InvestmentsLoans Net Interest Income
Figure 3.4
Trends in Interest Income (PKR billion)
0.0
2.0
4.0
6.0
8.0
10.0
12.0
14.0
16.0
WALR WADR Spread Policy Rate
Figure 3.5
Movement of Deposit, Lending, and Policy Rates
H1CY08 H1CY09 H1CY10 H1CY11 H1CY12 H1CY13
0
5
10
15
20
25
30
35
40
45
H1CY09 H1CY10 H1CY11 H1CY12 H1CY13
Figure 3.6
Provision Charge (PKR billion)

24
Non-mark up income kept earning at reaonable levels….
In sharp contrast to NII, the non-mark up income observed YoY
increase of 6.3 percent during H1-CY13. The growth was largely
supported by improved fee based income and gain on sale of
securities including T-bills, PIBs and listed stocks34 (Figure 3.7).
The fee income, which contributed 43.5 percent towards non-
markup earnings, improved by 14.1 percent. The dividend
income, though a smaller component of non-mark up income
declined by 43.8 percent indicating that banks maintained short-
term interest in the stock market.
Solvency
The capitalization of the banking sector remained well above the
local as well as Basel minima35
, though Capital Adequacy Ratio
(CAR) marginally declined by 10 bps to 15.5 percent during H1-
CY13 (Figure 3.8). The decline in capital adequacy primarily
resulted from dip in retained earnings (Figure 3.9). The leverage
ratio36
stood at a comfortable level, well above the Basel-III
standard of 3 percent. Most banks met the CAR, while some
continued to face challenges in achieving the prescribed
Minimum Capital Requirements (MCR).
Concentration analysis of solvency ratios showed that CAR of top
5 banks remained strong and well above the industry average
(Table 3.2). With healthy profits over the years, banks have been
able to enhance the capital base through internal capital
accumulation that faciliated them in matching increase in RWAs
and keeping the CAR high. The biggest increase in capital was
observed in smaller banks (21-30 bracket). However, due to
growth in MRWAs as well as increase in classified portfolio in
some of these banks witnessed somewhat deteriorated capital
ratios. Moreover, leverage represented by capital to assets ratio
increased due to growth in credit mainly in investment portfolio
during H1-CY13 (Table 3.2).
CRWA decreased slightly…
Given the decline in private sector credit, CRWA witnessed a
decrease of 2.6 percent during H1-CY13. As a result, the share of
CRWA in total RWA dipped to 76.7 percent in H1-CY13 from 78
34 Banks benefited from taking long position in the declining interest rate scenario and therefore gained on the sale of government securities held with them, while improved valuation of the strongly performing stock indices facilitated in booking gain on sale of qouted shares. 35 Banks are required to maintain minimum CAR of 10 percent. 36 The leverage ratio is measured as the ratio of adjusted tier-I capital to adjusted on-balance sheet and off-balance sheet assets
-2
-1
0
1
2
3
4
5
H1-CY12 H2-CY12 H1-CY13
Assigned Capital Reserves Retained earnings
Figure 3.9
Share in growth of equity (percentage points)
-
20
40
60
80
H1CY10 H1CY11 H1CY12 H1CY13Fee Income Dividend Income FX income Net gain on sale of securitiesOthers
Figure 3.7
Non-Mark up Income (PKR billion)
0
2
4
6
8
10
12
14
16
18
-
100
200
300
400
500
600
700
800
900
H1CY10 H2CY10 H1CY11 H2CY11 H1CY12 H2CY12 H1CY13
Tier-II Tier-1
Maintained CAR Required CAR
Figure 3.8
Solvency Profile of the Banks Gets Even Stronger
Capital (PKR billion) CAR percent

25
percent in H2-CY12. A look at the source of the changes show
that most of the increase in on-balance sheet exposure during
H1-CY13 resulted from an increased financing for public sector
commodity procurement operations, which carry zero risk
weight. The claims on most of the other categories either
decreased or remained unchanged, which decreased the overall
risk adjusted claims. Meanwhile credit risk adjusted off-balance
sheet claims inched up due to increase in trade related
contingencies and commitments (Table 3.3).
…while MRWA continued to grow
MRWA witnessed a sizeable growth of 16.6 percent that
enhanced its share in total RWAs by 120 bps to 8.3 percent in
H1-CY13. Among the MRWA, Interest rate risk (IRR) provided for
most of the increase in capital charge due to 17.4 percent
increase in stock of investments in long term-PIBs. With 49.8
percent growth in equity investments of the banks, the
associated capital charge also grew by 40.7 percent, while
foreign currency positions related capital charge rose modestly
by 3.1 percent during the period under review (Figure 3.10).
…whilst the riskiness of banking sector remained subdued…
Given the reduction in CRWA, the overall riskiness of the banking
sector (CRWA assets to average earning assets) continued to
subside. This came as a no surprise as major part of the 10.5
percent expansion in earning assets during H1-CY13 carried low
risk weights. Since CRWA declined by 0.38 percent, share of
CRWA as a percentage of average earning assets declined by 5.3
percentage points in H1-CY13. This trend though favorable in
short run, may compromise risk management capacity of the
banking sector in future (Figure 3.11).
Box B: Market Risk Sensitivity Shocks
IR1: Parallel upward shift in the yield curve - increase in interest
rates by 300 basis points along all the maturities.
IR2: Upward shift coupled with steepening of the yield curve by
increasing the interest rates along 3m, 6m, 1y, 3y, 5y and 10y
maturities equivalent to the maximum quarterly increase
experienced during the last 3 years.
ER3: Appreciation of Pak Rupee exchange rate by 3.2%
EQ1: Fall in general equity prices by 41.4%
EQ2: Fall in general equity prices by 50%.
0
10
20
30
40
50
60
70
Dec-09 Jun-10 Dec-10 Jun-11 Dec-11 Jun-12 Dec-12
CBs PSCBs LPBsFBs All Banks
Figure 3.11
Consistently high Net NPL to Capital Ratio (percent)
H2-
CY12
H1-
CY13
H2-
CY12
H1-
CY13
H2-
CY12
H1-
CY13
Top 5 16.7 16.5 13.8 13.7 10.1 9.9
6 to 10 13.6 13.7 10.7 10.7 6.8 6.9
11 to 20 11.5 11.7 9.8 10.1 8.0 7.7
21 to 30 18.6 16.5 19.1 16.5 12.0 11.8
PSCB 16.7 15.8 13.9 12.7 10.3 9.6
LPB 14.9 15.0 12.4 12.7 8.6 8.5
FB 30.7 26.4 30.5 26.2 16.5 16.3
SB 12.3 13.7 6.8 7.8 8.3 10.5
Industry 15.6 15.5 13.0 13.0 9.1 8.9
Capital to RWA Tier 1 to RWA Capital to Assets
Table 3.2: Bank Category-Wise Solvency Ratios
in percent
Clainms on Original
Exposure
Risk
Adjusted
Amount
RWA to
Original
Exposure
Original
Exposure
Risk
Adjusted
Amount
RWA to
Original
Exposure
GoP 2,432 - - 2,583 - -
PSEs 630 60 9.6 634 58 9.1
Banks 237 90 37.8 207 88 42.6
Corporates (excluding
equity exposures)
2,167 1,784 82.3 2,105 1,767 84.0
Categorized as retail
portfolio
575 376 65.4 549 356 64.8
Past due loans 202 195 96.3 198 194 98.0
Total On Balance
Sheet Exposures
7,763 3,390 43.7 7,920 3,338 42.2
Total Off Balance
Sheet Exposures
3,885 604 15.5 4,022 647 16.1
Table: 3.3: RWAs to Original Exposure
CY12 HCY13
-
50
100
150
200
250
300
350
400
H2CY11 H1CY12 H2CY12 H1CY13
IRR Equity FX Capital charge
Figure 3.10
IRR remained major component of market risk
MRWA in PKR billion

26
Lower riskiness can be also traced into rising level of low risk
weighted assets in the balance sheets of banks. In line with the
large share of public sector investments, share of zero risk
weighted asset reached its highest level of 36.9 percent during
H1-CY13 from 36 percent in H2-CY12. Moreover, share of assets
with risk weight of 20 percent increased to 9.8 percent of total
CRWAs portfolio due to increase in exposure towards entities
with better credit ratings. On the flip side, share of assets
carrying 50 and 100 percent risk weight (usually assigned to the
advances extended to unrated borrowers) continued to decline,
an outcome of slow growth in private sector credit (Figure
3.12).
A higher capital base above the regulatory requirements
provided banks with sufficient cushion against unexpected
idiosyncratic shocks and severe macroeconomic conditions. As a
part of its policy to strengthen common equity base of banks, the
SBP over the period has enhanced the MCR requirements in
gradual manner. The outcome of this approach is obvious in
comfortable CAR of most banks. (Table 3.4). Banks falling short
of minimum CAR represent merely 6.6 percent of total asset of
the industry and as such do not pose any serious concern to the
solvency of the banking sector.
Improved credit quality provided a breathing space for
overall solvency profile of banking system
Solvency risks from changes in credit quality continued to pacify
during period under review, as capital impairment ratio (Net
NPLs to Capital), an indicator of fraction of banks’ equity that
could be impaired by uncovered loan losses, improved
significantly during H1-CY13. Though this improvement was
broad based and observed across all categories of banks, the
most profound impact was observed in LPBs category where the
ratio came down from 15.9 percent in H2-CY12 to 13.7 percent in
H1-CY13 (Figure 3.13).
Banking system leverage remained well within the prescribed
limit
The leverage ratio37 for banking sector of Pakistan continued to
improve at the back of rising equity levels. During H1-CY13, ratio
increased by 24 bps due to inhibited growth in the on-balance
37 Leverage ratio is defined as Tier-I capital as proportion of total assets (adjusted both sides for intangible assets). The inverse of leverage ratio is call leverage multiples. This ratio is not yet applicable in Pakistan.
2.00
2.50
3.00
3.50
4.00
4.50
5.00
Dec-08 Jun-09 Dec-09 Jun-10 Dec-10 Jun-11 Dec-11 Jun-12 Dec-12
Leverage ratio Basel III mean leverage ratio
Figure 3.13Leverage Ratio-percent(Tier-I to total assets)
69.0
64.1 65.0
60.2 58.955.6
53.6
48.3
35
40
45
50
55
60
65
70
75
H2CY09 H1CY10 H2CY10 H1CY11 H2CY11 H1CY12 H2CY12 H1CY13
CRWAs/Average Earning Assets
Figure 3.11
Declining Banking Sector Riskiness (percent)
0
1,000
2,000
3,000
4,000
5,000
6,000
7,000
8,000
9,000
H1CY10 H2CY10 H1CY11 H2CY11 H1CY12 H2CY12 H1CY13
zero 20 35 50 75 100 150
Figure 3.12
Distribution of CRWAs by risk weight(PKR billion)
in percent
Less than 10 10 to 15 over 15 Total
H1CY10 6 15 19 40
H2CY10 5 13 20 38
H1CY11 5 12 21 38
H2CY11 5 10 23 38
H1CY12 5 11 22 38
H2CY12 5 9 24 38
H1CY13 5 11 22 38
Table 3.4: Distribution of Banks by CAR
0
20
40
60
80
100
120
140
H1CY10 H2CY10 H1CY11 H2CY11 H1CY12 H2CY12 H1CY13
All Banks FBs LPBs PSCBs CBs
Figure 3.13
Consistently declining Net NPL to Capital Ratio (percent)

27
sheet exposure relative to Tier-I capital. On aggregate basis,
leverage ratio stood at 4.4 percent in H1-CY13, much higher than
the minimum of 3 percent set by the Basel Committee on Banking
Supervision (Figure 3.14). With a comfortable level of this non-
risk based indicator and potential of growth in the economy,
banking industry enjoys enough buffer to further increase its
leverage in the future (Table 3.5).
Resilience of the banking system
The banking system continued to exhibit resilience to various
shocks under stress due to strong CAR of 15.5 percent. The stress
shocks on the credit, market, liquidity and contagion risk on the
banking sector reaffirms that system is satisfactorily placed to
withstand the stress shocks38. Importantly, all banks with before-
shock CAR of above 13.1%, including top 5 banks of the industry,
would comfortably bear the solvency shocks.
Under sensitivity analysis, the after-shock CAR of the system
would stay strong, though certain shocks to the credit risk
portfolio would have significant impact on the solvency profile of
the banking system. The credit shocks including shock (C-1)
assuming an increase in NPLs equivalent to 10 percent of
performing loans, (C-2) default of top 3 private sector individual
borrowers (fund based exposures only), and (C-3) a shock of
default of top three borrowers (both fund and non-fund based)
would decrease the after-shock CAR of the banking system up to
333 bps (Figure 3.15). Keeping in view their systemic
implication of high concentration of top corporate and group
exposure, banks need close monitoring of such exposures.
Despite considerable rise in MRWA, overall 8.3 percent share
continued to present a subdued market risk profile. As a result,
market risk related sensitivity shocks had minimal effect on the
solvency profile of banks (maximum decline of 85 bps in CAR).
Similarly, analysis of liquidity stress tests, which envisaged
significant withdrawals of deposits and volatile funds, and dip in
value of liquid securities, showed that the ample fund based
liquidity in the system would provide enough cushion to meet
significant withdrawals of deposits and volatile funds. Similarly,
haircut on value of government securities, would marginally
decline the liquidity coverage ratio (LCR) as defined under Basel-
III framework, would stay well above the minimum acceptable
value of LCR of 1.
38 For number of banks failing stress scenarios, see Annexure 1.15
Existing Simulated Cushion
Capital 807 807 -
RWAs 5,222 8,073 2,851
CAR 15.5% 10.0%
Table 3.5: Capital Cushion H1-CY13
amount in billion Rupees, ratio in percent
0.0%
2.0%
4.0%
6.0%
8.0%
10.0%
12.0%
14.0%
16.0%
18.0%C1 (Hp)
C2 (Hp)
C3 (Hp)
C4 (Hp)
C5 (Hp)
C6 (Hs)
C7 (Hs)
C8 (Hs)
C9 (Hs)
C10 (Hs)IR1 (Hp)IR2 (Hs)
IR3 (Hs)
ER1 (Hp)
ER2 (Hp)
ER3 (Hp)
EQ1 (Hs)
EQ2 (Hp)
R1 (Hp)
Comb (Hs)
Comb (Hp)
CAR before Shock
CAR after Shock
Benchmark CAR
Figure 3.15
Impact of Sensitivity Tests on Solvency of the Banking System- June-2013
Hp: Hypothetical
Hs: Historical
CAR in percent
2.50
3.00
3.50
4.00
4.50
5.00
H1CY09 H1CY10 H1CY11 H1CY12 H1CY13
Leverage ratio Basel III Mean leverage ratio
Figure 3.14
Leverage Ratio-percent(Tier-I to total assets)

28
The increase in assets base of Islamic banking continued to outpace the growth in banking sector of Pakistan as share of
Islamic banking reached 9 percent during H1-CY13. In sharp contrast to industry trend, flow of funds for financing
activities outpaced investments. The financing was broad based with major portion extended for long-term investment
under Ijarah and Diminishing Musharakah, while Musharakah financing saw a substantial surge. The assets quality
indicators showed marginal improvement though Non-Performing Financing saw some increase. The earning
performance moderated due to higher provision charge and increasing operating expenses largely incurred on expansion
of outreach. The Capital adequacy with marginal improvements remained steady.
Islamic banking continue gaining weight globally………
Islamic banking has been the major driver of Islamic finance over
the last decade and has started to gain systemic importance. It
expanded at a Compound Average Growth Rate (CAGR) of 19.1
percent during 2007-2012 enhancing the Islamic banking assets
to around USD 1.28 trillion39.
….and so is the case with Islamic banking in Pakistan
Islamic banking in Pakistan continued its expansion in terms of
size and penetration during H1CY13 though at decelerated pace
(Figure 4.1). With 7.9 percent increase in assets, share of Islamic
banking edged up by 40 bps to 9 percent. Though both financing
and investment activities contributed to this growth, the former
not only observed double digit surge but also outpaced
investment activities for second half-year in a row. Investment
activities remained largely confined to investment in
Government Ijara Sukuks. The operating performance of Islamic
Banking Institutions (IBIs) somewhat deteriorated due to higher
provisions charge and soaring operating expenses (Table 4.1).
Deposits continued to provide required funding…
Deposits remained the key funding source for the Islamic
Banking institutions (IBIs). The efforts of IBIs in expanding their
outreach and utilization of the existing branch network remained
the driving force behind the consistent increase in deposit base.
The deposit base of IBI’s increased by 9.1 percent during
H1CY13, financing the essential expansion in Islamic banking
assets. The customer’s deposits at around 95 percent of deposits
provided stabile source of funding (Figure 4.2). The mix of
Mudarbah (saving and term) and Qurd (current) deposit
39 IFSB; Islamic Financial Industry Stability Report, 2014
Chapter 4 Islamic Banking
-
200
400
600
800
1,000
1,200
5
6
7
8
9
10
11
H2CY10 H1CY11 H2CY11 H1CY12 H2CY12 H1CY13
Branch Network (RHS) Share in Assets
Share in Deposits
Figure 4.1
Share and Network of Islamic Banking
precent
Dec-11 Jun-12 Dec-12 Jun-13
All Banks
Jun-13
Total Assets 641 711 837 903 10,090
Investments (net) 274 346 394 439 4,253
Financing (net) 200 197 231 261 3,727
Deposits 521 603 771 771 7,756
precent change
Total Assets 14.4 10.9 17.7 7.9 3.4
Investments (net) 18.6 26.0 14.1 11.3 6.1
Financing (net) 6.2 (1.7) 17.5 12.8 (0.9)
Deposits 15.2 15.6 27.9 9.1 6.2
Table 4.1: Growth of Islamic Banking.
PKR billion

29
respectively at 69 and 26 percent remained in conformity with
past trend and in alignment with overall business conduct of
IBI’s.
Financing remained robust and relatively broad based…
Keeping the pace with development in H2CY12, growth in
financing at 12.8 percent remained ahead of investment growth
of 11.3 percent. As such, share of financing, which was on
downhill for last 5 years40, increased by 123 bps to 29 percent.
Private sector remained the prime user of the funds, with
additional funds channeled to more diverse borrower categories
(Figure 4.3). While public sector, with a mere 11 percent share
of financing, observed surge of 59 percent, largely for financing
the public sector commodity procurement operations.
Corporate sector utilized major part of the flows during H1-CY13
largely for long-term investment and trade financing needs. In
terms of Islamic modes, the period under review observed some
encouraging trends. Musharakah financing (sharing based mode)
observed more than 100 percent increase to Rs 4.4 billion, while
considerable financing under Ijara and Diminishing Musharakah
(DM) was directed towards fixed capital formation. Additionally,
banks ventured into financing commodity procurement
operations under Murabaha financing. Salam financing also
increased by 82 percent for financing trade and agribusiness
related activities (Table 4.2). Fresh financing flows during the
half year catered the financing requirements of textiles, chemical
sector, and production and transmission of energy.
Despite improvements in credit flows, the share of trade related
modes lead the financing landscape of Islamic banking. The
financing under the Murabaha, Dimnishing Musharakah and the
Ijarah composed about 86 percent of financing mix (Figure 4.4).
To encourage the participatory mode of financing, IBI’s needs to
refocus on asset led strategic policy by exploring the sharing
based financing avenues. To this end, regulator is continuously
making efforts for bringing about improvements in shariah
compliance framework and harmonization of industry practices.
During the period under review, SBP issued instruction for
extending facilities in conformity with the various AAOIFI and
shariah standards41.
40 Share of Financing came down from 52 percent in CY08 to 28 percent in CY12. 41 IBD Circulars No.1, 2 and 3 of 2013; see URL; http://www.sbp.org.pk/ibd/2013/index.htm
0
100
200
300
400
500
600
700
800
H1CY11 H2CY11 H1CY12 H2CY12 H1CY13
Fixed Saving Current
PKR billion
Figure 4.2
Customer Deposits
30
32
34
36
38
40
42
44
46
48
H1CY09 H1CY10 H1CY11 H1CY12 H1CY13
Figure 4.3
Private sector borrowers continued to grow ('000)
H1CY12 H2CY12 H1CY13 Growth(%)
Murabaha 75.1 85.4 97.6 14.3
Salam 7.4 7.3 13.4 82.8
Istina 10.8 17.7 15.1 (14.9)
Musharaka 2.4 1.9 4.0 108.6
Car Ijara 9.4 10.9 10.1 (7.7)
Plant and machinery Ijara 6.4 4.8 4.9 2.6
Equipment Ijara 5.7 5.9 6.7 13.0
Others Ijara 1.2 0.6 1.5 149.5
Diminishing Musharaka 74.2 87.1 90.2 3.7
Islamic Export refinance 8.8 11.8 12.6 6.7
Mudarabah 0.2 0.6 0.5 (19.7)
Other Islamic modes 6.7 10.9 18.6 70.9
Total 208.4 244.9 275.2 12.4
Table 4.2: Islamic modes of financing
PKR billion

30
In line with the industry trend, consumer-financing portfolio of
IBIs observed steady increase. This second major user of Islamic
funds witnessed a growth of 10% percent, with most of
disbursement confined to auto-financing and mortgages under
car Ijara and DM modes. Rest of the consumer finance segments,
with minor changes, remained almost static during the half year
(Table 4.3). The share of SME and Agriculture in IBI’s financing
portfolio remained quite meager at about 4 percent, despite
various regulatory measures for promoting SME and agriculture
financing.
..while investments largely confined to Ijrara Sukuk
Over the last few years high fiscal needs of the government along
with subdued credit flow to private sector and steady growth in
deposits allowed IBIs to invest considerable amount of funds in
Government Ijara Sukuks at attractive rates. The trend continued
during the H1CY13, as IBIs added another 12.9 percent Ijarah
Sukuks, increasing their volume to PKR 314.6 billion.
Consequently, liquidity indicators improved further during the
period under review as liquid asset to total asset and liquid asset
to deposit ratio at 47.2 percent & 55.3 percent respectively
reached the corresponding ratios of conventional banking.
However, it also kept the financing to deposit ratio dismally low
at 33.5 percent as against 47.5 percent in conventional banks
(Figure 4.5).
Liquidity management a major challenge for the industry…
Though GoP Ijara Sukuk provides Islamic banks with long-term
liquidity management instruments, development of innovative
Shariah compliant short maturity liquidity management
instrument remains the major challenge. Inherent characteristics
of Islamic modes of financing & deposit structures in wake of
limited supply of the interbank liquidity instruments renders
IBI’s more vulnerable to liquidity risk compared to conventional
banks. The SBP is working on developing such an instrument in
collaboration with the industry. In the meantime, IBIs need to
improve the fund management practices by diversifying the
assets and the corresponding liabilities structures.
Asset quality improved marginally……
The asset quality of the loan portfolio continued to improve
during the period under review though Non-performing
Financing (NPFs) observed some increase. Both NPFs to
financing and Net NPFs to Net Financing declined during H1CY13
as growth in financing outpaced growth in NPFs. Provisions
45%
9%1%
36%
9%
46%
8% 2%
33%
11%
Murabaha, Salam, and Istisna
Ijarah
Musharaka & Mudaraba
DM
Others
CY12
H1CY13
Figure 4.4
Financing Mix (in percent)
H1CY12 H2CY12 H1CY13 Growth(%)
Corporate Sector: 146.5 179.0 192.9 7.8
Fixed Investment 63.7 76.9 82.1 6.7
Working Capital 71.6 89.4 88.8 (0.7)
Trade Finance 11.2 12.6 22.0 74.7
SMEs: 10.8 10.1 10.2 1.2
Fixed Investment 2.9 2.5 3.5 42.4
Working Capital 5.8 6.4 5.3 (16.2)
Trade Finance 2.1 1.2 1.3 8.0
Agriculture 0.1 0.2 0.2 21.6
Consumer Finance: 30.8 32.0 35.1 9.6
Commodity Financing 15.3 17.8 29.7 66.5
Others 4.6 4.5 5.4 19.92
Total 208.2 243.7 273.6 12.3
PKR million
Table 4.3: Segement wise financing
25
30
35
40
45
50
55
60
65
H1CY11 H2CY11 H1CY12 H2CY12 H1CY13 H1CY13
Liquid Asset to Total Assets Liquid Assets to DepositsLoans to Customer Deposits
Figure 4.5
Liquidity Ratios
IBIs All Banks
percent

31
coverage ratio with a marginal dip remained steady at 66.1
percent. Capital at risk (Net NPFs to total Capital) inched up to
12.2 percent due to slow pace of growth in capital, though
remained far below the industry average of 19.4 percent (Table
4.4).
Earning of IBIs moderated somewhat ……..
The profitability of IBIs deteriorated during H1CY13 owing to
persistent rise in the high operating expenses and sharp increase
in the provision expenses. The profit before tax (PBT) witnessed
YoY decline of 27 percent to PKR 4.3 billion. As a result, the ROA
of the IBIs declined to 0.8 percent in H1CY13 compared to 1.4
percent in corresponding period last year (Figure 4.6)
In addtion to four times increase in provisions charge due to
higher NPFs, non-mark-up expense increased by 20 percent
during the period under review. Accordingly operating expense
to income ratio inched up to 71.7 percent. Although escalating
administrative expense raises concerns on efficient operations of
the IBIs, however, robust increase in branch network and related
resources provide the very basis for this surge. As such, we can
expect the efficiency ratios of the industry may remain high for
some years to come. However, soaring provision expenses in lieu
of restrained chunk of finance portfolio suggest serious
operational deficiencies on part of the IBI’s.
The overall CAR of the Islamic Banks42 with minor imporvements
remained unchaged at 15.4 during H1-CY13 (Figure 4.7).
Analysis of components show that eligible capital as well as Risk
weighted assets increased by 2 percent each; increase in capital
resulted from accumulation of retained earnings and increase in
paid up capital post announcement of annual results; while
growth in Risk Weighted Assets came from 50 percent increase
in MRWA. All Islamic Banks maintained CAR well above the
required level, though some of them face challenge in meeting
the MCR of PKR 9 billion.
42 Represent CAR of Islamic banks only.
Table 4.4: Asset Quality
All-Banks
H1CY11 H2CY11 H1CY12 H2CY12 H1CY13 H1CY13
NPF to Financing 7.5 7.6 8.8 7.6 7.1 14.8
Net NPF to Financing 3.2 2.9 3.8 2.7 2.5 4.4
Provisions to NPFs 60.0 63.0 59.5 66.5 66.1 73.2
Net NPFs to Capital 14.3 10.2 13.4 11.1 12.2 19.4
H1CY12 H2CY12 H1CY13 H1CY12 H2CY12 H1CY13
NPF to Financing 11.5 9.2 8.7 4.3 4.3 3.9
Net NPF to Financing 4.4 2.9 2.9 2.8 2.3 1.9
Provisions to NPFs 64.4 70.5 69.2 36.9 48.5 52.3
Net NPFs to Capital 14.6 12.3 14.5 11.0 9.0 8.0
IBs IBBs
IBIs
7.2 12.1 13.9 14.8
1.6
2.6 3.4 3.9
(5.7)(9.0) (11.2) (13.4)(1.7)(0.7)
(0.2)(1.0) 0
0.2
0.4
0.6
0.8
1
1.2
1.4
1.6
1.8
(15)
(10)
(5)
-
5
10
15
20
H1CY10 H1CY11 H1CY12 H1CY13
Provisions Expenses
Non Markup income NII
PBT ROA(PAT) (RHS)
Figure 4.6
IBIs' Earnings and Expenses PKR billion percent
6
8
10
12
14
16
18
20
H1CY11 H2CY11 H1CY12 H2CY12 H1CY13 H1CY13
CAR Tier 1 Capital to RWACapital to Total Assets
Figure 4.7
Solvency Ratios
IBIs All Banks
percent

32
Twin deficits and sluggish macroeconomic performance (except for declining inflation) continued to test the financial markets
during H1-CY13. The money market largely relied on substantial OMO injections by the central bank to maintain sufficient
market liquidity, which remained under stress due to unpredictability of high Government financing needs. Similarly, the
Foreign Exchange market also remained volatile and the market sentiment remained passive as current account turned
negative and the FX reserves held with the central bank continued to decrease. Meanwhile, the bullish sentiments in the equity
market further gained momentum and the index surged by 24.2 percent during the period on account of favorable corporate
earnings, dividend expectations and smooth transition of the political process.
Money Market liquidity and depleting reserves tested
financial markets
Financial markets remained largely resilient against economic
challenges primarily emanating from persistent twin deficits and
non-conducive business conditions (private sector crowding-out,
energy shortages, law and order concerns etc). The markets were
testing during H1-CY13 due to heavy fiscal borrowings, exchange
rate volatility and negative market sentiments in response to
depleting foreign exchange reserves. Despite these adverse
developments, the financial markets exhibited reasonable
performance and continued to provide intermediation to various
economic segments during H1-CY13.
The money market witnessed stress in liquidity due to surge in
the Government funding needs to bridge revenue-expenditure
gap. Similarly, the FX market also remained under pressure as
the current account deficit exacerbated and reserves depleted.
However, the exchange rate (PKR/USD) depreciated by only 2.5
percent during the period. The equity market remained bullish
and the benchmark KSE-100 index further increased to 21,005
points, showing a growth of 24.2 percent during H1-CY13 largely
due to increased corporate profitability in line with the market
expectations and dividend payouts.
The rising Government borrowings further increased the Net
Domestic Assets (NDA) of the banking system by 11.5 percent
(Figure 5.1). A consistent decline in FX reserves owing to
repayment of IMF loans dampened the Net Foreign Assets (NFA)
by 50.9 percent during the period. This further enhanced the
Government financing requirements, most of which were met
through central bank borrowings as the banks’ appetite
relatively subdued on account of unattractive return on
investments and to some extent, due to liquidity strain in the
money market (Figure 5.2).
Chapter 5 Financial Markets
-30
-20
-10
0
10
20
H1CY11 H2CY11 H1CY12 H2CY12 H1CY13
NDA NFA
Figure 5.1
Half-yearly trends in M2 (percent change)
...
- 50
-400
-200
0
200
400
600
800
1000
1200
H1CY11 H2CY11 H1CY12 H2CY12 H1CY13
Commodity operations Banks SBP
Figure 5.2
Pattern of Government Borrowings - Half-Yealy Flows (PKR billion)

33
Money Market
The money market remained relatively under stress despite
various measures taken by SBP including narrowing down of
interest rate corridor by 50 bps43 with the objective of managing
exchange rate stability and controlling excess money supply
(Figure 5.3). The latter objective remained unfulfilled due to
increased reliance of the Government on SBP for managing its
fiscal needs. In the meantime, gradual decline in OMOs, led banks
to recourse to interbank window for meeting short term liquidity
needs particularly in the second quarter of the year44 (Figure
5.4). As a result, the overnight rate – a measure of market
liquidity remained close to the ceiling of the interest rate
corridor during most of the half year.
During H1-CY13, the Government increased borrowings from the
banking system particularly the Central bank as it was not able to
raise required funds from the market participants. The Federal
Government borrowed PKR 665 billion mostly to roll over the
maturing T-bills and increased expenses in the last quarter of the
fiscal year including retirement of circular debt45. Meanwhile, the
banks remained wary of investing in shorter-term securities in
expectation of decline in discount rate. The stock of T-Bills
witnessed deceleration during H1CY13 compared to increasing
trend in last few years, while investment in PIBs grew
substantially particularly in the Apr-Jun quarter due to
settlement of inter-corporate circular debt (Figure 5.5).
Auction profile of Government debt instruments posed mix
picture
The auction of T-bills in general remained dismal until the
announcement of election results in mid of May CY13. The offer
to target ratio which started at 1.88 for first two T-bill auctions in
month of January, 2013 reduced to as low as 0.57 during
February auctions. During the first quarter, the aggregate offer to
target ratio remained 1.38. However, post-election, the bidding
patterns improved and the average offer to target ratio reached
1.5. Overall, the ratio deteriorated from 1.73 in H2-CY12 to 1.25
in H1-CY13 (Figure 5.6). This change in behavior of the market
resulted from unattractive yields on short-term instrument and
unpredictable behavior of government borrowings.
43 The Monetary Policy Statement announced in Feb 2014 narrowed the interest rate corridor (Discount rate – Repo rate) from 300bps to 250bps. 44The banks accessed the discount window 102 times during the second quarter of CY13 as against 57 times in the first quarter. 45 The reduction in circular debt was arranged through a dynamic funding mechanism that included settlement through cash, issuance of PIBs and adjustment for receivable dividends by the incumbent Government.
6
7
8
9
10
11
12
13
Jan
-12
Feb
-12
Mar
-12
Ap
r-1
2
May
-12
Jun
-12
Jul-
12
Au
g-1
2
Sep
-12
Oct
-12
No
v-1
2
Dec
-12
Jan
-13
Feb
-13
Mar
-13
Ap
r-1
3
May
-13
Jun
-13
Repo Floor Cap (Discount Rate)
Figure 5.3
Trend of overnight Repo Rates (percent)
-200
-100
0
100
200
300
400
500
600
700
Q1 Q2 Q3 Q4 Q1 Q2 Q3 Q4 Q1 Q2
CY11 CY12 CY13
Figure 5.4
Outstanding Open Market Operations (PKR billion)
8
9
10
11
12
13
14
0500
100015002000250030003500400045005000
Q1
CY
11
Q2
CY
11
Q3
CY
11
Q4
CY
11
Q1
CY
12
Q2
CY
12
Q3
CY
12
Q4
CY
12
Q1
CY
13
Q2
CY
13
Sukuks PIBs T-Bills3M (RHS) 12M (RHS)
Figure 5.5
Outstanding stock of Government securities
PKR billion Yield (percent)

34
The discount rate remained at 9.5 percent throughout the half
year, before 50 bps cut in the last week of the June, 2013. The
market perceived the rate to remain unchanged and
subsequently, banks offered more in 6-month T-bills during Jan-
Feb CY13. However, as the banks expected an increase in the
discount rate, the 3-month bids offered rose sharply. Later on, as
the inflation rate subsided to 5.1 percent in May CY13 (YoY
basis) and with positive sentiments following the 11th May, 2013
election, the banks perceived the discount rate to decline, which
increased the offers for 12-month T-bills to average 66 percent in
May-Jun CY13 period (Figure 5.7).
Besides, the participation of financial institutions in T-bill
auctions, the Government also provided investment
opportunities to general public and businesses through Non-
Competitive Bids (NCBs). However, following the trend in T-bill
auctions, the NCB acceptance also remained dull during the first
quarter of CY13 and the acceptance ratio declined from 11.7
percent in Dec CY12 to 9.5 percent in Mar CY13 quarter. Though,
the volume of NCBs increased in the second quarter, the higher
acceptance of T-bills further reduced the ratio to 9.3 percent in
Jun CY13 (Figure 5.8). A decline in NCBs can be explained in
terms of higher yields available elsewhere to investors such as
the equity market.
The PIB auctions also witnessed a mix picture during the first
half CY13 as the Government rejected all the offered bids of PKR
70 billion against the target of PKR 75 billion during Q1-CY13 on
account of higher offer rates by the bidders (banks and financial
institutions). Meanwhile, the three auctions that took place in
Q2-CY13 saw very high offerings (offerings of PKR 189 billion
against the target amount of PKR 75 billion and the acceptance of
PKR 87.3 billion). In line with the trend, most of the PIB
subscriptions were predominately of 3-year tenure (Figure 5.9).
The investors remained cautious of investing in longer tenure of
15-30 years on account of maturity mismatches (non-availability
of long-term funding) and also due to high degree of
macroeconomic and geo-political uncertainty involved in long
term placements.
In addition to conventional modes of raising debt, the
Government also borrowed by issuing Ijarah Sukuks. However,
like the conventional debt instruments, PIBs and T-bills, the
auction of Ijarah has also been relatively dull during H1-CY13
(Figure 5.10). A single issue of PKR 43 billion was targeted
which was well received by the dealers with an offer to target
ratio of 2.0. Despite enormous demand for Ijarah Sukuks by
Shariah compliant and conventional financial institutions alike,
0
500
1000
1500
2000
2500
3000
3500
4000
4500
5000
Target Offered Accepted
H2CY11 H1CY12 H2CY12 H1CY13
Figure 5.6
Profile of T-bill Auctions (PKR billion)
0
10
20
30
40
50
60
70
80
90
100
12M 6M 3M
Figure 5.7
T-Bill Tenure offered (percent share)
Q2CY12 Q3CY12 Q4CY12 Q1CY13 Q2CY13
0
2
4
6
8
10
12
14
0
20
40
60
80
100
120
140
160
180
Q1 Q2 Q3 Q4 Q1 Q2 Q3 Q4 Q1 Q2
2011 2012 2013
12-month 6-month 3-month share
Figure 5.8
Fluctuating share of Non-Competitive Bids
PKR billion Percent share
020406080
100120140160180200
H1CY11 H2CY11 H1CY12 H2CY12 H1CY13
3Y 5Y 7Y 10Y 15Y 20 Y 30 Y
Figure 5.9
Accepted PIB Auction Profile (PKR billion)
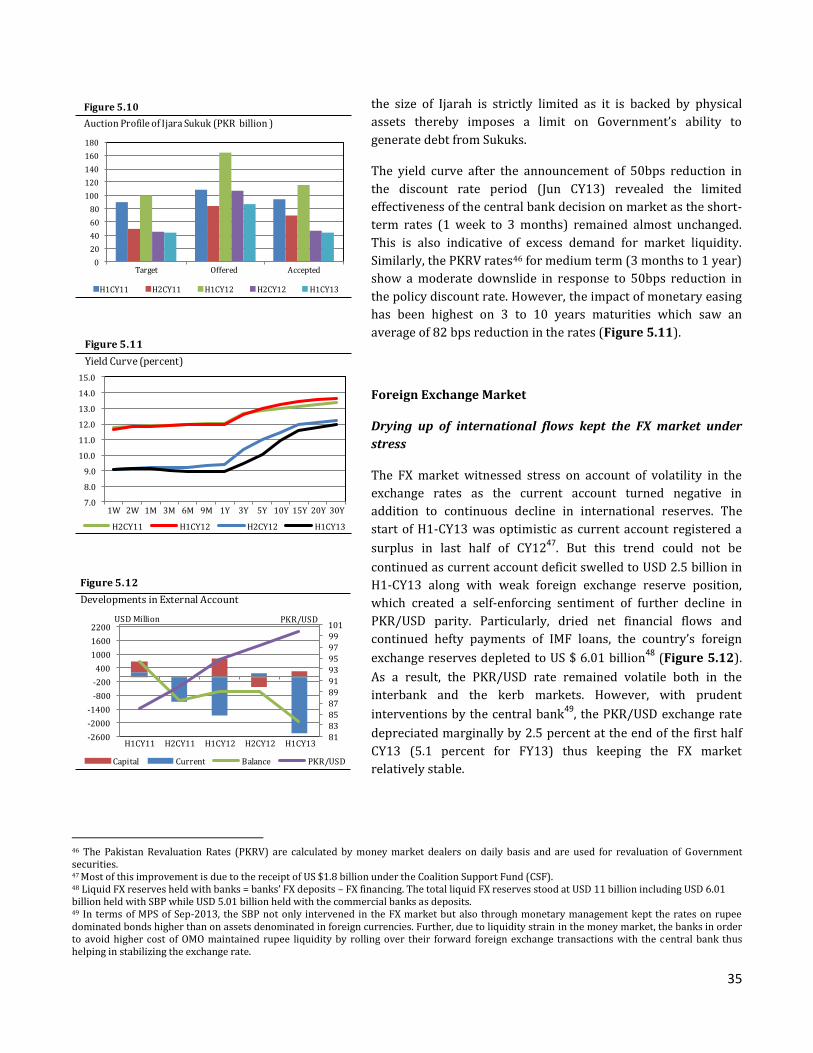
35
the size of Ijarah is strictly limited as it is backed by physical
assets thereby imposes a limit on Government’s ability to
generate debt from Sukuks.
The yield curve after the announcement of 50bps reduction in
the discount rate period (Jun CY13) revealed the limited
effectiveness of the central bank decision on market as the short-
term rates (1 week to 3 months) remained almost unchanged.
This is also indicative of excess demand for market liquidity.
Similarly, the PKRV rates46 for medium term (3 months to 1 year)
show a moderate downslide in response to 50bps reduction in
the policy discount rate. However, the impact of monetary easing
has been highest on 3 to 10 years maturities which saw an
average of 82 bps reduction in the rates (Figure 5.11).
Foreign Exchange Market
Drying up of international flows kept the FX market under
stress
The FX market witnessed stress on account of volatility in the
exchange rates as the current account turned negative in
addition to continuous decline in international reserves. The
start of H1-CY13 was optimistic as current account registered a
surplus in last half of CY1247
. But this trend could not be
continued as current account deficit swelled to USD 2.5 billion in
H1-CY13 along with weak foreign exchange reserve position,
which created a self-enforcing sentiment of further decline in
PKR/USD parity. Particularly, dried net financial flows and
continued hefty payments of IMF loans, the country’s foreign
exchange reserves depleted to US $ 6.01 billion48
(Figure 5.12).
As a result, the PKR/USD rate remained volatile both in the
interbank and the kerb markets. However, with prudent
interventions by the central bank49
, the PKR/USD exchange rate
depreciated marginally by 2.5 percent at the end of the first half
CY13 (5.1 percent for FY13) thus keeping the FX market
relatively stable.
46 The Pakistan Revaluation Rates (PKRV) are calculated by money market dealers on daily basis and are used for revaluation of Government securities. 47 Most of this improvement is due to the receipt of US $1.8 billion under the Coalition Support Fund (CSF). 48 Liquid FX reserves held with banks = banks’ FX deposits – FX financing. The total liquid FX reserves stood at USD 11 billion including USD 6.01 billion held with SBP while USD 5.01 billion held with the commercial banks as deposits. 49 In terms of MPS of Sep-2013, the SBP not only intervened in the FX market but also through monetary management kept the rates on rupee dominated bonds higher than on assets denominated in foreign currencies. Further, due to liquidity strain in the money market, the banks in order to avoid higher cost of OMO maintained rupee liquidity by rolling over their forward foreign exchange transactions with the central bank thus helping in stabilizing the exchange rate.
0
20
40
60
80
100
120
140
160
180
Target Offered Accepted
H1CY11 H2CY11 H1CY12 H2CY12 H1CY13
Figure 5.10
Auction Profile of Ijara Sukuk (PKR billion )
7.0
8.0
9.0
10.0
11.0
12.0
13.0
14.0
15.0
1W 2W 1M 3M 6M 9M 1Y 3Y 5Y 10Y 15Y 20Y 30Y
H2CY11 H1CY12 H2CY12 H1CY13
Figure 5.11
Yield Curve (percent)
81
83
85
87
89
91
93
95
97
99
101
-2600
-2000
-1400
-800
-200
400
1000
1600
2200
H1CY11 H2CY11 H1CY12 H2CY12 H1CY13
Capital Current Balance PKR/USD
Figure 5.12
Developments in External Account
USD Million PKR/USD

36
The kerb market exhibited even more volatility on account of
sluggish economy, tapering off of worker’s remittances50, and
uncertain political environment during pre-election period.
Moreover, the gradual decline in FX reserves resulted in market’s
perception about central bank’s limited ability to intervene in the
market. As a result, the kerb market besides witnessing
fluctuations in the exchange rate also saw kerb premium
increased from PKR 0.25 during H2-CY12 upto PKR 1.96 during
H1-CY13 (Figure 5.13). Additonal, the import coverage slashed
from 18 weeks during Dec CY12 to 14.3 weeks at the end of H1-
CY13 (Figure 5.14).
Capital Markets
Equity Market kept on making new records
The bullish sentiment gained further momentum in the leading
equity market of the country, leading to sharp rise in equity
prices during H1-CY13. The Karachi Stock Exchange (KSE)
benchmark KSE-100 index surged by 24.2 percent during H1-
CY13 and 52.2 percent for the year 2012-13 (Figure 5.15). The
index kept on reaching historical highs throughout the half year,
with some correction in post federal budget announcement.
The surge in index was despite the adverse developments in
macroeconomic environment mainly in the external sector and
constant depreciation of the domestic currency. However, strong
corporate sector profitability, expectations of higher dividend
payouts and smooth political transition after the general
elections enhanced the local and foreign interests in the market.
Likewise, the turnover – a measure of investors’ interest, also
improved drastically to 251 million shares as against 147 million
shares in previous half.
In terms of international comparison, the KSE outperformed
other regional and world stock exchanges. In fact, many of the
leading emerging and BRICS countries posted negative growth in
its equity market indices. This is also reflected in the MSCI
emerging market index that witnessed a decline of 10.9 percent
during H1-CY13 (Table 5.1).
Corporate Sector performance drive market momentum
Though, the growth in the benchmark KSE-100 index was robust,
it varied across the sectors listed in the equity market. The
50 Workers remittance declined in Jan 2013 stimulating KERB premium reaching highest level of 1.96, while it came down and touched its lowest in H1-CY13 (0.39 per dollar) in March 2013 as the flow of workers’ remittances increased in the month of March and April 2013.
29
30
31
32
33
34
35
36
37
38
0
5
10
15
20
25
Q1 Q2 Q3 Q4 Q1 Q2 Q3 Q4 Q1 Q2
CY11 CY12 CY13
Banks Chemical Oil & Gas (RHS)
Figure 5.16
Sector-Wise Performance of KSE (percent)
-1.0
-0.5
0.0
0.5
1.0
1.5
2.0
2.5
8486889092949698
100102
KERB Rate Premium (RHS)
Figure 5.13
KERB Exchange Rate and Premium
Rate (PKR/USD) Premium in PKR
Q1C
Y11
Q2C
Y11
Q3
CY
11
Q4C
Y11
Q1C
Y12
Q2
CY
12
Q3C
Y12
Q4C
Y12
Q1
CY
13
Q2C
Y13
02468101214161820
81012141618202224262830
Banks SBP Coverage (weeks)
Figure 5.14
Foreign Exchange Reserves and Import Coverage
Weeks USD billion
Q1C
Y11
Q2C
Y11
Q3C
Y11
Q4C
Y11
Q1C
Y12
Q2C
Y12
Q3C
Y12
Q4C
Y12
Q1C
Y13
Q2C
Y13
10000
12000
14000
16000
18000
20000
22000
24000
0
100
200
300
400
500
600
700
Figure 5.15
million shares KSE-100 Index
KSE-100 Index and Trading Volumes
Q1C
Y11
Q2C
Y11
Q3C
Y11
Q4C
Y11
Q1C
Y12
Q2C
Y12
Q3C
Y12
Q4C
Y12
Q1C
Y13
Q2C
Y13

37
concentration in market capitalization and turnover also
augmented during the period. Specifically, the turnover in the
banking sector scrip boosted during last two months of H1CY13.
While in terms of market performance, the share of oil and gas
sector continued to dominate the market capitalization on
account of improved profitability thus attracting investors’
interests (Figure 5.16).
The corporate results played an integral part in the bullish
behavior of the KSE. Nearly all the major listed sectors witnessed
improved profitability (Table 5.2)51
. As discussed earlier, banks’
profitability declined on account of declining yields on
government securities while the profits of oil and gas boosted on
realization of receivables and increased revenues. Furthermore,
owing to improvements in the equity markets and favorable
yields on long-term securities, the profitability of the Modaraba
Companies and Mutual funds (Mod/MF) also boosted during H1-
CY13.
SCRA flows are source of concern
The improved corporate profitability and booming stock indices,
attracted foreign interest and liquidity, which augmented the
overall market momentum52
. The gross SCRA inflows improved
to USD 538.5 million during H1-CY13 showing an improvement
of 56.9 percent over the preceding half year. However, the SCRA
investments remained short-lived and heavy outflows were
witnessed in the last two months in expectations of market
correction on account of federal budget. Accordingly, the net
SCRA flow for H1-CY13 remained negative USD 16.2 million as
against positive USD 246.6 million during H2-CY12 (Figure
5.17). These heavy outflows pose a significant risk as it reduces
stock prices and aggravates volatility. The effect of foreign
outflows trickled-down on local investors leading to further
correction in the index in the latter part of the H1-CY13.
51 The Table 5.1 presents the half-yearly results announced by the listed companies until 30th August 2013. 52 One such measure of attracting foreign investors is P/E (Price to Earnings ratio). The KSE traded at a price-equity ratio of 7.5x (multiple) meanwhile, the regional markets traded at 11.5x during H1-CY13 implying the KSE traded at discount.
10000
12000
14000
16000
18000
20000
22000
-230
-180
-130
-80
-30
20
70
120
170
Outflows Inflows KSE-100 (RHS)
Figure 5.17
KSE-100 Index and SCRA flows
SCRA USD million KSE-100 Index
Q2CY12 Q3CY12 Q4CY12 Q1CY13 Q2CY13
Table 5.1: World Equity Market Indices
29 Jun 12 31 Dec 12 28 Jun 13 %D-H1CY13
USA (DJIA) 12880.1 13104.1 14909.6 13.8
USA(NAScomp) 2935.1 3019.5 3403.2 12.7
China (SSEA) 2225.4 2269.1 1979.2 -12.8
Japan (Nikkei) 9006.7 10395.1 13677.3 31.6
Britian (FTSE) 5571.1 5897.8 6215.4 5.4
France (CAC) 3195.6 3641.0 3738.9 2.7
Russia (RTI) 1350.5 1526.9 1275.0 -16.5
Germany (DAX) 6416.2 7612.3 7959.2 4.6
Turkey (ISE) 62543.4 78208.4 76294.5 -2.4
India (BSE) 17429.9 19426.7 19395.8 -0.2
Indonesia (JSE) 3955.5 4316.6 4818.8 11.6
Malaysia (KLSE) 1599.1 1688.9 1773.5 5.0
Pakistan (KSE) 13801.4 16905.3 21005.6 24.3
Singapore (STI) 2878.4 3167.0 3150.4 -0.5
Thailand (SET) 1172.1 1391.9 1451.9 4.3
Argentina (MERV) 2346.6 2854.2 2976.2 4.3
Brazil (BVSP) 35354.6 60952.0 47457.1 -22.1
MSCI Developed 1235.7 1338.5 1433.5 7.1
MSCI Emerging 937.3 1055.2 940.3 -10.9
Source: Bloomberg

38
Profile of Equity and Debt markets continued to strengthen.
In addition to a record equity market performance, the listings in
the equity and debt markets also carried on from the trend of
previous half-year. The two new listings increased the listed
capital by PKR 4 billion which is far more than the capital listed
during CY12. Moreover, as the power sector remained dominant
in getting bank credit recently, the equity market also witnessed
a number of listings in the power sector (Figure 5.18).
The listing of debt instruments also observed some improvement
as Term Finance Certificates (TFCs) worth of PKR 7 billion were
listed during the half year as against PKR 5.2 billion in the
previous half year. Banks listed of six new TFCs for meeting for
the regulatory capital requirements and for meeting long-term
financing needs. In addition, two TFCs of oil and gas sector were
also listed during the period. With some improvement in
economic and business environment, it is expected that the
listing trend will further boost in future.
0
2
4
6
8
10
12
14
0
1
2
3
4
H1CY11 H2CY11 H1CY12 H2CY12 H1CY13
Numbers (LHS) Amount (PKR billion)
Figure 5.18
PKR billion
Equity Listings in KSE
No. of Listings
Table 5.2
Improved Corporate Profitability (PKR billion)
CY10 CY11 CY12 H1-CY13
Oil and Gas 162.11 196.11 240.5 250.49
Banks 107.84 158.82 172.2 84.31
Chemical 44.26 70.37 54.45 10.67
Cement -5.63 4.2 24.58 8.14
Food 18.47 24.56 28.83 16.82
Power -0.917 5.43 23.23 33.03
Textiles 30.54 35.43 16.51 3.62
Auto 7.47 7.65 11.19 6.28
Telecom 11.12 4.88 10.23 -3.69
Insurance 4.65 5.51 9.6 8.01
Pharma 5.21 6.44 7.71 3.73
Engineering 11.52 9.03 5.87 13.94
Mod/ MF 2.82 4.95 3.73 13.84
Transport 2.66 3.02 1.92 1.72
NBFC -10.52 -2.33 1.64 0.82
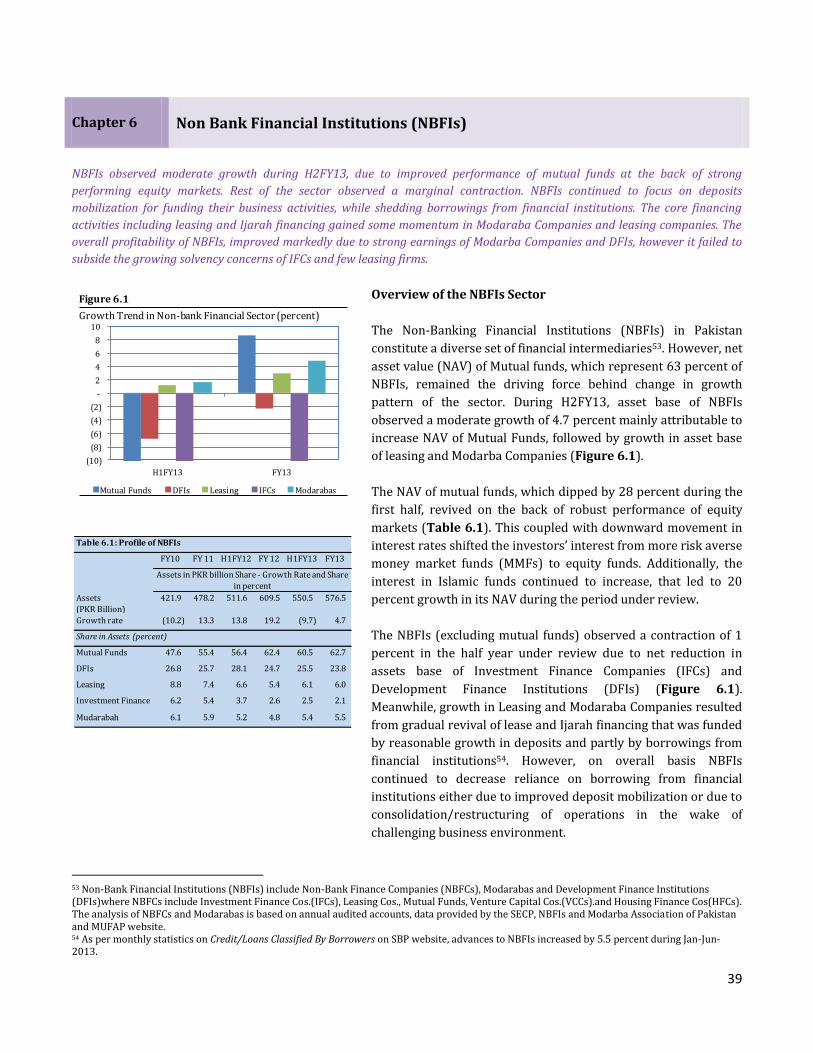
39
NBFIs observed moderate growth during H2FY13, due to improved performance of mutual funds at the back of strong
performing equity markets. Rest of the sector observed a marginal contraction. NBFIs continued to focus on deposits
mobilization for funding their business activities, while shedding borrowings from financial institutions. The core financing
activities including leasing and Ijarah financing gained some momentum in Modaraba Companies and leasing companies. The
overall profitability of NBFIs, improved markedly due to strong earnings of Modarba Companies and DFIs, however it failed to
subside the growing solvency concerns of IFCs and few leasing firms.
Overview of the NBFIs Sector
The Non-Banking Financial Institutions (NBFIs) in Pakistan
constitute a diverse set of financial intermediaries53. However, net
asset value (NAV) of Mutual funds, which represent 63 percent of
NBFIs, remained the driving force behind change in growth
pattern of the sector. During H2FY13, asset base of NBFIs
observed a moderate growth of 4.7 percent mainly attributable to
increase NAV of Mutual Funds, followed by growth in asset base
of leasing and Modarba Companies (Figure 6.1).
The NAV of mutual funds, which dipped by 28 percent during the
first half, revived on the back of robust performance of equity
markets (Table 6.1). This coupled with downward movement in
interest rates shifted the investors’ interest from more risk averse
money market funds (MMFs) to equity funds. Additionally, the
interest in Islamic funds continued to increase, that led to 20
percent growth in its NAV during the period under review.
The NBFIs (excluding mutual funds) observed a contraction of 1
percent in the half year under review due to net reduction in
assets base of Investment Finance Companies (IFCs) and
Development Finance Institutions (DFIs) (Figure 6.1).
Meanwhile, growth in Leasing and Modaraba Companies resulted
from gradual revival of lease and Ijarah financing that was funded
by reasonable growth in deposits and partly by borrowings from
financial institutions54. However, on overall basis NBFIs
continued to decrease reliance on borrowing from financial
institutions either due to improved deposit mobilization or due to
consolidation/restructuring of operations in the wake of
challenging business environment.
53 Non-Bank Financial Institutions (NBFIs) include Non-Bank Finance Companies (NBFCs), Modarabas and Development Finance Institutions (DFIs)where NBFCs include Investment Finance Cos.(IFCs), Leasing Cos., Mutual Funds, Venture Capital Cos.(VCCs).and Housing Finance Cos(HFCs). The analysis of NBFCs and Modarabas is based on annual audited accounts, data provided by the SECP, NBFIs and Modarba Association of Pakistan and MUFAP website. 54 As per monthly statistics on Credit/Loans Classified By Borrowers on SBP website, advances to NBFIs increased by 5.5 percent during Jan-Jun-2013.
Chapter 6 Non Bank Financial Institutions (NBFIs)
(10)
(8)
(6)
(4)
(2)
-
2
4
6
8
10
H1FY13 FY13
Mutual Funds DFIs Leasing IFCs Modarabas
Figure 6.1
Growth Trend in Non-bank Financial Sector (percent)
Table 6.1: Profile of NBFIs
FY10 FY 11 H1FY12 FY 12 H1FY13 FY13
Assets
(PKR Billion)
421.9 478.2 511.6 609.5 550.5 576.5
Growth rate (10.2) 13.3 13.8 19.2 (9.7) 4.7
Mutual Funds 47.6 55.4 56.4 62.4 60.5 62.7
DFIs 26.8 25.7 28.1 24.7 25.5 23.8
Leasing 8.8 7.4 6.6 5.4 6.1 6.0
Investment Finance 6.2 5.4 3.7 2.6 2.5 2.1
Mudarabah 6.1 5.9 5.2 4.8 5.4 5.5
Assets in PKR billion Share - Growth Rate and Share
in percent
Share in Assets (percent)

40
Operating performance of the NBFIs exhibited marked
improvement…
The profitability of NBFIs sector substantially improved during
FY13 particularly in the second half of the year. It posted after tax
profit of PKR 3.82 billion during FY13; compared to PKR 0.91
billion in FY12, showing more than 4 times increase YoY basis.
Modaraba Companies, with profit of PKR 2 billion (YoY growth of
73 percent) followed by DFIs and Leasing Companies, while IFCs
posted losses. Review of earning highlight varied reasons for
increase in profitability of NBFIs like improvement in core leasing
activity enhanced the earning of Modarabah and leasing
companies, while lower provisions charge and gain on sale of
investment added to the non-markup income of DFIs and
Modarabas. Similarly, expense control due to decreased reliance
on borrowings from financial institutions also jacked up earning
of leasing companies. Accordingly, the return indicators observed
a marked improvement over the year 55(Table 6.2).
Compliance with equity requirements remains the major
challenge
The NBFIs sector has been facing solvency issues for some time.
Though improved earning provided for shortfall in some of the
NBFI, most of the leasing companies and IFCs still fail to meet
Minimum Equity Requirements (MER). Furthermore, going
concern status of some of these companies is also elusive due to
deficit equity56. This is despite the fact that regulators allowed
extension of couple of years to these companies for meeting the
enhanced equity requirements.
Mutual Funds
NAV of mutual funds picked up .……
Mutual fund industry, after observing a dip in first half of the year,
picked up again in H2FY13. The strong performing equity
markets and changing interest rate scenario shifted the interest of
the investors from more risk averse money market funds to
equity funds. Islamic funds primarily contributed to overall
growth followed by conventional equity funds. A record-breaking
upturn in equity market not only increased investor’s interest in
equity funds but also boosted the NAV of Islamic and pension
funds. Interest in money market funds continues to fade due to
downward movement in interest rates (Figure 6.2 and 6.3).
55 Figures have been annualized for return indicators ROA and ROE. 56 As pe annual reports of the some of the NBFIs, SECP has not renewed licenses of some these companies for sometime.
Table 6.2 :Performance of NBFIs
(Amo unt in P KR millio n, Ratio s in %)
FY11 H1FY12 FY12 H1FY13 FY13
Profit after tax 1,704 933 907 3,926 3,823
DFIs 1,158 1,577 1,793 3,275 2,034
other NBFIs 546 (644) (886) 651 1,789
Expense 12,683 9,645 13,510 9,082 14,229
Expense to income 745 1,034 1,489 231 372
ROA 1.36 0.13 1.18 2.03 2.70
ROE 3.77 0.36 3.36 5.71 7.29

41
Mutual funds industry saw a moderate growth of 8.6 percent in
H2-FY13 at the back of sparkling performance of stock market.
This was in sharp contrast to first half when NAV of the funds
industry declined substantially. Though the growth was broad
based, it was more pronounced in close ended funds which
surged by 24.5 percent. The interest in close-ended mutual funds
resurfaced during FY13, after remaining on downhill for few
years, which enhance its share in the NAV of the funds by 111bps
to 8.7 percent.
… due to stellar performance of equity market
Over the last few years, growth in NAV of money market funds
(MMF) provided for most of the increase in value of the funds
industry. Similarly, income funds, with an investment mix of
government securities, debt instruments (TFCs, Sukuks, etc) and
banks deposits, supported the overall growth. However,
investment strategy saw a shift during last half year where it
tilted towards equity funds due to strong equity market
performance and this trend continued in second half too. The
equity funds, with a growth of 22.8 percent, drove the overall
performance of the MF sector. The growth in equity funds was
broad based, though with a varying extent; Islamic equity funds
grew by 37.9 percent, while conventional equity funds with 85
percent share in NAV of equity funds also saw a healthy increase
of 20.6 percent.
At the same time, decrease in NAV of the money market funds
(conventional and Islamic) slowed down the momentum of fund
industry. As a result, NAV of MMFs saw another dip of 1.8 percent
during H2-FY13 (19.1 percent for FY13). Though, factors
(substantial borrowing needs of the Government, providing risk
free investment avenue and consistently growing equity market)
responsible for surge in mutual fund industry during the previous
half year still existed, dip actually took place due to expectation of
slow demand of Government borrowing in future and decline in
discount rate. Despite decline in the NAV, MMF still held a top seat
in the market share followed by equity and income funds (Figure
6.4).
Declining variance in returns on interest based mutual funds
and deposits affected the performance of funds industry…
Returns seem to be another factor that played part in dip in NAV
of the interest based funds products. Traditionally, the gap
between return on mutual funds and bank deposit was quite high
0
4
8
12
16
FY-08 FY-09 FY-10 FY-11 FY-12 H1FY13 FY13
Deposit rate (3-6months) Deposit rate (1-2 years)
Income funds' return Money Market funds' return
Figure 6.5
Mutual funds returns and bank deposit rates (percent)
-60.0
-40.0
-20.0
0.0
20.0
40.0
0
100
200
300
400
FY
09
FY
10
FY
11
H1F
Y12
FY
12
H1F
Y13
FY
13
equity incomemoney market othersIslamic pensionNAV growth(RHS)
Figure 6.2
Profile of Mutual Fund Industry
PKR billion Percent
020406080100120140160180
0
50100
150
200250
300350400
FY
08
FY
09
FY
10
FY
11
H1
FY
12
FY
12
H1
FY
13
FY
13
open-Net Assets closed-net assetspension funds Number(RHS)
NumberPKR billion
Figure 6.3
Performance of Mutual Funds
22
17
37
6
17
1.03 equity, 25
income, 16
money market, 33
others, 6
Islamic, 19
pension, 1.33
FY13
H1FY13
Figure 6.4
Investment structure of mutual funds (share in percent)
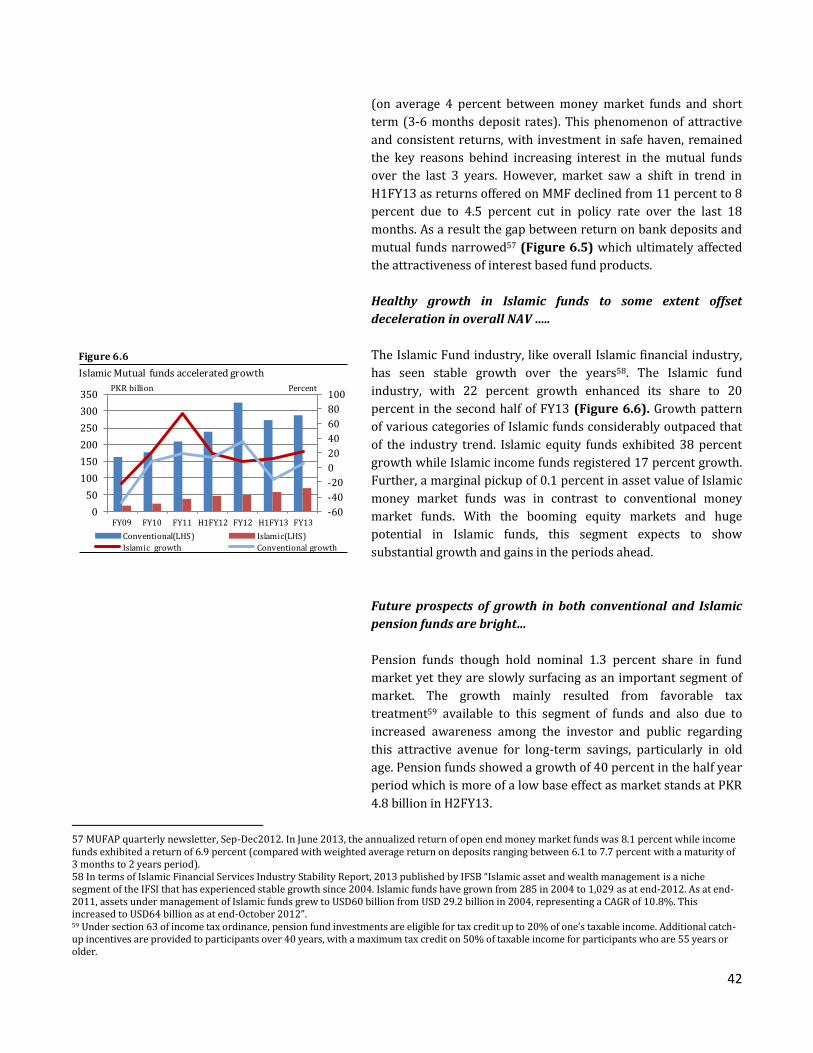
42
(on average 4 percent between money market funds and short
term (3-6 months deposit rates). This phenomenon of attractive
and consistent returns, with investment in safe haven, remained
the key reasons behind increasing interest in the mutual funds
over the last 3 years. However, market saw a shift in trend in
H1FY13 as returns offered on MMF declined from 11 percent to 8
percent due to 4.5 percent cut in policy rate over the last 18
months. As a result the gap between return on bank deposits and
mutual funds narrowed57 (Figure 6.5) which ultimately affected
the attractiveness of interest based fund products.
Healthy growth in Islamic funds to some extent offset
deceleration in overall NAV …..
The Islamic Fund industry, like overall Islamic financial industry,
has seen stable growth over the years58. The Islamic fund
industry, with 22 percent growth enhanced its share to 20
percent in the second half of FY13 (Figure 6.6). Growth pattern
of various categories of Islamic funds considerably outpaced that
of the industry trend. Islamic equity funds exhibited 38 percent
growth while Islamic income funds registered 17 percent growth.
Further, a marginal pickup of 0.1 percent in asset value of Islamic
money market funds was in contrast to conventional money
market funds. With the booming equity markets and huge
potential in Islamic funds, this segment expects to show
substantial growth and gains in the periods ahead.
Future prospects of growth in both conventional and Islamic
pension funds are bright…
Pension funds though hold nominal 1.3 percent share in fund
market yet they are slowly surfacing as an important segment of
market. The growth mainly resulted from favorable tax
treatment59 available to this segment of funds and also due to
increased awareness among the investor and public regarding
this attractive avenue for long-term savings, particularly in old
age. Pension funds showed a growth of 40 percent in the half year
period which is more of a low base effect as market stands at PKR
4.8 billion in H2FY13.
57 MUFAP quarterly newsletter, Sep-Dec2012. In June 2013, the annualized return of open end money market funds was 8.1 percent while income funds exhibited a return of 6.9 percent (compared with weighted average return on deposits ranging between 6.1 to 7.7 percent with a maturity of 3 months to 2 years period). 58 In terms of Islamic Financial Services Industry Stability Report, 2013 published by IFSB “Islamic asset and wealth management is a niche segment of the IFSI that has experienced stable growth since 2004. Islamic funds have grown from 285 in 2004 to 1,029 as at end-2012. As at end-2011, assets under management of Islamic funds grew to USD60 billion from USD 29.2 billion in 2004, representing a CAGR of 10.8%. This increased to USD64 billion as at end-October 2012”. 59 Under section 63 of income tax ordinance, pension fund investments are eligible for tax credit up to 20% of one’s taxable income. Additional catch-up incentives are provided to participants over 40 years, with a maximum tax credit on 50% of taxable income for participants who are 55 years or older.
-60
-40
-20
0
20
40
60
80
100
0
50
100
150
200
250
300
350
FY09 FY10 FY11 H1FY12 FY12 H1FY13 FY13
Conventional(LHS) Islamic(LHS)
Islamic growth Conventional growth
Figure 6.6
Islamic Mutual funds accelerated growth
PKR billion Percent

43
Currently there are 11 players operating in pension fund market
and majority of these funds are subsidiaries or associates of large
banks. In the wake of growing demand of shariah based products,
Islamic pension funds hold 61 percent of market share relative to
conventional funds (Figure 6.7). Keeping in view the long term
nature of their fund base, these funds can provide for long term
funding needs of market with stable returns. However, they
should be wary of going into risky ventures owing to dependency
of large number of old aged population on them.
Industry observed net redemption due to heavy redemption in
money market and income funds
Sales and redemption pattern of mutual funds over the years have
seen sales outpaced redemption except in 2009 due to liquidity
crunch faced by market in the aftermath of freezing of stock
exchange. In FY13, funds market again observed redemption
pressure in both halves yet second half was relatively better than
first half as market observed net redemption of PKR 9.18 billion
as against 76.4 billion in first half (Figure 6.8). Overall in FY13,
major redemption was seen in money market and income funds
where investors offloaded their investment of PKR 83 billion. On
the other hand, Islamic mutual funds including pension supported
the industry by adding PKR 6.55 billion new funds across
different categories of mutual funds.
In the backdrop of growing demand of Islamic financial
products60, SECP has announced formulation of Shariah Advisory
Board (SAB) which is entrusted with the ascertainment of Islamic
law for the purpose of development and promotion of Islamic
financial institutions namely; Islamic mutual funds, pensions
funds, Takaful operators and other FIs regulated by SECP. This
move will play a crucial role in bringing an effective and efficient
Shariah governance system enhancing the credibility of Islamic
financial institutions.
60 In H2FY13, ten new mutual funds were launched. Out of those, seven funds are established under Islamic category.
0
10
20
30
40
50
60
70
0
1
1
2
2
3
3
4
FY-10 FY-11 H1-FY12 H2-FY12 H1FY13 H2-FY13
Conventional(LHS) Islamic (LHS)
Growth-Convenitional Growth-Islamic
Figure 6.7
Pension Funds Performance
PKR billion Percent
-60
-40
-20
0
20
40
60
80
FY11 FY12 H1FY13 H2FY13
Equity Income Money Market others Islamic Pension
Figure 6.8
Industry observed net redemption except Islamic funds (PKR billion)

44
Development Finance Institutions (DFIs)
Asset base of DFIs observed contraction…
Assets bases of DFIs declined by 2.3 percent during H1CY13, due
to squeeze in investment and advances portfolio. On the funding
side, deposit of DFIs picked up and showed a healthy 15 percent
growth in period under review, after observing a decline in
previous half year. The borrowing which remained the main
funding source of DFIs kept on declining for the second
consecutive half; reducing its share in financing by 450 bps to
36.9 percent. The DFIs posted 13 percent higher earning in June-
13 due to decrease in provision charge, increase in dividend
income and gain on sale of securities. On solvency front, DFIs
remained sufficiently capitalized with a high CAR of 54.6 percent,
despite a marginal drop in the ratio during the half year. Some
companies do fall short of MCR.
Over the last three years, consistent increase in investments in
Federal Government securities boosted the assets base of the
DFIs. The trend reversed in second half of CY12, which continued
during the H1CY13 as investments portfolio further dropped by
4.2 percent. Despite 110 bps drop in share, investments still holds
the top seat in DFIs balance sheet (Figure 6.9). The DFIs
channelized PKR 4.4 billion into stock market, which also
exhibited industry expectation regarding declining interest rates
in near future (Figure 6.10).
With investments being the main earning source of
interest/mark-up income, DFIs opted flexible investment strategy
of placing major chunk of investments in Available for Sale (AFS)
category. This allowed the DFIs to off-load substantial portion of
investment during the period under review. However, despite this
decline, DFIs still holds 88 percent of their investment portfolio in
AFS (Figure 6.11).
…while advances saw a nominal growth
In line with trend in the banking sector, lending portfolio of DFIs
contracted by 4.2 percent in H1CY13. Breakup of incremental
advances61 reveals reduction in corporate sector advances mainly
in fixed investment category. SMEs, the most affected sector due
to prevailing economic and business environment made net
retirement of PKR 9 billion. Consumer finance, the second largest
61 Sectoral and segment based analysis of advances in this section is based on Un-audited quarterly data.
700
-1200
-800
-400
0
400
800
1200
1 2 3 4 5 6 7
Jun-13 Jun-12 required
Figure 6.22
Minimum equity required and maintained (PKR million)
0
10
20
30
40
50
60
70
80
90
100
H1-CY10 CY10 H1-CY11 CY11 H1CY12 H2CY12 H1CY13
TFCs/PTCs Quoted Shares Fed Govt Securities Others
Figure 6.10
Investment composition of DFIs (PKR billion)
0
20
40
60
80
100
120
140
160
H1CY11 CY11 H1CY12 CY12 H1CY13
Balances with Banks Lending to FIsInvestments - Net Advances - Net
Figure 6.9
Earning Assets of DFIs (PKR billion)
48.0
50.0
52.0
54.0
56.0
58.0
60.0
62.0
64.0
0
10
20
30
40
50
60
70
80
90
100
CY10 H1CY11 CY11 H1CY12 CY12 H1CY13
HFT AFS HTMS & A share (RHS)
Figure 6.11
Investment Anatomy
PKR billion Percent share
-6
-4
-2
0
2
4
6
(4)
(3)
(2)
(1)
-
1
2
3
4
CY10 H1CY11 CY11 H1CY12 CY12 H1CY13Fixed investment Working Capitalothers Consumer Financeadvances growth-RHS
Figure 6.12
Advances Composition (flows)PKR billion Percent
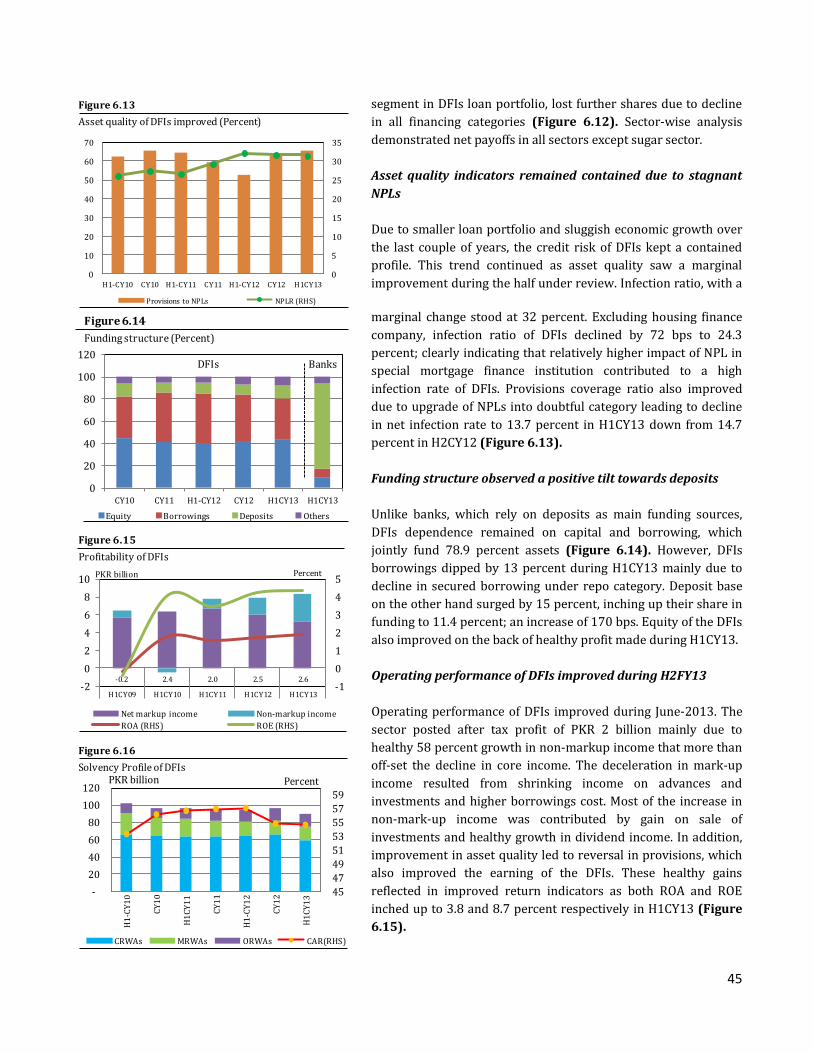
45
segment in DFIs loan portfolio, lost further shares due to decline
in all financing categories (Figure 6.12). Sector-wise analysis
demonstrated net payoffs in all sectors except sugar sector.
Asset quality indicators remained contained due to stagnant
NPLs
Due to smaller loan portfolio and sluggish economic growth over
the last couple of years, the credit risk of DFIs kept a contained
profile. This trend continued as asset quality saw a marginal
improvement during the half under review. Infection ratio, with a
marginal change stood at 32 percent. Excluding housing finance
company, infection ratio of DFIs declined by 72 bps to 24.3
percent; clearly indicating that relatively higher impact of NPL in
special mortgage finance institution contributed to a high
infection rate of DFIs. Provisions coverage ratio also improved
due to upgrade of NPLs into doubtful category leading to decline
in net infection rate to 13.7 percent in H1CY13 down from 14.7
percent in H2CY12 (Figure 6.13).
Funding structure observed a positive tilt towards deposits
Unlike banks, which rely on deposits as main funding sources,
DFIs dependence remained on capital and borrowing, which
jointly fund 78.9 percent assets (Figure 6.14). However, DFIs
borrowings dipped by 13 percent during H1CY13 mainly due to
decline in secured borrowing under repo category. Deposit base
on the other hand surged by 15 percent, inching up their share in
funding to 11.4 percent; an increase of 170 bps. Equity of the DFIs
also improved on the back of healthy profit made during H1CY13.
Operating performance of DFIs improved during H2FY13
Operating performance of DFIs improved during June-2013. The
sector posted after tax profit of PKR 2 billion mainly due to
healthy 58 percent growth in non-markup income that more than
off-set the decline in core income. The deceleration in mark-up
income resulted from shrinking income on advances and
investments and higher borrowings cost. Most of the increase in
non-mark-up income was contributed by gain on sale of
investments and healthy growth in dividend income. In addition,
improvement in asset quality led to reversal in provisions, which
also improved the earning of the DFIs. These healthy gains
reflected in improved return indicators as both ROA and ROE
inched up to 3.8 and 8.7 percent respectively in H1CY13 (Figure
6.15).
0
5
10
15
20
25
30
35
H1-CY10 CY10 H1-CY11 CY11 H1-CY12 CY12 H1CY130
10
20
30
40
50
60
70
Provisions to NPLs NPLR (RHS)
Figure 6.13
Asset quality of DFIs improved (Percent)
0
20
40
60
80
100
120
CY10 CY11 H1-CY12 CY12 H1CY13 H1CY13
Equity Borrowings Deposits Others
Figure 6.14
Funding structure (Percent)
DFIs Banks
45
47
49
51
53
55
57
59
-
20
40
60
80
100
120
H1
-CY
10
CY
10
H1
CY
11
CY
11
H1
-CY
12
CY
12
H1
CY
13
CRWAs MRWAs ORWAs CAR(RHS)
Figure 6.16
Solvency Profile of DFIsPKR billion Percent
-2
0
2
4
6
8
10
-0.2 2.4 2.0 2.5 2.6
H1CY09 H1CY10 H1CY11 H1CY12 H1CY13-1
0
1
2
3
4
5
Net markup income Non-markup income
ROA (RHS) ROE (RHS)
Figure 6.15
Profitability of DFIs
PKR billion Percent

46
Solvency remained strong though CAR observed some decline
The DFIs maintained strong solvency profile over the years due to
risk adverse behavior. This phenomenon is evident from
substantial drop of 9.6 percent in credit risk weighted assets
followed by market and operational risks. Further, eligible capital
also declined due to carry on impact of higher provisioning charge
by a single institution. As a result, CAR of industry marginally
dropped by 37 bps, however it still stands at comfortable 55
percent level (Figure 6.16).
Leasing
The focus of the leasing business in Pakistan is on corporate
segment and consumer finance, with most of the disbursements
for machinery, equipment, and vehicle leasing. In addition, leasing
companies are also trying to venture into other segments for
business diversification, though the pace remains slow. The
ownership structure show that 5 out of 8 companies are part of
the local or foreign banking groups and hold majority share in
asset base of the sector (Figure 6.17).
Performance of leasing companies improved ….
The leasing companies sustained the performance of the first half
of the year and registered a moderate growth of 3 percent in asset
base during H2-FY13 (4.2 percent during FY13) (Figure 6.18).
Most of the increase came from core leasing business largely
supported by healthy growth in deposits. The operating
performance improved considerably with ROA and ROE inched
up further. However, performance remained confined to a couple
of large companies. The solvency of the sector improved at the
back of healthy profits, however, majority of the companies still
fall short of the required minimum capital requirements.
Continuing increase in mobilization of retail funds…
The leasing companies have generally been relying on the
borrowing from financial institutions for funding their operation.
Over the last two years, this trend observed some shift as leasing
companies, particularly major player, augmented efforts for
deposit mobilization through Certificates of Deposits (CoDs) and
Certificates of Investments (CoIs), while decreasing reliance on
borrowings. Their deposits base surged by 17.5 percent during
H2-FY13 (34 percent during FY13), which enhanced its share in
liabilities to 30.4 percent (Table 6.3).
0
1
2
3
4
5
6
26
28
30
32
34
36
FY11 H1-FY12 FY12 H1-FY13 FY13
Assets Equity (RHS)
Figure 6.18
Profile of Leasing sector (PKR billion)
FY11 H1-FY12 FY12 H1-FY13 FY13
Leases and
Advances to Assets
80.5 77.6 84.5 76.7 83.1
Investments to
Assets
8.0 8.1 9.4 2.3 11.8
Borrowings to
Liabilities
51.2 30.3 42.6 47.7 39.4
Deposits to
Libilities
17.7 18.3 21.6 24.5 30.4
Table 6.3: Leasing sector ratios (Percent)
67
16
54
8
69
16
44
8
Orix
Standard Chartered
Saudi Pak
NBP
Others
Figure 6.17
Asset concentration in Leasing sector
FY13H1-FY13

47
Though, continuous growth in deposits is a good omen, most of
the increase was limited to a couple of large leasing companies.
Whilst, borrowings from financial institutions observe drop of
around 20 percent due to host of factors including prevailing
business environment, risk averse attitude of both lenders and
leasing companies, improved access to retail deposits and slow
demand for funding needs.
….improved lease-financing disbursements
The lease financing revived with a growth of 4.1 percent in the
half year under review (2.4 percent for FY13). Fresh
disbursements mainly financed vehicles, followed by machinery
and equipments. Importantly, some of the leasing companies
initiated Shariah based lease financing under various Islamic
modes including Musharaka, Diminishing Musharaka and Ijarah
modes. This new avenue of leasing will not only allow these
companies to provide Shariah based products, but also enable
them to diversify their products through taping this underserved
avenue of financing. In terms of assets structure, lease financing
and advances remained the major financing activity of the leasing
companies representing 83 percent of the total assets62 (Table
6.3).
Operating performance improved markedly…
The profitability of the leasing sector observed considerable
improvement mainly attributable to decline in total expenses. The
sector posted profit after tax of PKR 498 million during FY13
compared to loss of PKR 371 million in FY12. Though income
from lease business remained stagnant for the year, 11 percent
YoY decline in overall expense boosted the overall earning of the
leasing sector (Table 6.7). The decrease partly resulted from
lower cost of borrowing and partly from lower provisions charge.
The earnings performance was broad based as 6 out of 8 leasing
companies posted profits. Improved profitability further
increased the ROA and ROE63 to1.5 percent and 12.9 percent
respectively during FY13 (Figure 6.19).
…however, leasing sector continued to exhibit solvency
concerns
The equity base of the leasing sector observed 21 percent growth
during H2FY13, due to accumulation of earnings and substantial
62 NBFC and NE regulation, 2008 (Para 28a) requires Leasing companies to invest at least 70 percent of their assets in the business of leasing. 63 Leasing sector review is based on data for half year ending Jun-13. However for two companies’ financial year ends on December instead of June. To calculate ROA and ROE, profitability is annualized for overall sector.
FY11 H1-FY12 FY12 H1-FY13 FY13
Profit after tax 106 (600) (371) 179 498
Income from lease
operations
3,369 1,877 3,481 1,820 3,475
Income from
investment
2 19 56 35 49
Expense 3,757 2,454 4,394 2,075 3,889
Expense to income 97.0 111.2 99.3 97.0 86.2
Financial expense to
income
55.8 56.1 52.7 53.0 46.0
Table 6.4 : Leasing sector performance indicators
amount in PKR milion, ratio in percent
-4.5
-3.8
-3.0
-2.3
-1.5
-0.8
0.0
0.8
1.5
2.3
-30
-25
-20
-15
-10
-5
0
5
10
15
FY11 H1FY12 FY12 H1FY13 FY13
ROA(RHS) ROE
Figure 6.19
Profitablity indicators of Leasing sector (Percent)

48
capital injection by one of the leasing companies64 Despite
improved equity base, leasing sector remained under-capitalized
as only 3 out of 8 operative leasing firms complied with the
existing minimum equity requirement (MER) of PKR 700 million
set forth by SECP65 (Figure 6.18). Earlier, SECP extended the
period for meeting the MER of PKR 700 million by two years to
end June 201366. However, most of the non-compliant companies
failed to meet the capital requirements within prescribed
timelines, which made going concern status of some of the
companies uncertain.
Investment Banks
The IFCs share further declined in NBFCs…..
The investment banking sector, comprising only seven
companies, continued to face difficulties in improving its
performance. The sector shed 14 percent of assets during
H2FY13, which was observable across the sector, however,
restructuring of the largest IFC was largely responsible for this
substantial decline (Figure 6.21). In addition to challenging
economic environment, stiff competition from the banking sector
and other institutions, offering similar services, also adversely
affected the performance of the IFCs.
…due to funding constraints and shrinking business
With continuing liquidity issues facing the IFCs, it largely focused
on managing liability mix through either settlement or
restructuring. The deposit dipped by 11 percent, while
borrowings from financial institutions decreased by about 20
percent. Given the funding constraints, investment banks failed to
generate new business, which led to balance sheet squeeze. The
lease and advances portfolio decrease 18 percent, while the
investments declined by 28 percent.
..while solvency concerns continued due to deteriorating
earnings
The operating performance of the Investment banks continued in
red due to shrinking business activity. The sector posted loss of
64 During H2FY13, Saudi Pak Leasing issued non-cumulative non-redeemable/convertible preference shares of PKR 10 each aggregating to Rs 528.209 million against conversion of debt. 65 For MER of PKR 700 million required to be met by end June 2013, number of non-compliant firms stays the same. 66 Non-Banking Finance Companies and Notified Entities Regulations, 2008 (amendment vide SRO 764, Dated September 2nd 2009) require fresh
licensed leasing companies to hold Rs. 700 million capital while existing companies to maintain Rs. 350 million by June 30,2011 , Rs. 500 million
by June 30,2012 and Rs. 700 million by June 30,2013).
700
-500
0
500
1000
1500
2000
2500
3000
1 2 3 4 5 6 7 8
Jun-13 Capital required
Figure 6.20
Capital of leasing companies (PKR million)
0.0
0.8
1.6
2.4
3.2
4.0
0
6
12
18
24
30
FY11 H1FY12 FY12 H1FY13 FY13
Assets Equity (RHS)
Figure 6.21
Assets and Equity of IFCs (PKR billion)
(25)
(20)
(15)
(10)
(5)
-
-70
-60
-50
-40
-30
-20
-10
0
FY 11 H1FY12 FY 12 H1FY13 FY13
ROA(After Tax) ROE(After Tax) Asset growth(RHS)
Figure 6.22
Profitability Indicators and Asset growth(percent)

49
PKR 803 million during FY13. The waning business reflected in
decreasing revenues, financing cost and administrative expenses,
which kept the ROE and ROA negative for last many years (Figure
6.22). The persistent losses further eroded the already weak
equity of the sector and at present none of the IFCs meet the
Minimum Equity Requirements set by the SECP67 (Figure 6.23).
The dismal state of affair of the sector merits the attention of the
key policymakers. Towards that end some steps were taken
recently including allowing the brokerage business to IFCs, there
is still a sufficient space for further measures. To this end,
strategy for NBFIs under preparation is expected to provide
roadmap for growth and performance of the IFCs’ sector.
Modaraba
Modaraba, the Islamic finance product, launched in the 1980s has
come a long way to its present position. The sector, over the
years, has seen consolidation and now comprised 24 Modaraba
Management Companies. It primarily catered the unbanked
sections of economic activity like rental services, small scale
manufacturing and trading, as well as small scale retail and
wholesale activity; a domain where the mainstream banking
entities are reluctant to step in.
Modaraba Companies continue gradual and consistent
growth…
Modaraba Companies assets, though count for very small
percentage of the total financial sector, continued gradual and
consistent growth over the last three years and with 4.8 percent
increase during H2FY13 almost matched the asset base of leasing
sector (Figure 6.24). Most of this growth resulted from increase
in Ijarah assets and increase in investments in government
securities. The growth however remained dependent on the
performance of the top three firms, which now hold more than 50
percent of the asset base of the Modaraba Companies (Figure
6.25).
… while exhibiting robust operating performance
Modaraba Companies posted a healthy profit of PKR 2 billion
during FY13 compared to PKR 1.2 billion in the FY12. Total of 20
Modarabas declared profits and 17 Modarabas announced cash
67 Minimum required equity for leasing was Rs.700 million and for IFS it was Rs.1000 million for June 30, 2013, and onwards, as per NBFC & NE
Regulations 2008
-1200
-800
-400
0
400
800
1200
1 2 3 4 5 6 7
FY13 FY12 required
Figure 6.23
Minimum equity required and maintained (PKR million)
10
14
18
22
26
30
34
10
14
18
22
26
30
34
FY10 FY11 H1FY12 FY12 H1FY13 FY13
Total Assets Total equity Number (RHS)
Figure 6.24
Profile of Modaraba Sector
PKR billion No. of Companies
49
65
87
11 51
67
87
13
Top 3 Top 5 Top 10 Rest of firms
Figure: 6.25
Concentration increasing over the period
(Percent share) FY13
H1FY13

50
dividend with two Modarabas declaring bonus issued to their
certificate holders.
The earning resulted from mix of improved Ijarah rentals and
gain on sale of investments. As a result, ROA and ROE improved
by 220 bps and 580 bps to 6.7 percent and 15 percent
respectively during FY13. Healthy earning also improved the total
equity of the Modaraba sector, which went up by 2.5 percent to
Rs.13, 824 million during FY13 (Table 6.5).
.
FY08 FY10 FY11 H1FY12 FY12 H1FY13 FY13
Profit after tax 0.8 0.8 1.1 0.6 1.2 0.6 2.0
Income 5.5 7.9 8.1 3.3 9.0 3.7 10.2
Expenses 1.8 7.1 6.5 2.7 6.9 3.1 8.2
ROA 3.6 3.4 6.7 4.2 4.3 4.3 6.7
ROE 7.9 7.2 9.4 9.3 9.2 9.8 15.0
Table 6.5: Performance Indicators of Modarabas
PKR billion and ratios in percent

51
During H1-CY13, steady growth in premiums continued to strengthen asset base of the insurance sector. The life insurance
business attracted 17.4 percent higher gross premiums on account of higher retention and improved coverage of new life
business. Similarly, the nonlife gross premiums showed a healthy growth of 16.6 percent owing to some improvement in
economic activity and revival of auto finance business. In terms of performance, the profitability of the insurance industry
surged at the back of higher returns from booming stock market, which generally improved the soundness indictors of the
industry.
Asset base of insurance further strengthened as life industry
bolsters
The life insurance sector registered a healthy growth of 9.6 percent
at the back of steady premium flows (Figure 7.1). The trend of life
insurance as a major contributor towards the buildup of sector’s
assets68 maintained during H1-CY13. The growth in life industry’s
assets supported insurance sector cross PKR 600 billion mark. The
sector also witnessed a hefty 16.8 percent growth in gross premium
accumulation with equally impressive growth in both life and
nonlife businesses (Figure 7.2). In addition to offering innovative
and attractive products, the asset base also increased due to gradual
increase in real income of the prospective policyholders69.
Furthermore, revival of auto finance and risk coverage for security
related concerns contributed towards buildup of premiums.
Improved performance of the insurance sector reflected in healthy
growth in earnings. The pre-tax profits improved by 73 percent
(YoY) to PKR 7.2 billion with a major jump witnessed in the nonlife
earnings70. Declining claims ratio coupled with robust capital gains
and dividends from booming stock market surged profitability of the
nonlife companies. Meanwhile, earnings of the life industry
witnessed a moderate growth amid increase in the claims ratio and
higher underwriting / management expenses.
Life Insurance
Improved life premiums compromised by worsening claims ratio
The basis for life insurance coverage has been indemnification
towards financial losses arising from consequences of death, illness
and physical impairment. Apart from conventional policies offered
by the life insurance industry of the country, the robust growth in
recent years has been largely on account of unconventional unit-
68 Life insurance, nonlife insurance and reinsurance 69 Increase in real income is because of declining inflation rate. 70 The high profitability of the nonlife companies is solely due to large numbers of service providers (36) than the life insurance (9) as of end H1-CY13.
Chapter 7 Insurance Sector
0
100
200
300
400
500
600
2010 2011 H1-CY12 H2-CY12 H1-CY13
Reinsurance Non-Life Life
Figure 7.1
Steady growth in size of insurance industry
PKR billion
0
10
20
30
40
50
60
70
80
90
H1-2011 H2-CY11 H1-CY12 H2-CY12 H1-CY13
Reinsurance Life Premiums Non life Premiums
Figure 7.2
Insurance gross premium flows
PKR billion
3031323334353637383940
0
10
20
30
40
50
60
H1CY11 H2CY11 H1CY12 H2CY12 H1CY13
Single Premium Groupsub. year 2nd year1st year Claims Ratio (RHS)
Figure 7.3
Life insurance premiums and claims ratio (flows)
Premiums (PKR billion) Claims ratio (percent)

52
linked products and improved coverage of takaful - Shariah
compliant insurance. During H1-CY13, the assets of conventional life
insurance companies grew by 9.5 percent; while the family takaful
companies witnessed 22 percent growth. Rising demand from
prospective policyholders and growing financial business,
particularly the Islamic banking complemented the increase in
Takaful premiums.
During H1-CY13, the gross life insurance premiums witnessed a
robust increase of 17.4 percent (YoY). The family takaful business
witnessed yearly 38.9 percent growth in gross contributions as
against growth of 16.3 percent in premiums accumulated under
conventional means. As a result, the share of takaful business inched
up to 5.5 percent of total industry premiums.
The retention of policyholders – a measure of trust; remained
instrumental for growth in premiums. The second year and
subsequent premiums witnessed a combined growth of 33.8 percent
(YoY) thereby increasing its share to 55.6 percent. Similarly, the
premiums from new coverage also increased by 12.2 percent,
indicative of improved penetration (Figure 7.3). Meanwhile, the
claims ratio also worsened to 39.3 percent during the period against
36.6 percent in H1-CY12. Much of the increase in claims was
witnessed in case of death and surrenders. However, despite a rise
in the claims ratio, 8 out of 9 companies witnessed underwriting
surplus71.
Given the very nature of life insurance business consisting of long-
term insurance contracts, much of the assets were placed in long-
term government securities. In fact, the life insurance is the second
largest investor in government bonds after the banking sector.
During H1-CY13, the share of government bonds in total assets
inched up to 68 percent, an increase of 1 percent over
corresponding period last year (Figure 7.4)
The profitability of the life insurance increased by 4.1 percent to
PKR 1.26 billion during H1-CY13 (Figure 7.5). This modest
improvement was mainly contributed by increase in investment
income, which further enhanced the ROI to 17.1 percent. This
remarkable improvement, despite a declining interest rate scenario
on government bonds, resulted from gains on sale of investments
and higher returns on investment in equities. However, increase in
expense including reinsurance cost and net claims kept the growth
in net income and overall profitability under check. As such the ROA
of the sector deteriorated over the period under review.
71 Underwriting surplus is the excess of net premiums after deducting expenses of net claims, underwriting expenses and commission to other companies / agents.
0.0
0.2
0.4
0.6
0.8
1.0
1.2
1.4
-60
-40
-20
0
20
40
60
80
100
Net Claims Net PremiumsManagement Expense Net Investment IncomePBT (RHS)
Figure 7.5
Life insurance profitability (PKR billion)
H1-CY11 H2-CY11 H1-CY12 H2-CY12 H1-CY13
9%
7%
67%
11%
6%Current Assets
9%
Loans6%
Government Bonds68%
Equities and Sukuks
11%
Other Assets6%
CY12
H1CY13
Figure 7.4
Structure of Life insurance (percent of assets)
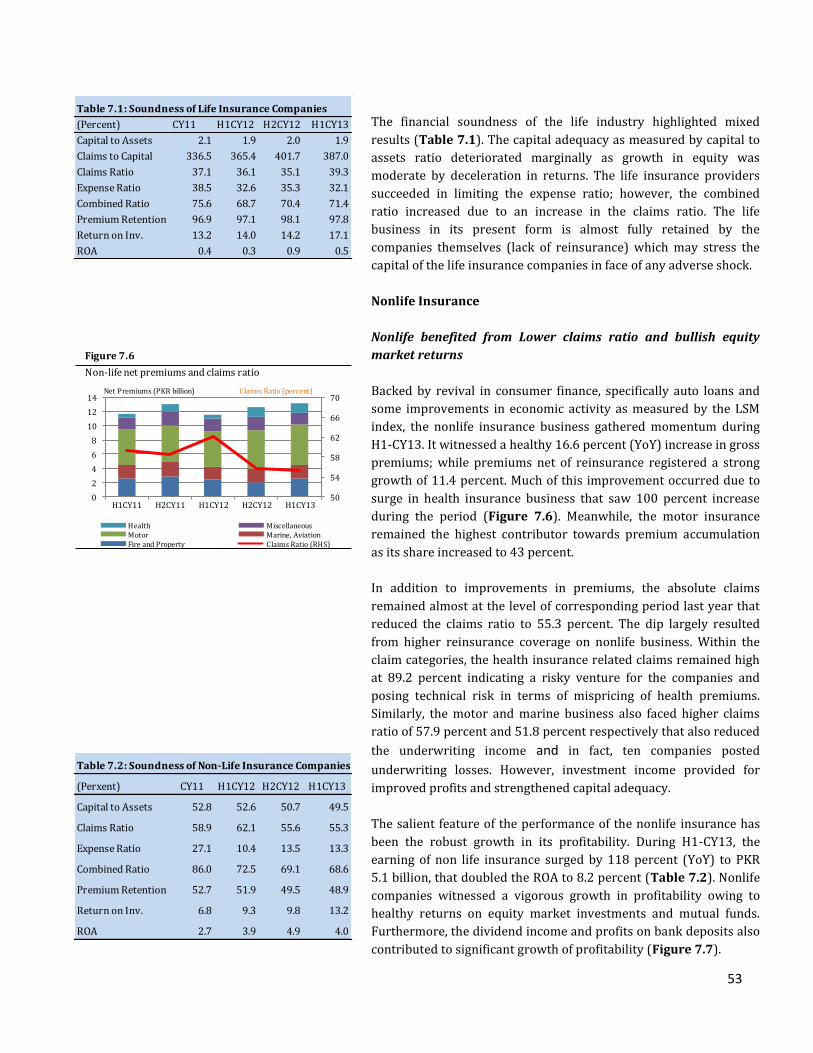
53
The financial soundness of the life industry highlighted mixed
results (Table 7.1). The capital adequacy as measured by capital to
assets ratio deteriorated marginally as growth in equity was
moderate by deceleration in returns. The life insurance providers
succeeded in limiting the expense ratio; however, the combined
ratio increased due to an increase in the claims ratio. The life
business in its present form is almost fully retained by the
companies themselves (lack of reinsurance) which may stress the
capital of the life insurance companies in face of any adverse shock.
Nonlife Insurance
Nonlife benefited from Lower claims ratio and bullish equity
market returns
Backed by revival in consumer finance, specifically auto loans and
some improvements in economic activity as measured by the LSM
index, the nonlife insurance business gathered momentum during
H1-CY13. It witnessed a healthy 16.6 percent (YoY) increase in gross
premiums; while premiums net of reinsurance registered a strong
growth of 11.4 percent. Much of this improvement occurred due to
surge in health insurance business that saw 100 percent increase
during the period (Figure 7.6). Meanwhile, the motor insurance
remained the highest contributor towards premium accumulation
as its share increased to 43 percent.
In addition to improvements in premiums, the absolute claims
remained almost at the level of corresponding period last year that
reduced the claims ratio to 55.3 percent. The dip largely resulted
from higher reinsurance coverage on nonlife business. Within the
claim categories, the health insurance related claims remained high
at 89.2 percent indicating a risky venture for the companies and
posing technical risk in terms of mispricing of health premiums.
Similarly, the motor and marine business also faced higher claims
ratio of 57.9 percent and 51.8 percent respectively that also reduced
the underwriting income and in fact, ten companies posted
underwriting losses. However, investment income provided for
improved profits and strengthened capital adequacy.
The salient feature of the performance of the nonlife insurance has
been the robust growth in its profitability. During H1-CY13, the
earning of non life insurance surged by 118 percent (YoY) to PKR
5.1 billion, that doubled the ROA to 8.2 percent (Table 7.2). Nonlife
companies witnessed a vigorous growth in profitability owing to
healthy returns on equity market investments and mutual funds.
Furthermore, the dividend income and profits on bank deposits also
contributed to significant growth of profitability (Figure 7.7).
Table 7.1: Soundness of Life Insurance Companies
(Percent) CY11 H1CY12 H2CY12 H1CY13
Capital to Assets 2.1 1.9 2.0 1.9
Claims to Capital 336.5 365.4 401.7 387.0
Claims Ratio 37.1 36.1 35.1 39.3
Expense Ratio 38.5 32.6 35.3 32.1
Combined Ratio 75.6 68.7 70.4 71.4
Premium Retention 96.9 97.1 98.1 97.8
Return on Inv. 13.2 14.0 14.2 17.1
ROA 0.4 0.3 0.9 0.5
50
54
58
62
66
70
0
2
4
6
8
10
12
14
H1CY11 H2CY11 H1CY12 H2CY12 H1CY13
Health MiscellaneousMotor Marine, Aviation Fire and Property Claims Ratio (RHS)
Figure 7.6
Non-life net premiums and claims ratio
Net Premiums (PKR billion) Claims Ratio (percent)
Table 7.2: Soundness of Non-Life Insurance Companies
(Perxent) CY11 H1CY12 H2CY12 H1CY13
Capital to Assets 52.8 52.6 50.7 49.5
Claims Ratio 58.9 62.1 55.6 55.3
Expense Ratio 27.1 10.4 13.5 13.3
Combined Ratio 86.0 72.5 69.1 68.6
Premium Retention 52.7 51.9 49.5 48.9
Return on Inv. 6.8 9.3 9.8 13.2
ROA 2.7 3.9 4.9 4.0

54
The soundness indicators of nonlife service providers exhibited
relatively steady position. Improved earnings during the year
boosted the equity base of the non-life business, which improved
the capital to assets ratio by 40 bps. Meanwhile with a reduction in
claims ratio, the expense ratio also reduced to 68.6 percent.
Reinsurance
Asset base decline and yet profits rise
The nonlife reinsurance witnessed a 9.3 percent decline in the asset
base during H1-CY13 largely for settlement of amounts due to other
insurers and dividend payout during the period under review. The
company distributed PKR 900 million annual cash dividend for CY12
to its shareholders which reduced the equity of the company
through partial liquidation of investments that shrunk by 4.7
percent. However, the gross premiums did improve by 9.7 percent
(YoY) on account of healthy growth in nonlife business.
The operating performance of the company observed improvement
during H1-CY13 as company posted 33 percent higher earnings
(YoY) basis. Though underwriting income declined due to increase
in claims and premium related expenses, profits of the company
surged at the back of healthy returns on investments that led to
increase in ROA to 10.4 percent in H1-CY13 compared to 9.4 percent
in H1-CY12 (Table 7.3).
-6
-4
-2
0
2
4
6
8
Expenses Investment income Core income PBT
Figure 7.7
Profitability of Nonlife Companies (PKR billion)
H1-CY11 H2-CY11 H1-CY12 H2-CY12 H1-CY13
CY11 H1CY12 H2CY12 H1CY13
Equity 6.4 5.9 6.3 6.0
Investments 5.8 5.2 6.4 6.1
Gr. Premiums 6.9 3.1 5.1 3.4
Net. Premiums 3.5 2.1 2.1 2.2
Net Claims 2 1.0 1.0 1.1
Expenses 0.4 0.6 0.6 0.7
Profits 0.8 0.6 0.6 0.8
Assets 12.9 12.5 16.1 14.6
Table 7.3: Profile of Reinsurance (PKR billion)

55
The payment system managed to handle both large valued and retail transactions efficiently during H1-CY13 with
reduced downtime and without any material disruption. The Pakistan Real Time Interbank Settlement Mechanism
(PRISM) settled increased value and quantum of transactions along with the provision of required liquidity facility
through Intra-day Liquidity Facility (ILF) despite stressed marked liquidity conditions. The retail banking also grew,
largely due to flourishing e-banking on the back of rising awareness and improved infrastructure. With significant
number of new entrants, Branchless Banking (BB) also witnessed robust growth and diversity over the half year.
One of the key objectives of SBP as a regulator of payment
system is to ensure continued availability of safe and efficient
payment system. SBP has come a long way with a number of
initiatives to bring about further efficiency and reliability in the
existing payment system of the country. Complementing SBP’s
endeavors, the large scale investment in IT infrastructure over
years from financial institutions particularly banks, has resulted
in innovative, resilient, and efficient Alternative Delivery
Channels (ADCs) in payment system. Specifically, the
development of core banking solutions has helped in achieving
higher degree of operational efficiency, better and more
diversified provision of services, and higher reliability of
systems.
As a core Large Value Payment (LVP) mechanism, Pakistan Real
Time Interbank Settlement Mechanism (PRISM)72 continued to
manage increased value and volume of large transactions during
the half year under review. It handled PKR 81.1 trillion worth of
256 thousand transactions exhibiting growth of 0.3 percent and
10.4 percent in value and volume respectively over the previous
half (Table 8.1 & Figure 8.1). Due to continued tight liquidity
conditions during the half, SBP provided another PKR 4.1 trillion
of ILF (5.1 percent of overall value) during H1-CY13, about 8.8
percent higher than the previous half year. The retail payment
mechanism also played a significant part and handled PKR 69.6
trillion of 347.9 million transactions; growing by 4.6 percent and
4.9 percent in value and volume respectively. Though paper
based transactions still lead the retail payments, e-banking share
is continuously on the rise. With the entry of 3 new market
players (all banks) during the half, BB grew with the rapid pace.
72 PRISM transactions are classified as large value transactions due to high average size of transaction; however, there is no downside limit of the transaction.
Chapter 8 Payment Systems
Table 8.1: Profile of Payment System Mechanisms
Mechanism Volume Value Volume Value
PRISM 231.9 80.9 256.1 81.1
Retail Payments 331,600 66.5 347,859 69.6
Paper based 180,800 52.5 177,599 53.9
E-transactions 150,800 14.0 170,260 15.7
H2-CY12 H1-CY13
Volume in thousands and value in trillion Rupees
0102030405060708090
-30
20
70
120
170
220
270
H1 H2 H1 H2 H1 H2 H1 H2 H1
CY09 CY10 CY11 CY12 CY13
Volume Value (RHS)
Figure 8.1
Growing trend of PRISM transactions
volume in '000' PKR trillion
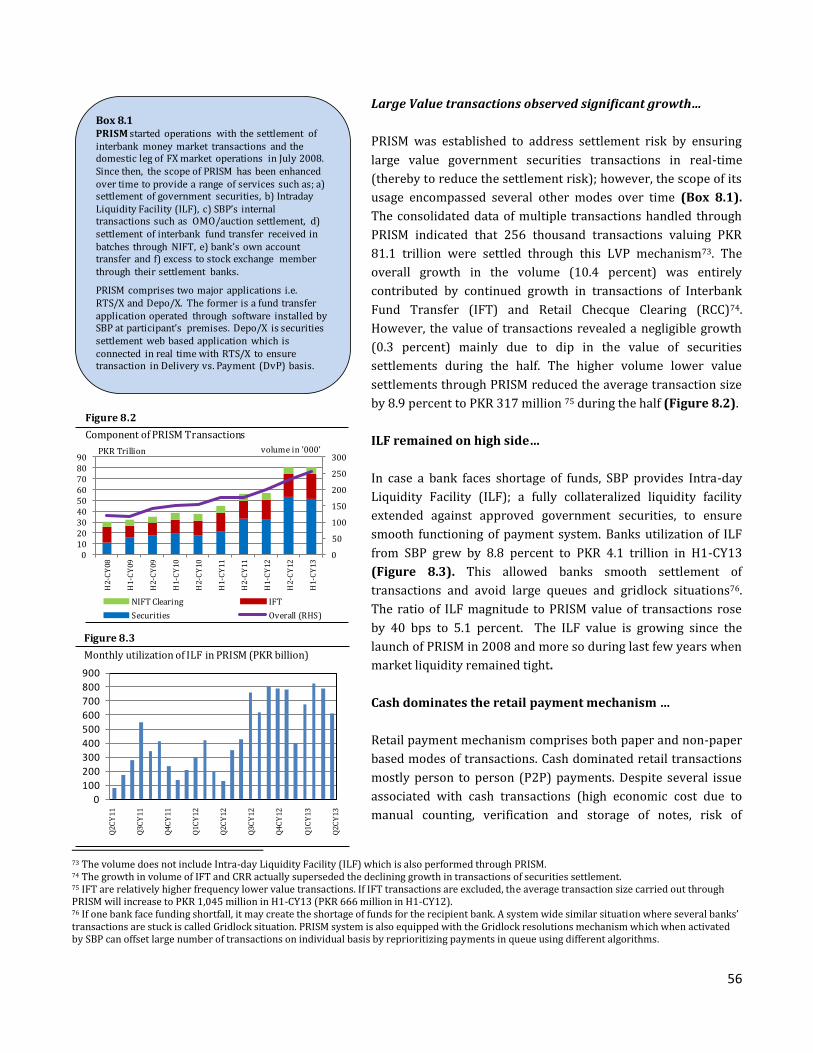
56
Large Value transactions observed significant growth…
PRISM was established to address settlement risk by ensuring
large value government securities transactions in real-time
(thereby to reduce the settlement risk); however, the scope of its
usage encompassed several other modes over time (Box 8.1).
The consolidated data of multiple transactions handled through
PRISM indicated that 256 thousand transactions valuing PKR
81.1 trillion were settled through this LVP mechanism73. The
overall growth in the volume (10.4 percent) was entirely
contributed by continued growth in transactions of Interbank
Fund Transfer (IFT) and Retail Checque Clearing (RCC)74.
However, the value of transactions revealed a negligible growth
(0.3 percent) mainly due to dip in the value of securities
settlements during the half. The higher volume lower value
settlements through PRISM reduced the average transaction size
by 8.9 percent to PKR 317 million 75 during the half (Figure 8.2).
ILF remained on high side…
In case a bank faces shortage of funds, SBP provides Intra-day
Liquidity Facility (ILF); a fully collateralized liquidity facility
extended against approved government securities, to ensure
smooth functioning of payment system. Banks utilization of ILF
from SBP grew by 8.8 percent to PKR 4.1 trillion in H1-CY13
(Figure 8.3). This allowed banks smooth settlement of
transactions and avoid large queues and gridlock situations76.
The ratio of ILF magnitude to PRISM value of transactions rose
by 40 bps to 5.1 percent. The ILF value is growing since the
launch of PRISM in 2008 and more so during last few years when
market liquidity remained tight.
Cash dominates the retail payment mechanism …
Retail payment mechanism comprises both paper and non-paper
based modes of transactions. Cash dominated retail transactions
mostly person to person (P2P) payments. Despite several issue
associated with cash transactions (high economic cost due to
manual counting, verification and storage of notes, risk of
73 The volume does not include Intra-day Liquidity Facility (ILF) which is also performed through PRISM. 74 The growth in volume of IFT and CRR actually superseded the declining growth in transactions of securities settlement. 75 IFT are relatively higher frequency lower value transactions. If IFT transactions are excluded, the average transaction size carried out through PRISM will increase to PKR 1,045 million in H1-CY13 (PKR 666 million in H1-CY12). 76 If one bank face funding shortfall, it may create the shortage of funds for the recipient bank. A system wide similar situation where several banks’ transactions are stuck is called Gridlock situation. PRISM system is also equipped with the Gridlock resolutions mechanism which when activated by SBP can offset large number of transactions on individual basis by reprioritizing payments in queue using different algorithms.
Box 8.1PRISM started operations with the settlement of interbank money market transactions and the domestic leg of FX market operations in July 2008. Since then, the scope of PRISM has been enhanced over time to provide a range of services such as; a) settlement of government securities, b) Intraday Liquidity Facility (ILF), c) SBP’s internal transactions such as OMO/auction settlement, d) settlement of interbank fund transfer received in batches through NIFT, e) bank’s own account transfer and f) excess to stock exchange member through their settlement banks.
PRISM comprises two major applications i.e. RTS/X and Depo/X. The former is a fund transfer application operated through software installed by SBP at participant’s premises. Depo/X is securities settlement web based application which is connected in real time with RTS/X to ensure transaction in Delivery vs. Payment (DvP) basis.
0
50
100
150
200
250
300
0102030405060708090
H2
-CY
08
H1
-CY
09
H2
-CY
09
H1
-CY
10
H2
-CY
10
H1
-CY
11
H2
-CY
11
H1
-CY
12
H2
-CY
12
H1
-CY
13
NIFT Clearing IFT
Securities Overall (RHS)
Figure 8.2
Component of PRISM Transactions
PKR Trillion volume in '000'
0
100
200
300
400
500
600
700
800
900
Figure 8.3
Monthly utilization of ILF in PRISM (PKR billion)
Q2
CY
11
Q3
CY
11
Q4
CY
11
Q1
CY
12
Q2
CY
12
Q3
CY
12
Q4
CY
12
Q1
CY
13
Q2
CY
13

57
theft/loss etc), cash dominance may be attributed to host of
factors including lack of awareness to alternative modes,
liquidity preference, perceived public confidence on currency,
cultural issues, low financial inclusion, and intended avoidance of
record keeping for tax evasion. Apart from cash-based
transactions, the rest of retail payments were subjugated by
traditional cheque-based transactions followed by emerging e-
banking transaction which accelerated in growth in recent years
with the support of technological improvement (Figure 8.4).
Cheques handled most of paper-based retail payments…
In order to bring efficiency in clearing and settlement processes,
SBP is working on standardization of financial instruments with
initial emphasis on standardization of cheques (also referred as
cheque truncation) while at the same time improving its security
features. This step intends to speed up the overall cheque
clearing process and minimize the fraudulent activities.
Overall, paper based retail payment mechanism handled PKR
53.9 trillion worth of 177.6 million transactions showing 2.7
percent growth in value while 1.8 percent decline in volume in
H1-CY13 over the previous half. Resultantly, the average
transaction size rose with a significant jump to PKR 303.2
thousand in the half under review against PKR 290.1 thousand in
previous half. Segment-wise classification reveals a clear ruling
of cheque-based transactions contributing 84.5 percent (PKR
45.5 trillion) share in value and 94.1 percent share in volume of
retail payments followed by pay orders as the second best
(Figure 8.5). Interestingly, 49.5 percent of cheques transactions
were carried out for cash withdrawals contained only 16.8
percent share in volume. In contrast, cheque payments for
transfer carries only 31.5 percent share in volume while 55.1
percent share in value (Table 8.2).
e-banking continued to rise …
In Pakistan, e-banking evolved over time, and with growing
trend, has started to gain importance in retail banking. This
technology based transaction mechanism has benefited the large
customer base through efficient, reliable, and diversified banking
services using non-traditional ADCs. Consequently, the value
share of e-banking in overall retail payment transactions rose to
22.2 percent on end June – 2013 (20.6 percent as of end
December 2012). During the half, 170.2 million e-banking
transactions were conducted, showing an increase of 12.9
54
56
58
60
62
64
66
68
70
72
290
300
310
320
330
340
350
360
H2-CY11 H1-CY12 H2-CY12 H1-CY13
Volume Value (RHS)
Figure 8.4
Retail payment trend
volume in millions PKR trillion
94%
84%
Cheques
Pay Orders
Demand Draft
Others
Figure 8.5
Composition of paper-based retail transactions during H1CY13
Number
(000,000)
Amount
Billion PKR
Volume
Share
Value
share
Cash 83.1 7,980.8 48.9% 17.2%
Transfer 55.6 25,928.9 32.8% 56.0%
Clearing 31.1 12,358.6 18.3% 26.7%
Refund 0.0 28.4 0.0% 0.1%
Table 8.2: Chequing Transactions in H1-CY13
12
13
14
15
16
H2-CY12 H1-CY13
Mobile Banking Internet Banking
Call Center POS
PKR trillion
Figure 8.6
E-Banking Transactions

58
percent; so was the case with value that grew by 10.6 percent to
reach PKR 15.5 trillion (Figure 8.6 & 8.7). The basic
infrastructure of payment system showed a considerable
improvement with a significant addition of new Real Time Online
Banking (RTOB), ATMs, and plastic cards during the half under
review (Table 8.3).
RTOBs dominated e-banking…
With the addition of 117 branches to the network, the number of
online bank branches reached 10,013 which is 94.6 percent of
total bank branches across the country. The overall value and
volume of payments through RTOB grew by 11.7 percent and 5.9
percent respectively that increased the average transaction size
to PKR 0.312 million in H1-CY13 compared to PKR 0.295million
in the previous half. There were few banks with average
transaction size significantly larger than overall industry
average; however, the overall share of such banks in total value
of transactions was quite small. Bank-wise value share of RTOB
payments during H1-CY13 was confined to few banks only; much
more than their relative asset share of the industry (Figure 8.8).
ATM’s growth was impressive…
With a growth of 8.4 percent, a total of 525 more ATMs were
added by various banks (more so in the second quarter of CY13),
thus bringing the total number of ATMs installed to 6,75777. The
bank-wise data revealed that the growth in ATM’s number was
largely contributed by top five banks (in terms of assets) and
partially by few other middle tier and small banks (Figure 8.9).
The banking sector handled 107.3 million transactions worth
PKR 1.07 trillion through ATM channel showing 18.6 percent and
16.1 percent growth in value and volume respectively.
Furthermore, due to rise in per ATMs card withdrawal limit
offered by various banks, the average ATMs transaction size
increased from PKR 9,794 to PKR 10,007 during the half.
However, the detailed bank-wise data reveals significant
dispersion in average ATM transaction size amongst banks.
77 The rise in ATM’s number was partially resulted from SBP’s instruction to add one ATM against each newly opened branch from CY13 onward and to fill the gap between numbers of existing branches with matching ATMs in next five years (BPRD Circular No.3 of 2012).
-100 200 300 400 500 600 700 800 900
1,000
B1
B3
B5
B7
B9
B11
B13
B15
B17
B19
B2
1B2
3B2
5B2
7B2
9B3
1B3
3B3
5
Bank-wise Overall
Figure 8.8
RTOB's Average Transactoin during H1-CY13
020
4060
80100
120140160180
H2-CY12 H1-CY13
Mobile Banking Internet BankingCall Center POS
Figure 8.7
E-Banking Transactions (volume-wise)
in '000'
-50
0
50
100
150
200
250
300
B1
B4
B7
B1
0
B1
3
B1
6
B1
9
B2
2
B2
5
B2
8
B3
1
B3
4
B3
7
Bank-wise Figure 8.9
Bank-wise increase in ATM's numbers - H1-CY13
CY12 H1CY13Growth H1-
CY13
ATMs 5,987 6,757 12.9%
Online Branches Network 9,412 10,013 6.4%
POS 34,229 33,748 -1.4%
Credit Cards (000) 1,274 1,088 -14.6%
Debit Cards (000) 17,588 20,267 15.2%
ATM Only Cards (000) 806 962 19.3%
Table 8.3: E-Banking Infrastrcture Position

59
The scope of ATM channel in the e-banking world has
significantly widened in recent past. ATMs are now covering
round the clock cash withdrawal and deposits, utility bill
payments, domestic and cross-border fund transfer, credit card
payments etc. The consistent availability of services in minimum
time is imperative for the efficiency of ATMs. The downtime of
ATMs during working hrs (9am to 9 pm) marginally reduced to
9.6 percent during H1-CY1378 from 9.9 percent in previous half.
However, the downtime for non-working hrs (9pm-9am)
increased to 13.4 percent from 12.7 percent in the last half
(Figure 8.10). A number of factors that may have added to
downtime include migration to new software, frequent
interruption in power supply, introduction to multi-vendor ATMs
software, breakdown in system-wide link, security concerns, etc.
The downfall in credit card business reduced POSs…
The number of credit cards during H1-CY13 reduced by 13.8
percent to 1.08 million as on June 30, 2013. Following the same
trend, POS terminals also declined by 2.8 percent (976) during
the half to 33,748 POSs nationwide on end June 2013. However,
despite the decline in physical infrastructure, the value and
volume of POS based payments showed a positive growth by 7.4
percent and 1.3 percent respectively. High valued transactions
with lesser POSs resulted in improved average transaction size to
PKR 5,112/- during H1-CY13 compared to PKR 4,824 in the
previous half. It may be worth mentioning that banks remained
shy from consumer finance especially during last few years due
to heighted credit risk in this particular segment and availability
of risk free government security as an alternative financing
channel.
Internet banking continued to gain importance …
The use of internet banking, third largest mode in e-banking after
RTOB and ATMs, is evolving with an impressive pace and
creating its space in retail payment system. With the prime
feature of convenience and improved security, internet banking
has got its size doubled in last two years. During the half under
consideration, internet banking observed a double-digit growth
in value and volume, i.e., 18.6 percent and 26.7 percent
respectively. This mode handled PKR 271 billion worth of 5.35
million transactions with an average transaction size of PKR
50,493 during H1-CY13.
78 Average downtime of two quarters is calculated for full half
4.0
6.0
8.0
10.0
12.0
14.0
16.0
18.0
Q1CY12 Q2CY12 Q3CY12 Q4CY12 Q1CY13 Q2CY13
9AM - 9 PM 9PM - 9AM
Figure 8.10
Downtime of ATMs (percent share)

60
Branchless banking growing…
With the fast growing technological innovations, the financial
institutions (particularly banks) have joined hands with
telecommunication sector to offer a wide ranged efficient,
reliable and user friendly financial services through BB. This
form of payment has resulted not only in enhanced reach of
financial services to unbanked customers (financial inclusion)
but also benefited banks in term of cost effectiveness. The BB can
also provide tremendous opportunity for Government to Persons
(G2P) and Person to Government (P2G) payments in Pakistan.
BB was pioneered by Tameer Microfinance Bank through its Easy
Paisa model in year 2009 and United Bank Limited’s (UBL) Omni
in 2010. After witnessing their success, six more players
including banks and telecoms have now entered the arena of BB,
which boosted the overall growth of BB services. During H1-
CY13, the transactions observed substantial growth due to
increasing number of BB’s agents. In H1-CY13, BB managed PKR
344 billion worth of 86 million transactions with the growth of
27.8 percent and 17.9 percent in value and volume respectively
(Table 8.4). BB’s payment is dominated by Over the counter
(OTC) transactions - transactions from one CNIC to another CNIC
that do not involve mobile wallet – which contributes around 83
percent share in BB. On the other side, M-wallets transactions
was the second best with 12 percent share. On average, 477
thousand transactions were performed per day by agents with an
average transaction size of Rs. 4,005. Alongside, BB accounts
witnessed a growth of 25.1 percent during the half and reached
2.64 million in numbers. Similarly, the number of agents offering
branchless banking services has crossed 93,800.
Branchless banking industry is expected to become more
competitive and cost effective with the entry of new players.
During the last two quarters, three new players, i.e., Mobicash,
Time Pay, and HBL Express have initiated BB operations,
whereas in addition U-Microfinance Bank commenced its
branchless banking operations under the brand name U-Paisa in
August 2013 as well.
H1CY12 H2CY12 H1CY13Growth
H1CY13
No. of Agents 29,525 41,567 93,862 125.8%
No. of Accounts (in 000) 1,447 2,112 2,643 25.1%
Deposits as of Date
(million PKR ) 753 1,055 2,391 126.6%
Transactions (No. in
million) 54 67 86 27.8%
Value of Transactions
(PKR billion) 200 292 344 17.9%
Average Size of
Transaction (PKR) 3,732 4,343 4,005 -7.8%
Average No. of Transaction
Per Day (in 000) 298 373 477 27.8%
Table 8.4: Key Highlights of Branchless Banking

61
Annexures

62
List of Annexures
1. Statistics of the Overall Banking System ......................................................................................................... 64
Table 1.1: Key variables of Balance Sheet and Profit & Loss Statement ......................................................... 64
Table 1.2: Growth Rates of Key Variables and Key Financial Soundness Indicators (FSIs).............................. 64
Table 1.3: Group wise Balance Sheets and Income Statements of Banks....................................................... 65
Table 1.4: Financial Soundness Indicators* ..................................................................................................... 66
Table 1.5: Banks’ category-wise key variables ................................................................................................ 68
Table 1.6: Concentration in the Banking System ............................................................................................ 70
Asset Quality: ....................................................................................................................................................... 71
Table 1.7: Asset Quality Indicators of the Banking System ............................................................................. 71
Table 1.8: Segment-wise Advances and Non Performing Loans (NPLs) .......................................................... 73
Table 1.9: Sector-wise Advances and Non Performing Loans (NPLs) .............................................................. 73
Soundness & Resilience: ...................................................................................................................................... 74
Table 1.10: Category-wise Profitability of the Banking System ...................................................................... 74
Table 1.11: Category-wise Profitability Indicators of the Banking System ..................................................... 74
Table 1.12: Break-up of Mark-up/Return/Interest Earned ............................................................................. 75
Table 1.13: Distribution of Banks by Capital Adequacy Ratio (CAR) ............................................................... 75
Table 1.14: Capital Structure and Capital Adequacy of All Banks and DFIS .................................................... 76
Table 1.15: Stress Testing Results of the Banking System ............................................................................... 77
Table 1.16: List of Banks .................................................................................................................................. 78
2. Islamic Banking ................................................................................................................................................ 79
Table 2.1: Group-wise Balance Sheets and Income Statements of Islamic Banks/Branches .......................... 79
Table 2.2: Financial Soundness Indicators of Islamic Banking ......................................................................... 80
Table 2.3: List of Islamic Banks ........................................................................................................................ 81
3. Non-Banking Financial Institutions.................................................................................................................. 82
Table 3.1: Balance Sheets and Income Statements of DFIs............................................................................. 82
Table 3.2: Financial Soundness Indicators of DFIs ........................................................................................... 83
Table 3.3: List of Development Finance Institutions ....................................................................................... 84
Table 3.4: NBFC’s category-wise key variables ................................................................................................ 85
Table 3.5: List of Non-Banking Finance Companies ........................................................................................ 86

63
4. Insurance Sector .............................................................................................................................................. 88
Table 4.1: Insurance Sector: Category-wise key variables .............................................................................. 88
Table 4.2: List of Insurance Companies ........................................................................................................... 89
Note: Figures for the calendar years (CY) are based on annual audited accounts for that year. While, figures
for quarters (Mar, Jun, Sep, and Dec) are based on unaudited Quarterly Report of Condition (QRC)
submitted by banks. Moreover, FY stands for Financial Year.

64
1. Statistics of the Overall Banking System
Table 1.1: Key variables of Balance Sheet and Profit & Loss Statement
Table 1.2: Growth Rates of Key Variables and Key Financial Soundness
Indicators (FSIs)
Column1 CY06 CY07 CY08 CY09 CY10 CY11 Jun-12 CY12 Jun-13
Total Assets 4,353 5,172 5,628 6,516 7,117 8,171 8,653 9,711 10,090
Investments (net) 833 1,276 1,087 1,737 2,157 3,055 3,275 4,013 4,253
Advances (net) 2,428 2,688 3,173 3,240 3,358 3,349 3,573 3,804 3,727
Deposits 3,255 3,854 4,218 4,786 5,451 6,244 6,803 7,294 7,756
Equity 402 544 563 660 695 784 808 882 901
Profit Before Tax (ytd) 124 107 63 81 105 170 99 178 82
Profit After Tax (ytd) 84 73 43 54 65 112 64 118 55
Provisioning Charges (ytd) 22 60 106 97 75 50 11 40 18
Non-Performing Loans 177 218 359 446 556 592 635 615 616
Non-Performing Loans (net) 39 30 109 134 185 182 214 176 165 Note: Statistics of profits are on year-to-date (ytd) basis.
PKR billion
CY07 CY08 CY09 CY10 CY11 CY12
Growth Rates YoY YoY YoY YoY YoY QoQ YoY YoY QoQ YoY
Assets 18.8 8.8 15.8 9.2 14.8 3.2 12.2 18.9 3.7 16.6
Loans (Net) 10.7 18.0 2.1 3.7 (0.3) 4.2 5.6 12.9 (0.1) 4.3
Deposits 18.4 9.4 13.5 13.9 14.5 7.7 14.0 16.8 7.2 14.0
Investments (Net) 53.1 (14.8) 59.9 24.2 41.6 2.7 25.0 31.4 2.2 29.8
Equity 35.3 3.4 17.3 5.2 12.9 2.6 11.8 12.5 4.3 11.5
KEY FSIs: CY07 CY08 CY09 CY10 CY11 CY12
Capital Adequacy Ratio 12.3 12.2 14.0 13.9 15.1 15.6
Capital to Total Assets 10.5 10.0 10.1 9.8 9.6 9.1
NPLs to Loans (Gross) 7.6 10.5 12.6 14.9 15.7 14.5
Net NPLs to Net Loans 1.1 3.4 4.1 5.5 5.4 4.6
ROA (Before Tax) 2.2 1.2 1.3 1.5 2.2 2.0
ROE^ (Before Tax) 22.6 11.4 13.2 15.5 23.0 21.4
Liquid Assets/ Total Deposits 45.1 37.7 44.5 47.1 59.5 64.5
Advances to Deposit Ratio 69.7 75.2 67.7 61.6 53.6 52.2
^ Based on Average Equity plus Surplus on Revaluation.
Percent
4.4
1.7
18.5
63.7
48.1
Jun-13
Jun-13
15.5
8.9
14.8
2.4
Jun-12
Jun-12
15.1
9.3
15.9
25.9
54.3
52.5
6.0
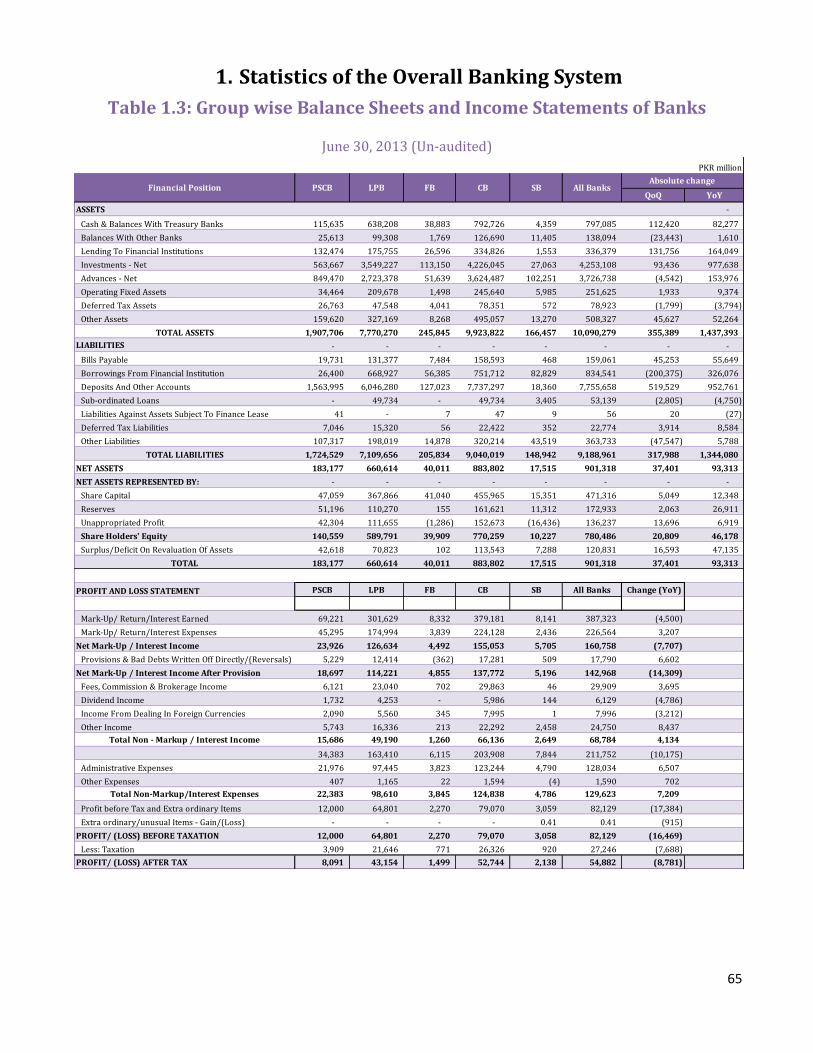
1. Statistics of the Overall Banking System
65
Table 1.3: Group wise Balance Sheets and Income Statements of Banks
June 30, 2013 (Un-audited)
PKR million
QoQ YoY
ASSETS -
Cash & Balances With Treasury Banks 115,635 638,208 38,883 792,726 4,359 797,085 112,420 82,277
Balances With Other Banks 25,613 99,308 1,769 126,690 11,405 138,094 (23,443) 1,610
Lending To Financial Institutions 132,474 175,755 26,596 334,826 1,553 336,379 131,756 164,049
Investments - Net 563,667 3,549,227 113,150 4,226,045 27,063 4,253,108 93,436 977,638
Advances - Net 849,470 2,723,378 51,639 3,624,487 102,251 3,726,738 (4,542) 153,976
Operating Fixed Assets 34,464 209,678 1,498 245,640 5,985 251,625 1,933 9,374
Deferred Tax Assets 26,763 47,548 4,041 78,351 572 78,923 (1,799) (3,794)
Other Assets 159,620 327,169 8,268 495,057 13,270 508,327 45,627 52,264
TOTAL ASSETS 1,907,706 7,770,270 245,845 9,923,822 166,457 10,090,279 355,389 1,437,393
LIABILITIES - - - - - - - -
Bills Payable 19,731 131,377 7,484 158,593 468 159,061 45,253 55,649
Borrowings From Financial Institution 26,400 668,927 56,385 751,712 82,829 834,541 (200,375) 326,076
Deposits And Other Accounts 1,563,995 6,046,280 127,023 7,737,297 18,360 7,755,658 519,529 952,761
Sub-ordinated Loans - 49,734 - 49,734 3,405 53,139 (2,805) (4,750)
Liabilities Against Assets Subject To Finance Lease 41 - 7 47 9 56 20 (27)
Deferred Tax Liabilities 7,046 15,320 56 22,422 352 22,774 3,914 8,584
Other Liabilities 107,317 198,019 14,878 320,214 43,519 363,733 (47,547) 5,788
TOTAL LIABILITIES 1,724,529 7,109,656 205,834 9,040,019 148,942 9,188,961 317,988 1,344,080
NET ASSETS 183,177 660,614 40,011 883,802 17,515 901,318 37,401 93,313
NET ASSETS REPRESENTED BY: - - - - - - - -
Share Capital 47,059 367,866 41,040 455,965 15,351 471,316 5,049 12,348
Reserves 51,196 110,270 155 161,621 11,312 172,933 2,063 26,911
Unappropriated Profit 42,304 111,655 (1,286) 152,673 (16,436) 136,237 13,696 6,919
Share Holders' Equity 140,559 589,791 39,909 770,259 10,227 780,486 20,809 46,178
Surplus/Deficit On Revaluation Of Assets 42,618 70,823 102 113,543 7,288 120,831 16,593 47,135
TOTAL 183,177 660,614 40,011 883,802 17,515 901,318 37,401 93,313
PROFIT AND LOSS STATEMENT PSCB LPB FB CB SB All Banks Change (YoY)
Mark-Up/ Return/Interest Earned 69,221 301,629 8,332 379,181 8,141 387,323 (4,500)
Mark-Up/ Return/Interest Expenses 45,295 174,994 3,839 224,128 2,436 226,564 3,207
Net Mark-Up / Interest Income 23,926 126,634 4,492 155,053 5,705 160,758 (7,707)
Provisions & Bad Debts Written Off Directly/(Reversals) 5,229 12,414 (362) 17,281 509 17,790 6,602
Net Mark-Up / Interest Income After Provision 18,697 114,221 4,855 137,772 5,196 142,968 (14,309)
Fees, Commission & Brokerage Income 6,121 23,040 702 29,863 46 29,909 3,695
Dividend Income 1,732 4,253 - 5,986 144 6,129 (4,786)
Income From Dealing In Foreign Currencies 2,090 5,560 345 7,995 1 7,996 (3,212)
Other Income 5,743 16,336 213 22,292 2,458 24,750 8,437
Total Non - Markup / Interest Income 15,686 49,190 1,260 66,136 2,649 68,784 4,134
34,383 163,410 6,115 203,908 7,844 211,752 (10,175)
Administrative Expenses 21,976 97,445 3,823 123,244 4,790 128,034 6,507
Other Expenses 407 1,165 22 1,594 (4) 1,590 702
Total Non-Markup/Interest Expenses 22,383 98,610 3,845 124,838 4,786 129,623 7,209
Profit before Tax and Extra ordinary Items 12,000 64,801 2,270 79,070 3,059 82,129 (17,384)
Extra ordinary/unusual Items - Gain/(Loss) - - - - 0.41 0.41 (915)
PROFIT/ (LOSS) BEFORE TAXATION 12,000 64,801 2,270 79,070 3,058 82,129 (16,469)
Less: Taxation 3,909 21,646 771 26,326 920 27,246 (7,688)
PROFIT/ (LOSS) AFTER TAX 8,091 43,154 1,499 52,744 2,138 54,882 (8,781)
Financial Position PSCB LPB FB CB SB All BanksAbsolute change

1. Statistics of the Overall Banking System
66
Table 1.4: Financial Soundness Indicators*
Percent
CY06 CY07 CY08 CY09 CY10 CY11 Jun-12 CY12 Jun-13
CAPITAL ADEQUACY
Risk Weighted CAR*
Public Sector Commercial Banks 15.2 16.1 13.4 15.1 14.7 16.5 14.4 16.7 15.8
Local Private Banks 12.7 11.8 11.9 13.9 13.6 14.4 14.9 14.9 15.0
Foreign Banks 15.0 14.6 21.8 23.0 23.8 31.3 31.0 30.7 26.4
Commercial Banks 13.3 12.8 12.6 14.5 14.1 15.3 15.2 15.6 15.5
Specialized Banks -8.3 -6.2 -4.9 -1.5 4.7 8.9 10.9 12.3 13.7
All Banks 12.7 12.3 12.2 14.0 13.9 15.1 15.1 15.6 15.5
Tier 1 Capital to RWA
Public Sector Commercial Banks 11.1 12.2 10.9 12.6 12.2 14.4 12.3 13.9 12.7
Local Private Banks 10.4 9.9 10.0 11.4 11.4 12.3 12.7 12.4 12.7
Foreign Banks 14.3 14.0 21.3 22.5 23.5 31.1 30.8 30.5 26.2
Commercial Banks 10.8 10.5 10.6 12.0 12.0 13.3 13.2 13.2 13.1
Specialized Banks -13.3 -12.5 -10.1 -5.8 -0.9 3.4 5.4 6.8 7.8
All Banks 10.0 10.0 10.1 11.6 11.6 13.0 13.0 13.0 13.0
Capital to Total Assets
Public Sector Commercial Banks 12.2 13.7 10.7 11.3 11.7 10.6 10.1 10.3 9.6
Local Private Banks 9.2 10.2 10.0 9.9 9.3 9.2 8.9 8.6 8.5
Foreign Banks 10.1 11.2 14.5 14.8 14.8 16.7 17.6 16.5 16.3
Commercial Banks 9.9 10.9 10.3 10.4 9.9 9.7 9.4 9.1 8.9
Specialized Banks -8.0 -5.4 -3.2 -1.7 1.2 5.4 7.6 8.3 10.5
All Banks 9.4 10.5 10.0 10.1 9.8 9.6 9.3 9.1 8.9
ASSET QUALITY
NPLs to Total Loans
Public Sector Commercial Banks 9.0 8.4 16.3 16.9 22.9 21.1 22.7 16.9 17.1
Local Private Banks 5.2 6.5 8.7 11.1 12.5 13.8 13.4 13.3 13.5
Foreign Banks 1.0 1.6 2.9 6.7 9.5 10.4 11.1 13.4 11.3
Commercial Banks 5.7 6.7 9.9 12.1 14.5 15.3 15.5 14.1 14.3
Specialized Banks 39.1 34.3 28.8 25.5 28.7 30.1 30.4 27.6 30.7
All Banks 6.9 7.6 10.5 12.6 14.9 15.7 15.9 14.5 14.8
Provision to NPLs
Public Sector Commercial Banks 84.5 89.0 66.9 67.8 52.4 58.2 50.0 62.8 65.2
Local Private Banks 78.7 88.5 70.2 71.0 73.2 74.6 74.9 75.2 77.8
Foreign Banks 191.7 157.0 81.9 75.2 86.6 89.3 88.7 94.0 95.9
Commercial Banks 81.5 89.1 69.3 70.1 66.9 69.9 66.9 72.0 74.5
Specialized Banks 64.1 68.6 72.4 65.7 63.4 59.1 55.5 61.3 53.2
All Banks 77.8 86.1 69.6 69.9 66.7 69.3 66.3 71.5 73.2
Net NPLs to Net Loans
Public Sector Commercial Banks 1.5 1.0 6.1 6.1 12.4 10.1 12.8 7.1 6.7
Local Private Banks 1.1 0.8 2.7 3.5 3.7 3.9 3.7 3.6 3.3
Foreign Banks -1.0 -0.9 0.5 1.8 1.4 1.2 1.4 1.0 0.5
Commercial Banks 1.1 0.8 3.3 4.0 5.3 5.1 5.7 4.4 4.1
Specialized Banks 18.7 14.0 10.0 10.5 12.8 14.9 16.2 12.9 17.2
All Banks 1.6 1.1 3.4 4.1 5.5 5.4 6.0 4.6 4.4
Net NPLs to Capital
Public Sector Commercial Banks 6.4 3.4 30.3 27.4 48.8 41.8 60.0 32.2 31.0
Local Private Banks 7.1 4.1 15.9 17.4 18.9 17.1 16.8 15.9 13.7
Foreign Banks -5.1 -4.1 1.6 4.4 2.6 1.9 2.1 1.4 0.7
Commercial Banks 6.2 3.7 17.9 18.8 25.0 21.6 24.9 18.7 16.7
Specialized Banks - - - 1.0 -
All Banks 9.7 5.6 19.4 20.4 26.7 23.1 26.5 19.9 18.3
EARNINGS
Return on Assets (Before Tax)
Public Sector Commercial Banks 4.0 3.5 0.6 1.5 1.8 2.0 1.8 1.6 1.3
Local Private Banks 3.1 2.0 1.3 1.3 1.5 2.3 2.5 2.1 1.7
Foreign Banks 3.2 1.5 0.0 -0.3 0.9 2.3 1.4 0.4 1.9
Commercial Banks 3.2 2.3 1.1 1.3 1.5 2.2 2.3 2.0 1.6
Specialized Banks -1.3 1.4 3.2 3.1 2.0 2.4 3.1 2.7 3.4
All Banks 3.1 2.2 1.2 1.3 1.5 2.2 2.4 2.0 1.7
Indicators

1. Statistics of the Overall Banking System
67
Financial Soundness Indicators* cont’d:
Percent
CY06 CY07 CY08 CY09 CY10 CY11 Jun-12 CY12 Jun-13EARNINGS
Return on Assets (After Tax)
Public Sector Commercial Banks 2.7 2.5 0.5 1.3 1.3 1.4 1.1 1.2 0.9
Local Private Banks 2.1 1.4 0.9 0.9 0.9 1.5 1.6 1.4 1.1
Foreign Banks 2.1 0.7 0.3 (0.3) 0.4 1.5 0.6 (0.1) 1.2
Commercial Banks 2.2 1.6 0.8 0.9 0.9 1.5 1.5 1.3 1.1
Specialized Banks (1.8) 0.7 1.8 1.2 1.2 1.6 2.1 1.8 2.2
All Banks 2.1 1.5 0.8 0.9 1.0 1.5 1.6 1.3 1.1
ROE (Avg. Equity& Surplus) (Before Tax)
Public Sector Commercial Banks 32.4 27.2 5.2 13.3 15.2 18.0 16.9 15.6 13.3
Local Private Banks 36.2 20.4 12.9 13.2 15.6 24.7 27.9 24.1 20.1
Foreign Banks 30.0 13.1 0.0 (2.4) 5.8 14.5 8.4 2.2 11.2
Commercial Banks 34.7 21.8 10.6 12.4 15.0 22.7 24.5 21.2 18.2
Specialized Banks - - - - - - - 1.0 -
All Banks 35.2 22.6 11.4 13.2 15.5 23.0 25.9 21.4 18.5
ROE (Avg. Equity &Surplus) (After Tax)
Public Sector Commercial Banks 21.7 19.5 4.4 11.4 11.2 12.2 11.0 11.2 9.0
Local Private Banks 25.0 13.8 8.5 8.6 9.3 16.1 18.1 15.9 13.4
Foreign Banks 20.4 6.0 2.2 (2.3) 2.7 9.5 3.5 (0.5) 7.4
Commercial Banks 23.7 15.0 7.3 8.6 9.4 14.9 15.8 14.0 12.2
Specialized Banks - - - - - - - 4.0 -
All Banks 23.8 15.4 7.8 8.9 9.6 15.1 17.3 14.2 12.4
NII/Gross Income
Public Sector Commercial Banks 69.5 65.9 65.4 63.0 69.1 69.4 66.7 64.1 60.4
Local Private Banks 73.5 70.7 73.2 75.9 77.2 77.9 73.7 73.0 72.0
Foreign Banks 65.8 59.1 61.3 64.8 67.6 72.2 73.3 69.0 78.1
Commercial Banks 72.1 69.2 71.2 73.3 75.4 76.2 72.6 71.3 70.1
Specialized Banks 40.1 42.8 46.6 44.7 51.0 67.3 62.7 63.7 66.4
All Banks 70.9 68.2 70.3 72.4 74.7 76.0 72.3 71.1 70.0
Cost / Income Ratio
Public Sector Commercial Banks 31.8 30.2 39.1 47.5 49.1 49.9 57.7 55.4 56.5
Local Private Banks 40.7 45.4 51.6 50.1 52.5 50.8 50.8 52.6 56.1
Foreign Banks 49.8 57.0 69.6 77.5 65.2 59.3 61.0 75.8 66.8
Commercial Banks 39.4 42.8 50.0 50.9 52.4 50.9 52.3 53.8 56.4
Specialized Banks 62.6 53.2 52.1 61.3 61.3 60.4 59.5 62.4 56.6
All Banks 40.3 43.2 50.1 51.2 52.7 51.1 52.5 54.1 56.4
LIQUIDITY
Liquid Assets/Total Assets
Public Sector Commercial Banks 33.9 37.0 30.6 31.1 34.6 40.9 32.6 38.0 37.0
Local Private Banks 31.1 32.5 26.8 32.3 35.7 46.2 44.7 50.8 51.7
Foreign Banks 41.0 41.6 45.2 55.0 64.6 68.6 67.4 69.4 72.7
Commercial Banks 32.2 33.8 28.3 32.9 36.4 45.9 43.1 48.8 49.4
Specialized Banks 23.0 27.9 24.5 19.8 19.6 23.5 23.8 23.7 24.1
All Banks 31.9 33.6 28.2 32.7 36.1 45.5 42.7 48.4 49.0
Liquid Assets/Total Deposits
Public Sector Commercial Banks 42.6 47.1 38.9 40.1 43.5 51.3 40.5 49.4 45.1
Local Private Banks 40.6 42.9 35.0 43.4 45.8 59.5 55.8 66.5 66.5
Foreign Banks 61.1 61.1 71.6 82.4 96.4 104.3 101.6 108.0 140.8
Commercial Banks 42.0 44.3 37.1 44.0 46.8 59.1 54.0 64.1 63.4
Specialized Banks 205.4 247.7 229.4 167.1 149.4 202.0 202.1 214.0 218.4
All Banks 42.7 45.1 37.7 44.5 47.1 59.5 54.3 64.5 63.7
Advances/Deposits
Public Sector Commercial Banks 64.6 60.0 68.4 65.2 58.0 55.2 59.0 60.9 54.3
Local Private Banks 74.5 70.1 75.1 66.6 61.3 52.0 49.7 48.8 45.0
Foreign Banks 80.1 75.2 68.9 56.1 42.0 39.6 39.7 37.4 40.7
Commercial Banks 72.7 73.8 73.6 66.0 60.1 52.3 51.2 50.9 46.8
Specialized Banks 528.4 507.3 577.0 560.8 491.5 540.1 535.9 556.9 556.9
All Banks 74.6 69.7 75.2 67.7 61.6 53.6 52.5 52.2 48.1
* Data of IDBP,PPCBL, and SME is based on Basel I.
Indicators

1. Statistics of the Overall Banking System
68
Table 1.5: Banks’ category-wise key variables
All Banks
CY06 CY07 CY08 CY09 CY10 CY11 Jun-12 CY12 Jun-13
Paid up Capital 168 248 281 325 358 405 459 428 471
Equity 402 544 563 660 695 784 808 882 901
Deposits 3,255 3,854 4,218 4,786 5,451 6,244 6,803 7,294 7,756
Liabilities 3,951 4,627 5,065 5,856 6,422 7,386 7,845 8,829 9,189
Advances (net of Provision) 2,428 2,688 3,173 3,240 3,358 3,349 3,573 3,804 3,727
Investments (net of Provisions) 833 1,276 1,087 1,737 2,157 3,055 3,275 4,013 4,253
Assets 4,353 5,172 5,628 6,516 7,117 8,171 8,653 9,711 10,090
Income 385 475 582 690 721 856 456 930 456
Expense 262 368 519 609 617 686 358 752 374
Profit bofore tax 124 107 63 81 105 170 99 178 82
Profit after tax 84 73 43 54 65 112 64 118 55
Public Sector Commercial Banks
CY06 CY07 CY08 CY09 CY10 CY11 Jun-12 CY12 Jun-13
Paid up Capital 12,278 16,671 18,544 21,339 34,030 41,414 43,096 61,284 47,059
Equity 102,043 142,270 111,986 139,219 159,790 166,172 163,828 188,541 183,177
Deposits 665,642 812,856 819,683 952,373 1,087,506 1,248,199 1,302,371 1,414,547 1,563,995
Liabilities 734,145 893,622 930,324 1,090,831 1,205,801 1,396,686 1,454,196 1,649,868 1,724,529
Advances (net of Provision) 429,716 487,362 560,666 620,596 630,704 689,423 768,577 861,295 849,470
Investments (net of Provisions) 179,883 296,670 204,784 297,689 383,310 479,609 456,008 588,623 563,667
Assets 836,189 1,035,892 1,042,310 1,230,050 1,365,591 1,562,858 1,618,023 1,838,410 1,907,706
Income 73,519 90,970 103,421 119,979 108,949 121,753 81,519 168,541 84,907
Expense 41,961 57,748 96,855 103,218 131,722 151,113 67,604 140,935 72,907
Profit bofore tax 31,558 33,222 6,566 16,762 22,773 29,359 13,915 27,606 12,000
Profit after tax 21,192 23,851 5,644 14,372 16,798 19,833 9,083 19,803 8,091
Local Private Banks
CY06 CY07 CY08 CY09 CY10 CY11 Jun-12 CY12 Jun-13
Paid up Capital 124,252 199,547 214,571 253,015 274,587 309,306 360,079 309,642 367,866
Equity 287,882 389,726 421,074 487,719 498,613 567,665 589,875 639,646 660,614
Deposits 2,425,781 2,909,310 3,236,220 3,655,994 4,188,181 4,810,209 5,321,893 5,702,710 6,046,280
Liabilities 2,886,107 3,446,053 3,799,764 4,417,543 4,875,191 5,635,806 6,047,823 6,826,456 7,109,656
Advances (net of Provision) 1,807,163 2,039,623 2,429,934 2,435,792 2,568,695 2,499,799 2,642,507 2,784,738 2,723,378
Investments (net of Provisions) 598,435 936,764 847,045 1,373,082 1,679,542 2,442,332 2,697,062 3,312,668 3,549,227
Assets 3,173,989 3,835,779 4,220,838 4,905,262 5,373,804 6,203,471 6,637,698 7,466,101 7,770,270
Income 273,918 348,149 437,498 524,275 470,401 528,855 351,582 717,584 350,818
Expense 187,158 278,615 385,022 463,734 547,425 660,306 271,255 572,018 286,018
Profit bofore tax 86,760 69,530 52,477 60,541 77,024 131,451 80,327 145,566 64,801
Profit after tax 59,490 47,263 34,704 39,265 45,646 85,716 52,095 95,896 43,154
PKR billion
PKR million
PKR million

1. Statistics of the Overall Banking System
69
Foreign Banks
CY06 CY07 CY08 CY09 CY10 CY11 Jun-12 CY12 Jun-13
Paid up Capital 17,469 17,085 32,130 34,885 33,992 38,720 40,285 41,149 41,040
Equity 22,686 19,373 33,971 35,739 34,509 42,530 42,446 40,783 40,011
Deposits 150,093 117,561 147,938 160,936 156,331 167,870 160,354 158,703 127,023
Liabilities 201,081 153,339 200,590 205,297 198,745 212,744 199,377 205,908 205,834
Advances (net of Provision) 120,223 88,455 101,921 90,325 65,628 66,411 63,724 59,322 51,639
Investments (net of Provisions) 38,477 26,427 22,593 52,373 79,809 113,382 90,755 85,519 113,150
Assets 223,783 172,711 234,562 241,037 233,253 255,274 241,823 246,690 245,845
Income 24,107 20,169 24,005 27,741 23,100 22,979 13,194 25,143 9,592
Expense 17,784 17,733 23,998 28,591 25,147 28,579 11,405 24,227 7,322
Profit bofore tax 6,323 2,435 7 (850) 2,046 5,601 1,789 916 2,270
Profit after tax 4,288 1,122 651 (809) 960 3,660 740 (227) 1,499
Specialized Banks
CY06 CY07 CY08 CY09 CY10 CY11 Jun-12 CY12 Jun-13
Paid up Capital 14,452 14,849 15,506 15,507 15,507 15,508 15,508 15,508 15,351
Equity (10,214) (6,931) (4,163) (2,424) 1,791 7,990 11,855 13,239 17,515
Deposits 13,491 14,320 13,883 16,588 18,962 17,327 18,279 17,738 18,360
Liabilities 129,173 134,125 134,332 142,414 142,577 141,179 143,486 146,713 148,942
Advances (net of Provision) 70,617 72,647 80,114 93,031 93,197 93,585 97,954 98,785 102,251
Investments (net of Provisions) 16,581 15,926 12,147 13,819 14,495 19,546 31,644 26,430 27,063
Assets 118,959 127,193 130,178 139,990 144,367 149,169 155,341 159,952 166,457
Income 13,944 15,943 17,039 17,612 14,063 12,022 10,178 19,053 10,790
Expense 14,710 14,272 12,888 13,392 16,909 15,540 7,611 14,962 7,732
Profit bofore tax (766) 1,671 4,151 4,220 2,846 3,518 2,567 4,091 3,058
Profit after tax (1,075) 875 2,317 1,617 1,665 2,388 1,745 2,760 2,138
PKR million
PKR million

1. Statistics of the Overall Banking System
70
Table 1.6: Concentration in the Banking System
June 30, 2013 (Un-audited)
Percent
Top 5
Banks
6-10
Banks
11-20
Banks
21-28
BanksFBs SBs Industry
Asset
Share of Total Assets 53.2 21.2 17.7 3.8 2.4 1.6 100
Share of Total Investments 54.9 21.5 16.9 3.5 2.6 0.6 100
of which investment in Government Securities 86.3 85.7 86.5 86.0 100.0 84.8 87
Advances
Advances:public 66.6 14.3 15.7 3.1 0.2 0.1 100.0
Advances:private 47.6 22.0 20.8 4.2 1.7 3.7 100.0
Sectoral Distribution of Loans
Corporate Sector 50.1 21.7 22.0 4.2 1.9 0.2 100.0
SMEs 40.3 23.0 29.9 2.7 0.2 4.0 100.0
Agriculture 37.5 4.6 8.3 0.5 0.0 49.1 100.0
Consumer Finance 59.8 15.2 16.4 7.9 0.6 0.0 100.0
Commodity Financing 57.0 25.4 13.9 3.6 0.0 0.0 100.0
Staff Loans 59.1 11.9 19.7 4.2 2.0 3.1 100.0
Others 91.3 3.4 0.9 0.4 3.6 0.4 100.0
Total 51.7 20.3 19.7 4.0 1.4 2.9 100.0
NPLs / Gross Loans 12.2 15.8 18.7 12.3 11.3 30.7 14.8
Net NPLs / Capital 7.3 34.5 41.6 17.4 0.7 100.1 18.3
Liabilities
Share of Total Deposits 54.9 21.3 18.1 3.9 1.6 0.2 100.0
Customer Fixed Deposits 51.7 20.5 20.1 5.2 2.4 0.1 100.0
Customer CASA 55.8 21.6 17.4 3.5 1.4 0.3 100.0
Customer Deposits others 32.0 37.3 26.0 3.1 1.3 0.4 100.0
Financial Institutions Remunerative Deposits 44.7 29.2 22.7 2.5 0.5 0.4 100.0
Financial Institutions Non-Remunerative Deposits 93.6 2.6 1.9 0.7 1.2 0.0 100.0
Capital Adequacy
Capital/RWA (Capital Adequacy Ratio) 16.5 13.7 11.8 19.6 26.4 13.7 15.5
Tier 1 Capital / RWA 13.7 10.7 10.4 19.9 26.2 7.8 13.0
Net Worth / Total Assets 9.9 6.9 6.8 11.3 16.3 10.5 8.9
Share of Risk Weighted Assets 54.0 18.2 18.4 3.9 2.9 2.6 100.0
Earning & Profitability
Profit/Loss (Before Tax) 74.2 21.1 -1.1 -0.7 2.8 3.7 100.0
Net Interest Income / Gross Income 70.8 67.6 67.4 77.5 78.1 68.3 70.0
Non-Interest Expense / Gross Income 29.2 32.4 32.6 22.5 21.9 31.7 30.0
Provision Expense to Gross Income 6.0 2.3 22.3 17.1 -6.3 6.1 7.8
Liquidity
Liquid Assets / Total Assets 50.5 48.9 44.7 44.7 72.7 24.1 49.0
Liquid Assets / Total Deposits 63.5 63.5 57.0 57.5 140.8 218.4 63.7Advances to deposits ratio 45.4 46.4 51.3 51.0 40.7 556.9 48.1
Indicators

1. Statistics of the Overall Banking System
71
Asset Quality:
Table 1.7: Asset Quality Indicators of the Banking System
Banking System: Selected Indicators of Asset Quality
CY06 CY07 CY08 CY09 CY10 CY11 Jun-12 CY12 Jun-13
Advances 2,564,055 2,875,686 3,422,549 3,551,331 3,729,003 3,759,235 3,993,626 4,243,561 4,177,875
NPLs 176,766 217,998 359,238 446,005 555,968 591,579 634,790 614,929 616,470
Provision 137,672 187,603 249,914 311,588 370,778 410,016 420,864 439,421 451,136
Advances (net) 2,427,719 2,688,087 3,172,636 3,239,744 3,358,225 3,349,219 3,572,762 3,804,140 3,726,738
Net NPLs 39,094 30,395 109,324 134,417 185,190 181,563 213,926 175,541 165,334
Banking System: Break up of Non Performing Loans (NPLs)
CY06 CY07 CY08 CY09 CY10 CY11 Jun-12 CY12 Jun-13
OAEM 12,660 8,999 11,558 12,152 14,141 15,521 17,429 14,320 19,811
Sub Standard 17,718 36,520 78,503 63,905 53,030 50,262 61,056 46,060 48,541
Doubtful 17,429 24,248 67,877 77,809 68,665 58,346 55,700 54,847 40,598
Loss 128,959 148,233 201,301 292,138 420,132 467,450 500,606 499,702 507,520
Total 176,766 217,999 359,238 446,005 555,968 591,579 634,790 614,929 616,470
Banking System: Break up of Provisions against Advances (specific)
CY06 CY07 CY08 CY09 CY10 CY11 Jun-12 CY12 Jun-13
OAEM 176 715 743 - - - - - -
Sub Standard 3,516 9,366 17,490 13,666 11,787 9,669 11,684 9,172 8,927
Doubtful 6,670 12,454 29,782 32,386 31,255 20,196 15,940 19,978 16,625
Loss 107,147 144,173 185,746 251,691 311,391 364,059 375,971 393,684 407,546
Total 117,508 166,708 233,761 297,743 354,434 393,924 403,596 422,834 433,097
Category-wise Break up of Banks' Advances
CY06 CY07 CY08 CY09 CY10 CY11 Jun-12 CY12 Jun-13
PSCBs 465,065 526,566 629,389 700,902 716,562 786,264 866,735 963,624 955,840
LPBs 1,881,906 2,163,480 2,587,530 2,643,594 2,826,985 2,785,927 2,938,345 3,093,144 3,041,894
FBs 122,626 90,666 104,440 95,113 71,495 73,215 70,715 67,873 57,940
CBs 2,469,597 2,780,712 3,321,360 3,439,608 3,615,042 3,645,407 3,875,796 4,124,641 4,055,675
SBs 94,459 94,974 101,189 111,723 113,961 113,828 117,831 118,920 122,200
Industry 2,564,055 2,875,686 3,422,549 3,551,331 3,729,003 3,759,235 3,993,626 4,243,561 4,177,875
PKR million
PKR million
PKR million
PKR million

1. Statistics of the Overall Banking System
72
Category-wise Break up of Banks' Non Performing Loans (NPLs)
CY06 CY07 CY08 CY09 CY10 CY11 Jun-12 CY12 Jun-13
PSCBs 41,841 44,054 102,656 118,400 163,786 166,289 196,399 163,057 163,153
LPBs 96,475 139,997 224,395 292,780 352,672 383,437 394,720 409,930 409,260
FBs 1,253 1,409 3,077 6,369 6,774 7,623 7,883 9,097 6,572
CBs 139,568 185,460 330,128 417,549 523,232 557,349 599,003 582,085 578,984
SBs 37,198 32,538 29,110 28,456 32,736 34,230 35,788 32,845 37,485
Industry 176,766 217,998 359,238 446,005 555,968 591,579 634,790 614,929 616,470
Category-wise Banks' Provisions
CY06 CY07 CY08 CY09 CY10 CY11 Jun-12 CY12 Jun-13
PSCBs 35,349 39,204 68,723 80,305 85,858 96,840 98,158 102,329 106,371
LPBs 76,080 123,855 157,598 207,803 258,289 286,128 295,838 308,406 318,516
FBs 2,403 2,211 2,519 4,788 5,867 6,804 6,991 8,551 6,301
CBs 113,831 165,271 228,839 292,896 350,014 389,773 400,987 419,285 431,188
SBs 23,841 22,332 21,075 18,692 20,764 20,244 19,877 20,135 19,949
Industry 137,672 187,603 249,914 311,588 370,778 410,016 420,864 439,421 451,136
Category-wise Banks' Advanes (net of provisions)
CY06 CY07 CY08 CY09 CY10 CY11 Jun-12 CY12 Jun-13
PSCBs 429,716 487,362 560,666 620,596 630,704 689,423 768,577 861,295 849,470
LPBs 1,807,163 2,039,623 2,429,934 2,435,792 2,568,695 2,499,799 2,642,507 2,784,738 2,723,378
FBs 120,223 88,455 101,922 90,325 65,628 66,411 63,724 59,322 51,639
CBs 2,357,102 2,615,440 3,092,522 3,146,713 3,265,028 3,255,634 3,474,808 3,705,355 3,624,487
SBs 70,617 72,647 80,114 93,031 93,197 93,585 97,954 98,785 102,251
Industry 2,427,719 2,688,087 3,172,636 3,239,744 3,358,225 3,349,219 3,572,762 3,804,140 3,726,738
Category-wise Banks' Non Performing Loans-NPLs (net of provisions)
CY06 CY07 CY08 CY09 CY10 CY11 Jun-12 CY12 Jun-13
PSCBs 6,492 4,850 33,934 38,095 77,928 69,448 98,241 60,729 56,782
LPBs 20,395 16,142 66,797 84,977 94,382 97,309 98,882 101,524 90,743
FBs (1,150) (803) 558 1,581 907 819 892 579 271
CBs 25,737 20,189 101,289 124,653 173,218 167,576 198,016 162,832 147,797
SBs 13,356 10,206 8,035 9,764 11,972 13,987 15,911 12,709 17,537
Industry 39,094 30,395 109,324 134,417 185,190 181,563 213,926 175,541 165,334
PKR million
PKR million
PKR million
PKR million

1. Statistics of the Overall Banking System
73
Table 1.8: Segment-wise Advances and Non Performing Loans (NPLs)
Table 1.9: Sector-wise Advances and Non Performing Loans (NPLs)
Advances NPLs
Infection
Ratio Advances NPLs
Infection
Ratio Advances NPLs
Infection
Ratio
Corporate Sector 2,583,699 439,543 17.0 2,760,068 418,993 15.2 2,698.3 425.9 15.8
SMEs Sector 257,815 96,478 37.4 276,684 95,740 34.6 244.2 90.1 36.9
Agriculture Sector 190,630 34,610 18.2 203,503 29,587 14.5 213.9 39.6 18.5
Consumer sector 245,191 44,406 18.1 250,264 43,718 17.5 262.4 40.8 15.6
i. Credit cards 23,183 4,873 21.0 23,154 4,983 21.5 21.9 3.6 16.4
ii. Auto loans 45,496 4,731 10.4 45,348 4,653 10.3 51.2 4.4 8.6
iii. Consumer durable 135 93 68.9 126 90 71.7 0.1 0.1 68.3
iv. Mortgage loans 55,216 16,767 30.4 52,990 16,628 31.4 51.9 16.1 31.1
v. Other personal loans 121,160 17,942 14.8 128,647 17,364 13.5 137.4 16.7 12.1
Commodity financing 535,897 6,246 1.2 512,847 5,867 1.1 565.5 5.8 1.0
Staff Loans 80,838 1,463 1.8 84,515 1,588 1.9 85.1 1.2 1.4
Others 99,557 12,045 12.1 108,417 11,750 10.8 108.5 13.0 12.0
Total 3,993,626 634,790 15.9 4,196,299 607,243 14.5 4,177.9 616.5 14.8
Dec-12Jun-12
amount in PKR million, ratio in percent
Jun-13
Advances NPLs
Infection
Ratio Advances NPLs
Infection
Ratio Advances NPLs
Infection
Ratio
Agribusiness 350,683 37,133 10.6 354,343 32,343 9.1 364.1 42.3 11.6
Automobile/Transportation 56,011 11,050 19.7 56,329 11,140 19.8 58.1 12.9 22.2
Cement 63,352 17,989 28.4 58,351 17,112 29.3 53.8 15.9 29.5
Chemical & Pharmaceuticals 153,278 14,310 9.3 150,101 14,909 9.9 151.7 15.5 10.2
Electronics 55,164 24,485 44.4 57,003 23,894 41.9 53.9 24.8 46.0
Financial 77,027 10,051 13.0 81,725 8,547 10.5 106.2 8.1 7.6
Individuals 337,424 54,166 16.1 333,309 54,106 16.2 341.9 49.7 14.5
Insurance 684 1 0.1 340 1 0.2 0.2 0.0 0.4
Others 1,638,085 229,317 14.0 1,783,342 205,755 11.5 1,764.2 207.8 11.8
Production/Transmission of Energy 483,109 20,377 4.2 492,814 18,265 3.7 443.3 19.9 4.5
Shoes & Leather garments 24,513 3,351 13.7 23,742 3,048 12.8 24.4 3.0 12.1
Sugar 122,274 11,544 9.4 105,558 10,898 10.3 134.3 7.1 5.3
Textile 632,023 201,018 31.8 699,342 207,225 29.6 681.8 209.5 30.7
Total 3,993,626 634,790 15.9 4,196,299 607,243 14.5 4,177.9 616.5 14.8
Jun-13
amount in PKR million, ratio in percent
Dec-12Jun-12

1. Statistics of the Overall Banking System
74
Soundness & Resilience:
Table 1.10: Category-wise Profitability of the Banking System
Table 1.11: Category-wise Profitability Indicators of the Banking System
CY06 CY07 CY08 CY09 CY10 CY11 Jun-12 CY12 Jun13
Profit Before Tax
PSCBs 31.5 33.2 6.6 16.8 22.8 29.4 13.9 27.6 12.0
LPBs 85.6 69.5 52.5 60.5 77.0 131.5 80.3 145.6 64.8
FBs 6.3 2.4 0.0 (0.9) 2.0 5.6 1.8 0.9 2.3
CBs 123.5 105.2 59.0 76.5 101.8 166.4 96.0 174.1 79.1
SBs 0.1 1.7 4.2 4.2 2.8 3.5 2.6 4.1 3.1
All Banks 123.6 106.9 63.2 80.7 104.7 169.9 98.6 178.2 82.1
Profit After Tax
PSCBs 21.2 23.9 5.6 14.4 16.8 19.8 9.1 19.8 8.1
LPBs 59.1 47.3 34.7 39.3 45.6 85.7 52.1 95.9 43.2
FBs 4.3 1.1 0.6 (0.8) 1.0 3.7 0.7 (0.2) 1.5
CBs 84.6 72.2 41.0 52.8 63.4 109.2 61.9 115.5 52.7
SBs (0.5) 0.9 2.3 1.6 1.7 2.4 1.7 2.8 2.1
All Banks 84.1 73.1 43.3 54.4 65.1 111.6 63.7 118.2 54.9
PKR billion
CY06 CY07 CY08 CY09 CY10 CY11 Jun-12 CY12 Jun-13
Before Tax ROA
PSCBs 4.0 3.5 0.6 1.5 1.8 2.0 1.8 1.6 1.3
LPBs 3.1 2.0 1.3 1.3 1.5 2.3 2.5 2.1 1.7
FBs 3.2 1.5 0.0 -0.3 0.9 2.3 1.4 0.4 1.9
CBs 3.2 2.3 1.1 1.3 1.5 2.2 2.3 2.0 1.6
SBs -1.3 1.4 3.2 3.1 2.0 2.4 3.1 2.7 3.4
All Banks 3.1 2.2 1.2 1.3 1.5 2.2 2.4 2.0 1.7
Before Tax ROE (based on Equity plus Surplus on Revaluation)
PSCBs 32.4 27.2 5.2 13.3 15.2 18.0 16.9 15.6 13.3
LPBs 36.2 20.4 12.9 13.2 15.6 24.7 27.9 24.1 20.1
FBs 30.0 13.1 0.0 -2.4 5.8 14.5 8.4 2.2 11.2
CBs 34.7 21.8 10.6 12.4 15.0 22.7 24.5 21.2 18.2
SBs - - - - - - - 1.0 -
All Banks 35.2 22.6 11.4 13.2 15.5 23.0 25.9 21.4 18.5
Percent
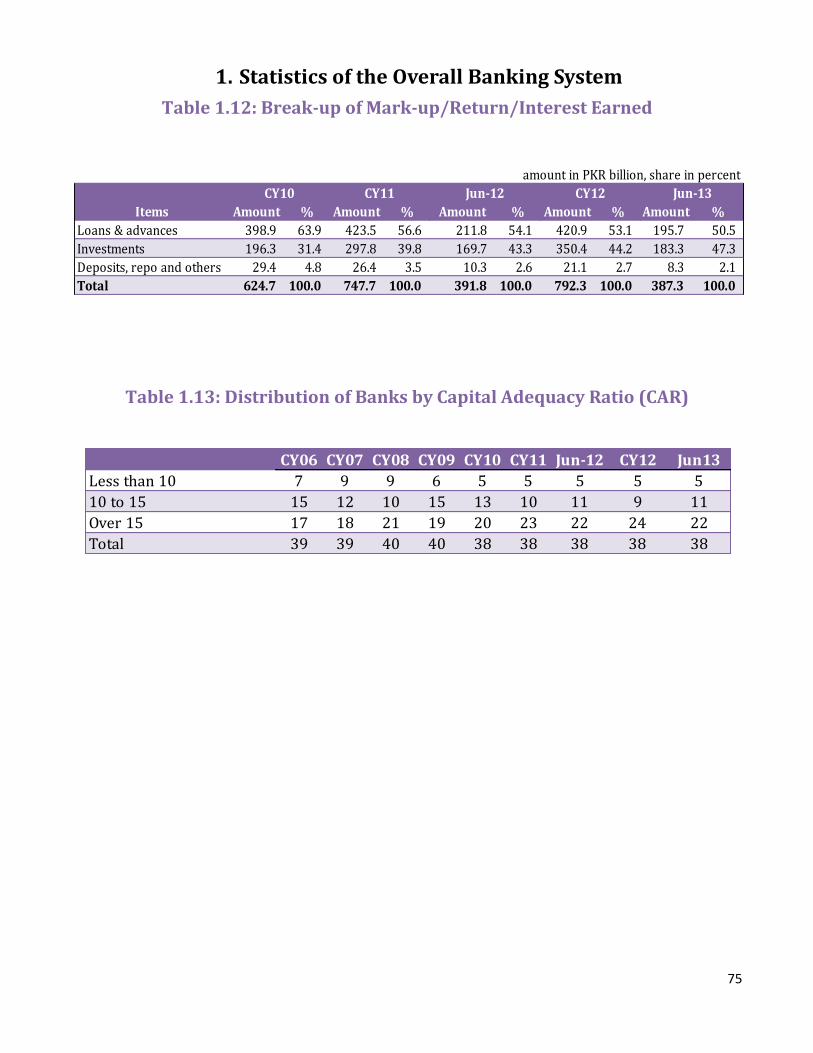
1. Statistics of the Overall Banking System
75
Table 1.12: Break-up of Mark-up/Return/Interest Earned
Table 1.13: Distribution of Banks by Capital Adequacy Ratio (CAR)
Items Amount % Amount % Amount % Amount % Amount %
Loans & advances 398.9 63.9 423.5 56.6 211.8 54.1 420.9 53.1 195.7 50.5
Investments 196.3 31.4 297.8 39.8 169.7 43.3 350.4 44.2 183.3 47.3
Deposits, repo and others 29.4 4.8 26.4 3.5 10.3 2.6 21.1 2.7 8.3 2.1
Total 624.7 100.0 747.7 100.0 391.8 100.0 792.3 100.0 387.3 100.0
Jun-13
amount in PKR billion, share in percent
CY12Jun-12CY11CY10
CY06 CY07 CY08 CY09 CY10 CY11 Jun-12 CY12 Jun13
Less than 10 7 9 9 6 5 5 5 5 5
10 to 15 15 12 10 15 13 10 11 9 11
Over 15 17 18 21 19 20 23 22 24 22
Total 39 39 40 40 38 38 38 38 38

1. Statistics of the Overall Banking System
76
Table 1.14: Capital Structure and Capital Adequacy of All Banks and DFIS
June 30, 2013 (Un-audited)
All Banks
and DFIs PSCBs LPBs FBs SBs All Banks DFIs
Equity
1.1 Fully Paid-up Capital/Capital Deposited with SBP 521,851 47,520 369,531 41,040 15,351 473,442 48,409
1.2 Balance in Share Premium Account (35,262) 17,000 (52,262) - - (35,262) -
1.3 Reserve for issue of Bonus shares - - - - - - -
1.4
General Reserves as disclosed on the Balance Sheet
(including statutory reserve) 175,934 25,139 132,785 155 11,312 169,391 6,543
1.5 Un-appropriated/Unremitted profits (net of accumulated losses, if any)136,436 41,604 110,178 (1,286) (16,436) 134,060 2,376
1.6 Sub-Total (1.1 to 1.5) 798,959 131,262 562,432 39,909 10,227 741,631 57,328
Deductions
1.7 Goodwill 42,557 1,361 40,860 269 0 42,491 66
1.8 Shortfall in Provisions required against Classified assets 2,253 204 1,816 234 - 2,253 -
1.9 Deficit on account of revaluation of AFS investment 35 68 201 4 (280) (8) 43
1.10 Any increase in equity capital resulting from a securitization transaction399 - 399 - - 399 -
1.11 Investments in TFCs of other banks 9,771 536 2,874 - - 3,410 6,361
1.12 Other Deductions 18,620 3,019 13,834 - 98 16,952 1,668
1.13 Sub-Total (1.7 to 1.12) 73,635 5,188 60,913 507 (182) 65,498 8,137
1.14 Total Eligible Tier 1 capital(1.6 less 1.13) 725,324 126,074 501,520 39,403 10,409 676,133 49,190
Supplementary Capital
2.1
Freely available General Provisions or reserves for loan
losses-upto maximum of 1.25% of Risk Weighted Assets 15,823 3,524 10,481 162 1,472 15,639 184
2.2 Revaluation reserves eligible upto 45% 67,177 21,357 40,989 69 3,370 65,784 1,392
2.3 Foreign Exchange Translation Reserves 34,825 9,116 25,709 - - 34,825 -
2.4 Undisclosed reserves (16) - (16) - - (16) -
2.5 Subordinated debt-upto maximum of 50% of total equity 30,483 - 27,278 - 3,204 30,483 -
2.6 Total Tier 2 Supplementary Capital(2.1 to 2.5) 148,292 33,998 104,441 231 8,046 146,716 1,576
Deductions
2.7 Other deductions 18,620 3,019 13,834 - 98 16,952 1,668
2.8 Total Deductions 18,620 3,019 13,834 - 98 16,952 1,668
2.9 Total eligible tier 2 capital 129,672 30,979 90,607 231 7,947 129,764 (92)
2.10 Eligible tier 3
2.11
Total Supplementary Capital eligible for MCR(maximum upto
100% of Total Equity) 129,672 30,979 90,607 231 7,947 129,764 (92)
2.13 TOTAL CAPITAL (1.14 plus 2.9) 854,996 157,053 592,126 39,634 18,356 805,897 49,098
Risk Weighted Amounts
3.1 Total Credit Risk Weighted Assets 4,061,006 792,118 2,984,018 109,305 115,825 4,001,265 59,741
3.2 Total Market Risk Weighted Assets 450,801 72,844 349,227 12,418 318 434,808 15,993
3.3 Total Operational Risk Assets 798,036 130,491 607,191 28,576 17,621 783,879 14,156
3.4 Total Risk Weighted Amount 5,309,843 995,453 3,943,061 150,300 133,764 5,219,952 89,891
Capital Adequacy Ratios
4.1 Credit Risk Capital Adequacy Ratio 21.1% 19.8% 19.8% 36.3% 15.8% 20.1% 82.2%
4.2 Tier 1 capital to Total Risk Weighted Amount 13.7% 12.7% 12.7% 26.2% 7.8% 13.0% 54.7%
4.3 Total Capital Adequacy Ratio 16.1% 15.8% 15.0% 26.4% 13.7% 15.4% 54.6%
Other Deductins from Tier 1 and Tier 2 Capital
5.1
Investments in equity and other regulatory capital of
majority owned securities or other financial subsidiaries not
consolidated in the balance sheet
97 - - - 97 97 -
5.2
Significant minority investments in banking, securities and
other financial entities29,629 4,356 24,325 - 100 28,781 849
5.3
Equity holdings (majority or significant minority) in an
insurance subsidiary(para 1.1 scope of Application)6,322 1,683 2,312 - - 3,994 2,328
5.4
Significant minority and majority investments in commercial
entities exceeding 15% of Bank,s Capital542 - 384 - - 384 159
5.5
Securitization exposure subject to deduction (para 4.3.1 of
instructions)648 - 648 - - 648 -
5.6 Others - - - - - - -
5.7
Total Deductible Items to be deducted 50% from Tier 1
capital and 50% from Tier 2 capital ( 5.1 to 5.6)37,239 6,038 27,668 - 197 33,903 3,336
PKR million

1. Statistics of the Overall Banking System
77
Table 1.15: Stress Testing Results of the Banking System
June 30, 2013 (Un-audited)
< 8% 8% > 10% > 10%
Pre-Shock Position 2 1 33
Credit Shocks Nature of Shock < 8% 8% > 10% > 10%
C-1 10% of performing loans become non-performing, 50% of substandard loans
downgrade to doubtful, 50% of doubtful to loss.
Hypothetical 7 3 27
C-2Default of top 3 private sector individual borrowers (fund based exposures only) of the
banks.
Hypothetical5 3 29
C-3 Default of top 3 private sector Individuals (both fund based and non-fund based
exposures) of the banks.
Hypothetical 6 4 27
C-4All NPLs under substandard downgrade to doubtful and all doubtful downgrade to loss. Hypothetical
4 0 33
C-5 Increase in provisions against NPLs equivalent to 25% of Net NPLs. Hypothetical 4 2 31
C-6Increase in NPLs to Loans Ratio (NPLR) equivalent to the maximum quarterly increase in
NPLs to Loans Ratio of the individual banks during the last 5 years.
Historical4 0 33
C-7 Increase in NPLs of all banks by 21% which is equivalent to the maximum quarterly
increase in NPLs of the banking system during the last 5 years (Mar-09).
Historical 4 0 33
C-8 Increase in NPLs to Loans Ratio of Textile Sector of the banks equivalent to the
maximum quarterly increase in these banks during the last 3 years.
Historical 4 0 33
C-9 Increase in NPLs to Loans Ratio of Consumer Sector of the banks equivalent to the
maximum quarterly increase in these banks during the last 3 years.
Historical 3 1 33
C-10 Increase in NPLs to Loans Ratio of Agriculture & SME Sector of the banks equivalent to
the maximum quarterly increase in these banks during the last 3 years.
Historical 3 1 33
NPLR Critical NPLR Difference
C-11 Critical Infection Ratio (The ratio of NPLs to Loans where capital would wipe out) Hypothetical 13.99% 51.98% 37.99%
Market Shocks < 8% 8% > 10% > 10%
IR-1 Parallel upward shift in the yield curve - increase in interest rates by 300 basis points
along all the maturities.
Hypothetical 4 2 31
IR-2
Upward shift coupled with steepening of the yield curve by increasing the interest rates
along 3m, 6m, 1y, 3y, 5y and 10y maturities equivalent to the maximum quarterly
increase experienced during the last 4 years (July-08).
Historical
4 2 31
IR-3
Downward Shift plus flattening of the yield curve by decreasing the interest rates along
3m, 6m, 1y, 3y, 5y and 10y maturities equivalevent to the maximum quarterly increase
experienced during the last 4 years (April-09).
Historical
2 2 33
ER-1 Depreciation of Pak Rupee exchange rate by 30%. Hypothetical 3 1 33
ER-2
Depreciation of Pak Rupee exchange rate by 14.5% equivalent to the quarterly high
depreciation of rupee against dollar experienced during the last 4 years (May08-Aug08).
Historical
3 1 33
ER-3
Appreciation of Pak Rupee exchange rate by 3.2% equivalent to the quarterly high level
of appreciation of rupee against dollar experienced during the last 4 years (Oct08-
Jan09).
Historical
3 1 33
EQ-1 Fall in general equity prices by 41.4% (Oct08-Jan09). Historical 4 1 32
EQ-2 Fall in general equity prices by 50%. Hypothetical 4 1 32
Combined Credit & Market Shocks < 8% 8% > 10% > 10%
COMB-1
Increase in NPLs equivalent to historically high quarterly increase in NPLs to Loan Ratio
(Shock C-6) and upward shift plus steepening of the yield curve (Shock IR-2) and fall in
equity prices (Shock- EQ-1)
Historical
5 1 31
COMB-2
10% of performing loans moving to substandard, 50% of substandard to doubtful, 50%
of doubtful to loss (Shock- C-1), parallel upward shift in the yield curve by 3% (Shock IR-
1) and fall in equity prices by 50% (Shock- EQ-2)
Hypothetical
9 6 22
3 Days 4 Days 5 Days
L-1 Withdrawal of customer deposits by 2%, 5%, 10%, 10% and 10% for five consecutive
days respectively.
Hypothetical 0 0 0
1 Day 2 Days 3 Days
L-2 Withdrawal of Wholesale Deposits and Unsecured Borrowings by 25%, 50%, and 100%
for three consecutive days respectively.
Hypothetical 0 0 2
LCR>2
L-3 Shock to Liquidity Coverage Ratio Applying 20% haircut to the value of Investments in
Government Securities*
Hypothetical 7
* Excluding IDBL.
No. of Banks with no liquidity after
Number of Banks with
LCR<1
8
Shock Details
Liquidity Shocks
Number of Banks with CAR*
Number of Banks with CAR

1. Statistics of the Overall Banking System
78
Table 1.16: List of Banks
CY11 Jun-12 CY12 Jun-13
A. Public Sector Com. Banks (5) A. Public Sector Com. Banks (5) A. Public Sector Com. Banks (5) A. Public Sector Com. Banks (5)
First Women Bank Ltd. First Women Bank Ltd. First Women Bank Ltd. First Women Bank Ltd.
National Bank of Pakistan National Bank of Pakistan National Bank of Pakistan National Bank of Pakistan
Sindh Bank Ltd. Sindh Bank Ltd. Sindh Bank Ltd. Sindh Bank Ltd.
The Bank of Khyber The Bank of Khyber The Bank of Khyber The Bank of Khyber
The Bank of Punjab The Bank of Punjab The Bank of Punjab The Bank of Punjab
B. Local Private Banks (22) B. Local Private Banks (22) B. Local Private Banks (22) B. Local Private Banks (22)
AlBaraka Bank (Pakistan) Ltd.. AlBaraka Bank (Pakistan) Ltd.. AlBaraka Bank (Pakistan) Ltd.. AlBaraka Bank (Pakistan) Ltd..
Allied Bank Ltd. Allied Bank Ltd. Allied Bank Ltd. Allied Bank Ltd.
Askari Bank Ltd. Askari Bank Ltd. Askari Bank Ltd. Askari Bank Ltd.
Bank AL Habib Ltd. Bank AL Habib Ltd. Bank AL Habib Ltd. Bank AL Habib Ltd.
Bank Alfalah Ltd. Bank Alfalah Ltd. Bank Alfalah Ltd. Bank Alfalah Ltd.
BankIslami Pakistan Ltd. BankIslami Pakistan Ltd. BankIslami Pakistan Ltd. BankIslami Pakistan Ltd.
Burj Bank Ltd. # Burj Bank Ltd. # Burj Bank Ltd. # Burj Bank Ltd. #
Dubai Islamic Bank Pakistan Ltd. Dubai Islamic Bank Pakistan Ltd. Dubai Islamic Bank Pakistan Ltd. Dubai Islamic Bank Pakistan Ltd.
Faysal Bank Ltd. Faysal Bank Ltd. Faysal Bank Ltd. Faysal Bank Ltd.
Habib Bank Ltd. Habib Bank Ltd. Habib Bank Ltd. Habib Bank Ltd.
Habib Metropolitan Bank Ltd. Habib Metropolitan Bank Ltd. Habib Metropolitan Bank Ltd. Habib Metropolitan Bank Ltd.
JS Bank Ltd. JS Bank Ltd. JS Bank Ltd. JS Bank Ltd.
KASB Bank Ltd. KASB Bank Ltd. KASB Bank Ltd. KASB Bank Ltd.
MCB Bank Ltd. MCB Bank Ltd. MCB Bank Ltd. MCB Bank Ltd.
Meezan Bank Ltd. Meezan Bank Ltd. Meezan Bank Ltd. Meezan Bank Ltd.
NIB Bank Ltd. NIB Bank Ltd. NIB Bank Ltd. NIB Bank Ltd.
SAMBA Bank Ltd. SAMBA Bank Ltd. SAMBA Bank Ltd. SAMBA Bank Ltd.
Silk Bank Ltd Silk Bank Ltd Silk Bank Ltd Silk Bank Ltd
Soneri Bank Ltd. Soneri Bank Ltd. Soneri Bank Ltd. Soneri Bank Ltd.
Standard Chartered Bank (Pakistan) Ltd. Standard Chartered Bank (Pakistan) Ltd. Standard Chartered Bank (Pakistan) Ltd. Standard Chartered Bank (Pakistan) Ltd.
Summit Bank Ltd. ^ Summit Bank Ltd. ^ Summit Bank Ltd. ^ Summit Bank Ltd. ^
United Bank Ltd. United Bank Ltd. United Bank Ltd. United Bank Ltd.
C. Foreign Banks (7) C. Foreign Banks (7) C. Foreign Banks (7) C. Foreign Banks (7)
Bank of Tokyo - Mitsubishi UFJ, Ltd. Bank of Tokyo - Mitsubishi UFJ, Ltd. Bank of Tokyo - Mitsubishi UFJ, Ltd. Bank of Tokyo - Mitsubishi UFJ, Ltd.
Barclays Bank PLC Barclays Bank PLC Barclays Bank PLC Barclays Bank PLC
Citibank N.A. Citibank N.A. Citibank N.A. Citibank N.A.
Deutsche Bank AG Deutsche Bank AG Deutsche Bank AG Deutsche Bank AG
HSBC Bank Milldle East Ltd. HSBC Bank Milldle East Ltd. HSBC Bank Milldle East Ltd. HSBC Bank Milldle East Ltd.
Industrial and Commercial Bank of China Ltd.^^ Industrial and Commercial Bank of China Ltd.^^ Industrial and Commercial Bank of China Ltd.^^ Industrial and Commercial Bank of China Ltd.^^
Oman International Bank S.A.O.G. HSBC Bank Oman S.A.O.G. ## HSBC Bank Oman S.A.O.G. ## HSBC Bank Oman S.A.O.G. ##
D. Specialized Banks (4) D. Specialized Banks (4) D. Specialized Banks (4) D. Specialized Banks (4)
Industrial Development Bank of Pakistan Industrial Development Bank Ltd. ### Industrial Development Bank Ltd. ### Industrial Development Bank Ltd. ###
Punjab Provincial Co-operative Bank Ltd. Punjab Provincial Co-operative Bank Ltd. Punjab Provincial Co-operative Bank Ltd. Punjab Provincial Co-operative Bank Ltd.
SME Bank Ltd. SME Bank Ltd. SME Bank Ltd. SME Bank Ltd.
Zarai Taraqiati Bank Ltd. Zarai Taraqiati Bank Ltd. Zarai Taraqiati Bank Ltd. Zarai Taraqiati Bank Ltd.
All Commercial Banks (34) All Commercial Banks (34) All Commercial Banks (34) All Commercial Banks (34)
Include A + B + C Include A + B + C Include A + B + C Include A + B + C
All Banks (38) All Banks (38) All Banks (38) All Banks (38)
Include A + B + C + D Include A + B + C + D Include A + B + C + D Include A + B + C + D
# Name was changed to "Burj Bank Ltd.." vide BPRD notification dated July 09, 2011.
## The name of “Oman International Bank S.A.O.G.” was changed to “HSBC Bank Oman S.A.O.G.” with effect from June 03, 2012.
### The name of “ Industrial Development Bank of Pakistan” was changed to “ Industrial Development Bank Ltd.” with effect from November 13, 2012.
^ Descheduling and amalgamation of Mybank Ltd. (MBL) with and into Summit Bank Ltd. with effect from Jun 29, 2011.
^^ Scheduling of Industrial and Commercial Bank of China Ltd. took place vide No. BPRD (LD-06)/602- ICBC/2011/10416 dated August 16, 2011.

79
2. Islamic Banking
Table 2.1: Group-wise Balance Sheets and Income Statements of Islamic
Banks/Branches
(June 30, 2013)
PKR million
Financial Position Islamic BanksIslamic Banking
Branches
Islamic Banking
Institutions
ASSETS QoQ YoY
Cash & Balances With Treasury Banks 43,137 20,057 63,194 17,863 17,063
Balances With Other Banks 13,958 15,937 29,896 6,422 9,437
Due from Financial Institutions 15,977 4,439 20,416 (2,792) 1,247
Investments - Net 273,605 165,149 438,754 8,580 93,076
Financing - Net 169,733 91,034 260,766 24,597 63,932
Operating Fixed Assets 12,477 5,387 17,863 101 1,908
Deferred Tax Assets 3,187 - 3,187 237 365
Other Assets 47,373 21,662 69,034 1,578 4,918
TOTAL ASSETS 579,447 323,664 903,111 56,586 191,946
LIABILITIES
Bills Payable 7,296 2,574 9,870 781 2,007
Due to Financial Institution 21,529 9,003 30,532 (11,188) 12,481
Deposits And Other Accounts 497,220 273,726 770,945 66,937 168,425
Sub-ordinated Loans - - - - -
Liabilities Against Assets Subject To Finance Lease - - - - (1)
Deferred Tax Liabilities - 13 13 (18) 12
Other Liabilities 12,170 15,187 27,357 (760) 3,596
TOTAL LIABILITIES 538,214 300,503 838,717 55,752 186,520
NET ASSETS 41,233 23,161 64,394 834 5,426
NET ASSETS REPRESENTED BY: -
Share Capital 38,629 10,198 48,827 50 2,469
Reserves 2,037 7 2,044 187 781
Unappropriated Profit 537 12,108 12,645 1,545 1,974
Share Holders' Equity 41,203 22,314 63,516 1,782 5,224
Surplus/Deficit On Revaluation Of Assets 30 847 878 (948) 202
TOTAL 41,233 23,161 64,394 834 5,426
PROFIT AND LOSS STATEMENT Islamic Banks Islamic Banking Islamic Banking Absolute
YoY
Mark-Up Income 22,030 12,711 34,740 1,763
Mark-Up Expenses 12,627 7,316 19,943 901
Net Mark-Up Income 9,402 5,395 14,797 863
Provisions & Bad Debts Written Off Directly/(Reversals) 576 388 964 747
Net Mark-Up Income After Provision 8,826 5,007 13,833 115
Fees, Commission & Brokerage Income 1,149 807 1,956 562
Dividend Income 108 23 132 (354)
Income From Dealing In Foreign Currencies 480 43 523 58
Other Income 982 318 1,300 194
Total Non - Markup Income 2,719 1,191 3,910 460
Total Income 11,546 6,197 17,743 575
Administrative Expenses 9,071 4,091 13,162 2,077
Other Expenses 141 111 252 93
Total Non-Markup Expenses 9,211 4,202 13,414 2,169
Profit before Tax and Extra ordinary Items 2,334 1,995 4,330 (1,594)
Extra ordinary/unusual Items -- Gain/(Loss) - - - -
PROFIT/ (LOSS) BEFORE TAXATION 2,334 1,995 4,330 (1,594)
Less: Taxation 732 70 802 (337)
PROFIT/ (LOSS) AFTER TAX 1,602 1,926 3,528 (1,257)
Absolute change

2. Islamic Banking
80
Table 2.2: Financial Soundness Indicators of Islamic Banking
Dec-09 Dec-10 Dec-11 Jun-12 Dec-12 Jun-13
Capital
Total Capital to Total RWA* 18.5 16.8 18.0 18.1 15.3 15.4
Tier 1 Capital to Total RWA* 18.4 16.3 17.2 17.4 14.7 14.8
Capital to Total Assets 11.4 9.7 8.7 8.3 7.6 7.1
Asset Quality
NPFs to Total Financing 6.3 7.3 7.6 8.8 7.6 7.1
Net NPFs to Net Financing 3.1 3.2 2.9 3.8 2.7 2.5
Provision to NPFs 51.7 58.6 63.0 59.5 66.5 66.1
Earnings
ROA before Tax 0.7 0.6 1.9 1.8 1.4 1.0
ROA after Tax 0.6 0.6 1.6 1.4 1.2 0.8
ROE before Tax 5.9 5.9 20.8 20.6 16.8 13.6
ROE after Tax 4.6 5.2 17.3 16.6 14.1 11.1
Net Mark-Up Income to Gross Income 79.4 78.5 82.4 80.2 80.1 79.1
Non Mark-Up Income to Gross Income 20.6 21.5 17.6 19.8 19.9 20.9
Operating Expense to Gross Income 70.3 72.6 60.4 64.7 67.3 71.7
Liquidity
Financing to Deposits 54.3 46.2 38.4 32.7 32.7 33.8
* Ratio pertains to Islamic Banks only and does not include Islamic Banking Branches
Percent

2. Islamic Banking
81
Table 2.3: List of Islamic Banks
Islamic Banks Islamic Banks
1 AlBaraka Bank (Pakistan) Ltd. 1 AlBaraka Bank (Pakistan) Ltd.
2 BankIslami Pakistan Ltd. 2 BankIslami Pakistan Ltd.
3 Burj Bank Ltd. 3 Burj Bank Ltd.
4 Dubai Islamic Bank Pakistan Ltd 4 Dubai Islamic Bank Pakistan Ltd
5 Meezan Bank Ltd 5 Meezan Bank Ltd
Conventional Banks having Islamic Banking Branches Conventional Banks having Islamic Banking Branches
1 Askari Bank Ltd. 1 Askari Bank Ltd.
2 Bank Al Habib Ltd 2 Bank Al Habib Ltd
3 Bank Alfalah Ltd 3 Bank Alfalah Ltd
4 Faysal Bank Ltd. 4 Faysal Bank Ltd.
5 Habib Bank Ltd 5 Habib Bank Ltd
6 Habib Metropolitan Bank 6 Habib Metropolitan Bank
7 MCB Bank Ltd 7 MCB Bank Ltd
8 National Bank of Pakistan 8 National Bank of Pakistan
9 Silk Bank Ltd 9 Silk Bank Ltd
10 Soneri Bank Ltd 10 Soneri Bank Ltd
11 Standard Chartered Bank 11 Standard Chartered Bank
12 The Bank of Khyber 12 The Bank of Khyber
13 United Bank Ltd. 13 The Bank of Punjab*
14 United Bank Ltd.
Grand Total 18 (5+13) Grand Total 19 (5+14)
* The Bank of Punjab started its Islamic Banking operations during H1CY13
As of December 31, 2012 As of June 30, 2013

82
3. Non-Banking Financial Institutions
Table 3.1: Balance Sheets and Income Statements of DFIs
PKR million
Absolute change
YoY
ASSETS
Cash & Balances With Treasury Banks 1,716 1,740 2,341 481 519 513 32
Balances With Other Banks 6,713 2,866 1,423 2,522 3,601 2,518 (4)
Lending To Financial Institutions 12,085 8,720 2,909 3,172 2,198 5,534 2,362
Investments - Net 62,102 64,115 81,379 88,005 79,065 75,773 (12,233)
Advances - Net 41,416 45,234 46,547 46,737 45,988 43,726 (3,011)
Operating Fixed Assets 3,098 2,974 2,930 2,960 4,545 3,329 369
Deferred Tax Assets 1,277 1,098 1,193 1,219 3,345 1,116 (102)
Other Assets 3,786 5,500 5,103 5,572 1,164 4,710 (862)
TOTAL ASSETS 132,193 132,248 143,825 150,669 140,426 137,218 (13,450)
LIABILITIES - - - - - -
Bills Payable - - - - - - -
Borrowings From Financial Institution 51,522 50,306 64,885 67,693 58,165 50,610 (17,083)
Deposits And Other Accounts 18,074 15,856 12,074 14,081 13,510 15,578 1,497
Sub-ordinated Loans - - - - - - -
Liabilities Against Assets Subject To Finance Lease 30 15 19 14 11 8 (6)
Deferred Tax Liabilities 2 637 669 719 8,181 914 195
Other Liabilities 5,814 6,757 6,899 7,537 898 9,956 2,419
TOTAL LIABILITIES 75,442 73,571 84,546 90,045 80,764 77,066 (12,980)
NET ASSETS 56,751 58,677 59,279 60,624 59,662 60,153 (471)
NET ASSETS REPRESENTED BY: - - - - - - -
Share Capital 47,269 48,343 48,409 48,627 48,409 48,627 -
Reserves 7,250 7,272 7,454 6,018 6,638 6,226 208
Unappropriated Profit 342 2,116 2,513 4,776 2,501 3,048 (1,728)
Share Holders' Equity 54,860 57,732 58,375 59,421 57,548 57,901 (1,520)
Surplus/Deficit On Revaluation Of Assets 1,891 945 904 1,203 2,114 2,252 1,049
TOTAL 56,751 58,677 59,279 60,624 59,662 60,153 (471)
OPERATING POSITION Jun-13
Mark-Up/ Return/Interest Earned 12,592 13,942 15,202 7,501 14,928 5,814 (1,687)
Mark-Up/ Return/Interest Expenses 6,720 7,318 8,030 4,463 8,524 3,148 (1,316)
Net Mark-Up / Interest Income 5,872 6,625 7,172 3,038 6,403 2,667 (371)
Provisions & Bad Debts Written Off Directly/(Reversals) 3,133 1,238 941 (129) 3,975 (175) (46)
Net Mark-Up / Interest Income After Provision 2,739 5,386 6,231 3,167 2,428 2,842 (325)
Fees, Commission & Brokerage Income 191 148 124 56 108 36 (20)
Dividend Income 423 484 854 223 1,036 338 115
Income From Dealing In Foreign Currencies 20 (483) (160) 73 148 29 (44)
Other Income 844 1,194 534 593 1,329 1,087 494
Total Non - Markup / Interest Income 1,479 1,343 1,352 945 2,620 1,491 546
Total Income 4,217 6,729 7,583 4,112 5,049 4,333 221
Administrative Expenses 2,647 2,977 3,102 1,547 3,397 1,724 177
Other Expenses 62 166 1,905 18 399 (33) (50)
Total Non-Markup/Interest Expenses 2,709 3,144 5,007 1,565 3,796 1,692 126
Profit before Tax and Extra ordinary Items 1,508 3,586 2,576 2,547 1,253 2,642 95
Extra ordinary/unusual Items -- Gain/(Loss) (25) - - - - - -
Profit/ (Loss) Before Taxation 1,533 3,586 2,576 2,547 1,253 2,642 95
Less: Taxation 630 1,690 1,690 754 1,500 608 (146)
Profit/ (Loss) after Taxation 904 1,896 886 1,793 (248) 2,034 241
CY09
Change
YoY
Jun-13
CY09 CY10 CY11 Jun-12
CY10Financial Position CY12
CY12
CY11 Jun-12

3. Non-Banking Financial Institutions
83
Table 3.2: Financial Soundness Indicators of DFIs
CY08 CY09 CY10 CY11 Jun-12 CY12 Jun-13
Capital
Total Capital to Total RWA 53.4 52.5 56.1 56.9 57.1 54.8 54.6
Tier 1 Capital to Total RWA 53.3 52.4 56.5 57.4 57.5 54.9 54.7
Capital to Total Assets 47.1 42.9 44.4 41.2 40.2 42.5 43.8
Asset Quality
NPLs to Total Loans 27.0 27.1 29.9 29.3 32.3 31.8 31.6
Net NPLs to Net Loans 11.2 10.1 14.8 14.4 18.3 14.7 13.7
Provision to NPLs 65.9 69.8 59.4 59.4 52.9 63.1 65.5
Net NPLs to Capital 8.4 7.4 11.4 11.3 14.1 11.3 10.0
Earnings
ROA before Tax 1.5 1.3 2.7 1.9 3.4 0.9 3.8
ROA after Tax 0.7 0.8 1.4 0.6 2.4 -0.2 2.9
ROE before Tax 3.4 2.9 6.2 4.4 8.4 2.1 8.7
ROE after Tax 1.6 1.7 3.3 1.5 5.9 -0.4 6.7
Net Interest Income to Gross Income 34.8 79.9 83.1 84.1 76.3 71.0 64.1
Operating Expense to Gross Income 22.7 36.9 39.5 58.7 39.3 42.1 40.7
Liquidity
Loans to Deposits 622.9 229.2 285.3 385.5 331.9 340.4 280.7
Liquid Assets/Total Assets 31.2 35.9 32.6 40.3 42.3 39.5 37.9
Liquid Assets/Total Deposits 547.3 262.4 271.6 480.6 453.0 410.7 333.8
Percent

3. Non-Banking Financial Institutions
84
Table 3.3: List of Development Finance Institutions
As of December 31, 2012 As of June 30, 2013
1. House Building Finance Company Ltd. 1. House Building Finance Company Ltd.
2. PAIR Investment Company Ltd. 2. PAIR Investment Company Ltd.
3. Pak Brunei investment Company Ltd. 3. Pak Brunei investment Company Ltd.
4. Pak Libya Holding Company Ltd. 4. Pak Libya Holding Company Ltd.
5. Pak Oman Investment Company Ltd. 5. Pak Oman Investment Company Ltd.
6. Pak-China Investment Company Ltd. 6. Pak-China Investment Company Ltd.
7. Pakistan Kuwait Investment Company Ltd. 7. Pakistan Kuwait Investment Company Ltd.
8. Saudi Pak Industrial & Agricultural Investment Company Ltd. 8. Saudi Pak Industrial & Agricultural Investment Company Ltd.

3. Non-Banking Financial Institutions
85
Table 3.4: NBFC’s category-wise key variables
Investment BanksPKR million
FY03 FY04 FY05 FY06 FY07 FY08 FY09 FY10 FY11 FY12 H1FY13 FY13
Equity 4,811 6,236 6,659 5,921 9,038 7,482 4,349 4,286 3,503 1,707 1,750 1,066
Deposits 12,810 12,263 19,907 25,024 15,204 12,593 8,869 6,472 7,176 6,071 4,513 4,005
Liabilities 31,258 29,338 44,382 48,606 35,550 35,896 26,526 22,007 20,648 17,493 12,070 10,767
Advances 10,715 13,535 21,274 22,502 18,537 18,721 14,181 7,852 4,774 3,913 2,569 3,294
Investments 19,888 17,386 20,931 24,088 20,854 17,070 11,196 9,270 11,167 5,696 5,413 3,873
Assets 36,069 35,568 51,041 54,527 44,588 43,378 30,875 26,294 24,140 16,644 13,821 11,762
Income 4,699 3,690 4,598 6,441 4,662 5,201 2,835 2,767 2,462 1,602 775 976
Expense 3,959 2,051 4,302 5,058 4,278 4,695 4,953 4,563 2,961 3,291 943 1,788
Leasing CompaniesPKR million
FY03 FY04 FY05 FY06 FY07 FY08 FY09 FY10 FY11 FY12 H1FY13 FY13
Paid up Capital 3,713 3,554 4,683 5,104 5,259 6,467 7,666 4,277 4,277 3,977 3,977 4,505
Equity 4,811 6,236 6,659 5,921 9,038 7,482 4,349 4,582 4,950 4,223 4,181 5,023
Deposits 12,810 12,263 19,907 25,024 15,204 12,593 8,869 13,290 5,295 6,358 7,020 8,386
Liabilities 31,258 29,338 44,382 48,606 35,550 35,896 26,526 32,406 28,568 28,692 29,174 29,290
Advances 10,715 13,535 21,274 22,502 18,537 18,721 14,181 29,285 26,934 26,551 25,274 28,543
Investments 19,888 17,386 20,931 24,088 20,854 17,070 11,196 3,635 2,799 2,993 3,095 4,048
Assets 36,069 35,568 51,041 54,527 44,588 43,378 30,875 36,989 33,473 32,874 33,356 34,341
Income 4,699 3,690 4,598 6,441 4,662 5,201 2,835 4,686 4,078 4,411 2,323 4,526
Expense 3,959 2,051 4,302 5,058 4,278 4,695 4,953 5,053 3,900 4,379 2,075 3,880
ModarabasPKR million
FY03 FY04 FY05 FY06 FY07 FY08 FY09 FY10 FY11 FY12 H1FY13 FY13
Paid up Capital 8,187 8,081 7,912 7,547 7,193 7,828 8,529 8,439 8,746 12,103 13,245 9,367
Equity 7,983 8,652 9,965 10,326 11,148 11,845 10,839 11,489 12,455 13,013 13,313 13,824
Liabilities 7,990 9,471 11,607 13,602 15,191 17,805 12,248 13,000 13,921 16,512 16,177 17,610
Assets 15,973 18,026 21,572 23,927 26,339 29,643 23,087 24,489 26,343 29,522 29,988 31,434
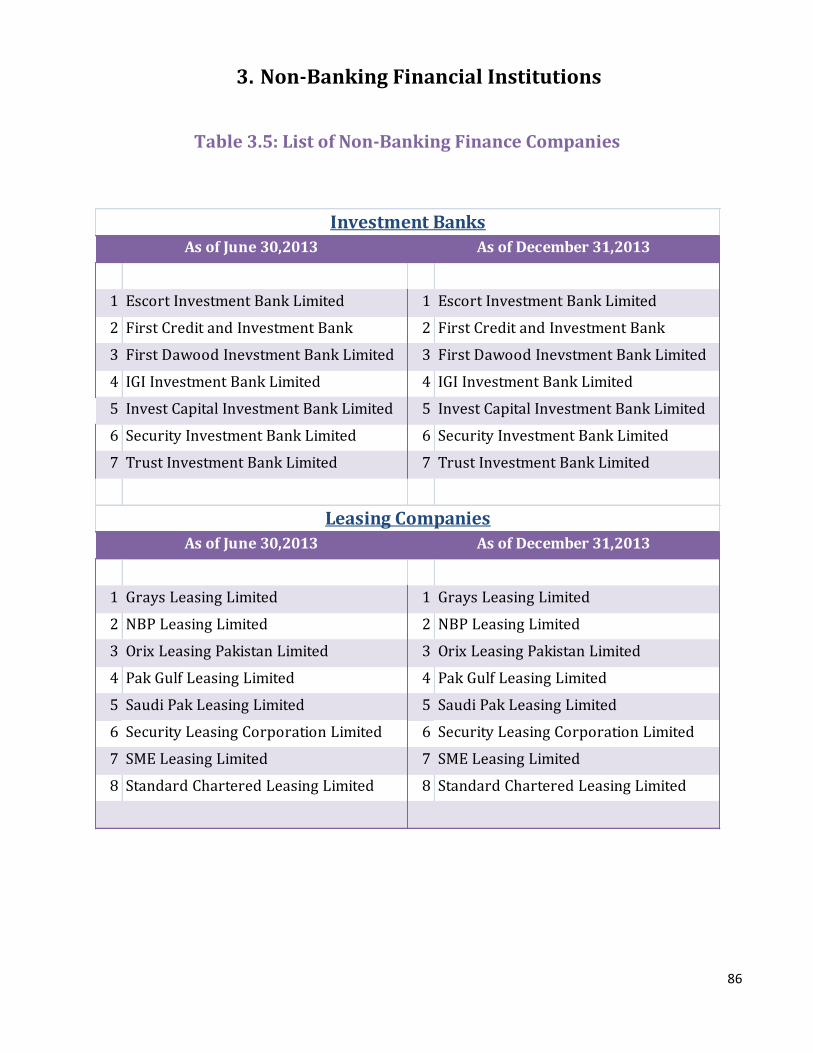
3. Non-Banking Financial Institutions
86
Table 3.5: List of Non-Banking Finance Companies
1 Escort Investment Bank Limited 1 Escort Investment Bank Limited
2 First Credit and Investment Bank 2 First Credit and Investment Bank
3 First Dawood Inevstment Bank Limited 3 First Dawood Inevstment Bank Limited
4 IGI Investment Bank Limited 4 IGI Investment Bank Limited
5 Invest Capital Investment Bank Limited 5 Invest Capital Investment Bank Limited
6 Security Investment Bank Limited 6 Security Investment Bank Limited
7 Trust Investment Bank Limited 7 Trust Investment Bank Limited
1 Grays Leasing Limited 1 Grays Leasing Limited
2 NBP Leasing Limited 2 NBP Leasing Limited
3 Orix Leasing Pakistan Limited 3 Orix Leasing Pakistan Limited
4 Pak Gulf Leasing Limited 4 Pak Gulf Leasing Limited
5 Saudi Pak Leasing Limited 5 Saudi Pak Leasing Limited
6 Security Leasing Corporation Limited 6 Security Leasing Corporation Limited
7 SME Leasing Limited 7 SME Leasing Limited
8 Standard Chartered Leasing Limited 8 Standard Chartered Leasing Limited
Investment Banks
As of June 30,2013 As of December 31,2013
Leasing Companies
As of June 30,2013 As of December 31,2013

3. Non-Banking Financial Institutions
87
1 Al -Noor Modaraba 1 Al -Noor Modaraba
2 Allied Rental Modaraba 2 Allied Rental Modaraba
3 B.F. Modaraba 3 B.F. Modaraba
4 BRR Guardian Modaraba 4 BRR Guardian Modaraba
5 Crescent Standard Modaraba 5 Crescent Standard Modaraba
6 Elite Capital Modaraba 6 Elite Capital Modaraba
7 Equity Modaraba 7 Equity Modaraba
8 Fidelity Leasing Modaraba 8 Fidelity Leasing Modaraba
9 First Pak Modaraba 9 First Pak Modaraba
10 First Treet Manufacturing Modaraba 10 First Treet Manufacturing Modaraba
11 Habib Bank Modaraba 11 Habib Bank Modaraba
12 Habib Modaraba 12 Habib Modaraba
13 IBL Modaraba 13 IBL Modaraba
14 Imrooz Modaraba 14 Imrooz Modaraba
15 KASB Modaraba 15 KASB Modaraba
16 Modaraba Al-Mali 16 Modaraba Al-Mali
17 National Bank Modaraba 17 National Bank Modaraba
18 Paramount Modaraba 18 Paramount Modaraba
19 Prudential Modaraba 19 Prudential Modaraba
20 Punjab Modaraba 20 Punjab Modaraba
21 Standard Chartered Modaraba 21 Standard Chartered Modaraba
22 Trust Modaraba 22 Trust Modaraba
23 UDL Modaraba 23 UDL Modaraba
24 Unicap Modaraba
Modarabas
As of June 30,2013 As of December 31,2013

88
4. Insurance Sector
Table 4.1: Insurance Sector: Category-wise key variables
Non-Life Insurance Business
CY05 CY06 CY07 CY08 CY09 CY10 CY11 Jun-12 Dec-12 Jun-13
Paid-up capital 7,734 8,807 10,245 11,827 13,909 13,347 14,601 16,205 16,277 17,698
Investments 22,528 34,419 69,677 60,195 63,122 59,268 56,821 55,018 59,096 59,951
Gross Premium 27,712 33,250 38,196 41,707 43,441 45,813 45,717 23,289 48,706 27,175
Net Premium 15,931 20,403 23,076 26,293 25,298 25,491 24,743 11,919 24,505 13,282
Net Claims Incurred 9,017 11,807 17,378 26,297 21,283 17,162 14,640 7,406 14,380 7,354
Net Profit after tax 5,863 16,819 56,153 (4,089) 5,995 3,605 3,066 3,473 5,025 4,387
Total Assets 53,753 74,334 121,771 114,497 123,654 121,856 112,883 117,694 120,881 126,737
Life Insurance Business
CY05 CY06 CY07 CY08 CY09 CY10 CY11 Jun-12 Dec-12 Jun-13
Paid-up capital 2,362 2,748 2,847 3,391 4,467 5,895 5,895 6,273 6,273 6,624
Investments 109,581 129,084 154,675 165,319 199,364 227,547 269,330 307,356 329,505 369,131
Gross premium 18,552 22,571 27,692 34,861 41,943 53,831 69,936 38,909 91,406 45,666
Net premium 17,964 21,848 26,818 33,786 40,771 52,531 66,274 37,770 89,385 44,644
Net claims incurred 8,818 10,994 13,353 16,737 19,774 21,214 20,469 14,045 32,916 17,532
Net profit (after tax) 393 657 1,679 (137) 1,068 940 1,519 834 2,447 881
Total assets 142,329 164,605 191,746 213,959 228,581 292,810 348,993 380,271 428,884 470,068
Reinsurance Business
CY05 CY06 CY07 CY08 CY09 CY10 CY11 Jun-12 Dec-12 Jun-13
Paid up Capital 450 450 540 3,000 3,000 3,000 3,000 3,000 3,000 6,061
Investments 2,873 3,588 6,412 5,459 5,481 4,674 5,793 5,226 6,434 6,137
Gross Premium 4,160 4,499 4,731 4,555 5,839 6,552 6,893 3,081 8,154 3,404
Net Premium 2,005 1,415 1,695 1,896 2,170 2,940 3,535 2,069 4,096 2,178
Net Claims incurred 823 777 931 962 904 1,688 2,018 1,009 2,217 1,006
Net Profit after tax 594 672 3,727 886 269 526 844 446 1,104 597
Total Assets 5,634 6,464 10,447 12,528 12,372 12,535 12,878 12,523 14,565 14,645
PKR million
PKR million
PKR million

4. Insurance Sector
89
Table 4.2: List of Insurance Companies
1 ACE Insurance Limted 1 ACE Insurance Limted
2 Adamjee Insurance Company Limited 2 Adamjee Insurance Company Limited
3 Allianz EFU Health Insurance Limited 3 Allianz EFU Health Insurance Limited
4 Alfalah Insurance 4 Alfalah Insurance
5 Alpha Insurance Company Limited 5 Alpha Insurance Company Limited
6 Asia Insurance Company Limited 6 Asia Insurance Company Limited
7 Askari General Insurance 7 Askari General Insurance
8 Atlas Insurance Limited 8 Atlas Insurance Limited
9 Capital Insurance Company Limited 9 Capital Insurance Company Limited
10 Central Insurance Company Limited 10 Central Insurance Company Limited
11 Century Insurance Company Limited 11 Century Insurance Company Limited
12 Continental Insurance Company Limited 12 Continental Insurance Company Limited
13 East West Insurance Company Limited 13 East West Insurance Company Limited
14 EFU General Insurance Limited 14 EFU General Insurance Limited
15 Habib Insurance Company limited 15 Habib Insurance Company limited
16 IGI Insurance Limited 16 IGI Insurance Limited
17 National Insurance Company Limited 17 National Insurance Company Limited
18 New Hampshire Insurance Company 18 New Hampshire Insurance Company
19 New Jubilee Insurance Company Limited 19 New Jubilee Insurance Company Limited
20 PICIC Insurance Limited 20 PICIC Insurance Limited
21 Premier Insurance Limited 21 Premier Insurance Limited
22 Reliance Insurance Company Limited 22 Reliance Insurance Company Limited
23 Saudi Pak Insurance Company Limited 23 Saudi Pak Insurance Company Limited
24 Security General Insurance Company Limited 24 Security General Insurance Company Limited
25 Shaheen Insurance Company Limited 25 Shaheen Insurance Company Limited
26 Silver Star Insurance Company Limited 26 Silver Star Insurance Company Limited
27 The Asian Mutual Insurance Company (Guarantee) Limited 27 The Asian Mutual Insurance Company (Guarantee) Limited
28 The Cooperative Insurance Society of Pakistan 28 The Cooperative Insurance Society of Pakistan
29 The Crescent Star Insurance Company Limited 29 The Crescent Star Insurance Company Limited
30 The Pakistan General Insurance Company Limited 30 The Pakistan General Insurance Company Limited
31 The United Insurance Company of Pakistan Limited 31 The United Insurance Company of Pakistan Limited
32 The Universal Insurance Company Limited 32 The Universal Insurance Company Limited
33 TPL Direct Insurance Limited 33 TPL Direct Insurance Limited
34 UBL Insurers Limited 34 UBL Insurers Limited
1 Pak Kuwait Takaful Company Limited 1 Pak Kuwait Takaful Company Limited
2 Pak Qatar General Takaful Limited 2 Pak Qatar General Takaful Limited
3 Takaful Pakistan Limited 3 Takaful Pakistan Limited
Non-Life Insurance
As on December 2012 As on June 2013
Non-Life Takaful Companies
As on December 2012 As on June 2013

4. Insurance Sector
90
1 Adamjee Life Assurance Company Limited 1 Adamjee Life Assurance Company Limited
2 American Life insurance Company (Pakistan) Limited 2 American Life insurance Company (Pakistan) Limited
3 Asia Care Health & Life Insurance Company Limited 3 Asia Care Health & Life Insurance Company Limited
4 East West Life Assurance Company Limited 4 East West Life Assurance Company Limited
5 EFU Life Assurance Limited 5 EFU Life Assurance Limited
6 New Jublee Life Insurance Company limited 6 New Jublee Life Insurance Company limited
7 State Life Insurance Corporation of Pakistan 7 State Life Insurance Corporation of Pakistan
1 Dawood Family Takaful Limited 1 Dawood Family Takaful Limited
2 Pak Qatar Family Takaful Limited 2 Pak Qatar Family Takaful Limited
1 Pakistan Reinsurance Company Limited 1 Pakistan Reinsurance Company Limited
Reinsurance
As on December 2012 As on June 2013
Life Insurance
As on December 2012 As on June 2013
Life Takaful Companies
As on December 2012 As on June 2013
91
Acronyms
AAOIFI
ADB
ADCs
ADR
Ads
AFS
AGD
AHFL
AIG
ALM
AMC
AML
AMZVL
ASEAN
ATM
BB
BCBS
BIS
BOP
BPRD
bps
BRICS
BRRGM
BSC
BSCs
BSD
CAD
CAELS
CAGR
CAMELS
CAR
CASA
CBs
CDC
CDD
CDNS
CDR
CDS
CDS
CF
CFS
CIB
CIC
CNIC
CoDs
COFI
CoIs
CPI
Accounting and Auditing Organization for Islamic
Financial Institutions
Asian Development Bank
Alternative Delivery Channels
Advances to Deposit Ratio
Authorized Dealers
Available-For-Sale
Accumulated Gross Disbursements
Asian Housing Finance Limited
American International Group, Inc
Asset Liability Management
Asset Management Companies
Anti Money Laundering
AMZ Ventures
Southeast Asian Nations
Automated-Teller Machines
Branchless Banking
Basel Committee Of Banking Supervision
Bank Of International Settlement
Balance of Payment
Banking Policy and Regulation Department
Basis Points
Brazil, Russia, India, China, and South Africa
B.R.R. Guardian Modaraba
Banking Services Corporation
Behbood Savings Certificates
Banking Surveillance Department
Current Account Deficit
Capital Adequacy Asset Quality Earnings
Compound Average Growth Rate
Capital, Assets, Management, Earnings, Liquidity and
Sensitivity
Capital Adequacy Ratio
Current Account Saving Account
Commercial Banks
Central Depository Company
Customer Due Diligence
Central Directorate of National Savings
Currency to Deposits Ratio
Credit Default Swaps
Central Depository System
Consumer Finance
Continuous Funding System
Credit Information Bureau
Currency in circulation
Computerized National Identity Card
Certificate of Deposits
Cost of Financial Intermediation
Certificate of Investments
Consumer Price Index
CPSS
CRR
CRWA
CSF
CSF
CY
DCMC
DFIs
DM
DMMD
DNS
DPCO
DSC
DVF
DVP
DW
EA
e-banking
E-bond
ECB
EFS
EPS
EWS
FB
FCA
FDI
FIFO
FMAP
FPI
FRA
FRDL
FSB
FSR
FSV
FY
FY
FX
G2P
GDP
GFC
GoP
GPF
HBFCL
HBL
HFCs
HFT
HHI
IBD
IBIs
IDB
Committee Of Payment And Settlement
Cash Reserve Requirement
Credit Risk Weighted Assets
Coalition Support Fund
Competitiveness Support Fund
Calendar Year
Debt Capital Market Committee
Development Finance Institutions
Diminishing Musharakah
Domestic Markets & Monetary Management
Deferred Net Settlement Systems
Debt Policy Co-ordination Office
Defense Saving Certificates
Delivery Vs. Free
Delivery Vs. Payment
Discount Window
Emerging Asia
Electronic Banking
Electronic Bond
European Commercial Bank
Export Finance Schemes
Earnings per Share
Early Warning System
Foreign Bank
Foreign Currency Account
Foreign Direct Investments
First In First Out
Financial Market Association Of Pakistan
Foreign Portfolio Investments
Forward Rate Agreement
Fiscal Responsibility and Debt Limitation Act
Financial Stability Board
Financial Stability Report
Forced Sale Value
Financial Year
Fiscal Year
Foreign Exchange
Government to Person
Gross Domestic Product
Global Financial Crisis
Government Of Pakistan
General Provident Fund
House Building Finance Corporation Limited
Habib Bank Limited
Housing Finance Companies
Held-For-Trading
Herfindahl Index
Islamic Banking Department
Islamic Banking Institutions
Industrial Development Bank

92
IDR
IFCs
IFIs
IFSB
IFSI
IFT
ILF
IMF
IDR
IPO
IPS
IRR
IRS
IT
KDA
KDS
KIBOR
KONIA
KSE
KYC
LCR
LHS
LIBOR
LICs
LMM
LoLR
LPBs
LRI
LSM
LVP
M&As
MCR
MER
MICR
MMA
MMF
MNSB
Mod/MF
MoF
MPS
MRTBs
MRWA
MSCI
MSR
MTBs
MUFAP
NAV
NBFCs
NBFIs
NBP
NCB
NCCPL
NCS
Investments to Deposit Ratio
Investment Finance Companies
International Financial Institutions
Islamic Financial Services Board
Islamic Financial Services Industry
Interbank Fund Transfers
Intra-Day Liquidity Facility
International Monetary Fund
Investment to Deposit Ratio
Initial Public Offering
Investment Portfolio Securities
Interest Rate Risk
Interest Rate Swap
Information Technology
Khass Deposit Accounts
Khass Deposit Certificates
Karachi Inter-Bank Offer Rate
Karachi Overnight Index Average
Karachi Stock Exchange
Know Your Customer
Liquidity Coverage Ratio
Left Hand Side
London Inter-Bank Rate
Life Insurance Companies
Locally Manufactured Machinery
Lender of Last Resort
Local Private Banks
Liquidity Risk Indicator
Large Scale Manufacturing
Large Value Payment
Mergers and Acquisitions
Minimum Capital Requirement
Minimum Equity Requirements
Magnetic Ink Character Recognition
Mahana Amdani Accounts
Money Market Funds
Multilateral Net Settlement Batches
Modaraba Companies and Mutual funds
Ministry Of Finance
Monetary Policy Statement
Market Related Treasury Bills
Market Risk Weighted Assets
Morgan Stanley Capital International
Minimum Saving Rate
Market Treasury Bills
Mutual Funds Association of Pakistan
Net Asset Value
Non-banking Finance Companies
Non-Bank Financial Institutions
National Bank of Pakistan
Non-Competitive Bids
National Clearing Company of Pakistan Ltd.
National Coinsurance Scheme
NCSS
NDA
NDLC
NEER
NFA
NGOs
NICL
NIFT
NII
NIM
NIT
NOP
NR
NPFs
NPLs
NPLR
NSB
NSS
NTN
O/N
OAEM
OMOs
OSED
OTC
P2G
P2P
PBA
PBA
PBIC
PBT
PCIC
PE&VCF
PEPCO
PIB
PIIC
PKIC
PKR
PKRV
PLA
PLHC
PLS
POIC
POL
POS
PPEML
PPTFC
PRC
PRCL
PRISM
PSC
PSCBs
PSEFT
National Clearing And Settlement System
Net Domestic Assets
National Developing Leasing Corporation
Nominal Effective Exchange Rate
Net Foreign Assets
Non-Governmental Organization
National Insurance Company Limited
National Institutional Facilitation Technologies (Pvt.)
Limited
Net Interest Income
Net Interest Margin
National Investment Trust Ltd
Net Open Position
Non-Remunerative
Non-Performing Financing
Non-Performing Loans
Non-Performing Loan Ratio
National Savings Bond
National Savings Schemes
National Tax Number
Overnight
Other Assets Especially Mentioned
Open Market Operations
Off-Site Supervision and Support Department
Over the Counter
Person to Government
Person to Person
Pakistan Banks’ Association
Pensioners' Benefit Account
Pak Brunei Investment company Ltd
Profit Before Tax
Pak China Investment Company Ltd.
Private Equity and Venture Capital Fund
Pakistan Electric Power Company
Pakistan Investment Bond
Pak-Iran Investment Company Ltd.
Pakistan Kuwait Investment Company (Pvt)
Pakistani Rupee
Pakistan Revaluation Rate
Personal ledger Accounts
Pak-Libya Holding Company (Pvt) Ltd.
Profit-Loss Sharing
Pak Oman Investment Company
Pakistan Oilfields Limited
Point Of Sale
Pakistan Private Equity Management Ltd.
Privately Placed Term Finance Certificates
Publication Review Committee
Pakistan Reinsurance Company Limited
Pakistan Real-Time Interbank Settlement
Private Sector Credit
Public Sector Commercial Banks
Payment Systems And Electronic Fund

93
PSEs
PTES
RCC
RDNS
REER
REPO
RHS
RIC
ROA
ROE
RPI
RSA
RSL
RTGS
RTOB
RWA
S&DWH
SA
SAB
SBs
SBA
SBP
SCRA
SDA
SDRs
SECP
SGS
SLIC
SLR
SME
SPIAIC
SSAs
SSC
SSS
STDL
SWIFT
T-Bill
TCP
TDL
TFC
TMTV
TRGPL
TSA
UAE
UBL
ULR
USD
VC
VCCs
WADR
WALR
WAPDA
WEO
YoY
Public Sector Enterprises
Production & Transmission of Energy Sector
Retail Checque Clearing
Regional Directorate of National Savings
Real Effective Exchange Rate
Repurchase Agreement
Right Hand Side
Regular Income Certificates
Return on Assets
Return on Equity
Real Private Investment
Rate Sensitive Assets
Rate Sensitive Liabilities
Real-Time Gross Settlement
Real Time Online Banking
Risk Weighted Assets
Statistics & Data Warehouse Department
Savings Accounts
Shariah Advisory Board
Specialized Banks
Stand-by Arrangement
State Bank of Pakistan
Special Convertible Rupee Account
Special Drawing Accounts
Special Drawing Rights
Securities Exchange Commission of Pakistan
Singapore Government Securities
State Life Insurance Corporation
Statutory Liquidity Requirement
Small And Medium Enterprises
Saudi Pak Industrial and Agricultural
Special Savings Accounts
Special Savings Certificates
Small Savings Schemes
Short-Term Debt And Liabilities
Society For Worldwide Interbank Financial
Treasury Bills
Trading Corporation of Pakistan
Time And Demand Liabilities
Term Finance Certificate
TMT Ventures
TRG Pakistan Limited
Treasury Single Account
United Arab Emirates
United Bank Limited
Uncovered Liability Ratio
US Dollar
Venture Capital
Venture Capital Companies
Weighted Average Deposits Rate
Weighted Average Lending Rate
Water and Power Development Authority
World Economic Outlook
Year on Year