financial service usage: a conceptual modelaccess.i2ifacility.org/publications/i2i mfw note 3 -...
TRANSCRIPT
Financialservice usage:A conceptual model
Advancing Financial Inclusion
Acknowledgments
About insight2impact
The authors had many discussions and read widely to form the hypotheses and framework presented in this series of notes. To all those who were willing to debate the heart of financial inclusion and share their thoughts, a sincere word of thanks. In particular, we would like to thank our advisory panel members for their valuable comments and guidance: Gerhard Coetzee, Henri Dommel, G. Gilbert Gnany, Fiona Greig, Leora Klapper, David Porteous, Elisabeth Rhyne and Piyush Tantia.
Insight2impact | i2i is a resource centre that aims to catalyse the provision and use of data by private and public-sector actors to improve financial inclusion through evidence-based, data-driven policies andclient-centric product design.
i2i is funded by the Bill & Melinda Gates Foundation in partnership with The MasterCard Foundation.
For more information:Visit our website at www.i2ifacility.org.Email Mari-Lise du Preez at [email protected]. Call us on +27 (0)21 913 9510.
Advancing Financial Inclusion

02
This note is the third in a series of notes to explore the role of measurement in delivering on financial inclusion objectives and to develop a set of new measurement frameworks to assist stakeholders to achieve these objectives.
The first note, Introduction to measurement frameworks, introduces the concept of a measurement framework, its purpose and components. The second outlines a scan of existing measurement initiatives in the financial inclusion space to position our usage agenda in context.
This, the third note, builds a conceptual model of financial device usage and the triggers and drivers thereof as a theoretical underpin to the work of i2i, on the premise that actual usage, rather than mere uptake, is important for financial inclusion impact.
The remaining notes present a number of new measurement frameworks (MFWs) for policymakers, development organisations and financial service providers to practically measure, and therefore better understand, priority measurement areas for financial inclusion.
About the i2i measurementframework note series
Title What does it cover
1. Introduction to MFWs
2. Determining our focus
3. Usage conceptual model
4. Needs measurement framework
5. Financial inclusion depth measurement framework
6. Usage measurement framework
Looks to other fields to explain what a measurement framework is.
Scans existing measurement frameworks and indicatorsin financial inclusion to position our measurement agenda(‘gap analysis’).
Builds a conceptual model of financial service usage and the triggers and drivers thereof as a theoretical underpin to thework of i2i, on the hypothesis that actual usage, rather thanmere uptake, is important for financial inclusion impact.
Outlines a measurement framework for how financial service needs are revealed and met through financial service usage.
Outlines a measurement framework for financial inclusion that considers the portfolio of financial devices taken up or used per person (termed ‘depth of financial inclusion’), in contrast to a one-dimensional focus on percentage of people reached.
Unpacks the definition of usage, clearly demarcating it from uptake; lays out a set of principles for determining usage indicators and provides examples of how these manifest.
Measurementframeworkconcept notes
Umbrella notes

Contents
Advancing Financial Inclusion

04
Executive summary 5
1. Introduction 7
2. Usage at the centre 9
3. What is usage? 17
4. The usage model 21
5. Drivers of usage 27 5.1 Trial use triggers 28 5.2 Drivers of usage 29 5.2.1 Functional drivers 30 5.2.2 Behavioural and contextual drivers 32
6. Implications for measurement 35
Appendix 1: Financial inclusion impact studies 39
Bibliography 40
Table of contents
Box 1. Core financial needs 13Box 2. The role of informal financial services 14Box 3. Total cost is more than fees and charges – the case of bank accounts in Malawi 31Box 4. Towards the operationalisation of the usage conceptual model 37
List of boxes
Figure 1. Financial inclusion chain 10Figure 2. Account activity in select countries 12Figure 3. Uptake of formal vs informal financial devices across Myanmar, Thailand, Swaziland, Lesotho, Malawi and Mozambique 14Figure 4. Overlaps in usage of informal and formal financial devices 16Figure 5. Conceptual approach to measuring usage 20Figure 6. Usage conceptual model 23Figure 7. Measuring total monthly cost of basic bank account in Malawi (USD) 31Figure 8. Illustration of levels of internal and contextual drivers of decision-making 34Figure 9. Illustrative example of steps towards the operationalisation of the usage conceptual model 37
List of figures
The i2i facility was established as a resource centre to assist the financial inclusion community to make better use of available and new data to improve the value delivered by financial services for low-income households and nations.
A focus on usage. Following a scan of existing measurement frameworks in financial inclusion and a consultation process to understand the evolution of financial inclusion measurement to date and the key measurement needs, the measurement of usage of financial services was identified as an area where i2i can make a substantial contribution.
Core assumptions. Durable measurement frameworks are underpinned by sound theory. Thus, i2i developed a theoretical or conceptual framework around usage. This framework starts from financial needs as point of departure. It then considers what triggers financial service uptake and/or first use, what drives sustained usage and how one can meaningfully gauge how consumers deploy different financial services towards meeting the underlying need. This conceptual model is based on three underlying assumptions:
» Usage – rather than mere uptake – is necessary for financial inclusion outcomes and impact.
» Consumers choose financial services based on their underlying financial needs.
» Different financial devices (payments, savings, credit, insurance), from different types of formal and informal providers, are substitutes or complements in meeting a specific need.
These three core theoretical tenets imply that, from a policy perspective, it is essential for governments, donors and financial service providers to measure: (i) the nature and patterns of their citizens’ usage of financial services; (ii) across the full financial usage profile, formal as well as informal; and (iii) that the point of departure for understanding usage patterns is an understanding of the purpose of usage, namely the needs being served and the different devices (formal and informal, and across product markets) that can be used to meet that need.
Building the conceptual model
Towards commonly accepted definitions. The conceptual model of usage comprises several core concepts for which a common definition is required: » Use cases are defined as the specific purpose
underlying usage. You need to pay for your child’s education to be able to cover health expenses or to cope if your harvest fails. You need to pay your household bills or send money to a relative in the rural areas. You need to cope with budget shortfalls.
» Financial devices are any physical, social or electronic mechanism that stores, accumulates, distributes or transfers value and that can be used to meet a financial need. People use a portfolio of financial devices – from the proverbial mattress for saving at home, to turning to community members for assistance, using a hawala or hundi service, mobile money, formal insurance, a loan from a money lender, a bank account, or an MFI loan – to meet their financial needs.
» Usage can be defined as “a person deploying a financial device to meet a specific financial need”.
» The active deployment sets usage apart from uptake, which we define as “the act of meeting the requirements and/or completing the procedures that confer on a customer the right to use a financial device”.
Uptake triggers and usage drivers. The poor are especially resourceful when managing their financial lives. What they choose to use, and how, is partly determined by supply-side factors that set access barriers1, as well as contextual matters relating to their lifecycle, socioeconomic circumstances or the macroeconomic realities of the time. But equally important are perceptions, behavioural traits and the nature of societal functioning. Uptake or usage triggers are defined as factors prompting first use (for example advertising), of which the effect erodes over time, whereas drivers exert a sustained influence over time.
Executive summary
A particularly important driver is the value proposition of the financial device vis-à-vis alternative options. Does it provide better functional value towards meeting the use case than alternative devices?
06
Three usage paths. After first use of a financial device has been triggered, the user can follow one of three paths: He/she can sustain his/her usage, can defect to an alternative device (or revert back to cash as default device for living his/her financial life) or the use case can cease, in which case there will no longer be any usage. It is important to build an understanding of the drivers of decision-making along each path.
The indicators are usage of various types of financial devices towards a financial need, as drawn from demand-side survey data, and informed by qualitative demand-side research. As such, the needs measurement framework provides an alternative measure of retail financial services market behaviour to the traditional product market measures. It is proposed that this measure is a more realistic reflection of actual client behaviour and therefore more useful for policymakers and financial service providers to deliver politically and commercially sustainable financial inclusion initiatives and outcomes.
Unpacking usage. The financial needs measurement framework forms the underpinfor a measurement framework to betterunderstand usage: » The objective of the usage measurement
framework is to understand the scale and nature of usage to inform policies and business models tailored to financial needs. Applying the usage measurement framework also allows the efficacy of such policies and strategies to be evaluated at a more granular and relevant level than allowed by conventional uptake measures. This, in turn, will enable us to better understand, and therefore improve, the ultimate impact of financial products on the welfare of end-consumers.
» The condition is the nature and scale of the deployment of a specific financial device, considered across recency, frequency, duration and value as core metrics.
» Aggregate indicators include the current state of usage, aggregate market size, relative use of specific devices and average or median use.
» The main data sources are supply-side data for objective assessment of frequency, recency, duration and value, complemented by demand-side data to understand the mix of devices used – formal and informal – in context.
These measurement frameworks will be piloted and tested in various contexts, in cooperation with different partners.
A dedicated look at needs. To further unpack this question, i2i has developed a measurement framework around functional needs as condition to be served by financial services. Four universal financial needs are defined: transfer of value, liquidity, resilience and meeting goals. These are measured by considering uptake of different financial devices towards use cases linked to each need. Analysing different devices used to meet each need enables the building of a market perspective on the competitive forces, complements and substitutes, across product types, formal and informal, for meeting the underlying need. Thus, the objective of the financial needs measurement framework is to understand how the market for retail financial services in low-income communities works, in order to ensure sustainable and effective provision of financial services.
1 Such as proximity, eligibility and affordability

1. Introduction
Advancing Financial Inclusion
The mandate of i2i’s measurement team is to evolve the way in which we measure financial inclusion to inform market players and policymakers in their quest for impact.
The drive for greater financial inclusion is all about impact. Policymakers set objectives and design interventions to achieve those objectives, and donor programmes aim to support them in this mission. But how do they know whether they are meeting their objectives or, if not, what needs to change? The mandate of i2i’s measurement team is to evolve the way in which we measure financial inclusion to inform market players and policymakers in their quest for impact.
The first note in i2i’s measurement series, titled Introduction to measurement frameworks introduces the concept of a measurement framework and its key components, namely to define a condition that is relevant for a specific objective, and to identify indicators for measuring that condition, which can be tracked with data. The theory is the glue between the various components of the measurement framework: It says why the condition is relevant to the objective and how the indicators relate to the condition. A sound theoretical foundation is critical for the credibility of any measurement framework, as it enables the theory to be tested and adapted based on the outcomes.
This note builds on the first note to articulate i2i’s theory of how financial inclusion happens and the central role of usage (rather than mere uptake) to financial inclusion outcomes and, ultimately, impact. It then builds up a conceptual model of what constitutes usage, how it builds on access and uptake and links to impact, what purpose it serves, and what triggers or drives it. This theory
forms the basis for the development of a number of specific measurement frameworks and related indicators relating to each core component of the usage model. i2i will test the theory outlined in this note and the resultant measurement frameworks in a series of pilot research projects to be rolled out from 2017.
Recap: What is ameasurement framework?
A measurement framework combines theory and
data to describe a condition necessary to achieve an objective. It consists of an indicator or set of indicators populated by data. The theory explains why the condition is important for the objective and why the indicators are valid proxies for the condition and any changes therein.
08

2. Usage at the centre
Advancing Financial Inclusion
Our theory is based on three core hypotheses, each of which will be tested through our and others’ measurement efforts:
1. Usage is necessary forfinancial inclusion outcomes and impact.
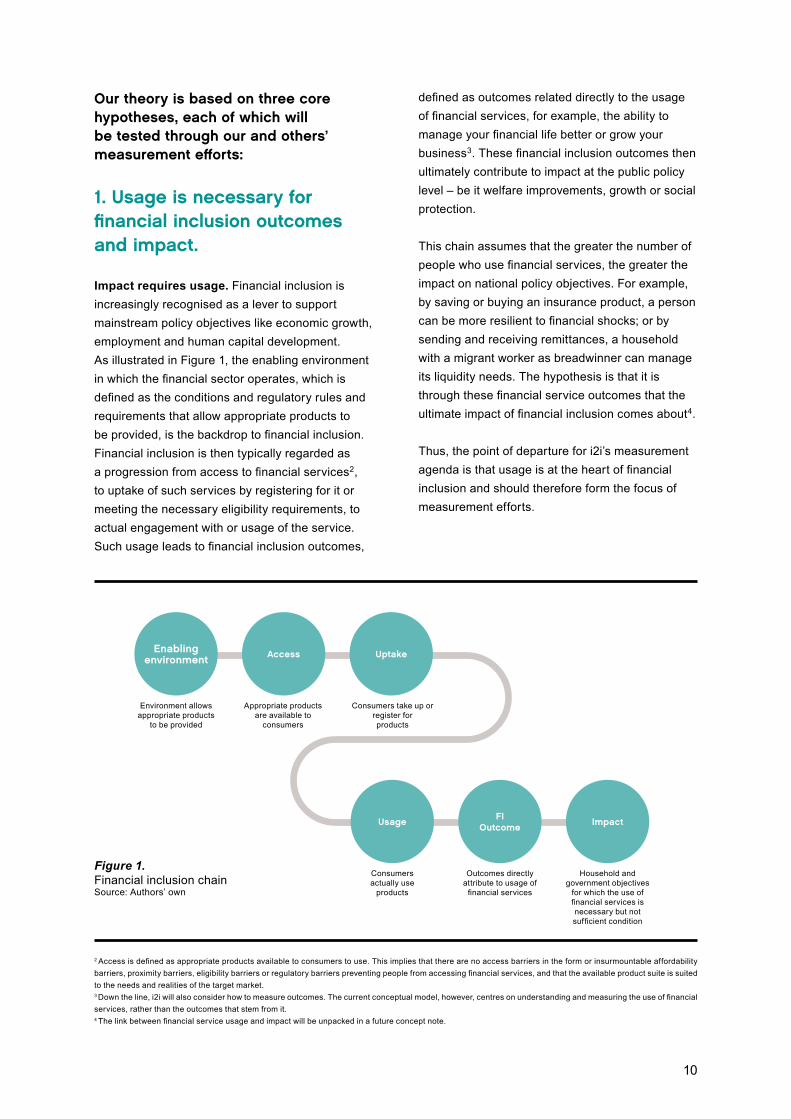
Impact requires usage. Financial inclusion is increasingly recognised as a lever to support mainstream policy objectives like economic growth, employment and human capital development. As illustrated in Figure 1, the enabling environment in which the financial sector operates, which is defined as the conditions and regulatory rules and requirements that allow appropriate products to be provided, is the backdrop to financial inclusion. Financial inclusion is then typically regarded as a progression from access to financial services2, to uptake of such services by registering for it or meeting the necessary eligibility requirements, to actual engagement with or usage of the service. Such usage leads to financial inclusion outcomes,
defined as outcomes related directly to the usage of financial services, for example, the ability to manage your financial life better or grow your business3. These financial inclusion outcomes then ultimately contribute to impact at the public policy level – be it welfare improvements, growth or social protection.
This chain assumes that the greater the number of people who use financial services, the greater the impact on national policy objectives. For example, by saving or buying an insurance product, a person can be more resilient to financial shocks; or by sending and receiving remittances, a household with a migrant worker as breadwinner can manage its liquidity needs. The hypothesis is that it is through these financial service outcomes that the ultimate impact of financial inclusion comes about4.
Thus, the point of departure for i2i’s measurement agenda is that usage is at the heart of financial inclusion and should therefore form the focus of measurement efforts.
Environment allowsappropriate products
to be provided
Enablingenvironment
Appropriate products are available to
consumers
Access
Consumers take up or register forproducts
Uptake
Consumersactually use
products
Usage
Outcomes directlyattribute to usage of
financial services
FIOutcome
Household and government objectives
for which the use of financial services is necessary but not sufficient condition
Impact
2 Access is defined as appropriate products available to consumers to use. This implies that there are no access barriers in the form or insurmountable affordability barriers, proximity barriers, eligibility barriers or regulatory barriers preventing people from accessing financial services, and that the available product suite is suited to the needs and realities of the target market.3 Down the line, i2i will also consider how to measure outcomes. The current conceptual model, however, centres on understanding and measuring the use of financial services, rather than the outcomes that stem from it.4 The link between financial service usage and impact will be unpacked in a future concept note.
10
Figure 1. Financial inclusion chainSource: Authors’ own

Setting the right targets. Most often in this discourse, ‘use’ is equated to ‘have’. And indeed, when viewed in this light, great strides are being made: Results from the global Findex survey show that the number of people worldwide with a bank account grew by 700 million between 2011 and 2014. As of November 2015, the GSMA (2015) reports that there were 411 million registered mobile money accounts globally, growing 31% in 2015 alone. As financial inclusion continues to gain prominence as a policy tool, more of this type of data is collected and tracked. For instance, the number of AFI (Alliance for Financial Inclusion) member institutions with quantified targets for financial inclusion has grown from 9 in 2011 to 81 in 2016.
However, the financial inclusion strategies developed and guided by these measurement frameworks may not be leading to the ultimate results that policymakers want to achieve. A closer look at the Findex data (in Figure 2) shows that a sizeable number of bank accounts lie dormant. And the GSMA reports that only 134 million of the 411 million mobile money accounts, equivalent to 33%, had been used even once in the last 90 days. If financial services are taken up but not used, or used to a very limited extent, many of the benefits of having the service do not materialise, and hence the linkage from financial inclusion to the ultimate public policy objective that it seeks to support breaks down. Furthermore, financial services that are taken up but not used constitute a loss centre for providers.
Regular usage is as important for providers to see benefits as it is for policymakers5. This is not to say that usage is a panacea – usage may be misplaced or inappropriate, or may not render sufficient value6. Ultimately, however, usage is a necessary (if not sufficient) condition for outcomes to ensue.
2. Consumers choosefinancial services based on their underlying needs.
The second hypothesis, which forms the basis for the concept note: Financial needs measurement framework, is that people regard financial services as a means-to-an-end, the end being the underlying financial need that financial services are deployed for7. This means that financial services may in practice be used for different purposes than what they were designed for. See Box 1 on Pg. 13 for a description of four core functions or financial needs fulfilled by financial services.
5 From a commercial provider perspective, initiation costs typically constitute a large portion of total operating costs. Therefore, high uptake but low usage of financial products is very expensive for providers. Increasing usage usually increases ARPU (average revenue per user) and helps to make the business models, particularly those targeting lower-income consumers, sustainable.6 The usage model as developed in this note is thus separate from the concept of the quality of usage. That does not mean that quality of usage is any less important. Measuring the value derived from usage and the quality of such usage are outcome variables that need to be unpacked in a dedicated measurement framework.7 This comes across strongly in the MAP demand-side research conducted in 10 countries to date as well as the various financial diaries studies (see, for example, Zollman, 2014 for the financial diaries Kenya findings). Note that even when usage is compulsory, it still serves some purpose, but that purpose may in the first instance relate to the needs of the party making the usage compulsory (e.g. the state requiring vehicle insurance, or the employer requiring that salaries be paid into a bank account), rather than primarily by the consumer’s own needs. This will be discussed further in Section 5 when we consider what triggers and drives usage.

10%
Percentage of adults with accounts at formal institutions
20% 30% 60%50%40%
Pakistan
Tanzania
Uganda
Bangladesh
Indonesia
Nigeria
India
Kenya 3% 27%
14%
17%
19% 8%
25%
7%
Malaysia 3% 22% 29%
13%
0 transactions in a typical month 3+ transactions in a typical month 1–2 transactions in a typical month
12
8%
2%
7%
4%
2%
2%
1% 5% 2%
8% 5%
16%
16% 11%
5%
Figure 2. Account activity in select countriesSource: Global Findex 2014

8 It is important to note that these needs are all phrased as financial needs, to be met by financial services, rather than as the underlying human needs (which may, for example, be the need for security, survival or self-actualisation). This means that financial needs fulfil an enablement function for ‘true’ human needs.
Box 1.Core financial needs8
Financial services fulfil four core functions or financial needs(see the concept note: Financial needs measurement framework for a more in-depth overview):
» Transfer of value: The need to transfer money or digital value from one person to another. A financial service meets this need by moving value from one person to another in a manner that is safe and creates certainty. Transferring value is a core functional need to enable people to live their economic lives, as it enables consumption, gifting and receiving of income. It is also a prerequisite for accessing savings, credit and insurance and, in some way or another, underlies each of the other core needs. Value transfer is furthermore core to the maintenance and utilisation of social capital. Value transfers take place at local, national and cross-border level and can be requited or unrequited.
» Liquidity: Liquidity refers to people’s ability to meet expenses in each income cycle. It is essential for survival and to maintain productive relationships. Financial services enable liquidity by allowing a person to accumulate a pool of resources that are available on demand, or by providing the option to borrow funds on a short-term, flexible basis.
» Resilience: Resilience entails the ability to deal with unexpected shocks that have a financial impact. Thus, this need goes beyond short-term liquidity management to the need to avoid falling into poverty or reducing living standards due to the impact of risk events. Financial services generate a safety net and certainty, either by pooling and transferring risks (insurance) or by allowing a person access to a large-enough pool of resources to draw on (through savings or credit).
» Meeting goals: The need to meet foreseeable life objectives or life stage or social obligations. These can include: developing human capital through maintaining health and education; providing security, for example for old age; taking productive risks; accumulating assets; and providing for lifecycle events such as weddings and births. These needs all require accumulating larger amounts of money than the person or household can fund from a single income cycle; hence financial services (savings, credit or payments) serve a facilitating function in meeting goals.
These needs tend to apply to most adults in any given society. However, the exact nature of the needs will vary across individuals, based on their demographic and socioeconomic context. People of all income levels need to manage their liquidity, but the practical nature of this may differ quite substantially between high and low-income individuals and based on the regulatory of their income.
For example: farmers, who receive a large income once or twice a year, will have a longer period over which to manage their liquidity than a market trader who operates on weekly budgets.
Similarly, individuals’ needs will shift and change over time based both on changes in their own lives and the macro context in which they live. As people move through different life stages, their needs will change. For example with most adults with school-going children would identify education asa priority goal that financial services can assist them to achieve, but this may not be relevant for older individuals.
14
An important upshot is that, if governments desire to influence financial behaviour for individual and public benefit, they need to understand the full spectrum of market behaviour.
3. Different financial devices (payments, savings, credit, insurance), from different types of formal and informal providers, are substitutes or complements in meeting a specific need.
The third core hypothesis, which follows from the second, is that one need may be served by different providers and products, and that formal provision is only part of the story. Thus, any measurement framework that attempts to impact financial inclusion outcomes should take account of consumers’ full financial life. An important upshot is that, if governments desire to influence financial behaviour for individual and public benefit, they need to understand the full spectrum of market behaviour. This is especially the case if the stated objective is to migrate informal activity into the formal sphere – in order to understand why formal financial services are not making progress, it is essential to measure and understand informal usage. In fact, the i2i measurement agenda is agnostic as to whether provision is formal or informal, lawful or unlawful. Rather, the purpose is to understand true market behaviour to make for sustainable policymaking and business models.See Box 2 on Pg. 15 for a description of the role of informal financial services.
Implications for measurement
The three core tenets of i2i’s theory as set out here imply that, from a policy perspective, it is essential for governments, donors and financial service providers to measure:
» the nature and patterns of their citizens’ usage of financial services;
» across the full financial usage profile, formal as well as informal; and
» that the point of departure for understanding usage patterns is an understanding of the purpose of usage, namely the needs being served and the different devices (formal and informal, and across product markets) that can be used to meet that need.
The rest of this note develops a conceptual model of what usage is, how it happens and what triggers and drives it.

Figure 3.Uptake of formal vs informal financial devices across Myanmar, Thailand, Swaziland, Lesotho, Malawi and MozambiqueSource: Various FinScope surveys
Savings
Payments
Credit
33%
33%
3%
67%
97%
97%
% of total financial devices used that are formal
% of total financial devices used that are informal
Box 2.The role of informalfinancial services
As outlined in the note, Determining our focus, existing financial inclusion measurement frameworks are mostly concerned with whether somebody is a customer of a registered financial institution. The UFA 2020 and Maya Declaration targets both track formal account ownership9. The reality, however, is that many people prefer informal financial services. One of the most striking findings across the six MAP pilot countries is that informal financial usage is much larger than formal usage. When considering total uptake of financial devices10 across the six countries, the dominance of informal financial devices is clear, as seen in Figure 3.
9 The Universal Financial Access (UFA) 2020 initiative was established during the 2015 World Bank Group-IMF Spring Meetings with the goal that, by 2020, adults who currently are not part of the formal financial system would have access to a transaction account to store money, send and receive payments as the basic building block to manage their financial lives. Through target interventions, the World Bank Group has committed to enabling one billion people access to a transaction account. So far, 30 partners have pledged to this commitment. The Maya Declaration was initiated in 2011 by the Alliance for Financial Inclusion, with AFI network members collectively adopting financial inclusion policy principles. At initiation, 80 institutions from 76 countries were members – currently, 100 institutions from 90 countries are members. See UFA 2020 and Maya Declaration for more information. 10 A financial device as defined here includes use of cash for payments. See Section 3 for a definition of the term ‘financial device’.
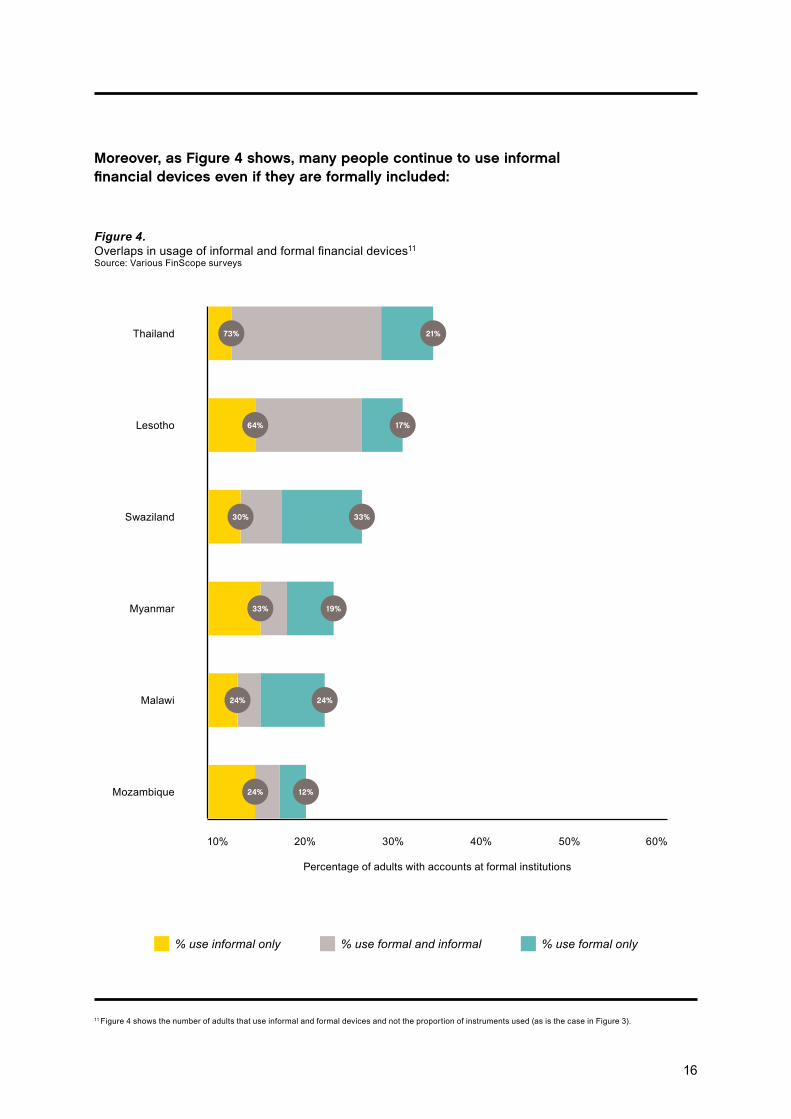
11 Figure 4 shows the number of adults that use informal and formal devices and not the proportion of instruments used (as is the case in Figure 3).
% use informal only % use formal only% use formal and informal
10%
Percentage of adults with accounts at formal institutions
20% 30% 60%50%40%
Mozambique
Malawi
Myanmar
Swaziland
Lesotho 64%
33%
24%
19%
33%
Thailand 73% 21%
17%
30%
24%
24% 12%
Figure 4. Overlaps in usage of informal and formal financial devices11 Source: Various FinScope surveys
Moreover, as Figure 4 shows, many people continue to use informal financial devices even if they are formally included:
16

3. What is usage?
Advancing Financial Inclusion
It is important to understand that uptake can be both formal, as when a mobile phone user registers as a mobile money user, and informal, as when a new member joins an existing informal savings club.
If it is usage, rather than mere uptake that matters, then what sets the two apart?
By uptake we mean:The act of meeting the requirements and/or completing the procedures that confer on a customer the right to use a financial device.
It is important to understand that uptake can be both formal (as when a mobile phone user registers as a mobile money user) and informal (as when a new member joins an existing informal savings club). It can also be once-off, as is the case with an over-the-counter (OTC) transaction, or result in an ongoing contractual relationship, for example, an account, facility, policy or membership. In the case of OTC transactions, uptake and usage occur at the same time; whereas, in the case of an account or other contractual relationship, uptake is a separate step to usage12.
By usage we mean:A person deploying a financial device to meet a specific financial need.
Two elements of this definition require further explanation:
» “A financial device.” A person (be it a natural or a legal person) can use different financial devices; and, depending on the device, differing rights and obligations are created for the parties involved. Thus, usage looks different across different devices.
» “To meet a financial need.” As discussed, financial devices are used to meet financial needs. Thus, as established in our second core hypothesis in Section 2, different devices can be substitutes for meeting the same financial need. Each need spans several use cases.
What is a use case?Use cases are the discrete purposes for which financial devices are used. Examples include being able to send
money to a relative in another part of the country, being able to pay monthly school fees, being able to purchase
enough food, being able to pay for unexpected medical expenses, or being able to save for old age. These use
cases profoundly influence the behaviour of financial markets.
18
12 OTC remittance payments require the user to first provide some information, at the very least the location and identity of the recipient. The provision of this information to the provider conveys upon the user the right to then use the payment device to send the remittance. In practice, this would all be part of a single interaction between the provider and the user.
13 Each of these verbs denote a specific meaning, each relating to the concept of value. Mostly, usage of a financial device entails the transfer of value. However, a device can accumulate value without transferring it (for example, the money in your account or under your mattress). Furthermore, a device can store value without accumulating it (for example, the cash in your pocket). Lastly, a device can also distribute value (in the case of insurance or credit) without value being accumulated in that device. The distribution of value requires the transfer of value as an underlying transaction. It is clear from these four instances that the definition of a financial device centres on the concept of value. The hypothesis is that something will only be a financial device if it can sound in money, that is, if it is fungible. In this way, a personal budget tool would not be a financial device, as it does not relate to something that can be converted into money; buying gold towards meeting a life goal, however, would be a device, as it entails a commodity that can be translated into monetary value. The Merriam-Webster definition of fungible is: “being something (such as money or a commodity) of such a nature that one part or quantity may be replaced by another equal part or quantity in paying a debt or settling an account. Oil, wheat, and lumber are fungible commodities.” (Merriam-Webster, 2017).
What is a financial device?
We define a financial device as any physical, social
or electronic mechanism that stores, accumulates,
distributes or transfers value13, and that can be
used to meet a financial need.
This definition is intentionally broad, for two
reasons. Firstly, the ingenuity of people to
meet needs is vast, hence the definition should
encompass as broad as possible a set of current
and potential devices. Secondly, this concept
should allow researchers to standardise the
tools used by people to lead their financial lives
across the formal and informal, in order to create
a measurable profile of a person’s full financial
behaviour. For example, financial devices can
include a bank account, payment instrument, formal
loan, insurance policy, or membership to a rotating
savings club or a risk-pooling group such as a burial
society or community-based health scheme.
But, savings at home (in cash, or through the
purchase of an asset, such as gold or livestock)
could also be considered a financial device, as
would be a loan from family and friends to meet
a specific financial need.
We define a financial device as any physical, social or electronic mechanism that stores, accumulates, distributes or transfers value, and that can be used to meet a financial need.

14 To clearly separate uptake from usage, we exclude from uptake any transfer of value or commitment to transfer value. In the case of cash, used either to transfer or store value, uptake could theoretically be said to occur whenever a consumer is in possession of a sum of cash. The ownership of physical cash notes and coins conveys upon the bearer the right to use it. Usage would occur when this cash is deployed to meet a specific financial need.15 Actions that do not involve value that can be translated into physical money or electronic value, fall beyond the definition of usage of financial services, although they can of course eventually lead to the usage of financial services. Note that, in the case of insurance, the physical transfer of value may occur at a predetermined future date after usage has started. The one exception would be maintenance or administrative activity, for example, when a person checks their account balance, compares insurance quotes to reassess their existing cover, or maintains membership of a cooperative without taking out a loan from the cooperative.
See the Financial needs measurement framework
concept note for a taxonomy of financial devices
and use cases as backbone for our proposed
measurement frameworks.
A person, therefore, takes up a device when he/she
fulfils the requirements or completes the procedures
to be able to use that device, for example, by
opening a bank account or joining an informal
Rotating Savings and Loan Association (ROSCA).
When uptake has taken place, the person has been
conferred the right to use the financial device, but
has not necessarily started to use the device14.
For usage, an action is needed that involves
monetary value15, such as depositing funds into
a bank account or making a cash contribution to
a ROSCA.
This definition denotes the realm of activity that
can be considered usage. Within this conceptual
realm, there can be many different manifestations
of usage, depending on who the user is (natural or
legal person; individual or group), the nature of the
usage action (such as voluntary or compulsory),
what financial device is used, towards which use
case, and across what time dimension.
Implications for measurement
As usage is a multifaceted concept, it is not easily
measurable in a single headline indicator like
uptake would be.
Rather, fully understanding usage requires granular
measurement of different indicators across a
number of devices. The framework for determining
the specific usage indicators to be measured
and the data required to do so are unpacked in
a separate concept note: Usage measurement
framework. The point of departure is to consider
different financial devices used for different use
cases and then to track the nature, intensity and
patterns of usage for each relevant device, as
illustrated in Figure 5.
20
Financialneed 1
Usecase 2
Financialneed 2
Usecase 3
Financialneed 3
Usecase 1
Financialneed 1
FrequencyNumber of interactions and intervals
RecencyRecency of interactions
DurationLength of time of use
Monetary valueThe amount involved
Figure 5. Conceptual approach to measuring usageSource: Authors’ own

4. The usage model
Advancing Financial Inclusion

What prompts a person to ‘trial’ a financial service? And once they have seen what it is like, what causes them to keep up such usage, taper it off, or switch to an alternative device?
Various constructs and frameworks can help answer this question:
» Several publications in the financial inclusion literature describe financial inclusion and its outcomes16. Amongst others, a number of randomised control trials (RCTs) have been done to test specific determinants of usage and the outcomes thereof, for example, the causality between one aspect of product design and usage17. These RCTs are based on very narrow research questions.
» Basic neoclassical economic theory assumes that individuals are rational economic agents who will make decisions to optimise net value (value derived minus cost). However, this is not always the case. The elements included in the usage model developed in this section are based on the underlying assumption that individuals make rational decisions within their context. This draws on the concept of ecological rationality.
» Ecological rationality is a theory to understand human decision-making. It holds that seemingly sub-optimal decisions are due to heuristics, namely the mental shortcuts applied in actual human thought processes18. So, people deal with complexity by making decision inferences based on the information in their environment19. In other words, people make rational decisions within their context, given all the information available to them and their preferences. Seemingly ‘irrational’ decision-making occurs due to imperfect information on the part of the decision-maker or an incomplete understanding of the decision-maker’s preferences by the observer.
» In the marketing literature, retail theory is used extensively to track customer behaviour. To date, these theories have found little application in the financial inclusion debate20.
» Behavioural economics is increasingly used to explain behaviour. A number of such frameworks can be applied to financial device usage21.
In this section, we draw on these various literatures to map the consumer’s usage decision-making process. Understanding the decision-making process, in turn, explains why a certain mix of devices is used towards a use case and which devices are substitutes and complements towards the same use case. This ‘use case market’ perspective is critical to inform financial inclusion policy interventions.
22
16 Sources consulted include the client centricity research in financial inclusion conducted by CGAP and others, financial health research by the Center for Financial Services Innovation, the work of the Center for Financial Inclusion, and the Financial Diaries Research rolled out in a number of countries.17 Studies considered are listed in Appendix A: Financial Inclusion impact studies. 18 Goldstein, D and Gigerenzer, G, 2002.19 Todd, et al, 2010.20 See for example Chuah, S (2013a and 2013b); Delichte, J. (2016); Erta, K., et al. (2013); Guarav, S, et al (2010); Kahneman, D. (2002); MCord, M. (2014).21 See, for example, dual process theory (Evans & Stonavich, 2013) and MINDSPACE theory (Dolan, 2010).

Figure 6 indicates i2i’s conceptual model of the interim stages in the consumer’s journey from uptake to sustained use and the factors that influence the consumer’s decisions along the way:
Uptake or first use triggers
Usage drivers
Figure 6. Usage conceptual modelSource: Authors’ own
Use case Uptake First trial
or use
Switch to alternative device or revert to prior default
Ongoing use of the device over time
After some time, value breaks down,prompting a switch
After some time, use case falls awayand usage ceases
Defection
Sustaineduse
No use
Negative (perceived) relative value
Positive (perceived) relative value
Use casefalls away
01
02
03

Weighing up alternatives. This usage model applies to usage of a particular device and therefore indicates usage decisions relative to alternative devices that the consumer has access to.
Access is assumed. The usage model intentionally does not deal with access barriers. As introduced in Section 2, access is a necessary but not sufficient condition for uptake or trial use to take place. This means that, though a person must first have access to a device before he or she can take it up or use it, access does not always translate into uptake or usage. Access, itself, has a number of well-documented drivers that are often phrased in terms of barriers to be overcome before access is established. As mentioned in the note: Determining our focus, there are a number of existing measurement initiatives that focus on access. The focus of our usage model is therefore on what comes after access in order to inform policymakers and financial service providers who wish to convert access into uptake andactive usage22.
Use case as starting point. The usage model originates from a particular use case as the reason for usage. Use cases change over time as people’s lifestyle, stage and choices change. This will impact the mix of devices used by a person at different points in time23. The default way in which people meet any use case in the absence of third-party financial service provision is by living their financial life in cash and drawing on reciprocal relationships in the community. When new devices become available or a new use case arises, they will either persist with their current patterns or take up and start using a new device.
Uptake as stepping stone. For some devices, like accounts, uptake (in this case opening the account) may happen without the device (yet) being used.
For other devices, like over-the-counter payments, uptake goes hand-in-hand with usage24. Thus, two paths are indicated on the diagram for the progression from use case to trial use: one indicates uptake separately, and one goes straight to trial use.
Uptake or trial use triggers. Something will prompt a person to adopt financial services, be it to take it up or to start using it for the first time. Triggers are defined as any specific event, circumstance, initiative or personal encouragement that prompts the initial uptake and use of a given financial device in order to overcome switching costs and the status quo bias. Triggers are differentiated from drivers in that their effect reduces over time and they are therefore unlikely, by themselves, to drive ongoing usage.
The fork in the road. After trying out the device, one of three paths will be followed: » Sustained use. The first usage path is that a
person may continue to use that device. » Defection. A person may stop using the device
in favour of switching to another device or may revert back to his or her prior default.
» No use. Alternatively, the use case may fall away over time, meaning that usage will cease. For example, once there are no longer any school-going children in a family, that family will no longer have the need to deploy a financial device to pay school fees.
Usage may break down at various points in time. In both instances – defection and discontinued use – the breakdown in usage may either happen soon after first or trial use or, as indicated by the dashed arrows in the diagram, may occur after some period of sustained usage.
24
22 A number of access factors, such as the fees and charges impacting affordability of using a device, the costs of meeting the eligibility requirements to take up a device and the travel and opportunity cost relating to the proximity of the user to channels for interacting with the device, still enter the usage framework, but not as absolute access barriers. Rather, they are functional cost elements that impact on perceived relative value. These factors will be considered further in Section 5.23 Changes in an individual’s lifestyle, such as a change of job, or progression through the traditional lifecycle may disrupt current habits and give rise to a need to use a financial service, or change an existing need. For example, if a main income earner in the household needs to move far away to secure an income, the household may for the first time need a remittance service. Furthermore, people sometimes make deliberate life-changing decisions, such as planning to start their own business, which may trigger financial service needs. 24 The case of a money transfer explains the concept: even though you may still have to fulfill some eligibility requirements to make a money transfer (so uptake is still technically a separate step to usage), no account relationship is established that can exist without usage as would be the case for a bank account. To take up the money transfer service is to use it. The same would hold for a loan or an insurance policy. The act of taking it up necessarily implies usage.

This usage model applies to usage of a particular device and therefore indicates usage decisions relative to alternative devices that the consumer has access to.
25 The extent to which needs are met, and how well.
Dormancy as result. Both defection and the cessation of a use case can lead to dormancy (in the case of a device that entails an underlying, contractual relationship). Dormancy means that the uptake relationship is maintained, but that usage activity is suspended. Alternatively, the account or relationship may be terminated altogether. Where termination takes place, uptake requirements would again need to be fulfilled, should the person wish to start using the device again. Thus, dormancy is a result rather than a standalone outcome, and measuring dormancy is only meaningful if one also measures or understands the underlying reasons for dormancy.
Various drivers of use or defection. A person will decide whether to continue to use the particular financial device or defect to another based on whether it provides them positive relative value versus alternative devices that could fulfil the same use case – formal and informal, across different product and provider types. Positive relative value, in turn, depends on the functional benefits derived25 versus the costs incurred, as well as on a range of drivers that do not relate to the function fulfilled by the financial device, but rather to the person’s ingrained preferences and tendencies, their personal characteristics, or the social or external environment in which they operate. Note that the drivers identified in this note can also serve as triggers of uptake or trial use. Unlike triggers, of which the effect erodes over time, they then also determine whether a consumer continues to use a device after the initial trial.

Compulsion or auto-enrolment impacts across the framework. The model outlined above is a decision-making model. This assumes volition. However, people may also be compelled by law and/or contract to take up and use financial devices in a certain way. Involuntary uptake or usage can arise in two ways:
» Due to compulsion: Compulsion means that a person knowingly takes up and uses a device, but does not have the power to decide whether or not to do so. Examples include: an employer requiring employees to have a bank account into which salary payments are made or to belong to a pension fund; government requiring all vehicle owners to take out third-party vehicle insurance; or a credit provider requiring a borrower to take out credit insurance or to have a transaction account from which installments are debited.
» As a result of auto-enrolment: Auto-enrolment means that a person is automatically signed up for a financial device or is the recipient or beneficiary of such a device without necessarily taking any action themselves to take up the device or, in some instances, without even knowing that uptake has taken place. In this instance, the action is taken by a third party on behalf of the ultimate beneficiary. Examples include: insurance cover included as a loyalty benefit for all bank account or mobile money account users; or insurance purchased by the state on behalf of a group of citizens as a social protection mechanism.
Thus, compulsion or auto-enrolment can override the other triggers and drivers by: (1) imposing uptake, (2) acting as a trial use trigger, plus(3) leading to some form of ongoing use (such as a person receiving and then withdrawing monthly social security payments). Whether the usage triggers or drivers are voluntary or not is likely to impact the nature of the usage and the value derived from it. In measuring the nature and patterns of usage, it would be important to consider the effect of different forms of compulsion and to compare trends and behaviour across voluntary and auto-enrolled or compulsory clients.
26

5. Drivers of usage
Advancing Financial Inclusion

This section outlines the triggers and drivers of usage, introduced above, in more detail.
5.1 Trial use triggers
Trying it out. Trial use is split out from sustained use, as the decision to use a financial device for the first time or over an initial trial period is a fundamentally different decision from that of using it on a sustained basis26. People already have at least one financial device that can be used to both transfer and store value – cash. Many already use informal alternatives to formal devices. To switch to an alternative incorporates switching costs, both monetary and psychological. Inertia in decision-making is a much-studied behavioural heuristic. People tend to remain at the status quo due to the transaction costs involved, even when these are relatively small (Madrian & Shea, 2001). Additionally, consumers are not fully aware of the benefits (and costs) of using a device until they actually use it. Therefore, a specific event, circumstance, initiative or personal encouragement is often required to trigger the initial adoption of the digital account alternative (Ott, 2010).
Triggers relate either to the supply-side or to the consumers themselves. Trial use can be triggered by a number of factors. From our reading of the marketing literature, we identify two trigger categories: those related to the supply of financial services and those directly related to the consumer and their environment and circumstances27.
Supply-related triggers include advertising, promotions and trials that prompt a person to start using a financial device, once-off changes to the supply-side offering that attract consumers’ attention, or the expansion of service or the presence of the service provider close to the prospective customer. Increasing the proximity of access points may lead to the adoption of the device by reducing access costs. Consumer-related triggers can be either circumstantial or related to procrastination:
» Circumstantial triggers include social dynamics and social events, such as the impact of word-of-mouth in the community28, the so-called messenger effect29 whereby the standing of the person who introduces somebody to a device matters for adoption, or cultural views and norms. There may also be once-off events in an individual’s social network that trigger usage. Examples include: the death of a relative; changes in the social circle (such as when friends emigrate or if an individual joins to a new church or community group); a wedding; amongst others.
» Procrastination refers to instances where a person’s usual behaviour gives rise to a situation that prompts usage. For example, FinMark Trust (2016), cite the example of consumers that used mobile payments for the first time to pay for their television subscription or electricity because they had wanted to access the service after hours and had not paid their bill during working hours in the usual way using cash. This then prompted them to adopt mobile or online payment options. The procrastination around paying the bill in the habitual way was the trigger for trial use of the digital payment alternative.
28
26 In practice, trial use may relate to the first few times a consumer uses a device as it may require multiple use experiences to fully understand the product’s costs and benefits.27 Trial use, or ‘adoption’ in marketing terms, has been much studied from various angles. This note does not attempt to be comprehensive in discussing the multitude of factors that can affect decisions. Instead, it aims to summarise what we consider to be the most relevant triggers for the adoption of financial services. For further reading, consider Noel (2009). 28 The marketing literature distinguishes between organic, or naturally occurring, word-of-mouth and amplified word-of-mouth, or word-of-mouth marketing. In this instance, we refer to the former.29 This effect, along with many others, has been extensively studied in the literature. See Kelley (1967), Duncan et al. (1968), Webb and Sheeran (2006) and Cialdini (2007).

Once a consumer has used a financial device, they have a more complete view of the device’s value and cost. The effect of initial triggers therefore erodes as they are able to make a more informed decision about whether the device provides them with greater value at lower cost than the alternatives.
30 Sustained usage can be regarded in terms of frequency (whether usage is recurring and how often transactions are made), in terms of value (such as whether there is a balance in an account), and in terms of duration (e.g. for how long the person remains an account holder, policy holder or group member).31 The net value construct as referred to here is thus a device-based construct and not a quality construct. The current framework does not measure value as an outcome.
Balancing out the pros and cons. Perceived value, rather than actual value, drives decisions. Simply put, consumers must implicitly weigh up whether the perceived benefits of the device exceed the perceived costs of using it, that is, whether they derive net value31. Even if they do not explicitly make the sums, the assumption of ecological rationality means that there will be some implicit assessment of whether usage is ‘worthwhile’. If the perceived value outweighs the perceived costs, then the consumers will make regular use of the product. If the perceived costs exceed the perceived value, the customers will revert to an alternative. In addition to the notion of net value, ecological rationality means that a range of factors related to the person’s preferences, external context and social context will play a role in the usage decision. For the purpose of this framework, the various factors impacting on the decision whether to continue to use a financial device or not are split between functional drivers on the one hand and behavioural and contextual drivers on the other hand.
5.2 Drivers of usage
Continuing to use it. Once the trial use of a product or service has been triggered, the decision to continue using it30 is determined by whether the user believes that they derive positive value from that product relative to alternatives. Importantly, ‘value’ refers to more than just monetary value, and the costs that are offset extend beyond fees, charges and other monetisable costs.
Note again that the drivers as defined in this framework can also influence trial use, but we treat them separately because their influence on usage is not once-off. Triggers, on the other hand, are those factors that initially prompted a consumer to use a device, but have limited impact on their decision to continue using the device thereafter.
5.2.1 Functional drivers
Functional drivers of the usage decision refer to the extent to which the financial device meets a financial need, balanced against the fees, charges and other actual costs associated with using the specific financial service (all intrinsically valued against the person’s informal and social network alternatives).
Use cases represent functional value. As discussed, a particular use case related to one of four financial service needs will form the initial purpose for uptake or usage. How well the device used meets the use case compared to alternatives will then also be a driver of continued or discontinued use. Functional value refers to the value derived when the product is able to perform its functional, utilitarian or physical purpose – that is, when it fulfils the particular use case. For example, a core driver of informal usage may be that it meets functional needs at lower cost than formal alternatives. Further functional value elements to take into account include satisfaction with service levels and convenience. The measurement of financial devices deployed towards various use cases is unpacked in a dedicated concept note titled Needs measurement framework.
Explicit and implicit costs. On the negative side of the functional equation are various costs that people explicitly or implicitly account for. Functional costs include all those factors that impose a monetary cost on the consumer to access, use or interact with the financial product. This includes fees and charges but also costs in meeting uptake (eligibility) requirements, such as the need to provide photos or to obtain proof of identity and meeting minimum account balance requirements.
Furthermore, functional costs extend to opportunity cost such as the value of a consumer’s time to access, use or interact with a financial product. Traditionally, financial service costs are measured as the fees, charges, premiums or interest levied by financial service providers. However, once transaction and opportunity costs are also taken into account, the pricing of the service can be but a small element of the total actual and perceived costs faced by consumers32. Box 3 illustrates the importance of measurement of total cost, also beyond fees and charges. The various functional cost elements and the indicators to measurewill be unpacked in a separate concept note: Cost measurement framework.
30
32 Peachey and Arora (2016), similarly discuss that cost goes beyond the direct costs of using a financial service. They distinguish between “the measurable financial cost that will be charged for the service” and “the monetisable economic costs they [consumers] incur when complying with regulatory and other requirements for accessing and then using the service on offer, which are often hidden and equally often higher than measurable financial cost.” Together, these constitute the scope of functional costs. Peachey and Arora (2016), also identify a third social / psychological cost. We have chosen to incorporate these costs as part of the trial use triggers (the cost of switching from something that you know and trust) and the contextual drivers as outlined in Section 5.2.2.

Box 3.Total cost is more than fees and charges – the case of bank accounts in Malawi
Figure 7 illustrates the different components of total functional cost based on an analysis of the total cost of accessing a bank account conducted as part of MAP Malawi (Thom, et al., 2015). It shows that the true cost of using a bank account is many multiples higher than the fees charged.
Opportunity cost = Average trip to a bank takes half a day(FinScope, 2015)
Travel cost = Average two trips monthlyusing public transport(FinScope, 2015)
Basic account cost = Monthly fee + two ATM withdrawels+ one deposit on a basic savings account(FinScope, 2015)
Figure 7.Measuring total monthly cost of basic bank account in Malawi (USD)Source: Thom et al., 2015
True cost of using a bank account
Bank fees (12%)
% of average income
$0.65
$3.84
15%
2%
$1.07
Cost to access bank (88%)
Increased infrastructure reduces totalbanking cost
Higher bank fees incentivises greater roll-out of ATMs

32
33 Note that this classification will be tested and evolved further through the i2i’s measurement agenda over the next few years and as additional published research comes to our attention.34 People also make use of heuristics (mental shortcuts) and are prone to biases in their decision-making. To make a decision, you must process large amounts of complex, interrelated and incomplete information. Humans have, therefore evolved to use ‘shortcuts’ to make decisions efficiently, referred to as heuristics. This is what leads to the departure from the traditional rationality assumption (Goldstein, D and Gigerenzer, G; 2002).35 The implications for financial service usage are well-established: products with a long delay until the benefit arises, such as insurance and long-term savings, may be valued less, while credit, which brings forward the benefit, may be valued more.36 Consumer studies have revealed that people tend to dislike losing something twice as much as they like gaining it (Kahneman, D and Tversky, A; 1992).
5.2.2 Behavioural andcontextual drivers
Behavioural and contextual drivers refer to any factors that do not relate to the function delivered by financial services but that are intrinsic to the decision-maker and the immediate context in which the decision takes place. These drivers are typically subjective in nature and may relate to the consumer’s experience of the service. For example, a person may be less inclined to take a loan in a society that scorns debt and may be inclined to join a savings group rather than make use of a savings account in a society that functions collectively rather than individually. Similarly, a person’s intrinsic view of risk, the extent to which they feel ‘overloaded’ in their decision-making capacity, negative past experiences or word-of-mouth about different financial devices may all impact usage, as may their marital status, the size and nature of the household, their education or their income and source of livelihood, to name but a few factors.
Classifying the drivers. Marketing and behavioural economics literature has helped to draw up a framework for making sense of the range of behavioural and contextual drivers of financial service usage. They can be classified into two broad categories: internal and contextual factors.33
» Internal factors. The internal factors are inherent personal influences that affect the decision made by consumers. These relate to the internal or cognitive decision-making process, even though they may be influenced by the external context. Consumers knowingly or unknowingly base their decisions on their perceptions, feelings, emotions, personality traits and moods in making decisions.34
They furthermore exhibit a number of biases that cause them to deviate from rational decisions and/or apply mental shortcuts or ‘heuristics’. A common bias, for example, is the tendency to prefer a smaller immediate reward over a large future reward, called hyperbolic discounting.35 Or, when overloaded or under pressure, a person may simply not have the mental capacity to make a rational decision or adequately weigh up all options (referred to as decision fatigue). This may cause them to take mental shortcuts (heuristics), for example adapting their expectations based on past experience rather than on the merits of the case at hand. Many people furthermore exhibit loss aversion.36 This has strong implications for uptake of financial services and switching between alternative financial services. For consumers to switch between services, the alternative should offer a significantly larger value.
» Contextual factors. Decisions are also influenced by factors external to the cognitive decision-making process. Three levels are identified:
1. Personal characteristics are specific to the individual. It includes demographic descriptors such as gender, education, age, marital status, parental status or role within the household, as well as socioeconomic features such as income, wealth, the frequency and regularity of income and the source of income or livelihood. Furthermore, it encompasses factors such as financial capability, health status, religion and even habits – all of which can shape financial service usage decisions.
2. Social context refers to the influence of interacting with other people and the natural desire for individuals to conform to norms and standards that exist within their communities or to enjoy status. The nature of societal functioning – be it collective or individualistic, or a linear or cyclical time orientation – is also an important determinant of which financial services are used, from which providers and in what way.
3. External context. The external context refers to the impact of the external environment or context in which a person functions on their decisions. This includes the phenomenon of priming or anchoring, whereby an association is activated in memory just before a person makes a decision, and that memory then conditions the decision. The external context may also relate to the experience a consumer has when interacting with a service. For example, a study among farmers in India showed that consumers that are intimidated or feel inferior based on their interaction with a provider are far less likely to use the product (World Bank, 2015). Furthermore, the macroeconomic context and political economy or ruling ideological milieu will also condition decision-making. For example, in Brazil it was found that the experience of hyperinflation leading up the Real Plan in 1994 still shaped people’s willingness to buy insurance almost two decades down the line (Bester et al, 2010).
Trust as a composite driver. Trust in financial services, which may differ for different types of devices or providers, is often quoted as a salient driver of usage decisions. In the framework as outlined above, trust is not an inherent driver as such, but rather the outcome or composite of a number of experiences and drivers across the functional, behavioural and contextual categories, including: » Perceptions of functional efficiency. » Perceptions of the appropriateness of the service and provider to the user’s needs. » Satisfaction with the service offering. » Intrinsic heuristics and biases such as a belief that certain services “are not for me” or certain providers “are
out to get me”. » Social drivers, for example, when there is a culture of mistrust in formal providers, when the messenger effect
shapes trust, or when word-of-mouth regarding experience by others in the community impacts trust. » External environment drivers, for example, when recent economic experiences, such as bankruptcy of a large
financial institution, undermine trust.
Trust in financial services, which may differ for different types of devices or providers, is often quoted as a salient driver of usage decisions.

34
Figure 8. Illustration of levels of internal and contextual drivers of decision-makingSource: Authors’ own
Figure 8 illustrates the different behavioural and contextual drivers of decision-making.
Personal characteristics
Social context
External context
Internal factors » Mood or affect » Intetemporal » Expectations » Bias and heuristics
6. Implications for measurement
Advancing Financial Inclusion
This note sets out a conceptual model of what constitutes usage and how consumers make the decision to start, continue or stop using a particular financial device as the theoretical backbone for the measurement work at i2i.
This conceptual model forms the basis for three core measurement frameworks, each of which is developed in a dedicated measurement framework concept note:
1. Gauging headline financial inclusion in terms of the number or proportion of adults reached, as well as the extent to which they are served across a portfolio of devices.
2. Determining the extent to which different financial devices meet various financial service use cases, and unpacking the financial needs that form the purpose of financial service usage.
3. Measuring the core dimensions of actual usage across devices towards various use cases.
36
The next round of measurement framework concept notes will unpack the triggers and drivers of trial, sustained or discontinued use: in terms of functional value and cost, on the one hand, and behavioural and contextual drivers on the other hand37. It will also consider the outcomes of usage.
Each concept note will define the measurement objectives and research question or hypothesis to be answered, and will list indicators to track for the specific measurement framework. These measurement frameworks will then be applied, tested and refined38 in in-country pilot projects, working with governments, financial service providers and those who measure the impact of financial inclusion interventions, and drawing on various demand-side and supply-side data sources. To this end, i2i’s data and measurement teams will work hand-in-hand to improve not only the measurement frameworks, but also the quality of the data available, and to design bespoke survey modules to inform the usage model.
37 Some of the triggers and drivers identified may be directly measurable. Others may not be directly measurable, but will still be relevant to note as exogenous factors when designing policy interventions to increase usage.38 Where the theory is shown to be flawed or incorrect, measurement frameworks that rely on that aspect of the theory must either be adapted or be discarded if shown to be inappropriate.
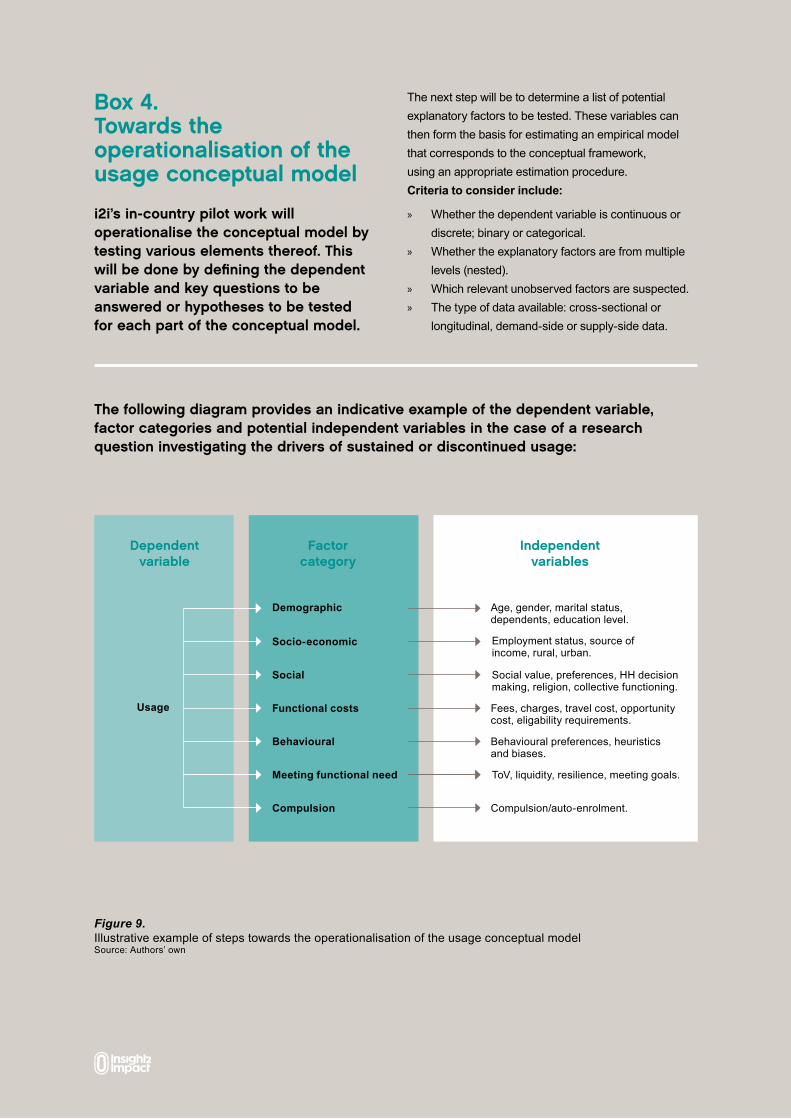
Box 4.Towards the operationalisation of the usage conceptual model
i2i’s in-country pilot work will operationalise the conceptual model by testing various elements thereof. This will be done by defining the dependent variable and key questions to be answered or hypotheses to be tested for each part of the conceptual model.
The following diagram provides an indicative example of the dependent variable, factor categories and potential independent variables in the case of a research question investigating the drivers of sustained or discontinued usage:
The next step will be to determine a list of potential explanatory factors to be tested. These variables can then form the basis for estimating an empirical model that corresponds to the conceptual framework,using an appropriate estimation procedure.Criteria to consider include:
» Whether the dependent variable is continuous or discrete; binary or categorical.
» Whether the explanatory factors are from multiple levels (nested).
» Which relevant unobserved factors are suspected. » The type of data available: cross-sectional or
longitudinal, demand-side or supply-side data.
Figure 9.Illustrative example of steps towards the operationalisation of the usage conceptual modelSource: Authors’ own
Dependentvariable
Factorcategory
Independentvariables
Usage
Demographic Age, gender, marital status,dependents, education level.
Employment status, source ofincome, rural, urban.
Social value, preferences, HH decision making, religion, collective functioning.
Fees, charges, travel cost, opportunity cost, eligability requirements.
Behavioural preferences, heuristics and biases.
ToV, liquidity, resilience, meeting goals.
Compulsion/auto-enrolment.
Socio-economic
Social
Functional costs
Behavioural
Meeting functional need
Compulsion
38
Collectively, these measurement frameworks will allow usage patterns to be tracked and the effectiveness of interventions aimed at enhancing usage to be tested so as to inform policy and market strategy.
The aim is to use these measurement frameworks to change the way in which we measure financial inclusion in order to:
These measurement frameworks will be created as a public good that others can also adopt. They can also be used to locate the work done in specific experiments such as randomised control trials in a broader conceptual framework. This is an ambitious agenda,but one that, once tested, has the scope to make a significant contribution to the financial inclusion field.
» Redefine how we view markets and market dynamics in the financial inclusion sphere, based on how customers make decisions.
» Consider all financial devices that are substitutes and complements in each financial need market, including those informal devices that are not typically visible to policymakers and financial service providers; in order to:
1. set more relevant targets39; and, in so doing,
2. impact government policies, provider business models and donor interventions.
39 For example, it may not be appropriate to target usage for the entire population if the socioeconomic circumstances mean that a certain proportion will not be viable clients. Then it may be more realistic to set a target pertaining to specific sub-samples of the population. Furthermore, targets will not be set at the uptake level, but rather at a more granular usage level, depending on the use cases and devices in question.
Allen, F., Carletti, E., Cull, R., Senbet, L. and Valenzuela, P., 2014. The African financial development and financial inclusion gaps. Journal of African economies, 23(5), pp.614-642.
Allen, F., Demirgüç-Kunt, A., Klapper, L.F. and Martinez Peria, M.S., 2012. The foundations of financial inclusion: Understanding ownership and use of formal accounts. The World Bank.Available online from http://elibrary.worldbank.org/doi/abs/10.1596/1813-9450-6290
Ang, J.B., 2010. Finance and inequality: the case of India. Southern economic journal, 76(3), pp.738-761.
Ardic, O.P., Heimann, M. and Mylenko, N., 2011. Access to financial services and the financial inclusion agenda around the world: a cross-country analysis with a new data set. The World Bank.Available online from https://ideas.repec.org/p/wbk/wbrwps/5537.html
Chakravarty, S.R. and Pal, R., 2013. Financial inclusion in India: An axiomatic approach. Journal of Policy Modeling, 35(5), pp.813-837.
Chowa, G.A., Masa, R.D., Wretman, C.J. and Ansong, D., 2013. The impact of household possessions on youth’s academic achievement in the Ghana Youthsave experiment: A propensity score analysis. Economics of Education Review, 33, pp.69-81.
Chowdhury, M.J.A., Ghosh, D. and Wright, R.E., 2005. The impact of micro-credit on poverty: evidence from Bangladesh. Progress in Development studies, 5(4), pp.298-309.
Duflo, E., Banerjee, A., Glennerster, R. and Kinnan, C.G., 2013. The miracle of microfinance? Evidence from a randomized evaluation (No. w18950). National Bureau of Economic Research. Available online from http://www.nber.org/papers/w18950
Dupas, P. and Robinson, J., 2013. Savings constraints and microenterprise development: Evidence from a field experiment in Kenya. American Economic Journal: Applied Economics, 5(1), pp.163-192.
Friedline, T., 2012. Predicting children’s savings: The role of parents’ savings for transferring financial advantage and opportunities for financial inclusion. Children and Youth Services Review, 34(1), pp.144-154.
Honohan, P and King, M, (2012). Cause and effect of financial access: cross-country evidence from the finscope surveys. Trinity College Dublin. Available online from http://www.tcd.ie/Economics/staff/phonohan/Honohan%20King%20Mar%209.pdf
IPA, (2007). Savings Accounts for Rural Micro Entrepreneurs in Kenya. Innovations for Poverty Action.Available online from http://www.poverty-action.org/study/savings-accounts-rural-micro-entrepreneurs-kenya
IPA, (2008). Sensitivity to Interest Rates and Account Ownership Requirements for a Commitment Savings Account in the Philippines. Innovations for Poverty Action. Available online from http://www.poverty-action.org/study/sensitivity-interest-rates-and-account-ownership-requirements-commitment-savings-account
IPA, (2009). Saving for Health Expenditures in Kenya. Innovations for Poverty Action.Available online from http://www.poverty-action.org/study/saving-health-expenditures-kenya
IPA, (2010a). Evidence from a Randomized Evaluation: The Miracle of Microfinance? Innovations for Poverty Action.Available online from http://www.poverty-action.org/study/miracle-microfinance-evidence-randomized-evaluation
IPA, (2010b). Reducing Barriers to Saving in Malawi. Innovations for Poverty Action.Available online from http://www.poverty-action.org/study/impact-microcredit-philippines
IPA, (2012a). Enhancing the Productive Assets of Microentrepreneurs in Ghana. Innovations for Poverty Action.Available online from http://www.poverty-action.org/study/enhancing-productive-assets-microentrepreneurs-ghana
IPA, (2012b). Microcredit for Women in Mexico. Innovations for Poverty Action.Available online from http://www.poverty-action.org/study/microcredit-women-mexico
IPA, (2012c). Price Fluctuations and Supply Chain Credit to Cocoa Farmers in Sierra Leone. Innovations for Poverty Action. Available online from http://www.poverty-action.org/study/price-fluctuations-and-supply-chain-credit-cocoa-farmers-sierra-leone
IPA, (2012d). The Impact of Microcredit in the Philippines. Innovations for Poverty Action.Available online from http://www.poverty-action.org/study/impact-microcredit-philippines.
IPA, (2015a). Enhancing the Productive Assets of Microentrepreneurs in Ghana. Innovations for Poverty Action. Available online from http://www.poverty-action.org/study/enhancing-productive-assets-microentrepreneurs-ghana
IPA, (2015b). Where Credit is Due. Innovations for Poverty Action.Available online from https://www.povertyactionlab.org/sites/default/files/publications/where-credit-is-due.pdf
Appendix 1: Financial inclusion impact studies

40
Kaboski, J.P. and Townsend, R.M., 2005. Policies and Impact: An Analysis of Village-Level Microfinance Institutions.Journal of the European economic Association, 3(1), pp.1-50.
Kpodar, K. and Andrianaivo, M., 2011. ICT, financial inclusion, and growth evidence from African countries. IMF Working Paper. Available online from http://www.imf.org/external/pubs/ft/wp/2011/wp1173.pdf
Kumar, N., 2013. Financial inclusion and its determinants: evidence from India. Journal of Financial Economic Policy, 5(1), pp.4-19.
Larivière, B. and Van den Poel, D., 2004. Investigating the role of product features in preventing customer churn, by using survival analysis and choice modeling: The case of financial services. Expert Systems with Applications, 27(2), pp.277-285.
Mohan, R., 2006. Economic growth, financial deepening, and financial inclusion. Reserve Bank of India Bulletin.Available online from http://www.bis.org/review/r061121e.pdf
Rojas-Suarez, L and Amado, MA, Understanding Latin America’s Financial Inclusion Gap. Centre for Global Development. Available online from https://www.cgdev.org/sites/default/files/latin-american-financial-inclusion-gap.pdf
Roodman, D. and Morduch, J., 2009. The impact of microcredit on the poor in Bangladesh: Revisiting the evidence. Centre for Global Development. Available online from: https://www.cgdev.org/publication/impact-microcredit-poor-bangladesh-revisiting-evidence-working-paper-174-june-2013
Shaw, A. and Romero, J.M., 2011. Do Formal Savings Feed Food Security? Evidence from a Matched Pair, Cluster-Randomized Encouragement Trial in Rural Malawi. Iris Centre, University of Maryland.Available online from http://www.fsassessment.umd.edu/publications/pdfs/iris-food-security-bill-melinda-gates-foundation.pdf
Swamy, V., 2014. Financial inclusion, gender dimension, and economic impact on poor households. World development, 56, pp.1-15.
AFI Global. (2016). Maya Declaration. Commitments You Can Bank On. http://www.afi-global.org/maya-declaration
Aglionby, J., 2016. Fintech takes off in Africa as lenders tap into mobile technology. Financial Times, 17 May
Bester, H., Chamberlain, D. & Hougaard, C., 2010. Microinsurance in Brazil: towards a strategy for market development. Country diagnostic report prepared for Funenseg and CNSeg. Available at: www.cenfri.org
Byun, J., 2015. Zoona: A Case Study on Third Party Innovation in Digital Finance, s.l.: FSD Zambia
C3IT, 2016. Software as a Service: Why Should I care About the Cloud?, s.l.: s.n.
Cate, F. H., Cullen, P. & Mayer-Schonberger, V., 2014. Data Protection Principles for the 21st Century, s.l.: Oxford Internet Institute
Cenfri, 2016. Making Access Possible (MAP) Zimbabwe: Financial Inclusion Country Report, Cape Town: The Centre for Financial Regulation.
Cenfri: Finmark Trust; UNCDF. (2014-2016). Making Access Possible (MAP) Financial Inclusion Country Reports [Botswana, Lesotho, Malawi, Mozambique, Myanmar, Nepal, Swaziland, Thailand, Zambia, Zimbabwe].http://www.uncdf.org/en/map: UNCDF
Center for Financial Services Innovation (CFSI), 2016. Eight Ways to Measure Financial Health.Available at: http://cfsinnovation.org/research/eight-ways-to-measure-financial-health/
Chan, G. & Faz, X., 2015. The potential of digital data: How far can it advance financial inclusion? , s.l.: CGAP.
Chuah, S. (2013a). Behavioural Economics and the Financial Services Consumer. Financial Services Research Forum. Research note.
Cialdini (2007) Influence: The psychology of persuasion. New York: HarperBusiness, Revised Edition.
Bibliography
The list below expands beyond sources directly quoted in this document, to also reflect background readings that helped shape the thinking presented in the usage conceptual framework:
Collins, D., Morduch, J., Rutherford, S. & Ruthven, O., 2009. Portfolios of the poor: How the world’s poor live on $2 day. Princeton: Princeton University Press
Constine, J., 2014. Facebook Hits 100 Million Users in Africa, Half the Continent’s Internet-Connected Population, s.l.: Tech Crunch.
Cook, T. & Mckay, C., 2015. How M-Shwari works: the story so far, s.l.: CGAP and FSD Kenya.
Cook, T. & McKay, C., 2015. Top 10 things to know about M-Shwari. [Online] Available at: www.cgap.org
Costa, A., Deb, A. & Kubzansky, M., 2015. Big Data, Small Credit: The digital revolution and its impact on emerging market consumers, s.l.: Omidyar Network.
Crowley, A., 2015. Microcredit Brief: South Africa’s Jumo launches microcredit borrower assessment technoogy based on mobile phone usage data, s.l.: MicroCapital.
Dalberg, 2016. Financial Health as a Global Framework. Stakeholder Convening Presentation. Washington D.C, October 2016. Delichte, J. (2016). Irrationality in Microinsurance. The 12th International Microinsurance Conference: Sri Lanka.
Davis, T., 2013. Open Data Barometer: 2013 Global Report, s.l.: Open Data Institute and World Wide Web Foundation.
Dolan, Paul, Hallsworth, Michael, Halpern, David, King, Dominic and Vlaev, Ivo (2010) MINDSPACE: influencing behaviour for public policy. Institute of Government, London, UK.
Duncan, Haller and Portes (1968) Peer influences on aspirations: A reinterpretation. American Journal of Sociology 74(2):119 - 37.
Entrepreneurial Finance Lab, 2016. EFL’s Official Website, s.l.: s.n.
Erta, K, Hunt, S, Iscenko, & Brambley, Z (2013). Applying behavioural economics at the Financial Conduct Authority. FCA Occasional Paper No.1.
Evans, Jonathan St BT, and Keith E. Stanovich. “Dual-process theories of higher cognition: Advancing the debate.” Perspectives on psychological science 8.3 (2013): 223-241.
Facebook, 2014. Connecting 100 Million People in Africa, s.l.: Facebook for Business .
Far, X. & Chan, G., 2016. The Open Data Index. [Online] Available at: http://global.census.okfn.org/ [Accessed July 2016].
Financial Inclusion Insights , 2015. Value added financial services in Kenya: M-Shwari, s.l.: InterMedia Corporation .
Finmark Trust. (2016). Why use accounts? Understanding account usage through a consumer lens. Johannesburg: Finamark Trust, prepared by Eighty20.
Gantz, J. & Reinsel, D., 2010. The Digital Universe Decade - Are You ready?, s.l.: International Data Corporation.
Goldstein, D., & Gigerenzer, G. (2002). Models of Ecological Rationality: The Recognition Heuristic. Psychological Review, Vol. 109, No. 1, 75-90.
Groenfeldt, T., 2015. Lenddo Creates Credit Scores Using Social Media. Digitalist Magazine, 5 February .
GSMA, 2015. State of Industry: Mobile money. [Online] Available at: http://www.gsma.com/mobilefordevelopment/wp-content/uploads/2016/04/SOTIR_2015.pdf [Accessed 12 July 2016].
GSMA, 2015. The Mobile Economy: Sub-Sharan Africa, s.l.: GSMA.
GSMA. (2016). 2015 State of the Industry Report: Mobile Money.http://www.gsma.com/mobilefordevelopment/wp-content/uploads/2016/04/SOTIR_2015.pdf
Guarav, S, Cole,S & Tobacman, J. Marketing Complex Financial Products in Emerging Markets: Evidence from Rainfall Insurance in India.
IBM, 2016. IBM. [Online] Available at: https://www-01.ibm.com/software/data/bigdata/what-is-big-data.html [Accessed 12 July 2016].
IDC, 2014. The Digital Universe of Opportunities: Rich Data and the Increasing Value of the Internet of Things, s.l.: International Data Corporation.
Internet World Stats, 2015. Africa Internt Users November 2015, s.l.: Internet World Stats.

42
Jamal, F., Luft, J., Shakhovskoy, M. & Wallace, S., 2016. The Rise of the Data Scientist: How big data and data science are changing smallholder finance, s.l.: The Initiative for Smallholder Finance.
Kahneman, D. (2002). Map of Bounded Rationality: A Perspective on Intuitive Judgment.
Kahneman, D. & Tversky, A. (1992). Advances in prospect theory: Cumulative representation of uncertainty. Journal of Risk and Uncertainty. 5 (4): 297–323. doi:10.1007/BF00122574.
Kelley (1967) Attribution theory in social psychology. Lincoln: University of Nebraska Press. In Lewis (2007), p.59.
Kelly, H., 2012. Lenddo Uses Social Networks to Give Loans and Improve Credit, s.l.: Venture Beat .
Leganza, G. & Angel, N., 2016. What You Need to Go From Data-Rich to Insights-Driven: Becoming Customer-Obsessed Requires People, Process, Technology, and Data Changes, s.l.: Forrester .
Macmillan, R., 2016. Digital Financial Services: Regulating for Financial Inclusion, s.l.: ICT.
Madrian & Shea, 2001. The Power of Suggestion: Inertia in 401(k) Participation and Savings Behavior.Available at https://academic.oup.com/qje/article-abstract/116/4/1149/1903159/The-Power-of-Suggestion-Inertia-in-401-k
McKay, C., 2015. Emerging Applications of Data Analytics: The case of M-Shwari. s.l., CGAP.
MCord, M. (2014). Does Information Overload Affect Uptake of Financial Services? CGAP.
Merriam-Webster. (2017, February). Retrieved from Merriam-Webter: https://www.merriam-webster.com/dictionary/fungible
Musarirwa, T., 2016. Econet Not Suprised by the $105.2 Million Revenue Decline. Techno Mag.
Noel, H. (2009). Basics Marketing 01: Consumer Behaviour. AVA Publishing SA
Norton Rose Fulbright, 2014. Global Data Privacy Directory, s.l.: Norton Rose Fulbright .
Ott, A. (2010). The ‘8Ps’ of Buying Triggers.Available online: http://www.marketingprofs.com/articles/2010/3953/the-8ps-of-buying-triggers
Out-law.com, 2016. Open APIs for UK Banking: It’s Happening, People, s.l.: The Register.
Peachey, S. & Arora, S., 2016. Customers at the Center: Cost to Customers Framework. Washington D.C.: CGAP.
Pelto, T., 2013. Is Social Media Impacting Your Credit?, s.l.: Quicken Loans.
Raj, V., 2015. Financial Inclusion Trends and Innovators-2015, s.l.: The Centre for Financial Inclusion & Accion.
Social Lender, 2016. How Social Lender Works, s.l.: Social Lender.
Todd, P., & Wilke, A. (2010). Past and present environments: The evolution of decision making. Psicothema, Vol. 22, No. 1, 4-8.
TransUnion & Versta Research, 2015. The State of Alternative Data: Benchmark survey of 300+ lenders reveals insights into the adoption and competitve impact of alterntive data, s.l.: TransUnion.
Webb and Sheeran (2006) Does changing behavioral intentions engender behavior change? A meta-analysis of the experimental evidence. Psychological Bulletin 13: 249 – 268.
World Bank, 2015. Private Credit Bureau Coverage in Sub-Saharan Africa, s.l.: Trading Economics.
World Bank. (2016). UFA2020 Overview: Universal Financial Access by 2020. http://www.worldbank.org/en/topic/financialinclusion/brief/achieving-universal-financial-access-by-2020.
Zollman, J. & Sandford, C., 2016. A Buck Short. What financial diaries tell us about building financial services that matter for low-income women. Boston: Bankable Frontier Associates.
Zollman, J., 2014. Kenya Financial Diaries. Shilingi kwa Shilingi. The financial lives of the poor. Available at: http://fsdkenya.org/publication/kenya-financial-diaries-shilingi-kwa-shilingi-the-financial-lives-of-the-poor/

Advancing Financial Inclusion
How to find usGet involved. Contact us.
Mari-Lise du PreezT: +27 021 913 9510E: [email protected]
Celina LeeT: +27 021 913 9510E: [email protected]
i2ifacility.org
@i2ifacility /insight2impact /insight2impact /i2ifacility
Established by:
Sponsored by: