financial risk exposures of the airlines … · 222. financial risk exposures of the airlines...
TRANSCRIPT

International Journal of Business and Society, Vol. 17 No. 2, 2016, 221-244
FINANCIAL RISK EXPOSURES OF THE AIRLINES INDUSTRY: EVIDENCE FROM CATHAY PACIFIC
AIRWAYS AND CHINA AIRLINES
Yasmin-Yashodha♣ Sunway University
Baharom Abdul Hamid INCEIF University
Muzafar Shah Habibullah Universiti Putra Malaysia
ABSTRACT
This study explores the long run and dynamic relationships between the stock price of Cathay Pacific Airways and China Airlines against key determinants of financial risks exposure confronting the airline industry, which include interest-rate, exchange rate and fuel price risk exposures for the period of January 1996 to December 2011. The (Johansen & Juselius, 1990) cointegration technique was employed to detect any long time trending relationship followed Vector Error Correction Model (VECM) and Vector Auto-Regression (VAR). The generalised forecast error variance decomposition and the generalised impulse response function were employed to comprehend the effects of theses financial risk exposures. Our empirical results suggest that exchange rate movements have a substantial impact, compared to the fuel price and interest rate exposures against the stock price of the analysed airline. Our findings play a pertinent role in the determination of the respective airlines foreign vulnerability and financial policies which would be helpful for industry players and policy makers from a financial stability perspective.
Keywords: Airline; Stock Price; VECM; VAR; IRF.
1. INTRODUCTION
The airline industry faces substantial financial risks exposure that affects the vulnerability of stock returns which arises from changing economic conditions, volatile fuel price movements and fluctuations in exchange rates. These exposures are attributed to the cyclical demand, strong price competition, high gearing levels, capital investment,
♣Corresponding Author: Sunway University, No. 1 Jalan Universiti, Bandar Sunway, 46150 Petaling Jaya, Selangor, Malaysia. Email: [email protected]

222 Financial Risk Exposures of the Airlines Industry: Evidence from Cathay Pacific Airways and China Airlines
fixed costs of labour and equipment and regulatory impediments such as ownership restrictions and landing rights. Consequently, managing these exposures is critical to the future progress of the aviation industry. Cathay Pacific Airlines and China Airlines have succumbed to major challenges of high fuel prices, weakening revenues and economic uncertainties, evidenced by the thriving growth of low cost carriers within the region, the negative impact on the economy class yields and its cargo business for both the carriers.
Despite the expected decline in profitability attributed by the global financial crisis, increase in fuel costs, slower demand and one-off gains in 2010, Cathay Pacific Airlines remained relatively resilient with an annual profit of USD710 million in 2011, compared to its gains of USD1.8 billion in 2010. This invariably strengthens the balance sheet of Hong Kong’s home carrier which will enable addition of new fleets and an array of product improvements, as the carrier seeks to plant its position as a leading legacy carrier amidst the increasing competition from its peers. In 2011, China Airlines' operating loss was NT$1,564 million (operating margin –1.2%), a decrease of NT$16,329 million over 2010. Net loss reached NT$1,954 million (net margin - 1.5%), an increase loss of NT$12,576 million over 2010. The poor performance of the carrier was attributed by high oil prices, the murky economic outlook in the aviation industry, the passenger demand that is plagued with uncertainty and the slowed cargo growth due to weakening international trade flows (CAPA, 2013).
This paper explores the long run and dynamic relationship between the stock price of two dominant airlines in East Asia against the three key determinants of financial risks exposure confronting the airline industry, which include interest-rate, exchange rate and fuel price risk exposures. The period observed includes (January 1996 – December 2011) and four segregated sub-periods (January 1996 – December 1999), (January 2000 – December 2003), (January 2004 – December 2007) and (January 2008 – December 2011). The (January 1996 – December 1999) sub-period represents the Asian Financial Crisis, (January 2000 – December 2003) represents the dot-com bubble and energy crisis, (January 2004 – December 2007) represents the tranquil period and (January 2008 to December 2011) represents the global financial crisis.
Additionally, the study observes the significance of the financial risk exposures during the selected sub-periods and a comparative analysis is provided for these two airlines. The vulnerability of stock prices to unanticipated shifts in financial risk exposure variables in short, medium and long terms is assessed using the generalized impulse response function and the generalized forecast error variance decomposition function. This empirical study is organised as follows. Section 2 provides the literature review and the contributions to existing knowledge on the respective research issues. Section 3 describes the secondary data and the econometric methodology implemented for this research. Section 4 reports the empirical findings and provides policy implications of the

Yasmin-Yashodha, Baharom Abdul Hamid and Muzafar Shah Habibullah 223
current study and Section 5 presents the concluding remarks and makes recommendations for further research in this area.
2. LITERATURE REVIEW Despite the pertinent changes that have transpired over the last decade in the aviation industry, most of the literature on the airline industry have been focusing on operational performance, value drivers of the aviation industry, air transport liberalization, service quality, behavioural intentions and the external environment (Assaf & Josiassen, 2011; Hooper, 2005; Saha & Theingi, 2009). The following literature highlights theoretical models that have examined the effect of exchange rate, fuel price and interest rate exposure on stock price. 2.1. Stock price and exchange rate exposure Preceding empirical literature on foreign exchange exposures have focused on developed markets such as United States and major European stock markets (Bodnar & Wong, 2000; Choi & Prasad, 1995; Jorion, 1990). Specific literature have indicated that the exchange rate exposure is significant based on the sectoral returns (Ibrahim, 2008) but indicates no long-run relationship between stock price and changes in exchange rate (Nieh & Lee, 2002; Zhao, 2010). The empirical evidence on the impact of exchange rates is not conclusive and these results have often excluded the airline industry as part of the research. The theoretical arguments of (Froot, Scharfstein, & Stein, 1993) conform appropriately to the investment climate in the airline industry, which indicates that the firm’s investments opportunities are valuable. 2.2. Stock price and fuel exposure The relationship between fuel price and stock prices varies across economies. The effects of oil price changes on sub-sector indices (such as wood, paper and printing, insurance and electricity) on the Istanbul Stock Exchange were positively significant for the period April 2000 – November 2011(Eryiğit, 2009). With respect to the U.S. aviation industry, evidence suggested that airlines stock returns were negatively correlated to percentage change in jet fuel prices and jet fuel hedging is positively related to airline firm value (Carter, Rogers, & Simkins, 2004). This is consistent with (Loudon, 2004), who suggested Qantas and Air New Zealand were negatively exposed to fuel price risk in the short term. Due to the limited literature pertaining to the effect of jet fuel to stock price, this research area could be further explored.

224 Financial Risk Exposures of the Airlines Industry: Evidence from Cathay Pacific Airways and China Airlines
2.3. Stock price and interest rate exposure Several empirical studies have examined that stock prices are expected to decrease (increase), as a decline in interest rates leads to an increase in the present value of future dividends and have also argued that interest rates are pertinent determinants of stock prices (Hashemzadeh & Taylor, 1988; Modigliani & Cohn, 1979). Apergis and Eleftheriou (2002) found a negative correlation between stock prices in Greece and nominal interest rates over the period 1988 – 1999. Bartram (2002) emphasized the impact of interest rates on general economic conditions and the progression of the business cycle, with its consequential effort on consumer demand. Due to the limited literature pertaining to the effect of interest rates on stock returns of the airline industry, this research area could be further examined.
3. METHODOLOGY AND DATA The monthly stock price data of the respective airlines and the monthly data of the Jet Kerosene-FOB Singapore U$/BBL were culled from the Datastream database, and the monthly real effective exchange rate data was derived from the financial statistics of Banks of International Settlements (BIS) with the indices' base year of 2010. The monthly lending rates data were gathered from the monthly issues of International Financial Statistics (IFS) published by International Monetary Fund (IMF) database. The estimation consists of 192 observations for each of the airlines from 1 January 1996 to December 2011 and 48 observations from each segregated period. The data are logged and in first differences for all regressions of this study. All categories of data and all stock returns are measured in US dollars and covers the period January 1996 to December 2011. The monthly jet fuel data employed for this research was the Jet Kerosene-FOB Singapore U$/BBL as it serves as the industry benchmark across the Asian region and the jet kerosene assessments are based on the standard commercial aviation quality, i.e. Defstan 91 – 91. The lending rate of the respective countries is amongst the most widely used benchmark and primary tool to influence interest rates and the economy. As the major proportion of airline debt financing is long-term, measures of long-term interest rate are examined using the respective lending rates of the countries of interest. To examine movements in exchange rates, a trade weighted index, the Real Effective Exchange Rate (REER) was implemented for this research. In Asian economies, by adjusting real exchange rates for inflation, a more accurate measure of Purchasing Power Parity (PPP) can be obtained. 3.1. Unit Root Tests For this research, three traditional unit-root test techniques, ADF (Dickey & Fuller, 1981), PP (Phillips & Perron, 1988) and NP (Ng & Perron, 2001) are employed. The

Yasmin-Yashodha, Baharom Abdul Hamid and Muzafar Shah Habibullah 225
null hypothesis of ADF, PP and NP are I(1). The appropriate models selected for the level and first difference are based on the decision procedures suggested by (Dolado, Jenkinson, & Sosvilla‐Rivero, 1990). The results for all tests indicate that all the stock market returns, fuel price data, exchange rate data and interest rate data (in log form) are statistically significant at the 1%, 5% and 10% level of significance. This concludes that the series are I(1) i.e. integrated of the same order for all variables and periods of study and able to proceed to the cointegration analysis of these variables. Due to word constraints, the results of these tests are not documented, but are available upon request.
3.2. Johansen’s Cointegration Test
Testing for cointegration is undertaken by the Johansen procedure (Johansen, 1988; Johansen & Juselius, 1990), a maximum likelihood method to multivariate autoregressive models. This approach would estimate and test the number of cointegrating relationships and common stochastic trends among the components of a vector zt of non-stationary variables, incorporating varied long-run and short-run dynamics. By defining a vector zt of n potentially endogenous variables, the data generating process can be specified as an unrestricted vector autoregression (VAR) involving up to k-lags of z:
zt = A1zt-1 + A2zt-2 + ... + Akzt-2 + ut (1)
where zt is a (n x1) matrix, each of Ai is a (n x n) matrix of parameters and ut represents other externalities. Equation (1) can be reformulated into a vector error correction (VECM) form:
k−1i =1∆zt = ∑ Γi∆zt-i + Πzt-k + ut (2)
where Γi = −(I – A1 − …− Ai ), (i=1,.., k – 1), Γi are interim multipliers, and Π = − (I – A1 −…− Ak). The consideration of the rank of Π is related to the testing for cointegration, which encompasses finding the number of r linearly independent columns in Π (cointegrating vectors). The test statistics that are used for the hypothesis of the existence of r cointegrating vectors are the ‘trace test’ and the ‘maximum eigenvalue’ test. The ‘trace test’ is the long run test statistic for the hypothesis that is at the most r distinct cointegrating vectors against a general alternative. Additionally, the ‘maximum eigenvalue’ test is used to compare the null hypothesis of r cointegrating vectors against the alternative of (r + 1) cointegrating vectors.
In this empirical study, the relationships between the stock price of the dominant airlines in the East Asian region against the three key determinants of financial risks exposure, which include interest-rate, currency and fuel price risk exposures, are estimated from the following regression:

226 Financial Risk Exposures of the Airlines Industry: Evidence from Cathay Pacific Airways and China Airlines
SPt = a + bEXt + cINTt + dFUELt + μt (3)
By considering the cointegrated factors that determine the relationship of the stock price of the individual airlines against fuel price, exchange rate and interest exposure, the VECM specification in Equation (3), can take the following forms:
m1
∆SPt = α1 + �β1i∆SPt-i + �β2i∆EXt-i +m2
i=0
�β3i∆INTt-i +m3
i=0
m4
�β4i∆FUELt-i + γECMt-1 + u1t (4)
m1
∆EXt = α1+ �β1i∆EXt-i + �β2i∆SPt-i +m2
i=0
�β3i∆INTt-i +m3
i=0
m4
�β4i∆FUELt-i + γECMt-1 + u1t (5)
m1
∆INTt = α1 + �β1i∆INTt-i + �β2i∆EXt-i +m2
i=0
�β3i∆SPt-i +m3
i=0�β4i∆FUELt-i + γECMt-1 + u1t (6)
∆FUELt = α1 + �β1i∆SPt-i + m1
i=1
�β2i∆EXt-i + m2
i=0
�β3i∆INTt-i + m3
i=0
m4
�β4i∆SPt-i + γECMt-1 + u1t i=0
(7)
To explore the long-run relationship between the stock price of the individual airlines against the innovation in fuel price, exchange rate and interest rate exposures, the above regression is extended by incorporating a dynamic correlation model of returns, the vector error correction model (VECM). The VECM would depict the feedback process of deviations adjusting towards long-run equilibrium, and reveal the mechanism which ties cointegrated series collectively based on ‘Granger causality’ (Granger, 1988). Short-run deviations from the long-run equilibrium will depict the changes in the dependent variable, to force the movement towards the long-run equilibrium.
By employing this model in this research, the novelty of this technique is illustrated by testing the financial risk exposures that are elusive with respect to the causal direction and implications on the stock price in the aviation industry. Additionally, this multivariate formulation of vector error-correction modelling is appropriate for this research paper, as it involves several variables that have been used in mainstream macroeconomic analysis to test for the causal chains implied by the major paradigms in macroeconomic theory (Masih & Masih, 1996a; Masih & Masih, 1996b). Where no cointegrating relationship is found through the Johansen cointegration test, the vector autoregressive (VAR) approach is employed to provide insights on the dynamic linkages and interaction between the individual airlines stock price and the respective independent variables for the sub-periods analysed in the study. This model has the ability to capture the dynamic relationships amongst the independent variables of interest against the individual stock price of the respective airlines.
i=1
i=1 i=0
i=1 i=0
m4
i=0

Yasmin-Yashodha, Baharom Abdul Hamid and Muzafar Shah Habibullah 227
The employed VAR model will have three stationary variables, i.e. the first log differences of exchange rate, fuel price and interest rates. The vector autoregression is expressed in the following form:
yt = � βjyt−j + utj = 1
(8)
In the above equation, variable y is a n vector of endogenous variables and βj is a n x n matrix of regression coefficients to be estimated. The error term u, is assumed to be independent and identically distributed with a zero mean and a constant variance. Additionally, the selection of the appropriate lag length, p, is equally pertinent to minimize the standard errors on the estimated coefficients and to adequately capture the dynamic properties of the data. The chosen model should also have no serial correlation in the residuals.
As estimated coefficients from VAR models appear to be lacking in statistical significance due to the inaccuracy of the technique in estimating standard errors, impulse response functions and variance decomposition analysis are used in this research paper to illustrate the dynamic effects of the shocks on the endogenous variables. This is consistent with (Lee & Pesaran, 1993; Lee, Pesaran, & Pierse, 1992; Pesaran, Pierse, & Lee, 1993) that supported the rationale, whereby information from application of these tools would provide enhanced evidence on the patterns of linkages and reactions of the stock price against the exchange rate, fuel price and interest rate shocks that are evident in the aviation industry.
4. EMPIRICAL RESULTS AND ANALYSIS
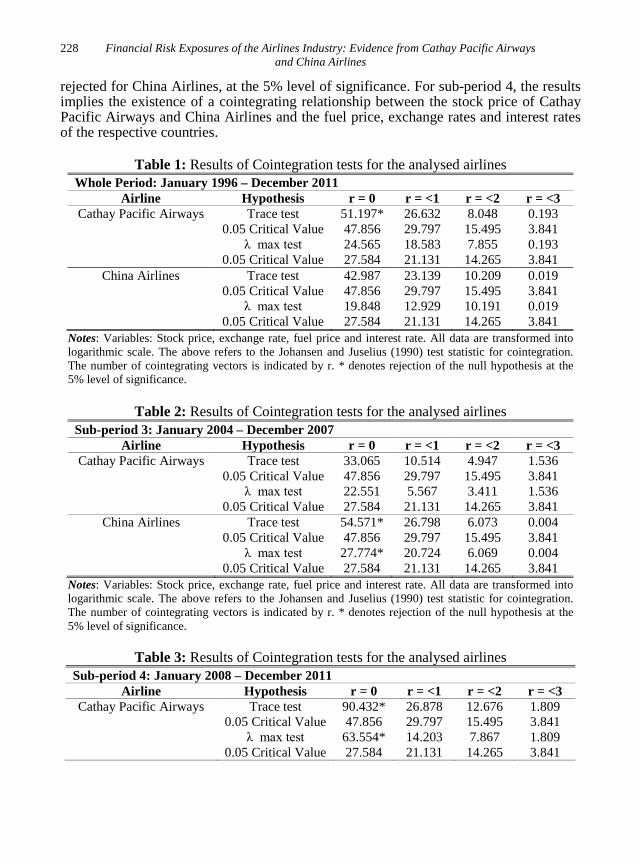
To determine the existence or absence of a long-run relationship between the individual airlines stock prices against the three key determinants, namely exchange rate, fuel price and interest rate exposures, the Johansen cointegration tests is considered for all variables. As the Johansen’s tests are known to be sensitive to the lag selection, the optimal lag length was selected based on the Akaike Information Criterion (AIC). These criteria indicate that a two-lag VAR is appropriate for the employed framework. The results of the cointegration tests are reported in Tables 1 – 3, which highlights evidence of cointegrated relationship between the stock price and its respective determinants for specific airlines and in specific periods of study. For the entire period analysed, as the statistical evidence on the cointegration relationship is evident between the individual stock price of Cathay Pacific Airways and its three key financial risk exposures, the long-run parameters of this model can be examined. For sub-period 1 and 2, the statistical evidence on the cointegration relationship was not evident between the individual stock price of the analysed airlines and its three key financial risk exposures. Due to word constraints, the results of these tests are not documented, but are available upon request. With respect to sub-period 3, the null hypothesis of no cointegration is
p
228 Financial Risk Exposures of the Airlines Industry: Evidence from Cathay Pacific Airways and China Airlines
rejected for China Airlines, at the 5% level of significance. For sub-period 4, the results implies the existence of a cointegrating relationship between the stock price of Cathay Pacific Airways and China Airlines and the fuel price, exchange rates and interest rates of the respective countries.
Table 1: Results of Cointegration tests for the analysed airlines Whole Period: January 1996 – December 2011
Airline Hypothesis r = 0 r = <1 r = <2 r = <3 Cathay Pacific Airways Trace test 51.197* 26.632 8.048 0.193
0.05 Critical Value 47.856 29.797 15.495 3.841 λ max test 24.565 18.583 7.855 0.193
0.05 Critical Value 27.584 21.131 14.265 3.841 China Airlines Trace test 42.987 23.139 10.209 0.019
0.05 Critical Value 47.856 29.797 15.495 3.841 λ max test 19.848 12.929 10.191 0.019
0.05 Critical Value 27.584 21.131 14.265 3.841 Notes: Variables: Stock price, exchange rate, fuel price and interest rate. All data are transformed into logarithmic scale. The above refers to the Johansen and Juselius (1990) test statistic for cointegration. The number of cointegrating vectors is indicated by r. * denotes rejection of the null hypothesis at the 5% level of significance.
Table 2: Results of Cointegration tests for the analysed airlines Sub-period 3: January 2004 – December 2007
Airline Hypothesis r = 0 r = <1 r = <2 r = <3 Cathay Pacific Airways Trace test 33.065 10.514 4.947 1.536
0.05 Critical Value 47.856 29.797 15.495 3.841 λ max test 22.551 5.567 3.411 1.536
0.05 Critical Value 27.584 21.131 14.265 3.841 China Airlines Trace test 54.571* 26.798 6.073 0.004
0.05 Critical Value 47.856 29.797 15.495 3.841 λ max test 27.774* 20.724 6.069 0.004
0.05 Critical Value 27.584 21.131 14.265 3.841 Notes: Variables: Stock price, exchange rate, fuel price and interest rate. All data are transformed into logarithmic scale. The above refers to the Johansen and Juselius (1990) test statistic for cointegration. The number of cointegrating vectors is indicated by r. * denotes rejection of the null hypothesis at the 5% level of significance.
Table 3: Results of Cointegration tests for the analysed airlines Sub-period 4: January 2008 – December 2011
Airline Hypothesis r = 0 r = <1 r = <2 r = <3 Cathay Pacific Airways Trace test 90.432* 26.878 12.676 1.809
0.05 Critical Value 47.856 29.797 15.495 3.841 λ max test 63.554* 14.203 7.867 1.809
0.05 Critical Value 27.584 21.131 14.265 3.841

Yasmin-Yashodha, Baharom Abdul Hamid and Muzafar Shah Habibullah 229
Table 3: Results of Cointegration tests for the analysed airlines (con’t) Sub-period 4: January 2008 – December 2011
Airline Hypothesis r = 0 r = <1 r = <2 r = <3 China Airlines Trace test 65.334* 25.890 11.958 0.290
0.05 Critical Value 47.856 29.797 15.495 3.841 λ max test 39.444* 13.932 6.668 0.290
0.05 Critical Value 27.584 21.131 14.265 3.841 Notes: Variables: Stock price, exchange rate, fuel price and interest rate. All data are transformed into logarithmic scale. The above refers to the Johansen and Juselius (1990) test statistic for cointegration. The number of cointegrating vectors is indicated by r. * denotes rejection of the null hypothesis at the 5% level of significance.
For the entire period analysed, the results in Table 4 implies that there is a significant long-run relationship between exchange rate and the individual stock price of Cathay Pacific Airways. As the ECT is positive for Cathay Pacific Airways and significant, the fuel price exposures are granger causing the individual stock price of the respective airlines. With respect to the short-run dynamic relationships of these airlines (Table 5), it is evident that fluctuations in exchange rates affect the changes in movements for the stock price of Cathay Pacific Airways and its sensitive to interest rate exposures, i.e. changes in lending rates have a significant effect in the short-run on the stock price of this airline.
Table 4: (VEC) model - Long-run relationship between the analysed stock price and the respective financial risk exposures faced by the aviation industry in the region
Whole Period: January 1996 – December 2011 Equation Cathay Pacific Airways Constant 50.747
LStock (-1) 1.000 LExchange(-1) 8.891***
(2.280) LFuel(-1) 2.421***
(0.500) LInterest(-1) -0.363
(0.741) Notes: All data are transformed into logarithmic scale. ***, ** and * denotes significance at 1%, 5% and 10% respectively. The lag order was selected by Schwarz Bayesian Criterion. Standard errors are indicated in the parentheses.
Table 5: (VEC) model – Short-run effects/changes between the analysed stock price and the respective financial risk exposures faced by the aviation industry in the region.
Whole Period: January 1996 – December 2011
Equation Cathay Pacific Airways ∆Stock
ECT,t-1 0.0125 (0.016)
α -0.001

230 Financial Risk Exposures of the Airlines Industry: Evidence from Cathay Pacific Airways and China Airlines
Table 5: (VEC) model – Short-run effects/changes between the analysed stock price and the respective financial risk exposures faced by the aviation industry in the region (con’t)
Whole Period: January 1996 – December 2011
Equation Cathay Pacific Airways ∆Stock (0.008)
∆stockt-1 -0.003 (0.081)
∆stockt-2 -0.010 (0.080)
∆exchanget-1 -1.3933** (0.603)
∆exchanget-2 0.184 (0.623)
∆fuelt-1 -0.024 (0.081)
∆fuelt-2 -0.012 (0.080)
∆interestt-1 0.787*** (0.318)
∆interestt-2 -0.554* (0.316)
R-squared 0.069 Adj. R-squared 0.022
F-statistic 1.465 Notes: All data are transformed into logarithmic scale. ***, ** and * denotes significance at 1%, 5% and 10% respectively. The lag order was selected by Schwarz Bayesian Criterion. Standard errors are indicated in the parentheses.
During the entire period of study, the results in Table 6 indicate that fluctuations in fuel price have a relatively negative significant effect and fluctuations in exchange rates affect the changes in movements for the individual stock price of China Airlines, in the short-run. During sub-period 1 (refer to Table 7), fluctuations in fuel price only affected the stock price of China Airlines. Interest rate exposures had a relatively negative significant effect on the individual stock price of Cathay Pacific Airways and China Airlines. During sub-period 2 (refer to Table 8), Cathay Pacific Airways were sensitive to interest rate exposures, i.e. changes in lending rates have a significant effect in the short-run on the individual stock price of these airlines. With respect to sub-period 3 (refer to Table 9), interest rate exposures had a relatively negative significant effect on the individual stock price of China Airlines. As for sub-period 4, (refer to Table 10), dynamic relationships were significantly evident between the fluctuations in exchange rates and the individual stock price of Cathay Pacific Airways.
From the above VAR results, the minimal implication of jet fuel price, on the respective stock prices are likely attributed to the changes in global risk perceptions that influences the dynamics of these information transmission mechanisms. The

Yasmin-Yashodha, Baharom Abdul Hamid and Muzafar Shah Habibullah 231
impact of risk perception on oil prices implies the growing uncertainty over the economic recovery, particularly during sub-period 1 and sub-period 4 causes the fluctuations in fuel price and invariably limits the global energy demand. Additionally, in the airlines industry, examining the causality between stock price and exchange rate movements is relatively pertinent as the industry is inclined to be exposed to institutional changes such as market liberalization and financial crises. The possible interpretation for the above results could be attributed to the co-movement effect between exchange rates and stock prices, which are generally driven by international investment capital flows, rather than international trade flows.
Table 6: (VAR) model – Short-run effects/changes between the stock prices and the respective financial risk exposures faced by the analysed airlines
Whole Period: January 1996 – December 2011
Equation China Airlines ∆Stock
α -0.001 (0.01)
∆stockt-1 -0.033 (0.076)
∆stockt-2 -0.069 (0.073)
∆exchanget-1 1.871*** (0.589)
∆exchanget-2 -0.776 (0.591)
∆fuelt-1 -0.131* (0.083)
∆fuelt-2 0.074 (0.084)
∆interestt-1 -0.190 (0.175)
∆interestt-2 0.031 (0.176)
R-squared 0.107 Adj. R-squared 0.068
F-statistic 2.709 Notes: All data are transformed into logarithmic scale. ***, ** and * denote significant at 1%, 5% and 10% respectively. The lag order was selected by Schwarz Bayesian Criterion. Standard errors are indicated in the parentheses. The underlying VAR model is of order 3 and contains unrestricted intercepts and restricted trend coefficients.

232 Financial Risk Exposures of the Airlines Industry: Evidence from Cathay Pacific Airways and China Airlines
Table 7: (VAR) model – Short-run effects/changes between the stock prices and the respective financial risk exposures faced by the analysed airlines
Sub-period 1: January 1996 – December 1999
Equation Cathay Pacific Airways ∆Stock
China Airlines ∆Stock
α 0.005 -0.006 (0.021) (0.014)
∆stockt-1 -0.168 -0.362*** (0.181) (0.159)
∆stockt-2 -0.016 -0.378*** (0.186) (0.143)
∆exchanget-1 -3.208** 3.163*** (1.731) (1.041)
∆exchanget-2 0.888 -0.367 (1.800) (1.035)
∆fuelt-1 -0.067 -0.271** (0.210) (0.146)
∆fuelt-2 0.005 -0.154 (0.217) (0.149)
∆interestt-1 0.626 -0.882 (1.128) (1.496)
∆interestt-2 -1.839* -4.565* (1.044) (1.551)
R-squared 0.148 0.411 Adj. R-squared -0.041 0.279
F-statistic 0.783 3.134 Notes: All data are transformed into logarithmic scale. ***, ** and * denote significant at 1%, 5% and 10% respectively. The lag order was selected by Schwarz Bayesian Criterion. Standard errors are indicated in the parentheses. The underlying VAR model is of order 3 and contains unrestricted intercepts and restricted trend coefficients.
Table 8: (VAR) model – Short-run effects/changes between the stock prices and the respective financial risk exposures faced by the analysed airlines
Sub-period 2: January 2000 – December 2003
Equation Cathay Pacific Airways ∆Stock
China Airlines ∆Stock
α 0.032 0.003 (0.019) (0.022)
∆stockt-1 0.015 -0.078 (0.162) (0.173)
∆stockt-2 -0.236 -0.071 (0.164) (0.163)
∆exchanget-1 1.380 2.350 (1.538) (1.693)
∆exchanget-2 0.801 -0.245 (1.465) (1.559)
∆fuelt-1 -0.097 -0.239 (0.171) (0.219)

Yasmin-Yashodha, Baharom Abdul Hamid and Muzafar Shah Habibullah 233
Table 8: (VAR) model – Short-run effects/changes between the stock prices and the respective financial risk exposures faced by the analysed airlines (con’t)
Sub-period 2: January 2000 – December 2003
Equation Cathay Pacific Airways ∆Stock
China Airlines ∆Stock
∆fuelt-2 -0.072 0.041 (0.173) (0.215)
∆interestt-1 1.557 -0.231 (0.843) (0.248)
∆interestt-2 -0.324* 0.209 (0.793) (0.255)
R-squared 0.179 0.191 Adj. R-squared -0.003 0.011
F-statistic 0.986 1.059 Notes: All data are transformed into logarithmic scale. ***, ** and * denote significant at 1%, 5% and 10% respectively. The lag order was selected by Schwarz Bayesian Criterion. Standard errors are indicated in the parentheses. The underlying VAR model is of order 3 and contains unrestricted intercepts and restricted trend coefficients.
Table 9: (VAR) model – Short-run effects/changes between the stock prices and the respective financial risk exposures faced by the analysed airlines.
Sub-period 3: January 2004 – December 2007
Equation Cathay Pacific Airways ∆Stock
China Airlines ∆Stock
α 0.015 0.008 (0.010) (0.009)
∆stockt-1 -0.110 -0.248* (0.175) (0.148)
∆stockt-2 -0.153 -0.324** (0.174) (0.126)
∆exchanget-1 0.647 0.400 (0.949) (0.676)
∆exchanget-2 -0.703 0.236 (0.965) (0.693)
∆fuelt-1 -0.016 0.021 (0.101) (0.090)
∆fuelt-2 -0.166* -0.179 ** (0.098) (0.091)
∆interestt-1 0.064 -1.724 ** (0.318) (0.775)
∆interestt-2 -0.430 0.945 (0.301) (0.791)
R-squared 0.156 0.317 Adj. R-squared -0.031 0.165
F-statistic 0.833 2.089 Notes: All data are transformed into logarithmic scale. ***, ** and * denote significant at 1%, 5% and 10% respectively. The lag order was selected by Schwarz Bayesian Criterion. Standard errors are indicated in the parentheses. The underlying VAR model is of order 3 and contains unrestricted intercepts and restricted trend coefficients.

234 Financial Risk Exposures of the Airlines Industry: Evidence from Cathay Pacific Airways and China Airlines
Table 10: (VAR) model – Short-run effects/changes between the stock prices and the respective financial risk exposures faced by the analysed airlines
Sub-period 4: January 2008 – December 2011
Equation Cathay Pacific Airways ∆Stock
China Airlines ∆Stock
α -0.002 -0.019 (0.016) (0.022)
∆stockt-1 -0.015 0.174 (0.196) (0.176)
∆stockt-2 0.023 0.084 (0.189) (0.176)
∆exchanget-1 -2.943*** 1.254 (1.056) (1.769)
∆exchanget-2 1.188 -1.279 (1.135) (1.698)
∆fuelt-1 -0.001 -0.195 (0.184) (0.234)
∆fuelt-2 0.096 0.257 (0.175) (0.259)
∆interestt-1 1.449 -0.203 (1.092) (0.595)
∆interestt-2 -0.655 -0.651 (1.094) (0.543)
R-squared 0.265 0.171 Adj. R-squared 0.102 -0.014
F-statistic 1.626 0.926 Notes: All data are transformed into logarithmic scale. ***, ** and * denote significant at 1%, 5% and 10% respectively. The lag order was selected by Schwarz Bayesian Criterion. Standard errors are indicated in the parentheses. The underlying VAR model is of order 3 and contains unrestricted intercepts and restricted trend coefficients.
To observe how the variables respond to various shocks to the system, we performed the variance decomposition analysis characterizing the dynamic behaviour of the model. It breaks down the forecast error variance of a variable into components that can be attributed to each of the variables. Tables 11 – 14 exhibit the generalized variance decomposition analysis over a ten-month period for the analysed individual airlines, whereby the ECTs were not statistically significant under the Johansen cointegration test. The first-differences operator is denoted by ∆. The optimum lag length is based on a minimum Schwarz information criterion (SIC) through an unconstrained VAR estimation (2 lag intervals in first differences for all series). To gauge the impact of the variables on each other in the short-run, the results are presented for the first 5 months and the 10th month.
Based on all the subsequent sub-periods, we observe that the forecast errors of the individual stock price are purely explained by their own shock (100%) in the first

Yasmin-Yashodha, Baharom Abdul Hamid and Muzafar Shah Habibullah 235
month. Additionally, for all the analysed airlines, the fuel price and interest rate exposures are the most endogenous variables in every period of study. By assessing the portion of forecast error variance of the individual stock price of the analysed airlines, the following empirical results were obtained. For the whole period of study, the empirical results of the exchange rate shock on the variance of the individual stock price of the analysed airlines, after 10 months is 7.7% for China Airlines.
During sub-period 1, the individual stock price of China Airlines and Cathay Pacific Airways were influenced by a shock in exchange rates after 10 months with the following portions respectively, 25.3%, and 7.3%. Based on sub-period 2, it is evident that interest rate exposures have a greater influence on the variance of the individual stock price of Cathay Pacific Airways. During sub-period 3, the brunt of the variance in the individual stock price of Cathay Pacific Airways is explained by movements in fuel price with 4.9% subsequent to the 10 month period. Interest rate exposures have minimal influence for all the analysed airlines, except for China Airlines with 11.7% after 10 months. In sub-period 4, the individual stock price of Cathay Pacific Airways was influenced by a shock in exchange rates after 10 months with 16.8%. Furthermore, over the 10 month period, changes in the individual stock price of China Airlines (aside from the effects of its own shock) are explained by shocks to the exchange rate and fuel price exposures.
From the above variance decomposition results, the findings provide some answers, as to how important the debate is on the relative strength of inputs for the respective stock price of the analysed airlines. The decomposition of the VEC model indicates that all the airlines are mainly sensitive to their own individual stock price performance in all periods of study, and a shock in exchange rate movements has a relatively substantial impact, compared to the fuel price and interest rate exposure for most of the individual stock price of the analysed airlines. The results in this section have a number of policy implications. The effect of the exchange rate against the stock price of the analyzed airlines varies across economies due to the different exchange rate regimes and different degree of trade openness of the economies.
The economy of a floating exchange rate regime, such as in Hong Kong will be more vulnerable to the external shocks. Understanding the source and transmission mechanism of crisis are pertinent as it will assist policy makers in developing domestic and international policies to limit the contagion effect during a financial or currency crisis. Since high and volatile jet fuel prices can have significant adverse effects on the stock price of these airlines, government intervention is required to reduce volatility. To cope with international jet fuel price upsurge and supply shortages, governments should consider oil-saving measures such as policies to improve energy efficiency, promote energy conservation and use of alternative jet fuels (i.e. renewable energy). The insignificance of interest rate exposure on the respective airlines indicates that changes in domestic interest rates do not affect the stock price of the analyzed airlines

236 Financial Risk Exposures of the Airlines Industry: Evidence from Cathay Pacific Airways and China Airlines
despite the high leverage ratios that are prevalent in the airlines industry due to its capital intensive nature.
Table 11: Generalized forecast error variance decomposition results Sub-period 1: January 1996 – December 1999
Airlines Horizon Percentage of forecast variance explained by
innovations in: ∆Stock ∆Exchange ∆Fuel ∆Interest
Cathay Pacific Airways ∆Stock 1 100.000 0.000 0.000 0.000
2 91.588 7.511 0.260 0.641 3 88.630 7.228 0.634 3.508 4 88.722 7.152 0.629 3.496 5 88.552 7.246 0.698 3.504 10 88.410 7.332 0.724 3.534
China Airlines ∆Stock 1 100.000 0.000 0.000 0.000
2 72.108 22.342 4.931 0.618 3 66.492 23.801 5.275 4.431 4 64.309 24.999 6.368 4.323 5 64.409 24.856 6.328 4.406 10 63.866 25.251 6.463 4.419
Notes: All data are transformed into logarithmic scale. The first-differences operator is denoted by ∆.
Table 12: Generalized forecast error variance decomposition results Sub-period 2: January 2000 – December 2003
Airlines Horizon Percentage of forecast variance explained by
innovations in: ∆Stock ∆Exchange ∆Fuel ∆Interest
Cathay Pacific Airways ∆Stock 1 100.000 0.000 0.000 0.000
2 88.821 3.509 0.793 6.877 3 87.745 4.559 0.771 6.924 4 87.459 4.557 1.088 6.897 5 87.415 4.624 1.084 6.875 10 87.287 4.628 1.092 6.994
China Airlines ∆Stock 1 100.000 0.000 0.000 0.000
2 91.848 4.359 2.287 1.505 3 89.015 4.568 2.203 4.214 4 89.202 4.502 2.147 4.149 5 89.182 4.522 2.139 4.158 10 88.852 4.625 2.179 4.344
Notes: All data are transformed into logarithmic scale. The first-differences operator is denoted by ∆.

Yasmin-Yashodha, Baharom Abdul Hamid and Muzafar Shah Habibullah 237
Table 13: Generalized forecast error variance decomposition results Sub-period 3: January 2004 – December 2007
Airlines Horizon Percentage of forecast variance explained by
innovations in: ∆Stock ∆Exchange ∆Fuel ∆Interest
Cathay Pacific Airways ∆Stock 1 100.000 0.000 0.000 0.000
2 98.113 1.749 0.067 0.070 3 90.091 2.889 4.463 2.557 4 89.759 2.929 4.738 2.573 5 87.947 3.297 4.846 3.909
10 87.073 3.632 4.981 4.314 China Airlines
∆Stock 1 100.000 0.000 0.000 0.000 2 88.206 2.072 0.433 9.289 3 83.624 2.057 3.472 10.847 4 82.492 2.044 3.495 11.968 5 81.196 2.258 4.748 11.798
10 80.765 2.394 5.095 11.745 Notes: All data are transformed into logarithmic scale. The first-differences operator is denoted by ∆.
Table 14: Generalized forecast error variance decomposition results Sub-period 4: January 2008 – December 2011
Airlines Horizon Percentage of forecast variance explained by
innovations in: ∆Stock ∆Exchange ∆Fuel ∆Interest
Cathay Pacific Airways ∆Stock 1 100.000 0.000 0.000 0.000
2 82.688 16.537 0.062 0.712 3 82.078 16.609 0.143 1.169 4 80.097 16.683 2.034 1.184 5 79.978 16.599 2.221 1.201
10 79.568 16.880 2.345 1.207 China Airlines
∆Stock 1 100.000 0.000 0.000 0.000 2 97.446 1.163 1.210 0.180 3 91.845 2.178 3.562 2.416 4 91.580 2.181 3.796 2.443 5 89.907 2.991 3.735 3.367
10 88.271 3.289 4.970 3.470 Notes: All data are transformed into logarithmic scale. The first-differences operator is denoted by ∆.
The preceding impulse response functions were derived with standard impulse response function analysis. The VAR is estimated and a vector moving-average (VMA) is formed to derive the effects of experimental shocks on the variables over time. The generalized impulse response analysis (Koop et al. 1996; Pesaran and Shin, 1998)
238 Financial Risk Exposures of the Airlines Industry: Evidence from Cathay Pacific Airways and China Airlines
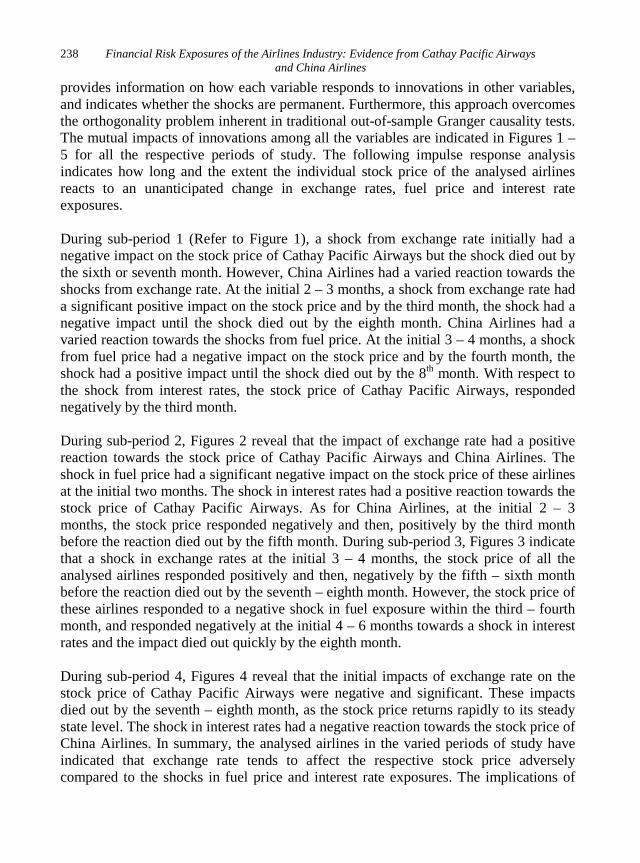
provides information on how each variable responds to innovations in other variables, and indicates whether the shocks are permanent. Furthermore, this approach overcomes the orthogonality problem inherent in traditional out-of-sample Granger causality tests. The mutual impacts of innovations among all the variables are indicated in Figures 1 – 5 for all the respective periods of study. The following impulse response analysis indicates how long and the extent the individual stock price of the analysed airlines reacts to an unanticipated change in exchange rates, fuel price and interest rate exposures.
During sub-period 1 (Refer to Figure 1), a shock from exchange rate initially had a negative impact on the stock price of Cathay Pacific Airways but the shock died out by the sixth or seventh month. However, China Airlines had a varied reaction towards the shocks from exchange rate. At the initial 2 – 3 months, a shock from exchange rate had a significant positive impact on the stock price and by the third month, the shock had a negative impact until the shock died out by the eighth month. China Airlines had a varied reaction towards the shocks from fuel price. At the initial 3 – 4 months, a shock from fuel price had a negative impact on the stock price and by the fourth month, the shock had a positive impact until the shock died out by the 8th month. With respect to the shock from interest rates, the stock price of Cathay Pacific Airways, responded negatively by the third month.
During sub-period 2, Figures 2 reveal that the impact of exchange rate had a positive reaction towards the stock price of Cathay Pacific Airways and China Airlines. The shock in fuel price had a significant negative impact on the stock price of these airlines at the initial two months. The shock in interest rates had a positive reaction towards the stock price of Cathay Pacific Airways. As for China Airlines, at the initial 2 – 3 months, the stock price responded negatively and then, positively by the third month before the reaction died out by the fifth month. During sub-period 3, Figures 3 indicate that a shock in exchange rates at the initial 3 – 4 months, the stock price of all the analysed airlines responded positively and then, negatively by the fifth – sixth month before the reaction died out by the seventh – eighth month. However, the stock price of these airlines responded to a negative shock in fuel exposure within the third – fourth month, and responded negatively at the initial 4 – 6 months towards a shock in interest rates and the impact died out quickly by the eighth month.
During sub-period 4, Figures 4 reveal that the initial impacts of exchange rate on the stock price of Cathay Pacific Airways were negative and significant. These impacts died out by the seventh – eighth month, as the stock price returns rapidly to its steady state level. The shock in interest rates had a negative reaction towards the stock price of China Airlines. In summary, the analysed airlines in the varied periods of study have indicated that exchange rate tends to affect the respective stock price adversely compared to the shocks in fuel price and interest rate exposures. The implications of

Yasmin-Yashodha, Baharom Abdul Hamid and Muzafar Shah Habibullah 239
the impulse response analysis suggest that understanding oil price shocks is pertinent for the aviation industry as it has two varied negative effects on the airlines profitability.
Firstly, it has a direct negative effect as it increases the operating costs and invariably the airlines’ earnings consistency is affected, and therefore, the sector’s stock is heavily discounted. It is noted that airline price/earnings ratio are usually half or a third of the market average due to its volatility in earnings. Secondly, due to its inconsistency in stock performance, investors would foresee the decline in profit margins and make decisions that affect the stock price of the respective airlines. The varied reaction to shocks of the exchange rate towards the stock price of the analysed airlines is dependent on the different exchange rate regime, as it plays a pertinent role in the determination of the airlines’ financial policies.
With a floating exchange rate regime, the airlines’ external vulnerability would reduce, which enables them to take measures against their exchange rate risk. However, this regime would exert a negative impact on the airlines foreign borrowing, or a positive effect on the use of currency derivatives which could induce airlines to lower the currency mismatches in their balance sheets. Following a interest rate shock in the varied sub-periods, the negligible speed of adjustment of the stock price of the analysed airlines, indicates that the effectiveness of the monetary policy of these economies have insignificant effect on the stock price of the analysed airlines in the region.
Figure 1: Response to Generalized One S.D. Innovations ± 2 S.E. (Sub-period 1: January 1996 – December 1999)
Cathay Pacific Airways
China Airlines
-.10
-.05
.00
.05
.10
.15
.20
1 2 3 4 5 6 7 8 9 10
Response of D(LSTOCK) to D(LSTOCK)
-.10
-.05
.00
.05
.10
.15
.20
1 2 3 4 5 6 7 8 9 10
Response of D(LSTOCK) to D(LEXCHANGE)
-.10
-.05
.00
.05
.10
.15
.20
1 2 3 4 5 6 7 8 9 10
Response of D(LSTOCK) to D(LFUEL)
-.10
-.05
.00
.05
.10
.15
.20
1 2 3 4 5 6 7 8 9 10
Response of D(LSTOCK) to D(LINTEREST)
Response to Cholesky One S.D. Innovations ± 2 S.E.
-.08
-.04
.00
.04
.08
.12
1 2 3 4 5 6 7 8 9 10
Response of D(LSTOCK) to D(LSTOCK)
-.08
-.04
.00
.04
.08
.12
1 2 3 4 5 6 7 8 9 10
Response of D(LSTOCK) to D(LEXCHANGE)
-.08
-.04
.00
.04
.08
.12
1 2 3 4 5 6 7 8 9 10
Response of D(LSTOCK) to D(LFUEL)
-.08
-.04
.00
.04
.08
.12
1 2 3 4 5 6 7 8 9 10
Response of D(LSTOCK) to D(LINTEREST)
Response to Cholesky One S.D. Innovations ± 2 S.E.

240 Financial Risk Exposures of the Airlines Industry: Evidence from Cathay Pacific Airways and China Airlines
Figure 2: Response to Generalized One S.D. Innovations ± 2 S.E. (Sub-period 2: January 2000 – December 2003)
Figure 3: Response to Generalized One S.D. Innovations ± 2 S.E. (Sub-period 3: January 2004 – December 2007)
Cathay Pacific Airways
China Airlines
-.04
.00
.04
.08
.12
1 2 3 4 5 6 7 8 9 10
Response of D(LSTOCK) to D(LSTOCK)
-.04
.00
.04
.08
.12
1 2 3 4 5 6 7 8 9 10
Response of D(LSTOCK) to D(LEXCHANGE)
-.04
.00
.04
.08
.12
1 2 3 4 5 6 7 8 9 10
Response of D(LSTOCK) to D(LFUEL)
-.04
.00
.04
.08
.12
1 2 3 4 5 6 7 8 9 10
Response of D(LSTOCK) to D(LINTEREST)
Response to Cholesky One S.D. Innovations ± 2 S.E.
-.10
-.05
.00
.05
.10
.15
.20
1 2 3 4 5 6 7 8 9 10
Response of D(LSTOCK) to D(LSTOCK)
-.10
-.05
.00
.05
.10
.15
.20
1 2 3 4 5 6 7 8 9 10
Response of D(LSTOCK) to D(LEXCHANGE)
-.10
-.05
.00
.05
.10
.15
.20
1 2 3 4 5 6 7 8 9 10
Response of D(LSTOCK) to D(LFUEL)
-.10
-.05
.00
.05
.10
.15
.20
1 2 3 4 5 6 7 8 9 10
Response of D(LSTOCK) to D(LINTEREST)
Response to Cholesky One S.D. Innovations ± 2 S.E.
Cathay Pacific Airways
China Airlines
-.04
-.02
.00
.02
.04
.06
.08
1 2 3 4 5 6 7 8 9 10
Response of D(LSTOCK) to D(LSTOCK)
-.04
-.02
.00
.02
.04
.06
.08
1 2 3 4 5 6 7 8 9 10
Response of D(LSTOCK) to D(LEXCHANGE)
-.04
-.02
.00
.02
.04
.06
.08
1 2 3 4 5 6 7 8 9 10
Response of D(LSTOCK) to D(LFUEL)
-.04
-.02
.00
.02
.04
.06
.08
1 2 3 4 5 6 7 8 9 10
Response of D(LSTOCK) to D(LINTEREST)
Response to Cholesky One S.D. Innovations ± 2 S.E.
-.04
-.02
.00
.02
.04
.06
.08
1 2 3 4 5 6 7 8 9 10
Response of D(LSTOCK) to D(LSTOCK)
-.04
-.02
.00
.02
.04
.06
.08
1 2 3 4 5 6 7 8 9 10
Response of D(LSTOCK) to D(LEXCHANGE)
-.04
-.02
.00
.02
.04
.06
.08
1 2 3 4 5 6 7 8 9 10
Response of D(LSTOCK) to D(LFUEL)
-.04
-.02
.00
.02
.04
.06
.08
1 2 3 4 5 6 7 8 9 10
Response of D(LSTOCK) to D(LINTEREST)
Response to Cholesky One S.D. Innovations ± 2 S.E.

Yasmin-Yashodha, Baharom Abdul Hamid and Muzafar Shah Habibullah 241
Figure 4: Response to Generalized One S.D. Innovations ± 2 S.E. (Sub-period 4: January 2008 – December 2011)
5. CONCLUSIONS AND RECOMMENDATIONS
Due to the limited literature pertaining to the financial risks exposures that affects the aviation industry, this research explores the long run and dynamic relationship between the stock prices of the Cathay Pacific Airways and China Airlines against the three key determinants of financial risks exposure confronting the airline industry. As opposed to relating stock price to one independent variable as preceding literature, the current study adopts a multivariable approach in an effort to shed light on stock price determination. The financial risk exposures that are considered to influence the stock price are the fluctuations in exchange rates, fuel price and interest rate exposures.
Our empirical results show a significant causal relation between the three financial risk exposures, i.e. fluctuations in exchange rate, fuel price and interest rate exposures against the stock price of the analysed airlines were more prominent during the global financial crisis, January 2008 to December 2011 as opposed to the Asian financial crisis, January 1996 to December 1999. The practical relevance of our findings in managing these financial risk exposures lies in the fact that, although there were number of techniques and hedging tools such as balance sheet hedging, use of derivatives, leading and lagging amongst others were available to manage these exposures, these measures were probably only implemented during the global financial crisis.
Cathay Pacific Airways
China Airlines
-.10
-.05
.00
.05
.10
.15
1 2 3 4 5 6 7 8 9 10
Response of D(LSTOCK) to D(LSTOCK)
-.10
-.05
.00
.05
.10
.15
1 2 3 4 5 6 7 8 9 10
Response of D(LSTOCK) to D(LEXCHANGE)
-.10
-.05
.00
.05
.10
.15
1 2 3 4 5 6 7 8 9 10
Response of D(LSTOCK) to D(LFUEL)
-.10
-.05
.00
.05
.10
.15
1 2 3 4 5 6 7 8 9 10
Response of D(LSTOCK) to D(LINTEREST)
Response to Cholesky One S.D. Innovations ± 2 S.E.
-.10
-.05
.00
.05
.10
.15
.20
1 2 3 4 5 6 7 8 9 10
Response of D(LSTOCK) to D(LSTOCK)
-.10
-.05
.00
.05
.10
.15
.20
1 2 3 4 5 6 7 8 9 10
Response of D(LSTOCK) to D(LEXCHANGE)
-.10
-.05
.00
.05
.10
.15
.20
1 2 3 4 5 6 7 8 9 10
Response of D(LSTOCK) to D(LFUEL)
-.10
-.05
.00
.05
.10
.15
.20
1 2 3 4 5 6 7 8 9 10
Response of D(LSTOCK) to D(LINTEREST)
Response to Cholesky One S.D. Innovations ± 2 S.E.
242 Financial Risk Exposures of the Airlines Industry: Evidence from Cathay Pacific Airways and China Airlines
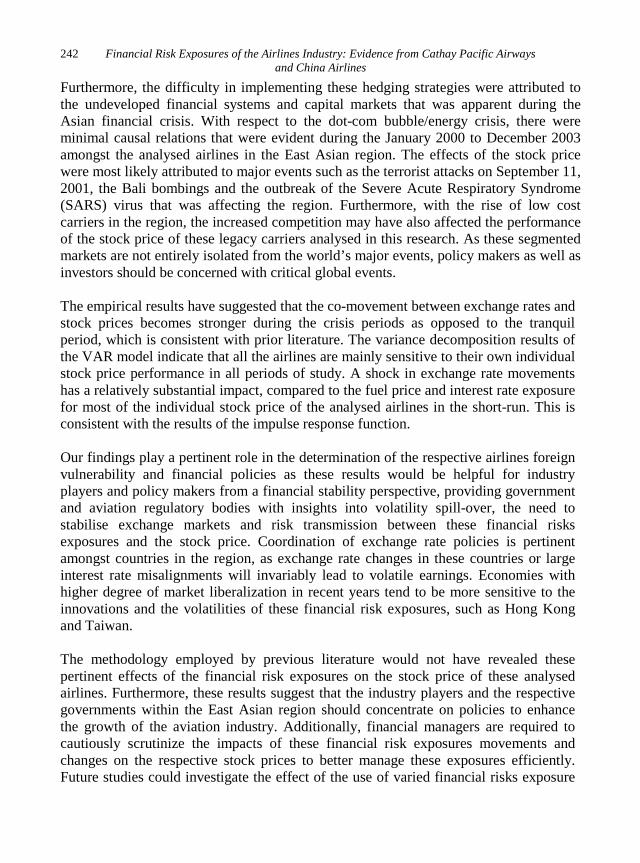
Furthermore, the difficulty in implementing these hedging strategies were attributed to the undeveloped financial systems and capital markets that was apparent during the Asian financial crisis. With respect to the dot-com bubble/energy crisis, there were minimal causal relations that were evident during the January 2000 to December 2003 amongst the analysed airlines in the East Asian region. The effects of the stock price were most likely attributed to major events such as the terrorist attacks on September 11, 2001, the Bali bombings and the outbreak of the Severe Acute Respiratory Syndrome (SARS) virus that was affecting the region. Furthermore, with the rise of low cost carriers in the region, the increased competition may have also affected the performance of the stock price of these legacy carriers analysed in this research. As these segmented markets are not entirely isolated from the world’s major events, policy makers as well as investors should be concerned with critical global events.
The empirical results have suggested that the co-movement between exchange rates and stock prices becomes stronger during the crisis periods as opposed to the tranquil period, which is consistent with prior literature. The variance decomposition results of the VAR model indicate that all the airlines are mainly sensitive to their own individual stock price performance in all periods of study. A shock in exchange rate movements has a relatively substantial impact, compared to the fuel price and interest rate exposure for most of the individual stock price of the analysed airlines in the short-run. This is consistent with the results of the impulse response function.
Our findings play a pertinent role in the determination of the respective airlines foreign vulnerability and financial policies as these results would be helpful for industry players and policy makers from a financial stability perspective, providing government and aviation regulatory bodies with insights into volatility spill-over, the need to stabilise exchange markets and risk transmission between these financial risks exposures and the stock price. Coordination of exchange rate policies is pertinent amongst countries in the region, as exchange rate changes in these countries or large interest rate misalignments will invariably lead to volatile earnings. Economies with higher degree of market liberalization in recent years tend to be more sensitive to the innovations and the volatilities of these financial risk exposures, such as Hong Kong and Taiwan.
The methodology employed by previous literature would not have revealed these pertinent effects of the financial risk exposures on the stock price of these analysed airlines. Furthermore, these results suggest that the industry players and the respective governments within the East Asian region should concentrate on policies to enhance the growth of the aviation industry. Additionally, financial managers are required to cautiously scrutinize the impacts of these financial risk exposures movements and changes on the respective stock prices to better manage these exposures efficiently. Future studies could investigate the effect of the use of varied financial risks exposure

Yasmin-Yashodha, Baharom Abdul Hamid and Muzafar Shah Habibullah 243
minimization mechanisms on firm valuation and stock returns. The resolution of these issues requires data and analysis beyond the scope of this research paper and can be explored in future research.
REFERENCES
Apergis, N., & Eleftheriou, S. (2002). Interest rates, inflation, and stock prices: the case of the Athens Stock Exchange. Journal of Policy Modeling, 24(3), 231-236.
Assaf, A. G., & Josiassen, A. (2011). The operational performance of UK airlines: 2002-2007. Journal of Economic Studies, 38(1), 5-16.
Bartram, S. (2002). The interest rate exposure of nonfinancial corporations. European Finance Review, 6(1), 101-125.
Bodnar, G. M., & Wong, M. (2000). Estimating exchange rate exposures: Some" weighty" issues. National Bureau Of Economic Research Working Paper No. 7497.
CAPA. (2013). Global Aviation Industry Outlook 2012–Pursuing certainty in an uncertain world. Retrieved December 15, 2013, from http://centreforaviation.com/analysis/capa-global-aviation-industry-outlook-2013---pursuing-certainty-in-an-uncertain-world---part-2-104436.
Carter, D., Rogers, D. A., & Simkins, B. J. (2004). Does fuel hedging make economic sense? The case of the US airline industry. The Case of the US Airline Industry (September 16, 2002). AFA 2004 San Diego Meetings.
Choi, J. J., & Prasad, A. M. (1995). Exchange risk sensitivity and its determinants: a firm and industry analysis of US multinationals. Financial Management, 24(3), 77-88.
Dickey, D. A., & Fuller, W. A. (1981). Likelihood ratio statistics for autoregressive time series with a unit root. Econometrica: Journal of the Econometric Society, 49(9), 1057-1072.
Dolado, J. J., Jenkinson, T., & Sosvilla‐Rivero, S. (1990). Cointegration and unit roots. Journal of economic surveys, 4(3), 249-273.
Eryiğit, M. (2009). Effects of Oil Price Changes on the Sector Indices of Istanbul Stock Exchange‖. International Research Journal of Finance and Economics, 25(2), 209-216.
Froot, K. A., Scharfstein, D. S., & Stein, J. C. (1993). Risk management: Coordinating corporate investment and financing policies. the Journal of Finance, 48(5), 1629-1658.
Granger, C. W. (1988). Some Comments on Econometric Methodology. Economic Record, 64(4), 327-330.
Hashemzadeh, N., & Taylor, P. (1988). Stock prices, money supply, and interest rates: the question of causality. Applied Economics, 20(12), 1603-1611.
Hooper, P. (2005). The environment for Southeast Asia's new and evolving airlines. Journal of Air Transport Management, 11(5), 335-347.

244 Financial Risk Exposures of the Airlines Industry: Evidence from Cathay Pacific Airways and China Airlines
Ibrahim, M. H. (2008). The Exchange-Rate Exposure of Sectoral Stock Returns: Evidence From Malaysia. International Journal of Economic Perspectives, 2(2), 64.
Johansen, S. (1988). Statistical analysis of cointegration vectors. Journal of economic dynamics and control, 12(2), 231-254.
Johansen, S., & Juselius, K. (1990). Maximum likelihood estimation and inference on cointegration with applications to the demand for money. Oxford Bulletin of Economics and Statistics, 52(2), 169-210.
Jorion, P. (1990). The exchange-rate exposure of US multinationals. Journal of Business, 63(3), 331-345.
Lee, K. C., & Pesaran, M. H. (1993). Persistence profiles and business cycle fluctuations in a disaggregated model of UK output growth. Ricerche Economiche, 47(3), 293-322.
Lee, K. C., Pesaran, M. H., & Pierse, R. G. (1992). Persistence of shocks and their sources in a multisectoral model of UK output growth. The Economic Journal, 102(411), 342-356.
Loudon, G. F. (2004). Financial risk exposures in the airline industry: evidence from Australia and New Zealand. Australian Journal of Management, 29(2), 295-316.
Masih, A. M., & Masih, R. (1996a). Empirical tests to discern the dynamic causal chain in macroeconomic activity: new evidence from Thailand and Malaysia based on a multivariate cointegration/vector error-correction modeling approach. Journal of Policy Modeling, 18(5), 531-560.
Masih, R., & Masih, A. M. (1996b). Macroeconomic activity dynamics and Granger causality: New evidence from a small developing economy based on a vector error-correction modelling analysis. Economic Modelling, 13(3), 407-426.
Modigliani, F., & Cohn, R. A. (1979). Inflation, rational valuation and the market. Financial Analysts Journal, 35(2), 24-44.
Ng, S., & Perron, P. (2001). Lag length selection and the construction of unit root tests with good size and power. Econometrica, 69(6), 1519-1554.
Nieh, C.-C., & Lee, C.-F. (2002). Dynamic relationship between stock prices and exchange rates for G-7 countries. The Quarterly Review of Economics and Finance, 41(4), 477-490.
Pesaran, M. H., Pierse, R. G., & Lee, K. C. (1993). Persistence, cointegration, and aggregation: A disaggregated analysis of output fluctuations in the US economy. Journal of econometrics, 56(1), 57-88.
Phillips, P. C., & Perron, P. (1988). Testing for a unit root in time series regression. Biometrika, 75(2), 335-346.
Saha, G. C., & Theingi. (2009). Service quality, satisfaction, and behavioural intentions: A study of low-cost airline carriers in Thailand. Managing Service Quality: An International Journal, 19(3), 350-372.
Zhao, H. (2010). Dynamic relationship between exchange rate and stock price: Evidence from China. Research in International Business and Finance, 24(2), 103-112.