financial results q4 2016 -...
TRANSCRIPT

FINANCIAL RESULTSQ4 2016
VESA TYKKYLÄINEN, CEO
NICLAS ROSENLEW, CFO
FEBRUARY 1, 2017

IMPORTANT NOTICE
The following information contains, or may be deemed to contain, forward-looking statements. These
statements relate to future events or future financial performance, including, but not limited to,
expectations regarding market growth and development as well growth and profitability of Basware. In
some cases, such forward-looking statements can be identified by terminology such as “expect,” “plan,”
“anticipate,” “intend,” “believe,” “estimate,” “predict,” “potential,” or “continue,” or the negative of those
terms or other comparable terminology. By their nature, forward-looking statements involve risks and
uncertainties because they relate to events and depend on circumstances that may or may not occur in
the future. Future results may vary from the results expressed in, or implied by, the forward-looking
statements, possibly to a material degree. All forward-looking statements included herein are based on
information presently available to Basware and, accordingly, Basware assumes no obligation to update
any forward-looking statements, unless obligated to do so pursuant to an applicable law or regulation.
Nothing in this presentation constitutes investment advice and this presentation shall not constitute an
offer to sell or the solicitation of an offer to buy any securities of Basware or otherwise to engage in any
investment activity.
2

VESA TYKKYLÄINEN
CEO REVIEW

SIGNIFICANT MARKET OPPORTUNITY
4(1) Annual spend on source-to-pay and e-invoicing network services for key,
corporate, SMB medium and public sector customers in Europe and North America.
Source: Basware, Forrester, Gartner, Billentis, EESPA
EUR 3.5
billion Current
market(1) EUR
149 million Basware 2016 revenues
EUR 15 billionMarket potential(1)
Underpenetrated market
Competition is fragmented
Basware is
global leader
Largest e-invoicing
network
#1 in Accounts
Payable
Top 3 in Procurement

RECOGNISED AGAIN AS MARKET LEADER
Leader with highest score for Adaptability
“an impressive company that offers a leading solution among global P2P providers”
Procure to Pay Navigator 2016
5
Basware scores highest in five categories

Q4 2016 HIGHLIGHTS
Extend cloud
P2P leadership
Accelerate
Network growth
Unleash
Financing
Services
SaaS revenues
+123.1%
29.7 million Q4
Transactions
(18.9%)
Maturing the
solutions
29 new P2P
SaaS deals
closed (vs 26 in
Q4 2015)
November
record month at
10.4m
54 deals signed
in total since
inception
Strategy:
Q4 2016
Progress:
6
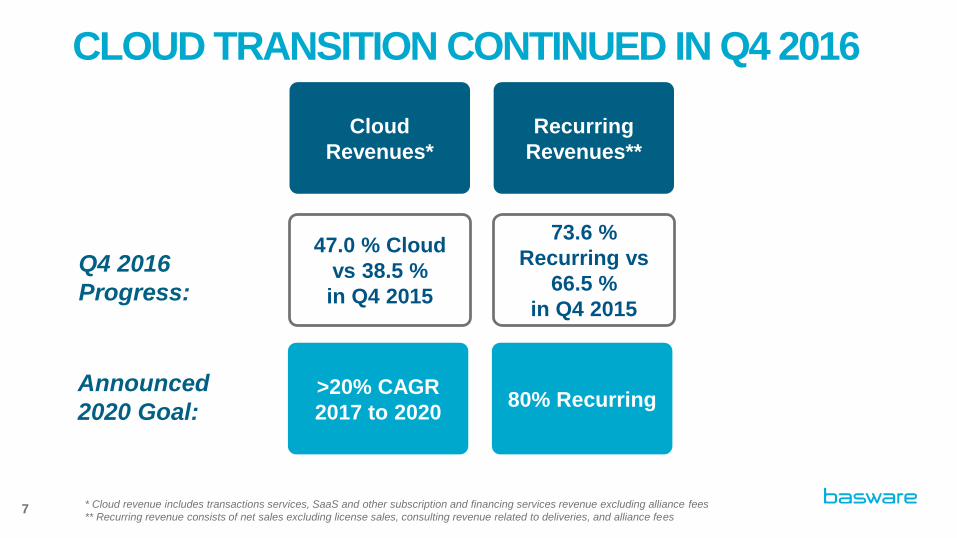
CLOUD TRANSITION CONTINUED IN Q4 2016
Announced
2020 Goal:
Recurring
Revenues**
Cloud
Revenues*
Q4 2016
Progress:
80% Recurring>20% CAGR
2017 to 2020
73.6 %
Recurring vs
66.5 %
in Q4 2015
47.0 % Cloud
vs 38.5 %
in Q4 2015
* Cloud revenue includes transactions services, SaaS and other subscription and financing services revenue excluding alliance fees
** Recurring revenue consists of net sales excluding license sales, consulting revenue related to deliveries, and alliance fees 7

27 Alusta SaaS
go-lives
vs 13 in Q4 2015
Express delivery
Productivity
programme initiated
in November 2016
Shift to AWS
infrastructure
Q4 INVESTMENTS FOR THE STRATEGY
Announced
Growth
Enablers:
Further
shortening of
delivery times
Investing in
demand
generation
and sales
Scalable
company
infrastructure
Q4 2016
Progress:
Sales and
marketing
headcount up
23.5%
Roll out of Account
Management
8

FINANCIAL REVIEW
NICLAS ROSENLEW

(EUR Thousands) Q4 2016 Q4 2015 Change 1-12 2016 1-12 2015 Change
Reported Net Sales 40 211 39 210 2.6% 148 580 143 410 3.6%
Organic Net Sales 37 401 39 156 -4.5% 138 137 140 192 -1.5%
Organic Net Sales at
Constant Currencies37 991 39 156 -3.0% 140 594 140 192 0.3%
KEY GUIDANCE METRICS
(EUR Thousands) Q4 2016 Q4 2015 1-12 2016 1-12 2015
Reported EBITDA -1 623 6 224 -5 394 11 902
Total Adjustments 5 283 559 7 456 219
Adjusted EBITDA 3 660 6 783 2 063 12 121
2.6% Net
Sales growth
(-3.0% organic
at constant
currencies)
in Q4 2016
10

Q4 2016 NET SALES PROGRESSION
EUR thousand Q4 2016 Q4 2015 Change
SaaS 7 173 3 216 123.1%
Transaction services 10 152 9 399 8.0%
Other Cloud 1 576 2 477 -36.4%
Cloud total 18 900 15 091 25.2%
Consulting services 9 360 10 315 -9.3%
Maintenance 10 075 10 387 -3.0%
License sales 1 962 3 397 -42.2%
Other Non-Cloud -86 21
Non-Cloud total 21 310 24 119 -11.6%
Group total 40 211 39 210 2.6%
• SaaS growth accelerated at
123.1% total, 60.5% organic
• Transaction services revenue
increased 8.0%; differences vs
transaction volume driven by
retroactive billing in Q4 2015
• Overall growth impacted by the
decline in non cloud revenues,
as well as weakness in the UK
11

Q4 OPERATING EXPENSES AND INVESTMENTS
• Operating Expenses increased by EUR 8.7 m versus Q4 2015. This included c. EUR 5m related to employee efficiency related measures
• Sales and marketing headcount grew 23.5% compared to 14.4% for group headcount
• R&D Expenses accounted for 17.0% of sales versus 15.5% in Q4 2015. This included c. EUR 1.6m related to employee efficiency related measures
Operating expenses include employee benefits, depreciations & amortizations, and other operating expenses
** 2016 number includes c. EUR 5m related to employee efficiency related measures
EUR thousand Q4 2016 Q4 2015 Change
Employee Benefit Expenses* 27 614 22 456 23.0%
Other Operating Expenses 9 623 6 517 47.7%
Depreciation and Amortization 2 391 1 919 24.6%
Total Operating Expenses 39 628 30 892 28.3%
Materials and Services 4 600 4 098 12.2%
R&D Expenses 6 845 6 096 12.3%
Capitalised R&D 3 179 2 889 10.0%
Personnel 1 891 1 652 14.4%
12

Q4 CASHFLOW AND BALANCE SHEET
• Cashflow from operating activities
was EUR -5.6 m in Q4
• Cashflow was impacted by the
increase in growth
investments
• EUR 35.8 m of cash and cash
equivalents
• Increase in cash position
compared to Q4 2015 related
to incomings from financing
and outgoings from
acquisitions and growth
related investments
(EUR Thousands) Q4 2016 Q4 2015
Cash flows from operating
activities-5 564 1 241
Net change in cash and
cash equivalents22 856 -3 682
Cash and cash equivalents* 35 755 33 238
* Includes short term deposits13

KEY GROUP REPORTED FINANCIALS
EUR thousand Q4 2016 Q4 2015 Change
Net sales 40 211 39 210 2.6%
Material and services -4 600 -4 098 12.2%
Personnel expenses* -27 614 -22 456 23.0%
Other operating expenses -9 623 -6 517 47.7%
EBITDA -1 623 6 224
Depreciation and amortization -2 391 -1 919 24.6%
Operating result (EBIT) -4 014 4 305
Net result -3 121 2 954
EPS, EUR (diluted) -0.22 0.21
* 2016 number includes c. EUR 5m related to employee efficiency related measures14

Q4 2016 SUMMARY HIGHLIGHTS
+ 25.2% Cloud
revenue growth
Adjusted
EBITDA
EUR 3 660K
+ 123.1% total
SaaS revenue
growth
+ 18.9%
Network
transaction
volume growth
+ 23.5% Sales
and Marketing
headcount
47.0% Cloud
Revenues
108 million full
year
Transactions
FinancialsSales
momentum
Investing in
growth
Transition to
cloud
Account
Management
Roll-out
15

OUTLOOK
VESA TYKKYLÄINEN

HOW BASWARE WILL SEIZE THE OPPORTUNITY
Customer
experience
High
performance
culture
Integrated &
high-quality
offering
Sales &
Marketing
effectiveness
Cloud
Revenue
Growth
Operational
excellenceInnovation
Grow the
Network
Extend P2P
Leadership
Expand Value
Added Services
17

2020 STRATEGY GOALS
Cloud revenue growth
>20% CAGR
on an organic basis
Annual net sales
>EUR 220 million
Recurring revenue
~ 80% of net sales
* Cloud revenue includes transactions services, SaaS and other subscription and financing services revenue excluding alliance fees
** Recurring revenue consists of net sales excluding license sales, consulting revenue related to deliveries, and alliance fees
2020 Strategic Goals
Cloud Revenue Growth
Continue to improve
underlying profitability
Strategic Priority
18

2017 FULL YEAR OUTLOOK
• Basware’s number one strategic priority is cloud revenue growth
• For 2017, Basware expects:
Cloud revenues to grow by approximately 20 percent
Adjusted EBITDA at breakeven
19

APPENDIX

BREAKDOWN OF REVENUES BY CURRENCY
• To enable further
understanding of
Basware’s exposure to
currency movements, a
breakdown of 2016
revenues split by
currency is provided:
55.4%
13.8%
10.5%
20.3%
EUR USD GBP Other
21

MORE INFORMATION:
www.basware.com/investors
www.basware.com
www.twitter.com/basware
www.facebook.com/BaswareCorporation
www.linkedin.com/company/basware
Q1 INTERIM REPORT ON APRIL 21, 2017
NEXT REPORT