financial results - pdf.kabutan.jp
TRANSCRIPT

Financial Results: The 1st 9 Months of FY Ending March 2021 (April 1, 2020 –December 31, 2020)
February 9, 2021

1
Contents
Summary of Business Results for 1st 9 Months of FY Ending March 2021
Supplemental Materials
Business Environment and Future Prospect■
■
02 Financial Summary03 Year over Year Comparisons of Net Sales,
Cost of Sales, and SGA Expenses04 Net Sales by Segment05 Operating Income by Segment06 Operating Gross Profit Margins/Operating
Margins by Segment07-12 Review of Operations13-14 Earnings Forecasts for FY Ending March 2021
■
16 Business Environment17 Our Countermeasures18 Long-Term Vision and Medium-Term
Management Plan19 Recent Topics (from October 2020)20 Dividends
22 Balance Sheets23 Net Sales by Business24 Gross Margin by Transportation Mode25 Freight Volume by Segment (Air Freight) 26 Freight Volume by Segment (Sea Freight) 27 Freight Volume by Segment (Air/Sea Freight)
2
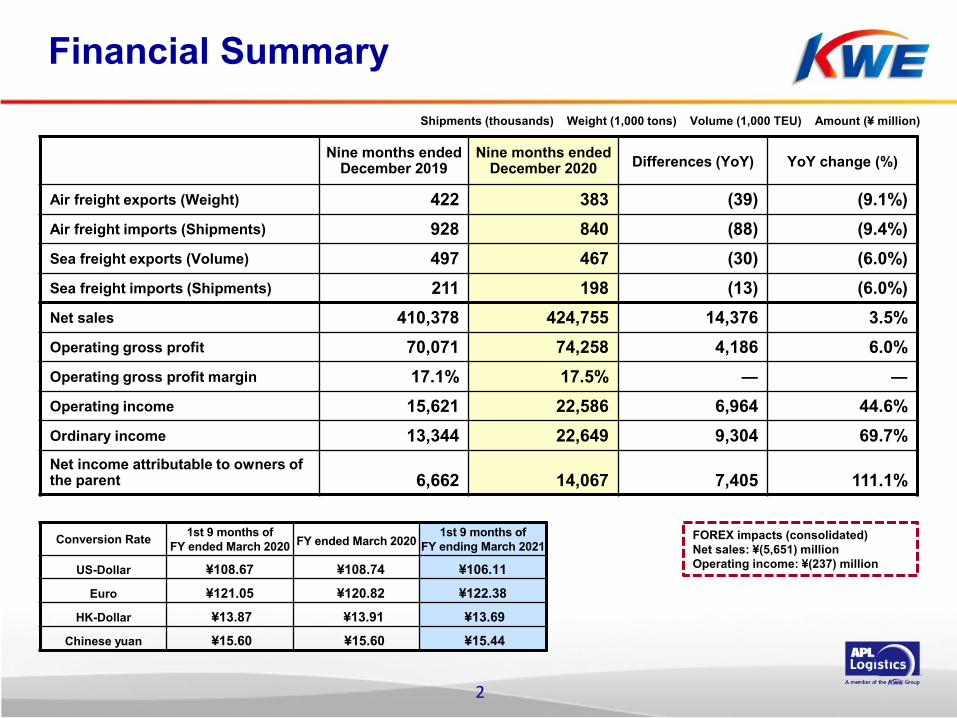
Financial Summary
Conversion Rate 1st 9 months ofFY ended March 2020 FY ended March 2020
1st 9 months ofFY ending March 2021
US-Dollar ¥108.67 ¥108.74 ¥106.11
Euro ¥121.05 ¥120.82 ¥122.38
HK-Dollar ¥13.87 ¥13.91 ¥13.69
Chinese yuan ¥15.60 ¥15.60 ¥15.44
Shipments (thousands) Weight (1,000 tons) Volume (1,000 TEU) Amount (¥ million)
FOREX impacts (consolidated) Net sales: ¥(5,651) millionOperating income: ¥(237) million
Nine months ended December 2019
Nine months ended December 2020 Differences (YoY) YoY change (%)
Air freight exports (Weight) 422 383 (39) (9.1%)Air freight imports (Shipments) 928 840 (88) (9.4%)Sea freight exports (Volume) 497 467 (30) (6.0%)Sea freight imports (Shipments) 211 198 (13) (6.0%)Net sales 410,378 424,755 14,376 3.5%Operating gross profit 70,071 74,258 4,186 6.0%Operating gross profit margin 17.1% 17.5% ― ―Operating income 15,621 22,586 6,964 44.6%Ordinary income 13,344 22,649 9,304 69.7%Net income attributable to owners of the parent 6,662 14,067 7,405 111.1%

3
Year over Year Comparisons of Net Sales,Cost of Sales, and SGA Expenses
410,378 424,755
340,306 350,772
54,450 51,396
0
100,000
200,000
300,000
400,000
500,000
Nine months ended December 2019 Nine months ended December 2020
Net sales
Cost of sales
Net sales
SGA expenses
Nine months ended December 2019 Ratio to net sales Nine months ended
December 2020 Ratio to net sales
Net sales 410,378 100.0% 424,755 100.0%Cost of sales 340,306 82.9% 350,496 82.5%Operating gross profit 70,071 17.1% 74,258 17.5%SGA expenses 54,450 13.3% 51,672 12.2%Operating income 15,621 3.8% 22,586 5.3%
(Millions of yen)
(Millions of yen)

23.7%
9.4%
6.2%21.3%
14.2%
24.7%
0.5%
4
Composition by segment
Net Sales by Segment Nine months ended December 2019
Nine months ended December 2020
YoY change
Amount %
Japan 103,480 103,523 42 0.0%The Americas 43,882 41,073 (2,809) (6.4%)Europe, Middle East & Africa 27,016 27,298 281 1.0%East Asia & Oceania 70,110 92,724 22,613 32.3%Southeast Asia 41,712 61,821 20,108 48.2%APLL 133,829 107,523 (26,305) (19.7%)Other 2,253 2,025 (228) (10.1%)Adjustment (11,907) (11,234) 672 ―
Total 410,378 424,755 14,376 3.5%
Net Sales by Segment
The AmericasJapan
East Asia & OceaniaSoutheast Asia
OtherAPLL
Europe, Middle East &Africa24.5%
10.4%
6.4%16.6%
9.9%
31.7%
0.5%
Nine months ended December 2020Nine months ended December 2019

19.3%
11.2%
3.1%
29.2%
20.1%
16.0%1.1%
5
Operating Income by Segment
16.6%
12.5%
2.9%
17.7%7.4%
40.6%
2.3% Composition by segment
Nine months ended December 2019 Nine months ended December 2020Operating Income by
SegmentNine months ended
December 2019Nine months ended
December 2020YoY change
Amount %
Japan 3,316 5,183 1,867 56.3%The Americas 2,492 3,002 510 20.5%Europe, Middle East & Africa 583 835 252 43.3%
East Asia & Oceania 3,549 7,843 4,293 121.0%Southeast Asia 1,482 5,390 3,908 263.5%APLL 8,135 4,298 (3,837) (47.2%)
Amortization of goodwill 4,408 4,300 (108) ―Other 456 308 (147) (32.3%)Adjustment 14 22 7 ―
Total 15,621 22,586 6,964 44.6
The AmericasJapan
East Asia & OceaniaSoutheast Asia
OtherAPLL
Europe, Middle East &Africa

6
3.8%
5.3%
3.2%
5.0%5.7%
7.3%
2.2%3.1%
5.1%
8.5%
3.6%
8.7%
4.3%
7.1%6.1%
4.0%
0.0%
5.0%
10.0%
15.0%
20.0%
25.0%
Japan The Americas Europe, Middle East & Africa
East Asia & Oceania Southeast AsiaConsolidated
20/3 21/33Q
KWE
17.1%17.5%
20.3%
21.9%
14.6%
17.2%
12.7%13.0%12.2%
14.1%12.6%
15.1%
20.4%19.6%
APLL
20/3 21/3 20/3 21/3 20/3 21/3 20/3 21/3 20/3 21/3 20/3 21/3 20/3 21/3
15.5%16.8%
3Q 3Q 3Q 3Q 3Q 3Q 3Q 3Q 3Q 3Q 3Q 3Q 3Q 3Q 3Q
Operating Gross Profit Margins/Operating Margins by Segment
Operating margin
Operating grossprofit margin
* APLL’s operating margin is calculated based on the amount before amortization of goodwill.

7
41.7%
22.9%
9.1%
26.3%
Japan
Air FreightSea FreightLogisticsOther
・ Profit increased due to an improvement in operating gross profit margin, etc. amid a drastic decline in air freight volume・ Domestic subsidiaries struggled with sluggish domestic air freight demand
Review of Operations
Nine months ended December 2019
Nine months ended December 2020
YoY change
Amount %
Net sales 103,480 103,523 42 0.0%
Operating income 3,316 5,183 1,867 56.3%
(Millions of yen)
Freight volumeNine months ended
December 2019Nine months ended
December 2020 YoY change
Air freight exports(tons) 103,413 89,400 (13.6%)
Air freight imports (shipments) 261,594 239,005 (8.6%)
Sea freight exports (TEUs) 103,225 110,658 7.2%
Sea freight imports (Shipments) 83,973 80,361 (4.3%)
Net Sales by Business

8
60.5%23.0%
7.2%9.3%
・ Profit growth due to an improvement in operating gross profit margin amid a drastic decline in freight volume
・ FOREX impact Net sales: ¥(1,302) million Operating income: ¥(75) million
Review of Operations
The Americas
Nine months endedDecember 2019
Nine months ended December 2020
YoY change
Amount %
Net sales 43,882 41,073 (2,809) (6.4%)
Operating income 2,492 3,002 510 20.5%
Freight volumeNine months ended
December 2019Nine months ended
December 2020 YoY change
Air freight exports (tons) 80,976 70,359 (13.1%)
Air freight imports (shipments) 90,882 70,803 (22.1%)
Sea freight exports (TEUs) 34,529 27,224 (21.2%)
Sea freight imports (shipments) 28,981 25,367 (12.5%)
(Millions of yen)
Net Sales by Business
Air FreightSea FreightLogisticsOther
9
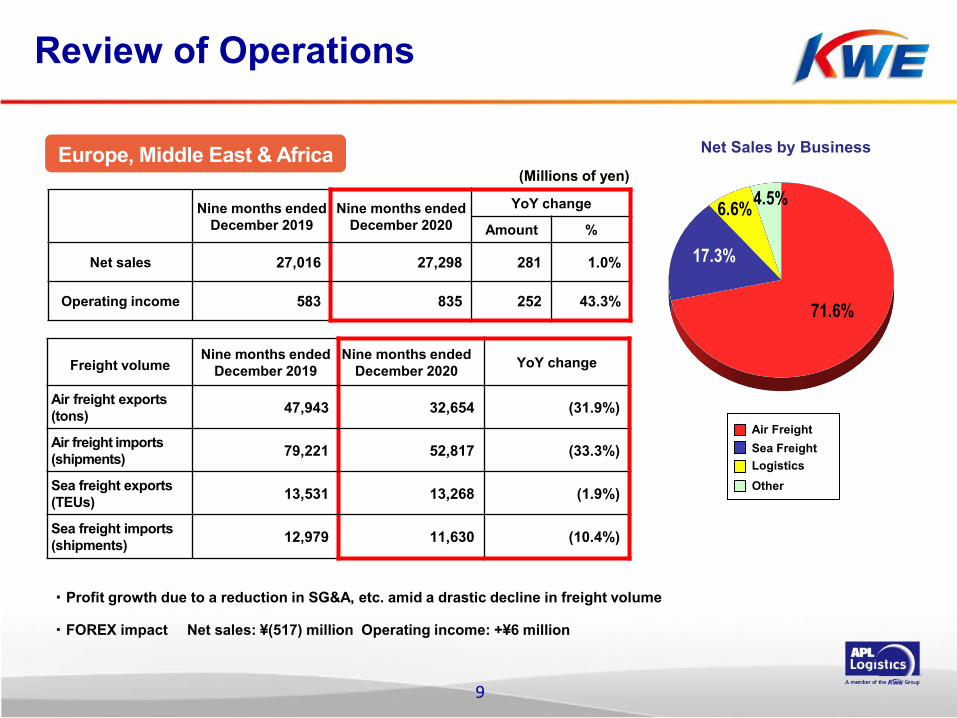
71.6%
17.3%
6.6%4.5%
Europe, Middle East & Africa
・ Profit growth due to a reduction in SG&A, etc. amid a drastic decline in freight volume
Review of Operations
Net Sales by Business(Millions of yen)
Nine months ended December 2019
Nine months ended December 2020
YoY change
Amount %
Net sales 27,016 27,298 281 1.0%
Operating income 583 835 252 43.3%
Freight volumeNine months ended
December 2019Nine months ended
December 2020 YoY change
Air freight exports (tons) 47,943 32,654 (31.9%)
Air freight imports (shipments) 79,221 52,817 (33.3%)
Sea freight exports (TEUs) 13,531 13,268 (1.9%)
Sea freight imports (shipments) 12,979 11,630 (10.4%)
・ FOREX impact Net sales: ¥(517) million Operating income: +¥6 million
Air FreightSea FreightLogisticsOther

10
60.3%20.8%
14.4%4.5%
East Asia & Oceania
・Profit increased significantly with solid shipments in electronic products and improved operating gross profit margin
Review of Operations
Net Sales by Business
Nine months ended December 2019
Nine months ended December 2020
YoY change
Amount %
Net sales 70,110 92,724 22,613 32.3%
Operating income 3,549 7,843 4,293 121.0%
Freight volumeNine months ended
December 2019Nine months ended
December 2020 YoY change
Air freight exports (tons) 110,736 116,998 5.7%
Air freight imports (shipments) 345,752 353,152 2.1%
Sea freight exports (TEUs) 174,067 173,304 (0.4%)
Sea freight imports (shipments) 45,990 45,945 (0.1%)
(Millions of yen)
・ FOREX impact Net sales: ¥(547) million Operating income: ¥(20) million
Air FreightSea FreightLogisticsOther

11
67.2%
20.1%
8.7%4.0%
Southeast Asia
・ Profit increased significantly due to an improvement in operating gross profit margin amid a drastic decline in freight volume
Review of Operations
Net Sales by Business
Nine months endedDecember 2019
Nine months ended December 2020
YoY change
Amount %
Net sales 41,712 61,821 20,108 48.2%
Operating income 1,482 5,390 3,908 263.5%
Freight volumeNine months ended
December 2019Nine months ended
December 2020 YoY change
Air freight exports (tons) 79,097 74,436 (5.9%)
Air freight imports (shipments) 151,024 125,102 (17.2%)
Sea freight exports (TEUs) 124,184 111,135 (10.5%)
Sea freight imports (shipments) 39,484 35,420 (10.3%)
(Millions of yen)
・ FOREX impact Net sales: ¥(1,318) million Operating income: ¥(20) million
Air FreightSea FreightLogisticsOther

12
1.0%
31.1%
67.9%
・ For automotive-related services, the land transport decreased in North America and India as a consequence of shutdowns of factories due to lockdowns in the first half. For retail-related services, the handling volume decreased mainly in major customers due to shutdowns of stores around the world.The volume in consumer and other industrial fields was below a year earlier
Review of Operations
(Millions of yen)Nine months ended
December 2019Nine months ended
December 2020 YoY change %
Net sales 133,829 107,523 (26,305) (19.7%)
Operating income 3,726 (1) (3,728) ―
Net Sales by BusinessAPLL
・ Operating income of ¥4,298 million before amortization of goodwill (¥8,135 million a year earlier)
・ FOREX impact Net sales: ¥(1,912) million Operating income: ¥(116) million
Air FreightSea FreightLogistics
13
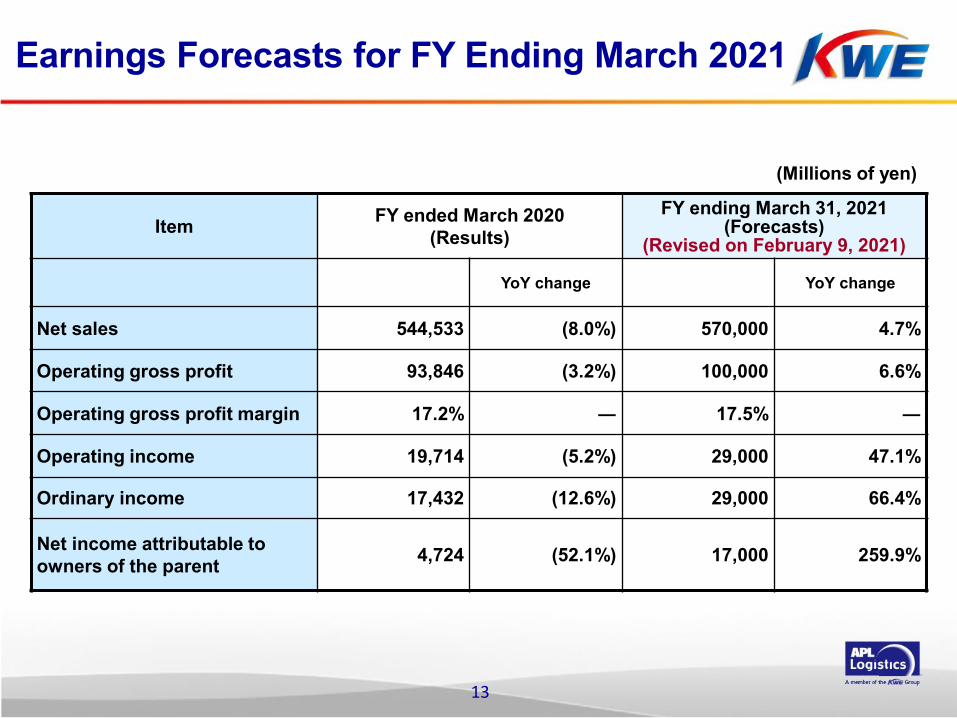
Earnings Forecasts for FY Ending March 2021
(Millions of yen)
Item FY ended March 2020(Results)
FY ending March 31, 2021 (Forecasts)
(Revised on February 9, 2021)
YoY change YoY change
Net sales 544,533 (8.0%) 570,000 4.7%
Operating gross profit 93,846 (3.2%) 100,000 6.6%
Operating gross profit margin 17.2% ― 17.5% ―
Operating income 19,714 (5.2%) 29,000 47.1%
Ordinary income 17,432 (12.6%) 29,000 66.4%
Net income attributable to owners of the parent 4,724 (52.1%) 17,000 259.9%
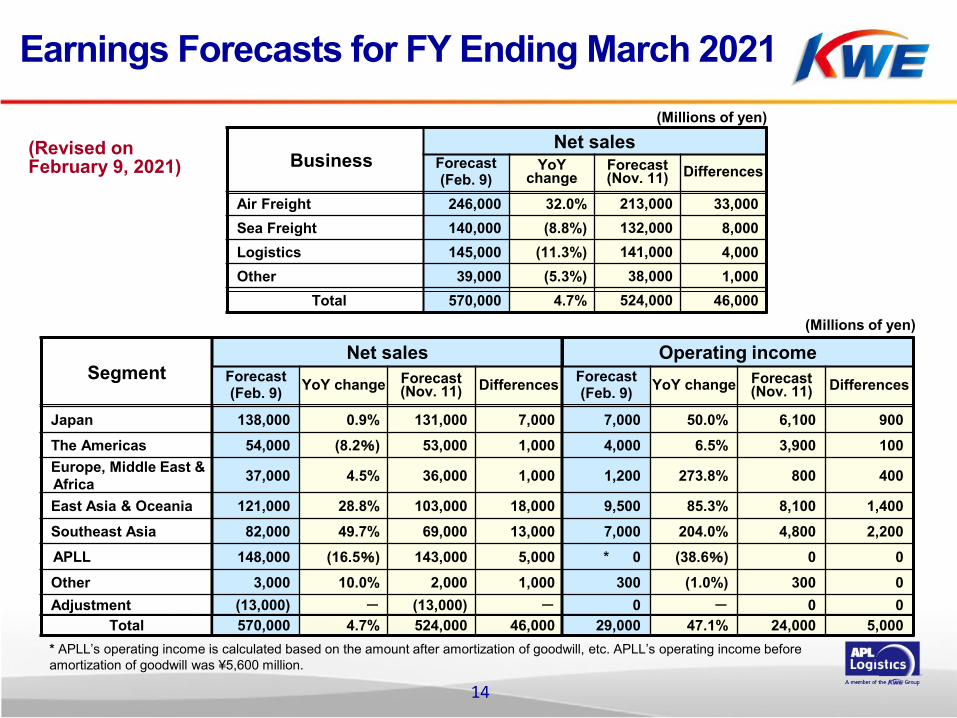
SegmentNet sales Operating income
Forecast(Feb. 9) YoY change Forecast
(Nov. 11) Differences Forecast(Feb. 9) YoY change Forecast
(Nov. 11) Differences
Japan 138,000 0.9% 131,000 7,000 7,000 50.0% 6,100 900The Americas 54,000 (8.2%) 53,000 1,000 4,000 6.5% 3,900 100Europe, Middle East & Africa 37,000 4.5% 36,000 1,000 1,200 273.8% 800 400
East Asia & Oceania 121,000 28.8% 103,000 18,000 9,500 85.3% 8,100 1,400Southeast Asia 82,000 49.7% 69,000 13,000 7,000 204.0% 4,800 2,200APLL 148,000 (16.5%) 143,000 5,000 * 0 (38.6%) 0 0Other 3,000 10.0% 2,000 1,000 300 (1.0%) 300 0Adjustment (13,000) - (13,000) - 0 - 0 0
Total 570,000 4.7% 524,000 46,000 29,000 47.1% 24,000 5,000
BusinessNet sales
Forecast(Feb. 9)
YoY change
Forecast(Nov. 11) Differences
Air Freight 246,000 32.0% 213,000 33,000Sea Freight 140,000 (8.8%) 132,000 8,000Logistics 145,000 (11.3%) 141,000 4,000Other 39,000 (5.3%) 38,000 1,000
Total 570,000 4.7% 524,000 46,000
14
(Revised on February 9, 2021)
(Millions of yen)
(Millions of yen)
* APLL’s operating income is calculated based on the amount after amortization of goodwill, etc. APLL’s operating income before amortization of goodwill was ¥5,600 million.
Earnings Forecasts for FY Ending March 2021

15
Business Environment and Future Prospect
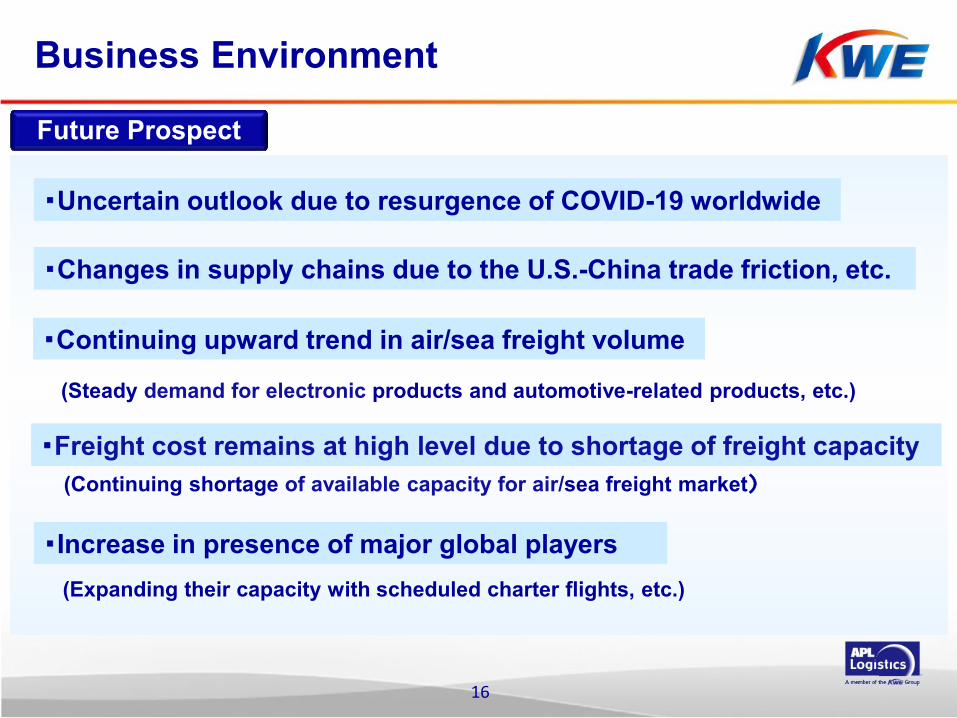
Future Prospect
Business Environment
・Uncertain outlook due to resurgence of COVID-19 worldwide
・Continuing upward trend in air/sea freight volume
(Steady demand for electronic products and automotive-related products, etc.)
・Freight cost remains at high level due to shortage of freight capacity(Continuing shortage of available capacity for air/sea freight market)
・Increase in presence of major global players(Expanding their capacity with scheduled charter flights, etc.)
・Changes in supply chains due to the U.S.-China trade friction, etc.
16

Countermeasures
・ Timely response to changing market and customers’ needs
・ Flexible and strategic use of charter flights and Block Space Agreement (BSA)・ Reinforce relationship with air/sea carriers and optimize centralized
procurement
・ Further optimization of operational efficiency (Promoting paperless, better work environment, etc.)
・ Business expansion with our multinational Corporate Accounts (CA) focusing on non-Japanese customers
・ Continuous initiatives for items related to technological innovation (IoT, AI, 5G, EV, etc.)
17

¥420.2 billion
¥592.0 billion ¥544.5
billion¥570.0 billion
¥720.0 billion
¥1 trillion
0
25
50
75
100
125
150
0
2,000
4,000
6,000
8,000
10,000
2015年度
(実績)
2018年度
(実績)
2019年度
(実績)
2020年度
(計画)
2021年度
(計画)
長期ビジョン
航空貨物物量
海上貨物物量
営業収入
FYFY2015
(Results)FY2018
(Results)FY2019
(Results)FY2020(Plan)
FY2021(Plan)
Long-Term Vision
Long-Term Vision and Medium-Term Management Plan
Net sales: Billions of yen
¥50.0 billion
¥15.3 billion
¥19.7 billion
Operating income:
Freight volume: 10,000 tons10,000 TEUs
Over 1 million
tons
Over 1 million
TEUs
550,000tons
800,000tons
457,000tons
600,000tons
900,000TEUs
640,000TEUs
700,000TEUs455,000
TEUs
¥20.7 billion
Global Top 10
550,000tons
640,000TEUs
¥29.0 billion
Net sales
Sea Freight (TEUs)
Air freight (Tons)1,000
800
600
400
200
0
Revised on February 9, 2021
18

19
Recent Topics (from October 2020)
2020
Dec.
Oct.
Jan.2021
KWE Singapore acquired GDPMDS (Good Distribution Practice for Medical Devices) Certificate
KWE China and Shanghai Kintetsu Logistics were awarded at the ceremony of the 30 years anniversary of Shanghai Free Trade Zone as one of the “30-year outstanding contributors” and “Top 100 economical contribution companies in 2019,” etc.
KWE Thailand opened a new sales office in Amata City, Chonburi
Opened Constanta branch in Romania
KWE Group Sustainability Committee held the 1st conference
Jan.
Jan.

17.5 18.5 20.0 23.0 26.0 26.0 26.0 30.0 30.0
10.0
20.0
0
10
20
30
40
2011年度 2012年度 2013年度 2014年度 2015年度 2016年度 2017年度 2018年度 2019年度 2020年度
*The company conducted a stock split at a ratio of 1:2 of common stock on October 1, 2015. Cash dividends per share is calculated based on the assumption that the stock split was conducted on April 1, 2011.
Dividends
Annual dividend per share (yen)
Annual dividend per share
(予想)
Interim
Year-end
Annual ¥30.0
While enriching its internal reserves in view of strengthening its financial standing (reduction of interest-bearing debt, etc.) and future business expansion, the Company holds as a basic policy to aim to maintain stable dividends with comprehensive consideration of factors such as strengthening its business platform.
FY2011 FY2012 FY2013 FY2014 FY2015 FY2016 FY2017 FY2018 FY2019 FY2020(Forecasts)
20
(Plan)

21
Supplemental Materials
22
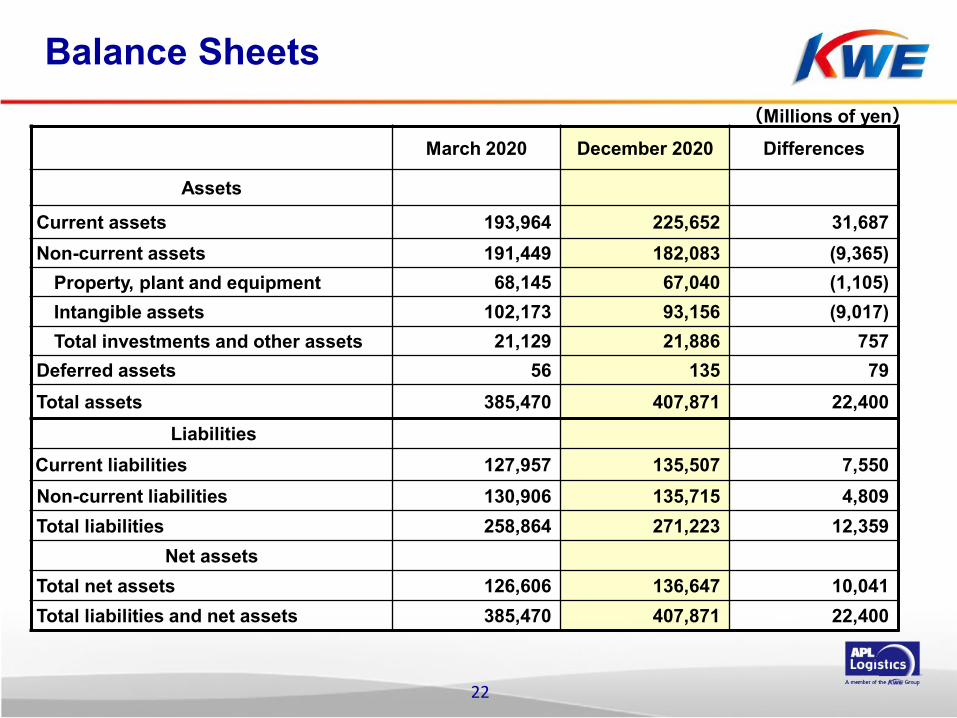
Balance Sheets
March 2020 December 2020 Differences
Assets
Current assets 193,964 225,652 31,687Non-current assets 191,449 182,083 (9,365)
Property, plant and equipment 68,145 67,040 (1,105)Intangible assets 102,173 93,156 (9,017)Total investments and other assets 21,129 21,886 757
Deferred assets 56 135 79Total assets 385,470 407,871 22,400
LiabilitiesCurrent liabilities 127,957 135,507 7,550Non-current liabilities 130,906 135,715 4,809Total liabilities 258,864 271,223 12,359
Net assetsTotal net assets 126,606 136,647 10,041Total liabilities and net assets 385,470 407,871 22,400
(Millions of yen)

138,043 186,637
118,229
103,983
123,114 105,943
30,991 28,190
0
50,000
100,000
150,000
200,000
250,000
300,000
350,000
400,000
450,000
Nine months ended December 2019
Nine months ended December 2020
23
410,378
135.2%
88.0%
91.0%
86.1%
103.5%
43.9%
24.5%
25.0%
6.6%
YoY
Net Sales by Business
424,755Composition
ratio
33.6%
28.8%
7.6%
30.0%
Air Freight
Sea Freight
Logistics
Other
(Millions of yen)
Composition ratio

24
FY ended March 2019 FY ended March 2020 FY ending March 2021
First3 months
First6 months
First9 months Full year First
3 monthsFirst
6 monthsFirst
9 months Full year First3 months
First6 months
First9 months
Air 25.1% 25.0% 24.7% 25.1% 26.0% 26.5% 26.6% 27.3% 28.1% 28.1% 26.2%
Sea 27.4% 27.3% 27.7% 27.6% 27.9% 27.9% 28.0% 27.9% 27.2% 26.7% 26.1%
Gross Margin by Transportation Mode
* Gross profit=Net sales-Direct cost

103,413 89,400
80,97670,359
47,94332,654
110,736116,998
79,09774,436
0
100,000
200,000
300,000
400,000
500,000
261,594 239,005
90,88270,803
79,22152,817
345,752353,152
151,024125,102
0
200,000
400,000
600,000
800,000
1,000,000
25
(Shipments)(Weight: tons) Air Freight ImportAir Freight Exports
68.1%
86.9%
86.4%
102.1%
66.7%
77.9%
91.4%
105.7%
82.8%
East Asia& Oceania
Europe, MiddleEast & Africa
The Americas
Japan
SoutheastAsia94.1%
383,847840,879
YoY90.9%
Freight Volume by Segment (Air Freight)
422,165
928,473 YoY90.6%
Nine months ended December 2020
Nine months ended December 2020
Nine months ended December 2019
Nine months ended December 2019

26
Sea Freight Export
66.7%
78.8%98.1%
99.6%
107.2%
198,723
99.9%
89.6%
87.5%
95.7%
89.7%
Sea Freight Import
APLL
89.5%
467,659
Freight Volume by Segment (Sea Freight)
211,407497,636
YoY94.0%
YoY94.0%
83,973 80,361
28,981 25,367
12,97911,630
45,99045,945
39,48435,420
0
50,000
100,000
150,000
200,000
250,000(Volume: TEUs) (Shipments)
East Asia& Oceania
The Americas
Japan
SoutheastAsia
Europe, MiddleEast & Africa
103,225 110,658
34,529 27,22413,531 13,268
174,067 173,304
124,184 111,135
48,09932,070
0
100,000
200,000
300,000
400,000
500,000
600,000
Nine months ended December 2020
Nine months ended December 2019
Nine months ended December 2020
Nine months ended December 2019

27
Freight Volume by Segment (Air/Sea Freight)Air Freight
Exports FY2019 FY2020
From1Q (Apr.-Jun.) 2Q (Jul.-Sep.) 3Q (Oct.-Dec.) 4Q (Jan.-Mar.) 1Q (Apr.-Jun.) 2Q (Jul.-Sep.) 3Q (Oct.-Dec.)
Weight (tons) Y o Y Weight
(tons) Y o Y Weight (tons) Y o Y Weight
(tons) Y o Y Weight (tons) Y o Y Weight
(tons) Y o Y Weight (tons) Y o Y
Japan 34,225 80.2% 34,667 87.0% 34,521 83.3% 33,324 90.5% 26,264 76.7% 28,850 83.2% 34,286 99.3%
The Americas 26,031 90.7% 26,050 93.4% 28,895 103.6% 25,430 94.5% 22,885 87.9% 22,767 87.4% 24,707 85.5%
Europe, Middle East &
Africa15,869 98.3% 15,895 95.5% 16,179 86.6% 14,134 86.7% 9,469 59.7% 9,869 62.1% 13,316 82.3%
East Asia & Oceania 33,178 89.7% 36,352 96.2% 41,206 99.7% 38,592 112.3% 34,619 104.3% 35,141 96.7% 47,239 114.6%
Southeast Asia 26,414 90.5% 24,704 92.3% 27,979 99.0% 23,168 88.2% 20,315 76.9% 23,375 94.6% 30,746 109.9%
Total 135,717 88.3% 137,668 92.5% 148,780 94.4% 134,648 95.7% 113,552 83.7% 120,002 87.2% 150,293 101.0%
*For APLL whose year-end is December, the above results are for 1Q (Jan. to Mar.), 2Q (Apr. to Jun.), 3Q (Jul. to Sept.), and 4Q (Oct. to Dec.).
Sea Freight Exports FY2019 FY2020
From1Q (Apr.-Jun.) 2Q (Jul.-Sep.) 3Q (Oct.-Dec.) 4Q (Jan.-Mar.) 1Q (Apr.-Jun.) 2Q (Jul.-Sep.) 3Q (Oct.-Dec.)Volume (TEUs) Y o Y Volume
(TEUs) Y o Y Volume (TEUs) Y o Y Volume
(TEUs) Y o Y Volume (TEUs) Y o Y Volume
(TEUs) Y o Y Weight (tons) Y o Y
Japan 34,095 88.7% 33,501 89.3% 35,630 89.2% 32,870 97.8% 32,160 94.3% 34,590 103.3% 43,908 123.3%
The Americas 12,752 97.2% 11,743 92.8% 10,035 90.2% 11,131 93.6% 10,692 83.8% 8,463 72.1% 8,069 80.4%
Europe, Middle East &
Africa4,624 99.3% 4,504 94.3% 4,404 91.0% 4,672 104.5% 3,774 81.6% 4,692 104.2% 4,802 109.0%
East Asia & Oceania 56,088 100.1% 60,528 102.2% 57,451 97.7% 46,412 88.6% 52,624 93.8% 58,689 97.0% 61,991 107.9%
Southeast Asia 38,042 94.9% 42,557 101.9% 43,585 99.6% 38,334 93.2% 30,327 79.7% 37,001 86.9% 43,807 100.5%
APLL* 16,852 71.6% 14,538 76.0% 16,709 74.5% 13,410 56.9% 10,621 63.0% 8,167 56.3% 13,282 79.5%
Total 162,453 92.6% 167,371 95.6% 167,814 92.8% 146,829 87.3% 140,198 86.3% 151,602 90.1% 175,860 104.8%

Kintetsu World Express, Inc.Website: https://www.kwe.co.jp/en/ir
* The information contained herein does not constitute an offer to solicit investment which can only be made by formal prospectus. The forward-looking statements contained herein are not intended to assure or guarantee future performance. Actual results may vary from that projected herein.