financial results of 2017 2nd quarterfinancial results of 2017 2q (2) numerical plan net sales and...
TRANSCRIPT

Financial Results of 2017 2nd Quarter
(Code 3001, TSE 1st section)
August 21, 2017

Financial Results of 2017 2QContents
2
1.Financial Highlights of 2017 2nd Quarter
Consolidated Income Statement
Consolidated Income Statement / Business Segment
Consolidated Balance Sheet
Consolidated Statement of Cash Flows
2.2017 Forecast
Consolidated Income Statement / Forecast
Consolidated Income Statement / Business Segment Forecast
Capital Expenditures, Depreciation and R&D Expenditures Forecast
3.Progress Report on “Katakura 2021”
4.Dividends and Dividend Policy

1.Financial Highlights of 2017 2nd Quarter
3
Financial Results of 2017 2QConsolidated Income Statement
4
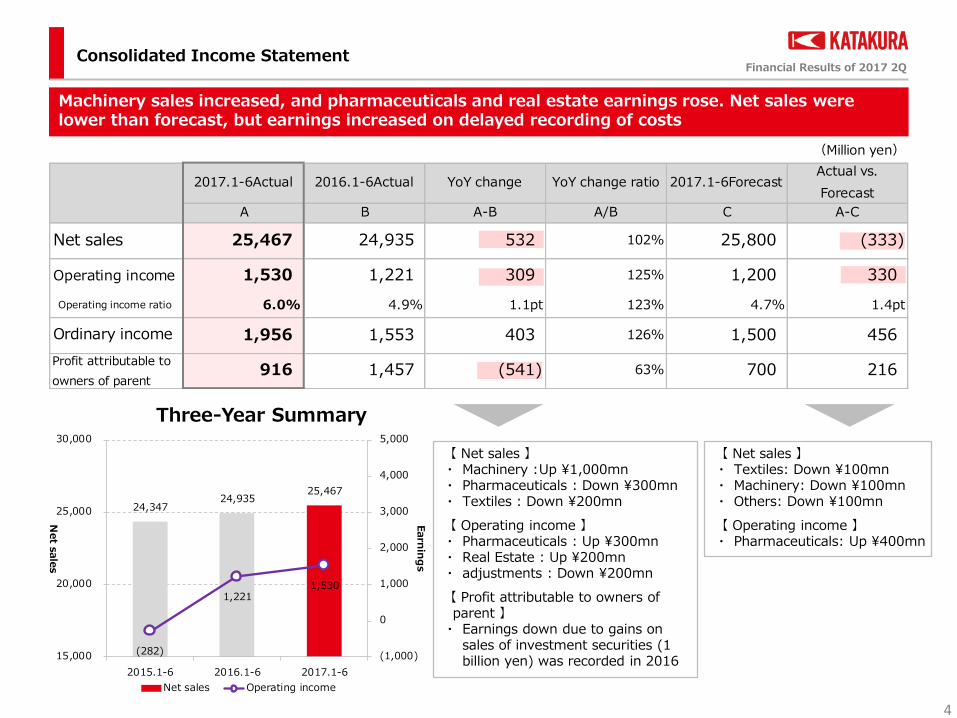
Machinery sales increased, and pharmaceuticals and real estate earnings rose. Net sales were lower than forecast, but earnings increased on delayed recording of costs
【 Net sales 】・ Machinery :Up ¥1,000mn・ Pharmaceuticals : Down ¥300mn・ Textiles : Down ¥200mn
【 Operating income 】・ Pharmaceuticals : Up ¥300mn・ Real Estate : Up ¥200mn・ adjustments : Down ¥200mn
【 Profit attributable to owners of parent 】
・ Earnings down due to gains on sales of investment securities (1 billion yen) was recorded in 2016
【 Net sales 】・ Textiles: Down ¥100mn・ Machinery: Down ¥100mn・ Others: Down ¥100mn
【 Operating income 】・ Pharmaceuticals: Up ¥400mn
24,347 24,935
25,467
(282)
1,221 1,530
(1,000)
0
1,000
2,000
3,000
4,000
5,000
15,000
20,000
25,000
30,000
2015.1-6 2016.1-6 2017.1-6
Earn
ing
s
Net s
ale
s
Three-Year Summary
Net sales Operating income
(Million yen)
2017.1-6Actual 2016.1-6Actual YoY change YoY change ratio 2017.1-6ForecastActual vs.
Forecast
A B A-B A/B C A-C
Net sales 25,467 24,935 532 102% 25,800 (333)
Operating income 1,530 1,221 309 125% 1,200 330
Operating income ratio 6.0% 4.9% 1.1pt 123% 4.7% 1.4pt
Ordinary income 1,956 1,553 403 126% 1,500 456
Profit attributable to
owners of parent916 1,457 (541) 63% 700 216

Financial Results of 2017 2QConsolidated Income Statement / Business Segment
5
①: Increase in earnings in pharmaceuticals
・ Increase due to research and development expenses (R&D) being delayed to 2H
②: Earnings increase in real estate
・ Increase due to repairs and other expenses being delayed to 2H
Textiles
17.7%
Pharmaceuti
cals
29.6%Machinery
27.3%
Real Estate
20.2%
Others
4.9%
New
businesses
0.3%
Business Segment Sales①: Significant sales growth in machinery
・ Increase in sales due to growth in orders for large-size pump trucks and chemicals vehicles but only slight growth in earnings because outsourcing expenses and other manufacturing costs were also higher
②: Lower sales but increase in earnings in pharmaceuticals
・ Decrease in sales due to decline in long-term listed drugs and in core Flandol tape in particular
・ Increase in earnings due to decreases in research and development expenses (R&D) and depreciation expenses, etc.
③: Lower sales and earnings in textiles・ Strong performance by functional fibers, but
sluggish sales of casual inners resulted in lower sales and earnings
2017.1-6Actual
①②③
※
①
②
※
※: Decreased earnings due to adjusted amount
・ Due to increase in retirement benefit expenses
(Million yen)
Net sales Operating income Net sales Operating income Net sales Operating income Net sales Operating income Net sales Operating income
Textiles 4,495 (57) 4,738 (24) (243) (33) 4,600 (100) (105) 43
Pharmaceuticals 7,530 513 7,858 223 (328) 290 7,500 100 30 413
Machinery 6,960 208 5,945 184 1,015 24 7,100 350 (140) (142)
Real Estate 5,141 1,778 5,037 1,626 104 152 5,100 1,600 41 178
Others 1,260 23 1,302 19 (42) 4 1,400 50 (140) (27)
New businesses 79 (172) 54 (236) 25 64 100 (150) (21) (22)
adjustments - (764) - (571) - (193) - (650) - (114)
25,467 1,530 24,935 1,221 532 309 25,800 1,200 (333) 330
2017.1-6Forecast
Total
2017.1-6Actual 2016.1-6Actual
A B A-B
YoY change
C A-C
Actual vs. Forecast

Financial Results of 2017 2QConsolidated Balance Sheet
6
・ Reduction in inventories due to shipments of fire enginesand other items
・ Down due to valuation
difference in market value of investment securities
(Million yen)
2017.6 2016.12 YoY change
A B A-B
51,941 54,228 (2,287)
87,986 90,430 (2,444)
50,769 51,509 (740)
1,208 1,350 (142)
36,008 37,570 (1,562)
Investment securities 33,173 34,635 (1,462)
139,928 144,659 (4,731)
61,233 65,752 (4,519)
Loans 19,012 19,649 (637)
Lease and guarantee deposits 9,823 9,810 13
Deferred tax liabilities 9,953 10,294 (341)
78,694 78,906 (212)
Valuation difference on available-for-sale securities 16,049 16,349 (300)
Non-controlling interest 22,818 23,337 (519)
139,928 144,659 (4,731)Total liabilities and net assets
Total net assets
Total liabilities
Investments and other assets
Total assets
Current assets
Non-current assets
Property,plant and equipment
Intangible assets

Financial Results of 2017 2Q
13,248
11,405
8,000
10,000
12,000
14,000
16,000
18,000
beginning of year Operating CF Investing CF Financing CF end of year
Cash Flows
Consolidated Statement of Cash Flows
7
【 Operating cash flows 】
・ Profit before income taxes: Up ¥1,600mn
・ Depreciation: Up ¥1,700mn
2,854(3,468)
(1,229)
(Million yen)
2017.1-6Actual 2016.1-6Actual
13,248 9,256
Operating cash flows 2,854 4,521
Investing cash flows (3,468) (2,421)
Financing cash flows (1,229) (4,634)
(1,843) (2,534)
11,405 6,722
Cash and cash equivalents at beginning of year
Net increase (decrease) in cash and cash equivalents
Cash and cash equivalents at end of year
【 Investing cash flows 】
・ Purchase of property, plant and equipment : Down ¥700mn
・ Transfers to time deposit of 3 months and over: Down ¥2,700mn
【 Financing cash flows 】
・ Repayments of short-term loans payable: Down ¥1,100mn
・ Increase in long-term loans payable: Up ¥500mn

Financial Results of 2017 2Qmemo
8

2.2017 Forecast
9

Financial Results of 2017 2QConsolidated Income Statement / Forecast
10
【 Net sales 】・ Machinery :Up ¥900mn・ Pharmaceuticals : Down ¥400mn
【 Operating income 】・ Real Estate : Up ¥200mn・ New businesses : Up ¥200mn・ Textiles : Up ¥200mn・ adjustments : Down ¥400mn
【 Profit attributable to owners of parent 】
・ Earnings down due to proceeds from sales of investment securities (¥1,200mn) in 2016
Increase in net sales and operating income compared to the previous term. Compared to initial forecast, real estate sales are favorable, but both net sales and earnings expected to decline
48,573 46,927 47,400
(190)
1,486 1,750
(300)
700
1,700
2,700
3,700
4,700
15,000
25,000
35,000
45,000
55,000
2015 2016 2017Revised Forecast
Earn
ing
s
Net s
ale
s
Three-Year Summary
Net sales Operating income
【 Net sales 】・ Pharmaceuticals : Down ¥300mn・ Others : Down ¥200mn
【 Operating income 】・ adjustments : Down ¥300mn
【 Ordinary income】・ As forecasted, due to increase in
miscellaneous income etc.
【 Profit attributable to owners of parent 】
・ Decline in earnings due to loss on disposal of non-current assets
(Million yen)
2017Revised
Forecast2016Actual YoY change YoY change ratio
2017Initial
ForecastDifference
A B A-B A/C C A-C
Net sales 47,400 46,927 473 101% 48,000 (600)
Operating income 1,750 1,486 264 118% 2,000 (250)
Operating income ratio 3.7% 3.2% 0.5pt 117% 4.2% (0.5)pt
Ordinary income 2,500 2,152 348 116% 2,500 0
Profit attributable to
owners of parent1,200 1,691 (491) 71% 1,300 (100)

Financial Results of 2017 2QConsolidated Income Statement / Business Segment Forecast
11
Textiles
19.8%
Pharmaceu
ticals
31.0%
Machinery
21.7%
Real Estate
21.7%
Others
5.3%
New
businesses
0.4%
Business Segment Sales
2017RevisedForecast
①: Decline sales but earnings as forecasted in pharmaceutical
・ Decrease in sales due to decline in long-term listed drugs but earnings expected in line with initial forecast due to decrease in research and development expenses (R&D) etc.
②: Increases in sales and earnings in real estate
・ Increased earnings expected due to decrease in repair expenses, etc.
①: Significant increase in sales but decline in earnings in machinery
・ Increase in sales due to growth in orders for large-size pump trucks and chemicals vehicles but decline in earnings because outsourcing expenses and other manufacturing costs are expected to be higher
②: Decrease in sales but earnings growth in pharmaceuticals
・ Decrease due to decline in long-term listed drugs etc.
・ Increase in earnings due to decrease in research and development expenses, depreciation expenses etc.
③: Decrease in sales but improvement forecasted in textiles
・ Decrease due to sluggish sales of casual innerwear but improvement forecasted on strong performance in functional fibers
①
②③
※
①
②
※
※: Decrease in earnings due to adjusted amount
・ Due to increase in retirement benefit expenses
(Million yen)
Net sales Operating income Net sales Operating income Net sales Operating income Net sales Operating income Net sales Operating income
Textiles 9,400 (100) 9,635 (250) (235) 150 9,500 (100) (100) 0
Pharmaceuticals 14,700 300 15,065 199 (365) 101 15,000 300 (300) 0
Machinery 10,300 50 9,412 88 888 (38) 10,300 150 0 (100)
Real Estate 10,300 3,400 10,188 3,176 112 224 10,200 3,200 100 200
Others 2,500 0 2,502 (27) (2) 27 2,700 100 (200) (100)
New businesses 200 (300) 124 (484) 76 184 300 (300) (100) 0
adjustments - (1,600) - (1,216) - (384) - (1,350) - (250)
47,400 1,750 46,927 1,486 473 264 48,000 2,000 (600) (250)
2017Revised Forecast
Total
A
2016Actual YoY change 2017Initial Forecast Difference
B A-B C A-C

Financial Results of 2017 2QCapital Expenditures, Depreciation and R&D Expenditures Forecast
12
①:Resulting from the
transfer of manufacturing and sales rights of a product in the pharmaceuticals in the previous fiscal year, etc.
①
(Million yen)
2017Revised
Forecast2016Actual YoY change
2017Initial
ForecastDifference
A B A-B C A-C
Real Estate 810 1,048 (238) 860 (50)
Other Segment 1,320 2,087 (767) 1,310 10
2,130 3,135 (1,005) 2,170 (40)
Pharmaceuticals 1,100 1,345 (245) 1,100 0
Real Estate 1,890 2,086 (196) 1,900 (10)
Other Segment 500 682 (182) 520 (20)
3,490 4,113 (623) 3,520 (30)
Pharmaceuticals 2,100 2,285 (185) 2,210 (110)
Other Segment 430 282 148 390 40
2,530 2,567 (37) 2,600 (70)
Capital expenditures
Depreciation
R&D Expenditures

3.Progress Report on “Katakura 2021”
13

Financial Results of 2017 2Q
Sustainable growth
(1) Fundamental Strategy
14
2012 2013 2014 2015 2016 2017 2018 2019 2020 2021 2023
Katakura 2016 Katakura 2021
■ Positioning of this plan
Transform Katakura
into a Growing Business
Create new
businesses
➣ Aim to become No. 1 in targeted domains by meeting diversifying customer needs
➣ Build a stronger profit structure by reexamining our current businesses and shifting
resources to growing businesses
➣ Target opportunities in the markets of emerging countries
➣ Leverage synergies across our current businesses to create new businesses
➣ Supply innovative products and services by meeting people’s latent needs in order to
create growing businesses
➣ Use a long-term perspective to create activities that can become the new core businesses
of Katakura GroupBeloved
bicentennial company
Create new businesses
Transform Katakura into a Growing Business Structural
reform
Laying foundation to
become a beloved
bicentennial company
the 150th anniversary

Financial Results of 2017 2Q(2) Numerical Plan Net Sales and Operating Income by Segment
15
Katakura 2021Katakura 2016
(Million yen)
2017~2021
Plan
Real Estate 18,000
Other Segment 7,000
25,000
Real Estate 8,500
Pharmaceuticals 4,500
Other Segment 3,000
16,000
Pharmaceuticals 10,000
Other Segment 2,000
12,000
Capital expenditures
Depreciation
R&D Expenditures
<5-year capital expenditures etc.>
(Million yen)
2016 2017 2021
Actual Forecast Plan
Textiles 9,635 9,400 11,500
Pharmaceuticals 15,065 14,700 15,200
Machinery 9,412 10,300 13,000
Real Estate 10,188 10,300 10,800
Others 2,502 2,500 4,100
New businesses 124 200 2,000
46,927 47,400 56,600
(Million yen)
2016 2017 2021
Actual Forecast Plan
Textiles (250) (100) 500
Pharmaceuticals 199 300 1,200
Machinery 88 50 400
Real Estate 3,176 3,400 4,000
Others (27) 0 200
New businesses (484) (300) 100
adjustments (1,216) (1,600) (1,200)
1,486 1,750 5,200
Net sales
Operating income

Financial Results of 2017 2Q
(2) Numerical PlanBusiness Foundation Supporting New Medium-term Management Plan
16
Complete structural reforms of unprofitable businesses by the end of
FY2018, taking downsizing or withdrawal into account
Expand business fields for further growth in continually growing businesses
Aim to create the group’s new core businesses in the strategic priority fields,
integrating management resources of each segment while actively using
alliances and M&A with other companies
①
②
③ Senior Care, Welfare and Health
Agriculture and Environment
Disaster prevention and Security
High value-added Fabric
New businesses in Saitama Shintoshin Area

Financial Results of 2017 2Q(3) Business Segment Reports Textiles
17
■ Strategic initiatives & Progress Report
■ Numerical Plan
Develop new national brands based on natural materials
Strengthen competitiveness by rebuilding functions
Strategic
initiatives
Progress
Report
New national brands
・ Introduced "Katakura Silk" brand entirely and
exclusively dedicated to silk
・ Expansion of sales of new "Care Cotton" basic skin
care product
Structural Reform of Business・ Shrinking low-profit margin products
・ Review of physical distribution expenses
・ Common operating system for 3 practical utility
clothing companies
Nitivy ALF™
<Practical Clothing>
Develop new high-functional materials and application of heat-resistant fibers
Strategic
initiatives
Progress
Report
Work on developing new varieties of alumina long fibers
Started study of a grand design for a manufacturing facility
<Functional fibers>
CARE COTTON
(Million yen)
2016 2017 2021 Progress
Actual Forecast Plan
Net sales 9,635 9,400 11,500 82%
Practical clothing 7,831 7,500 9,500 79%
functional fibers 1,804 1,900 2,000 95%
Operating income (250) (100) 500 -
Operating income ratio - - 4.3% -
High value-added Fabric
High value-added Fabric

Financial Results of 2017 2Q
18
(3) Business Segment Reports Textiles 【Topics】
■Premium line released (March 27)
New brand "Katakura Silk" on sale, pop-up sales at department stores nationwide

Financial Results of 2017 2Q(3) Business Segment Reports Pharmaceuticals
19
■ Strategic initiatives & Progress Report
Progress
Report
Enter into a neighboring field of kidney and dialysis
Focus on generic drugs
Efficient R&D of new drugs by using licensing methods
Strengthen successions and co-promotions (sales alliances)
■ Numerical Plan
Strategic
initiatives
Engaging with sales growth of Bisono Tape・ Addition of chronic atrial fibrillation indication, improvement of
formulation (Application for approval is planned in 2018)
Expansion of range of items - mainly for generic products・ Applications for approval of 3 items in cardiovascular field, kidney and
dialysis fields are underway・ Applications for multiple items from next term are in progress
Reviewing the organizational structure to respond to regional strategy/product strategy transformation
Hypertension treatment drug” Bisono Tape “
(Sales started in September 2013)
A treatment for arrhythmia ” Cibenol ” etc.
(Million yen)
2016 2017 2021 Progress
Actual Forecast Plan
Net sales 15,065 14,700 15,200 97%
Operating income 199 300 1,200 25%
Operating income ratio 1.3% 2.0% 7.9% -
R&D Expenditures 2,285 2,100 10,000 (5 years)

Financial Results of 2017 2Q(3) Business Segment Reports Machinery
20
■ Strategic initiatives & Progress Report
Progress
Report
Improve functions of fire engines and expand a neighboring field
Expands the Vowcan series and enter into the disaster prevention field
Develops specially-equipped vehicles using outfitting technologies
Advance into overseas markets mainly in Asia
■ Numerical Plan
Strategic
initiatives
Expand business
・ Established a new company providing maintenance services to power
companies (April) We are considering business collaborations with other
companies so as to be able to expand into peripheral fields
Exhibited at the "66th Tone River Water System Association· Comprehensive Flood Control Exercise"
The Large-capacity submersible pump system “Vowcan”
Fire truck with a ladder
(Million yen)
2016 2017 2021 Progress
Actual Forecast Plan
Net sales 9,412 10,300 13,000 79%
Operating income 88 50 400 13%
Operating income ratio 0.9% 0.5% 3.1% -
Disaster prevention and safety

Financial Results of 2017 2Q(3) Business Segment Reports Real Estate
21
■ Strategic initiatives & Progress Report
Progress
Report
Starts Stage 3 development Expand businesses from the
standpoint of community creation
■ Numerical Plan
Strategic
initiatives
Stage 3 development
・ Considering a development plan for the
entire site of the Saitama Shintoshin Area
Measures to enhancing the value of
the area
・ Cooperation with peripheral businesses,
particularly the "Saitama Shintoshin
Development Promotion Council"
<Saitama Shintoshin community creation> <Acquisition of new land for development>
Searching for real estate properties, mainly concentrating on commercial development (shopping centers, etc.) in the Tokyo metropolitan area (including Saitama Shintoshin), and business development (office buildings, etc.)
Investment in new acquisition: 10,000 million yen(2017-2021)
Acquisition of new land for
development
Strategic
initiatives
Progress
Report
COCOON City “ COCOON2 “(Opened on April , 2015 )
(Million yen)
2016 2017 2021 Progress
Actual Forecast Plan
Net sales 10,188 10,300 10,800 95%
Operating income 3,176 3,400 4,000 85%
Operating income ratio 31.2% 33.0% 37.0% -
Depreciation 2,086 1,890 8,500 (5 years)

Financial Results of 2017 2Q(3) Business Segment Reports Real Estate
22
■ Saitama Shintoshin Ekimae Company-owned LandThe entire company-owned land : About 147,000㎡
(The area of each sector does not include public streets.)
a
b
c d
e
h
f
gi
j
kl
Japan Mint ・Museum Saitama Shintoshin Station
Saitama Super Arena
●
JR Saitama Shintoshin building
●
Land Axis Tower
●
Saitama Red Cross HospitalSaitama Children's Medical Center
●
NTT DOCOMO Saitama building
●
Government office complex
● ●
Omiya Police Station(scheduled for fall 2017)
Stage 1 development
Land areaAbout 33,000㎡
Stage 2 development
Land areaAbout 68,000㎡
a. COCOON1 b. COCOON2 c. COCOON3 d. Park side building e. Lexus Saitama Shintoshin f. Volkswagen Saitama Shintoshin g. cocoon athletics
h. Garden Hills Geihinkan i. COCOON City Housing exhibition space j. Office building k. Nursing care facility [Nichii Gakkan] l. convenience store

Financial Results of 2017 2Q
Recruiting members for Yoga Studio & Bouldering (Rock Climbing) Gym which
opens for business in September
23
(3) Business Segment Reports Real Estate 【Topics】
■ Facility Outline
*The picture is an image
Housing-type fee-based nursing home opened in July
・ Saitama prefecture's first indoor & outdoor hybrid sports club・ Offering services such as yoga, bouldering (rock climbing),
run & walk, café, etc.
・ Revenue form: Usage charge revenue
・ Facility name: cocoon athletics
・ Operator: BEACH TOWN CORPORATION, Primary contractor: Katakura Industries Co., Ltd.
■ Facility Outline
・ Revenue form: Building rental (52 rooms in total)
・ Facility name: Granda Inokashira Park
・ Operator: Benesse Style Care Co., Ltd.
・ Developed former site (about 2,670 m²) of company-owned housing in Mitaka City, Tokyo
New businesses in Saitama Shintoshin Area Senior Care, Welfare and Health

Financial Results of 2017 2Q(3) Business Segment Reports New businesses
24
Two senior day care service
facilities in Tokyo
”Kinumitsu“cosmeticsFacial soap
Cleansing oilLotion
All in one gel
Low-potassium lettuce
Cauliflower fungus
“Hanaka”
Expand the business of nursing care services and develop and expand sales of equipment for senior care and welfare
Expand the product lineup in cosmetics field and advance into healthy food field
Develop and expand sales of high value-added vegetables and establish a mass production system at plant factories
■ Numerical Plan
Progress
Report
Strategic
initiatives
■ Strategic initiatives & Progress Report
Making every effort toward early monetization
Striving towards expansion of business scale
・ “e-anza" new model released for sale
・ Expanding product lineup and sales channels
(Million yen)
2016 2017 2021 Progress
Actual Forecast Plan
Net sales 124 200 2,000 10%
Operating income (484) (300) 100 -
Operating income ratio - - 5.0% -
Senior Care, Welfare and Health
Agriculture and Environment
Sale of toilet seats designed for ostomates

Financial Results of 2017 2Q
Released “e-anza" wide-front toilet seat new model (July 5), Introduction at all stores of a major drugstore chain decided on
25
(3) Business Segment Reports New businesses 【Topics】
Welcia Pharmacy, Nihonbashi Store 1/ B.B.ON Nihonbashi
Introduction examples(As of June 2017)
<Hospitals> ・ The University of Tokyo Hospital (Tokyo)・ Totsuka Kyouritsu Daini Hospital (Kanagawa)・ Hidaka Hospital (Gunma)
<Parks> ・ Higashimatsudo Yuinohana Park (Chiba)<Commercial facilities>
・ COCOON City (Saitama, Operator : Katakura Industries Co., Ltd.)
・ atre Omori (Tokyo, Operator : Atré Co. Ltd.)・ Tradepia Odaiba (Tokyo, Operator : Ichigo)・ Matsudo Nanbu Wholesale Market (Chiba,
Operator : Ichigo)・ Miyako City (Miyazaki, Operator : Ichigo)
■ Introduction proceeding after the release in November 2015
■Product feature
image Huge burden on legs and hips in half-
rising posture.

Financial Results of 2017 2Q(4) Approach to ESG (*)
26(*) Environment, Social and Governance
Held “Saitama Uchimizu (watering) Big Operation 2017" in co-sponsorship
with civic groups and administrative organizations in COCOON City
Uchimizu at the COCOON Square
About 300 people participated in the event
【 Environment&Social 】

4.Dividends and Dividend Policy
27
Financial Results of 2017 2QDividends and Dividend Policy
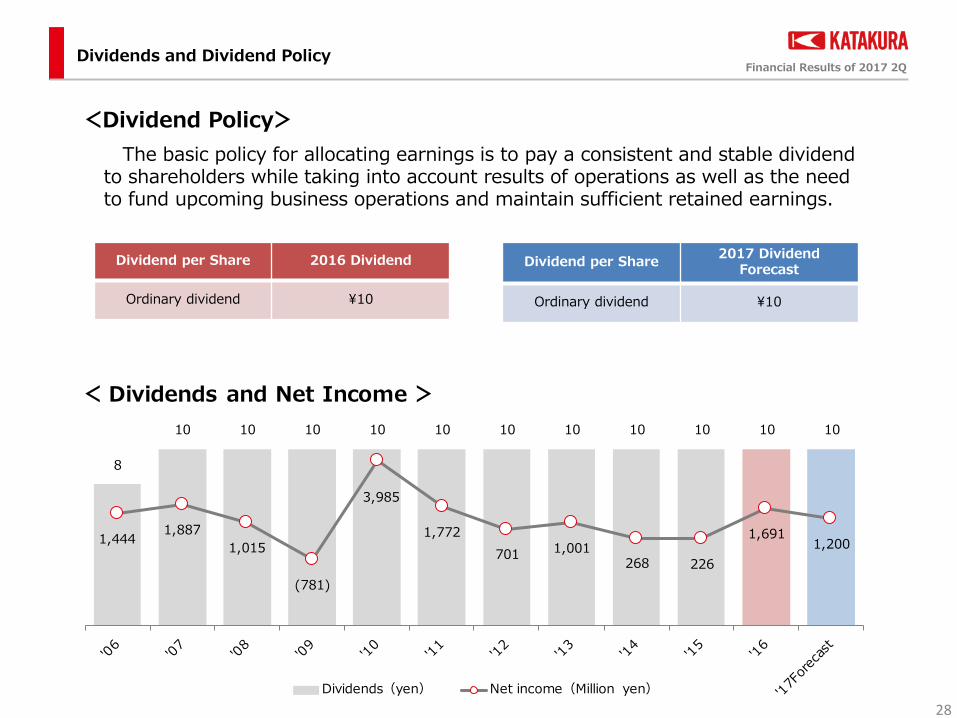
Dividend per Share 2016 Dividend
Ordinary dividend ¥10
28
<Dividend Policy>
Dividend per Share 2017 Dividend
Forecast
Ordinary dividend ¥10
8
10 10 10 10 10 10 10 10 10 10 10
1,444 1,887
1,015
(781)
3,985
1,772
701 1,001 268 226
1,691 1,200
< Dividends and Net Income >
Dividends(yen) Net income(Million yen)
The basic policy for allocating earnings is to pay a consistent and stable dividend to shareholders while taking into account results of operations as well as the need to fund upcoming business operations and maintain sufficient retained earnings.
Supplementary Information
29

Financial Results of 2017 2Q《Supplementary Information①》 The Source of Katakura’s Diversification
30
Raw silk Production Silk thread research Manufacture of silk reeling machines
Thread factories
Founded 1873
Established 1920
Silk thread production Raw silk Ownership of Tomioka Silk Mill
1939-2005 (66 years)
Carrying on the tradition of raw silk production
Innovating originating from research to create outstanding silk products
Utilizing know-how for the internal development of manufacturing equipment
Utilizing the former sites of thread factories
Textiles Pharmaceuticals Machinery Real Estate
ApparelManufacture and sale of underwear and socks
Ogran Japan Co., Ltd. Manufacture and sale of casual innerwear
Kafulas Co., Ltd.Manufacture and sale of foundation undergarments
Toa Eiyo Ltd.Manufacture and sale of prescription drugs
MechatronicsManufacture and sale of automotive parts and other products
Nihon Kikai Kogyo Co., Ltd.Manufacture and sale of fire engines
Katakura Machinery Industries Co., Ltd.Manufacture and sale of agricultural machinery
Commercial FacilitiesOperation of shopping centers,
real estate leasing
Real Estate Development BusinessDevelopment and use of company-owned land
Others
Bioscience Research CenterProduction and sale of insect pollinators and other products
Katakura Caron Service Corp.Building cleaning and maintenance services
Retailing BusinessOperation of home improvement centers
Others
Nitivy Co., Ltd.Manufacture and sale of functional fibers

Financial Results of 2017 2Q《Supplementary Information②》 The Business Activities of Katakura Group
31
Pharmaceuticals Machinery
Real Estate Others
Textiles
Apparel Ogran Japan Co., Ltd. Kafulas Co., Ltd. Nitivy Co., Ltd.
Toa Eiyo Ltd. Mechatronics Nihon Kikai Kogyo Co., Ltd.Katakura Machinery Industries Co., Ltd.
Commercial Facilities
Real Estate Development Retailing
Bioscience Research Center
Katakura Caron Service Corp.
Silk innerwearNursing care underwear
Licensed products Support undergarments Alumina fiber yarn(fire resistant)
Three-way valve
Vibration bubbling cleanser
Fire engines
Two-wheel power tiller
Tokyo Square Garden COCOON City
New Life Katakura Mulberry Garden
Cross-fertilization honeybee products
Building maintenance
Fire truck with a ladder

Financial Results of 2017 2Q
<Disclaimer >
Sales and earnings forecasts and other forward-looking statements in this document are based on the economic
forecast and other current assumptions. These statements are not guarantees or promises regarding future
performance. Furthermore, forecasts may be revised at any time without prior notice.
Katakura has exercised care to be certain that all information in this document is correct. However, Katakura
assumes no responsibility whatsoever for any errors in this information.
<Contact information>
Hideaki Mori (Manager) / Nobuyuki Kikuchi
PR・IR Office, Corporate Planning Dept.
Katakura Industries Co., Ltd.
URL: http://www.katakura.co.jp/
Address: 6-4 Akashi-cho, Chuo-ku, Tokyo 104-8312
Tel : 03-6832-0223
Fax: 03-6832-0282
World Heritage Site "Tomioka Silk Mill"
Special WEB page "history walked the Katakura and Tomioka Silk Mill"
http://www.katakura.co.jp/tomioka.htm
32