financial results for the fiscal year 2015 second quarter · financial results for the fiscal year...
TRANSCRIPT

Financial Results for the Fiscal Year 2015 Second Quarter
http://www.star-m.jp
* The projections in this document are based on information available at the time of release of this report and certain assumptions the Company considers reasonable. The Company does not promise that these projections will be achieved. Actual results may differ materially from projections due to a variety of factors.
Code 7718 September 30, 2014

1
Contents
■Overview of Fiscal 2015 Second Quarter P2 ■Financial Data P3 ■Segment Overview
・Special Products P4 ・Machine Tools P5 ・Precision Products P6
■Operating Income by Segment P7 ■Capital Investment P8 ■Balance Sheets P9 ■Cash Flows/Other P10 ■Shareholder Returns P11 ■Performance Indicators (10-Year Data) P12 ■Reference: Business Segments and Products P13

Overview of Fiscal 2015 Second Quarter
2
■Net Sales : ¥22.84 billion 18.6% up YoY ■Operating Income: ¥2.30 billion 363.1% up YoY ■Ordinary Income : ¥2.50 billion 200.3% up YoY ■Net Income : ¥2.11 billion 831.4% up YoY
Substantially higher earnings on sales growth compared with
the same period last year.
Due also to the yen weakening, sales increased across all business segments, centered on machine tools. Operating income and ordinary income increased substantially on the back of increased sales. Net income rose sharply, partly due to a decrease in income taxes following the recording of deferred tax assets.

Second Quarter Full-Year
2Q for FY2/14 Actual
2Q for FY2/15 Actual
FY2/14 Actual
FY2/15 Forecast
Amount Income
Ratio (%) Amount Income
Ratio (%) YoY
Change (%) Amount Income
Ratio (%) Amount Income
Ratio (%) YoY
Change (%)
Sales
Special Products 4,241 5,598 32.0 9,455 11,290 19.4
Machine Tools 11,774 14,923 26.8 26,969 32,760 21.5
Precision Products 1,808 2,320 28.3 3,891 4,550 16.9
Micro Audio Components 1,429 - - 3,166 - -
Total 19,254 22,843 18.6 43,481 48,600 11.8
Operating Income
Special Products 249 5.9 946 16.9 279.8 975 10.3 1,740 15.4 78.3
Machine Tools 1,304 11.1 2,174 14.6 66.6 3,597 13.3 5,130 15.7 42.6
Precision Products 30 1.7 334 14.4 997.9 140 3.6 610 13.4 335.2
Micro Audio Components 29 2.0 - - - 143 4.5 - - -
Eliminations or Corporate (1,115) (1,147) (2,250) (2,280)
Total 498 2.6 2,307 10.1 363.1 2,606 6.0 5,200 10.7 99.5
Ordinary Income 833 4.3 2,503 11.0 200.3 3,219 7.4 5,500 11.3 70.8
Net Income 227 1.2 2,115 9.3 831.4 1,143 2.6 4,400 9.1 284.9
ROE (%) - - 2.7 9.7
Cash Dividends Applicable to the Year ¥17 ¥19 ¥34 ¥38
DOE (%) - - 3.4 3.5
*ROE(Return on Equity) =Net Income/Shareholders' Equity (average for the beginning and end of the period)x 100(%)
Full-Year 2nd Half Assumed
Exchange Rate Assumed
Exchange Rate Foreign exchange
sensitivity
Exchange Rate
US$ ¥ 95.59 ¥102.47 ¥ 97.65 ¥101.24 ¥100.00 ¥3 million
EUR ¥125.50 ¥140.43 ¥129.69 ¥137.71 ¥135.00 ¥22 million
GBP ¥147.39 ¥171.02 ¥152.71 ¥168.01 ¥165.00 ¥ 4 million
CHF ¥102.01 ¥114.97 ¥105.36 ¥112.48 ¥110.00 ¥17 million 3
(Millions of Yen)
*DOE(Dividend on Equity) =The ratio of the non-consolidated dividend per common share (annual) /consolidated net assets per share(year average)x 100(%)
Financial Data
*Foreign exchange sensitivity: Sensitivity of operating income to a ¥1 change in foreign exchange rates.

Sales Volume by POS Printers Type
Special Products
・In the U.S. and Japanese markets, sales centered on applications for payment systems using smartphones and tablets (mobile POS system) were strong. Sales also grew in the European market alongside the economic recovery.
・In the Asian market, sales of dot-matrix printers increased in China .
Sales
Sales Volume by Region
4
( )2Q Actual
( )2Q Actual
( )2Q Actual
Dot Matrix
Thermal and Others
Dot Matrix
Thermal and Others
America Europe Asia Japan and exports, etc.
2,000
4,000
6,000
8,000
10,000
12,000
1,796
6,009
7,806
FY2/12
1,338
6,467
7,806
FY2/13
1,460 (648)
7,994 (3,593)
9,455 (4,241)
FY2/14
1,944 (936)
9,345 (4,662)
11,290 (5,598)
FY2/15(Est.) 0
(Millions of Yen)
200
400
600
241
299
541
FY2/12
178
340
519
FY2/13
128 (60)
353 (161)
481 (221)
FY2/14
145 (72)
423 (213)
568 (285)
FY2/15(Est.) 0
(Thousand Units)
200
400
600
31
135
132
241
541
FY2/12
46
116
128
229
519
FY2/13
40 (17)
82 (37)
127 (60)
231 (106)
481 (221)
FY2/14
54 (29)
99 (50)
144 (66)
270 (138)
568 (285)
FY2/15(Est.) 0
(Thousand Units)

Machine Tools Sales Volume by Region
Sales by Region
Sales
5
( )2Q Actual
( )2Q Actual
( )2Q Actual
Overseas
Domestic
America Asia
Domestic Europe
America Asia
Domestic Europe
10,000
20,000
30,000
40,000
4,088
22,551
26,639
FY2/12
3,756
19,140
22,897
FY2/13
(1,475)
23,077 (10,298)
26,969 (11,774)
FY2/14
5,108 (2,433)
27,651 (12,489)
32,760 (14,923)
FY2/15(Est.) 0
(Millions of Yen)
3,891
500
1,000
1,500
2,000
2,500
374
715
355
533
1,977
FY2/12
353
519
328
637
1,837
FY2/13
351 (127)
526 (222)
308 (137)
699 (368)
1,884 (854)
FY2/14
432 (213)
703 (305)
248 (108)
1,031 (491)
2,414 (1,117)
FY2/15(Est.) 0
(Units)
10,000
20,000
30,000
40,000
4,088
12,028
6,353
4,169
26,639
FY2/12
3,756
8,714
6,042
4,383
22,897
FY2/13 (1,475)
10,671 (4,428)
7,141 (3,194)
5,264 (2,674)
26,969 (11,774)
FY2/14
5,108 (2,433)
14,397 (6,366)
5,601 (2,583)
7,652 (3,540)
32,760 (14,923)
FY2/15(Est.) 0
(Millions of Yen)
3,891
・Sales in the European market, increased sharply, reflecting solid sales amid a continuing recovery in orders from summer last year, mainly in the automotive-related sector.
・Sales in the U.S. market declined year on year, primarily due to sluggish sales in the mainstay medical equipment-related sector.
・Sales increased substantially in the Asian market, with strong sales in the automobile-, communications-, and medical equipment-related sectors in East Asia.
・Sales increased significantly in the Japanese market, reflecting strong sales primarily in the automotive-related sector.

Sales of Non-wristwatch Components
Precision Products
Sales
・ Sales of wristwatch components increased markedly due to strong sales to wristwatch makers.
・ In non-wristwatch components, overseas sales were brisk for components for hard disk drives (HDDs), air conditioning-related components, and medical equipment-related components, with sales centered on automotive-related components. Consequently, overall sales in non-wristwatch components increased year on year.
6
Wristwatch Components
Non-wristwatch Components
Others Medical Air Conditioning Automotive HDD
( )2Q Actual
( )2Q Actual
1,000
2,000
3,000
4,000
5,000
1,881
2,381
4,263
FY2/12
1,652
2,269
3,922
FY2/13
1,363 (580)
2,528 (1,227)
3,891 (1,808)
FY2/14
1,773 (886)
2,776 (1,434)
4,550 (2,320)
FY2/15(Est.) 0
(Millions of Yen)
1,000
2,000
3,000
641
914
290
425
2,381
FY2/12
597
841
288 170
370
2,269
FY2/13
575 (263)
932 (453)
486 (255)
(46)
440 (208)
2,528 (1,227)
FY2/14
564 (288)
986 (515)
499 (296)
228 (96)
497 (236)
2,776 (1,434)
FY2/15(Est.) 0
(Millions of Yen)
110 92
Micro Audio Components
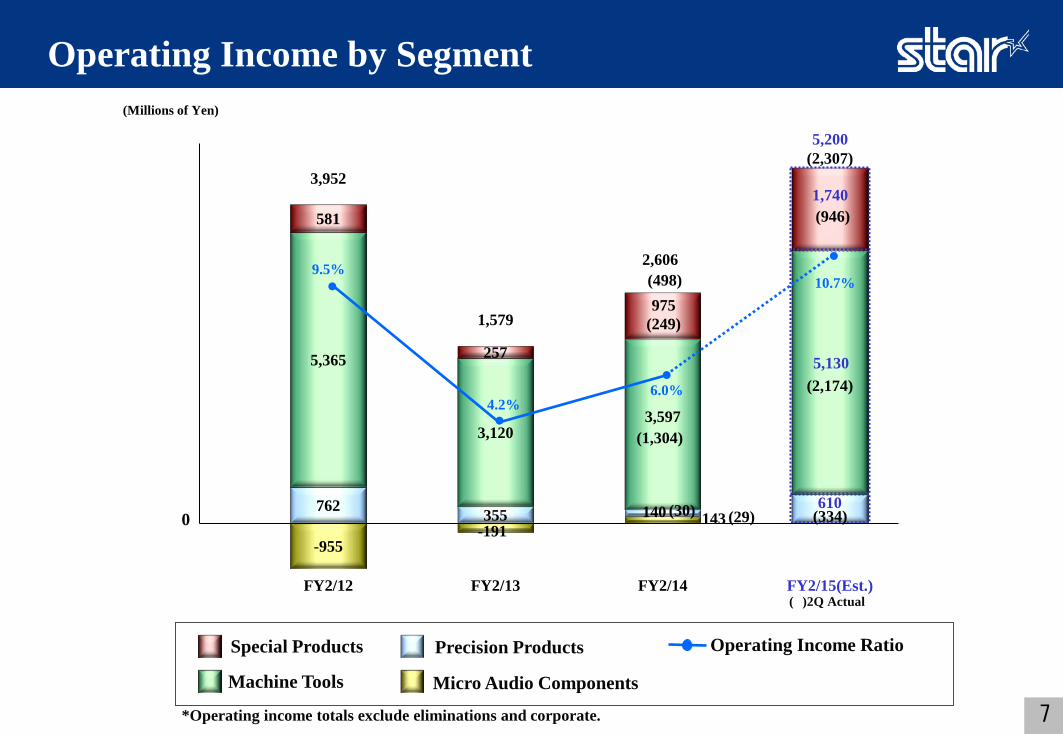
Operating Income by Segment
7
Operating Income Ratio Special Products
Machine Tools
Precision Products
*Operating income totals exclude eliminations and corporate.
( )2Q Actual
0 762
5,365
581
-955
3,952
FY2/12
355
3,120
257
1,579
FY2/13
(29)
3,597 (1,304)
975 (249)
2,606
FY2/14
(498)
610 (334)
5,130 (2,174)
1,740 (946)
5,200
FY2/15(Est.)
(2,307)
(Millions of Yen)
9.5%
4.2% 6.0%
10.7%
140 143 -191
(30)
Micro Audio Components Depreciation
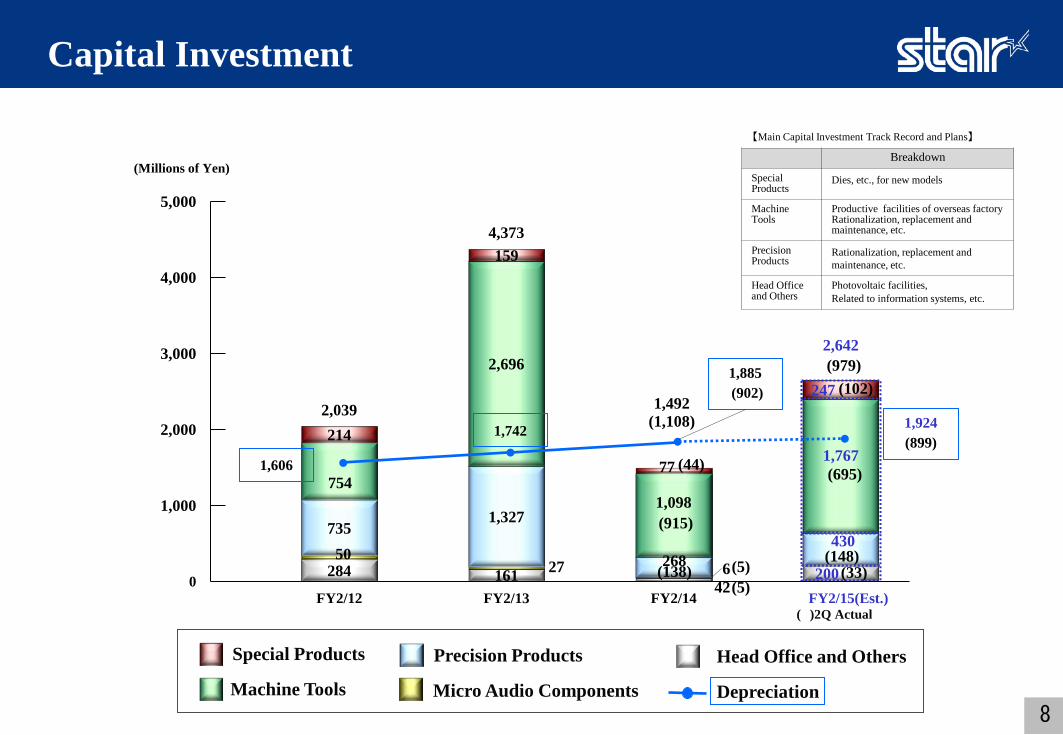
Capital Investment
8
Special Products
Machine Tools
Precision Products Head Office and Others
Breakdown
Special Products
Dies, etc., for new models
Machine Tools
Productive facilities of overseas factory Rationalization, replacement and maintenance, etc.
Precision Products
Rationalization, replacement and maintenance, etc.
Head Office and Others
Photovoltaic facilities, Related to information systems, etc.
( )2Q Actual
【Main Capital Investment Track Record and Plans】
FY2/14
1,000
2,000
3,000
4,000
5,000
284
735
754
214 2,039
FY2/12
1,327
2,696
159 4,373
FY2/13 42 (5) 6 (5) (138)
1,098 (915)
77 (44)
1,492 (1,108)
200 (33)
430 (148)
1,767 (695)
247 (102)
2,642 (979)
FY2/15(Est.) 0
(Millions of Yen)
1,606
1,742
1,885 (902)
1,924 (899)
50 27 161
268

Balance Sheets
9
Feb.2012 Actual Feb.2013 Actual Feb.2014 Actual Feb.2015 Forecast
Amount Component percentages Amount
Component percentages Amount
Component percentages Amount
Component percentages
Assets
Cash and deposit 15,640 30% 13,987 27% 15,279 26% 15,400 24%
Trade notes and accounts receivable 9,849 19% 9,148 17% 12,115 20% 13,900 22%
Inventories 11,378 22% 11,398 22% 12,748 22% 14,300 23%
Other current assets 1,433 3% 1,291 2% 1,089 2% 1,300 2%
Total current assets 38,302 74% 35,826 68% 41,232 70% 44,900 71%
Property, plant and equipment 10,289 20% 13,476 26% 14,326 24% 14,400 23%
Other fixed assets 3,333 6% 3,261 6% 3,742 6% 3,700 6%
Total fixed assets 13,622 26% 16,737 32% 18,069 30% 18,100 29%
Total assets 51,924 100% 52,564 100% 59,302 100% 63,000 100%
Liabilities
Trade notes and accounts payable 7,554 14% 5,281 10% 5,651 10% 6,700 11%
Short-term debt 2,000 4% 2,000 4% 2,000 3% 2,000 3%
Other current liabilities 4,983 10% 4,269 8% 5,428 9% 7,065 11%
Total current liabilities 14,538 28% 11,550 22% 13,080 22% 15,765 25%
Total long-term liabilities 406 1% 303 1% 523 1% 800 1%
Total liabilities 14,944 29% 11,854 23% 13,604 23% 16,565 26%
Net assets Total net assets 36,980 71% 40,710 77% 45,697 77% 46,435 74%
Total liabilities and net assets 51,924 100% 52,564 100% 59,302 100% 63,000 100%
(Millions of Yen)

Cash Flows/Other
10
Cash Flows (Millions of Yen)
Feb.2012 Actual
Feb.2013 Actual
Feb.2014 Actual
Feb.2015 Forecast
Net cash provided by operating activities 4,466 483 2,596 4,000
Net cash used in investing activities (393) (1,907) (2,455) (1,300)
Free cash flow 4,073 (1,424) 141 2,700
Net cash used in financing activities (2,092) (1,201) (1,394) (1,600)
Cash and cash equivalents at end of year 14,735 13,198 14,080 14,500 ※The year-end balance of cash and cash equivalents shown here differs from the cash and cash equivalents shown in the balance sheets, mainly because it does not include time deposits over 3-month period.
Financial Benchmarks Feb.2012
Actual Feb.2013
Actual Feb.2014
Actual Feb.2015 Forecast
Total asset turnover 0.8 times 0.7 times 0.8 times 0.8 times
Equity ratio 70.2% 76.1% 75.5% 72.3%
Return on equity(ROE) 6.7% 6.0% 2.7% 9.7%
Return on assets(ROA) 8.0% 4.3% 5.8% 9.0%
Earnings per share(EPS) ¥56.94 ¥54.66 ¥27.17 ¥104.40
Book value per share(BPS) ¥866.94 ¥951.14 ¥1,063.52 ¥1,080.97
Dividend on equity (DOE) 3.0% 3.3% 3.4% 3.5%
Research and Development Costs
(Millions of Yen)
Feb.2012 Actual
Feb.2013 Actual
Feb.2014 Actual
Feb.2015 Forecast
R&D costs 1,807 1,894 1,946 1,866

Shareholder Returns
11
■Medium-term Targets ・Consolidated dividend payout ratio : 40% or more ・Dividend on equity : 4.5% or more
Year-end dividend per share Interim dividend per share
DOE
10
20
30
40
13
13
26 (Dividend payout ratio 45.7%)
FY2/12
15
15
30 (Dividend payout ratio 54.9%)
FY2/13
17
17
34 (Dividend payout ratio 125.1%)
FY2/14
19
19
38 (Dividend payout ratio 36.4%)
FY2/15(Est.) 0
(Yen)
3.0% 3.3% 3.4% 3.5%

Performance Indicators (10-Year Data)
12
Net Sales (Millions of Yen)
Operating Income
(Millions of Yen)
Ordinary Income
(Millions of Yen)
Net Income (Millions of Yen)
EPS (Yen)
ROE (%)
DOE (%)
Dividends Per Share
(Yen) Income
Ratio(%) Income
Ratio(%) Income
Ratio(%)
FY2/05 49,689 6,343 12.8 6,357 12.8 3,775 7.6 70.13 8.2 1.7 15.0
FY2/06 54,788 8,108 14.8 8,386 15.3 5,151 9.4 95.60 10.1 2.2 21.0
FY2/07 62,670 10,444 16.7 10,862 17.3 7,012 11.2 131.09 12.2 3.0 32.0
FY2/08 73,883 14,651 19.8 15,170 20.5 8,080 10.9 150.74 12.8 4.7 56.0
FY2/09 56,952 8,544 15.0 8,923 15.7 4,338 7.6 85.66 7.3 3.8 45.0
FY2/10 29,180 (3,984) - (3,884) - (8,555) - (187.95) - 2.2 22.0
FY2/11 35,717 1,428 4.0 1,194 3.3 161 0.5 3.71 0.4 2.5 22.0
FY2/12 41,654 3,952 9.5 4,025 9.7 2,426 5.8 56.94 6.7 3.0 26.0
FY2/13 37,858 1,579 4.2 2,254 6.0 2,299 6.1 54.66 6.0 3.3 30.0
FY2/14 43,481 2,606 6.0 3,219 7.4 1,143 2.6 27.17 2.7 3.4 34.0
FY2/15(Est.) 48,600 5,200 10.7 5,500 11.3 4,400 9.1 104.40 9.7 3.5 38.0

CNC Swiss Type Automatic Lathe SV-38R
13
POS Printer TSP100ECO
Special Products
Machine Tools
Reference:Business Segments and Products
Card Reader/Writer TCP300Ⅱ
Mobile Printer SM-S210i
Wristwatch Components
(Automotive Components)
Non-Wristwatch Components (Automotive, Air Conditioning, HDD and Medical Components)
Precision Products
CNC Swiss Type Automatic Lathe ST-20
CNC Swiss Type Automatic Lathe SW-12RII