financial results for q4 2019 and full year 2019
TRANSCRIPT

Financial Results for Q4 2019 and Full Year 2019
January 23, 2020

This presentation contains forward-looking statements regarding Teradyne’s future business prospects, results of operations, market conditions, earnings per share, the payment of a quarterly dividend, the repurchase of Teradyne common stock pursuant to a share repurchase program, use of proceeds and potential dilution from the senior convertible notes offering, and the impact of the U.S. export and tariff laws. Such statements are based on the current assumptions and expectations of Teradyne’s management and are neither promises nor guarantees of future performance, events, earnings per share, use of cash, payment of dividends, repurchases of common stock, payment of the senior convertible notes, or the impact of the U.S. export and tariff laws. There can be no assurance that management’s estimates of Teradyne’s future results or other forward-looking statements will be achieved. Additionally, the current dividend and share repurchase programs may be modified, suspended or discontinued at any time. On May 16, 2019, Huawei and 68 of its affiliates, including HiSilicon, were added to the U.S. Department of Commerce Entity List under U.S. Export Administration Regulations (the “EAR”). This action by the U.S. Department of Commerce imposed new export licensing requirements on exports, re-exports, and in-country transfers of all U.S. - regulated products, software and technology to the designated Huawei entities. While most of our products are not subject to the EAR and therefore not affected by the Entity List restrictions, some of our products are currently manufactured in the U.S. and thus subject to the Entity List restrictions. Compliance with the current Entity List restrictions has not significantly impacted our sales. There have been recent news reports that the U.S. Department of Commerce plans to modify the U.S. EAR to expand the scope of the regulations to include more products that would become subject to the Entity List restrictions relating to Huawei and the designated Huawei entities including HiSilicon. These modified regulations, if implemented as currently reported, would impact our ability to continue to sell certain products directly to Huawei and HiSilicon, both of which are significant Teradyne customers. However, based on our understanding, these proposed modified regulations would not impact our sales to third party contract manufacturers used by Huawei and HiSilicon to manufacture and test semiconductor and other electronic devices. Because the business environment for Huawei is both fluid and uncertain, there are also risks that Huawei and HiSilicon may have less demand for our products and/or may purchase products from our competitors who are not impacted by the U.S. regulations. Until these or any new regulations become public and effective, we will not know the extent of the impact on our business with Huawei and HiSilicon. However, it is possible that these modified regulations and any other additional regulations that may be implemented by the U.S. Department of Commerce or other government agency would have a material impact on our business and financial results. Important factors that could cause actual results, earnings per share, use of cash, dividend payments, repurchases of common stock, or payment of the senior convertible notes to differ materially from those presently expected include: conditions affecting the markets in which Teradyne operates; decreased or delayed product demand from one or more significant customers; development, delivery and acceptance of new products; the ability to grow the Industrial Automation business; increased research and development spending; deterioration of Teradyne’s financial condition; the consummation and success of any mergers or acquisitions; unexpected cash needs; insufficient cash flow to make required payments and pay the principal amount on the senior convertible notes; the business judgment of the board of directors that a declaration of a dividend or the repurchase of common stock is not in the company’s best interests; additional U.S. tax regulations or IRS guidance; the impact of any tariffs or export controls imposed in the U.S. or China; compliance with trade protection measures or export restrictions; the impact of U.S. Department of Commerce or other government agency regulations relating to Huawei and HiSilicon; and other events, factors and risks disclosed in filings with the SEC, including, but not limited to, the “Risk Factors” section of Teradyne’s Annual Report on Form 10-K for the fiscal year ended December 31, 2018 and the Quarterly Report on Form 10-Q for the period ended September 29, 2019. The forward-looking statements provided by Teradyne in this presentation represent management’s views as of the date of this presentation. Teradyne anticipates that subsequent events and developments may cause management's views to change. However, while Teradyne may elect to update these forward-looking statements at some point in the future, Teradyne specifically disclaims any obligation to do so. These forward-looking statements should not be relied upon as representing Teradyne's views as of any date subsequent to the date of this presentation.
2
SAFE HARBOR

Business Update and Outlook
3
Mark Jagiela, Teradyne President and CEO

$520M$582M
$655M
$0.63$0.77
$0.88
$-
$0.20
$0.40
$0.60
$0.80
$1.00
$1.20
$1.40
$200M
$300M
$400M
$500M
$600M
$700M
Q4'18 Q3'19 Q4'19
Sales EPS
Q4’19 and 2019 Summary
4 (1) See appendix for GAAP to Non-GAAP reconciliation
• Semiconductor strength in 4G, 5G and Memory Test
• System Test sales up 53% from Q4’18 on Storage Test growth
• Full year 2019 Non-GAAP EPS of $2.86 up $0.49/21% from 2018
• Four year Non-GAAP EPS CAGR of 23%
• Reduced diluted share count by 8% in 2019 compared to 2018
All Business Segments’ Revenue Grew Quarter on Quarter and Year on Year2019 Sales of $2,295M, Non-GAAP EPS of $2.86
• Sales up 9% from 2018
• Four year sales CAGR of 9%
Quarterly Sales/Non-GAAP EPS Full Year Sales Full Year Non-GAAP EPS(1)
$1,640M$1,753M
$2,137M $2,101M$2,295M
$1,000M
$1,300M
$1,600M
$1,900M
$2,200M
$2,500M
2015 2016 2017 2018 2019
$1.27 $1.51
$2.34 $2.37$2.86
$0.0
$0.5
$1.0
$1.5
$2.0
$2.5
$3.0
$3.5
2015 2016 2017 2018 2019

• Q4 Sales up 26% and non-GAAP EPS up 40% from Q4’18
• Full year 2019 sales up 9%, Non-GAAP EPS up 21% on Test strength in 4G/5G, Storage
and Defense/Aerospace markets
• Industrial Automation (IA) below plan in 2019; grew 14% as reported, 12% proforma in
face of global manufacturing slow down
• Expect 2020 SOC Test market to be $3.1-3.4B, Memory Test market $650-750M
• New product design wins will begin to ramp in 1H-’20
• IA long term growth rate expected to moderate to 20-35% CAGR, expect above 20% in 2020
5
January 2020 Update

Fourth Quarter and Full Year 2019 Financial Results and First Quarter 2020 Guidance
6
Sanjay Mehta, Teradyne Vice President and Chief Financial Officer

Q4’19 Non-GAAP Results
7
(1) See attached appendix for GAAP to non-GAAP reconciliations
$s in millions, except EPS Q4’18 Actual(1) Q3’19 Actual(1) Q4’19 Actual(1)
Sales $520M $582M $655M
Gross Margin 59.6% $310M 59.3% $345M 58.5% $383M
R&D 14.4% $75M 13.4% $78M 13.3% $87M
SG&A 19.4% $101M 18.4% $107M 17.9% $117M
OPEX 33.8% $175M 31.8% $185M 31.2% $204M
Operating Profit 25.8% $134M 27.5% $160M 27.4% $179M
Income Taxes (& effective tax rate)
15.0% $20M 17% $27M 17% $30M
EPS $0.63 $0.77 $0.88
Diluted Shares 181M 175M 175M

Balance Sheet & Capital Return
8
(1) Includes UR, MiR and AutoGuide(2) Includes depreciation, stock based compensation, amortization of acquired intangible assets and amortization of the non-cash convertible debt discount(3) Teradyne calculates free cash flow as: GAAP Cash flow from operations, excluding discontinued operations, less property, plant and equipment additions; see GAAP to
non–GAAP reconciliations.
Q4’18Actual
Q3’19Actual
Q4’19Actual
Cash and Marketable Securities $1,205M $1,040M $1,016M
Inventory $154M $178M $197M
DSO 52 Days 56 days 51 Days
Acquisition Earn-out Accruals(1) $71M $18M $40M
Capital Additions $26M $37M $39M
Depreciation and Amortization(2) $39M $40M $41M
Free Cash Flow(3) $160M $162M $178M
Capital Return$261M $122M $131M
$16M $15M $15M
Buybacks
Dividends

Q4’19 and 2019 Segment Summary
9
UR sales up 6%, MiR sales up 43% in
2019 vs 2018 on a pro forma basis
Acquired AutoGuide, a leader in autonomous
forklift technology, in Q4
Sales up 33% in 2019 vs 2018 with growth in all 3
businesses
Storage Test grew 73% in 2019 vs 2018 on higher
capacity HDDs and increased System Level
Test demand
Sales growth of 19% in 2019 vs 2018 on strong Connectivity and early
5G demand
Advanced connectivity and 5G expected to
drive demand in 2020
5G Infrastructure and 4G handset demand
stronger than planned
Successfully entered the LPDDR5 DRAM test
market
$83M $45M4th
Q
uar
ter
Sale
s2
01
9 K
ey H
igh
ligh
ts
$88M$439M
Semiconductor Test
Industrial Automation
System Test Wireless Test
Semi Product
$353M
Semi Service
$86M
SemiTest Sales
4th
Qu
arte
r Sa
les
Det
ail Industrial Automation Revenue
23%
41%
30%
5%
Asia
Europe
North America
Rest of world

78%
22%
AutomatedTest
IndustrialAutomation
2022E
$2,700 3,250
58% 59%
32% 31%
26% 28%
$3.50 $4.25
Teradyne Updated Non-GAAP Earnings Model
10
2019
TER Revenue ($M's) $2,295
Gross Margin % 58%
OPEX % 33%
Operating Profit % 25%
Non-GAAP EPS $2.86
(1) See attached appendix for GAAP to non-GAAP reconciliations(2) Financial Model updated as of 1/23/20(3) 2022E sales mix is at mid-point of model range
Financial Model Update(1)(2)
87%
13%2019 Sales Mix
2022E Sales Mix(3)
2022E Updated Model Assumptions
=$2,295M
=$2,975M(3)
Metric Old Model New Model Comment
IA Revenue CAGR 30-40% off 2018 20-35% off 2019 14% growth as reported in 2019 due to economic headwinds
Test Revenue CAGR 3-5% off 2018 4-8% off 2019 9% growth in 2019

Q1’20 Non-GAAP Guidance
11(1) See attached appendix for GAAP to non-GAAP reconciliations.
$s in millions, except EPSQ4’19 Actual(1) Q1’20 Guidance(1)
Sales $655M $670M - $710M
Gross Margin 59% 57%-58%
OPEX 31% 31% - 30%
Operating Profit 27% 26% - 28%
Net Interest & Other Income $4M $1M
Effective Tax Rate 17% 16%
EPS $0.88 $0.86 - $0.96
Diluted Shares 175M 174M

• Q4 Sales up 26% and non-GAAP EPS up 40% from Q4’18
• Full year 2019 sales up 9%, Non-GAAP EPS up 21% on Test strength in 4G/5G, Storage and
Defense/Aerospace markets
• Industrial Automation (IA) below plan in 2019; grew 14% as reported, 12% proforma in face of global
manufacturing slow down
• Expect 2020 SOC Test market to be $3.1-3.4B, Memory Test market $650-750M
• New product design wins will begin to ramp in 1H-’20
• IA long term growth rate expected to moderate to 20-35% CAGR, expect above 20% in 2020
• Raised top end of non-GAAP EPS earnings model from $4.00 to $4.25 in 2022 to reflect latest Test and IA outlook
• Expect to repurchase a minimum of $250 million of Teradyne shares in 2020 as part of $1B repurchase authorization
12
January 2020 Summary

Supplemental Information
13

Annual Non-GAAP Results
(1) See attached appendix for GAAP to non-GAAP reconciliations.
14
$s in millions, except EPS 2018(1) 2019(1)
Sales $2,101M $2,295M
Gross Margin 58% $1,221M 58% $1,340M
R&D 14% $302M 14% $322M
SG&A 19% $391M 19% $435M
OPEX 33% $692M 33% $758M
Operating Profit 25% $529M 25% $582M
Income Taxes (& effective tax rate)16% $84M 17% $98M
EPS $2.37 $2.86
Diluted Shares 189M 175M

History of Balanced Capital Allocation
15
2014 2015 2016 2017 2018 2019
Buybacks $0M $300M $146M $200M $823M $500M
Dividends $37M $51M $49M $55M $67M $61M
Acquisitions $19M $283M $0M $0M $169M $80M
Earn-out Payments(2) $0M $0M $15M $1M $25M $35M
Total $57M $633M $210M $257M $1,085M $676M
Cumulative
$1,970M(1)
$320M
$551M
$76M
$2,918M
Free Cash Flow(3) $323M $323M $370M $521M $370M $444M $2,351M
(1) 60.8 million shares repurchased at an average price of $32.38
(2) Earn-Out payments flow through both financing and operating sections of the cash flow statement.
(3) Teradyne calculates free cash flow as: GAAP Cash flow from operations, excluding discontinued
operations, less property, plant and equipment additions net of gov’t subsidies; see GAAP to non–GAAP
reconciliations.
19%
11%
68%
3%
Cumulative Capital Allocation Breakdown 2014-2019
Acquisitions
Dividends
Buybacks
Earn-out Payments

In addition to disclosing results that are determined in accordance with GAAP, Teradyne also discloses in this presentation and on the earnings call non-GAAP results of operations that exclude certain income items and charges. These results are provided as a complement to results provided in accordance with GAAP. These non-GAAP performance measures are used to make operational decisions, to determine employee compensation, to forecast future operational results, and for comparison with the Company’s business plan, historical operating results and the operating results of the Company’s competitors. Management believes each of these non-GAAP performance measures provides useful supplemental information for investors, allowing greater transparency to the information used by management in its operational decision making and in the review of the Company’s financial and operational performance, as well as facilitating meaningful comparisons of the Company’s results in the current period compared with those in prior and future periods. A reconciliation of each available GAAP to non-GAAP financial measure discussed in this presentation is contained in the following slides and on the Teradyne website at www.teradyne.com by clicking on "Investors" and then selecting the "GAAP to Non-GAAP Reconciliation" link. The non-GAAP performance measures discussed in this presentation may not be comparable to similarly titled measures used by other companies. The presentation of non-GAAP measures is not meant to be considered in isolation, as a substitute for, or superior to, financial measures or information provided in accordance with GAAP.
16
Appendix | GAAP to Non-GAAP Reconciliation

17
Appendix | GAAP to Non-GAAP Reconciliation

18
Appendix | GAAP to Non-GAAP Reconciliation

19
Appendix | GAAP to Non-GAAP Reconciliation

20
Appendix | GAAP to Non-GAAP ReconciliationTwelve Months Ended
December 31,
2017
% of Net
Revenues
December 31,
2016
% of Net
Revenues
Net Revenues 2,136.6$ 1,753.3$
Gross profit - GAAP 1,223.9$ 57.3% 959.6$ 54.7%
Pension mark-to-market adjustment (1) (2.8) -0.1% (1.0) -0.1%
Gross profit - non-GAAP 1,221.1$ 57.2% 958.6$ 54.7%
Income (loss) from operations - GAAP 530.0$ 24.8% (60.0)$ -3.4%
Acquired intangible assets amortization 30.5 1.4% 52.6 3.0%
Restructuring and other (2) 9.4 0.4% 21.9 1.2%
Pension mark-to-market adjustment (1) (6.3) -0.3% (3.2) -0.2%
Goodwill impairment (3) - - 254.9 14.5%
Acquired intangible assets impairment (3) - - 83.3 4.8%
Income from operations - non-GAAP 563.6$ 26.4% 349.5$ 19.9%
December 31,
2017
% of Net
Revenues Basic Diluted
December 31,
2016
% of Net
Revenues Basic Diluted
Net income (loss) - GAAP 257.7$ 12.1% 1.30$ 1.28$ (43.4)$ -2.5% (0.21)$ (0.21)$
Acquired intangible assets amortization 30.5 1.4% 0.15 0.15 52.6 3.0% 0.26 0.26
Interest and other (4) 12.4 0.6% 0.06 0.06 0.6 0.0% 0.00 0.00
Restructuring and other (2) 9.4 0.4% 0.05 0.05 21.9 1.2% 0.11 0.11
Pension mark-to-market adjustment (1) (6.3) -0.3% (0.03) (0.03) (3.2) -0.2% (0.02) (0.02)
Goodwill impairment (3) - - - - 254.9 14.5% 1.26 1.25
Acquired intangible assets impairment (3) - - - - 83.3 4.8% 0.41 0.41
Exclude discrete tax adjustments (5) 178.3 8.3% 0.90 0.89 (4.5) -0.3% (0.02) (0.02)
Non-GAAP tax adjustments (6) (12.8) -0.6% (0.06) (0.06) (53.3) -3.0% (0.26) (0.26)
Net income - non-GAAP 469.2$ 22.0% 2.37$ 2.34$ 308.9$ 17.6% 1.52$ 1.51$
198.1 202.6
201.6 202.6
Exclude dilutive shares from convertible note (1.3) -
Include dilutive shares - 1.8
200.3 204.4
Net Income
per Common Share
Net (Loss) Income
per Common Share
GAAP and non-GAAP weighted average common shares - basic
GAAP weighted average common shares - diluted
Non-GAAP weighted average common shares - diluted

Appendix | GAAP to Non-GAAP Reconciliation
21
Year Ended
December 31,
2016
% of Net
Revenues
December 31,
2015
% of Net
Revenues
Net Revenues 1,753.3$ 1,639.6$
Gross profit - GAAP 959.6$ 54.7% 915.6$ 55.8%
Inventory step-up - - 1.6 0.1%
Pension mark-to-market adjustments (1) (1.0) -0.1% 8.3 0.5%
Gross profit - non-GAAP 958.6$ 54.7% 925.5$ 56.4%
(Loss) income from operations - GAAP (60.0)$ -3.4% 243.0$ 14.8%
Goodwill impairment (2) 254.9 14.5% - -
Acquired intangible assets impairment (2) 83.3 4.8% - -
Acquired intangible assets amortization 52.6 3.0% 69.0 4.2%
Restructuring and other (3) 21.9 1.2% 5.1 0.3%
Pension mark-to-market adjustments (1) (3.2) -0.2% 17.7 1.1%
Inventory step-up - - 1.6 0.1%
Income from operations - non-GAAP 349.5$ 19.9% 336.4$ 20.5%
December 31,
2016
% of Net
Revenues Basic Diluted
December 31,
2015
% of Net
Revenues Basic Diluted
Net (loss) income - GAAP (43.4)$ -2.5% (0.21)$ (0.21)$ 206.5$ 12.6% 0.98$ 0.97$
Goodwill impairment (2) 254.9 14.5% 1.26 1.25 - - - - Acquired intangible assets impairment (2) 83.3 4.8% 0.41 0.41 - - - - Acquired intangible assets amortization 52.6 3.0% 0.26 0.26 69.0 4.2% 0.33 0.32 Restructuring and other (3) 21.9 1.2% 0.11 0.11 5.1 0.3% 0.02 0.02 Pension mark-to-market adjustments (1) (3.2) -0.2% (0.02) (0.02) 17.7 1.1% 0.08 0.08
Interest and other (4) 0.6 0.0% 0.00 0.00 (5.4) -0.3% (0.03) (0.03)
Inventory step-up - - - - 1.6 0.1% 0.01 0.01
Exclude discrete tax adjustments (5) (4.5) -0.3% (0.02) (0.02) (4.9) -0.3% (0.02) (0.02) Tax effect of non-GAAP adjustments (53.3) -3.0% (0.26) (0.26) (18.5) -1.1% (0.09) (0.09)
Net income - non-GAAP 308.9$ 17.6% 1.52$ 1.51$ 271.1$ 16.5% 1.28$ 1.27$
202.6 211.5
202.6 213.3
Include dilutive shares 1.8 -
204.4 213.3
Net (Loss) Income
per Common Share
Net Income
per Common Share
GAAP and non-GAAP weighted average common shares - basic
GAAP weighted average common shares - diluted
Non-GAAP weighted average common shares - diluted
22
Appendix | GAAP to Non-GAAP Reconciliation
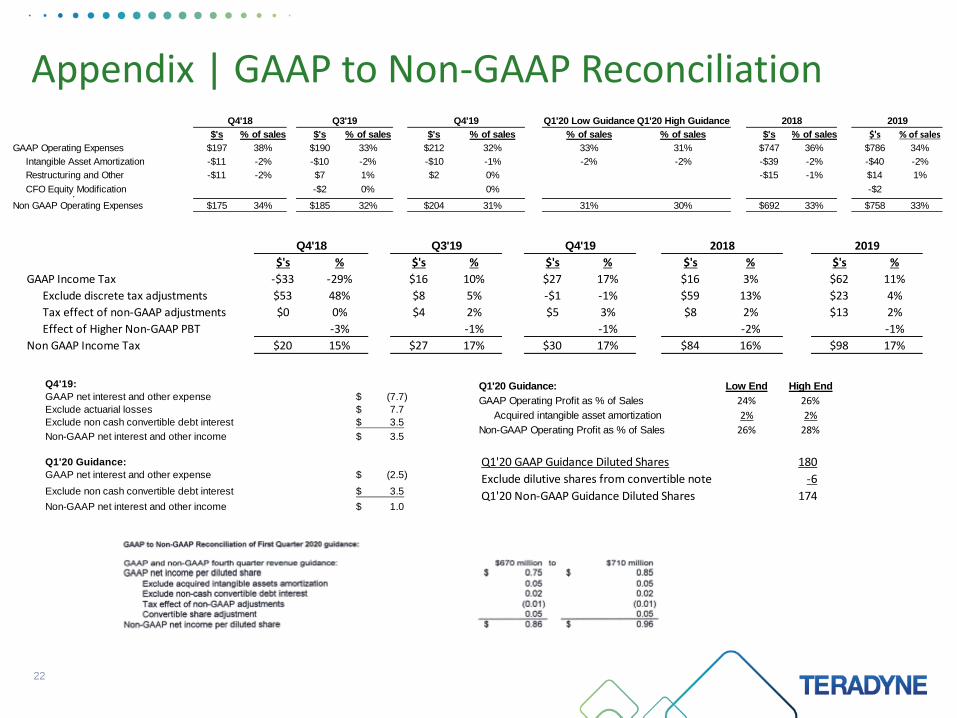
$'s % of sales $'s % of sales $'s % of sales % of sales % of sales $'s % of sales $'s % of sales
GAAP Operating Expenses $197 38% $190 33% $212 32% 33% 31% $747 36% $786 34%
Intangible Asset Amortization -$11 -2% -$10 -2% -$10 -1% -2% -2% -$39 -2% -$40 -2%
Restructuring and Other -$11 -2% $7 1% $2 0% -$15 -1% $14 1%
CFO Equity Modification -$2 0% 0% -$2Goodwill Impairment 0%
Non GAAP Operating Expenses $175 34% $185 32% $204 31% 31% 30% $692 33% $758 33%
Q4'18 Q3'19 Q1'20 Low Guidance Q1'20 High GuidanceQ4'19 2018 2019
$'s % $'s % $'s % $'s % $'s %
GAAP Income Tax -$33 -29% $16 10% $27 17% $16 3% $62 11%
Exclude discrete tax adjustments $53 48% $8 5% -$1 -1% $59 13% $23 4%
Tax effect of non-GAAP adjustments $0 0% $4 2% $5 3% $8 2% $13 2%
Effect of Higher Non-GAAP PBT -3% -1% -1% -2% -1%
Non GAAP Income Tax $20 15% $27 17% $30 17% $84 16% $98 17%
Q4'18 Q3'19 Q4'19 2018 2019
Q1'20 Guidance: Low End High End
GAAP Operating Profit as % of Sales 24% 26%
Acquired intangible asset amortization 2% 2%
Non-GAAP Operating Profit as % of Sales 26% 28%
Q1'20 GAAP Guidance Diluted Shares 180
Exclude dilutive shares from convertible note -6
Q1'20 Non-GAAP Guidance Diluted Shares 174
Q4'19:
GAAP net interest and other expense (7.7)$
Exclude actuarial losses 7.7$
Exclude non cash convertible debt interest 3.5$
Non-GAAP net interest and other income 3.5$
Q1'20 Guidance:
GAAP net interest and other expense (2.5)$
Exclude non cash convertible debt interest 3.5$
Non-GAAP net interest and other income 1.0$

23
Appendix | GAAP to Non-GAAP Reconciliation• Teradyne determines non-GAAP operating cash flow (“Free Cash Flow”) by adjusting GAAP cash flow from operations excluding
discontinued operations, less property, plant and equipment additions. Free cash flow is considered a non-GAAP financial measure. Teradyne believes that free cash flow, which measures our ability to generate cash from our business operations, is an importantfinancial measure for use in evaluating Teradyne’s financial performance. Free cash flow should be considered in addition to, rather than as a substitute for, income (loss) from continuing operations or net income (loss) as a measure of our performance and net cash provided by operating activities as a measure of our liquidity.
• Teradyne believes it is important to view free cash flow as a measure that provides supplemental information to Teradyne’s entire statement of cash flows.
• Although other companies report their free cash flow, numerous methods may exist for calculating a company's free cash flow. As a result, the method used by Teradyne to calculate free cash flow may differ from the methods other companies use to calculate their free cash flow.
• The following table sets forth a reconciliation of free cash flow, a non-GAAP financial measure, to net cash provided by operating activities, a GAAP measure, which we believe to be the GAAP financial measure most directly comparable to free cash flow.
Q4'18 Q3'19 Q4'19 2014 2015 2016 2017 2018 2019
GAAP Cash Flow From Operations, Excl Disc Ops $186 $199 $216 $492 $413 $455 $626 $477 $579
Less Property, Plant and Equipment Additions net of Gov't Subsidy -$26 -$37 -$39 -$169 -$90 -$85 -$105 -$107 -$135
Non-GAAP Operating Cash Flow ("Free Cash Flow") $160 $162 $178 $323 $323 $370 $521 $370 $444

24
Appendix | GAAP to Non-GAAP Reconciliation
FY 2022 Low FY 2022 High
2022 Estimated GAAP Operating Expenses as a % of Sales 33% 32%
Less Intangible Asset Amortization as a % of Sales 1% 1%
2022 Estimated Non-GAAP Operating Expenses as a % of Sales 32% 31%
FY 2022 Low FY 2022 High
2022 Estimated GAAP Operating Profit as a % of Sales 25% 27%
Add back Intangible Asset Amortization as a % of Sales 1% 1%
2022 Estimated Non-GAAP Operating Profit as a % of Sales 26% 28%
FY 2022 Low FY 2022 High
2022 Estimated GAAP Diluted EPS 3.18$ 3.87$
Add back Intangible Asset Amortization 0.09$ 0.10$
Add back Non Cash Convertible Debt Interest 0.07$ 0.07$
Convertible share adjustment 0.15$ 0.21$
2022 Estimated Non-GAAP Diluted EPS 3.50$ 4.25$
FY 2022 High Old
2022 Estimated GAAP Diluted EPS (Old) 3.73$
Add back Intangible Asset Amortization 0.07$
Add back Non Cash Convertible Debt Interest 0.08$
Convertible share adjustment 0.13$
2022 Estimated Non-GAAP Diluted EPS 4.00$
MiR's revenue increase for the period January 1, 2019 to December 31, 2019 compared to the period April 23, 2018 to December 31, 2018 is 84%. MiR's pro-forma revenue increase for
the period January 1, 2019 to December 31, 2019 compared to the period January 1, 2018 to December 31, 2018 is 43%.
Industrial Automation GAAP revenue increase for the period January 1, 2019 to December 31, 2019 compared to the period January 1, 2018 to December 31, 2018 is 14%. Industrial
Automation's pro-forma revenue increase for the period January 1, 2019 to December 31, 2019 compared to the period January 1, 2018 to December 31, 2018 is 12%.