financial results briefing 1q-fy2020 · 2020. 10. 2. · 2. trend of business results changes in...
TRANSCRIPT

©TOKYO KEIKI INC. All Rights Reserved
Financial Results Briefing for 1Q of the Fiscal Year Ended March 31, 2021 (Fiscal 2020)
-From April 1 to June 30, 2020-
August 11, 2020
The forward-looking statements contained in this material reflect the management’s assumptions based on currently available information as of the date of announcement. Future changes in business environment and other factors may therefore cause differences with the actual situation.

©TOKYO KEIKI INC. All Rights Reserved
The Hydraulics and Pneumatics Business experienced a decline in demand from major markets due to the COVID-19 pandemic as well as U.S.-China trade friction.
The full-year earnings forecast made changes to the forecast disclosed on May 19, 2020 taking into account the current business climate and earnings trends reflecting the impacts of COVID-19 up until now (see supplement on next page).
2
1. Summary of financial results for 1Q of FY2020
Summary of 1Q Results(From April 1 to June 30, 2020)
©TOKYO KEIKI INC. All Rights Reserved
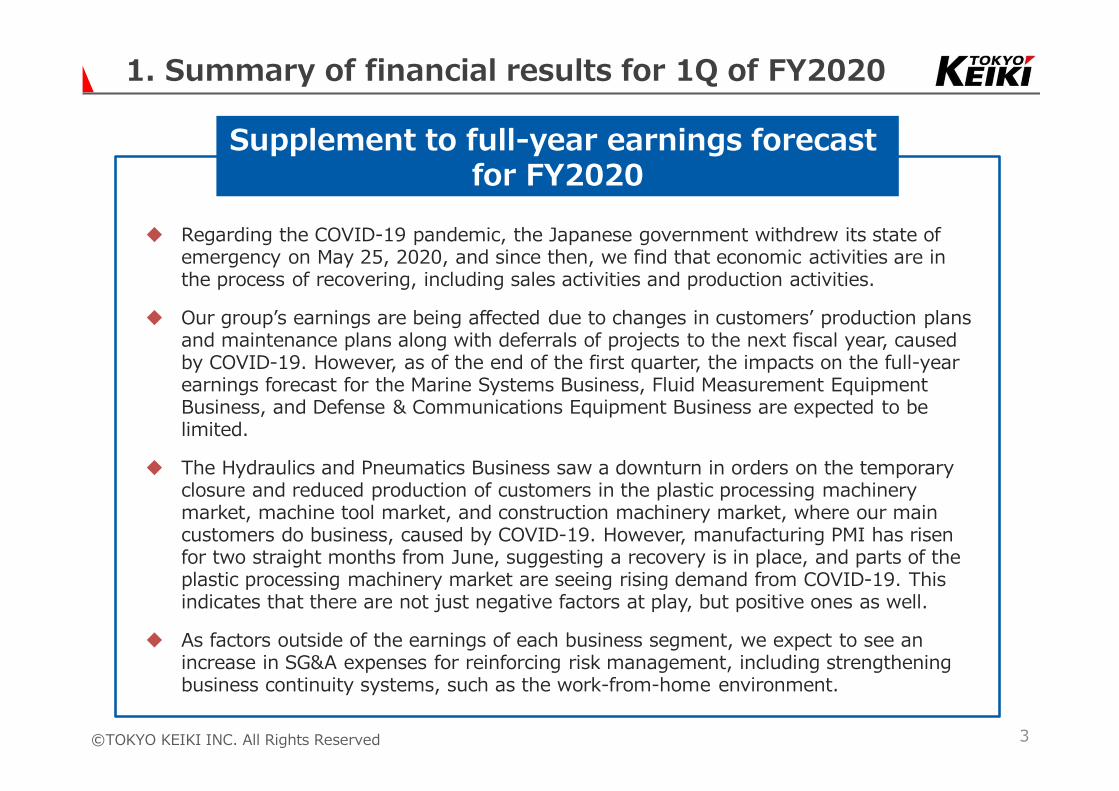
Regarding the COVID-19 pandemic, the Japanese government withdrew its state of emergency on May 25, 2020, and since then, we find that economic activities are in the process of recovering, including sales activities and production activities.
Our group’s earnings are being affected due to changes in customers’ production plans and maintenance plans along with deferrals of projects to the next fiscal year, caused by COVID-19. However, as of the end of the first quarter, the impacts on the full-year earnings forecast for the Marine Systems Business, Fluid Measurement Equipment Business, and Defense & Communications Equipment Business are expected to be limited.
The Hydraulics and Pneumatics Business saw a downturn in orders on the temporary closure and reduced production of customers in the plastic processing machinery market, machine tool market, and construction machinery market, where our main customers do business, caused by COVID-19. However, manufacturing PMI has risen for two straight months from June, suggesting a recovery is in place, and parts of the plastic processing machinery market are seeing rising demand from COVID-19. This indicates that there are not just negative factors at play, but positive ones as well.
As factors outside of the earnings of each business segment, we expect to see an increase in SG&A expenses for reinforcing risk management, including strengthening business continuity systems, such as the work-from-home environment.
3
Supplement to full-year earnings forecast for FY2020
1. Summary of financial results for 1Q of FY2020

©TOKYO KEIKI INC. All Rights Reserved 4
2. Trend of Business Results
Changes in consolidated profit & loss
【Net Sales】 【Operating Profit】1Q
Full year
(Million yen)(Million yen)
*Full year forecast of Fiscal 2020 was changed in “Summary of financial results for the first-quarter of fiscal 2020” on June 11, 2020.
9,622 9,438 9,593 8,624
2018/3 2019/3 2020/3 2021/3
43,803
(Forecast)45,50046,692 47,440
17
△ 240 △ 298 △ 4172018/3 2019/3 2020/3 2021/3
2,440
1,319
(Forecast)1,510
1,875

©TOKYO KEIKI INC. All Rights Reserved
8,624
15,766
11,05611,025
9,593
13,451
11,99111,812
9,438
13,973
10,4519,7579,622
14,168
9,9199,331
7,975
1Q4Q3Q2Q1Q4Q3Q2Q1Q4Q3Q2Q1Q4Q3Q2Q1Q
5
2019/3¥46,692 million
2017/3¥41,394 million
2018/3¥43,803 million
2021/3-1Q¥8,624 million
2020/3¥47,440 million
(Million yen)
Quarterly changes in net sales
2. Trend of Business Results

©TOKYO KEIKI INC. All Rights Reserved
△ 417
1,628
258287△ 298
1,663
569448
△ 240
1,304
13△ 1517
2,162
△ 49△ 299△ 693
1Q4Q3Q2Q1Q4Q3Q2Q1Q4Q3Q2Q1Q4Q3Q2Q1Q
6
2019/3¥2,440 million
2017/3¥1,121 million
2018/3¥1,319 million
2021/3-1Q¥▲417 million
2020/3¥1,875 million
2. Trend of Business Results
(Million yen)
Quarterly changes in operating profits

©TOKYO KEIKI INC. All Rights Reserved
2,2261,9942,316
2,232 3,1653,220
3,0802,414
361 418 393 520
3,5523,365
3,3663,078
319 441 437 380
18/3 19/3 20/3 21/3 18/3 19/3 20/3 21/3 18/3 19/3 20/3 21/3 18/3 19/3 20/3 21/3 18/3 19/3 20/3 21/3
(Forecast)8,870
12,85313,064
(Forecast)11,560
4,1013,440
(Forecast)4,200
16,05116,909
(Forecast)17,160
2,601
(Forecast)3,720
9,094
12,050
3,745
19,264
8,858
3,667
8,949
3,283
7
(Million yen)
2. Trend of Business Results
Changes in net sales by segment1Q
Full year
Marine Systems Hydraulics and Pneumatics
Fluid Measurement Equipment
Defense and Communications
Equipment
Others
*Net sales before adjustment.*“Fire Extinguishing Systems Business”, which has been included under “Other Businesses”, is included under the “Fluid Measurement Equipment Business” in Fiscal 2018. The amounts before Fiscal 2018 are updated to reflect the segment change.
*Full year forecast of Fiscal 2020 was changed in “Summary of financial results for the first-quarter of fiscal 2020” on August 11, 2020.

©TOKYO KEIKI INC. All Rights Reserved
68 3293 69
16 40
△ 41△ 138
△ 206△ 190 △ 170
△ 130
272
55
△ 9△ 82 △ 122
△ 158△ 155
△ 119
18/3 19/3 20/3 21/3 18/3 19/3 20/3 21/3 18/3 19/3 20/3 21/3 18/3 19/3 20/3 21/3 18/3 19/3 20/3 21/3
(Forecast)260
118 (Forecast)10
845
444
(Forecast)570
70
525
(Forecast)260
573 (Forecast)510
161
460
235
456
233
△223
545
931
464
8
(Million yen)
2. Trend of Business Results
1Q
Full year
Marine Systems Hydraulics and Pneumatics
Fluid Measurement Equipment
Defense and Communications
Equipment
Others
*Operating profits before adjustment.*”Fire Extinguishing Systems Business”, which has been included under “Other Businesses”, is included under the “Fluid Measurement Equipment Business” in Fiscal 2018. The amounts before Fiscal 2018 are updated to reflect the segment change.
*Full year forecast of Fiscal 2020 was changed in “Summary of financial results for the first-quarter of fiscal 2020” on August 11, 2020.
Changes in operating profits by segment

©TOKYO KEIKI INC. All Rights Reserved 9
45,500
46,700
△417
Remaining 36,876
Remaining 1,927
Remaining 1,988
Remaining 1,396
1,510
1,930
1,650
2,050
1,180
1,530
△338
△216
8,624
(Million yen)
3. Fiscal 2020 1Q Progress
Net Sales
Operating Profit
Ordinary Profit
Profit attributable
to owners of parent
Fiscal 2020 1Q progress Full year forecastForecast at the beginning of
the fiscal year
Progression rate 19.0%
Progression rate ー%
Progression rate ー%
Progression rate ー%
*Full year forecast of Fiscal 2020 was changed in “Summary of financial results for the first-quarter of fiscal 2020” on August 11, 2020.

©TOKYO KEIKI INC. All Rights Reserved
2,232
2,414
520
3,078
380
10
Progress of net sales by segment
8,870
9,200
Remaining6,638
Remaining9,146
Remaining3,680
Remaining14,082
11,560
12,500
4,200
4,200
17,160
17,000
Remaining3,340 3,720
3,700
Progression rate 25.2%
Progression rate 20.9%
Progression rate 12.4%
Progression rate 17.9%
Progression rate 10.2%
・In contrast with strong sales of purchased goods in the domestic coastal vessels market, the commercial vessels market and overseas market mainly in Asia saw weaker demand for new shipbuilding.
・The plastic processing machinery market, machine tool market, and construction machinery market each saw a downturn in demand, including due to the impacts of COVID-19.
・The fire extinguishing systems market was on par with the previous first quarter.
・The public-sector market saw completion of major projects contribute to higher sales.
・The public-sector market continued to see deliveries of mass-produced products, such as radar warning receivers, but some projects were deferred to the second quarter and beyond, causing a decline year on year.
・The Printing Inspection Equipment Business trended at levels on par with the previous first quarter.
・The Railway Maintenance Business saw equipment sales decline because of a lack of large projects seen in the previous first quarter.
(Million yen)
3. Fiscal 2020 1Q Progress
*Net sales before adjustment.*Full year forecast of Fiscal 2020 was changed in “Summary of financial results for the first-quarter of fiscal 2020” on August 11, 2020.
Full year forecastForecast at the beginning of
the fiscal yearMarine Systems
Hydraulics and Pneumatics
Fluid Measurement Equipment
Defense and Communications Equipment
Others

©TOKYO KEIKI INC. All Rights Reserved 11
260
260
Remaining 191
Remaining 148
Remaining 700
Remaining 342
10
310
570
620
260
290
Remaining 629 510
540
Progression rate 26.5%
Progression rate ― %
・Profit declined year on year following the drop in sales.
・FX saw the yen at weaker levels than the initial assumption (initial exchange rate: 1 dollar = 103 yen).
・The operating loss increased year on year on worsening cost price rate caused by lower utilization rate, in addition to the drop in sales.
・The operating loss was reduced year on year from the increase in sales.
・The operating loss increased year on year due to the drop in sales.
・The operating loss of the Railway Maintenance Business, which tends to see profits mostly recorded in the second half in normal years, was reduced year on year.
Progression rate ― %
Progression rate ― %
Progression rate ― %
(Million yen)
3. Fiscal 2020 1Q Progress
Marine Systems
Hydraulics and Pneumatics
Fluid Measurement Equipment
Defense and Communications Equipment
Others
Progress of operating profit by segmentFull year forecast
Forecast at the beginning of the fiscal year
*Operating profit before adjustment.*Full year forecast of Fiscal 2020 was changed in “Summary of financial results for the first-quarter of fiscal 2020” on August 11, 2020.

©TOKYO KEIKI INC. All Rights Reserved
Amount of orders received for 1Q of Fiscal 2020
Amount of order backlog at the end of 1Q of Fiscal 2020
(Million yen) Amount YoY change Amount YoY change Change from the end of FY2019
Marine Systems 2,285 +5.1% 2,729 +2.0% +2.2%
Hydraulics and Pneumatics 2,266 △29.3% 2,400 △5.8% △29.4%
Fluid Measurement Equipment 682 △4.1% 1,124 +16.8% +8.9%
Defense & communications Equipment 1,698 △32.4% 13,888 △9.0% △30.6%
Reported segment total 6,931 △19.4% 20.141 △6.1% △25.7%
Others 1,290 +27.0% 1,342 +211.8% +20.5%
Total 8,222 △14.5% 21,482 △1.8% △23.9%
The Hydraulics and Pneumatics Business experienced a large downturn in orders and order backlog due to the U.S.-China trade conflict and to declining demand in the plastic processing machinery market, machine tool market, and construction machinery market caused by COVID-19.
The order backlog for the Defense & Communications Equipment Business declined largely year on year after a peak in mass-production orders for radar warning receivers in the public-sector market, which continued up to the previous first quarter.
12
4. Status of Orders Received and Order Backlog

©TOKYO KEIKI INC. All Rights Reserved
Cash and deposits increased significantly because net sales in the fourth quarter of the previous fiscal year were larger than normal (up 2,316 million yen year on year).
Inventory assets increased 532 million yen (of which works in process increased 226 million yen), but this figure is down 2,452 million yen compared to the previous first quarter.
Retained earnings decreased due to dividends (409 million yen) and net loss attributable to owners of parent (216 million yen). 13
(Million yen) As of Mar 31, 2020
As of Jun 30, 2020
Amount of change (Million yen) As of Mar
31, 2020As of Jun 30, 2020
Amount of change
Current assets 42,695 40,792 △1,902 Current liabilities 21,736 20,494 △1,243
Cash and deposits 7,709 10,579 +2,870 Notes and accounts payable 5,800 5,411 △359
Notes and accounts receivable 15,262 10,309 △4,952 Short-term loans
payable 11,692 11,692 -
Electronically recordedmonetary claims 4,404 3,773 △631 Provision for bonuses 1,123 552 △570
Inventories 15,001 15,533 +532 Non-current liabilities 3,197 2,968 △228
Accounts receivable 81 258 +177 Long-term loans payable 1,076 869 △207
Other 240 340 +100 Net defined benefit liability 1,229 1,215 △14
Non-current assets 11,882 11,740 △142 Total liabilities 24,933 23,462 △1,471
Tangible assets 7,004 6,824 △179 Shareholders’ equity 29,065 28,439 △626
Intangible assets 0 0 - Retained earnings 22,542 21,916 △626
Investment securities 2,991 3,101 +110 Total net assets 29,644 29,070 △574
Total assets 54,577 52,532 △2,045 Total liabilities and net assets 54,577 52,532 △2,045
5. Consolidated Balance Sheets (Main accounting items only)(Assets) (Liabilities and net assets)
©TOKYO KEIKI INC. All Rights Reserved 14
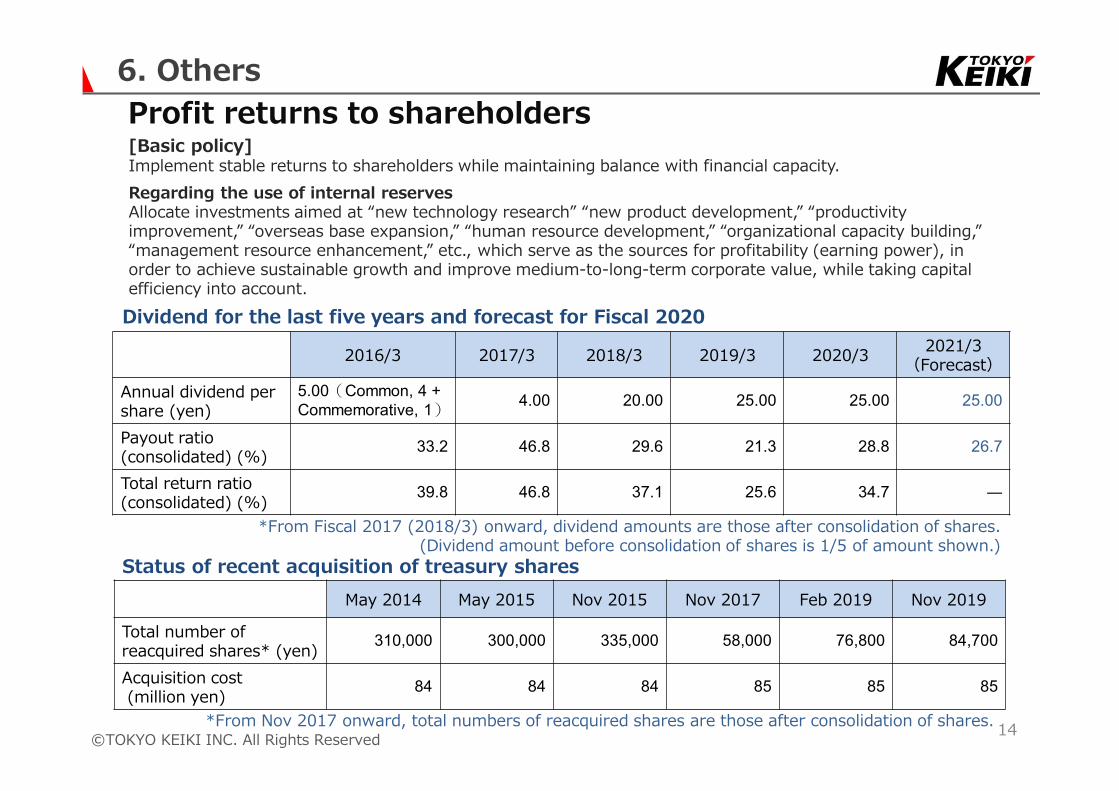
2016/3 2017/3 2018/3 2019/3 2020/3 2021/3(Forecast)
Annual dividend per share (yen)
5.00(Common, 4 + Commemorative, 1) 4.00 20.00 25.00 25.00 25.00
Payout ratio (consolidated) (%) 33.2 46.8 29.6 21.3 28.8 26.7
Total return ratio (consolidated) (%) 39.8 46.8 37.1 25.6 34.7 ―
May 2014 May 2015 Nov 2015 Nov 2017 Feb 2019 Nov 2019
Total number of reacquired shares* (yen) 310,000 300,000 335,000 58,000 76,800 84,700
Acquisition cost(million yen) 84 84 84 85 85 85
6. Others
[Basic policy]Implement stable returns to shareholders while maintaining balance with financial capacity.Regarding the use of internal reservesAllocate investments aimed at “new technology research” “new product development,” “productivity improvement,” “overseas base expansion,” “human resource development,” “organizational capacity building,” “management resource enhancement,” etc., which serve as the sources for profitability (earning power), in order to achieve sustainable growth and improve medium-to-long-term corporate value, while taking capital efficiency into account.
Profit returns to shareholders
Dividend for the last five years and forecast for Fiscal 2020
*From Fiscal 2017 (2018/3) onward, dividend amounts are those after consolidation of shares. (Dividend amount before consolidation of shares is 1/5 of amount shown.)
Status of recent acquisition of treasury shares
*From Nov 2017 onward, total numbers of reacquired shares are those after consolidation of shares.

©TOKYO KEIKI INC. All Rights Reserved 15
(1) Purpose of introducing the planThe Plan is introduced as a compensation plan that allots restricted shares to executive directors
who are not Audit & Supervisory Committee members, the Company’s executive officers, and the representative directors of the Company’s subsidiaries (hereinafter, “eligible persons under the Plan”) in order for eligible persons under the Plan to share the benefits and risks of stock price movements with shareholders more so than before and to further elevate their motivation to contribute to increasing the share price and increasing corporate value.
Furthermore, by introducing the Plan, the provisions of the amount of “stock acquisition compensation” paid out to directors until now will be abolished.
(2) Overview of the Plan• The Company will pay monetary compensation to the eligible persons under the Plan as compensation
for restricted stock pursuant to the resolution passed by the Company’s Board of Directors.• Eligible persons under the Plan will receive allotment of restricted shares by payment of all applicable
monetary compensation according to the method of investment in kind.• The amount to be paid-in per restricted share shall be decided by the Board of Directors based on the
closing price of the Company’s common share on the Tokyo Stock Exchange on the business day immediately preceding the date of the resolution related to the issuance or disposition of such by the Board of Directors (or the closing price on the transaction day immediately prior thereto if no transaction is made on such business day), to the extent that will not constitute an especially advantageous sum with respect to the persons eligible under the Plan subscribing to the restricted shares.
(Reference)The allotment of these shares in the current fiscal year is planned for a total of 19,713 shares on August 19, 2020 as a basis for the disposition of treasury stock.
Introduction of a restricted stock compensation plan6. Others

©TOKYO KEIKI INC. All Rights Reserved