financial reporting and analysis
TRANSCRIPT
Submitted To : Rizwan ul Haq Submitted By : MIR ABDULLAH
FAREEHA FAISALALI JAVEDBURHAN UDDIN
Financial analysis is the process of evaluating financial and other
information for decision-making.
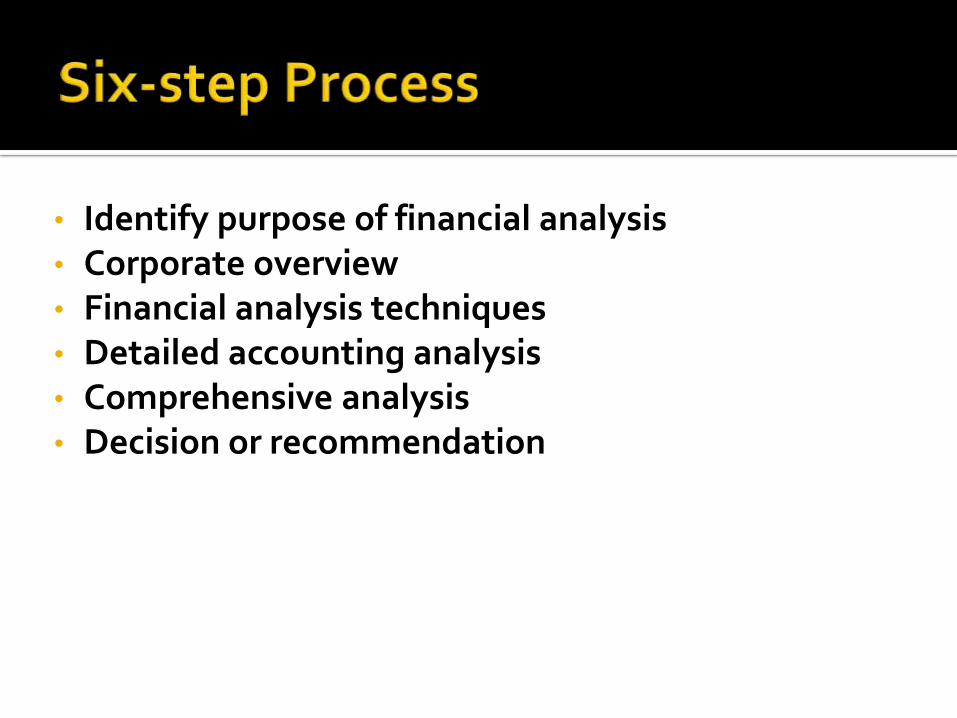
• Identify purpose of financial analysis• Corporate overview• Financial analysis techniques• Detailed accounting analysis• Comprehensive analysis• Decision or recommendation
• Balance Sheet• Income Statement• Cashflow Statement• Statement of Retained Earnings
4

• What do internal users use it for?
Planning, evaluating and controlling companyoperations
• What do external users use it for?
Assessing past performance and current financialposition and making predictions about the futureprofitability and solvency of the company as wellas evaluating the effectiveness of management
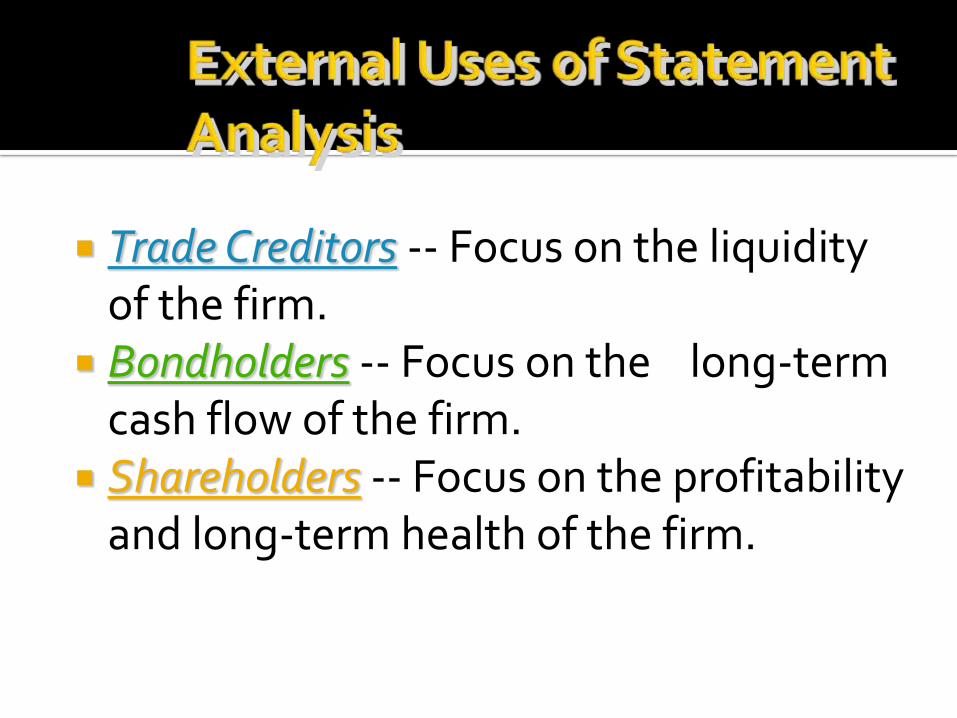
Trade Creditors -- Focus on the liquidity of the firm.
Bondholders -- Focus on the long-term cash flow of the firm.
Shareholders -- Focus on the profitability and long-term health of the firm.

Plan -- Focus on assessing the current financial position and evaluating potential firm opportunities.
Control -- Focus on return on investment for various assets and asset efficiency.
Understand -- Focus on understanding how suppliers of funds analyze the firm.

Horizontal Analysis
Vertical Analysis
Common-Size Statements
Trend Percentages
Ratio Analysis
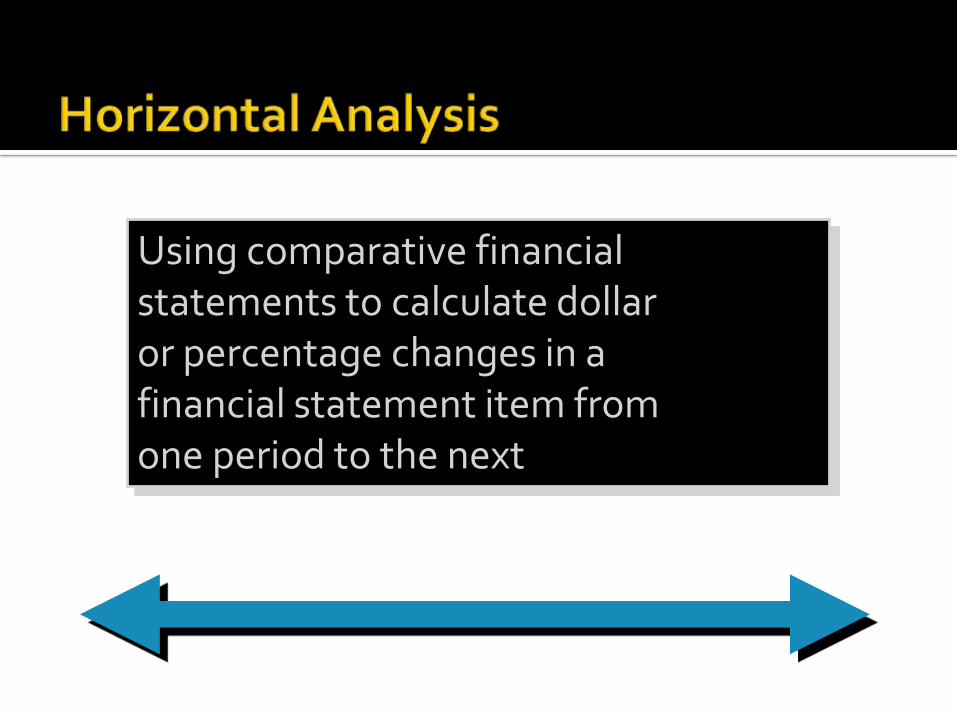
Using comparative financial statements to calculate dollar or percentage changes in a financial statement item from one period to the next
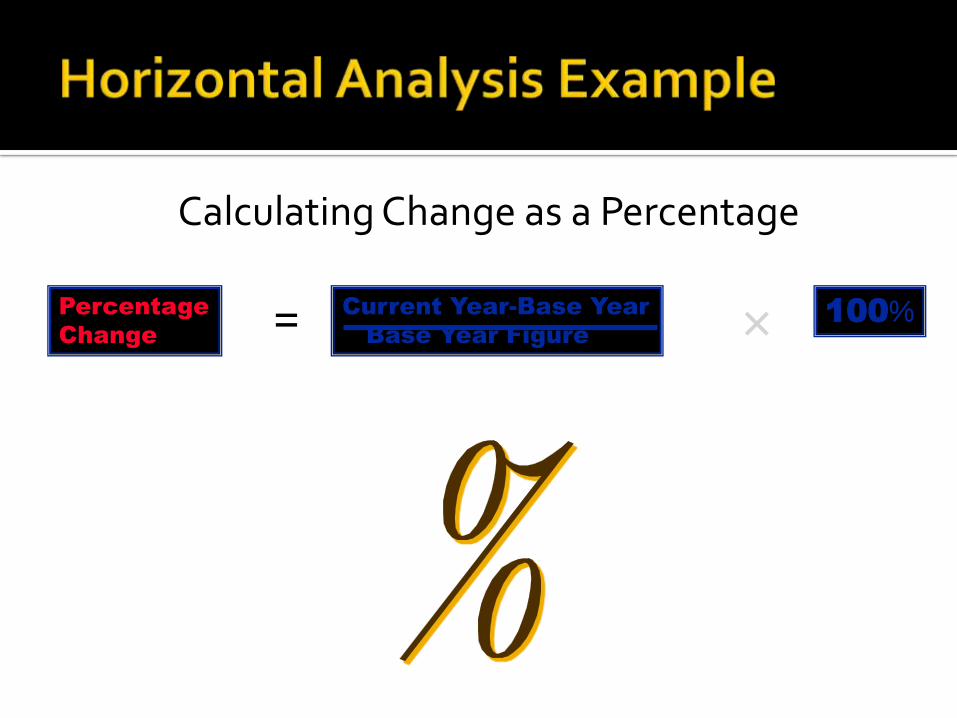
Calculating Change as a Percentage
Percentage
Change
Current Year-Base Year
Base Year Figure
100%= ×

Increase (Decrease)
1999 1998 Amount %
Assets
Current assets:
Cash 10,000$ 23,500$ (13,500)$
Accounts receivable, net 30,000 40,000
Inventory 120,000 100,000
Prepaid expenses 3,000 1,200
Total current assets 163,000 164,700
Property and equipment:
Land 50,000 40,000
Buildings and equipment, net 120,000 85,000
Total property and equipment 170,000 125,000
Total assets 333,000$ 289,700$
$10,000 – $23,500 = $(13,500)

Increase (Decrease)
1999 1998 Amount %
Assets
Current assets:
Cash 10,000$ 23,500$ (13,500)$ (57.4)
Accounts receivable, net 30,000 40,000
Inventory 120,000 100,000
Prepaid expenses 3,000 1,200
Total current assets 163,000 164,700
Property and equipment:
Land 50,000 40,000
Buildings and equipment, net 120,000 85,000
Total property and equipment 170,000 125,000
Total assets 333,000$ 289,700$
($10,000 ÷ $23,500) × 100% = 57.4%

Increase (Decrease)
1999 1998 Amount %
Assets
Current assets:
Cash 10,000$ 23,500$ (13,500)$ (57.4)
Accounts receivable, net 30,000 40,000 (10,000) (25.0)
Inventory 120,000 100,000 20,000 20.0
Prepaid expenses 3,000 1,200 1,800 150.0
Total current assets 163,000 164,700 (1,700) (1.0)
Property and equipment:
Land 50,000 40,000 10,000 25.0
Buildings and equipment, net 120,000 85,000 35,000 41.2
Total property and equipment 170,000 125,000 45,000 36.0
Total assets 333,000$ 289,700$ 43,300$ 14.9
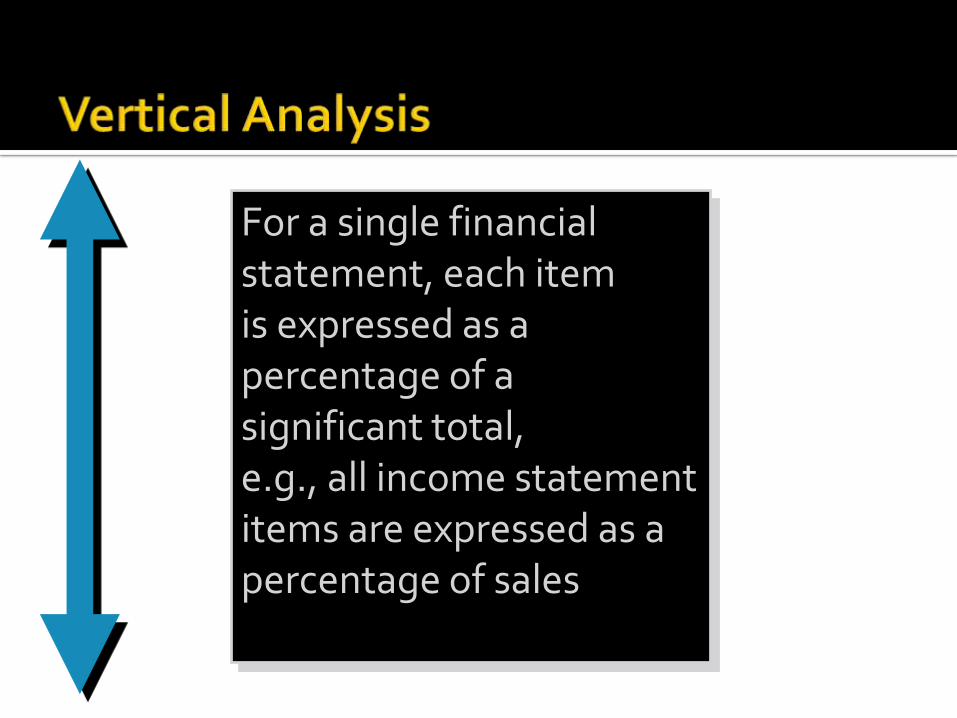
For a single financial statement, each item is expressed as a percentage of a significant total, e.g., all income statement items are expressed as a percentage of sales
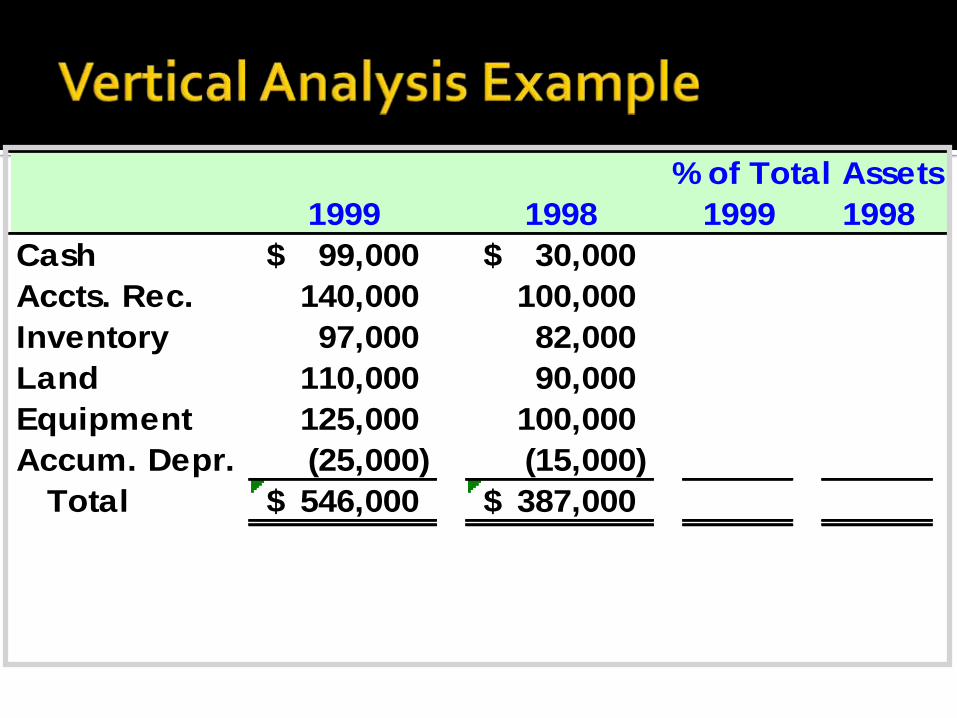
% of Total Assets
1999 1998 1999 1998
Cash 99,000$ 30,000$
Accts. Rec. 140,000 100,000
Inventory 97,000 82,000
Land 110,000 90,000
Equipment 125,000 100,000
Accum. Depr. (25,000) (15,000)
Total 546,000$ 387,000$

FAAB Company
Balance Sheet (Assets)
At December 31, 1999 and 1998
% of Total Assets
1999 1998 1999 1998
Cash 99,000$ 30,000$ 18% 8%
Accts. Rec. 140,000 100,000 26% 26%
Inventory 97,000 82,000 18% 21%
Land 110,000 90,000 20% 23%
Equipment 125,000 100,000 23% 26%
Accum. Depr. (25,000) (15,000) -5% -4%
Total 546,000$ 387,000$ 100% 100%
$99000 ÷ $546,000 = 18% rounded$30,000 ÷ $387,000 = 8% rounded

Financial statements that show only percentages and no absolute dollar amounts

Show changes over time in given financial statement items (can help evaluate financial information of several years)

Wheeler, Inc. provides you with the following operating data and asks that you prepare a
trend analysis.
FAAB Pvt Ltd
Operating Data
1999 1998 1997 1996 1995
Revenues 2,405$ 2,244$ 2,112$ 1,991$ 1,820$
Expenses 2,033 1,966 1,870 1,803 1,701
Net income 372$ 278$ 242$ 188$ 119$

Wheeler, Inc. provides you with the following operating data and asks that you prepare a
trend analysis.
FAAB Pvt Ltd
Operating Data
1999 1998 1997 1996 1995
Revenues 2,405$ 2,244$ 2,112$ 1,991$ 1,820$
Expenses 2,033 1,966 1,870 1,803 1,701
Net income 372$ 278$ 242$ 188$ 119$
$1,991 - $1,820 = $171

Using 1995 as the base year, we develop the following percentage relationships.
FAAB Pvt Ltd
Operating Data
1999 1998 1997 1996 1995
Revenues 132% 123% 116% 109% 100%
Expenses 120% 116% 110% 106% 100%
Net income 313% 234% 203% 158% 100%
$1,991 - $1,820 = $171
$171 ÷ $1,820 = 9% rounded
Expression of logical relationships between items in a financial statement of a single period (e.g., percentage relationship between revenue and net income)
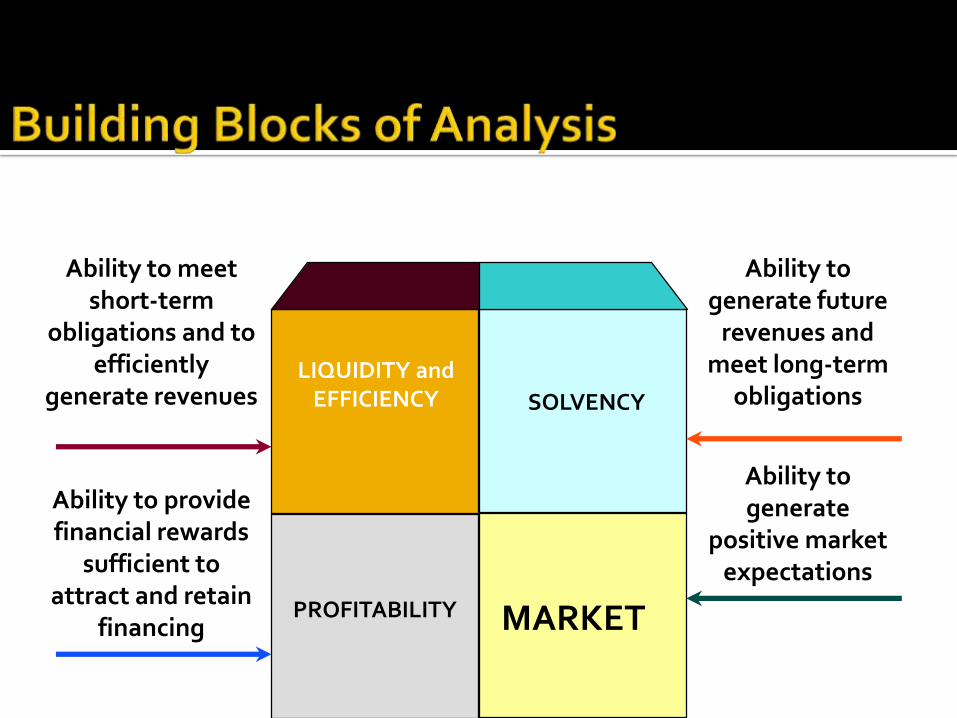
LIQUIDITY and EFFICIENCY SOLVENCY
PROFITABILITY MARKET
Ability to meet short-term
obligations and to efficiently
generate revenues
Ability to generate future
revenues and meet long-term
obligations
Ability to generate
positive market expectations
Ability to provide financial rewards
sufficient to attract and retain
financing

As Percentage - such as 25% or 50% . Forexample if net profit is Rs.25,000/- and the sales isRs.1,00,000/- then the net profit can be said to be25% of the sales.
As Proportion - The above figures may beexpressed in terms of the relationship between netprofit to sales as 1 : 4.
As Pure Number /Times - The same can also beexpressed in an alternatively way such as the sale is 4times of the net profit or profit is 1/4th of the sales.

Balance Sheet Ratio
P&L Ratio or Income/RevenueStatement Ratio
Balance Sheet and Profit & Loss Ratio
Financial Ratio Operating Ratio Composite Ratio
Current RatioQuick Asset RatioProprietary RatioDebt Equity Ratio
Gross Profit RatioOperating RatioExpense RatioNet profit RatioStock Turnover Ratio
Fixed Asset Turnover Ratio, Return on Total Resources Ratio, Return on Own Funds Ratio, Earning per Share Ratio, Debtors’ Turnover Ratio,

Thank You