financial report (u.s. version) year ended 30 june 2016 · annual report 2016 . 1. contents. ......
TRANSCRIPT

Financial Report (U.S. Version) Year ended 30 June 2016

This page has been intentionally left blank
Commonwealth Bank of Australia – Annual Report 2016 1
Contents
Introduction 2
Directors’ Report 3
Financial Statements 37
Income Statements 38
Statements of Comprehensive Income 39
Balance Sheets 40
Statements of Changes in Equity 41
Statements of Cash Flows 43
Notes to the Financial Statements 45
Directors’ Declaration 145
Independent Auditor’s Report 146

Introduction
2 Commonwealth Bank of Australia – Annual Report 2016
The Commonwealth Bank of Australia Financial Report
(US Version) - Year Ended 30 June 2016, which contains
the financial statements for the year ended 30 June 2014,
2015 and 2016 and as of 30 June 2015 and 2016 (the
“2016 Financial Report”) should be read in conjunction with:
The Commonwealth Bank of Australia Financial
Report (US version) – Year Ended 30 June 2015,
which contains the Financial Statements for the years
ended 30 June 2013, 2014 and 2015 and as at
30 June 2014 and 2015 (the “2015 Financial Report”);
and
The Commonwealth Bank of Australia Basel III Pillar 3
Capital Adequacy and Risk Disclosures as at
30 June 2016, in each case, as found on the
US Investor Website located at:
www.commbank.com.au/usinvestors (the “US Investor
Website”).

Directors’ Report
3 Commonwealth Bank of Australia – Annual Report 2016
The Directors of the Commonwealth Bank of Australia submit their report, together with the financial report of the Commonwealth
Bank of Australia (the Bank) and of the Group, being the Bank and its controlled entities, for the year ended 30 June 2016.
The names of the Directors holding office during the financial year are set out below, together with details of Directors’
experience, qualifications and special responsibilities.
David Turner, Chairman
Director of the Bank since August 2006.
David Turner was appointed Chairman of the Bank in
February 2010.
He is Chairman of the Board Performance and Renewal
Committee, and a member of the Risk Committee and the
Remuneration Committee.
Mr Turner has extensive experience in finance, international
business and governance.
He was Chairman of Cobham plc from May 2008 until
May 2010. He has held a number of directorships including
Whitbread plc and the Iron Trades Insurance Group and has
been a member of the Quotations Committee of the London
Stock Exchange.
He was Chief Executive Officer of Brambles Limited from
October 2003 until his retirement in June 2007, and formerly
Chief Financial Officer from 2001 until 2003. He was also
Finance Director of GKN plc and Finance Director of Booker
plc, and spent six years with Mobil Oil.
Other Directorships and Interests: Ashurst, O’Connell Street
Associates Pty Ltd and Great Barrier Reef Foundation.
Qualifications: Fellow of the Australian Institute of Company
Directors and Fellow of the Institute of Chartered Accountants
in England and Wales.
Mr Turner is a resident of New South Wales. Age 71.
Ian Narev, Managing Director and Chief Executive Officer
Director of the Bank since December 2011.
Ian Narev was appointed Managing Director and Chief
Executive Officer on 1 December 2011.
Mr Narev joined the Group in May 2007. From then until
January 2009, he was Group Head of Strategy, with
responsibility for corporate strategy development, mergers
and acquisitions and major cross business strategic
initiatives.
From January 2009 until September 2011, Mr Narev was
Group Executive, Business and Private Banking, one of the
Group’s six operating divisions.
Prior to joining CBA, Mr Narev was a partner of McKinsey’s
New York, Sydney and Auckland offices (1998 to 2007). He
became a global partner in 2003, and from 2005 until his
departure in 2007 was head of McKinsey’s New Zealand
office. Prior to joining McKinsey, Mr. Narev was a lawyer
specialising in mergers and acquisitions.
Other Directorships and Interests: Sydney Theatre Company
(Chairman), Business Council of Australia, Financial Markets
Foundation for Children and Institute of International Finance.
Qualifications: BA LLB (Hons) (Auckland), LLM (Cantab), LLM
(NYU).
Mr Narev is a resident of New South Wales. Age 49.
Sir John Anderson, KBE
Director of the Bank since March 2007.
Sir John Anderson is a member of the Risk Committee, the
Board Performance and Renewal Committee and the Audit
Committee.
He has held many senior positions in the New Zealand
finance industry, including Chief Executive Officer and
Director of ANZ National Bank Limited from 2003 until 2005
and the National Bank of New Zealand Limited from 1989
until 2003.
In 1994, he was awarded Knight Commander of the Civil
Division of the Order of the British Empire, and in 2005
received the inaugural Blake Medal for “Outstanding
Leadership Contributions to New Zealand”. In 2012, he was
awarded an Honorary Doctorate of Commerce by Victoria
University, Wellington.
Other Directorships and Interests: APN News & Media Ltd,
NPT Ltd (Chairman), Steel & Tube Holdings Ltd (Chairman)
and T&G Global Ltd (Deputy Chairman).
Qualifications: Fellow of Chartered Accountants Australia and
New Zealand, Fellow of the Institute of Financial Professionals
New Zealand, Fellow of the Institute of Directors and Life
Member of the Australian Institute of Banking and Finance.
Sir John is a resident of Wellington, New Zealand. Age 71.

Directors’ Report
4 Commonwealth Bank of Australia – Annual Report 2016
Shirish Apte
Director of the Bank since June 2014.
Shirish Apte is a member of the Audit Committee. He is also a
member of the Risk Committee and from the end of
September 2016 will assume the role of Chairman of that
Committee.
He was Co-Chairman of Citi Asia Pacific Banking from
January 2012 until January 2014. Previously he was Chief
Executive Officer of Citi Asia Pacific (2009 to 2011), with
responsibility for South Asia, including Australia, New
Zealand, India and ASEAN countries.
He has more than 32 years’ experience with Citi, including as
CEO of Central & Eastern Europe, Middle East & Africa and,
before that, as Country Manager and Deputy President of
Citibank Handlowy, Poland, where he is now Vice Chairman
of the Supervisory Board.
Other Directorships and Interests: IHH Healthcare Bhd,
Crompton Greaves Ltd, Citibank Japan, AIG Asia Pacific Pte
Ltd, Clifford Capital Pte Ltd, Pierfront Capital Mezzanine Fund
Pte Ltd (Chairman), Parkway Hospitals Singapore, Acibadem
Hospital Group, Turkey and Supervisory Board of Citibank
Handlowy, Poland.
Qualifications: Chartered Accountant, Institute of Chartered
Accountants in England and Wales and Bachelor of Commerce
(Calcutta), MBA (London Business School).
Mr Apte is a resident of Singapore. Age 63.
Sir David Higgins
Director of the Bank since September 2014.
Sir David Higgins is the Chairman of the Remuneration
Committee and a member of the Risk Committee.
Sir David is the Chairman of High Speed Two (HS2) Ltd, the
company responsible for developing and promoting the UK’s
new high speed rail network. He is a senior advisor to Global
Infrastructure Partners (US) and to Lone Star Funds. Prior to
that, he was Chief Executive Officer of Network Rail
Infrastructure Ltd which is involved in the maintenance and
development of railway infrastructure throughout the UK.
From 2006 until 2011, he was Chief Executive Officer of the
Olympic Delivery Authority where he oversaw the creation of
the London 2012 Olympic Games venues, the Olympic
Village and transport projects.
For the three years prior to 2005, he was Chief Executive
Officer of English Partnerships, the UK Government’s national
housing and regeneration agency. In 1985, he joined Lend
Lease, and was Managing Director and Chief Executive
Officer of Lend Lease from 1995 until 2002.
Other Directorships and Interests: High Speed Two (HS2)
Ltd (Chairman).
Qualifications: Bachelor of Engineering (Civil), USyd, and
Diploma, Securities Institute of Australia.
Sir David is a resident of London, United Kingdom. Age 61.
Launa Inman
Director of the Bank since March 2011.
Launa Inman is a member of the Audit Committee and the
Remuneration Committee.
She was Managing Director and Chief Executive Officer of
Billabong International Limited from May 2012 until
August 2013. Prior to this, she was Managing Director of
Target Australia Pty Limited (2005 to 2011), and Managing
Director of Officeworks (2004 to 2005).
She has significant international and Australian experience in
retailing, wholesale, property and logistics, as well as
extensive marketing experience in traditional, digital and
social media channels.
Other Directorships and Interests: Bellamy’s Australia Ltd,
Super Retail Group Ltd, Precinct Properties New Zealand Ltd,
Virgin Australia Melbourne Fashion Festival and The Alannah
and Madeline Foundation.
Qualifications: MCom, University of South Africa (UNISA),
BCom (Hons) (UNISA), BCom (Economics and Accounting)
(UNISA) and Australian Institute of Company Directors
(Member).
Ms Inman is a resident of Victoria. Age 60.

Directors’ Report
5 Commonwealth Bank of Australia – Annual Report 2016
Catherine Livingstone (Appointed 1 March 2016)
Director of the Bank since March 2016.
Catherine Livingstone is a member of the Audit Committee.
Ms Livingstone is a highly respected company director with
extensive business and finance experience across a broad
range of industries and organisations. She is also a Chartered
Accountant.
Her executive career spanned more than 22 years in which
she held general management and finance leadership roles,
primarily in the medical devices sector and including six years
as the Chief Executive Officer of Cochlear Limited.
Ms Livingstone was the former Chairman of Telstra
Corporation Limited and of the CSIRO. She has served on the
Boards of Macquarie Group Limited, Goodman Fielder
Limited and Rural Press Limited and has contributed to the
work of the Innovation and Productivity Council for the New
South Wales Government. In 2008, Catherine was awarded
Officer of the Order of Australia.
Other Directorships and Interests: WorleyParsons Ltd, The
George Institute for Global Health, Saluda Medical Pty Ltd,
Business Council of Australia (President) and Australian
Museum Trust (President).
Qualifications: BA (Accounting) (Hons), Fellow of Chartered
Accountants Australia and New Zealand, Fellow of Australian
Academy of Technological Sciences and Engineering, Fellow
of the Australian Institute of Company Directors and Fellow of
the Australian Academy of Science.
Ms Livingstone is a resident of New South Wales. Age 60.
Brian Long
Director of the Bank since September 2010.
Brian Long is Chairman of the Audit Committee, a member of
the Risk Committee and the Board Performance and Renewal
Committee.
He retired as a partner of EY in 30 June 2010. Until that time
he was the Chairman of both the EY Global Advisory Council
and the Oceania Area Advisory Council. He was one of the
firm’s most experienced audit partners with over 30 years’
experience in serving as audit signing partner on major
Australian public companies including those in the financial
services, property, insurance and media sectors.
Mr Long is currently a member of the NSW Court
Consultation Committee as an appointee of the NSW Attorney
General.
Other Directorships and Interests: Brambles Ltd, Ten
Network Holdings Limited (Ceased 25 July 2016), Cantarella
Bros Pty Ltd and a Member of the Council of the University of
NSW.
Qualifications: Fellow of Chartered Accountants Australia and
New Zealand.
Mr Long is a resident of New South Wales. Age 70.
Andrew Mohl
Director of the Bank since July 2008.
Andrew Mohl is a member of the Risk Committee and the
Remuneration Committee.
He has over 35 years’ financial services experience. He was
Managing Director and Chief Executive Officer of AMP
Limited from October 2002 until December 2007.
His previous roles at AMP included Managing Director, AMP
Financial Services and Managing Director and Chief
Investment Officer, AMP Asset Management.
He was a former Group Chief Economist, Chief Manager,
Retail Banking and Managing Director, ANZ Funds
Management at ANZ Banking Group. Mr. Mohl commenced
his career at the Reserve Bank of Australia where his roles
included Senior Economist and Deputy Head of Research.
Other Directorships and Interests: Nil.
Qualifications: BEc (Hons), Monash.
Mr Mohl is a resident of New South Wales. Age 60.
Directors’ Report
6 Commonwealth Bank of Australia – Annual Report 2016
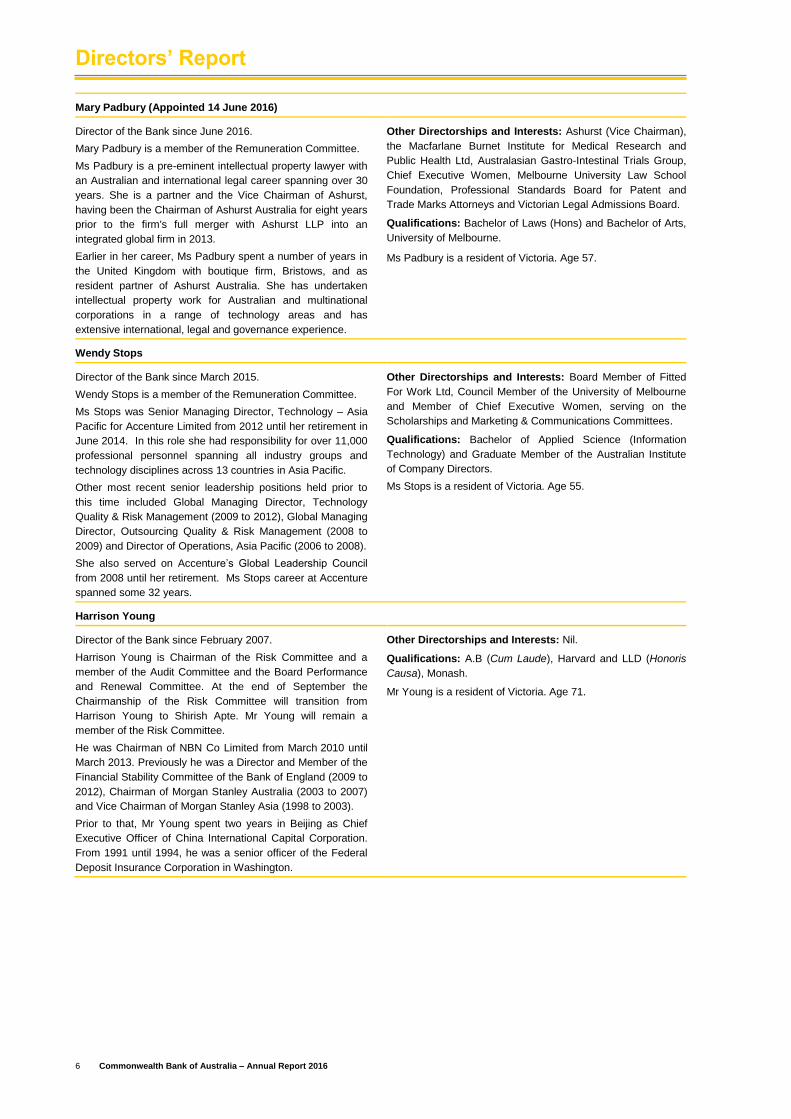
Mary Padbury (Appointed 14 June 2016)
Director of the Bank since June 2016.
Mary Padbury is a member of the Remuneration Committee.
Ms Padbury is a pre-eminent intellectual property lawyer with
an Australian and international legal career spanning over 30
years. She is a partner and the Vice Chairman of Ashurst,
having been the Chairman of Ashurst Australia for eight years
prior to the firm's full merger with Ashurst LLP into an
integrated global firm in 2013.
Earlier in her career, Ms Padbury spent a number of years in
the United Kingdom with boutique firm, Bristows, and as
resident partner of Ashurst Australia. She has undertaken
intellectual property work for Australian and multinational
corporations in a range of technology areas and has
extensive international, legal and governance experience.
Other Directorships and Interests: Ashurst (Vice Chairman),
the Macfarlane Burnet Institute for Medical Research and
Public Health Ltd, Australasian Gastro-Intestinal Trials Group,
Chief Executive Women, Melbourne University Law School
Foundation, Professional Standards Board for Patent and
Trade Marks Attorneys and Victorian Legal Admissions Board.
Qualifications: Bachelor of Laws (Hons) and Bachelor of Arts,
University of Melbourne.
Ms Padbury is a resident of Victoria. Age 57.
Wendy Stops
Director of the Bank since March 2015.
Wendy Stops is a member of the Remuneration Committee.
Ms Stops was Senior Managing Director, Technology – Asia
Pacific for Accenture Limited from 2012 until her retirement in
June 2014. In this role she had responsibility for over 11,000
professional personnel spanning all industry groups and
technology disciplines across 13 countries in Asia Pacific.
Other most recent senior leadership positions held prior to
this time included Global Managing Director, Technology
Quality & Risk Management (2009 to 2012), Global Managing
Director, Outsourcing Quality & Risk Management (2008 to
2009) and Director of Operations, Asia Pacific (2006 to 2008).
She also served on Accenture’s Global Leadership Council
from 2008 until her retirement. Ms Stops career at Accenture
spanned some 32 years.
Other Directorships and Interests: Board Member of Fitted
For Work Ltd, Council Member of the University of Melbourne
and Member of Chief Executive Women, serving on the
Scholarships and Marketing & Communications Committees.
Qualifications: Bachelor of Applied Science (Information
Technology) and Graduate Member of the Australian Institute
of Company Directors.
Ms Stops is a resident of Victoria. Age 55.
Harrison Young
Director of the Bank since February 2007.
Harrison Young is Chairman of the Risk Committee and a
member of the Audit Committee and the Board Performance
and Renewal Committee. At the end of September the
Chairmanship of the Risk Committee will transition from
Harrison Young to Shirish Apte. Mr Young will remain a
member of the Risk Committee.
He was Chairman of NBN Co Limited from March 2010 until
March 2013. Previously he was a Director and Member of the
Financial Stability Committee of the Bank of England (2009 to
2012), Chairman of Morgan Stanley Australia (2003 to 2007)
and Vice Chairman of Morgan Stanley Asia (1998 to 2003).
Prior to that, Mr Young spent two years in Beijing as Chief
Executive Officer of China International Capital Corporation.
From 1991 until 1994, he was a senior officer of the Federal
Deposit Insurance Corporation in Washington.
Other Directorships and Interests: Nil.
Qualifications: A.B (Cum Laude), Harvard and LLD (Honoris
Causa), Monash.
Mr Young is a resident of Victoria. Age 71.
Directors’ Report
7 Commonwealth Bank of Australia – Annual Report 2016
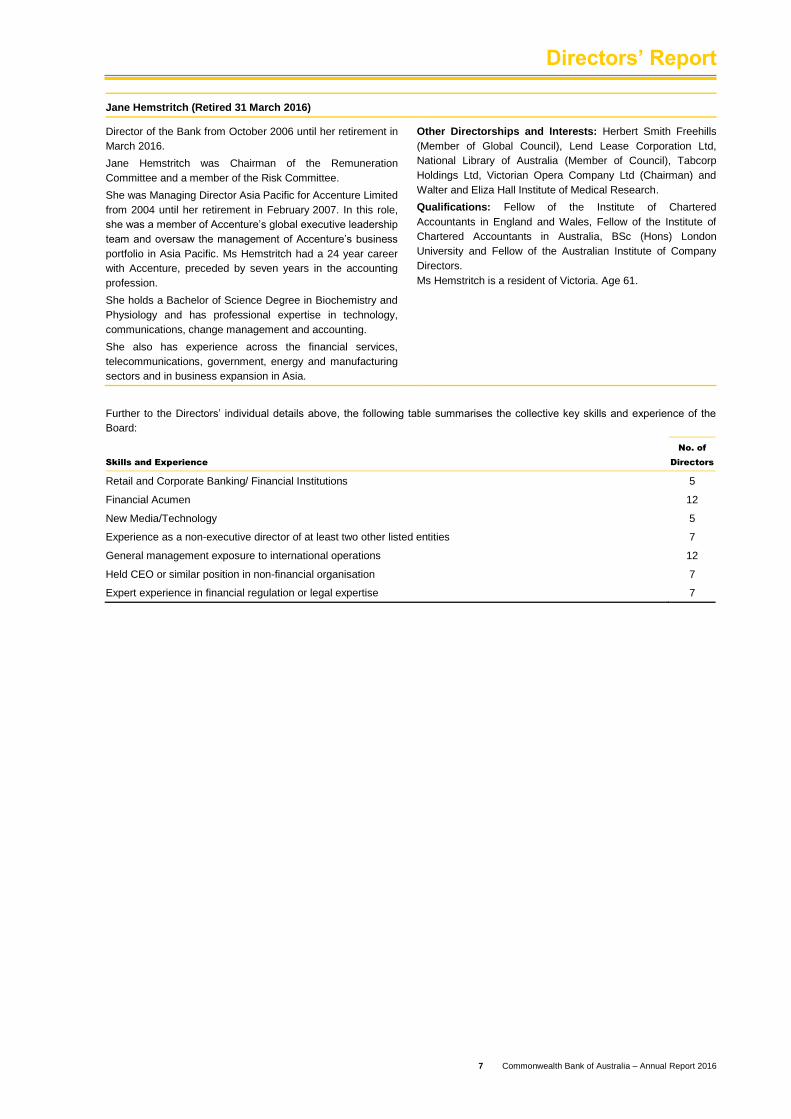
Jane Hemstritch (Retired 31 March 2016)
Director of the Bank from October 2006 until her retirement in
March 2016.
Jane Hemstritch was Chairman of the Remuneration
Committee and a member of the Risk Committee.
She was Managing Director Asia Pacific for Accenture Limited
from 2004 until her retirement in February 2007. In this role,
she was a member of Accenture’s global executive leadership
team and oversaw the management of Accenture’s business
portfolio in Asia Pacific. Ms Hemstritch had a 24 year career
with Accenture, preceded by seven years in the accounting
profession.
She holds a Bachelor of Science Degree in Biochemistry and
Physiology and has professional expertise in technology,
communications, change management and accounting.
She also has experience across the financial services,
telecommunications, government, energy and manufacturing
sectors and in business expansion in Asia.
Other Directorships and Interests: Herbert Smith Freehills
(Member of Global Council), Lend Lease Corporation Ltd,
National Library of Australia (Member of Council), Tabcorp
Holdings Ltd, Victorian Opera Company Ltd (Chairman) and
Walter and Eliza Hall Institute of Medical Research.
Qualifications: Fellow of the Institute of Chartered
Accountants in England and Wales, Fellow of the Institute of
Chartered Accountants in Australia, BSc (Hons) London
University and Fellow of the Australian Institute of Company
Directors.
Ms Hemstritch is a resident of Victoria. Age 61.
Further to the Directors’ individual details above, the following table summarises the collective key skills and experience of the
Board:
Skills and Experience
No. of
Directors
Retail and Corporate Banking/ Financial Institutions 5
Financial Acumen 12
New Media/Technology 5
Experience as a non-executive director of at least two other listed entities 7
General management exposure to international operations 12
Held CEO or similar position in non-financial organisation 7
Expert experience in financial regulation or legal expertise 7

Directors’ Report
8 Commonwealth Bank of Australia – Annual Report 2016
Other Directorships
The Directors held the following directorships in other listed companies in the three years prior to the end of the 2016 financial
year:
Director Company Date Appointed
Date of Ceasing
(if applicable)
Sir John Anderson
Jane Hemstritch
APN News & Media Limited
Tabcorp Holdings Limited
26/03/2015
13/11/2008
Santos Limited 16/02/2010 04/05/2016
Lend Lease Corporation Limited 01/09/2011
Launa Inman Billabong International Limited 14/05/2012 02/08/2013
Bellamy’s Australia Limited 18/02/2015
Catherine Livingstone
Super Retail Group Limited
WorleyParsons Limited
Telstra Corporation Limited
Macquarie Bank Limited
Macquarie Group Limited
21/10/2015
01/07/2007
17/11/2000
19/11/2003
30/08/2007
27/04/2016
25/07/2013
25/07/2013
Brian Long Ten Network Holdings Limited 01/07/2010 25/07/2016
Brambles Limited 01/07/2014
Directors’ Meetings
The number of Directors’ meetings (including meetings of standing committees of Directors) and the number of meetings
attended by each of the Directors during the financial year were:
Director
No. of Meetings
Held (1)
No. of Meetings
Attended
David Turner
Ian Narev
John Anderson
11
11
11
11
11
9
Shirish Apte 11 11
Jane Hemstritch (2) 9 9
David Higgins 11 11
Launa Inman
Catherine Livingstone (3)
11
3
10
2
Brian Long 11 11
Andrew Mohl
Mary Padbury (4)
11
1
11
1
Wendy Stops
Harrison Young
11
11
11
11
(1) The number of meetings held during the time the Director was a member of the Board and was eligible to attend.
(2) Jane Hemstritch retired effective 31 March 2016.
(3) Catherine Livingstone commenced effective 1 March 2016.
(4) Mary Padbury commenced effective 14 June 2016.
Directors’ Report
9 Commonwealth Bank of Australia – Annual Report 2016
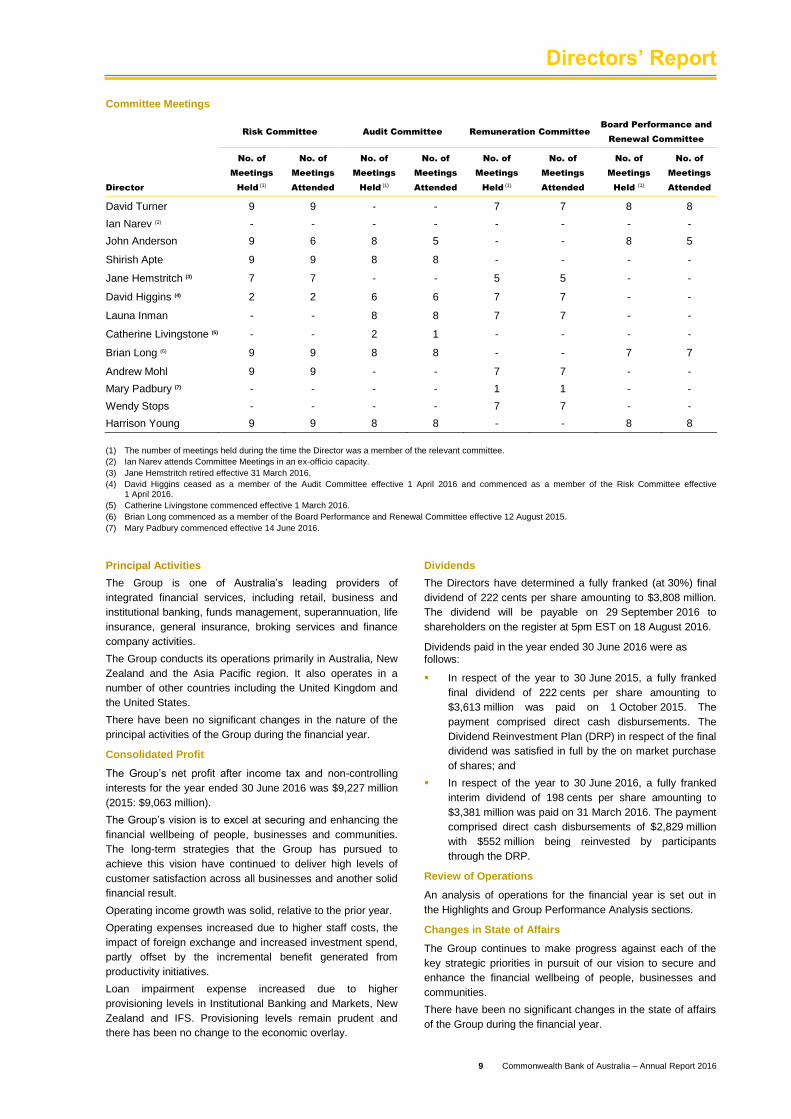
Committee Meetings
Risk Committee Audit Committee Remuneration Committee
Board Performance and
Renewal Committee
Director
No. of
Meetings
Held (1)
No. of
Meetings
Attended
No. of
Meetings
Held (1)
No. of
Meetings
Attended
No. of
Meetings
Held (1)
No. of
Meetings
Attended
No. of
Meetings
Held (1)
No. of
Meetings
Attended
David Turner
Ian Narev (2)
John Anderson
9
-
9
9
-
6
-
-
8
-
-
5
7
-
-
7
-
-
8
-
8
8
-
5
Shirish Apte 9 9 8 8 - - - -
Jane Hemstritch (3) 7 7 - - 5 5 - -
David Higgins (4) 2 2 6 6 7 7 - -
Launa Inman - - 8 8 7 7 - -
Catherine Livingstone (5) - - 2 1 - - - -
Brian Long (6) 9 9 8 8 - - 7 7
Andrew Mohl
Mary Padbury (7)
Wendy Stops
Harrison Young
9
-
-
9
9
-
-
9
-
-
-
8
-
-
-
8
7
1
7
-
7
1
7
-
-
-
-
8
-
-
-
8
(1) The number of meetings held during the time the Director was a member of the relevant committee.
(2) Ian Narev attends Committee Meetings in an ex-officio capacity.
(3) Jane Hemstritch retired effective 31 March 2016.
(4) David Higgins ceased as a member of the Audit Committee effective 1 April 2016 and commenced as a member of the Risk Committee effective 1 April 2016.
(5) Catherine Livingstone commenced effective 1 March 2016.
(6) Brian Long commenced as a member of the Board Performance and Renewal Committee effective 12 August 2015.
(7) Mary Padbury commenced effective 14 June 2016.
Principal Activities
The Group is one of Australia’s leading providers of
integrated financial services, including retail, business and
institutional banking, funds management, superannuation, life
insurance, general insurance, broking services and finance
company activities.
The Group conducts its operations primarily in Australia, New
Zealand and the Asia Pacific region. It also operates in a
number of other countries including the United Kingdom and
the United States.
There have been no significant changes in the nature of the
principal activities of the Group during the financial year.
Consolidated Profit
The Group’s net profit after income tax and non-controlling
interests for the year ended 30 June 2016 was $9,227 million
(2015: $9,063 million).
The Group’s vision is to excel at securing and enhancing the
financial wellbeing of people, businesses and communities.
The long-term strategies that the Group has pursued to
achieve this vision have continued to deliver high levels of
customer satisfaction across all businesses and another solid
financial result.
Operating income growth was solid, relative to the prior year.
Operating expenses increased due to higher staff costs, the
impact of foreign exchange and increased investment spend,
partly offset by the incremental benefit generated from
productivity initiatives.
Loan impairment expense increased due to higher
provisioning levels in Institutional Banking and Markets, New
Zealand and IFS. Provisioning levels remain prudent and
there has been no change to the economic overlay.
Dividends
The Directors have determined a fully franked (at 30%) final
dividend of 222 cents per share amounting to $3,808 million.
The dividend will be payable on 29 September 2016 to
shareholders on the register at 5pm EST on 18 August 2016.
Dividends paid in the year ended 30 June 2016 were as follows:
In respect of the year to 30 June 2015, a fully franked
final dividend of 222 cents per share amounting to
$3,613 million was paid on 1 October 2015. The
payment comprised direct cash disbursements. The
Dividend Reinvestment Plan (DRP) in respect of the final
dividend was satisfied in full by the on market purchase
of shares; and
In respect of the year to 30 June 2016, a fully franked
interim dividend of 198 cents per share amounting to
$3,381 million was paid on 31 March 2016. The payment
comprised direct cash disbursements of $2,829 million
with $552 million being reinvested by participants
through the DRP.
Review of Operations
An analysis of operations for the financial year is set out in
the Highlights and Group Performance Analysis sections.
Changes in State of Affairs
The Group continues to make progress against each of the
key strategic priorities in pursuit of our vision to secure and
enhance the financial wellbeing of people, businesses and
communities.
There have been no significant changes in the state of affairs
of the Group during the financial year.

Directors’ Report
10 Commonwealth Bank of Australia – Annual Report 2016
Events Subsequent to Balance Sheet Date
The Bank expects the DRP for the final dividend for the year
ended 30 June 2016 will be satisfied by the issue of shares of
approximately $628 million.
The Directors are not aware of any other matter or
circumstance that has occurred since the end of the financial
year that has significantly affected or may significantly affect
the operations of the Group, the results of those operations or
the state of affairs of the Group in subsequent financial years.
Business Strategies and Future Developments
The Group’s Strategy
Anchored firmly to the Group’s vision to ‘excel at securing and
enhancing the financial wellbeing of people, businesses and
communities’, the Group’s strategy is focussed on creating
long-term value for its customers, shareholders and people.
The Group’s overarching priority is customer focus supported
by four market-leading capabilities: people, productivity,
technology and strength.
Since 2012, the Group has sustained strong performance
across key metrics, including customer satisfaction, total
shareholder returns, productivity and people engagement.
With an ongoing focus on execution, the strategy is
appropriate to deliver future growth for the Group and will
continue to underpin the Group’s performance.
The strategy is split into three elements:
Underpinning the Group’s vision, an overarching
objective of Customer Focus is to continuously improve
the value and experiences provided to customers.
Customers remain the Group’s foremost priority with the
goal to be number one in customer satisfaction across
all segments;
Four capabilities that the Group invests in and
leverages, to reinforce and enhance its competitive
advantage, namely People, Productivity, Technology
and Strength; and
Three growth opportunities that define the most
significant opportunities for the Group to create
shareholder value, namely One CommBank where the
Group aims to meet more of its customers’ financial
needs; continued growth in business and institutional
banking; and disciplined capability-led growth outside
Australia.
There are a number of material business risks that could
adversely affect the Group and the achievement of the
Group’s performance objectives. Those risks and how they
are managed are described in Notes 31 to 34 of the Financial
Statements on pages 100 to 123.
Environmental Reporting
The Group is subject to the Federal Government’s National
Greenhouse and Energy Reporting (NGER) scheme. The
scheme makes it mandatory for controlling corporations to
report annually on greenhouse gas emissions, energy
production and energy consumption, if they exceed certain
threshold levels. The Group has a long history in voluntary
environmental reporting, including Corporate Responsibility
Reporting and CDP (formerly the Carbon Disclosure Project).
As a result, the Group is well placed to meet the NGER
requirements.
The Group is not subject to any other particular or significant
environmental regulation under any law of the
Commonwealth or of a State or Territory, but can incur
environmental liabilities as a lender. The Group Environment
Policy is updated to ensure risk is managed appropriately. For
further details, please see:
https://www.commbank.com.au/content/dam/commbank/abou
t-us/docs/susatinability-20151103-group-environment-
policy.pdf
Directors’ Shareholdings and Options
Particulars of shares held by Directors and the Chief
Executive Officer in the Commonwealth Bank or in a related
body corporate are set out in the Remuneration Report that
forms part of this report.
No options have been granted to the Directors or Chief
Executive Officer during the period.
Options and Share Rights Outstanding
As at the date of this Report there are no employee options
and 2,475,157 share rights outstanding in relation to
Commonwealth Bank ordinary shares.
Directors’ Interests in Contracts
A number of Directors have given written notices, stating that
they hold office in specified companies and accordingly are to
be regarded as having an interest in any contract or proposed
contract that may be made between the Bank and any of
those companies.
Directors’ and Officers’ Indemnity
The Directors, as named on pages 3 to 7 of this report, and
the Secretaries of the Bank, being named on page 11 of this
Report, are indemnified under the Constitution of
Commonwealth Bank of Australia (the Constitution), as are all
senior managers of the Bank.
The indemnity extends to such other officers, employees,
former officers or former employees of the Bank, or of its
related bodies corporate, as the Directors in each case
determine (each, including the Directors and Secretaries,
defined as an ‘Officer’ for the purposes of this section).
The Officers are indemnified on a full indemnity basis and to
the full extent permitted by law against all losses, liabilities,
costs, charges and expenses incurred by the Officer as an
Officer of the Bank or of a related body corporate.
Deeds of Indemnity have been executed by the Bank,
consistent with the Constitution, in favour of each Director of
the Bank which includes indemnification in substantially the
same terms to that provided in the Constitution.
An Indemnity Deed Poll has been executed by the Bank,
consistent with the Constitution which also includes
indemnification in substantially the same terms to that
provided in the Constitution, in favour of each:
secretary and senior manager of the Bank;
director, secretary or senior manager of a related body
corporate of the Bank;
person who, at the prior formal request of the Bank or a
related body corporate, acts as director, secretary or
senior manager of a body corporate which is not a
related body corporate of the Bank (in which case the
indemnity operates only in excess of protection provided
by that body corporate); and
person who, at the request of a related body corporate of
the Bank, acts as a member of the compliance
committee of a registered scheme for which the related
body corporate of the Bank is the responsible entity.
In the case of a partly-owned subsidiary of the Bank, where a
director, secretary or senior manager of that entity is a

Directors’ Report
11 Commonwealth Bank of Australia – Annual Report 2016
nominee of a third party body corporate which is not a related
body corporate of the Bank, the Indemnity Deed Poll will not
apply to that person unless the Bank's CEO has certified that
the indemnity will apply to that person.
Directors’ and Officers’ Insurance
The Bank has, during the financial year, paid an insurance
premium in respect of an insurance policy for the benefit of
the Bank and those named and referred to above including
the directors, secretaries, officers and certain employees of
the Bank and related bodies corporate as defined in the
insurance policy. The insurance is appropriate pursuant to
section 199B of the Corporations Act 2001 (Corporations Act
2001). In accordance with commercial practice, the insurance
policy prohibits disclosure of the terms of the policy, including
the nature of the liability insured against and the amount of
the premium.
Proceedings on behalf of the Bank
No application has been made under section 237 of the
Corporations Act 2001 in respect of the Bank, and there are
no proceedings that a person has brought or intervened in on
behalf of the Bank under that section.
Rounding and Presentation of Amounts
Unless otherwise indicated, the Bank has rounded off
amounts in this Directors’ Report and the accompanying
financial statements to the nearest million dollars in
accordance with ASIC Corporations Instrument 2016/191.
The financial information included in this Annual Report has
been prepared and presented in accordance with Australian
Accounting Standards, unless otherwise indicated. This
ensures compliance with International Financial Reporting
Standards.
The Group manages its business performance using a “cash
basis” profit measure. The key items that are excluded from
statutory profit for this purpose are non-recurring or not
considered representative of the Group’s ongoing financial
performance. Profit on an “underlying basis” is used primarily
in the Wealth Management businesses. It provides a profit
measure that excludes both the volatility of equity markets on
shareholder funds and the mark to market revaluations on the
Guaranteed Annuity portfolio for a measure of core operating
performance.
Corporate Governance Statement
The Bank is committed to ensuring that its policies and
practices reflect a high standard of corporate governance.
The Board has adopted a comprehensive framework of
Corporate Governance Guidelines, designed to balance
performance and conformance.
Throughout the 2016 financial year, the Bank’s governance
arrangements were consistent with the Corporate
Governance Principles and Recommendations (3rd edition)
published by the ASX Corporate Governance Council.
The Group’s Corporate Governance Statement can be
viewed at:
www.commbank.com.au/about-us/shareholders/corporate-
profile/corporate-governance.
Company Secretaries
Details of the Bank’s Company Secretaries, including their
experience and qualifications, are set out below.
Taryn Morton was appointed Group Company Secretary of
the Bank in October 2015. She has over 17 years of
combined corporate governance, company secretarial and
legal experience. Prior to the Bank, she was with Insurance
Australia Group and before that held the role of Company
Secretary of Qantas Airways, where she was also a director
of Qantas subsidiaries. Her earlier governance roles were at
Babcock & Brown, Ten Network Holdings and Ashurst. She
holds Bachelor degrees in Arts and Law and is a Fellow of the
Governance Institute of Australia.
David Cohen was a Company Secretary of the Bank from
February 2015 until June 2016. David joined the Bank in 2008
and was appointed to the position of Group Chief Risk Officer
with effect from 1 July 2016. Prior to his current role, David
held the position of Group General Counsel and Group
Executive Corporate Affairs with responsibility for advising the
CEO and the Board on legal matters and for the Group’s
external and internal affairs, communications, sustainability
and corporate governance. Previously he was General
Counsel of AMP and a partner with Allens Arthur Robinson
for 12 years.
Carla Collingwood was appointed a Company Secretary of
the Bank in July 2005. From 1994 until 2005, she was a
solicitor with the Bank’s Legal Services, before being
appointed to the position of General Manager, Secretariat.
She holds a Bachelor of Laws degree (Hons) and a Graduate
Diploma in Applied Corporate Governance from the
Governance Institute of Australia. She is a Graduate of the
Australian Institute of Company Directors.

Directors’ Report – Remuneration Report
12 Commonwealth Bank of Australia – Annual Report 2016
Message from the Remuneration Committee Chairman
Dear Shareholder,
I am pleased to present my first CBA Group Remuneration
Report in 2016.
The CBA remuneration framework is designed to create
sustainable value for shareholders, customers, our people
and communities.
The report reflects the Board’s assessment of the Group’s
performance for the year ended 30 June 2016 and includes
consideration of any material risk incidents and conduct.
This year, the Committee also looked forward and made
changes to both short-term and long-term incentive
arrangements to ensure financial and reputational
performance are appropriately balanced.
Remuneration Outcomes
In relation to the 2016 financial year, in aggregate, Group
Executives received on-target short-term incentive (STI)
awards reflecting the Group’s achievement of solid overall
performance in challenging circumstances. In determining STI
outcomes, the Committee assessed individual performance
and gave consideration to the impact of CommInsure issues
on the Group’s performance. As a result, the Committee
applied some discretionary reductions, resulting in STI
outcomes overall being lower than last year.
The Committee also commissioned an independent review of
performance measures for roles within CommInsure. The
review did not identify any issues that would drive undesirable
outcomes for customers. There are separate reviews
underway into declined claims over the past five years and
the ethical concerns raised in the media in March and April
2016. The reviews are ongoing, and to date we have not
found evidence to substantiate any of the claims of
widespread problems or willful misconduct. As with any issue,
if any material risk items are identified over the coming year,
the Committee will again consider impacts on Executive
remuneration outcomes as part of next year’s review.
In section 3.4, you will note that the CEO’s total remuneration
received during the 2016 financial year increased significantly
from last year. This was due to equity awards granted through
the Group Leadership Reward Plan (GLRP) in 2011 which
covered the four year period to mid-2015. These awards
vested during the year ended 30 June 2016, reflecting total
returns to shareholders of 110% and top quartile performance
by the CBA Group over the four year period.
Next year’s report will show significantly lower GLRP vesting,
which relates to the 2012 award. There was no vesting of the
Total Shareholder Return (TSR) performance component for
the 2012 GLRP award, while Customer Satisfaction
performance, which counted for 25% of the award, was
strong. As a result the award vested to Executives at 20.31%
of the maximum. Consistent with previous commitments, no
upward discretion was exercised by the Committee in relation
to the outcome of the 2012 award. This award will be
reflected in the CEO’s and Group Executives’ total
remuneration during the 2017 financial year.
During the period Group Executives received modest fixed
remuneration increases, less than 1% on average. The CEO
did not receive an increase and there was no increase to
Board and Committee fees during 2016.
Remuneration Changes
During the 2016 financial year, the Committee undertook a
review of remuneration arrangements for the CEO and Group
Executives. The objective of the review was to ensure our
executive remuneration approach drives a strong focus on
achieving long-term superior performance for the Group’s key
stakeholder groups being shareholders, customers, our
people and the community in line with our vision and values.
On the basis of the review the Board has approved the
following changes for the 2017 financial year:
Executive STI balanced performance scorecards, which
largely determine individual outcomes, will include an
assessment of exemplary leadership and exceptional
personal demonstration of the Group’s vision and
values; and
The 2016 GLRP will incorporate a new focus on our
people and the community, weighted at 25%, measuring
long-term progress and achievement in the areas of
diversity and inclusion, sustainability, and culture. TSR
and customer satisfaction performance components,
weighted 50% and 25% respectively, remain to continue
our strong focus on delivering long-term value for
shareholders and better customer outcomes. Changes
to the GLRP are explained in more detail in the report.
I invite you to review the full report, and thank you for your interest.
Sir David Higgins
Committee Chairman
9 August 2016
Directors’ Report – Remuneration Report
13 Commonwealth Bank of Australia – Annual Report 2016
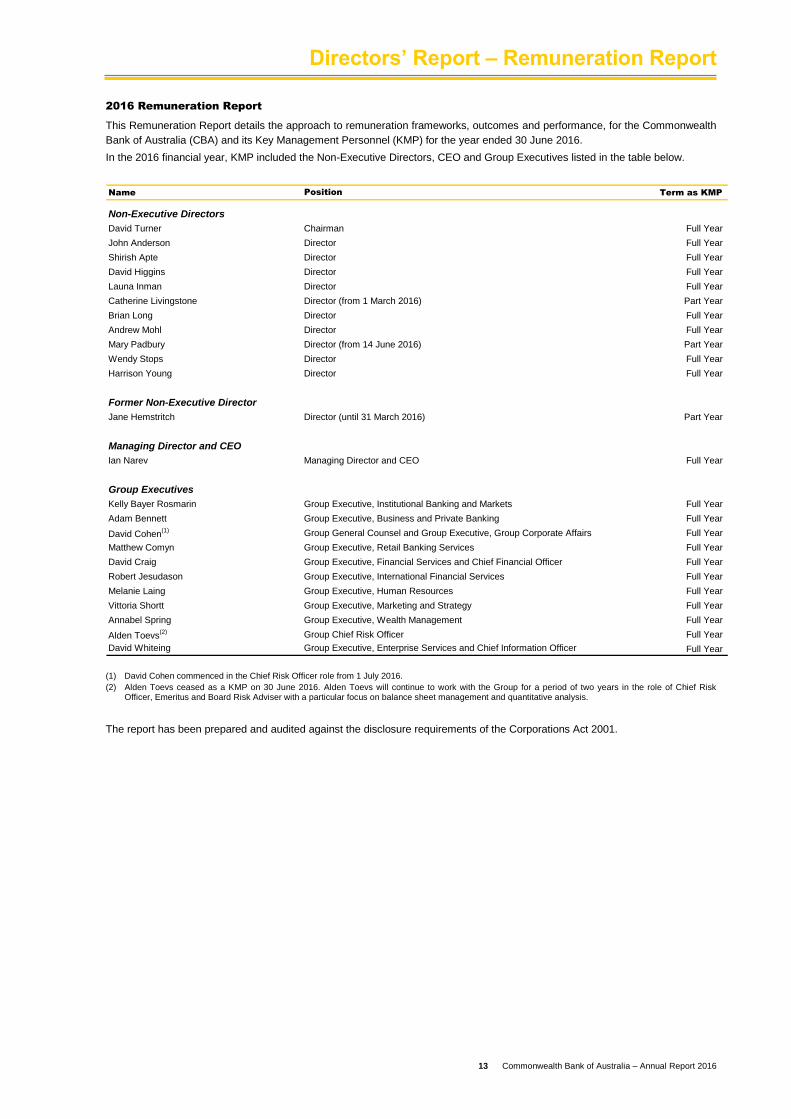
2016 Remuneration Report
This Remuneration Report details the approach to remuneration frameworks, outcomes and performance, for the Commonwealth
Bank of Australia (CBA) and its Key Management Personnel (KMP) for the year ended 30 June 2016.
In the 2016 financial year, KMP included the Non-Executive Directors, CEO and Group Executives listed in the table below.
Name Position Term as KMP
Non-Executive Directors
David Turner Chairman Full Year
John Anderson Director Full Year
Shirish Apte Director Full Year
David Higgins Director Full Year
Launa Inman Director Full Year
Catherine Livingstone Director (from 1 March 2016) Part Year
Brian Long Director Full Year
Andrew Mohl Director Full Year
Mary Padbury Director (from 14 June 2016) Part Year
Wendy Stops Director Full Year
Harrison Young Director Full Year
Former Non-Executive Director
Jane Hemstritch Director (until 31 March 2016) Part Year
Managing Director and CEO
Ian Narev Managing Director and CEO Full Year
Group Executives
Kelly Bayer Rosmarin Group Executive, Institutional Banking and Markets Full Year
Adam Bennett Group Executive, Business and Private Banking Full Year
David Cohen(1) Group General Counsel and Group Executive, Group Corporate Affairs Full Year
Matthew Comyn Group Executive, Retail Banking Services Full Year
David Craig Group Executive, Financial Services and Chief Financial Officer Full Year
Robert Jesudason Group Executive, International Financial Services Full Year
Melanie Laing Group Executive, Human Resources Full Year
Vittoria Shortt Group Executive, Marketing and Strategy Full Year
Annabel Spring Group Executive, Wealth Management Full Year
Alden Toevs(2) Group Chief Risk Officer Full Year
David Whiteing Group Executive, Enterprise Services and Chief Information Officer Full Year
(1) David Cohen commenced in the Chief Risk Officer role from 1 July 2016.
(2) Alden Toevs ceased as a KMP on 30 June 2016. Alden Toevs will continue to work with the Group for a period of two years in the role of Chief Risk Officer, Emeritus and Board Risk Adviser with a particular focus on balance sheet management and quantitative analysis.
The report has been prepared and audited against the disclosure requirements of the Corporations Act 2001.
Directors’ Report – Remuneration Report
14 Commonwealth Bank of Australia – Annual Report 2016
1. Remuneration Governance
1.1 Remuneration Committee
The Remuneration Committee (the Committee) is the main
governing body for setting remuneration policy across the
Group. The Committee develops the remuneration
philosophy, framework and policies for Board approval.
As at 30 June 2016, the Committee is made up of
independent Non-Executive Directors and consists of the
following members:
David Higgins (Chairman);
Launa Inman;
Andrew Mohl;
Mary Padbury;
Wendy Stops; and
David Turner.
The responsibilities of the Committee are outlined in its
Charter, which is reviewed annually by the Board. The
Charter is available on the Group’s website at
www.commbank.com.au/about-us/shareholders/corporate-
profile/corporate-governance.html.
In summary, the Committee is responsible for
recommending to the Board approval of:
Remuneration arrangements and all reward outcomes
for the CEO, senior direct reports to the CEO and
other individuals whose roles may affect the financial
soundness of the Group;
Remuneration arrangements for finance, risk and
internal control employees;
Remuneration arrangements for employees who have
a significant portion of their total remuneration based
on performance; and
Significant changes in remuneration policy and
structure, including superannuation and employee
equity plans.
This year, the Committee’s key areas of focus were:
A review of long-term incentive arrangements for the
CEO and Group Executives to ensure they continue to
deliver long-term value to shareholders, align with the
Group’s vision and reflect dynamic business
strategies;
A review of sales incentive plan governance across
the Group to ensure the model is appropriate in the
future;
The retirement of Alden Toevs from the Group Chief
Risk Officer role, effective 30 June 2016. Alden Toevs
will continue to work with the Group for a period of two
years in the role of Chief Risk Officer, Emeritus and
Board Risk Adviser (not a KMP role), with a particular
focus on balance sheet management and quantitative
analysis;
The appointment of David Cohen to the role of Group
Chief Risk Officer, effective 1 July 2016, following the
retirement of Alden Toevs;
The appointment of Anna Lenahan to the role of
Group General Counsel and Group Executive, Group
Corporate Affairs. Anna will commence with the Group
in late 2016;
The annual review of the Group Remuneration Policy;
An independent review of performance measures for
roles within CommInsure to confirm they were not
driving poor customer outcomes;
Ongoing monitoring of regulatory and legislative
changes, both locally and offshore, ensuring that the
Group’s policies and practices remain compliant; and
Continued focus on embedding a remuneration
framework that is appropriate for the Group’s different
businesses with transparency in design, strong
governance and risk oversight.
Independent Remuneration Consultant
The Committee obtains remuneration information directly
from its external independent remuneration consultant EY.
Throughout the 2016 financial year, the main information
received from the Committee’s remuneration consultant
related to:
Regulatory reforms;
Key performance indicators for individual roles within
CommInsure;
Current market practices; and
Long-term incentive arrangements for the CEO and
Group Executives.
EY provides information to assist the Committee in making
remuneration decisions. EY has not made any
remuneration recommendations during the 2016 financial
year. The Committee is responsible for making decisions
within the terms of its Charter.
1.2 Remuneration Philosophy
The Group’s remuneration philosophy is the backbone of its
remuneration framework, policies and processes. In
summary, the remuneration philosophy for the CEO and
Group Executives is to:
Provide target remuneration which is market
competitive, without putting upward pressure on the
market;
Align remuneration with shareholder interests and our
business strategy;
Articulate clearly to Executives the link between
individual and Group performance, and individual
remuneration;
Reward superior performance, while managing risks
associated with delivering and measuring that
performance;
Provide flexibility to meet changing needs and
emerging market practice; and
Provide appropriate benefits on termination that do not
deliver any windfall payments not related to
performance.
1.3 Remuneration and Risk Management
The Committee has a robust framework for the systematic
review of risk and compliance issues impacting
remuneration. The Committee:
Takes note of any material risk issues impacting
remuneration, with issues raised by the Committee
provided to the Board’s Risk Committee for noting;

Directors’ Report – Remuneration Report
15 Commonwealth Bank of Australia – Annual Report 2016
1.3 Remuneration and Risk Management (continued)
Considers issues and recommendations raised by the
Risk and Remuneration Review Committee, a
management committee that monitors material risk
and compliance issues throughout the year;
May impose adjustments to remuneration outcomes of
Executives before or after awards are made, subject
to Board approval; and
Works closely with the Board’s Risk Committee to
ensure that any risks associated with remuneration
arrangements are managed within the Group’s Risk
Management Framework.
The following diagram illustrates the Group’s remuneration
and risk governance framework:
Remuneration Committee
Risk & Remuneration Review Committee
Monitoring and reporting of Group risk & compliance issues
Independent Remuneration
Consultant
CBA Board
Risk Committee
1.4 Non-Executive Directors Remuneration
Non-Executive Directors receive fees to recognise their
contribution to the work of the Board and the associated
committees that they serve. Non-Executive Directors do not
receive any performance-related remuneration.
The Board Performance and Renewal Committee reviews
the Non-Executive Directors fee schedule regularly and
examines fee levels against the market.
Non-Executive Directors fees include statutory
superannuation contributions and were last increased
on 1 January 2015.
The following table outlines the Non-Executive Directors
fees for the main Board and the Committees as at
30 June 2016:
Position Fees (1)
($)
Board Chairman 870,000
Non-Executive Director
242,000
Audit Committee Chairman 65,000
Member 32,500
Risk Committee Chairman 65,000
Member 32,500
Remuneration Chairman 60,000
Committee Member 30,000
Board Performance & Chairman 11,600
Renewal Committee Member 11,600
(3) Fees are inclusive of base fees and superannuation. The Chairman does not receive separate Committee fees.
The total amount of Non-Executive Directors fees is capped
at a maximum pool that is approved by shareholders. The
current fee pool is $4.75 million, which was approved by
shareholders at the Annual General Meeting (AGM) on
17 November 2015.
Non-Executive Directors are required to hold 5,000 or more
CBA shares. For those Non-Executive Directors who have
holdings below this threshold, 20% of their after-tax base
fees are used to purchase CBA shares until a holding of
5,000 shares has been reached.
The statutory table on page 27 provides the individual
remuneration expense for each Non-Executive Director in
relation to the 2016 financial year.
2. Remuneration Framework
The remuneration arrangements for the CEO and Group
Executives are made up of both fixed and at risk
remuneration. This is composed of the following three
elements:
Fixed remuneration;
Short-Term Incentive (STI) at risk; and
Long-Term Incentive (LTI) at risk.
The at risk components are based on performance against
key financial and non-financial measures. More detail on
executive remuneration and the link to performance is
included in section 3 of this report.
2.1 Total Target Remuneration
The following diagram illustrates the total target mix of the
three remuneration elements:
1/31/3
1/3
50% STI paid as cash
50% STI deferred for 1 year
Fixed remuneration
100% LTI deferred for 4 years
The three remuneration elements are broken down into
equal portions of total target remuneration.
In setting target remuneration levels the Group aims to
remain competitive by attracting and retaining highly
talented Executives. This is done by considering the
experience of the Executive, the size and scope of role
responsibilities, and level of market competitive
remuneration sourced from remuneration market surveys
and disclosed data.
Each component of remuneration has a specific purpose
and direct link to our business strategy as detailed below.
2.2 Fixed Remuneration
Fixed remuneration is made up of base remuneration
and superannuation. Base remuneration includes cash
salary and any salary sacrifice items;
The Board, with recommendations from the
Committee, determines an appropriate level of fixed
remuneration for the CEO and Group Executives with
consideration of incumbent, role and market
factors; and
Fixed remuneration is reviewed annually, following the
end of the 30 June performance year. For the 2016
financial year the average fixed remuneration increase
for Executives who did not change roles was 0.9%.

Directors’ Report – Remuneration Report
16 Commonwealth Bank of Australia – Annual Report 2016
2.3 Short-Term Incentive
The CEO and Group Executives have an STI target
equal to 100% of their fixed remuneration. STI
outcomes reflect the Executive’s performance against
a balanced scorecard and CBA’s overall performance;
STI outcomes for the CEO and Group Executives may
be awarded between zero and 150% of their STI
target depending on performance;
Executives receive 50% of their STI payment as cash
following the Group’s year-end results. The remaining
50% of the STI payment is deferred for one year and
earns interest at the CBA one year term deposit rate;
The CEO and Group Executives will forfeit the
deferred portion of their STI if they resign or are
dismissed from the Group before the end of the
deferral period, unless the Board determines
otherwise;
The deferral assists in managing the risk of losing key
Executive talent. It also allows the Board to reduce or
cancel the deferred component of the STI where
business outcomes are materially lower than expected
or with consideration of other circumstances; and
STI payments are made within a funding cap which is
determined by the Board after consideration of Group
performance in the year. The Board retains discretion
to adjust remuneration outcomes up or down to
ensure consistency with the Group’s remuneration
philosophy and to prevent any inappropriate reward
outcomes.
See section 3.1 for more detail on STI outcomes and the
link to performance.
2.4 Long-Term Incentive
The CEO and each Group Executive has an LTI target
that is equal to 100% of their fixed remuneration,
based on the expected values at the end of the
performance period, in today’s dollars;
The LTI award has a four year vesting period and is
measured against relative Total Shareholder Return
(TSR) and relative Customer Satisfaction performance
hurdles;
The performance hurdles are aligned to our key
business priorities of Customer Focus and long-term
shareholder value creation;
Executives only receive value if performance hurdles
are met at the end of the four years, subject to final
Board review;
Executives receive one CBA share (or cash
equivalent) for each right that vests; and
No dividends are paid while LTI awards are unvested.
See section 3.2 for more detail on how the LTI award
operates and its direct link to performance outcomes.
2.5 Mandatory Shareholding Policy
The CEO and each Group Executive are required to
accumulate CBA shares over a five year period to the value
of 300% of fixed remuneration for the CEO and 200% of
fixed remuneration for Group Executives.
2.6 Sign-on and Retention Awards
Sign-on awards may be offered to new Executives to
compensate for existing incentive arrangements that
they will forgo due to the termination of their non-CBA
employment before the end of the vesting period.
Retention awards are pre-determined future payments
that may be awarded to Executives at a defined future
date to encourage retention.
No sign-on or retention awards were made to
Executives during the 2016 performance year.
3. Linking Remuneration to Performance
The remuneration framework is designed to attract and
retain high calibre Executives by rewarding them for
achieving goals that are aligned to the Group’s business
strategy and shareholder interests. All our incentives are
directly linked to both short-term and long-term
performance goals.
3.1 Short-Term Performance 2016
Overall Group performance, together with an assessment
of individual Executive performance through a balanced
scorecard approach, determines the individual STI
outcomes of Executives. Financial and non-financial
objectives and weightings vary by role. The CEO has a
40% weighting on financial outcomes, Executives
managing business units typically have a 45% weighting on
financial outcomes and Executives managing support
functions have a typical weighting of 25% on financial
outcomes.
Risk is an important factor in accounting for short-term
performance. The Group uses Profit After Capital Charge
(PACC), a risk-adjusted measure, as one of our key
measures of financial performance. It not only takes into
account the profit achieved, but also reflects the risk to
capital that was taken to achieve it. Moreover, Executives
are required to comply with the Group and relevant
Business Unit Risk Appetite Statements and provide
leadership of strong risk culture.
The following table provides the Board’s assessment of the
Group’s overall performance for the year ended
30 June 2016 and highlights key financial and non-financial
performance outcomes. Performance categories have been
assessed as above, on, or below target.

Directors’ Report – Remuneration Report
17 Commonwealth Bank of Australia – Annual Report 2016
3.1 Short-Term Performance 2016 (continued)
Strategic
Pillar
2016 Performance Measures Outcome Commentary
Strength Group Cash Net Profit After
Tax (Cash NPAT) ($m)
Group Underlying PACC ($m)
Risk
On-Target The Group reported solid performance with a
3% increase in cash NPAT to $9,450 million.
The Group enhanced the Common Equity Tier
1 capital ratio to 10.6%, primarily through the
$5.1bn institutional and retail entitlement offer.
The above factors contributed to a solid risk
adjusted underlying PACC performance for the
period in a changing regulatory environment.
Customer Customer Satisfaction
Retail
Above-Target The Group continued its commitment to a customer
focused culture and maintained the number one
ranking among the major banks for customer
satisfaction across retail and business customers.
Specifically:
For Retail Banking, CBA finished the financial
year ranked number one in Main Financial
Institution (MFI) customer satisfaction(1). During
this time, CBA attained the highest score ever
recorded by a major bank at 84.5%.
In Business Banking, CBA ended the financial
year equal first in MFI customer satisfaction(1)
among the major banks across most key
business segments.
In Institutional Banking, CBA continues to
perform strongly and ended the financial year
ranked number one in MFI customer
satisfaction(1) among the major banks.
Wealth Management’s platforms were ranked
number one for adviser satisfaction among the
four major banks and other key competitors.
Business
Institutional
Wealth
Technology Strategy Execution On-Target The Group continued its leadership in financial
technology, providing market leading solutions for
our customers and our people, while investing now
for the future.
For consumers, the Group provided:
The ability for non-Commonwealth Bank
customers to download and use the
CommBank app to become a customer within
minutes;
Photo-a-Bill functionality allowing customers to
automatically populate biller payment details by
photographing their bills; and
New international share trading through
CommSec.
For businesses, the Group:
Placed over 37,000 additional Albert terminals
(the Group’s next generation EFTPOS tablet) in
the market place;
Introduced instant credit decisioning for online
asset finance applications; and
Provided a new Simple Business Overdraft
product.

Directors’ Report – Remuneration Report
18 Commonwealth Bank of Australia – Annual Report 2016
In addition, the Group launched and strengthened
multiple research and development partnerships and
initiatives, covering cyber security, blockchain
technology, quantum computing and farming peer to
peer platforms.
People Talent & Leadership
Safety
Diversity
Engagement
Culture
On-Target Over 2,000 leaders attended targeted leadership
development programs during the 2016 financial year.
Continual improvement of health, safety and wellbeing
systems, processes and programs, saw the Group
achieve a 30% reduction in lost time injury frequency
over the past 12 months.
Having achieved the initial gender diversity target of
35% women in senior leadership positions, the Group
set a new target of 40% women in senior leadership by
2020 and established a target for more diverse cultural
representation in senior leadership.
The Group’s engagement score of 77% indicates that
culture and people engagement remain strong, with an
increase in the survey completion rate.
Significant investment was made in embedding the
Group’s vision and values across policies and
processes, including recruitment, talent, and
performance.
Successfully implemented a global human resource
management system across offshore locations.
Productivity Productivity Execution On-Target The Group’s productivity focus remains on simplifying
and standardising processes to support the execution
of its process centricity and digitisation efforts.
Productivity initiatives, including expense benefit
targets, have been embedded in business and support
unit plans, delivering significant process efficiencies.
Productivity initiatives supported sound cost
management in the 2016 financial year, with the
Group’s cost-to-income ratio improving 40 basis points
from prior year to 42.4%.
Group-wide, there were demonstrated on-going
improvements in turnaround times, error rates and unit
costs of processes. Examples ranged from a 97%
improvement in Bankwest’s small business credit card
turnaround time, to an 85% advancement in Colonial
customer request response times.
Productivity savings allow the Group to invest for the
future. More than $600 million was reinvested in the
2016 financial year to support future productivity and
growth initiatives, including growing productivity
capability through leadership focused courses and
embedded productivity resources.
Future initiatives will help to ensure our continuous
improvement culture is fully embedded and cascades
from people leaders to all employees of the Group,
with progress tracked through accreditation and
benefits measurement.
(1) Customer satisfaction is measured by three separate surveys. For the Retail Bank, this is measured by Roy Morgan Research. Roy Morgan Research Main Financial Institution (MFI) Retail Customer Satisfaction measures percentage of the Australian population 14+, % “Very Satisfied” or “Fairly Satisfied” with their relationship with that MFI, based on a 6-month rolling average to June 2016. CBA excludes Bankwest. Rank refers to CBA’s outright position relative to NAB, ANZ and Westpac. For Business Banking and Institutional Banking, MFI customer satisfaction is measured by DBM Business Financial Services Monitor which takes the average satisfaction rating of business customers’ MFI, using an 11 point scale where 0 is Extremely Dissatisfied and 10 is Extremely Satisfied based on a 6 month rolling average to June 2016. Institutional Banking includes businesses with turnover of $100 million and above. For Wealth Management, customer satisfaction is measured by the Wealth Insights 2016 Service Level Report, Platforms. This survey measures satisfaction with the service of master trusts/wraps in Australia, by financial advisers. It includes Colonial First State’s FirstChoice and FirstWrap platforms.
Directors’ Report – Remuneration Report
19 Commonwealth Bank of Australia – Annual Report 2016
2016 STI outcomes
Overall, 2016 financial and non-financial performance was solid. Against this background, the average STI payment for the CEO and Group Executives was 112% of their STI targets. 3.2 Long-Term Performance
The executive remuneration structure also focuses on driving performance and creating shareholder alignment in the longer term,
by providing Executives with LTI awards in the form of Reward Rights with a four year vesting period. CEO and Group
Executives’ current LTI awards are issued under the Group Leadership Reward Plan (GLRP). Vesting is subject to performance
against relative TSR and relative Customer Satisfaction hurdles.
2012 GLRP Award
The 2012 GLRP award reached the end of its four year performance period on 30 June 2016. The 2012 GLRP award was
weighted against two performance hurdles, relative TSR (75% of the award) and relative Customer Satisfaction (25% of the
award). At the end of the performance period, the results against these measures were:
0% vesting against the TSR hurdle;
89.5% vesting against the Customer Satisfaction hurdle;
In line with the plan rules for this award, 20.31% of the total award vested; and
The Board reviewed the measurement outcomes of this award and concluded that the above vesting appropriately reflects
performance over the four year performance period.
Overview of Unvested LTI Awards
Equity Plan (1)
Performance Period –
Start Date
Performance Period –
End Date Performance Hurdles
2013 GLRP (2)
2014 GLRP (3)
2015 GLRP (4)
1 July 2013
1 July 2014
1 July 2015
30 June 2017
30 June 2018
30 June 2019
Each award is split and tested:
75% TSR ranking relative to peer group
25% Customer Satisfaction average ranking relative to peer group
(1) Naming convention updated to align with the start of the performance period.
(2) For Ian Narev, the grant date was 11 November 2013. For Kelly Bayer Rosmarin the grant date was 13 February 2014. For all other Executives the grant date was 23 September 2013.
(3) For Ian Narev, the grant date was 13 November 2014. For Adam Bennett the grant date was 12 February 2015. For Vittoria Shortt the grant date was 7 May 2015. For all other Executives the grant date was 18 September 2014.
(4) For Ian Narev, the grant date was 17 November 2015. For all other Executives the grant date was 10 November 2015.
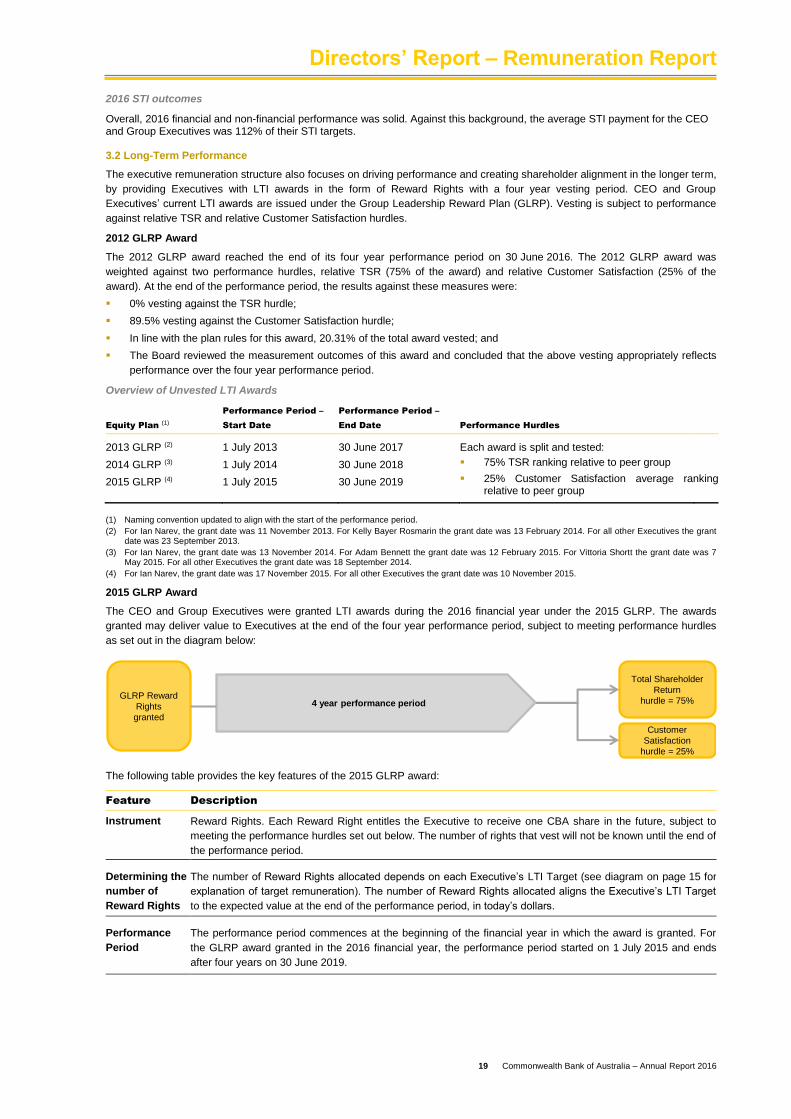
2015 GLRP Award
The CEO and Group Executives were granted LTI awards during the 2016 financial year under the 2015 GLRP. The awards
granted may deliver value to Executives at the end of the four year performance period, subject to meeting performance hurdles
as set out in the diagram below:
GLRP Reward
Rights
granted
4 year performance period
Customer
Satisfaction
hurdle = 25%
Total Shareholder
Return
hurdle = 75%
The following table provides the key features of the 2015 GLRP award:
Feature Description
Instrument Reward Rights. Each Reward Right entitles the Executive to receive one CBA share in the future, subject to
meeting the performance hurdles set out below. The number of rights that vest will not be known until the end of
the performance period.
Determining the
number of
Reward Rights
The number of Reward Rights allocated depends on each Executive’s LTI Target (see diagram on page 15 for
explanation of target remuneration). The number of Reward Rights allocated aligns the Executive’s LTI Target
to the expected value at the end of the performance period, in today’s dollars.
Performance
Period
The performance period commences at the beginning of the financial year in which the award is granted. For
the GLRP award granted in the 2016 financial year, the performance period started on 1 July 2015 and ends
after four years on 30 June 2019.

Directors’ Report – Remuneration Report
20 Commonwealth Bank of Australia – Annual Report 2016
Performance
Hurdles
75% of each award is subject to a performance hurdle that measures the Group’s TSR performance
relative to a set peer group(1).This is made up of the 20 largest companies on the Australian Securities
Exchange (ASX) by market capitalisation at the beginning of the performance period, excluding resources
companies and Commonwealth Bank of Australia. The next five largest companies listed on the ASX by
market capitalisation will form a reserve bench of companies. A reserve bench company will be substituted
(in order of market capitalisation as at the beginning of the performance period) into the peer group when
a peer group Company ceases to be listed on the ASX as a result of an acquisition, merger or other
relevant corporate action or delisting; and
25% of each award is subject to a performance hurdle that measures the Group’s Customer Satisfaction
outcomes relative to a peer group of Australia & New Zealand Banking Group Limited (ANZ), National
Australia Bank Limited (NAB), Westpac Banking Corporation (WBC), and other key competitors for the
wealth business.
Vesting
Framework
TSR (75% of the award)
100% vesting is achieved if the Group’s TSR is ranked in the top quarter of the peer group (i.e. 75th
percentile or higher)(1);
If the Group is ranked at the median, 50% of the Reward Rights will vest;
Vesting occurs on a sliding scale if the Group is ranked between the median and the 75th percentile; and
No Reward Rights in this part of the award will vest if the Group’s TSR is ranked below the median of the
peer group.
Customer Satisfaction (25% of the award)
100% vesting applies if the weighted average ranking for the Group over the performance period is 1st;
50% will vest if the Group’s weighted average ranking is 2nd;
Vesting of between 50% and 100% will occur on a pro-rata straight line basis if the Group’s weighted
average ranking is between 2nd and 1st; and
No Reward Rights in this part of the award will vest if the Group’s weighted average ranking is less than
2nd.
Calculation of
the
Performance
Results
TSR is calculated independently by Orient Capital.
Customer Satisfaction is measured with reference to the three independent surveys below:
– Roy Morgan Research (measuring customer satisfaction across Retail Banking);
– DBM, Business Financial Services Monitor (measuring customer satisfaction across Business
Banking); and
– Wealth Insights Service Level Report, Platforms (measuring customer satisfaction across Wealth
Management).
Board
Discretion
The award is subject to a risk and compliance review. The Board also retains sole discretion to determine the
amount and form of any award that may vest (if any) to prevent any unintended outcomes, or in the event of a
corporate restructuring or capital event.
Expiry At the end of the applicable performance period, any Reward Rights that have not vested will expire.
(1) The peer group (at the beginning of the performance period) for the TSR performance hurdle (at the time of grant) comprised Amcor Limited, AMP Limited, Australia and New Zealand Banking Group Limited, Brambles Limited, CSL Limited, Insurance Australia Group Limited, Macquarie Group Limited, National Australia Bank Limited, QBE Insurance Group Limited, Ramsey Health Care Limited, Scentre Group, Suncorp Group Limited, Sydney Airport, Telstra Corporation Limited, Transurban Group, Vicinity Centres, Wesfarmers Limited, Westfield Corporation, Westpac Banking Corporation and Woolworths Limited. The reserve bench comprised AGL Energy Limited, APA Group, Aurizon Holdings Limited, Goodman Group and Stockland.
Retail Entitlement Offer
During the 2016 financial year, additional Reward Rights were granted to all existing rights holders as part of the Retail
Entitlement Offer, including the CEO and Group Executives. The grant of additional Reward Rights for Ian Narev in respect of
2012, 2013 and 2014 GLRP awards was approved by shareholders at the AGM on 17 November 2015. Additional Reward Rights
will vest only if the original performance hurdles in respect of each award are met.
Directors’ Report – Remuneration Report
21 Commonwealth Bank of Australia – Annual Report 2016
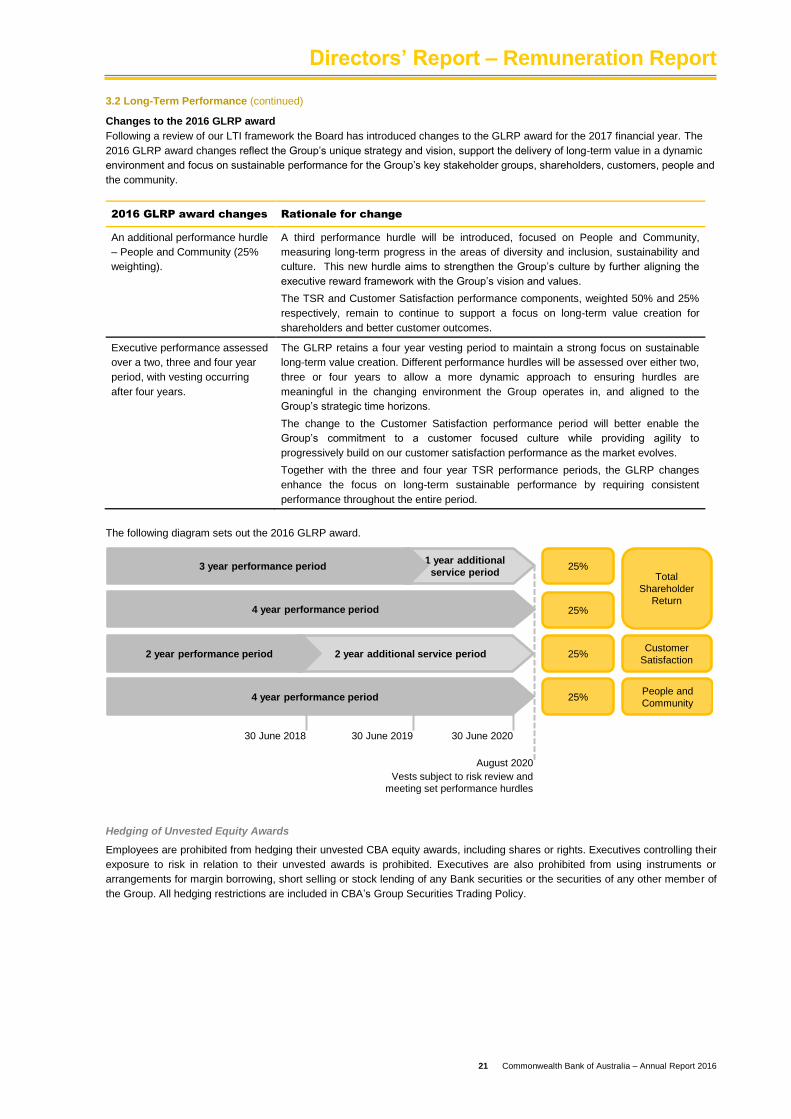
3.2 Long-Term Performance (continued)
Changes to the 2016 GLRP award
Following a review of our LTI framework the Board has introduced changes to the GLRP award for the 2017 financial year. The
2016 GLRP award changes reflect the Group’s unique strategy and vision, support the delivery of long-term value in a dynamic
environment and focus on sustainable performance for the Group’s key stakeholder groups, shareholders, customers, people and
the community.
2016 GLRP award changes Rationale for change
An additional performance hurdle
– People and Community (25%
weighting).
A third performance hurdle will be introduced, focused on People and Community,
measuring long-term progress in the areas of diversity and inclusion, sustainability and
culture. This new hurdle aims to strengthen the Group’s culture by further aligning the
executive reward framework with the Group’s vision and values.
The TSR and Customer Satisfaction performance components, weighted 50% and 25%
respectively, remain to continue to support a focus on long-term value creation for
shareholders and better customer outcomes.
Executive performance assessed
over a two, three and four year
period, with vesting occurring
after four years.
The GLRP retains a four year vesting period to maintain a strong focus on sustainable
long-term value creation. Different performance hurdles will be assessed over either two,
three or four years to allow a more dynamic approach to ensuring hurdles are
meaningful in the changing environment the Group operates in, and aligned to the
Group’s strategic time horizons.
The change to the Customer Satisfaction performance period will better enable the
Group’s commitment to a customer focused culture while providing agility to
progressively build on our customer satisfaction performance as the market evolves.
Together with the three and four year TSR performance periods, the GLRP changes
enhance the focus on long-term sustainable performance by requiring consistent
performance throughout the entire period.
The following diagram sets out the 2016 GLRP award.
1 year additional
service period
4 year performance period
3 year performance period
4 year performance period
25%
Total
Shareholder
Return
Customer
Satisfaction
People and
Community25%
2 year additional service period
25%
25%2 year performance period
August 2020
Vests subject to risk review and
meeting set performance hurdles
30 June 2018 30 June 2019 30 June 2020
Hedging of Unvested Equity Awards
Employees are prohibited from hedging their unvested CBA equity awards, including shares or rights. Executives controlling their
exposure to risk in relation to their unvested awards is prohibited. Executives are also prohibited from using instruments or
arrangements for margin borrowing, short selling or stock lending of any Bank securities or the securities of any other member of
the Group. All hedging restrictions are included in CBA’s Group Securities Trading Policy.

Directors’ Report – Remuneration Report
22 Commonwealth Bank of Australia – Annual Report 2016
Long-Term Performance against Key Measures
As detailed above, long-term incentive arrangements are designed to align Executives with the Group’s long-term strategy and
shareholder interests. The remainder of this section illustrates performance against key related metrics over time.
Financial Performance
The following graphs show the Group’s cash NPAT, cash Earnings per Share (cash EPS), share price movement and full-year
dividend results over the past five financial years (including 2016). The solid performance has delivered sound returns to
shareholders.
Cash NPAT
Cash EPS (1)
7,039
7,760
8,6809,137 9,450
0
1,000
2,000
3,000
4,000
5,000
6,000
7,000
8,000
9,000
10,000
Jun 12 Jun 13 Jun 14 Jun 15 Jun 16
$ M
illio
n
444.7
482.1
532.7557.5 555.1
0
100
200
300
400
500
600
Jun 12 Jun 13 Jun 14 Jun 15 Jun 16C
en
ts
(1) Comparative information has been restated to incorporate the
bonus element of the rights issue in the weighted number of ordinary shares for June 15 and June 14 only in line with comparatives presented in the Financial Statements.
Share Price
Dividends per Share
$0
$10
$20
$30
$40
$50
$60
$70
$80
$90
$100
Jun 11 Jun 12 Jun 13 Jun 14 Jun 15 Jun 16
3.343.64
4.014.20 4.20
$0.00
$0.50
$1.00
$1.50
$2.00
$2.50
$3.00
$3.50
$4.00
$4.50
Jun 12 Jun 13 Jun 14 Jun 15 Jun 16

Directors’ Report – Remuneration Report
23 Commonwealth Bank of Australia – Annual Report 2016
Long-Term Performance against Key Measures (continued)
Relative TSR Performance against the Group’s Peers
The graph below represents CBA’s TSR performance against the comparator peer group for the period 1 July 2012 to
30 June 2016. The Group was ranked at the 45th percentile of the peer group(1) at the end of the period. TSR is calculated by
Orient Capital.
-60%
-30%
0%
30%
60%
90%
120%
150%
180%
210%
240%
To
tal S
hare
ho
lder
Retu
rn 2
016 (
4 Y
ears
)
Comparator Peer Group (1)
CBA
(1) For the 2012 GLRP, the peer group (at the end of the performance period) for the TSR performance hurdle comprised AGL Energy Limited, Amcor Limited, AMP Limited, Australia and New Zealand Banking Group Limited, Brambles Limited, Coca-Cola Amatil Limited, CSL Limited, GPT Group, Insurance Australia Group Limited, Macquarie Group Limited, National Australia Bank Limited, Orica Limited, QBE Insurance Group Limited, Stockland, Suncorp Group Limited, Telstra Corporation Limited, Transurban Group, Wesfarmers Limited, Westpac Banking Corporation and Woolworths Limited.
Performance against Customer Satisfaction
The following graphs show CBA’s customer satisfaction performance across Retail, Business and Wealth Management. During
the 2016 financial year, CBA maintained the number one ranking among the major banks in Retail MFI customer satisfaction and
has been ranked equal or outright first position in MFI customer satisfaction among the major banks in most key business
segments. The Wealth Management results ranked the Group first for adviser satisfaction among the four major banks and other
key competitors.
(1) Roy Morgan Research Main Financial Institution (MFI) Retail Customer Satisfaction. Australian population 14+, % “Very Satisfied” or “Fairly Satisfied” with
relationship with that MFI. 6 month rolling average to June 2016. CBA excludes Bankwest. Rank refers to CBA’s position relative to NAB, ANZ and Westpac.
70%
75%
80%
85%
90%
Ju
n-1
2
Au
g-1
2
Oct-
12
De
c-1
2
Fe
b-1
3
Ap
r-1
3
Ju
n-1
3
Au
g-1
3
Oct-
13
De
c-1
3
Fe
b-1
4
Ap
r-1
4
Ju
n-1
4
Au
g-1
4
Oct-
14
De
c-1
4
Fe
b-1
5
Ap
r-1
5
Ju
n-1
5
Au
g-1
5
Oct-
15
De
c-1
5
Fe
b-1
6
Ap
r-1
6
Ju
n-1
6% S
ati
sfi
ed
('V
ery
Sa
tis
fie
d' o
r 'F
air
ly S
ati
sfi
ed
')
Major Bank 1 Major Bank 2 Major Bank 3 CBA
Retail Main Financial Institution Customer Satisfaction - Competitive Context
Source: Roy Morgan Research6 month rolling average(1)

Directors’ Report – Remuneration Report
24 Commonwealth Bank of Australia – Annual Report 2016
Business Main Financial Institution Customer Satisfaction - Competitive Context (1)
6
7
8
Jun-1
2
Aug-1
2
Oct-
12
Dec-1
2
Feb-1
3
Apr-
13
Jun-1
3
Aug-1
3
Oct-
13
Dec-1
3
Feb-1
4
Apr-
14
Jun-1
4
Aug-1
4
Oct-
14
Dec-1
4
Feb-1
5
Apr-
15
Jun-1
5
Aug-1
5
Oct-
15
Dec-1
5
Feb-1
6
Apr-
16
Jun-1
6
Sati
sfa
cti
on
-A
vera
ge
Major Bank 1 Major Bank 2 Major Bank 3 CBA
Source: DBM, Business Financial Services Monitor6 month rolling average(2)
(1) CBA and Major Bank 1 and Major Bank 2 are ranked equal 1st (DBM Business Financial Services Monitor, June 2016) as the difference in average satisfaction rating is not considered to be statistically significant.
(2) DBM Business Financial Services Monitor (June 2016), average satisfaction rating of each financial institution’s MFI business customers across all Australian businesses, 6 month rolling average.
Wealth Management Customer Satisfaction
30-Jun-16 30-Jun-15 30-Jun-14 30-Jun-13 30-Jun-12 (1)
Score (2) 8.07 7.75 7.94 8.32 7.86
CBA Rank 1st 2nd 1st 1st 1st
(1) In the 2012 year, the satisfaction score was calculated on a straight average of FirstChoice and FirstWrap. Due to the change in calculation of the
satisfaction score in 2013, historical results have been restated. As a result, the score and ranking for 2012 has changed from 7.69 (2nd) to 7.86 (1st). For remuneration purposes the ranking of 2nd has been applied.
(2) For Wealth Management, customer satisfaction is measured by the Wealth Insights 2016 Service Level Report, Platforms.
3.3 Performance Timeline of At Risk Remuneration Outcomes
The performance management framework supports decisions in awarding appropriate annual STI outcomes for Executives. The
balanced scorecard performance objectives are communicated to Executives at the beginning of the financial year. Executive
annual performance evaluations are conducted following the end of the financial year. For the 2016 financial year, the evaluations
were conducted in July 2016.
The following diagram outlines the timing of the 2016 STI award and the 2016 GLRP award made to the Executives over the
relevant performance periods. All awards are subject to risk and compliance reviews.
STI
Annual
Performance
Review
STI outcomes
determined &
approved by Board
50% of STI
outcome paid as
cash
August
2017
Follow ing shareholder approval
LTI 2016 GLRP aw ards
approved by Board
CEO and Group
Executives grant
of 2016 GLRP
aw ard
July
2015
30 June
2016
July
2016
August
2016
September
2016
November
2016
August
2020
Vests subject to risk review
and meeting set performance
hurdles
Bo
ard
sets
str
ate
gy
STI targets are set Subject to risk & compliance review Vests subject to risk review
Performance measurement
period
50% STI deferred for 1 year
2016 GLRP aw ard deferred for 4 years (1 July 2016 to
30 June 2020)

Directors’ Report – Remuneration Report
25 Commonwealth Bank of Australia – Annual Report 2016
3.4 CEO and Group Executive Remuneration Received in the year ended 30 June 2016
The incentives awarded to the CEO and Group Executives are linked to the Group’s and individual financial and non-financial
performance.
Total statutory remuneration recognised for the CEO and Group Executives for the 2016 financial year was $44.8 million and is
the total of the values for each Executive shown in the statutory remuneration table on page 28. Statutory remuneration
disclosures are prepared in accordance with the Corporations Act 2001 and Australian Accounting Standards. Total cash
remuneration received by the CEO and Group Executives in relation to the 2016 performance year was $22.4 million. The total
cash remuneration received is used to present a clear view of the Group’s remuneration payments made to the CEO and Group
Executives during the performance year.
Table (a) below shows remuneration received in relation to the 2016 financial year. The total cash payments received are made
up of base remuneration and superannuation (fixed remuneration), and the portion of the 2016 STI award which is not deferred.
These amounts are consistent with that disclosed in section 4.2 for the same items. This table also includes the value of previous
years’ deferred STI and LTI awards which vested during 2016. This differs to the table in section 4.2, which presents the
accounting expense for both vested and unvested awards.
(a) Remuneration in relation to the 2016 Financial Year
Fixed
Remuneration (1)
Cash STI (2)
Total cash
in relation
to 2016
Deferred cash
awards (3)
Deferred
equity
awards (4)
Total
remuneration
received
during 2016
Previous years'
awards
forfeited/lapsed
during 2016 (5)
$ $ $ $ $ $ $
Managing Director and CEO
Ian Narev 2,650,000 1,431,000 4,081,000 1,625,834 6,597,473 12,304,307 (925,991)
Current Executives (6)
Kelly Bayer Rosmarin 1,050,600 586,235 1,636,835 626,771 466,671 2,730,277 -
Adam Bennett 980,000 554,239 1,534,239 259,295 393,185 2,186,719 -
David Cohen 900,000 529,594 1,429,594 595,883 2,178,446 4,203,923 (305,721)
Matthew Comyn 1,055,750 653,193 1,708,943 632,915 549,041 2,890,899 -
David Craig 1,380,000 812,044 2,192,044 871,355 3,340,159 6,403,558 (468,772)
Robert Jesudason 1,193,421 712,174 1,905,595 630,361 385,378 2,921,334 -
Melanie Laing 845,000 483,499 1,328,499 506,546 1,936,282 3,771,327 (271,724)
Vittoria Shortt 845,000 501,455 1,346,455 170,430 263,529 1,780,414 -
Annabel Spring 1,055,750 501,481 1,557,231 677,005 2,371,784 4,606,020 (332,868)
Alden Toevs 1,430,000 752,091 2,182,091 864,542 3,461,148 6,507,781 (485,770)
David Whiteing 980,000 510,519 1,490,519 563,418 - 2,053,937 -
Previous years' awards that
vested during 2016
(1) Fixed Remuneration includes base remuneration and superannuation.
(2) This is the 50% of the 2016 STI for performance during the 12 months to 30 June 2016 (payable September 2016). The remaining 50% is deferred until 1 July 2017. Deferred STI awards are subject to Board review at the time of payment.
(3) The value of all deferred cash awards that vested during the 2016 financial year plus any interest accrued during the vesting period. For Rob Jesudason, a portion of his 2015 deferred STI award that vested during the 2016 financial year was paid in Australian dollars and a portion was paid in Hong Kong dollars. For the purpose of disclosure, the portion paid in Hong Kong dollars has been converted to Australian dollars using the average year-to-date exchange rate as at 30 June 2016.
(4) The value of deferred equity awards that vested during the 2016 financial year plus any dividends accrued during the vesting period. For Ian Narev, David Cohen, David Craig, Melanie Laing, Annabel Spring and Alden Toevs this reflects the portion of the 2011 GLRP award that vested during the 2016 financial year. For Kelly Bayer Rosmarin, Adam Bennett, Matthew Comyn, Robert Jesudason and Vittoria Shortt this amount reflects the 2012 deferred STI awarded prior to their appointment as Group Executive under Executive General Manager arrangements that vested during the 2016 financial year. A portion of Ian Narev’s deferred equity award was delivered in the form of cash, which was paid to registered charities pursuant to an option that the Board made available in the current year.
(5) The value of any deferred cash and/or equity awards that were forfeited/lapsed during the 2016 financial year.
(6) Group Executives as at 30 June 2016.

Directors’ Report – Remuneration Report
26 Commonwealth Bank of Australia – Annual Report 2016
(b) CEO Reconciliation Table of Cash Payments from Table (a) and Statutory Remuneration Table on Page 28
2016
$
Year
Award Vests
(1)
Cash remuneration received in relation to 2016 - refer to table (a) above 4,081,000 n/a
2016 STI deferred for 12 months at risk 1,431,000 2017
Annual leave and long service leave accruals 137,247 n/a
Other Payments 50,886 n/a
Share-based payments: accounting expense for 2016 for LTI awards made over the past 4 years:(2)(3)
2012 GLRP:(4) Expense for 1 award that may vest subject to customer satisfaction performance 506,401 2016
2012 GLRP: Expense for 1 award that may vest subject to relative TSR performance 516,251 2016
2013 GLRP: Expense for 1 award that may vest subject to customer satisfaction performance 287,158 2017
2013 GLRP: Expense for 1 award that may vest subject to relative TSR performance 647,543 2017
2014 GLRP: Expense for 1 award that may vest subject to customer satisfaction performance 226,631 2018
2014 GLRP: Expense for 1 award that may vest subject to relative TSR performance 530,831 2018
2015 GLRP: Expense for 1 award that may vest subject to customer satisfaction performance 107,695 2019
2015 GLRP: Expense for 1 award that may vest subject to relative TSR performance 245,709 2019
Total Statutory Remuneration as per page 28 8,768,352
(1) Awards vest in August each year subject to Board Risk Review and meeting set performance hurdles.
(2) Naming convention updated to align with the start of the performance period.
(3) Includes the accounting expense for additional Reward Rights granted as part of the Retail Entitlement Offer.
(4) Includes true up for prior year award.

Directors’ Report – Remuneration Report
27 Commonwealth Bank of Australia – Annual Report 2016
4. KMP Disclosure Tables
4.1 Non-Executive Directors Statutory Remuneration
The statutory table below details individual statutory remuneration for the Non-Executive Directors for the year ended
30 June 2016 and the previous financial year.
Short-Term
Benefits
Post Employment
Benefits
Share-Based
payments
Non-Executive Total
Super- Directors' Statutory
Cash (1)
annuation (2)
Share Plan (3)
Remuneration
$ $ $ $
Chairman
David Turner
2016 854,887 19,308 - 874,195
2015 841,034 18,783 - 859,817
Non-Executive Directors
John Anderson
2016 300,768 19,308 - 320,076
2015 289,173 18,783 - 307,956
Shirish Apte
2016 299,140 7,860 - 307,000
2015 296,395 4,753 - 301,148
David Higgins (4)
2016 294,078 19,308 - 313,386
2015 217,848 15,593 - 233,441
Launa Inman
2016 257,222 19,308 29,233 305,763
2015 251,185 18,783 28,533 298,501
Catherine Livingstone (5)
2016 84,890 6,436 - 91,326
Brian Long
2016 332,094 19,308 - 351,402
2015 311,290 18,783 - 330,073
Andrew Mohl
2016 286,599 19,308 - 305,907
2015 279,718 18,783 - 298,501
Mary Padbury (5)
2016 12,386 1,177 - 13,563
Wendy Stops (4)
2016 253,938 19,308 - 273,246
2015 79,087 5,867 - 84,954
Harrison Young
2016 333,428 19,308 - 352,736
2015 322,739 18,783 - 341,522
Former Non-Executive Director
Jane Hemstritch (6)
2016 238,164 14,507 - 252,671
2015 308,810 18,783 - 327,593
(1) Cash includes Board and Committee fees received as cash. For Shirish Apte this also includes payments made on his behalf in relation to tax advice in the prior year.
(2) Superannuation contributions are capped at the superannuation maximum contributions base as prescribed under the Superannuation Guarantee legislation. For Shirish Apte, superannuation is paid on the Australian portion of his fees and includes minor adjustments made in relation to the prior year.
(3) The values shown in the table represent the post-tax portion of fees received as shares. Catherine Livingstone met the Non-Executive Director shareholding requirement at the time of her appointment and is not required to purchase any additional shares. To comply with the Non-Executive Director shareholding requirement, post-tax deductions for Mary Padbury will commence in the 2017 financial year.
(4) For 2015 comparison, David Higgins was appointed as a Non-Executive Director on 1 September 2014 and Wendy Stops was appointed as a Non-Executive Director on 9 March 2015. Their remuneration was prorated accordingly in 2015.
(5) Catherine Livingstone was appointed as a Non-Executive Director on 1 March 2016 and Mary Padbury was appointed as a Non-Executive Director on 14 June 2016. Their remuneration has been prorated accordingly.
(6) Jane Hemstritch retired from the Group on 31 March 2016 and her remuneration has been prorated accordingly.
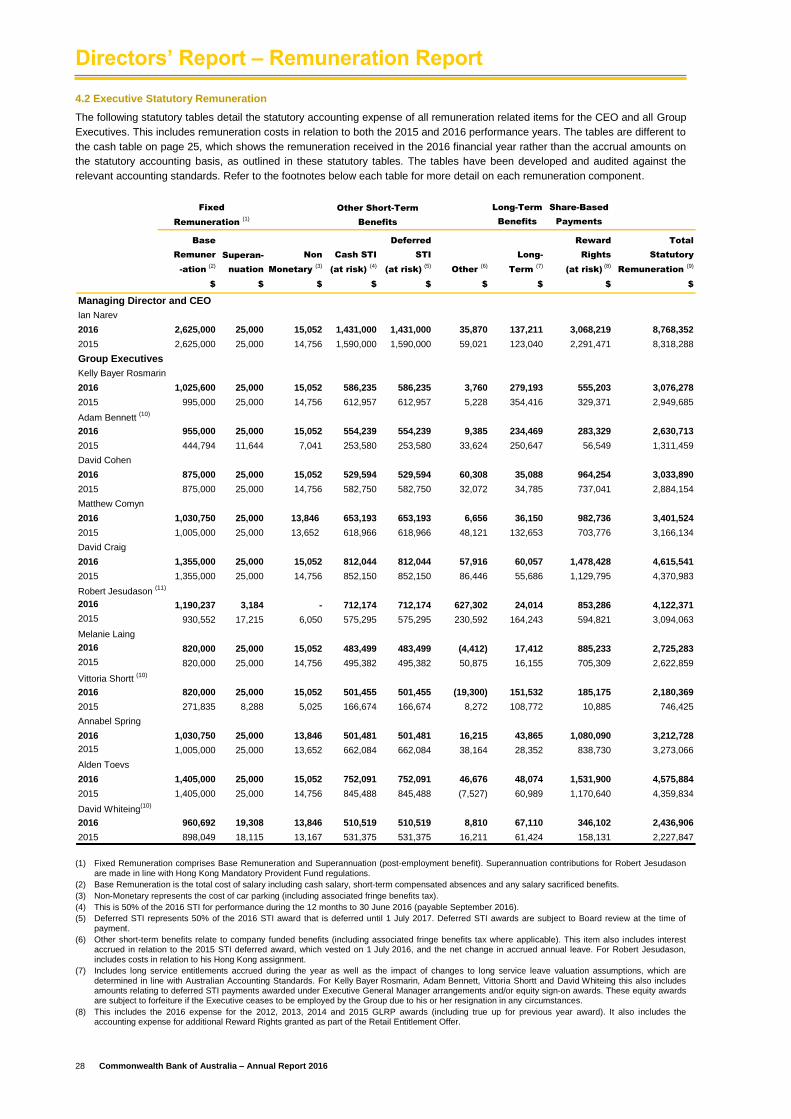
Directors’ Report – Remuneration Report
28 Commonwealth Bank of Australia – Annual Report 2016
4.2 Executive Statutory Remuneration
The following statutory tables detail the statutory accounting expense of all remuneration related items for the CEO and all Group
Executives. This includes remuneration costs in relation to both the 2015 and 2016 performance years. The tables are different to
the cash table on page 25, which shows the remuneration received in the 2016 financial year rather than the accrual amounts on
the statutory accounting basis, as outlined in these statutory tables. The tables have been developed and audited against the
relevant accounting standards. Refer to the footnotes below each table for more detail on each remuneration component.
Long-Term
Benefits
Share-Based
Payments
Base
Remuner
-ation (2)
Superan-
nuation
Non
Monetary (3)
Cash STI
(at risk) (4)
Deferred
STI
(at risk) (5)
Other (6)
Long-
Term (7)
Reward
Rights
(at risk) (8)
Total
Statutory
Remuneration (9)
$ $ $ $ $ $ $ $ $
Managing Director and CEO
Ian Narev
2016 2,625,000 25,000 15,052 1,431,000 1,431,000 35,870 137,211 3,068,219 8,768,352
2015 2,625,000 25,000 14,756 1,590,000 1,590,000 59,021 123,040 2,291,471 8,318,288
Group Executives
Kelly Bayer Rosmarin
2016 1,025,600 25,000 15,052 586,235 586,235 3,760 279,193 555,203 3,076,278
2015 995,000 25,000 14,756 612,957 612,957 5,228 354,416 329,371 2,949,685
Adam Bennett (10)
2016 955,000 25,000 15,052 554,239 554,239 9,385 234,469 283,329 2,630,713
2015 444,794 11,644 7,041 253,580 253,580 33,624 250,647 56,549 1,311,459
David Cohen
2016 875,000 25,000 15,052 529,594 529,594 60,308 35,088 964,254 3,033,890
2015 875,000 25,000 14,756 582,750 582,750 32,072 34,785 737,041 2,884,154
Matthew Comyn
2016 1,030,750 25,000 13,846 653,193 653,193 6,656 36,150 982,736 3,401,524
2015 1,005,000 25,000 13,652 618,966 618,966 48,121 132,653 703,776 3,166,134
David Craig
2016 1,355,000 25,000 15,052 812,044 812,044 57,916 60,057 1,478,428 4,615,541
2015 1,355,000 25,000 14,756 852,150 852,150 86,446 55,686 1,129,795 4,370,983
Robert Jesudason (11)
2016 1,190,237 3,184 - 712,174 712,174 627,302 24,014 853,286 4,122,371
2015 930,552 17,215 6,050 575,295 575,295 230,592 164,243 594,821 3,094,063
Melanie Laing
2016 820,000 25,000 15,052 483,499 483,499 (4,412) 17,412 885,233 2,725,283
2015 820,000 25,000 14,756 495,382 495,382 50,875 16,155 705,309 2,622,859
Vittoria Shortt (10)
2016 820,000 25,000 15,052 501,455 501,455 (19,300) 151,532 185,175 2,180,369
2015 271,835 8,288 5,025 166,674 166,674 8,272 108,772 10,885 746,425
Annabel Spring
2016 1,030,750 25,000 13,846 501,481 501,481 16,215 43,865 1,080,090 3,212,728
2015 1,005,000 25,000 13,652 662,084 662,084 38,164 28,352 838,730 3,273,066
Alden Toevs
2016 1,405,000 25,000 15,052 752,091 752,091 46,676 48,074 1,531,900 4,575,884
2015 1,405,000 25,000 14,756 845,488 845,488 (7,527) 60,989 1,170,640 4,359,834
David Whiteing(10)
2016 960,692 19,308 13,846 510,519 510,519 8,810 67,110 346,102 2,436,906
2015 898,049 18,115 13,167 531,375 531,375 16,211 61,424 158,131 2,227,847
Fixed
Remuneration (1)
Other Short-Term
Benefits
(1) Fixed Remuneration comprises Base Remuneration and Superannuation (post-employment benefit). Superannuation contributions for Robert Jesudason are made in line with Hong Kong Mandatory Provident Fund regulations.
(2) Base Remuneration is the total cost of salary including cash salary, short-term compensated absences and any salary sacrificed benefits.
(3) Non-Monetary represents the cost of car parking (including associated fringe benefits tax).
(4) This is 50% of the 2016 STI for performance during the 12 months to 30 June 2016 (payable September 2016).
(5) Deferred STI represents 50% of the 2016 STI award that is deferred until 1 July 2017. Deferred STI awards are subject to Board review at the time of payment.
(6) Other short-term benefits relate to company funded benefits (including associated fringe benefits tax where applicable). This item also includes interest accrued in relation to the 2015 STI deferred award, which vested on 1 July 2016, and the net change in accrued annual leave. For Robert Jesudason, includes costs in relation to his Hong Kong assignment.
(7) Includes long service entitlements accrued during the year as well as the impact of changes to long service leave valuation assumptions, which are determined in line with Australian Accounting Standards. For Kelly Bayer Rosmarin, Adam Bennett, Vittoria Shortt and David Whiteing this also includes amounts relating to deferred STI payments awarded under Executive General Manager arrangements and/or equity sign-on awards. These equity awards are subject to forfeiture if the Executive ceases to be employed by the Group due to his or her resignation in any circumstances.
(8) This includes the 2016 expense for the 2012, 2013, 2014 and 2015 GLRP awards (including true up for previous year award). It also includes the accounting expense for additional Reward Rights granted as part of the Retail Entitlement Offer.

Directors’ Report – Remuneration Report
29 Commonwealth Bank of Australia – Annual Report 2016
(9) The percentage of 2016 remuneration related to performance was: Ian Narev 68%, Kelly Bayer Rosmarin 56%, Adam Bennett 53%, David Cohen 67%, Matthew Comyn 67%, David Craig 67%, Robert Jesudason 55%, Melanie Laing 68%, Vittoria Shortt 54%, Annabel Spring 65%, Alden Toevs 66%, and David Whiteing 56%.
(10) For 2015 comparative, David Whiteing commenced in the KMP role on 14 July 2014, Adam Bennett commenced in the KMP role on 12 January 2015 and Vittoria Shortt commenced in the KMP role on 2 March 2015. Their remuneration reflects time in the KMP role.
(11) For Robert Jesudason remuneration is paid in Hong Kong dollars and was impacted by movements in exchange rates.
4.3 Executive STI Allocations for 2016
STI Target (1) Maximum STI (1)
$ % % $ % $
Managing Director and CEO
Ian Narev 2,650,000 150% 50% 1,431,000 50% 1,431,000
Group Executives
Kelly Bayer Rosmarin 1,050,600 150% 50% 586,235 50% 586,235
Adam Bennett 980,000 150% 50% 554,239 50% 554,239
David Cohen 900,000 150% 50% 529,594 50% 529,594
Matthew Comyn 1,055,750 150% 50% 653,193 50% 653,193
David Craig 1,380,000 150% 50% 812,044 50% 812,044
Robert Jesudason 1,193,421 150% 50% 712,174 50% 712,174
Melanie Laing 845,000 150% 50% 483,499 50% 483,499
Vittoria Shortt 845,000 150% 50% 501,455 50% 501,455
Annabel Spring 1,055,750 150% 50% 501,481 50% 501,481
Alden Toevs 1,430,000 150% 50% 752,091 50% 752,091
David Whiteing 980,000 150% 50% 510,519 50% 510,519
Cash STI (2)
Deferred STI (3)
(1) The maximum STI is represented as a percentage of fixed remuneration. The minimum STI is zero.
(2) Includes 50% of the annual STI award payable as cash in recognition of performance for the year ended 30 June 2016.
(3) This represents 50% of the STI award that is deferred until 1 July 2017. Deferred STI awards are subject to Board review at the time of payment.
4.4 Equity Awards Received as Remuneration
The table below details the value and number of all equity awards that were granted or forfeited/lapsed to Executives during their
time in a KMP role in 2016. It also shows the number of previous year’s awards that vested during the 2016 performance year
(some of which relate to past non-KMP roles).
Previous Years'
Awards Vested
during 2016 (4)
Name Class Units $ Units Units $
Managing Director and CEO
Ian Narev GLRP Reward Rights 54,493 2,480,651 70,398 (11,222) (925,991)
Group Executives
Kelly Bayer Rosmarin GLRP Reward Rights 21,507 921,888 - - -
Deferred Rights 19 1,359 5,201 - -
Adam Bennett GLRP Reward Rights 20,010 857,673 - - -
Deferred Rights 2,073 157,101 4,382 - -
David Cohen GLRP Reward Rights 18,512 794,437 23,245 (3,705) (305,721)
Matthew Comyn GLRP Reward Rights 21,707 931,534 - - -
Deferred Rights - - 6,119 - -
David Craig GLRP Reward Rights 28,385 1,218,155 35,641 (5,681) (468,772)
Robert Jesudason GLRP Reward Rights 20,544 881,456 - - -
Deferred Rights - - 4,295 - -
Melanie Laing GLRP Reward Rights 17,377 745,713 20,661 (3,293) (271,724)
Vittoria Shortt GLRP Reward Rights 17,249 739,341 - - -
Deferred Rights 2,264 171,609 2,937 - -
Annabel Spring GLRP Reward Rights 21,707 931,534 25,308 (4,034) (332,868)
Alden Toevs GLRP Reward Rights 29,413 1,262,286 36,932 (5,887) (485,770)
David Whiteing GLRP Reward Rights 20,034 858,552 - - -
Deferred Rights 5 358 - - -
Forfeited or
Granted Lapsed
during 2016 (1)(2)(3)
during 2016 (5)
(1) Represents the maximum number of GLRP Reward Rights and Deferred Rights that may vest to each Executive. For GLRP Reward Rights the value represents the fair value at grant date. For Ian Narev, the grant date for his GLRP Reward Rights was 17 November 2015. For all other Executives the grant date for GLRP Reward Rights was 10 November 2015. The grant date for additional GLRP Reward Rights granted as part of the Retail Entitlement Offer was 17 November 2015. Deferred Rights represent the deferred STI awarded under Executive General Manager arrangements, sign-on and retention awards received as restricted rights. For Deferred Rights the value reflects the face value at grant date. The minimum potential outcome for GLRP Reward Rights and Deferred Rights is zero.
(2) Includes the following additional rights granted as part of the Retail Entitlement Offer: Ian Narev 444 rights, Kelly Bayer Rosmarin 97 rights, Adam Bennett 39 rights, David Cohen 155 rights, Matthew Comyn 173 rights, David Craig 239 rights, Robert Jesudason 147 rights, Melanie Laing 142 rights, Vittoria Shortt 25 rights, Annabel Spring 173 rights, Alden Toevs 246 rights and David Whiteing 51 rights.
(3) As at 1 July 2015, the maximum value of GLRP Reward Rights granted during 2016 (excluding additional rights granted as part of the Retail Entitlement Offer in relation to unvested 2012, 2013 and 2014 GLRP awards), based on the volume weighted average price of the Group’s ordinary shares over the five trading days up to and including 1 July 2015 was: Ian Narev $4,639,026, Kelly Bayer Rosmarin $1,839,251, Adam Bennett $1,715,570, David Cohen

Directors’ Report – Remuneration Report
30 Commonwealth Bank of Australia – Annual Report 2016
$1,575,581, Matthew Comyn $1,848,263, David Craig $2,415,771, Robert Jesudason $1,750,675, Melanie Laing $1,479,280, Vittoria Shortt $1,479,280, Annabel Spring $1,848,263, Alden Toevs $2,503,404 and David Whiteing $1,715,570.
(4) Previous years' awards that vested include the 2011 GLRP award and other deferred equity awards. A portion of Ian Narev’s vested equity award was delivered in the form of cash, which was paid to registered charities pursuant to an option that the Board made available in the current year.
(5) This includes the portion of the 2011 GLRP award that vested during 2016 that did not meet the performance hurdle and was forfeited. The value of the lapsed award is calculated using the Volume Weighted Average Closing Price for the five days preceding the transaction date.
4.5 Fair Value Assumptions for Unvested Equity Awards
For the Customer Satisfaction component of all LTI awards, the fair value is the closing market price of a CBA share as at the
grant date. For the TSR component of the LTI awards, the fair value has been calculated using a Monte Carlo simulation method
using the below assumptions. The exercise price is nil across all GLRP awards.
Fair Performance Expected Expected Risk Free
Grant Value Period Life Volatility Rate
Equity Plan Date $ End (Years) % %
2015 GLRP Reward Rights (2) 17/11/2015 35.15 30/06/2019 3.62 20 2.35
2015 GLRP Reward Rights (3) 17/11/2015 77.07 30/06/2019 n/a n/a n/a
2015 GLRP Reward Rights (2) 10/11/2015 32.41 30/06/2019 3.64 20 2.29
2015 GLRP Reward Rights (3) 10/11/2015 74.76 30/06/2019 n/a n/a n/a
2015 GLRP Reward Rights (2)(4) 17/11/2015 35.15 30/06/2019 3.62 20 2.35
2015 GLRP Reward Rights (3)(4) 17/11/2015 77.07 30/06/2019 n/a n/a n/a
2014 GLRP Reward Rights (2)(4) 17/11/2015 23.17 30/06/2018 2.62 20 2.18
2014 GLRP Reward Rights (3)(4) 17/11/2015 77.07 30/06/2018 n/a n/a n/a
2013 GLRP Reward Rights (2)(4) 17/11/2015 42.59 30/06/2017 1.62 20 2.14
2013 GLRP Reward Rights (3)(4) 17/11/2015 77.07 30/06/2017 n/a n/a n/a
2012 GLRP Reward Rights (2)(4) 17/11/2015 48.96 30/06/2016 0.62 20 2.14
2012 GLRP Reward Rights (3)(4) 17/11/2015 77.07 30/06/2016 n/a n/a n/a
Assumptions (1)
(1) For the TSR component of the GLRP awards, a zero dividend yield has been assumed given that dividends are incorporated into the fair value of the rights.
(2) The performance hurdle for this portion of the GLRP award is TSR relative to the Group’s peers.
(3) The performance hurdle for this portion of the GLRP award is Customer Satisfaction relative to the Group’s peers.
(4) Additional Reward Rights granted as part of the Retail Entitlement Offer as outlined in section 3.2.
4.6 Termination Arrangements
The table below provides the termination arrangements included in all Executive contracts for current KMP.
Contract
Type (1)
Notice Severance (2)
Managing Director & CEO
Ian Narev Permanent 12 months n/a
Group Executives
Kelly Bayer Rosmarin Permanent 6 months 6 months
Adam Bennett Permanent 6 months 6 months
David Cohen Permanent 6 months 6 months
Matthew Comyn Permanent 6 months 6 months
David Craig Permanent 6 months 6 months
Robert Jesudason Permanent 6 months 6 months
Melanie Laing Permanent 6 months 6 months
Vittoria Shortt Permanent 6 months 6 months
Annabel Spring Permanent 6 months 6 months
Alden Toevs Permanent 6 months n/a
David Whiteing Permanent 6 months 6 months
(1) Permanent contracts are ongoing until notice is given by either party.
(2) Severance applies where the termination is initiated by the Group, other than for misconduct or unsatisfactory performance.
The termination entitlements are appropriate and do not deliver windfall payments on termination that are not related to
performance. As part of these arrangements, Executives who resign or are dismissed will forfeit all their unvested deferred
awards (including cash and equity awards), unless the Board determines otherwise, and will generally not be entitled to a STI
payment for that year. At the Board’s discretion, where an Executive’s exit is related to retrenchment, retirement or death, the
Executive may be entitled to an STI payment and any outstanding LTI awards continue unchanged with performance measured
at the end of the performance period related to each award. The Board has ultimate discretion over the amount of awards that
may vest.

Directors’ Report – Remuneration Report
31 Commonwealth Bank of Australia – Annual Report 2016
4.7 Security Holdings of KMP
Details of the shareholdings and other securities held by KMP (or close family members or entities controlled, jointly controlled, or
significantly influenced by them, or any entity over which any of the aforementioned hold significant voting power) are set out
below. For details of Director and Executive equity plans refer to the Financial Statements Note 24 Share-Based Payments.
(a) Shares and other securities held by Directors
All shares were acquired by Directors on normal terms and conditions or through the Non-Executive Director’s Share Plan. Other
securities acquired by Directors were on normal terms and conditions.
Balance Net Change Balance
Directors Class 1 July 2015 Acquired (1)
Other (2)
30 June 2016
Non-Executive Directors
David Turner Ordinary 11,840 428 - 12,268
PERLS (5) 380 1,000 - 1,380
John Anderson Ordinary 18,186 792 - 18,978
Shirish Apte Ordinary 7,500 - - 7,500
David Higgins Ordinary 5,023 5,323 - 10,346
Launa Inman Ordinary 3,580 641 - 4,221
Catherine Livingstone (3) Ordinary n/a - 5,146 5,146
Brian Long Ordinary 12,470 2,184 - 14,654
PERLS (5) 800 6,050 - 6,850
Andrew Mohl Ordinary 67,230 20,316 (5,312) 82,234
Mary Padbury (3)
PERLS (5) n/a - 1,600 1,600
Wendy Stops Ordinary 13,000 2,218 - 15,218
Harrison Young Ordinary 26,764 3,236 - 30,000
Former Non-Executive Director
Jane Hemstritch (4) Ordinary 25,775 1,122 - n/a
PERLS (5) 11,800 2,500 (2,500) n/a
Other securities (6) 5,000 - - n/a
(1) Incorporates shares and other securities purchased during the year. Non-Executive Directors who hold less than 5,000 Commonwealth Bank shares are
required to receive 20% of their total post-tax annual fees as Commonwealth Bank shares. These shares are subject to a 10 year trading restriction (the shares will be released earlier if the director leaves the Board).
(2) Net Change Other incorporates changes resulting from sales of securities and appointment of Non-Executive Directors during the year.
(3) Catherine Livingstone was appointed as a Non-Executive Director on 1 March 2016 and Mary Padbury was appointed as a Non-Executive Director on 14 June 2016. Their shareholdings have not been included in the opening balance as at 1 July 2015.
(4) Jane Hemstritch retired from the Group on 31 March 2016 and her shareholdings are not included in the balance as at 30 June 2016.
(5) Includes cumulative holdings of all PERLS securities issued by the Group.
(6) As at 31 March 2016 Jane Hemstritch held Colonial Sub notes (2015: Colonial Sub notes).
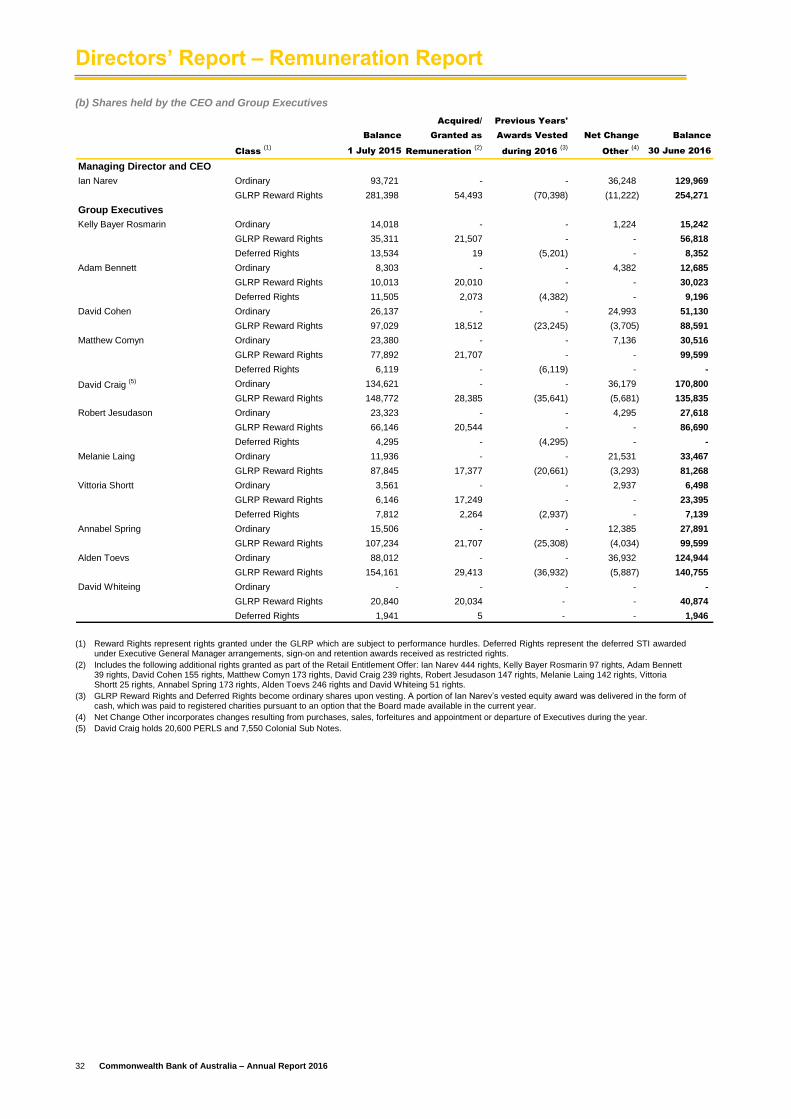
Directors’ Report – Remuneration Report
32 Commonwealth Bank of Australia – Annual Report 2016
(b) Shares held by the CEO and Group Executives
Acquired/ Previous Years'
Balance Granted as Awards Vested Net Change Balance
Class (1)
1 July 2015 Remuneration (2)
during 2016 (3)
Other (4)
30 June 2016
Managing Director and CEO
Ian Narev Ordinary 93,721 - - 36,248 129,969
GLRP Reward Rights 281,398 54,493 (70,398) (11,222) 254,271
Group Executives
Kelly Bayer Rosmarin Ordinary 14,018 - - 1,224 15,242
GLRP Reward Rights 35,311 21,507 - - 56,818
Deferred Rights 13,534 19 (5,201) - 8,352
Adam Bennett Ordinary 8,303 - - 4,382 12,685
GLRP Reward Rights 10,013 20,010 - - 30,023
Deferred Rights 11,505 2,073 (4,382) - 9,196
David Cohen Ordinary 26,137 - - 24,993 51,130
GLRP Reward Rights 97,029 18,512 (23,245) (3,705) 88,591
Matthew Comyn Ordinary 23,380 - - 7,136 30,516
GLRP Reward Rights 77,892 21,707 - - 99,599
Deferred Rights 6,119 - (6,119) - -
David Craig (5) Ordinary 134,621 - - 36,179 170,800
GLRP Reward Rights 148,772 28,385 (35,641) (5,681) 135,835
Robert Jesudason Ordinary 23,323 - - 4,295 27,618
GLRP Reward Rights 66,146 20,544 - - 86,690
Deferred Rights 4,295 - (4,295) - -
Melanie Laing Ordinary 11,936 - - 21,531 33,467
GLRP Reward Rights 87,845 17,377 (20,661) (3,293) 81,268
Vittoria Shortt Ordinary 3,561 - - 2,937 6,498
GLRP Reward Rights 6,146 17,249 - - 23,395
Deferred Rights 7,812 2,264 (2,937) - 7,139
Annabel Spring Ordinary 15,506 - - 12,385 27,891
GLRP Reward Rights 107,234 21,707 (25,308) (4,034) 99,599
Alden Toevs Ordinary 88,012 - - 36,932 124,944
GLRP Reward Rights 154,161 29,413 (36,932) (5,887) 140,755
David Whiteing Ordinary - - - - -
GLRP Reward Rights 20,840 20,034 - - 40,874
Deferred Rights 1,941 5 - - 1,946
(1) Reward Rights represent rights granted under the GLRP which are subject to performance hurdles. Deferred Rights represent the deferred STI awarded under Executive General Manager arrangements, sign-on and retention awards received as restricted rights.
(2) Includes the following additional rights granted as part of the Retail Entitlement Offer: Ian Narev 444 rights, Kelly Bayer Rosmarin 97 rights, Adam Bennett 39 rights, David Cohen 155 rights, Matthew Comyn 173 rights, David Craig 239 rights, Robert Jesudason 147 rights, Melanie Laing 142 rights, Vittoria Shortt 25 rights, Annabel Spring 173 rights, Alden Toevs 246 rights and David Whiteing 51 rights.
(3) GLRP Reward Rights and Deferred Rights become ordinary shares upon vesting. A portion of Ian Narev’s vested equity award was delivered in the form of cash, which was paid to registered charities pursuant to an option that the Board made available in the current year.
(4) Net Change Other incorporates changes resulting from purchases, sales, forfeitures and appointment or departure of Executives during the year.
(5) David Craig holds 20,600 PERLS and 7,550 Colonial Sub Notes.

Directors’ Report – Remuneration Report
33 Commonwealth Bank of Australia – Annual Report 2016
4.8 Loans to KMP
All loans to KMP (including close family members or entities controlled, jointly controlled, or significantly influenced by them, or
any entity over which any of the aforementioned held significant voting power) have been made in the ordinary course of business
on normal commercial terms and conditions no more favourable than those given to other employees and customers, including
the term of the loan, security required and the interest rate (which may be fixed or variable). There has been no write down of
loans during the period.
4.9 Total Loans to KMP
2016
$
Opening Balance 10,130,233
Closing Balance 11,354,745
Interest Charged 456,842
4.10 Loans to KMP Exceeding $100,000 in Aggregate
Highest
Balance Interest Interest Not Balance Balance
1 July 2015 Charged Charged Write-off 30 June 2016 in Period (1)
$ $ $ $ $ $
Kelly Bayer Rosmarin 2,744,784 80,923 - - 2,196,663 2,744,784
David Cohen 522,505 24,501 - - 509,980 544,940
Matthew Comyn 2,131,212 93,390 - - 2,324,854 2,604,951
Melanie Laing 429,061 10,897 - - 279,955 573,780
Mary Padbury (2) N/A 1,162 - - 786,881 792,512
Vittoria Shortt 2,261,178 161,604 - - 3,668,455 3,904,563
Annabel Spring 8,324 7,078 - - 3,911 9,533,534
David Whiteing 1,917,959 77,265 - - 1,425,731 1,956,882
Total 10,015,023 456,820 - - 11,196,430 22,655,946
(1) Represents the highest balance per individual of loans outstanding at any point during the year ended 30 June 2016.
(2) Mary Padbury was appointed as a Director on 14 June 2016. As interest is paid in arrears no interest was disclosed for the year ended 30 June 2016.
4.11 Other Transactions of KMP
Financial Instrument Transactions
Financial instrument transactions (other than loans and shares disclosed within this report) of KMP occur in the ordinary course of
business on normal commercial terms and conditions no more favourable than those given to other employees and customers.
Disclosure of financial instrument transactions regularly made as part of normal banking operations is limited to disclosure of such
transactions with KMP and entities controlled or significantly influenced by them.
All such financial instrument transactions that have occurred between entities within the Group and their KMP were in the nature
of normal personal banking and deposit transactions.
Transactions other than Financial Instrument Transactions of Banks
All other transactions with KMP and their related entities and other related parties are conducted in the ordinary course of
business on normal commercial terms and conditions no more favourable than those given to other employees and customers.
These transactions principally involve the provision of financial and investment services by entities not controlled by the Group. A
related party of an Executive is also employed by the Group, and is remunerated in a manner consistent with normal employee
relationships.

Directors’ Report – Remuneration Report
34 Commonwealth Bank of Australia – Annual Report 2016
Glossary of Key Terms
To assist readers, key terms and abbreviations used in the remuneration report as they apply to the Group are set out below.
Term Definition
Base Remuneration Cash and non-cash remuneration, including any salary sacrifice items, paid regularly with no
performance conditions.
Board The Board of Directors of the Group.
Deferred Rights Rights subject to forfeiture on resignation. These are used for deferred STI awarded under
Executive General Manager arrangements, sign-on and retention awards.
Executives The CEO and Group Executives are collectively referenced as ‘Executives’.
Fixed Remuneration Consists of Base Remuneration plus employer contributions to superannuation.
Group Commonwealth Bank of Australia and its subsidiaries.
Group Executive Key Management Personnel who are also members of the Group’s Executive Committee.
Group Leadership Reward
Plan (GLRP)
The Group’s long-term incentive plan for the CEO and Group Executives.
Key Management Personnel
(KMP)
Persons having authority and responsibility for planning, directing and controlling the activities
of an entity, directly or indirectly, including any Director (whether Executive or otherwise) of
that entity.
Long-Term Incentive (LTI) A remuneration arrangement which grants benefits to participating Executives that may vest
over a period of four years if, and to the extent that, performance hurdles are met. The
Group’s long-term incentive plan is the GLRP.
NPAT Net profit after tax.
Remuneration Received Represents all forms of consideration paid by the Group or on behalf of the Group during the
current performance year ending 30 June 2016, in exchange for services previously rendered
to the Group.
Retail Entitlement Offer During the period the Group undertook a capital raising through a rights issue to all share
holders. An accelerated institutional offer closed on 13 August 2015, while the retail
entitlement offer closed on 8 September 2015.
Reward Rights Rights to ordinary shares in CBA granted under the GLRP and subject to performance
hurdles.
Salary Sacrifice An arrangement where an employee agrees to forgo part of his or her cash component of
Base Remuneration in return for non-cash benefits of a similar value.
Short-Term Incentive (STI) Remuneration paid with direct reference to the Group’s and the individual’s performance over
one financial year.
Statutory Remuneration All forms of consideration paid, payable or provided by the Group, or on behalf of the Group,
in exchange for services rendered to the Group. In reading this report, the term
“remuneration” means the same as the term “compensation” for the purposes of the
Corporations Act 2001 and the accounting standard AASB124.
Total Shareholder Return
(TSR)
TSR measures a company’s share price movement, dividend yield and any return of capital
over a specific period.
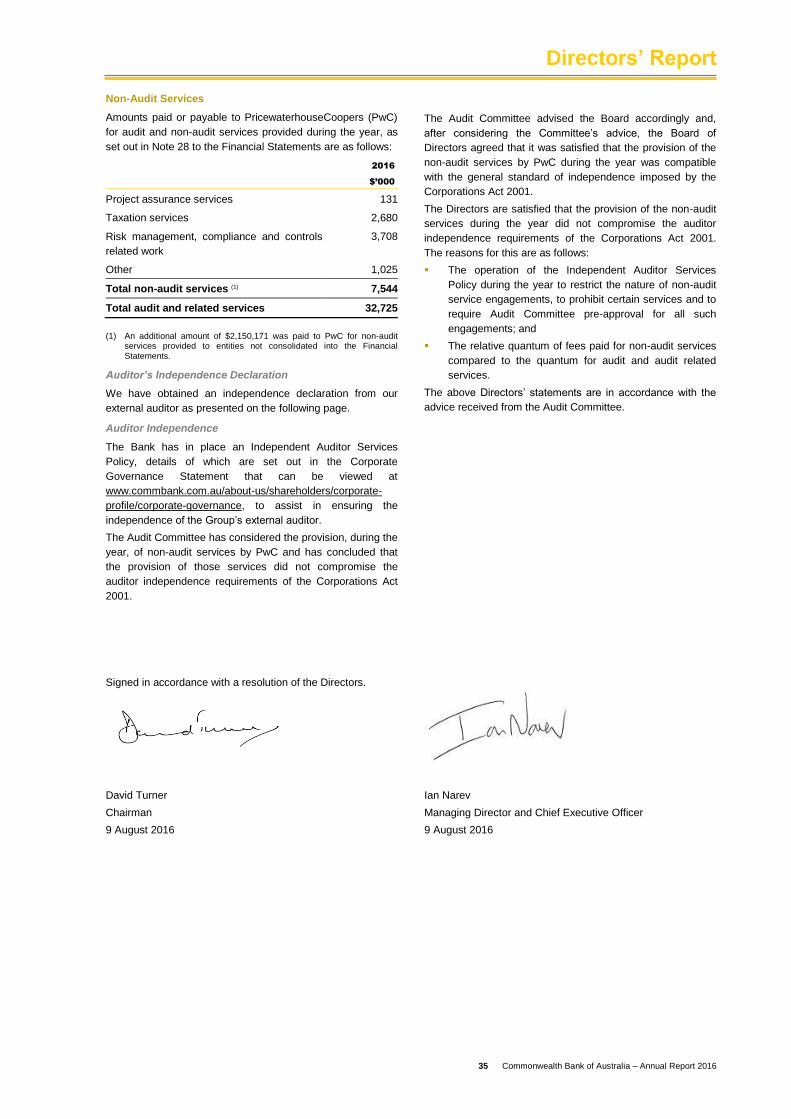
Directors’ Report
35 Commonwealth Bank of Australia – Annual Report 2016
Non-Audit Services
Amounts paid or payable to PricewaterhouseCoopers (PwC)
for audit and non-audit services provided during the year, as
set out in Note 28 to the Financial Statements are as follows:
2016
$’000
Project assurance services 131
Taxation services 2,680
Risk management, compliance and controls
related work
3,708
Other 1,025
Total non-audit services (1) 7,544
Total audit and related services 32,725
(1) An additional amount of $2,150,171 was paid to PwC for non-audit services provided to entities not consolidated into the Financial Statements.
Auditor’s Independence Declaration
We have obtained an independence declaration from our
external auditor as presented on the following page.
Auditor Independence
The Bank has in place an Independent Auditor Services
Policy, details of which are set out in the Corporate
Governance Statement that can be viewed at
www.commbank.com.au/about-us/shareholders/corporate-
profile/corporate-governance, to assist in ensuring the
independence of the Group’s external auditor.
The Audit Committee has considered the provision, during the
year, of non-audit services by PwC and has concluded that
the provision of those services did not compromise the
auditor independence requirements of the Corporations Act
2001.
Signed in accordance with a resolution of the Directors.
The Audit Committee advised the Board accordingly and,
after considering the Committee’s advice, the Board of
Directors agreed that it was satisfied that the provision of the
non-audit services by PwC during the year was compatible
with the general standard of independence imposed by the
Corporations Act 2001.
The Directors are satisfied that the provision of the non-audit
services during the year did not compromise the auditor
independence requirements of the Corporations Act 2001.
The reasons for this are as follows:
The operation of the Independent Auditor Services
Policy during the year to restrict the nature of non-audit
service engagements, to prohibit certain services and to
require Audit Committee pre-approval for all such
engagements; and
The relative quantum of fees paid for non-audit services
compared to the quantum for audit and audit related
services.
The above Directors’ statements are in accordance with the
advice received from the Audit Committee.
David Turner
Chairman
9 August 2016
Ian Narev
Managing Director and Chief Executive Officer
9 August 2016

Commonwealth Bank of Australia – Annual Report 2016 36
Auditor’s Independence Declaration
As lead auditor for the audit of Commonwealth Bank of Australia for the year ended 30 June 2016, I declare that to
the best of my knowledge and belief, there have been:
a) no contraventions of the auditor independence requirements of the Corporations Act 2001 in relation to the
audit; and
b) no contraventions of any applicable code of professional conduct in relation to the audit.
This declaration is in respect of Commonwealth Bank of Australia and the entities it controlled during the period.
Marcus Laithwaite
Partner
PricewaterhouseCoopers
Sydney
9 August 2016
PricewaterhouseCoopers, ABN 52 780 433 757
Darling Park Tower 2, 201 Sussex Street, GPO BOX 2650, SYDNEY NSW 1171
T: +61 2 8266 0000, F: +61 2 8266 9999, www.pwc.com.au

Financial Statements
Commonwealth Bank of Australia – Annual Report 2016 37
Income Statements 38
Statements of Comprehensive Income 39
Balance Sheets 40
Statements of Changes in Equity 41
Statements of Cash Flows 43
Note 1 Accounting Policies 45
Note 2 Profit 56
Note 3 Average Balances and Related Interest 58
Note 4 Income Tax 61
Note 5 Dividends 64
Note 6 Earnings Per Share 65
Note 7 Cash and Liquid Assets 65
Note 8 Receivables Due from Other Financial Institutions 65
Note 9 Assets at Fair Value through Income Statement 66
Note 10 Derivative Financial Instruments 66
Note 11 Available-for-Sale Investments 70
Note 12 Loans, Bills Discounted and Other Receivables 71
Note 13 Provisions for Impairment 74
Note 14 Property, Plant and Equipment 76
Note 15 Intangible Assets 78
Note 16 Other Assets 80
Note 17 Deposits and Other Public Borrowings 80
Note 18 Liabilities at Fair Value through Income Statement 81
Note 19 Other Provisions 81
Note 20 Debt Issues 83
Note 21 Bills Payable and Other Liabilities 84
Note 22 Loan Capital 85
Note 23 Shareholders’ Equity 86
Note 24 Share-Based Payments 89
Note 25 Capital Adequacy 91
Note 26 Financial Reporting by Segments 92
Note 27 Life Insurance 95
Note 28 Remuneration of Auditors 97
Note 29 Lease Commitments 97
Note 30 Contingent Liabilities, Contingent Assets and Commitments 98
Note 31 Risk Management 100
Note 32 Credit Risk 104
Note 33 Market Risk 118
Note 34 Liquidity and Funding Risk 120
Note 35 Retirement Benefit Obligations 123
Note 36 Investments in Subsidiaries and Other Entities 126
Note 37 Key Management Personnel 131
Note 38 Related Party Disclosures 132
Note 39 Notes to the Statements of Cash Flows 133
Note 40 Disclosures about Fair Values 134
Note 41 Securitisation, Covered Bonds and Transferred Assets 140
Note 42 Collateral Arrangements 141
Note 43 Offsetting Financial Assets and Financial Liabilities 142
Note 44 Subsequent Events 144

Financial Statements
38 Commonwealth Bank of Australia – Annual Report 2016
Income Statements
For the year ended 30 June 2016
Group (1)
Bank (1)
2016 2015 2014 2016 2015
Note $M $M $M $M $M
Interest income 2 33,817 34,145 33,691 34,660 34,975
Interest expense 2 (16,882) (18,322) (18,550) (19,545) (20,988)
Net interest income 16,935 15,823 15,141 15,115 13,987
Other banking income 4,576 4,828 4,280 6,035 6,791
Net banking operating income 21,511 20,651 19,421 21,150 20,778
Funds management income 2,315 2,396 2,356 - -
Investment revenue 283 618 840 - -
Claims, policyholder liability and commission expense (537) (1,011) (1,162) - -
Net funds management operating income 2 2,061 2,003 2,034 - -
Premiums from insurance contracts 2,921 2,797 2,604 - -
Investment revenue 467 543 547 - -
Claims, policyholder liability and commission expense
from insurance contracts (2,382) (2,326) (2,118) - -
Net insurance operating income 2 1,006 1,014 1,033 - -
Total net operating income before impairment
and operating expenses 2 24,578 23,668 22,488 21,150 20,778
Loan impairment expense 2,13 (1,256) (988) (918) (1,153) (837)
Operating expenses 2 (10,468) (10,068) (9,573) (8,538) (8,271)
Net profit before income tax 2 12,854 12,612 11,997 11,459 11,670
Corporate income tax expense 4 (3,506) (3,429) (3,221) (2,820) (2,694)
Policyholder tax expense 4 (101) (99) (126) - -
Net profit after income tax 9,247 9,084 8,650 8,639 8,976
Non-controlling interests (20) (21) (19) - -
Net profit attributable to Equity holders of the
Bank 9,227 9,063 8,631 8,639 8,976
The above Income Statements should be read in conjunction with the accompanying notes.
Group (2)
2016 2015 2014
Note
Earnings per share:
Basic 6 542.5 553.7 530.6
Fully diluted 6 529.5 539.6 518.9
Cents per share
(1) Comparative information has been reclassified to conform to presentation in the current year.
(2) Comparative information has been restated to incorporate the bonus element of the rights issue in the weighted average number of ordinary shares.

Financial Statements
Commonwealth Bank of Australia – Annual Report 2016 39
Statements of Comprehensive Income
For the year ended 30 June 2016
Group Bank
2016 2015 2014 2016 2015
$M $M $M $M $M
Net profit after income tax for the financial year 9,247 9,084 8,650 8,639 8,976
Other comprehensive income/(expense):
Items that may be reclassified subsequently to profit/(loss):
Foreign currency translation reserve net of tax 383 398 385 53 171
Gains and (losses) on cash flow hedging instruments net of tax 210 39 (144) 202 106
Gains and (losses) on available-for-sale investments net of tax (316) (45) 338 (331) (84)
Total of items that may be reclassified 277 392 579 (76) 193
Items that will not be reclassified to profit/(loss):
Actuarial gains and (losses) from defined benefit superannuation plans net
of tax10 311 42 10 311
Gains and (losses) on liabilities at fair value due to changes in own credit
risk net of tax(1) (3) 6 (1) (3)
Revaluation of properties net of tax 1 15 26 1 11
Total of items that will not be reclassified 10 323 74 10 319
Other comprehensive income/(expense) net of income tax 287 715 653 (66) 512
Total comprehensive income for the financial year 9,534 9,799 9,303 8,573 9,488
Total comprehensive income for the financial year is attributable
to:
Equity holders of the Bank 9,514 9,778 9,284 8,573 9,488
Non-controlling interests 20 21 19 - -
Total comprehensive income net of income tax 9,534 9,799 9,303 8,573 9,488
The above Statements of Comprehensive Income should be read in conjunction with the accompanying notes.
Group
2016 2015 2014
Note
Dividends per share attributable to shareholders of the Bank:
Ordinary shares 5 420 420 401
Trust preferred securities 7,994 7,387 6,498
Cents per share

Financial Statements
40 Commonwealth Bank of Australia – Annual Report 2016
Balance Sheets
As at 30 June 2016
Group Bank
2016 2015 2016 2015
Note $M $M $M $M
Assets
Cash and liquid assets 7 23,372 33,116 21,582 31,683
Receivables due from other financial institutions (1) 8 11,591 13,063 10,182 11,204
Assets at fair value through Income Statement: 9
Trading 34,067 26,424 32,985 25,135
Insurance 13,547 14,088 - -
Other 1,480 1,278 1,187 989
Derivative assets 10 46,567 46,154 46,525 45,607
Available-for-sale investments 11 80,898 74,684 76,361 72,304
Loans, bills discounted and other receivables 12 695,398 639,262 617,919 573,435
Bank acceptances of customers 1,431 1,944 1,413 1,908
Shares in and loans to controlled entities 38 - - 145,953 143,756
Property, plant and equipment 14 3,940 2,833 1,503 1,509
Investment in associates and joint ventures 36 2,776 2,637 1,231 1,245
Intangible assets 15 10,384 9,970 4,778 4,700
Deferred tax assets 4 345 455 793 771
Other assets (1) 16 7,282 7,538 5,997 5,921
Total assets 933,078 873,446 968,409 920,167
Liabilities
Deposits and other public borrowings 17 588,045 543,231 536,086 497,625
Payables due to other financial institutions 28,771 36,416 28,328 35,516
Liabilities at fair value through Income Statement 18 10,292 8,493 7,441 7,323
Derivative liabilities 10 39,921 35,213 43,884 39,636
Bank acceptances 1,431 1,944 1,413 1,908
Due to controlled entities - - 130,046 126,496
Current tax liabilities 1,022 661 892 578
Deferred tax liabilities 4 340 351 - -
Other provisions 19 1,656 1,726 1,249 1,254
Insurance policy liabilities 27 12,636 12,911 - -
Debt issues 20 161,284 154,429 134,214 130,359
Managed funds units on issue 1,606 1,149 - -
Bills payable and other liabilities 21 9,774 11,105 11,642 14,361
856,778 807,629 895,195 855,056
Loan capital 22 15,544 12,824 15,138 13,364
Total liabilities 872,322 820,453 910,333 868,420
Net assets 60,756 52,993 58,076 51,747
Shareholders' Equity
Share capital:
Ordinary share capital 23 33,845 27,619 34,125 27,894
Other equity instruments 23 - 939 406 1,895
Reserves 23 2,734 2,345 3,115 3,195
Retained profits 23 23,627 21,528 20,430 18,763
Shareholders' Equity attributable to Equity holders of the Bank 60,206 52,431 58,076 51,747
Non-controlling interests 36 550 562 - -
Total Shareholders' Equity 60,756 52,993 58,076 51,747
(1) Comparative information has been reclassified to conform to presentation in the current year.
The above Balance Sheets should be read in conjunction with the accompanying notes.

Financial Statements
Commonwealth Bank of Australia – Annual Report 2016 41
Statements of Changes in Equity
For the year ended 30 June 2016
Group
Shareholders'
Equity
attributable
Ordinary Other to Equity Non- Total
share equity Retained holders controlling Shareholders'
capital instruments Reserves profits of the Bank interests Equity
$M $M $M $M $M $M $M
As at 30 June 2014 27,036 939 2,009 18,827 48,811 537 49,348
Net profit after income tax - - - 9,063 9,063 21 9,084
Net other comprehensive income - - 407 308 715 - 715
Total comprehensive income for the
financial year - - 407 9,371 9,778 21 9,799
Transactions with Equity holders in
their capacity as Equity holders:
Dividends paid on ordinary shares - - - (6,744) (6,744) - (6,744)
Dividends paid on other equity
instruments - - - (36) (36) - (36)
Dividend reinvestment plan (net of
issue costs) 571 - - - 571 - 571
Issue of shares (net of issue costs) - - - - - - -
Share-based payments - - (3) - (3) - (3)
Purchase of treasury shares (790) - - - (790) - (790)
Sale and vesting of treasury shares 802 - - - 802 - 802
Redemptions - - - - - - -
Other changes - - (68) 110 42 4 46
As at 30 June 2015 27,619 939 2,345 21,528 52,431 562 52,993
Net profit after income tax - - - 9,227 9,227 20 9,247
Net other comprehensive income - - 278 9 287 - 287
Total comprehensive income for the
financial year - - 278 9,236 9,514 20 9,534
Transactions with Equity holders in
their capacity as Equity holders:
Dividends paid on ordinary shares - - - (6,994) (6,994) - (6,994)
Dividends paid on other equity
instruments - - - (50) (50) - (50)
Dividend reinvestment plan (net of
issue costs) 1,209 - - - 1,209 - 1,209
Issue of shares (net of issue costs) 5,022 - - - 5,022 - 5,022
Share-based payments - - 10 - 10 - 10
Purchase of treasury shares (108) - - - (108) - (108)
Sale and vesting of treasury shares 103 - - - 103 - 103
Redemptions - (939) - - (939) - (939)
Other changes - - 101 (93) 8 (32) (24)
As at 30 June 2016 33,845 - 2,734 23,627 60,206 550 60,756
The above Statements of Changes in Equity should be read in conjunction with the accompanying notes.
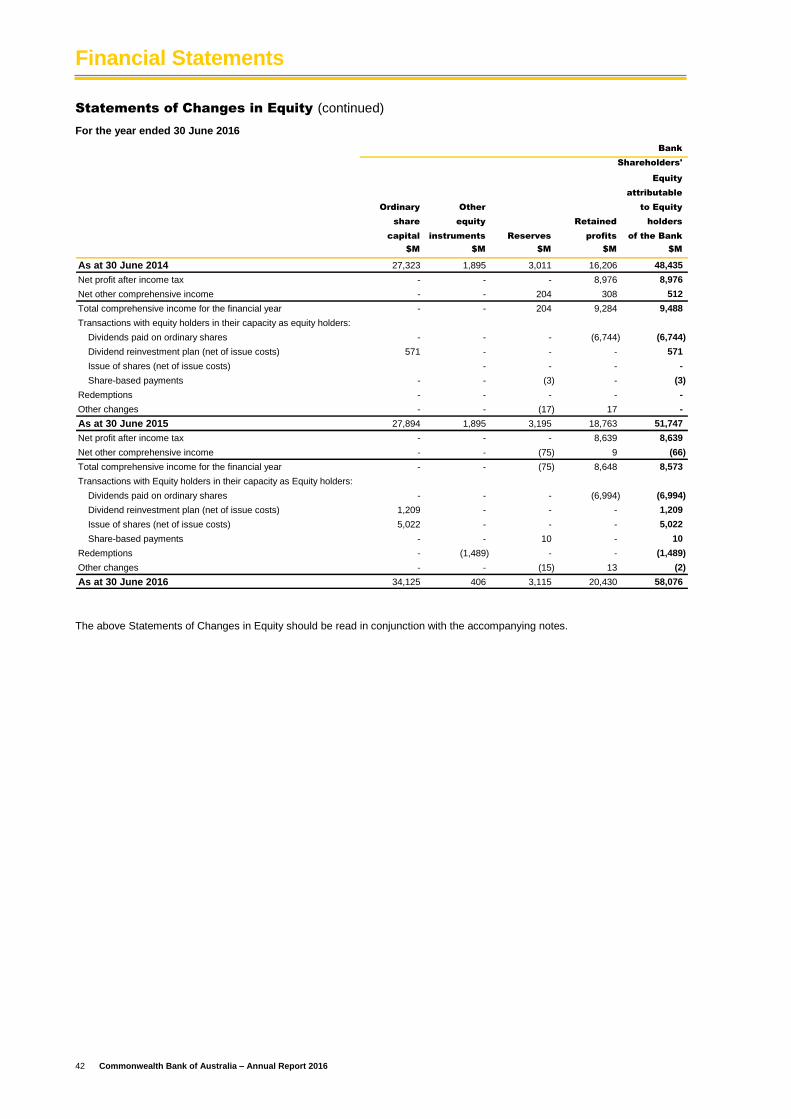
Financial Statements
42 Commonwealth Bank of Australia – Annual Report 2016
Statements of Changes in Equity (continued)
For the year ended 30 June 2016
Bank
Shareholders'
Equity
attributable
Ordinary Other to Equity
share equity Retained holders
capital instruments Reserves profits of the Bank
$M $M $M $M $M
As at 30 June 2014 27,323 1,895 3,011 16,206 48,435
Net profit after income tax - - - 8,976 8,976
Net other comprehensive income - - 204 308 512
Total comprehensive income for the financial year - - 204 9,284 9,488
Transactions with equity holders in their capacity as equity holders:
Dividends paid on ordinary shares - - - (6,744) (6,744)
Dividend reinvestment plan (net of issue costs) 571 - - - 571
Issue of shares (net of issue costs) - - - -
Share-based payments - - (3) - (3)
Redemptions - - - - -
Other changes - - (17) 17 -
As at 30 June 2015 27,894 1,895 3,195 18,763 51,747
Net profit after income tax - - - 8,639 8,639
Net other comprehensive income - - (75) 9 (66)
Total comprehensive income for the financial year - - (75) 8,648 8,573
Transactions with Equity holders in their capacity as Equity holders:
Dividends paid on ordinary shares - - - (6,994) (6,994)
Dividend reinvestment plan (net of issue costs) 1,209 - - - 1,209
Issue of shares (net of issue costs) 5,022 - - - 5,022
Share-based payments - - 10 - 10
Redemptions - (1,489) - - (1,489)
Other changes - - (15) 13 (2)
As at 30 June 2016 34,125 406 3,115 20,430 58,076
The above Statements of Changes in Equity should be read in conjunction with the accompanying notes.

Financial Statements
Commonwealth Bank of Australia – Annual Report 2016 43
Statements of Cash Flows (1)
For the year ended 30 June 2016
Group Bank
2016 2015 2014 2016 2015
Note $M $M $M $M $M
Cash flows from operating activities
Interest received (2) 34,047 34,112 33,669 34,908 34,706
Interest paid (2) (16,285) (17,442) (18,166) (18,935) (20,197)
Other operating income received (2) 5,688 5,439 5,098 3,674 3,659
Expenses paid (9,981) (8,740) (8,377) (7,961) (7,368)
Income taxes paid (3,071) (3,444) (3,763) (2,661) (3,093)
Net (outflows)/inflows from assets at fair value through
Income Statement (excluding life insurance) (2,642) 1,457 5,188 (3,367) 4,494
Net inflows/(outflows) from liabilities at fair value through
Income Statement:
Insurance:
Investment income (362) 118 394 - -
Premiums received (3) 3,114 2,910 2,899 - -
Policy payments and commission expense (3) (3,301) (3,307) (3,080) - -
Other liabilities at fair value through Income Statement 1,872 738 (1,619) 246 1,969
Cash flows from operating activities before
changes in operating assets and liabilities 9,079 11,841 12,243 5,904 14,170
Changes in operating assets and liabilities
arising from cash flow movements
Movement in available-for-sale investments:
Purchases (50,233) (60,967) (49,468) (48,759) (67,619)
Proceeds 46,150 53,569 44,130 46,541 53,052
Net increase in loans, bills discounted and other receivables (52,825) (41,768) (36,795) (45,917) (35,870)
Net decrease/(increase) in receivables due from other
financial institutions and regulatory authorities (2) 803 (3,799) (207) 238 (2,684)
Net decrease/(increase) in securities purchased under
agreements to resell 4,574 (6,174) 1,119 4,467 (6,483)
Insurance business:
Purchase of insurance assets at fair value through
Income Statement (2,020) (2,741) (3,156) - -
Proceeds from sale/maturity of insurance assets at fair
value through Income Statement 4,276 4,789 3,804 - -
Net (increase)/decrease in other assets (2) (108) 39 260 (157) 35
Net increase in deposits and other public borrowings 37,783 41,229 29,419 35,054 34,258
Net (decrease)/increase in payables due to other financial
institutions (6,323) 8,598 (1,812) (5,511) 8,147
Net increase in securities sold under
agreements to repurchase 4,148 3,015 4,389 4,257 3,090
Net increase/(decrease) in other liabilities 135 (448) 37 (1,580) 3,108
Changes in operating assets and liabilities
arising from cash flow movements (13,640) (4,658) (8,280) (11,367) (10,966)
Net cash (used in)/provided by operating activities 39 (a) (4,561) 7,183 3,963 (5,463) 3,204
Cash flows from investing activities
Net proceeds from disposal of controlled entities 39 (d) - - 531 - -
Payments for acquisition of controlled entities 39 (e) (857) (29) - - (29)
Net proceeds from disposal of entities and businesses
(net of cash disposals) 110 72 481 110 -
Dividends received 78 71 70 1,462 1,972
Net amounts received from controlled entities (4) - - - 1,307 2,564
Proceeds from sale of property, plant and equipment 405 69 68 122 67
Purchases of property, plant and equipment (1,259) (578) (513) (426) (380)
Payments for acquisitions of investments in
associates/joint ventures - (270) (36) - (220)
Net purchase of intangible assets (509) (550) (400) (450) (494)
Net cash (used in)/provided by investing activities (2,032) (1,215) 201 2,125 3,480
(1) It should be noted that the Group does not use these accounting Statements of Cash Flows in the internal management of its liquidity positions.
(2) Comparative information has been reclassified to conform to presentation in the current year.
(3) Represents gross premiums and policy payments before splitting between policyholders and shareholders.
(4) Amounts received from and paid to controlled entities are presented in line with how they are managed and settled.

Financial Statements
44 Commonwealth Bank of Australia – Annual Report 2016
Statements of Cash Flows (1)
(continued)
For the year ended 30 June 2016
Group Bank
2016 2015 2014 2016 2015
Note $M $M $M $M $M
Cash flows from financing activities
Dividends paid (excluding Dividend Reinvestment Plan) (5,827) (6,200) (5,491) (5,777) (6,164)
Redemption of other equity instruments (net of costs) (939) - - (1,483) -
Proceeds from issuance of debt securities 98,958 68,655 87,554 88,920 61,142
Redemption of issued debt securities (97,740) (73,377) (79,776) (90,149) (66,424)
Purchase of treasury shares (108) (790) (813) - -
Sale of treasury shares 50 744 760 - -
Issue of loan capital 3,949 6,184 358 3,943 6,164
Redemption of loan capital (1,678) (2,971) (500) (2,645) (2,899)
Proceeds from issuance of shares (net of issue costs) 5,022 - - 5,022 -
Other (67) (120) (157) 179 176
Net cash provided by/(used in) financing activities 1,620 (7,875) 1,935 (1,990) (8,005)
Net (decrease)/increase in cash and cash equivalents (4,973) (1,907) 6,099 (5,328) (1,321)
Effect of foreign exchange rates on cash and cash equivalents 150 2,049 411 72 2,008
Cash and cash equivalents at beginning of year 19,270 19,128 12,618 18,165 17,478
Cash and cash equivalents at end of year 39 (b) 14,447 19,270 19,128 12,909 18,165
(1) It should be noted that the Group does not use these accounting Statements of Cash Flows in the internal management of its liquidity positions.
The above Statements of Cash Flows should be read in conjunction with the accompanying notes.

Financial Statements
Commonwealth Bank of Australia – Annual Report 2016 45
Note 1 Accounting Policies
The Financial Statements of the Commonwealth Bank of
Australia (the Bank) and the Bank and its subsidiaries (the
Group) for the year ended 30 June 2016, were approved and
authorised for issue by the Board of Directors on
9 August 2016. The Directors have the power to amend and
reissue the Financial Statements.
The Bank is a for-profit entity incorporated and domiciled in
Australia. It is a company limited by shares that are publicly
traded on the Australian Securities Exchange. The registered
office is Ground Floor, Tower 1, 201 Sussex Street, Sydney,
NSW 2000, Australia.
The principal accounting policies adopted in the preparation
of this financial report are set out below. These policies have
been consistently applied to all the periods presented, unless
otherwise stated. The financial report is presented in
Australian dollars. The assets and liabilities are presented in
order of liquidity on the Balance Sheet.
Basis of Preparation
(a) Basis of Accounting
This General Purpose Financial Report has been prepared in
accordance with Australian Accounting Standards (the
standards), Australian Interpretations, and the Corporations
Act 2001.
The Financial Statements comply with International Financial
Reporting Standards (IFRS) and Interpretations as issued by
the International Accounting Standards Board (IASB) and
IFRS Interpretations Committee (IFRIC) respectively.
(b) Historical Cost Convention
This financial report has been prepared under the historical
cost convention, except for certain assets and liabilities
(including derivative instruments) measured at fair value.
(c) Rounding of Amounts
The amounts in this financial report have been rounded in
accordance with ASIC Corporations Instrument 2016/191 to
the nearest million dollars, unless otherwise indicated.
(d) Segment Reporting
Operating segments are reported based on the Group’s
organisational and management structures. Senior
management review the Group’s internal reporting based
around these segments, in order to assess performance and
allocate resources.
All transactions between segments are conducted on an
arm’s length basis, with inter-segment revenue and costs
being eliminated in “Other”.
(e) Changes in Accounting Policies
The accounting policies adopted are consistent with those of
the previous financial year.
Comparatives
Where necessary, comparative information has been restated
to conform to changes in presentation in the current year. All
comparative changes made have been footnoted throughout
the financial statements. Other than changes to the
presentation of segment information, as disclosed in Note 26,
the restatements are not considered to have a material impact
on the financial statements.
(f) Principles of Consolidation
Subsidiaries
The consolidated financial report comprises the financial
report of the Bank and its subsidiaries. Subsidiaries are
entities (including structured entities) over which the Bank has
control. The Bank controls another entity when it has:
power over the relevant activities of the entity, for
example through voting or other rights;
exposure to, or rights to, variable returns from the Bank’s
involvement with the entity; and
the ability to use its power over the entity to affect the
Bank’s returns from the entity.
Transactions between subsidiaries in the Group are
eliminated. Non-controlling interests in the results and equity
of subsidiaries are shown separately in the consolidated
Income Statement, Statement of Comprehensive Income,
Statement of Changes in Equity, and Balance Sheet.
Subsidiaries are consolidated from the date on which control
is transferred to the Group and de-consolidated when control
ceases.
Subsidiaries are accounted for at cost less accumulated
impairments at the Bank level.
Business Combinations
Business combinations are accounted for using the
acquisition method. Cost is measured as the aggregate of the
fair values of assets given, equity instruments issued, or
liabilities incurred or assumed at the date of exchange.
Identifiable assets acquired and liabilities and contingent
liabilities assumed in a business combination are measured at
fair value on the acquisition date. Goodwill is recorded as the
excess of the total consideration transferred, the carrying
amount of any non-controlling interest in the acquiree and the
acquisition date fair value of any previous equity interest in
the acquiree over the net identifiable assets acquired. If there
is a deficit instead, this discount on acquisition is recognised
directly in the consolidated Income Statement, but only after a
reassessment of the identification and measurement of the
net assets acquired.
Investment in Associates and Joint Ventures
Associates and joint ventures are entities over which the
Group has significant influence or joint control, but not control.
In the consolidated financial report, they are equity
accounted. They are initially recorded at cost and adjusted for
the Group’s share of the associates’ and joint ventures’ post-
acquisition profits or losses and other comprehensive income
(OCI), less any dividends received. At the Bank level, they are
accounted for at cost less accumulated impairments.
The Group assesses, at each Balance Sheet date, whether
there is any objective evidence of impairment. The main
indicators of impairment are as for equity securities classified
as available-for-sale (Note 1(t)). If there is an indication that
an investment may be impaired, then the entire carrying
amount of the investment in associate or joint venture is
tested for impairment by comparing the recoverable amount
(higher of value in use and fair value less disposal costs) with
its carrying amount. Impairment losses recognised in the
Income Statement are subsequently reversed through the
Income Statement if there has been a change in the
estimates used to determine recoverable amount since the
impairment loss was recognised.

Notes to the Financial Statements
46 Commonwealth Bank of Australia – Annual Report 2016
Note 1 Accounting Policies (continued)
(g) Foreign Currency Translation
Functional and Presentation Currency
The consolidated financial statements are presented in
Australian dollars, which is the Bank’s functional and
presentation currency. The functional currency of the Group’s
foreign operations (including subsidiaries, branches,
associates, and joint ventures) will vary based on the
currency of the main economy to which it is exposed.
Foreign Currency Transactions
Foreign currency transactions are translated into the
functional currency, using the exchange rates prevailing at the
date of each transaction.
Monetary assets and liabilities resulting from foreign currency
transactions are subsequently translated at the spot rate at
reporting date. Exchange differences arising upon settling or
translating monetary items at different rates to those at which
they were initially recognised or previously reported, are
recognised in the Income Statement.
Foreign Operations
Where the Group’s foreign operations do not have an
Australian dollar functional currency:
assets and liabilities are translated at the prevailing
exchange rate at Balance Sheet date;
revenue and expenses are translated at the average
exchange rate for the period (or the prevailing rate at the
transaction date where the average is not a reasonable
approximation); and
all resulting exchange differences are recognised in the
foreign currency translation reserve.
When a foreign operation is disposed of, exchange
differences are recognised in the Income Statement as part of
the gain or loss on disposal. No Group entities have a
functional currency of a hyperinflationary economy.
(h) Offsetting
Income and expenses are only offset in the Income Statement
if permitted under the relevant accounting standard.
Examples of offsetting include gains and losses from foreign
exchange exposures and trading operations.
Financial assets and liabilities are offset and the net amount
is presented in the Balance Sheet if, and only if, there is a
currently enforceable legal right to offset the recognised
amounts, and there is an intention to settle on a net basis, or
to realise the asset and settle the liability simultaneously.
(i) Fair Value Measurement
Fair value is the amount that would be received to sell an
asset or paid to transfer a liability in an orderly transaction
between market participants at the measurement date.
Financial assets and liabilities at fair value through Income
Statement, available-for-sale investments and all derivative
instruments are initially recognised and subsequently
measured at fair value.
The fair value for financial instruments traded in active
markets at the reporting date is based on their quoted market
price or dealer price quotations, without any deduction for
transaction costs. Assets and long positions are measured at
a quoted bid price; liabilities and short positions are measured
at a quoted asking price. Where the Group has positions with
offsetting market risks, mid-market prices are used to
measure the offsetting risk positions and a quoted bid or
asking price adjustment is applied only to the net open
position as appropriate.
Non-market quoted financial instruments are mostly valued
using valuation techniques based on observable inputs,
except for a limited number of instances where observable
market data is unavailable. In this instance, the financial
instrument is initially recognised at the transaction price,
which is generally the best indicator of fair value. This may
differ from the value obtained from the valuation model. The
timing of the recognition in the Income Statement of this initial
difference in fair value depends on the individual facts and
circumstances of each transaction, but is never later than
when the market data becomes observable. The difference
may be either amortised over the life of the transaction,
recognised when the inputs become observable or on
derecognition of the instrument, as appropriate.
Income Statement
(j) Interest Income
Interest income is brought to account using the effective
interest method. The effective interest method calculates the
amortised cost of a financial instrument and allocates the
interest income or interest expense over the relevant period.
The effective interest rate is the rate that discounts estimated
future cash payments or receipts through the expected life of
the financial instrument or, when appropriate, a shorter
period, to the net carrying amount of the financial asset or
liability. Fees and transaction costs associated with loans are
capitalised and included in the effective interest rate and
recognised in the Income Statement, over the expected life of
the instrument. Interest income on finance leases is brought
to account progressively over the life of the lease, consistent
with the outstanding investment and unearned income
balance.
(k) Fee and Commission Income
Fees and commissions that relate to the execution of a
significant act (for example, advisory or arrangement
services, placement fees and underwriting fees) are
recognised when the significant act has been completed.
Fees charged for providing ongoing services (for example,
managing and administering existing facilities and funds) are
recognised as income over the service period.
Fees and commissions, which include commitment fees to
originate a loan that is unlikely to be drawn down, are
recognised as fee income as the facility is provided.
(l) Other Income
Trading income represents both realised and unrealised gains
and losses from changes in the fair value of trading assets,
liabilities and derivatives.
Translation differences on non-monetary items, such as
derivatives measured at fair value through the Income
Statement, are reported as part of the fair value gain or loss
on these items. Translation differences on non-monetary
items measured at fair value through equity, such as equities
classified as available-for-sale financial assets, are
recognised in equity through OCI.
Insurance income recognition is outlined in Note 1(dd).

Notes to the Financial Statements
Commonwealth Bank of Australia – Annual Report 2016 47
Note 1 Accounting Policies (continued)
(m) Interest Expense
Interest expense on financial liabilities measured at amortised
cost is recognised in the Income Statement using the effective
interest method.
Interest expense includes issue costs that are initially
recognised as part of the carrying value of the liability and
amortised over the expected life using the effective interest
method. These include fees and commissions payable to
advisers and other expenses such as external legal costs,
provided these are incremental costs that are directly related
to the issue of a financial liability. It also includes payments
made under a liquidity facility arrangement with the Reserve
Bank of Australia and other financing charges.
(n) Operating Expenses
Operating expenses are recognised as the relevant service is
rendered or once a liability is incurred.
Staff expenses are recognised over the period the employee
renders the service to receive the benefit.
Staff expenses include share based payments which may be
cash or equity settled. The fair value of equity settled
remuneration is calculated at grant date and amortised to the
Income Statement over the vesting period, with a
corresponding increase in the employee compensation
reserve. Market vesting conditions, such as share price
performance conditions, are taken into account when
estimating the fair value. Non–market vesting conditions, such
as service conditions, are taken into account by adjusting the
number of the equity instruments included in the
measurement of the expense.
Cash settled share-based remuneration is recognised as a
liability and remeasured to fair value until settled, with
changes in the fair value recognised as an expense.
Occupancy and equipment expenses include the depreciation
and lease rentals that are outlined in Note 1(w) and Note 1(u)
respectively.
IT expenses are recognised as incurred unless they qualify
for capitalisation as an asset due to the related service
generating probable future economic benefits. If capitalised
the asset is subsequently amortised per Note 1(x).
Taxation
(o) Income Tax Expense
Income tax is recognised in the Income Statement, except to
the extent that it relates to items recognised directly in OCI, in
which case it is recognised in the Statement of
Comprehensive Income. Income tax on the profit or loss for
the period comprises current and deferred tax.
(p) Current Tax
Current tax is the expected tax payable on the taxable income
for the year, using tax rates enacted at the Balance Sheet
date, and any adjustment to tax payable in respect of
previous years.
(q) Deferred Tax
Deferred tax is calculated using the Balance Sheet method
where temporary differences between the carrying amounts of
assets and liabilities for financial reporting purposes and their
tax base are recognised.
The amount of deferred tax provided is based on the
expected manner of realisation or settlement of the carrying
amount of assets and liabilities (i.e. through use or through
sale), using tax rates which are expected to apply when the
deferred tax asset is realised or the deferred tax liability is
settled.
A deferred tax asset is only recognised to the extent that it is
probable that future taxable profits will be available for it to be
used against. Deferred tax assets and liabilities are set off
where they relate to income tax levied by the same taxation
authority on either the same taxable entity or different taxable
entities within the same taxable group.
(r) The Tax Consolidated Group
Tax consolidation legislation allows Australian resident
entities to elect to consolidate and be treated as a single
entity for Australian tax purposes. The Bank, as the head of
the tax consolidated group, and its wholly-owned Australian
subsidiaries, elected to be taxed as a single entity under this
regime with effect from 1 July 2002.
The members of the tax consolidated group have entered into
tax funding and tax sharing agreements, which set out the
funding obligations of members of the tax consolidated group
in respect of tax amounts.
Any current tax liabilities/assets and deferred tax assets
arising from unused tax losses from subsidiaries are
recognised in conjunction with any tax funding arrangement
amounts by the Bank legal entity (as the head of the tax
consolidated group).
The measurement and disclosure of deferred tax assets and
liabilities have been performed in accordance with the
principles in AASB 112 ‘Income Taxes’, and on a modified
standalone basis under UIG 1052 ‘Tax Consolidation
Accounting’.
Assets
(s) Cash and Liquid Assets
Cash and liquid assets include cash at branches, cash at
banks, nostro balances, money at short call with an original
maturity of three months or less and securities held under
reverse repurchase agreements. They are measured at face
value, or the gross value of the outstanding balance. Interest
is recognised in the Income Statement using the effective
interest method.
For the purposes of the Statements of Cash Flows, cash and
cash equivalents include cash and money at short call.
(t) Financial Assets
The Group classifies its financial assets in the following
categories:
financial assets at fair value through the Income
Statement;
derivative assets;
loans and receivables; and
available-for-sale investments.
The classification of financial instruments at initial recognition
depends on their purpose, characteristics and management’s
intention when acquiring them.
Financial instruments, except for loans and receivables, are
initially recognised by the Group on the trade date, i.e. the
date that the Group becomes a party to the contractual
provisions of the instruments.

Notes to the Financial Statements
48 Commonwealth Bank of Australia – Annual Report 2016
Note 1 Accounting Policies (continued)
This applies to trades transacted in a regular way, i.e.
purchases or sales of financial assets that require delivery of
assets within the time frame generally established by
regulation or convention in the market place. Loans and
receivables are recognised on settlement date, when funding
is advanced to the borrowers.
Financial assets are initially recognised at their fair value plus
directly attributable transaction costs, except in the case of
financial assets recorded at fair value through Income
Statement. Directly attributable transaction costs on these
assets are expensed on subsequent fair value measurement.
The Group has not classified any of its financial assets as
held to maturity investments.
Financial Assets at Fair Value through the Income Statement
Assets classified at fair value through the Income Statement
are further classified into three sub-categories: trading,
insurance and other.
Trading assets are those acquired or incurred principally for
the purpose of selling or repurchasing in the near term, or if
they are a part of a portfolio of identified financial instruments
that are managed together and for which there is evidence of
a recent actual pattern of short-term profit-taking. Discounted
bills that the Group intends to sell into the market immediately
or in the near term also meet the definition of assets held for
trading. Due to their nature, such assets are included in loans,
bills discounted and other receivables in the Balance Sheet,
while being measured at fair value.
Insurance assets are investments that back life insurance
contracts and life investment contracts. Refer to Note 1(ff).
Other investments include financial assets, which the Group
has designated at fair value through Income Statement at
inception to: eliminate an accounting mismatch; reflect they
are managed on a fair value basis; or where the asset is a
contract which contains an embedded derivative.
Subsequent to initial recognition, financial assets are
measured at fair value with changes in fair value recognised
in other operating income. Dividends earned are recorded in
other operating income. Interest earned is recorded within net
interest income using the effective interest method.
Derivative Financial Instruments
Derivative financial instruments are contracts whose value is
derived from one or more underlying price, index or other
variable. They include forward rate agreements, futures,
options and interest rate, currency, equity and credit swaps.
Derivatives are entered into for trading or hedging purposes.
Subsequent to initial recognition, gains or losses on
derivatives are recognised in the Income Statement, unless
they are entered into for hedging purposes and designated
into a cash flow hedge.
The Group uses derivatives to manage exposures to interest
rate, foreign currency and credit risks, including exposures
arising from forecast transactions.
Where derivatives are held for risk management purposes
and when transactions meet the required criteria, the Group
applies one of three hedge accounting models; fair value
hedge accounting, cash flow hedge accounting, or hedging of
a net investment in a foreign operation as appropriate to the
risks being hedged.
(i) Fair Value Hedges
Changes in fair value of derivatives that qualify and are
designated as fair value hedges are recorded in the Income
Statement, together with changes in the fair value of the
hedged asset or liability that are attributable to the hedged
risk. The changes in the fair value of the hedged asset or
liability shall be adjusted against their carrying value.
If the hedge relationship no longer meets the criteria for
hedge accounting, it is discontinued. For fair value hedges of
interest rate risk, the fair value adjustment to the hedged item
is amortised to the Income Statement over the period to
maturity of the previously designated hedge relationship using
the effective interest method. If the hedged item is sold or
repaid, the unamortised fair value adjustment is recognised
immediately in the Income Statement.
(ii) Cash Flow Hedges
Changes in fair value associated with the effective portion of a
derivative designated as a cash flow hedge are recognised
through OCI in the Cash Flow Hedge Reserve within equity.
Ineffective portions are recognised immediately in the Income
Statement. Amounts deferred in equity are transferred to the
Income Statement in the period in which the hedged forecast
transaction takes place.
When a hedging instrument expires or is sold, terminated or
exercised, or when the hedge no longer meets the criteria for
hedge accounting, any cumulative gain or loss existing in
equity at that time remains in equity and is reclassified to
profit or loss in the period in which the hedged item affects
profit or loss. When a forecast transaction is no longer
expected to occur, the cumulative gain or loss that was
reported in equity is recycled immediately to the Income
Statement.
(iii) Net Investment Hedges
Gains and losses on derivative contracts relating to the
effective portion of the net investment hedge are recognised
in the foreign currency translation reserve in equity.
Ineffective portions are recognised immediately in the Income
Statement. Gains and losses accumulated in equity are
included in the Income Statement when the foreign subsidiary
or branch is disposed of.
(iv) Embedded Derivatives
In certain instances, a derivative may be embedded within a
host contract. It is accounted for separately as a stand-alone
derivative at fair value, where:
the host contract is not carried at fair value through the
Income Statement; and
the economic characteristics and risks of the embedded
derivative are not closely related to the host contract.
Available-for-Sale Investments
Available-for-sale (AFS) investments are non-derivative
financial assets that are not classified at fair value through the
Income Statement or as loans and receivables. They primarily
include public debt securities held as part of the Group’s
liquidity holdings.
Subsequent to initial recognition, AFS investments are
measured at fair value with unrealised gains and losses
arising from changes in fair value recognised in the AFS
investment reserve within equity, net of applicable income
taxes until such investments are sold, collected, otherwise
disposed of, or become impaired.

Notes to the Financial Statements
Commonwealth Bank of Australia – Annual Report 2016 49
Note 1 Accounting Policies (continued)
Interest, premiums and dividends are recognised in the
Income Statement when earned. Foreign exchange gains and
losses on AFS equity instruments are recognised directly in
equity.
The Group assesses at each Balance Sheet date, whether
there is any objective evidence of impairment as a result of
one or more events which have an impact on the estimated
future cash flows of the AFS investments that can be reliably
estimated. For equity securities classified as an AFS
investment, the main indicators of impairment are significant
changes in the market, economic or legal environment and a
significant or prolonged decline in fair value below cost.
If any such evidence exists for AFS investments, cumulative
losses are removed from equity and recognised in the Income
Statement. If, in a subsequent period, the fair value of an AFS
debt security increases and the increase can be linked
objectively to an event occurring after the impairment event,
the impairment is reversed through the Income Statement.
Impairment losses on AFS equity securities are not reversed.
Upon disposal, the accumulated change in fair value within
the AFS investments reserve is transferred to the Income
Statement and reported within other operating income.
Financial assets initially designated as AFS investments, that
would have otherwise met the definition of loans and other
receivables, can be reclassified if the Group has the intention
and ability to hold these financial assets for the foreseeable
future or until maturity at the date of reclassification.
Reclassifications are made at fair value as at the date of
reclassification. Fair value becomes the new amortised cost
and no reversals of fair value gains or losses recorded before
reclassification date are subsequently made.
Loans, Bills Discounted and Other Receivables
Loans, bills discounted and other receivables are non-
derivative financial assets, with fixed and determinable
payments that are not quoted in an active market.
Loans, bills discounted and other receivables include
overdrafts, home loans, credit card and other personal
lending, term loans, bill financing, redeemable preference
shares, securities, finance leases, and receivables due from
other financial institutions (including loans, deposits with
regulatory authorities and settlement account balances due
from other banks). Subsequent to initial recognition, loans and
receivables are measured at amortised cost using the
effective interest method and are presented net of provisions
for impairment.
Discounted bills included in this category due to their nature
meet the definition of trading asset. They are measured at fair
value through Income Statement in line with the accounting
policy for assets held for trading.
The Group assesses at each Balance Sheet date whether
there is any objective evidence of impairment. If there is
objective evidence that an impairment loss on loans and other
receivables has been incurred, the amount of the loss is
measured as the difference between the asset's carrying
amount and the present value of the estimated future cash
flows (excluding future credit losses that have not been
incurred), discounted at the financial asset's original effective
interest rate. Short-term balances are not discounted.
Loans and other receivables are presented net of provisions
for loan impairment. The Group has individually and
collectively assessed provisions. Individually assessed
provisions are made against financial assets that are
individually significant, or which have been individually
assessed as impaired.
Individual provisions for impairment are recognised to reduce
the carrying amount of non-performing facilities to the present
value of their expected future cash flows. Individually
significant provisions are calculated based on discounted
cash flows.
The unwinding of the discount, from initial recognition of
impairment through to recovery of the written down amount, is
recognised as interest income.
In subsequent periods, interest in arrears/due on non-
performing facilities is recognised in the Income Statement
using the original effective interest rate.
All loans and other receivables that do not have an
individually assessed provision are assessed collectively for
impairment. Collective provisions are maintained to reduce
the carrying amount of portfolios of similar loans and
advances to the present value of their expected future cash
flows at the Balance Sheet date.
The expected future cash flows for portfolios of assets with
similar credit risk characteristics are estimated on the basis of
historical loss experience. Loss experience is adjusted on the
basis of current observable data to reflect the effects of
current conditions that did not affect the period on which the
loss experience is based and to remove the effects of
conditions in the period that do not currently exist. Increases
or decreases in the provision amount are recognised in the
Income Statement.
Derecognition of Financial Assets and Financial Liabilities
The Group derecognises financial assets when the rights to
receive cash flows from the asset have expired or when the
Group transfers its rights to receive cash flows from the asset
together with substantially all the risks and rewards of the
asset. The Group enters into certain transactions where it
transfers financial assets recognised on its Balance Sheet but
retains either all or a majority of the risks and rewards of the
transferred financial assets. If all or substantially all risks and
rewards are retained, the transferred financial assets are not
derecognised from the Balance Sheet. Transactions where
transfers of financial assets result in the Group retaining all or
substantially all risks and rewards include reverse repurchase
transactions, and some of the Group’s securitisation and
covered bonds programs.
A financial liability is derecognised when the obligation under
the liability is discharged, cancelled or expires. Where an
existing financial liability is replaced by another from the same
lender on substantially different terms, or the terms of an
existing liability are substantially modified, such an exchange
or modification is treated as a derecognition of the original
liability and the recognition of a new liability. The difference in
the respective carrying amounts is recognised in the Income
Statement.
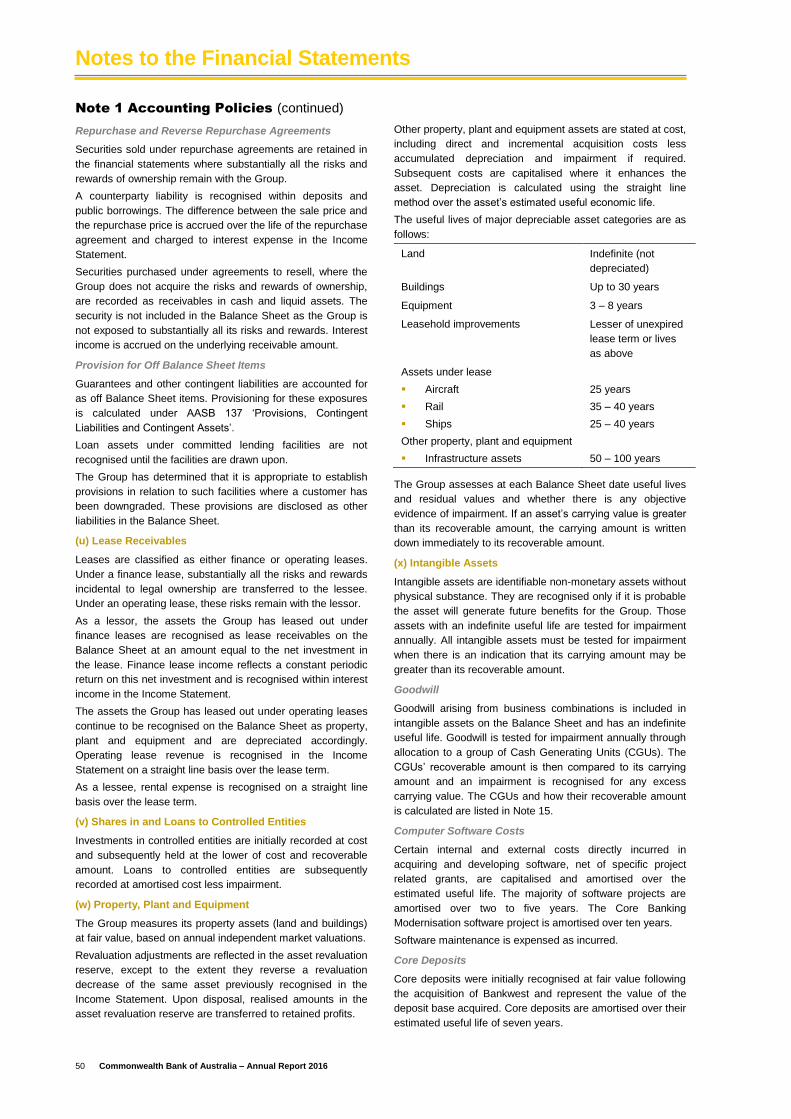
Notes to the Financial Statements
50 Commonwealth Bank of Australia – Annual Report 2016
Note 1 Accounting Policies (continued)
Repurchase and Reverse Repurchase Agreements
Securities sold under repurchase agreements are retained in
the financial statements where substantially all the risks and
rewards of ownership remain with the Group.
A counterparty liability is recognised within deposits and
public borrowings. The difference between the sale price and
the repurchase price is accrued over the life of the repurchase
agreement and charged to interest expense in the Income
Statement.
Securities purchased under agreements to resell, where the
Group does not acquire the risks and rewards of ownership,
are recorded as receivables in cash and liquid assets. The
security is not included in the Balance Sheet as the Group is
not exposed to substantially all its risks and rewards. Interest
income is accrued on the underlying receivable amount.
Provision for Off Balance Sheet Items
Guarantees and other contingent liabilities are accounted for
as off Balance Sheet items. Provisioning for these exposures
is calculated under AASB 137 ‘Provisions, Contingent
Liabilities and Contingent Assets’.
Loan assets under committed lending facilities are not
recognised until the facilities are drawn upon.
The Group has determined that it is appropriate to establish
provisions in relation to such facilities where a customer has
been downgraded. These provisions are disclosed as other
liabilities in the Balance Sheet.
(u) Lease Receivables
Leases are classified as either finance or operating leases.
Under a finance lease, substantially all the risks and rewards
incidental to legal ownership are transferred to the lessee.
Under an operating lease, these risks remain with the lessor.
As a lessor, the assets the Group has leased out under
finance leases are recognised as lease receivables on the
Balance Sheet at an amount equal to the net investment in
the lease. Finance lease income reflects a constant periodic
return on this net investment and is recognised within interest
income in the Income Statement.
The assets the Group has leased out under operating leases
continue to be recognised on the Balance Sheet as property,
plant and equipment and are depreciated accordingly.
Operating lease revenue is recognised in the Income
Statement on a straight line basis over the lease term.
As a lessee, rental expense is recognised on a straight line
basis over the lease term.
(v) Shares in and Loans to Controlled Entities
Investments in controlled entities are initially recorded at cost
and subsequently held at the lower of cost and recoverable
amount. Loans to controlled entities are subsequently
recorded at amortised cost less impairment.
(w) Property, Plant and Equipment
The Group measures its property assets (land and buildings)
at fair value, based on annual independent market valuations.
Revaluation adjustments are reflected in the asset revaluation
reserve, except to the extent they reverse a revaluation
decrease of the same asset previously recognised in the
Income Statement. Upon disposal, realised amounts in the
asset revaluation reserve are transferred to retained profits.
Other property, plant and equipment assets are stated at cost,
including direct and incremental acquisition costs less
accumulated depreciation and impairment if required.
Subsequent costs are capitalised where it enhances the
asset. Depreciation is calculated using the straight line
method over the asset’s estimated useful economic life.
The useful lives of major depreciable asset categories are as
follows:
Land Indefinite (not
depreciated)
Buildings Up to 30 years
Equipment 3 – 8 years
Leasehold improvements Lesser of unexpired
lease term or lives
as above
Assets under lease
Aircraft
Rail
Ships
Other property, plant and equipment
Infrastructure assets
25 years
35 – 40 years
25 – 40 years
50 – 100 years
The Group assesses at each Balance Sheet date useful lives
and residual values and whether there is any objective
evidence of impairment. If an asset’s carrying value is greater
than its recoverable amount, the carrying amount is written
down immediately to its recoverable amount.
(x) Intangible Assets
Intangible assets are identifiable non-monetary assets without
physical substance. They are recognised only if it is probable
the asset will generate future benefits for the Group. Those
assets with an indefinite useful life are tested for impairment
annually. All intangible assets must be tested for impairment
when there is an indication that its carrying amount may be
greater than its recoverable amount.
Goodwill
Goodwill arising from business combinations is included in
intangible assets on the Balance Sheet and has an indefinite
useful life. Goodwill is tested for impairment annually through
allocation to a group of Cash Generating Units (CGUs). The
CGUs’ recoverable amount is then compared to its carrying
amount and an impairment is recognised for any excess
carrying value. The CGUs and how their recoverable amount
is calculated are listed in Note 15.
Computer Software Costs
Certain internal and external costs directly incurred in
acquiring and developing software, net of specific project
related grants, are capitalised and amortised over the
estimated useful life. The majority of software projects are
amortised over two to five years. The Core Banking
Modernisation software project is amortised over ten years.
Software maintenance is expensed as incurred.
Core Deposits
Core deposits were initially recognised at fair value following
the acquisition of Bankwest and represent the value of the
deposit base acquired. Core deposits are amortised over their
estimated useful life of seven years.

Notes to the Financial Statements
Commonwealth Bank of Australia – Annual Report 2016 51
Note 1 Accounting Policies (continued)
Brand Names
Brand names are initially recognised at fair value when
acquired in a business combination. Brand names are
amortised over their useful life, which is considered to be
similar to the period of the brand name’s existence at the time
of purchase. Where the brand name is assessed to have an
indefinite useful life, it is carried at cost less accumulated
impairment. An indefinite useful life is considered appropriate
when there is no foreseeable limit to the period over which the
brand name is expected to generate cash flows.
Other Intangibles
Other intangibles predominantly comprise customer lists.
Customer relationships acquired as part of a business
combination are initially measured at fair value. They are
subsequently measured at cost less accumulated
amortisation and any impairment losses. Amortisation is
calculated based on the timing of projected cash flows of the
relationships over their estimated useful lives.
Liabilities
(y) Financial Liabilities
The Group classifies its financial liabilities in the following
categories:
liabilities at fair value through Income Statement;
liabilities at amortised cost; and
derivative liabilities (refer to Note 1(t)).
Financial liabilities are initially recognised at their fair value
less directly attributable transaction costs, except in the case
of financial liabilities recorded at fair value through Income
Statement. Directly attributable transaction costs on these
liabilities are expensed on subsequent fair value
measurement.
Liabilities at Fair Value through Income Statement
The Group designates certain liabilities at fair value through
Income Statement on origination where those liabilities are
managed on a fair value basis, where the liabilities eliminate
an accounting mismatch, or where they contain embedded
derivatives.
Subsequent to initial recognition, these liabilities are
measured at fair value. Changes in fair value relating to the
Group’s own credit risk are recognised in other
comprehensive income, with the remaining fair value
movement recognised in other operating income. Interest
incurred is recorded within net interest income using the
effective interest method.
Liabilities at Amortised Cost
(i) Deposits From Customers
Deposits from customers include certificates of deposit, term
deposits, savings deposits, other demand deposits and
debentures. Subsequent to initial recognition, they are
measured at amortised cost. Interest and yield related fees
are recognised on an effective interest basis.
(ii) Payables Due to Other Financial Institutions
Payables due to other financial institutions include deposits,
vostro balances and settlement account balances due to
other banks. Subsequent to initial recognition, they are
measured at amortised cost. Interest and yield related fees
are recognised using the effective interest method.
(iii) Debt Issues
Debt issues are short and long-term debt issues of the Group,
including commercial paper, notes, term loans and medium
term notes. Commercial paper, floating, fixed and structured
debt issues are recorded at amortised cost using the effective
interest method.
Premiums, discounts and associated issue expenses are
recognised in the Income Statement using the effective
interest method from the date of issue, to ensure that
securities attain their redemption values by maturity date.
Interest is recognised in the Income Statement using the
effective interest method. Any profits or losses arising from
redemption prior to maturity are taken to the Income
Statement in the period in which they are realised.
The Group hedges interest rate and foreign currency risk on
certain debt issues. When fair value hedge accounting is
applied to fixed rate debt issues, the carrying values are
adjusted for changes in fair value related to the hedged risks,
rather than carried at amortised cost.
(iv) Loan Capital
Loan capital is debt issued by the Group with terms and
conditions that qualify for inclusion as capital, under APRA
Prudential Standards. It is initially recorded at fair value, plus
directly attributable transaction costs and thereafter at
amortised cost using the effective interest method.
(v) Bank Acceptances of Customers - Liability
These are bills of exchange initially accepted and discounted
by the Group and subsequently sold into the market. They are
recognised at amortised cost. The market exposure is
recognised as a liability. An asset of equal value is recognised
to reflect the offsetting claim against the drawer of the bill.
Bank acceptances generate interest and fee income that is
recognised in the Income Statement when earned.
(vi) Financial Guarantees and Credit Commitments
In the ordinary course of business, the Group gives financial
guarantees consisting of letters of credit, guarantees and
acceptances. Financial guarantees are recognised within
other liabilities initially at fair value, being the premium
received. Subsequent to initial recognition, the Group’s
liability under each guarantee is measured at the higher of the
amount initially recognised less cumulative amortisation
recognised in the Income Statement, and the best estimate of
expenditure required to settle any financial obligation arising
as a result of the guarantee. Any increase in the liability
relating to financial guarantees is recorded in the Income
Statement. The premium received is recognised in the
Income Statement in other operating income on a straight line
basis over the life of the guarantee.
Loan commitments are defined amounts (unutilised credit
lines or undrawn portions of credit lines) against which clients
can borrow money under defined terms and conditions. Loan
commitments that are cancellable by the Group are not
recognised on the Balance Sheet. Upon a loan drawdown by
the counterparty, the amount of the loan is accounted for in
accordance with accounting policies for loans and
receivables. Irrevocable loan commitments are not recorded
in the Balance Sheet, but a provision is recognised if it is
probable that a loss has been incurred and a reliable estimate
of the amount can be made.

Notes to the Financial Statements
52 Commonwealth Bank of Australia – Annual Report 2016
Note 1 Accounting Policies (continued)
(z) Employee Benefits
Annual Leave
The provision for annual leave represents the current
outstanding liability to employees for annual leave
entitlements at Balance Sheet date.
Long Service Leave
The provision for long service leave is discounted to present
value and is set based on actuarial assumptions. The
assumptions and provision balance are subject to periodic
review.
Other Employee Benefits
Other employee entitlements comprises liabilities to a
registered health fund for subsidies with respect to retired and
current employees, and employee incentives under employee
share plans and bonus schemes.
Defined Benefit Superannuation Plans
The Group currently sponsors two defined benefit
superannuation plans for its employees.
The net defined benefit liability or asset recognised in the
Balance Sheet is the present value of the defined benefit
obligation as at the Balance Sheet date less the fair value of
plan assets. The defined benefit obligation is calculated by
independent fund actuaries.
In each reporting period, the movement in the net defined
benefit liability or asset is recognised as follows:
The net movement relating to the current period service
cost, net interest cost (income), past service and other
costs (such as the effects of any curtailments and
settlements) is recognised as an employee expense in
the Income Statement;
Remeasurements relating to actuarial gains and losses
and the difference between interest income and the
return on plan assets are recognised directly in retained
profits through OCI;
Contributions made by the Group are recognised directly
against the net defined benefit liability or asset; and
Net interest cost (income) is determined by multiplying
the rate of high quality corporate bonds by the net
defined benefit obligation (asset) at the beginning of the
reporting period and adjusted for changes in the net
defined benefit liability (asset) due to contributions and
benefit payments.
Defined Contribution Superannuation Plans
The Group sponsors a number of defined contribution
superannuation plans. The Group recognises contributions
due in respect of the accounting period in the Income
Statement. Any contributions unpaid at the Balance Sheet
date are included as a liability.
(aa) Provisions
Provisions are recognised when a probable obligation has
arisen as a result of a past event that can be reliably
measured. Note 19 Other Provisions contains a description of
provisions held.
Equity
(bb) Shareholders’ Equity
Ordinary shares are recognised at the amount paid up per
ordinary share, net of directly attributable issue costs.
Where the Bank or other members of the Group purchase
shares in the Bank, the consideration paid is deducted from
total Shareholders’ Equity and the shares are treated as
treasury shares until they are subsequently sold, reissued or
cancelled. Where such shares are sold or reissued, any
consideration received is included in Shareholders’ Equity.
(cc) Reserves
General Reserve
The general reserve is derived from revenue profits and is
available for dividend payments except for undistributable
profits in respect of the Group’s life insurance businesses.
Capital Reserve
The capital reserve held by the Bank relates to historic
internal Group restructuring performed at fair value. The
capital reserve is eliminated on consolidation.
Asset Revaluation Reserve
The asset revaluation reserve is used to record revaluation
adjustments on the Group’s property assets. Where an asset
is sold or disposed of, any balance in the reserve in relation to
the asset is transferred directly to retained profits.
Foreign Currency Translation Reserve
Exchange differences arising on translation of the Group’s
foreign operations are accumulated in the foreign currency
translation reserve. The cumulative amount is reclassified to
profit or loss when the foreign investment is disposed of or
wound up.
Cash Flow Hedge Reserve
The cash flow hedge reserve is used to record fair value
gains or losses associated with the effective portion of
designated cash flow hedging instruments. Amounts are
reclassified to profit or loss when the hedged transaction
impacts profit or loss.
Employee Compensation Reserve
The employee compensation reserve is used to recognise the
fair value of shares and other equity instruments issued to
employees under the employee share plans and bonus
schemes.
Available-for-Sale Investment Reserve
The available-for-sale investment reserve includes changes in
the fair value of available-for-sale financial assets. These
changes are transferred to profit or loss when the asset is
derecognised or impaired.
Life and General Insurance Business
The Group’s consolidated financial statements include the
assets, liabilities, income and expenses of the life and general
insurance businesses conducted by various subsidiaries of
the Bank.
Insurance contracts involve the acceptance of significant
insurance risk from another party (the policyholder) by
agreeing to compensate the policyholder if a specified
uncertain future event adversely affects the policyholder. The
insured benefit is either not linked or only partly linked to the
market value of the investments held, and the financial risks
are substantially borne by the insurer.
General insurance contracts are insurance contracts that are
not life insurance contracts.
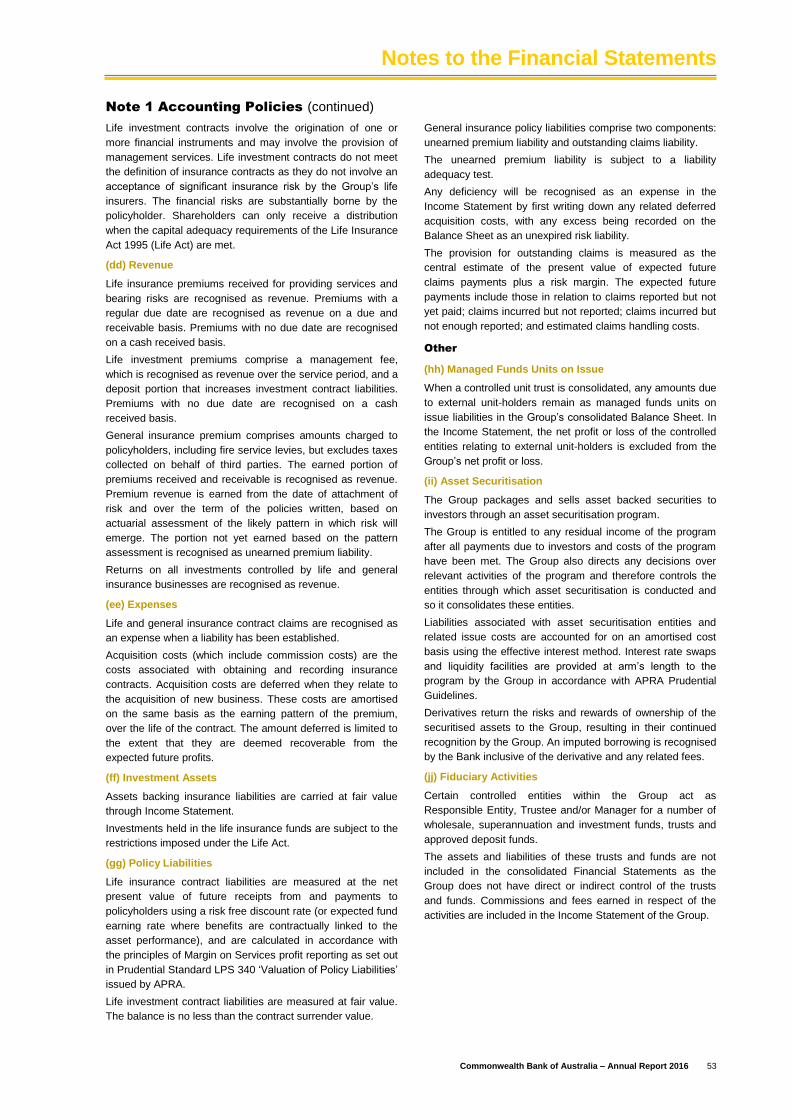
Notes to the Financial Statements
Commonwealth Bank of Australia – Annual Report 2016 53
Note 1 Accounting Policies (continued)
Life investment contracts involve the origination of one or
more financial instruments and may involve the provision of
management services. Life investment contracts do not meet
the definition of insurance contracts as they do not involve an
acceptance of significant insurance risk by the Group’s life
insurers. The financial risks are substantially borne by the
policyholder. Shareholders can only receive a distribution
when the capital adequacy requirements of the Life Insurance
Act 1995 (Life Act) are met.
(dd) Revenue
Life insurance premiums received for providing services and
bearing risks are recognised as revenue. Premiums with a
regular due date are recognised as revenue on a due and
receivable basis. Premiums with no due date are recognised
on a cash received basis.
Life investment premiums comprise a management fee,
which is recognised as revenue over the service period, and a
deposit portion that increases investment contract liabilities.
Premiums with no due date are recognised on a cash
received basis.
General insurance premium comprises amounts charged to
policyholders, including fire service levies, but excludes taxes
collected on behalf of third parties. The earned portion of
premiums received and receivable is recognised as revenue.
Premium revenue is earned from the date of attachment of
risk and over the term of the policies written, based on
actuarial assessment of the likely pattern in which risk will
emerge. The portion not yet earned based on the pattern
assessment is recognised as unearned premium liability.
Returns on all investments controlled by life and general
insurance businesses are recognised as revenue.
(ee) Expenses
Life and general insurance contract claims are recognised as
an expense when a liability has been established.
Acquisition costs (which include commission costs) are the
costs associated with obtaining and recording insurance
contracts. Acquisition costs are deferred when they relate to
the acquisition of new business. These costs are amortised
on the same basis as the earning pattern of the premium,
over the life of the contract. The amount deferred is limited to
the extent that they are deemed recoverable from the
expected future profits.
(ff) Investment Assets
Assets backing insurance liabilities are carried at fair value
through Income Statement.
Investments held in the life insurance funds are subject to the
restrictions imposed under the Life Act.
(gg) Policy Liabilities
Life insurance contract liabilities are measured at the net
present value of future receipts from and payments to
policyholders using a risk free discount rate (or expected fund
earning rate where benefits are contractually linked to the
asset performance), and are calculated in accordance with
the principles of Margin on Services profit reporting as set out
in Prudential Standard LPS 340 ‘Valuation of Policy Liabilities’
issued by APRA.
Life investment contract liabilities are measured at fair value.
The balance is no less than the contract surrender value.
General insurance policy liabilities comprise two components:
unearned premium liability and outstanding claims liability.
The unearned premium liability is subject to a liability
adequacy test.
Any deficiency will be recognised as an expense in the
Income Statement by first writing down any related deferred
acquisition costs, with any excess being recorded on the
Balance Sheet as an unexpired risk liability.
The provision for outstanding claims is measured as the
central estimate of the present value of expected future
claims payments plus a risk margin. The expected future
payments include those in relation to claims reported but not
yet paid; claims incurred but not reported; claims incurred but
not enough reported; and estimated claims handling costs.
Other
(hh) Managed Funds Units on Issue
When a controlled unit trust is consolidated, any amounts due
to external unit-holders remain as managed funds units on
issue liabilities in the Group’s consolidated Balance Sheet. In
the Income Statement, the net profit or loss of the controlled
entities relating to external unit-holders is excluded from the
Group’s net profit or loss.
(ii) Asset Securitisation
The Group packages and sells asset backed securities to
investors through an asset securitisation program.
The Group is entitled to any residual income of the program
after all payments due to investors and costs of the program
have been met. The Group also directs any decisions over
relevant activities of the program and therefore controls the
entities through which asset securitisation is conducted and
so it consolidates these entities.
Liabilities associated with asset securitisation entities and
related issue costs are accounted for on an amortised cost
basis using the effective interest method. Interest rate swaps
and liquidity facilities are provided at arm’s length to the
program by the Group in accordance with APRA Prudential
Guidelines.
Derivatives return the risks and rewards of ownership of the
securitised assets to the Group, resulting in their continued
recognition by the Group. An imputed borrowing is recognised
by the Bank inclusive of the derivative and any related fees.
(jj) Fiduciary Activities
Certain controlled entities within the Group act as
Responsible Entity, Trustee and/or Manager for a number of
wholesale, superannuation and investment funds, trusts and
approved deposit funds.
The assets and liabilities of these trusts and funds are not
included in the consolidated Financial Statements as the
Group does not have direct or indirect control of the trusts
and funds. Commissions and fees earned in respect of the
activities are included in the Income Statement of the Group.

Notes to the Financial Statements
54 Commonwealth Bank of Australia – Annual Report 2016
Note 1 Accounting Policies (continued)
Critical Judgements and Estimates
The application of the Group’s accounting policies requires
the use of judgement, estimates and assumptions. The
estimates and associated assumptions are based on
historical experience and other factors that are considered to
be relevant, and are reviewed on an ongoing basis. Actual
results may differ from these estimates, which could impact
the Group’s net assets and profit.
(kk) Provisions for Impairment of Financial Assets
Provisions for impairment of financial assets are raised where
there is objective evidence of impairment (where the Group
does not expect to receive all of the cashflows contractually
due) at an amount adequate to cover assessed credit related
losses. Financial assets are either individually or collectively
assessed.
Credit losses arise primarily from loans, but also from other
credit instruments such as bank acceptances, contingent
liabilities, guarantees and other financial instruments.
Individually Assessed Provisions
Individually assessed provisions are made against financial
assets that are individually significant, or which have been
individually assessed as impaired. The provisions are
established based primarily on estimates of the realisable
(fair) value of collateral taken and are measured as the
difference between a financial asset’s carrying amount and
the present value of the expected future cash flows (excluding
future credit losses that have not been incurred), discounted
at the financial asset’s original effective interest rate. Short-
term balances are not discounted.
Collective Provisions
Loans and receivables that do not have an individually
assessed provision are assessed collectively for impairment.
The collective provision is maintained to reduce the carrying
amount of portfolios of similar loans and receivables to their
estimated recoverable amounts at the Balance Sheet date.
The evaluation process is subject to a series of estimates and
judgements. In the risk rated segment, the risk rating system,
including the frequency of default and loss given default rates,
loss history, and the size, structure and diversity of individual
borrowers are considered. Current developments in portfolios
(industry, geographic and term) are reviewed.
In the statistically managed (retail) segment, the history of
defaults and losses, and the size, structure and diversity of
portfolios are considered.
Management also considers overall indicators of portfolio
performance, quality and economic conditions.
Changes in these estimates could have a direct impact on the
level of provision determined.
(ll) Provisions (Other than Loan Impairment)
Provisions are held in respect of a range of future obligations
as outlined in Note 19. Some of the provisions involve
significant judgement about the likely outcome of various
events and estimated future cash flows.
The measurement of these obligations involves the exercise
of management judgements about the ultimate outcomes of
the transactions. Payments which are expected to be incurred
later than one year are discounted at a rate which reflects
both current interest rates and the risks specific to that
provision.
(mm) Life Insurance Policyholder Liabilities
The determination of life insurance policyholder liabilities
involves the following key actuarial assumptions:
Business assumptions including amount, timing and
duration of claims/policy payments, policy lapse rates
and acquisition and maintenance expense levels;
Long-term economic assumptions for discount, interest,
inflation and market earnings rates; and
Determining whether the projection or accumulation
method is appropriate. The selection of the method is
generally governed by the product type.
The determination of assumptions relies on making
judgements on variances from long-term assumptions. Where
experience differs from long-term assumptions:
Recent results may be a statistical aberration; or
There may be a commencement of a new paradigm
requiring a change in long-term assumptions.
The Group’s actuaries arrive at conclusions regarding the
statistical analysis using their experience and judgement.
Further detail on the financial position on performance of the
Group’s Life Insurance operations is set out in Note 27.
(nn) Consolidation of Structured Entities
The Group exercises judgement at inception and periodically
thereafter, to assess whether that structured entity should be
consolidated based on the Bank’s power over the relevant
activities of the entity and the significance of its exposure to
variable returns of the structured entity. Such assessments
are predominantly required for the Group’s securitisation
program, structured transactions and involvement with
investment funds.
(oo) Financial Instruments at Fair Value
A significant portion of financial instruments are carried at fair
value on the Balance Sheet.
The best evidence of fair value is quoted prices in an active
market. If the market for a financial instrument is not active,
the Group establishes fair value by using a valuation
technique. The objective of using a valuation technique is to
establish what the transaction price would have been on the
measurement date in an arm’s length exchange motivated by
normal business considerations.
Valuation techniques include using recent arm’s length
market transactions between knowledgeable willing parties (if
available), reference to the current fair value of substantially
similar instruments’ discounted cash flow analysis and option
pricing models. If there is a valuation technique commonly
used by market participants to price the instrument and that
technique has been demonstrated to provide reliable
estimates of prices obtained in actual market transactions, the
Group uses that technique.
The chosen valuation technique makes maximum use of
market inputs and relies as little as possible on entity specific
inputs. It incorporates all factors that the Group believes
market participants would consider in setting a price and is
consistent with accepted economic methodologies for pricing
financial instruments. Data inputs that the Group relies upon

Notes to the Financial Statements
Commonwealth Bank of Australia – Annual Report 2016 55
Note 1 Accounting Policies (continued)
when valuing financial instruments relate to counterparty
credit risk, volatility, correlation and extrapolation.
Periodically, the Group calibrates its valuation techniques and
tests them for validity using prices from any observable
current market transactions in the same instrument (i.e.
without modification or repackaging) and any other available
observable market data. Note 40 includes details of non-
observable inputs used to fair value financial instruments.
(pp) Goodwill
Goodwill is allocated to CGUs whose recoverable amount is
calculated for the purpose of impairment testing. The
recoverable amount calculation relies primarily on publicly
available earnings multiples. Note 15 includes the details of
the inputs used in recoverable amount calculations.
(qq) Taxation
Provisions for taxation require significant judgement with
respect to outcomes that are uncertain. For such
uncertainties, the Group has estimated its tax provisions
based on its expected outcomes.
(rr) Superannuation Obligations
The Group’s defined benefit plans are described in Note 35.
Actuarial valuations of the plan’s obligations and fair value of
the plan’s assets are performed semi-annually.
The actuarial valuation of plan obligations is dependent upon
a series of assumptions, including price inflation, discount
rates, salary growth, mortality, morbidity and investment
returns assumptions. Different assumptions could significantly
alter the difference between plan assets and obligations, and
the superannuation cost charged.
Future Accounting Developments
AASB 9 ‘Financial Instruments’ introduces changes in three
areas:
Financial assets will be categorised according to a cash
flow and business model test. The outcome of these
tests will drive the measurement of financial assets at
either amortised cost, fair value through profit or loss or
fair value through other comprehensive income;
Impairment of financial assets will be based on an
expected loss rather than incurred loss model; and
Simplifications to hedge accounting.
AASB 9 is not mandatory until 1 July 2018 for the Group.
Other than the own credit requirements of the standard, which
were early adopted from 1 January 2014, the Group does not
intend to early adopt the standard. The Group has
commenced an implementation program.
AASB 15 ‘Revenue from Contracts with Customers’
introduces a single model for the recognition of revenue
based on when control of goods and services transfers to a
customer. It does not apply to financial instruments. AASB 15
is not mandatory until 1 July 2018 for the Group.
AASB 16 ‘Leases’ amends the accounting for leases.
Lessees will be required to bring all leases on Balance Sheet
as the distinction between operating and finance leases has
been eliminated. Lessor accounting remains largely
unchanged. AASB 16 is not mandatory until 1 July 2019 for
the Group.
The potential financial impacts of the above to the Group
have not yet been determined. The Group does not intend to
early adopt these standards.
Other amendments to existing standards that are not yet
effective are not expected to result in significant changes to
the Group’s accounting policies.

Notes to the Financial Statements
56 Commonwealth Bank of Australia – Annual Report 2016
Note 2 Profit
Profit before income tax has been determined as follows:
Group (1)
Bank (1)
2016 2015 2014 2016 2015
$M $M $M $M $M
Interest Income
Loans and bills discounted 30,966 31,476 31,200 27,576 27,705
Other financial institutions 137 73 69 122 60
Cash and liquid assets 291 268 251 246 206
Assets at fair value through Income Statement 576 518 447 553 468
Available-for-sale investments 1,847 1,810 1,724 1,740 1,694
Controlled entities - - - 4,423 4,842
Total interest income (2) 33,817 34,145 33,691 34,660 34,975
Interest Expense
Deposits 11,685 12,936 13,320 10,176 11,397
Other financial institutions 277 220 228 246 186
Liabilities at fair value through Income Statement 211 222 230 110 113
Debt issues 4,125 4,372 4,343 3,361 3,458
Loan capital 584 572 429 563 547
Controlled entities - - - 5,089 5,287
Total interest expense (3) 16,882 18,322 18,550 19,545 20,988
Net interest income 16,935 15,823 15,141 15,115 13,987
Other Operating Income
Lending fees 1,010 1,005 1,037 927 935
Commissions 2,215 2,209 2,112 1,838 1,842
Trading income 1,087 1,039 946 975 940
Net gain/(loss) on non-trading financial instruments (4) (27) 251 (49) (90) 254
Net gain/(loss) on sale of property, plant and equipment (21) (8) (12) (15) (4)
Net hedging ineffectiveness (72) (95) (21) (35) (67)
Dividends - Controlled entities - - - 1,407 1,919
Dividends - Other 12 16 12 55 53
Net funds management operating income 2,061 2,003 2,034 - -
Insurance contracts income 1,006 1,014 1,033 - -
Share of profit from associates and joint ventures net of impairment 289 285 150 21 -
Other (5) 83 126 105 952 919
Total other operating income 7,643 7,845 7,347 6,035 6,791
Total net operating income before impairment and
operating expenses 24,578 23,668 22,488 21,150 20,778
Impairment Expense
Loan impairment expense 1,256 988 918 1,153 837
Total impairment expense (Note 13) 1,256 988 918 1,153 837
(1) Comparative information has been restated to conform to presentation in the current year.
(2) Total interest income for financial assets that are not at fair value through profit or loss is $33,002 million (2015: $33,208 million, 2014: $33,127 million) for the Group and $33,868 million (2015: $34,088 million) for the Bank.
(3) Total interest expense for financial liabilities that are not at fair value through profit or loss is $16,713 million (2015: $18,100 million, 2014: $18,320 million) for the Group and $19,435 million (2015: $20,875 million) for the Bank.
(4) Inclusive of non-trading derivatives that are held for risk management purposes.
(5) Includes depreciation of $107 million (30 June 2015: $80 million, 30 June 2014 $77 million) and impairment of $69 million (30 June 2015; $nil, 30 June 2014: $nil) in relation to assets held for lease by the Group. Includes depreciation of $26 million (30 June 2015: $18 million) in relation to assets held for lease by the Bank.

Notes to the Financial Statements
Commonwealth Bank of Australia – Annual Report 2016 57
Note 2 Profit (continued)
Group Bank
2016 2015 2014 2016 2015
$M $M $M $M $M
Staff Expenses
Salaries and related on-costs 5,652 5,321 5,089 4,128 3,918
Share-based compensation 102 96 99 99 92
Superannuation 410 399 354 316 311
Total staff expenses 6,164 5,816 5,542 4,543 4,321
Occupancy and Equipment Expenses
Operating lease rentals 650 620 607 564 535
Depreciation of property, plant and equipment 266 253 244 221 208
Other occupancy expenses 218 213 202 171 172
Total occupancy and equipment expenses 1,134 1,086 1,053 956 915
Information Technology Services
Application maintenance and development 511 430 412 450 390
Data processing 197 183 175 197 182
Desktop 143 110 101 132 96
Communications 203 190 189 180 169
Amortisation of software assets 379 308 328 333 264
Software write-offs 1 11 70 - 10
IT equipment depreciation 51 60 62 47 56
Total information technology services 1,485 1,292 1,337 1,339 1,167
Other Expenses
Postage and stationery 192 195 188 171 170
Transaction processing and market data 179 153 156 129 116
Fees and commissions:
Professional fees 247 390 257 209 358
Other 93 97 99 353 360
Advertising, marketing and loyalty 491 522 477 392 407
Amortisation of intangible assets (excluding software and merger
related amortisation)14 16 19 - -
Non-lending losses 103 118 97 74 108
Other 327 308 274 333 274
Total other expenses 1,646 1,799 1,567 1,661 1,793
Total expenses 10,429 9,993 9,499 8,499 8,196
Investment and Restructuring
Merger related amortisation (1) 39 75 74 39 75
Total investment and restructuring 39 75 74 39 75
Total operating expenses 10,468 10,068 9,573 8,538 8,271
Profit before income tax 12,854 12,612 11,997 11,459 11,670
Net hedging ineffectiveness comprises:
Gain/(loss) on fair value hedges:
Hedging instruments (709) (568) 59 (1,409) (731)
Hedged items 642 493 (71) 1,369 660
Cash flow and net investment hedge ineffectiveness (5) (20) (9) 5 4
Net hedging ineffectiveness (72) (95) (21) (35) (67)
(1) Merger related amortisation relates to Bankwest core deposits and customer lists.

Notes to the Financial Statements
58 Commonwealth Bank of Australia – Annual Report 2016
Note 3 Average Balances and Related Interest
The following tables have been produced using statutory Balance Sheet and Income Statement categories. The tables list the
major categories of interest earning assets and interest bearing liabilities of the Group together with the respective interest earned
or paid and the average interest rate (predominantly daily averages). Interest is accounted for based on product yield.
Where assets or liabilities are hedged, the amounts are shown net of the hedge, however individual items not separately hedged
may be affected by movements in exchange rates. The overseas component comprises overseas branches of the Bank and
overseas domiciled controlled entities. Non-accrual loans are included in interest earning assets under Loans, bills discounted
and other receivables. The official cash rate in Australia decreased by 25 basis points, while rates in New Zealand decreased 100
basis points during the year which is reflected in Overseas.
Group
2016 2015 2014
Average Average Average Average Average Average
Interest earning Balance Interest Rate Balance Interest Rate Balance Interest Rate
assets (1)$M $M % $M $M % $M $M %
Cash and liquid assets
Australia 11,536 186 1. 6 8,951 174 1. 9 8,179 169 2. 1
Overseas 20,183 105 0. 5 21,500 94 0. 4 17,840 82 0. 5
Receivables due from other
financial institutions
Australia 3,387 26 0. 8 3,418 20 0. 6 5,070 29 0. 6
Overseas (1) 8,986 111 1. 2 7,262 53 0. 7 4,825 40 0. 8
Assets at fair value through
Income Statement - Trading and
Other
Australia 19,354 500 2. 6 17,367 396 2. 3 16,259 352 2. 2
Overseas 3,090 76 2. 5 4,618 122 2. 6 6,053 95 1. 6
Available-for-sale investments
Australia 66,543 1,662 2. 5 58,338 1,656 2. 8 54,026 1,635 3. 0
Overseas 12,770 185 1. 4 10,094 154 1. 5 7,702 89 1. 2
Loans, bills discounted and other
receivables (2)
Australia 581,067 26,620 4. 6 542,138 27,117 5. 0 512,894 27,417 5. 3
Overseas 90,541 4,346 4. 8 82,186 4,359 5. 3 73,014 3,783 5. 2
Total interest earning assets
and interest income817,457 33,817 4. 1 755,872 34,145 4. 5 705,862 33,691 4. 8
(1) Comparative information has been restated to conform to presentation in the current year.
(2) Loans, bills discounted and other receivables includes bank acceptances.
Group
2016 2015 2014
Average Average Average
Balance Balance Balance
Non-interest earning assets $M $M $M
Assets at fair value through Income Statement - Insurance
Australia 11,819 12,531 12,141
Overseas 2,502 2,574 2,413
Property, plant and equipment
Australia 2,827 2,531 2,506
Overseas 266 249 237
Other assets
Australia 70,207 61,855 51,448
Overseas (1) 14,939 11,580 10,333
Provisions for impairment
Australia (3,272) (3,524) (4,027)
Overseas (375) (288) (269)
Total non-interest earning assets 98,913 87,508 74,782
Total assets 916,370 843,380 780,644
Percentage of total assets applicable to overseas operations (%) 16.7 16.6 15.6
(1) Comparative information has been restated to conform to presentation in the current year.
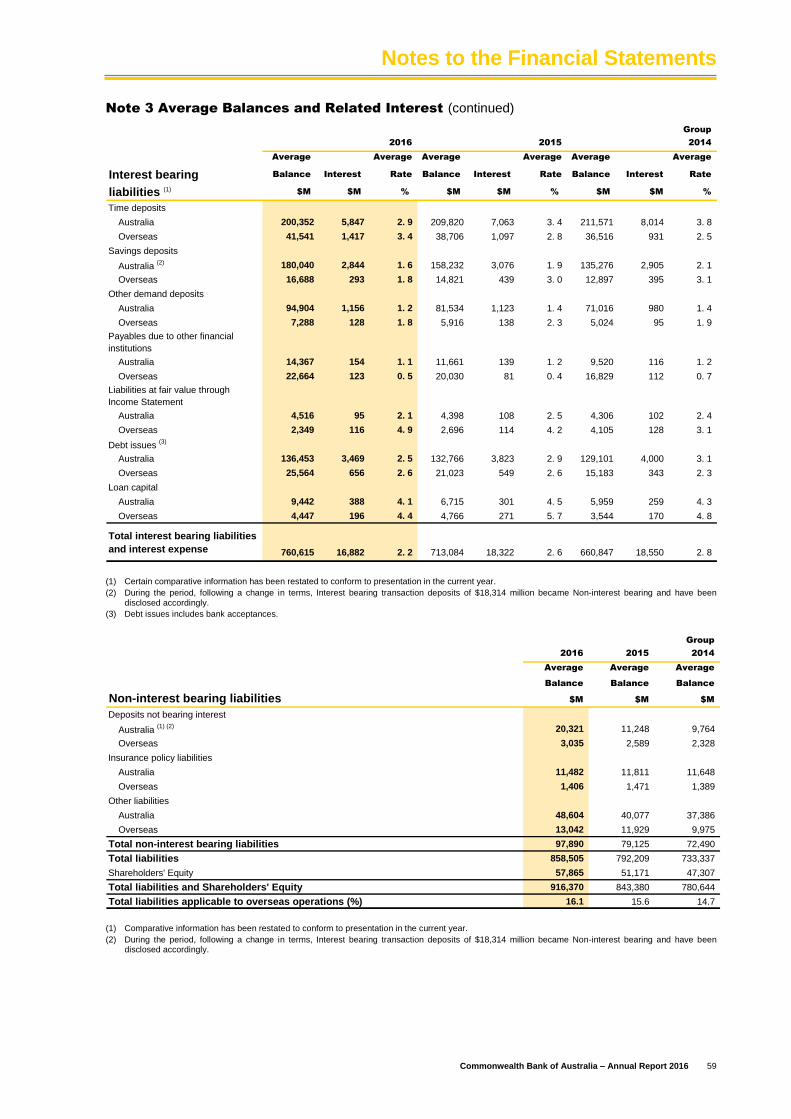
Notes to the Financial Statements
Commonwealth Bank of Australia – Annual Report 2016 59
Note 3 Average Balances and Related Interest (continued)
Group
2016 2015 2014
Average Average Average Average Average Average
Interest bearing Balance Interest Rate Balance Interest Rate Balance Interest Rate
liabilities (1)$M $M % $M $M % $M $M %
Time deposits
Australia 200,352 5,847 2. 9 209,820 7,063 3. 4 211,571 8,014 3. 8
Overseas 41,541 1,417 3. 4 38,706 1,097 2. 8 36,516 931 2. 5
Savings deposits
Australia (2) 180,040 2,844 1. 6 158,232 3,076 1. 9 135,276 2,905 2. 1
Overseas 16,688 293 1. 8 14,821 439 3. 0 12,897 395 3. 1
Other demand deposits
Australia 94,904 1,156 1. 2 81,534 1,123 1. 4 71,016 980 1. 4
Overseas 7,288 128 1. 8 5,916 138 2. 3 5,024 95 1. 9
Payables due to other financial
institutions
Australia 14,367 154 1. 1 11,661 139 1. 2 9,520 116 1. 2
Overseas 22,664 123 0. 5 20,030 81 0. 4 16,829 112 0. 7
Liabilities at fair value through
Income Statement
Australia 4,516 95 2. 1 4,398 108 2. 5 4,306 102 2. 4
Overseas 2,349 116 4. 9 2,696 114 4. 2 4,105 128 3. 1
Debt issues (3)
Australia 136,453 3,469 2. 5 132,766 3,823 2. 9 129,101 4,000 3. 1
Overseas 25,564 656 2. 6 21,023 549 2. 6 15,183 343 2. 3
Loan capital
Australia 9,442 388 4. 1 6,715 301 4. 5 5,959 259 4. 3
Overseas 4,447 196 4. 4 4,766 271 5. 7 3,544 170 4. 8
Total interest bearing liabilities
and interest expense 760,615 16,882 2. 2 713,084 18,322 2. 6 660,847 18,550 2. 8
(1) Certain comparative information has been restated to conform to presentation in the current year.
(2) During the period, following a change in terms, Interest bearing transaction deposits of $18,314 million became Non-interest bearing and have been disclosed accordingly.
(3) Debt issues includes bank acceptances.
Group
2016 2015 2014
Average Average Average
Balance Balance Balance
Non-interest bearing liabilities $M $M $M
Deposits not bearing interest
Australia (1) (2) 20,321 11,248 9,764
Overseas 3,035 2,589 2,328
Insurance policy liabilities
Australia 11,482 11,811 11,648
Overseas 1,406 1,471 1,389
Other liabilities
Australia 48,604 40,077 37,386
Overseas 13,042 11,929 9,975
Total non-interest bearing liabilities 97,890 79,125 72,490
Total liabilities 858,505 792,209 733,337
Shareholders' Equity 57,865 51,171 47,307
Total liabilities and Shareholders' Equity 916,370 843,380 780,644
Total liabilities applicable to overseas operations (%) 16.1 15.6 14.7
(1) Comparative information has been restated to conform to presentation in the current year.
(2) During the period, following a change in terms, Interest bearing transaction deposits of $18,314 million became Non-interest bearing and have been disclosed accordingly.

Notes to the Financial Statements
60 Commonwealth Bank of Australia – Annual Report 2016
Note 3 Average Balances and Related Interest (continued)
Changes in Net Interest Income: Volume and Rate Analysis
The following tables show the movement in interest income and expense due to changes in volume and interest rates. Volume
variances reflect the change in interest from the prior year due to movement in the average balance. Rate variances reflect the
change in interest from the prior year due to changes in interest rates.
Volume and rate variance for total interest earning assets and interest bearing liabilities have been calculated separately (rather
than being the sum of the individual categories).
Changes in net interest income: Volume Rate Total Volume Rate Total
Volume and rate analysis $M $M $M $M $M $M
Interest Earning Assets (1)
Cash and liquid assets
Australia 46 (34) 12 15 (10) 5
Overseas (6) 17 11 16 (4) 12
Receivables due from other financial institutions
Australia - 6 6 (10) 1 (9)
Overseas 17 41 58 19 (6) 13
Assets at fair value through Income Statement - Trading and
Other
Australia 48 56 104 25 19 44
Overseas (39) (7) (46) (30) 57 27
Available-for-sale investments
Australia 219 (213) 6 126 (105) 21
Overseas 40 (9) 31 32 33 65
Loans, bills discounted and other receivables
Australia 1,865 (2,362) (497) 1,513 (1,813) (300)
Overseas 422 (435) (13) 481 95 576
Changes in interest income 2,665 (2,993) (328) 2,323 (1,869) 454
Interest Bearing Liabilities and Loan Capital (1)
Time deposits
Australia (298) (918) (1,216) (63) (888) (951)
Overseas 89 231 320 59 107 166
Savings deposits
Australia 384 (616) (232) 470 (299) 171
Overseas 44 (190) (146) 58 (14) 44
Other demand deposits
Australia 174 (141) 33 145 (2) 143
Overseas 28 (38) (10) 19 24 43
Payables due to other financial institutions
Australia 31 (16) 15 26 (3) 23
Overseas 12 30 42 17 (48) (31)
Liabilities at fair value through Income Statement
Australia 3 (16) (13) 2 4 6
Overseas (16) 18 2 (52) 38 (14)
Debt issues
Australia 100 (454) (354) 110 (287) (177)
Overseas 118 (11) 107 142 64 206
Loan capital
Australia 117 (30) 87 33 9 42
Overseas (16) (59) (75) 64 37 101
Changes in interest expense 1,138 (2,578) (1,440) 1,404 (1,632) (228)
Changes in net interest income 1,283 (171) 1,112 1,060 (378) 682
June 2016 vs June 2015 June 2015 vs June 2014
(1) Certain comparative information has been restated to conform to presentation in the current year.

Notes to the Financial Statements
Commonwealth Bank of Australia – Annual Report 2016 61
Note 4 Income Tax
The income tax expense for the year is determined from the profit before income tax as follows:
Group Bank
2016 2015 2014 2016 2015
$M $M $M $M $M
Profit before Income Tax 12,854 12,612 11,997 11,459 11,670
Prima facie income tax at 30% 3,856 3,784 3,599 3,438 3,501
Effect of amounts which are non-deductible/ (assessable)
in calculating taxable income:
Taxation offsets and other dividend adjustments (4) (6) (6) (426) (582)
Tax adjustment referable to policyholder income 71 69 89 - -
Tax losses not previously brought to account (5) (9) (21) (5) (6)
Offshore tax rate differential (79) (116) (99) (32) (35)
Offshore banking unit (33) (39) (30) (27) (39)
Effect of changes in tax rates 1 2 3 1 1
Income tax (over) provided in previous years (177) (163) (121) (171) (151)
Other (23) 6 (67) 42 5
Total income tax expense 3,607 3,528 3,347 2,820 2,694
Corporate tax expense 3,506 3,429 3,221 2,820 2,694
Policyholder tax expense 101 99 126 - -
Total income tax expense 3,607 3,528 3,347 2,820 2,694
Effective tax rate (%) (1) 27.5 27.4 27.1 24.6 23.1
(1) Policyholder tax is excluded from both profit before income tax and tax expense for the purpose of calculating the Group’s effective tax rate as it is not incurred directly by the Group.
Group Bank
Income tax expense attributable to 2016 2015 2014 2016 2015
profit from ordinary activities $M $M $M $M $M
Australia
Current tax expense 2,971 2,865 2,433 2,708 2,591
Deferred tax expense 84 124 389 28 9
Total Australia 3,055 2,989 2,822 2,736 2,600
Overseas
Current tax expense 507 547 670 103 78
Deferred tax expense/(benefit) 45 (8) (145) (19) 16
Total overseas 552 539 525 84 94
Income Tax Expense attributable to profit from ordinary
activities 3,607 3,528 3,347 2,820 2,694

Notes to the Financial Statements
62 Commonwealth Bank of Australia – Annual Report 2016
Note 4 Income Tax (continued)
Group Bank
2016 2015 2014 2016 2015
$M $M $M $M $M
Deferred tax asset balances comprise temporary differences
attributable to:
Amounts recognised in the Income Statement:
Provision for employee benefits 457 453 437 385 369
Provisions for impairment on loans, bills discounted and other receivables 1,051 1,008 1,044 961 944
Other provisions not tax deductible until expense incurred 216 283 160 125 234
Financial instruments 56 36 9 10 1
Defined benefit superannuation plan 310 293 265 310 293
Other 227 207 233 182 184
Total amount recognised in the Income Statement 2,317 2,280 2,148 1,973 2,025
Amounts recognised directly in Other Comprehensive Income:
Cash flow hedge reserve 161 155 99 9 7
Other reserves 16 6 2 11 3
Total amount recognised directly in Other Comprehensive Income 177 161 101 20 10
Total deferred tax assets (before set off) (1) 2,494 2,441 2,249 1,993 2,035
Set off to tax pursuant to set-off provisions in Note 1(q) (2,149) (1,986) (1,663) (1,200) (1,264)
Net deferred tax assets 345 455 586 793 771
Deferred tax liability balances comprise temporary differences
attributable to:
Amounts recognised in the Income Statement:
Lease financing 282 341 381 108 170
Intangible assets 149 123 45 146 118
Financial instruments 196 235 184 13 11
Insurance 510 425 406 - -
Investments in associates 95 78 62 - -
Other 233 97 156 49 61
Total amount recognised in the Income Statement 1,465 1,299 1,234 316 360
Amounts recognised directly in Other Comprehensive Income:
Revaluation of properties 74 76 85 74 76
Foreign currency translation reserve 26 40 - - -
Cash flow hedge reserve 416 293 193 329 223
Defined benefit superannuation plan 376 365 229 376 365
Available-for-sale investments reserve 132 264 288 105 240
Total amount recognised directly in Other Comprehensive Income 1,024 1,038 795 884 904
Total deferred tax liabilities (before set off) (2) 2,489 2,337 2,029 1,200 1,264
Set off to tax pursuant to set-off provisions in Note 1(q) (2,149) (1,986) (1,663) (1,200) (1,264)
Net deferred tax liabilities 340 351 366 - -
Deferred tax assets opening balance: 455 586 916 771 796
Movement in temporary differences during the year:
Provisions for employee benefits 4 16 23 16 9
Provisions for impairment on loans, bills discounted and other receivables 43 (36) (133) 17 (42)
Other provisions not tax deductible until expense incurred (67) 123 (15) (109) 100
Financial instruments 36 87 19 19 (1)
Defined benefit superannuation plan 17 28 66 17 28
Other 20 (26) 1 (2) (21)
Set off to tax pursuant to set-off provisions in Note 1(q) (163) (323) (291) 64 (98)
Deferred tax assets closing balance 345 455 586 793 771
(1) The following amounts are expected to be recovered within 12 months of the Balance Sheet date for the Group $1,324 million (2015: $1,220 million) and for the Bank $1,132 million (2015: $1,083 million).
(2) The following amounts are expected to be settled within 12 months of the Balance Sheet date for the Group $438 million (2015: $552 million) and for the Bank $83 million (2015: $139 million).
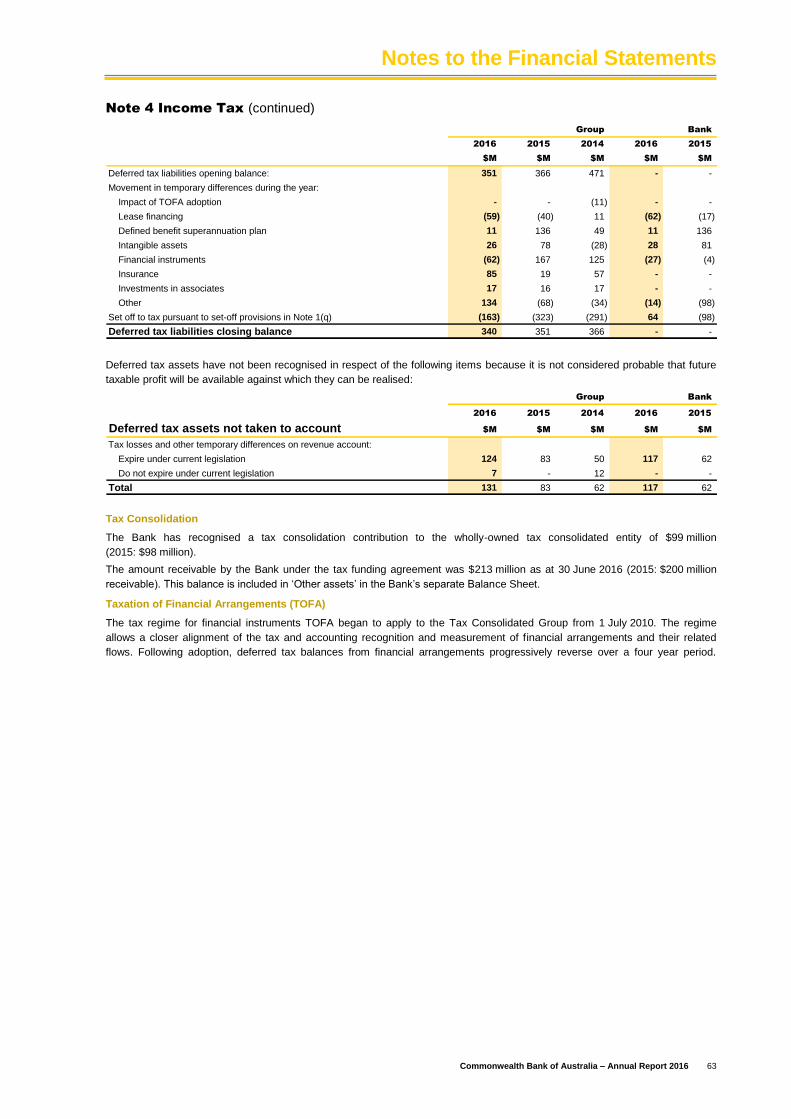
Notes to the Financial Statements
Commonwealth Bank of Australia – Annual Report 2016 63
Note 4 Income Tax (continued)
Group Bank
2016 2015 2014 2016 2015
$M $M $M $M $M
Deferred tax liabilities opening balance: 351 366 471 - -
Movement in temporary differences during the year:
Impact of TOFA adoption - - (11) - -
Lease financing (59) (40) 11 (62) (17)
Defined benefit superannuation plan 11 136 49 11 136
Intangible assets 26 78 (28) 28 81
Financial instruments (62) 167 125 (27) (4)
Insurance 85 19 57 - -
Investments in associates 17 16 17 - -
Other 134 (68) (34) (14) (98)
Set off to tax pursuant to set-off provisions in Note 1(q) (163) (323) (291) 64 (98)
Deferred tax liabilities closing balance 340 351 366 - -
Deferred tax assets have not been recognised in respect of the following items because it is not considered probable that future
taxable profit will be available against which they can be realised:
Group Bank
2016 2015 2014 2016 2015
Deferred tax assets not taken to account $M $M $M $M $M
Tax losses and other temporary differences on revenue account:
Expire under current legislation 124 83 50 117 62
Do not expire under current legislation 7 - 12 - -
Total 131 83 62 117 62
Tax Consolidation
The Bank has recognised a tax consolidation contribution to the wholly-owned tax consolidated entity of $99 million
(2015: $98 million).
The amount receivable by the Bank under the tax funding agreement was $213 million as at 30 June 2016 (2015: $200 million
receivable). This balance is included in ‘Other assets’ in the Bank’s separate Balance Sheet.
Taxation of Financial Arrangements (TOFA)
The tax regime for financial instruments TOFA began to apply to the Tax Consolidated Group from 1 July 2010. The regime
allows a closer alignment of the tax and accounting recognition and measurement of financial arrangements and their related
flows. Following adoption, deferred tax balances from financial arrangements progressively reverse over a four year period.
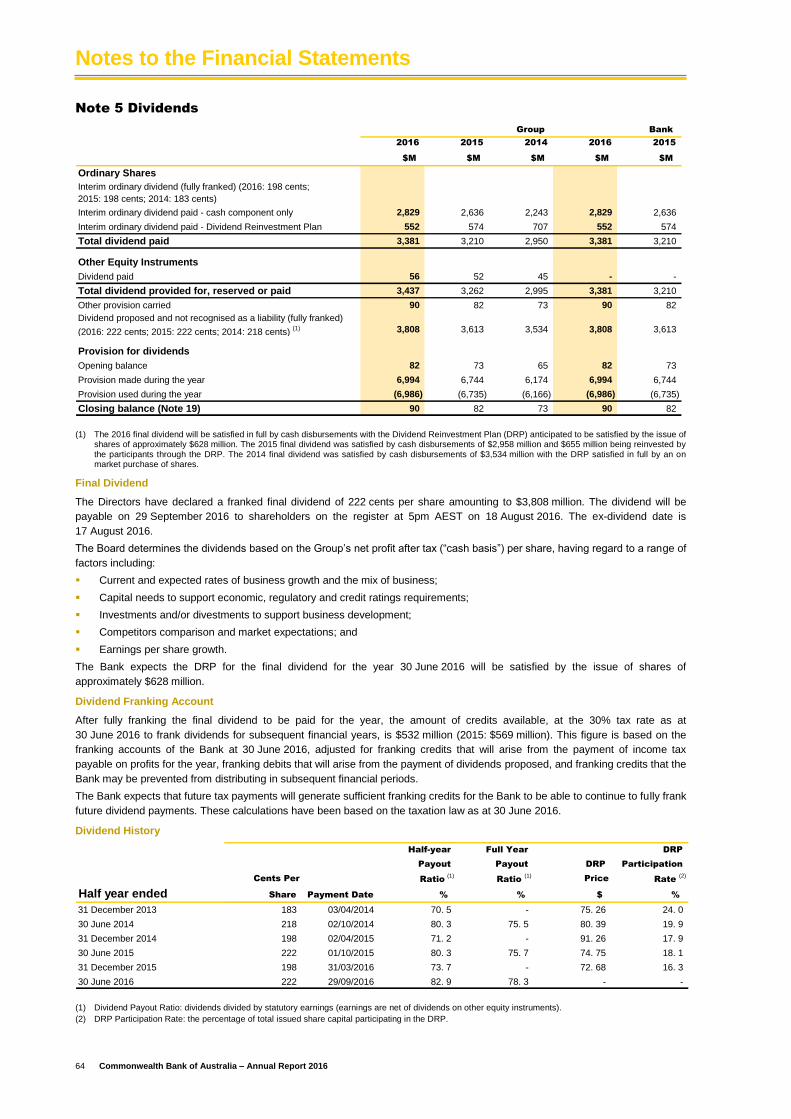
Notes to the Financial Statements
64 Commonwealth Bank of Australia – Annual Report 2016
Note 5 Dividends
Group Bank
2016 2015 2014 2016 2015
$M $M $M $M $M
Ordinary Shares
Interim ordinary dividend (fully franked) (2016: 198 cents;
2015: 198 cents; 2014: 183 cents)
Interim ordinary dividend paid - cash component only 2,829 2,636 2,243 2,829 2,636
Interim ordinary dividend paid - Dividend Reinvestment Plan 552 574 707 552 574
Total dividend paid 3,381 3,210 2,950 3,381 3,210
Other Equity Instruments
Dividend paid 56 52 45 - -
Total dividend provided for, reserved or paid 3,437 3,262 2,995 3,381 3,210
Other provision carried 90 82 73 90 82
Dividend proposed and not recognised as a liability (fully franked)
(2016: 222 cents; 2015: 222 cents; 2014: 218 cents) (1) 3,808 3,613 3,534 3,808 3,613
Provision for dividends
Opening balance 82 73 65 82 73
Provision made during the year 6,994 6,744 6,174 6,994 6,744
Provision used during the year (6,986) (6,735) (6,166) (6,986) (6,735)
Closing balance (Note 19) 90 82 73 90 82
(1) The 2016 final dividend will be satisfied in full by cash disbursements with the Dividend Reinvestment Plan (DRP) anticipated to be satisfied by the issue of
shares of approximately $628 million. The 2015 final dividend was satisfied by cash disbursements of $2,958 million and $655 million being reinvested by the participants through the DRP. The 2014 final dividend was satisfied by cash disbursements of $3,534 million with the DRP satisfied in full by an on market purchase of shares.
Final Dividend
The Directors have declared a franked final dividend of 222 cents per share amounting to $3,808 million. The dividend will be
payable on 29 September 2016 to shareholders on the register at 5pm AEST on 18 August 2016. The ex-dividend date is
17 August 2016.
The Board determines the dividends based on the Group’s net profit after tax (“cash basis”) per share, having regard to a range of
factors including:
Current and expected rates of business growth and the mix of business;
Capital needs to support economic, regulatory and credit ratings requirements;
Investments and/or divestments to support business development;
Competitors comparison and market expectations; and
Earnings per share growth.
The Bank expects the DRP for the final dividend for the year 30 June 2016 will be satisfied by the issue of shares of
approximately $628 million.
Dividend Franking Account
After fully franking the final dividend to be paid for the year, the amount of credits available, at the 30% tax rate as at
30 June 2016 to frank dividends for subsequent financial years, is $532 million (2015: $569 million). This figure is based on the
franking accounts of the Bank at 30 June 2016, adjusted for franking credits that will arise from the payment of income tax
payable on profits for the year, franking debits that will arise from the payment of dividends proposed, and franking credits that the
Bank may be prevented from distributing in subsequent financial periods.
The Bank expects that future tax payments will generate sufficient franking credits for the Bank to be able to continue to fully frank
future dividend payments. These calculations have been based on the taxation law as at 30 June 2016.
Dividend History
Half-year Full Year DRP
Payout Payout DRP Participation
Cents Per Ratio (1)
Ratio (1)
Price Rate (2)
Half year ended Share Payment Date % % $ %
31 December 2013 183 03/04/2014 70. 5 - 75. 26 24. 0
30 June 2014 218 02/10/2014 80. 3 75. 5 80. 39 19. 9
31 December 2014 198 02/04/2015 71. 2 - 91. 26 17. 9
30 June 2015 222 01/10/2015 80. 3 75. 7 74. 75 18. 1
31 December 2015 198 31/03/2016 73. 7 - 72. 68 16. 3
30 June 2016 222 29/09/2016 82. 9 78. 3 - -
(1) Dividend Payout Ratio: dividends divided by statutory earnings (earnings are net of dividends on other equity instruments).
(2) DRP Participation Rate: the percentage of total issued share capital participating in the DRP.
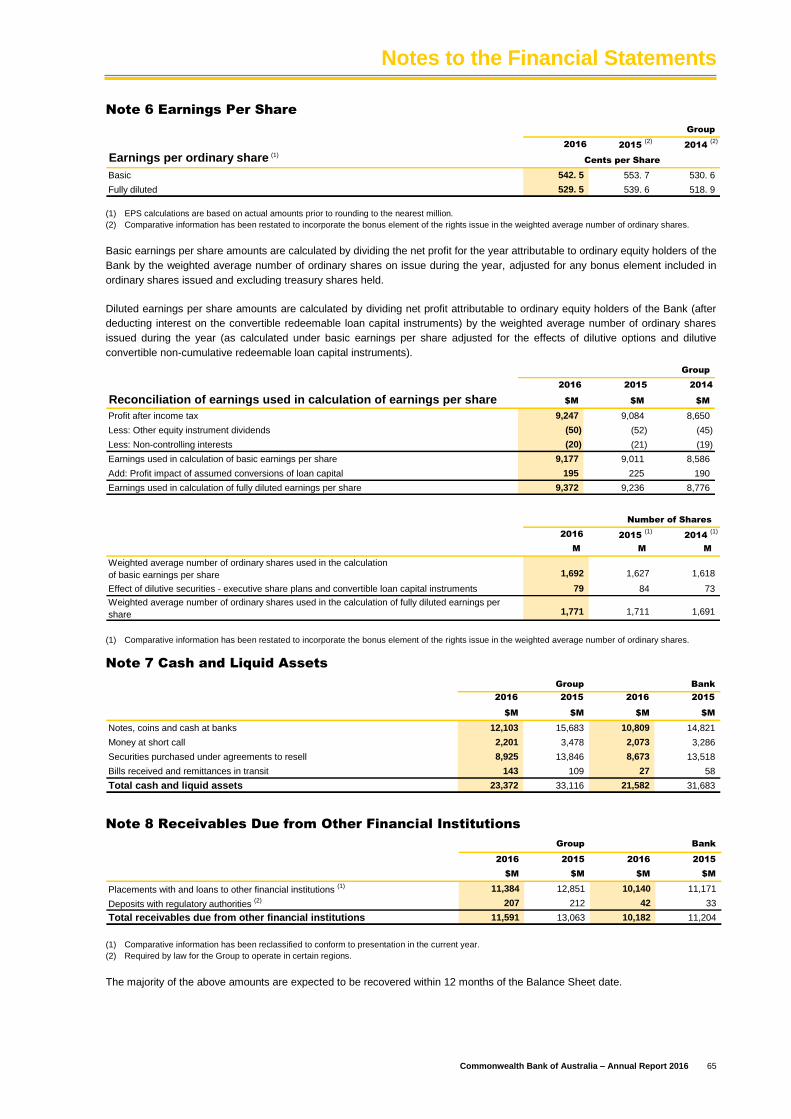
Notes to the Financial Statements
Commonwealth Bank of Australia – Annual Report 2016 65
Note 6 Earnings Per Share
Group
2016 2015 (2)
2014 (2)
Earnings per ordinary share (1)
Cents per Share
Basic 542. 5 553. 7 530. 6
Fully diluted 529. 5 539. 6 518. 9
(1) EPS calculations are based on actual amounts prior to rounding to the nearest million.
(2) Comparative information has been restated to incorporate the bonus element of the rights issue in the weighted average number of ordinary shares.
Basic earnings per share amounts are calculated by dividing the net profit for the year attributable to ordinary equity holders of the
Bank by the weighted average number of ordinary shares on issue during the year, adjusted for any bonus element included in
ordinary shares issued and excluding treasury shares held.
Diluted earnings per share amounts are calculated by dividing net profit attributable to ordinary equity holders of the Bank (after
deducting interest on the convertible redeemable loan capital instruments) by the weighted average number of ordinary shares
issued during the year (as calculated under basic earnings per share adjusted for the effects of dilutive options and dilutive
convertible non-cumulative redeemable loan capital instruments).
Group
2016 2015 2014
Reconciliation of earnings used in calculation of earnings per share $M $M $M
Profit after income tax 9,247 9,084 8,650
Less: Other equity instrument dividends (50) (52) (45)
Less: Non-controlling interests (20) (21) (19)
Earnings used in calculation of basic earnings per share 9,177 9,011 8,586
Add: Profit impact of assumed conversions of loan capital 195 225 190
Earnings used in calculation of fully diluted earnings per share 9,372 9,236 8,776
Number of Shares
2016 2015 (1)
2014 (1)
M M M
Weighted average number of ordinary shares used in the calculation
of basic earnings per share 1,692 1,627 1,618
Effect of dilutive securities - executive share plans and convertible loan capital instruments 79 84 73
Weighted average number of ordinary shares used in the calculation of fully diluted earnings per
share 1,771 1,711 1,691
(1) Comparative information has been restated to incorporate the bonus element of the rights issue in the weighted average number of ordinary shares.
Note 7 Cash and Liquid Assets
Group Bank
2016 2015 2016 2015
$M $M $M $M
Notes, coins and cash at banks 12,103 15,683 10,809 14,821
Money at short call 2,201 3,478 2,073 3,286
Securities purchased under agreements to resell 8,925 13,846 8,673 13,518
Bills received and remittances in transit 143 109 27 58
Total cash and liquid assets 23,372 33,116 21,582 31,683
Note 8 Receivables Due from Other Financial Institutions
Group Bank
2016 2015 2016 2015
$M $M $M $M
Placements with and loans to other financial institutions (1) 11,384 12,851 10,140 11,171
Deposits with regulatory authorities (2) 207 212 42 33
Total receivables due from other financial institutions 11,591 13,063 10,182 11,204
(1) Comparative information has been reclassified to conform to presentation in the current year.
(2) Required by law for the Group to operate in certain regions.
The majority of the above amounts are expected to be recovered within 12 months of the Balance Sheet date.

Notes to the Financial Statements
66 Commonwealth Bank of Australia – Annual Report 2016
Note 9 Assets at Fair Value through Income Statement
Group Bank
2016 2015 2016 2015
Assets at Fair Value through Income Statement $M $M $M $M
Trading
Government bonds, notes and securities 17,653 11,486 17,440 11,042
Corporate/financial institution bonds, notes and securities 5,353 6,444 4,808 6,026
Shares and equity investments 2,484 2,623 2,160 2,196
Commodities 8,577 5,871 8,577 5,871
Total trading assets 34,067 26,424 32,985 25,135
Insurance (1)
Investments backing life risk contracts
Equity security investments 855 844 - -
Debt security investments 3,563 3,135 - -
Property investments 82 136 - -
Other assets 703 555 - -
Investments backing life investment contracts
Equity security investments 4,356 4,670 - -
Debt security investments 2,417 3,182 - -
Property investments 123 297 - -
Other assets 1,448 1,269 - -
Total life insurance investment assets 13,547 14,088 - -
Other (2)
Government securities 43 95 - -
Receivables due from other corporate/financial institutions (3) 250 293 - 99
Other lending (3) 1,187 890 1,187 890
Total other assets at fair value through Income Statement 1,480 1,278 1,187 989
Total assets at fair value through Income Statement (4) 49,094 41,790 34,172 26,124
Maturity Distribution of assets at fair value through income statement
Less than twelve months 25,845 27,577 24,355 26,124
More than twelve months 23,249 14,213 9,817 -
Total assets at fair value through Income Statement 49,094 41,790 34,172 26,124 (1) Investments held in the Australian statutory funds may only be used within the restrictions imposed under the Life Insurance Act 1995.
(2) Designated at Fair Value through Income Statement at inception as they are managed by the Group on a fair value basis or to eliminate an accounting mismatch.
(3) Comparative information has been reclassified to conform to presentation in the current period.
(4) In addition to the assets above, the Group also measures bills discounted that are intended to be sold into the market at fair value. These are classified within Loans, bills discounted and other receivables (refer to Note 12).
Note 10 Derivative Financial Instruments
Derivative Contracts
Derivatives are classified as “Held for Trading” or “Held for Hedging”. Held for Trading derivatives are contracts entered into in
order to meet customers’ needs, to undertake market making and positioning activities, or for risk management purposes that do
not qualify for hedge accounting. Held for Hedging derivatives are instruments held for risk management purposes, which meet
the criteria for hedge accounting.
Derivatives Transacted for Hedging Purposes
There are three types of allowable hedging relationships: fair value hedges, cash flow hedges and hedges of a net investment in
a foreign operation. For details on the accounting treatment of each type of hedging relationship refer to Note 1(t).
Fair Value Hedges
Fair value hedges are used by the Group to manage exposure to changes in the fair value of an asset, liability or unrecognised
firm commitment. Changes in fair values can arise from fluctuations in interest or foreign exchange rates. The Group principally
uses interest rate swaps, cross currency swaps and futures to protect against such fluctuations.
All gains and losses associated with the ineffective portion of fair value hedge relationships are recognised immediately as ‘Other
operating income’ in the Income Statement.
Cash Flow Hedges
Cash flow hedges are used by the Group to manage exposure to variability in future cash flows, which could affect profit or loss
and may result from fluctuations in interest and exchange rates or in commodity prices on financial assets, liabilities or highly
probable forecast transactions. The Group principally uses derivative instruments to protect against such fluctuations.

Notes to the Financial Statements
Commonwealth Bank of Australia – Annual Report 2016 67
Note 10 Derivative Financial Instruments (continued)
Where it is appropriate, non-derivative financial assets and liabilities are also designated as hedging instruments in cash flow
hedge relationships.
Amounts accumulated in Other Comprehensive Income in respect of cash flow hedges are recycled to the Income Statement
when the forecast transaction occurs. Underlying cash flows from cash flow hedges are discounted to calculate deferred gains
and losses which are expected to occur in the following periods:
Group Bank
Total Total
2016 2015 2016 2015
$M $M $M $M
Within 6 months (46) (39) (9) (8)
6 months - 1 year 8 (5) 80 28
1 - 2 years 108 97 153 174
2 - 5 years 846 591 969 690
After 5 years (237) (267) (148) (128)
Net deferred gains/(losses) 679 377 1,045 756
Net Investment Hedges
The Group uses foreign exchange forward transactions to minimise its exposure to the currency translation risk of certain net
investments in foreign operations. In the current and prior year, there have been no material gains or losses as a result of
ineffective net investment hedges.
The fair value of derivative financial instruments is set out in the following tables:
Group
2016 2015
Fair Value Fair Value Fair Value Fair Value
Asset Liability Asset Liability
Derivatives assets and liabilities $M $M $M $M
Held for trading
Exchange rate related contracts:
Forward contracts 9,055 (8,656) 7,019 (6,472)
Swaps 6,646 (9,762) 7,299 (7,808)
Futures 1 - 7 -
Options purchased and sold 874 (897) 736 (773)
Total exchange rate related contracts 16,576 (19,315) 15,061 (15,053)
Interest rate related contracts:
Forward contracts - - 1 (1)
Swaps 10,590 (7,266) 9,120 (7,226)
Futures 15 (42) 5 (2)
Options purchased and sold 1,120 (1,261) 824 (844)
Total interest rate related contracts 11,725 (8,569) 9,950 (8,073)
Credit related swaps 38 (50) 28 (33)
Equity related contracts:
Swaps 38 (86) 165 (9)
Options purchased and sold 14 (27) 66 (62)
Total equity related contracts 52 (113) 231 (71)
Commodity related contracts:
Swaps 593 (510) 291 (359)
Options purchased and sold 40 (43) 59 (55)
Total commodity related contracts 633 (553) 350 (414)
Identified embedded derivatives 338 (125) 193 (258)
Total derivative assets/(liabilities) held for trading 29,362 (28,725) 25,813 (23,902)

Notes to the Financial Statements
68 Commonwealth Bank of Australia – Annual Report 2016
Note 10 Derivative Financial Instruments (continued)
Group
2016 2015
Fair Value Fair Value Fair Value Fair Value
Asset Liability Asset Liability
$M $M $M $M
Fair value hedges
Exchange rate related contracts:
Swaps 8,631 (4,612) 12,238 (5,393)
Total exchange rate related contracts 8,631 (4,612) 12,238 (5,393)
Interest rate related swaps 881 (2,930) 932 (3,182)
Total fair value hedges 9,512 (7,542) 13,170 (8,575)
Cash flow hedges
Exchange rate related swaps 5,002 (2,150) 4,329 (1,080)
Interest rate related swaps 2,691 (1,495) 2,831 (1,656)
Total cash flow hedges 7,693 (3,645) 7,160 (2,736)
Net investment hedges
Exchange rate related forward contracts - (9) 11 -
Total net investment hedges - (9) 11 -
Total derivative assets/(liabilities) held for hedging 17,205 (11,196) 20,341 (11,311)
Held for trading derivatives are expected to be recovered or due to be settled within 12 months of the Balance Sheet date. The
majority of hedging derivatives are expected to be recovered or due to be settled more than 12 months after the Balance Sheet
date.
Bank
2016 2015
Fair Value Fair Value Fair Value Fair Value
Asset Liability Asset Liability
Derivatives assets and liabilities $M $M $M $M
Held for trading
Exchange rate related contracts:
Forward contracts 9,010 (8,554) 6,900 (6,430)
Swaps 8,366 (10,691) 7,484 (7,800)
Futures 1 - 7 -
Options purchased and sold 873 (894) 730 (772)
Derivatives held with controlled entities 915 (3,083) 850 (3,647)
Total exchange rate related contracts 19,165 (23,222) 15,971 (18,649)
Interest rate related contracts:
Forward contracts - - 1 (1)
Swaps 10,166 (6,868) 8,898 (6,896)
Futures 15 (37) - (1)
Options purchased and sold 1,119 (1,255) 823 (842)
Derivatives held with controlled entities 216 (261) 132 (241)
Total interest rate related contracts 11,516 (8,421) 9,854 (7,981)
Credit related swaps 38 (50) 28 (33)
Equity related contracts:
Swaps 38 (86) 165 (9)
Options purchased and sold 14 (27) 66 (62)
Total equity related contracts 52 (113) 231 (71)
Commodity related contracts:
Swaps 593 (510) 291 (359)
Options purchased and sold 40 (43) 59 (55)
Total commodity related contracts 633 (553) 350 (414)
Identified embedded derivatives 338 (125) 193 (258)
Total derivative assets/(liabilities) held for trading 31,742 (32,484) 26,627 (27,406)
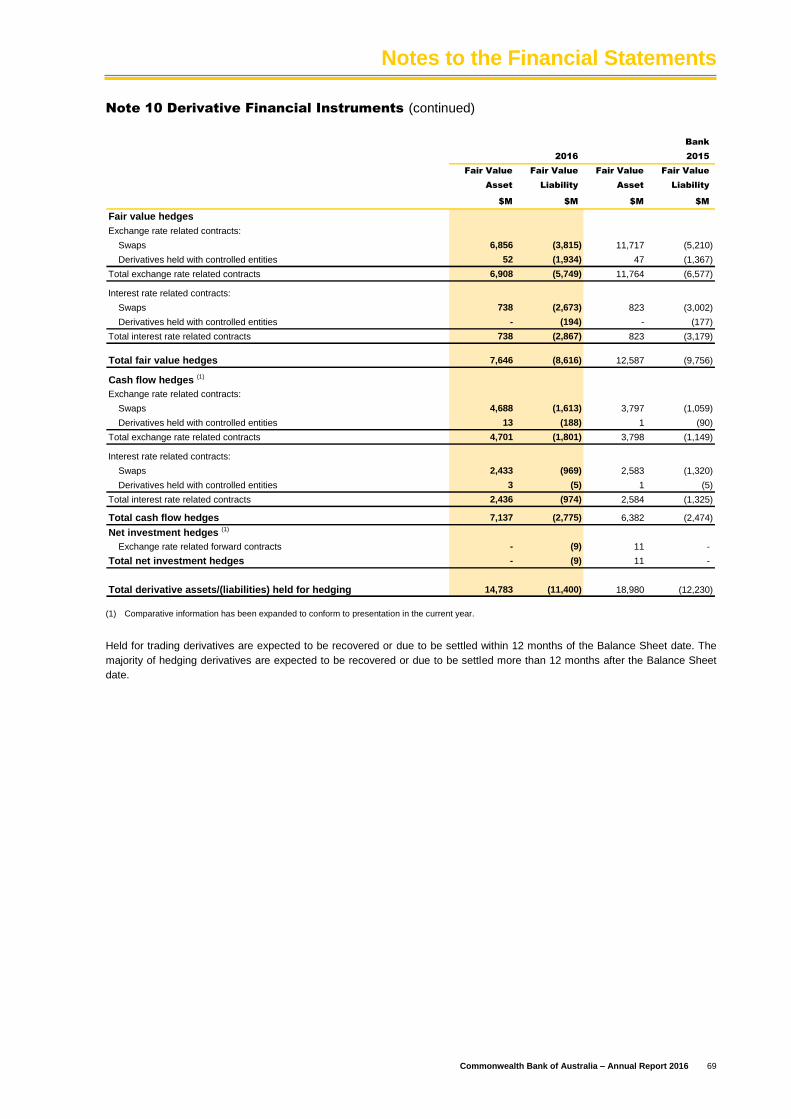
Notes to the Financial Statements
Commonwealth Bank of Australia – Annual Report 2016 69
Note 10 Derivative Financial Instruments (continued)
Bank
2016 2015
Fair Value Fair Value Fair Value Fair Value
Asset Liability Asset Liability
$M $M $M $M
Fair value hedges
Exchange rate related contracts:
Swaps 6,856 (3,815) 11,717 (5,210)
Derivatives held with controlled entities 52 (1,934) 47 (1,367)
Total exchange rate related contracts 6,908 (5,749) 11,764 (6,577)
Interest rate related contracts:
Swaps 738 (2,673) 823 (3,002)
Derivatives held with controlled entities - (194) - (177)
Total interest rate related contracts 738 (2,867) 823 (3,179)
Total fair value hedges 7,646 (8,616) 12,587 (9,756)
Cash flow hedges (1)
Exchange rate related contracts:
Swaps 4,688 (1,613) 3,797 (1,059)
Derivatives held with controlled entities 13 (188) 1 (90)
Total exchange rate related contracts 4,701 (1,801) 3,798 (1,149)
Interest rate related contracts:
Swaps 2,433 (969) 2,583 (1,320)
Derivatives held with controlled entities 3 (5) 1 (5)
Total interest rate related contracts 2,436 (974) 2,584 (1,325)
Total cash flow hedges 7,137 (2,775) 6,382 (2,474)
Net investment hedges (1)
Exchange rate related forward contracts - (9) 11 -
Total net investment hedges - (9) 11 -
Total derivative assets/(liabilities) held for hedging 14,783 (11,400) 18,980 (12,230)
(1) Comparative information has been expanded to conform to presentation in the current year.
Held for trading derivatives are expected to be recovered or due to be settled within 12 months of the Balance Sheet date. The
majority of hedging derivatives are expected to be recovered or due to be settled more than 12 months after the Balance Sheet
date.

Notes to the Financial Statements
70 Commonwealth Bank of Australia – Annual Report 2016
Note 11 Available-for-Sale Investments
Group Bank
2016 2015 2016 2015
$M $M $M $M
Government bonds, notes and securities 47,190 36,100 45,754 35,708
Corporate/financial institution bonds, notes and securities 18,740 22,272 17,724 22,027
Shares and equity investments 959 1,155 486 726
Covered bonds, mortgage backed securities and SSA (1) (2) 14,009 15,157 12,397 13,843
Total available-for-sale investments 80,898 74,684 76,361 72,304
(1) Supranational, Sovereign and Agency Securities (SSA).
(2) On 31 March 2015 internal residential mortgage backed securities (internal RMBS) issued to the Bank by controlled entities of $75,041 million were reclassified to Loans to controlled entities. They were reclassified prospectively at their fair value of $75,041 million. As at the date of reclassification the available for sale reserve was nil. The fair value of the internal RMBS as at 30 June 2015 was $74,959 million, as disclosed in Note 40.
The following amounts expected to be recovered within 12 months of the Balance Sheet date for the Group are $16,324 million
(2015: $20,350 million) and for Bank $15,660 million (2015: $20,812 million).
Proceeds received from settlement at or close to maturity of Available-for-sale investments for the Group were $39,011 million
(2015: $47,752 million) and for the Bank were $39,430 million (2015: $47,235 million).
Proceeds from the sale of available-for-sale investments for the Group were $7,139 million (2015: $5,817 million) and for the
Bank were $7,111 million (2015: $5,817 million).
Maturity Distribution and Weighted Average Yield
Group
Maturity Period at 30 June 2016
10 or Non-
0 to 1 Year 1 to 5 Years 5 to 10 Years more Years Maturing Total
$M % $M % $M % $M % $M $M
Government bonds, notes and securities 7,743 0.46 12,172 1.66 19,211 1.95 8,064 2.42 - 47,190
6,109 2.21 12,596 2.98 25 4.00 10 3.00 - 18,740
Shares and equity investments - - - - - - - - 959 959
775 2.54 6,060 2.88 616 2.99 6,558 2.82 - 14,009
Total available-for-sale investments 14,627 - 30,828 - 19,852 - 14,632 - 959 80,898
Covered bonds, mortgage backed securities and
SSA
Corporate/financial institution bonds, notes and
securities
The maturity table is based on contractual terms.
.

Notes to the Financial Statements
Commonwealth Bank of Australia – Annual Report 2016 71
Note 12 Loans, Bills Discounted and Other Receivables
Group Bank
2016 2015 2016 2015
$M $M $M $M
Australia
Overdrafts 26,857 22,353 26,857 22,353
Home loans (1) 409,452 383,174 404,352 379,500
Credit card outstandings 12,122 11,887 12,122 11,887
Lease financing 4,412 4,485 3,073 3,053
Bills discounted (2) 10,507 14,847 10,507 14,847
Term loans and other lending (3) 140,784 124,312 140,700 124,186
Total Australia 604,134 561,058 597,611 555,826
Overseas
Overdrafts 1,592 1,373 318 139
Home loans (1) 46,622 39,677 550 522
Credit card outstandings 912 816 - -
Lease financing 72 335 28 49
Term loans and other lending (3) 46,967 40,969 23,754 21,325
Total overseas 96,165 83,170 24,650 22,035
Gross loans, bills discounted and other receivables 700,299 644,228 622,261 577,861
Less
Provisions for Loan Impairment (Note 13):
Collective provision (2,783) (2,739) (2,510) (2,530)
Individually assessed provisions (935) (879) (855) (824)
Unearned income:
Term loans (701) (756) (699) (753)
Lease financing (482) (592) (278) (319)
(4,901) (4,966) (4,342) (4,426)
Net loans, bills discounted and other receivables 695,398 639,262 617,919 573,435
(1) Home loans balance includes residential mortgages that have been assigned to securitisation vehicles and covered bond trusts. Further detail on these residential mortgages is disclosed in Note 41.
(2) The Group measures bills discounted intended to be sold into the market at fair value and includes these within loans, bills discounted and other receivables to reflect the nature of the lending arrangement.
(3) Comparatives have been aggregated to align to presentation in the current year.
The following amounts, based on behavioural terms and current market conditions, are expected to be recovered within
12 months of the Balance Sheet date for Group $206,157 million (2015: $187,536 million), and for Bank $191,962 million
(2015: $159,429 million). The maturity tables below are based on contractual terms.
Finance Lease Receivables
The Group and the Bank provide finance leases to a broad range of clients to support financing needs in acquiring transportation
assets such as trains, aircraft, ships and major production and manufacturing equipment.
Finance lease receivables are included within loans, bills discounted and other receivables to customers.
Group
2016 2015
Gross Present Value Gross Present Value
Investment in of Minimum Investment in of Minimum
Finance Lease Unearned Lease Payment Finance Lease Unearned Lease Payment
Receivable Income Receivable Receivable Income Receivable
$M $M $M $M $M $M
Not later than one year 1,247 (161) 1,086 1,051 (147) 904
One year to five years 2,906 (287) 2,619 3,138 (353) 2,785
Over five years 331 (34) 297 631 (92) 539
4,484 (482) 4,002 4,820 (592) 4,228
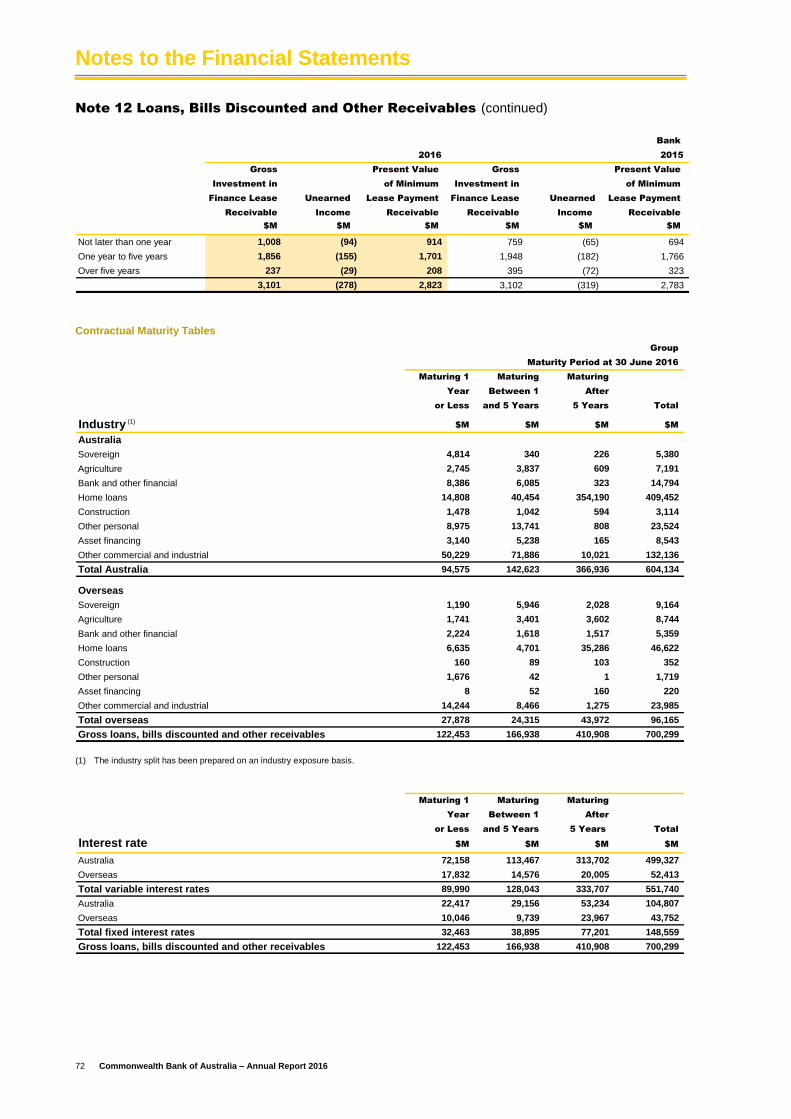
Notes to the Financial Statements
72 Commonwealth Bank of Australia – Annual Report 2016
Note 12 Loans, Bills Discounted and Other Receivables (continued)
Bank
2016 2015
Gross Present Value Gross Present Value
Investment in of Minimum Investment in of Minimum
Finance Lease Unearned Lease Payment Finance Lease Unearned Lease Payment
Receivable Income Receivable Receivable Income Receivable
$M $M $M $M $M $M
Not later than one year 1,008 (94) 914 759 (65) 694
One year to five years 1,856 (155) 1,701 1,948 (182) 1,766
Over five years 237 (29) 208 395 (72) 323
3,101 (278) 2,823 3,102 (319) 2,783
Contractual Maturity Tables
Group
Maturity Period at 30 June 2016
Maturing 1 Maturing Maturing
Year Between 1 After
or Less and 5 Years 5 Years Total
Industry (1)
$M $M $M $M
Australia
Sovereign 4,814 340 226 5,380
Agriculture 2,745 3,837 609 7,191
Bank and other financial 8,386 6,085 323 14,794
Home loans 14,808 40,454 354,190 409,452
Construction 1,478 1,042 594 3,114
Other personal 8,975 13,741 808 23,524
Asset financing 3,140 5,238 165 8,543
Other commercial and industrial 50,229 71,886 10,021 132,136
Total Australia 94,575 142,623 366,936 604,134
Overseas
Sovereign 1,190 5,946 2,028 9,164
Agriculture 1,741 3,401 3,602 8,744
Bank and other financial 2,224 1,618 1,517 5,359
Home loans 6,635 4,701 35,286 46,622
Construction 160 89 103 352
Other personal 1,676 42 1 1,719
Asset financing 8 52 160 220
Other commercial and industrial 14,244 8,466 1,275 23,985
Total overseas 27,878 24,315 43,972 96,165
Gross loans, bills discounted and other receivables 122,453 166,938 410,908 700,299
(1) The industry split has been prepared on an industry exposure basis.
Maturing 1 Maturing Maturing
Year Between 1 After
or Less and 5 Years 5 Years Total
Interest rate $M $M $M $M
Australia 72,158 113,467 313,702 499,327
Overseas 17,832 14,576 20,005 52,413
Total variable interest rates 89,990 128,043 333,707 551,740
Australia 22,417 29,156 53,234 104,807
Overseas 10,046 9,739 23,967 43,752
Total fixed interest rates 32,463 38,895 77,201 148,559
Gross loans, bills discounted and other receivables 122,453 166,938 410,908 700,299

Notes to the Financial Statements
Commonwealth Bank of Australia – Annual Report 2016 73
Note 12 Loans, Bills Discounted and Other Receivables (continued)
Group
Maturity Period at 30 June 2015
Maturing 1 Maturing Maturing
Year Between 1 After
or Less and 5 Years 5 Years Total
Industry (1)$M $M $M $M
Australia
Sovereign 4,815 438 268 5,521
Agriculture 2,212 3,224 822 6,258
Bank and other financial 8,477 6,312 368 15,157
Home loans 18,070 36,111 328,993 383,174
Construction 1,186 1,116 420 2,722
Other personal 7,739 13,525 1,049 22,313
Asset financing 2,781 5,426 149 8,356
Other commercial and industrial 40,565 66,281 10,711 117,557
Total Australia 85,845 132,433 342,780 561,058
Overseas
Sovereign 5,496 6,512 921 12,929
Agriculture 1,411 2,598 3,981 7,990
Bank and other financial 2,729 2,690 2,153 7,572
Home loans 6,382 4,134 29,161 39,677
Construction 174 113 120 407
Other personal 1,094 33 1 1,128
Asset financing 11 79 468 558
Other commercial and industrial 5,447 4,396 3,066 12,909
Total overseas 22,744 20,555 39,871 83,170
Gross loans, bills discounted and other receivables 108,589 152,988 382,651 644,228
(1) The industry split has been prepared on an industry exposure basis.
Maturing 1 Maturing Maturing
Year Between 1 After
or Less and 5 Years 5 Years Total
Interest rate $M $M $M $M
Australia 76,053 112,989 293,596 482,638
Overseas 15,082 13,277 17,649 46,008
Total variable interest rates 91,135 126,266 311,245 528,646
Australia 9,792 19,444 49,184 78,420
Overseas 7,662 7,278 22,222 37,162
Total fixed interest rates 17,454 26,722 71,406 115,582
Gross loans, bills discounted and other receivables 108,589 152,988 382,651 644,228

Notes to the Financial Statements
74 Commonwealth Bank of Australia – Annual Report 2016
Note 13 Provisions for Impairment
Group Bank
2016 2015 2014 2016 2015
Provisions for impairment losses $M $M $M $M $M
Collective provision
Opening balance 2,762 2,779 2,858 2,553 2,587
Net collective provision funding 664 589 497 566 528
Impairment losses written off (846) (770) (753) (782) (718)
Impairment losses recovered 225 176 165 207 155
Other 13 (12) 12 1 1
Closing balance 2,818 2,762 2,779 2,545 2,553
Individually assessed provisions
Opening balance 887 1,127 1,628 832 1,087
Net new and increased individual provisioning 788 659 726 760 550
Write-back of provisions no longer required (196) (260) (305) (173) (241)
Discount unwind to interest income (27) (38) (51) (27) (38)
Impairment losses written off (571) (709) (1,060) (590) (639)
Other 63 108 189 62 113
Closing balance 944 887 1,127 864 832
Total provisions for impairment losses 3,762 3,649 3,906 3,409 3,385
Less: Provision for Off Balance Sheet exposures (44) (31) (40) (44) (31)
Total provisions for loan impairment 3,718 3,618 3,866 3,365 3,354
Group Bank
2016 2015 2014 2016 2015
Provision ratios % % % % %
Total provisions for impaired assets as a % of gross impaired
assets 36. 17 35. 94 37. 60 39. 59 38. 85
Total provisions for impairment losses as a % of gross loans and
acceptances 0. 54 0. 56 0. 64 0. 55 0. 58
Group Bank
2016 2015 2014 2016 2015
Loan impairment expense $M $M $M $M $M
Net collective provision funding 664 589 497 566 528
Net new and increased individual provisioning 788 659 726 760 550
Write-back of individually assessed provisions (196) (260) (305) (173) (241)
Total loan impairment expense 1,256 988 918 1,153 837

Notes to the Financial Statements
Commonwealth Bank of Australia – Annual Report 2016 75
Note 13 Provisions for Impairment (continued)
Group
Individually assessed provisions by 2016 2015 2014 2013 2012
industry classification $M $M $M $M $M
Australia
Sovereign - - - - -
Agriculture 42 133 123 168 89
Bank and other financial 29 36 68 217 235
Home loans 193 148 151 182 256
Construction 25 20 29 89 152
Other personal 7 10 14 14 11
Asset financing 28 28 30 23 14
Other commercial and industrial 483 400 620 871 1,163
Total Australia 807 775 1,035 1,564 1,920
Overseas
Sovereign - - - - -
Agriculture 23 14 3 16 7
Bank and other financial 4 - 15 5 6
Home loans 6 10 11 17 28
Construction 8 1 1 - -
Other personal 1 - - - -
Asset financing 10 10 - - -
Other commercial and industrial 85 77 62 26 47
Total overseas 137 112 92 64 88
Total individually assessed provisions 944 887 1,127 1,628 2,008
Group
2016 2015 2014 2013 2012
Loans written off by industry classification $M $M $M $M $M
Australia
Sovereign - - - - -
Agriculture 84 65 138 30 32
Bank and other financial 10 36 122 79 51
Home loans 82 72 113 217 88
Construction 11 14 52 139 45
Other personal 747 686 677 622 657
Asset financing 54 45 37 25 38
Other commercial and industrial 249 404 568 686 884
Total Australia 1,237 1,322 1,707 1,798 1,795
Overseas
Sovereign - - - - -
Agriculture 7 3 3 4 5
Bank and other financial - 69 - 10 1
Home loans 7 8 13 21 24
Construction - - - - -
Other personal 54 42 30 25 19
Asset financing - - - - -
Other commercial and industrial 112 35 60 31 33
Total overseas 180 157 106 91 82
Gross loans written off 1,417 1,479 1,813 1,889 1,877
Recovery of amounts previously written off
Australia 211 165 148 144 216
Overseas 14 11 17 10 12
Total amounts recovered 225 176 165 154 228
Net loans written off 1,192 1,303 1,648 1,735 1,649

Notes to the Financial Statements
76 Commonwealth Bank of Australia – Annual Report 2016
Note 13 Provisions for Impairment (continued)
Group
2016 2015 2014 2013 2012
Loans recovered by industry classification $M $M $M $M $M
Australia
Sovereign - - - - -
Agriculture 1 - - - -
Bank and other financial 27 9 6 8 17
Home loans 3 3 4 4 5
Construction 1 - - - -
Other personal 154 125 106 113 147
Asset financing 4 4 5 6 17
Other commercial and industrial 21 24 27 13 30
Total Australia 211 165 148 144 216
Overseas
Sovereign - - - - -
Agriculture - - 3 - -
Bank and other financial 1 - 3 1 -
Home loans 1 1 1 1 -
Construction - - - - -
Other personal 10 10 8 8 8
Asset financing - - - - -
Other commercial and industrial 2 - 2 - 4
Total overseas 14 11 17 10 12
Total loans recovered 225 176 165 154 228
Note 14 Property, Plant and Equipment
Group Bank
2016 2015 2016 2015
$M $M $M $M
Land and Buildings (1)
At 30 June valuation 496 463 446 416
Total land and buildings 496 463 446 416
Leasehold Improvements
At cost 1,557 1,513 1,307 1,282
Accumulated depreciation (952) (904) (817) (786)
Closing balance 605 609 490 496
Equipment
At cost 1,891 1,691 1,502 1,336
Accumulated depreciation (1,406) (1,313) (1,106) (1,032)
Closing balance 485 378 396 304
Total property, plant and equipment held for own use 1,586 1,450 1,332 1,216
Assets Held for Lease
At cost 1,558 1,662 247 373
Accumulated depreciation (271) (279) (76) (80)
Closing balance 1,287 1,383 171 293
Other Property, Plant and Equipment (2)
At cost 1,067 - - -
Accumulated depreciation - - - -
Closing balance 1,067 - - -
Total property, plant and equipment 3,940 2,833 1,503 1,509
(1) Had land and buildings been measured using the cost model rather than fair value, the carrying value would have been $270 million (2015: $210 million)
for Group and $249 million (2015: $190 million) for Bank.
(2) Relates to property, plant and equipment held via a partly owned fund within the Group’s life insurance business. The investment in the fund is used to back life insurance policy liabilities. As a result the underlying property, plant and equipment is not considered to be held for the use of the Bank.
The majority of the above amounts have expected useful lives longer than 12 months after the Balance Sheet date.
There are no significant items of property, plant and equipment that are currently under construction.

Notes to the Financial Statements
Commonwealth Bank of Australia – Annual Report 2016 77
Note 14 Property, Plant and Equipment (continued)
Land and buildings are carried at fair value based on independent valuations performed during the year; refer to Note 1(w).
These fair values fall under the Level 3 category of the fair value hierarchy as defined in Note 40.
Reconciliation of the carrying amounts of Property, Plant and Equipment is set out below:
Group Bank
2016 2015 2016 2015
$M $M $M $M
Land and Buildings
Carrying amount at the beginning of the year 463 499 416 448
Additions 73 13 70 13
Disposals (14) (35) (11) (30)
Net revaluations 2 19 1 16
Depreciation (31) (32) (30) (31)
Foreign currency translation adjustment 3 (1) - -
Carrying amount at the end of the year 496 463 446 416
Leasehold Improvements
Carrying amount at the beginning of the year 609 589 496 487
Additions 148 168 130 139
Disposals (18) (6) (16) (6)
Depreciation (137) (142) (118) (124)
Foreign currency translation adjustment 3 - (2) -
Carrying amount at the end of the year 605 609 490 496
Equipment
Carrying amount at the beginning of the year 378 355 304 273
Additions 260 174 218 149
Disposals (8) (11) (6) (9)
Depreciation (149) (139) (120) (109)
Foreign currency translation adjustment 4 (1) - -
Carrying amount at the end of the year 485 378 396 304
Assets Held for Lease
Carrying amount at the beginning of the year 1,383 1,373 293 259
Additions 448 223 8 80
Disposals (385) (179) (104) (28)
Impairment losses (69) - - -
Depreciation (107) (80) (26) (18)
Foreign currency translation adjustment 17 46 - -
Carrying amount at the end of the year 1,287 1,383 171 293
Other Property, Plant and Equipment
Carrying amount at the beginning of the year - - - -
Acquisitions attributed to business combinations 693 - - -
Additions 330 - - -
Depreciation - - - -
Foreign currency translation adjustment 44 - - -
Carrying amount at the end of the year 1,067 - - -

Notes to the Financial Statements
78 Commonwealth Bank of Australia – Annual Report 2016
Note 15 Intangible Assets
Group Bank
2016 2015 2016 2015
$M $M $M $M
Goodwill
Purchased goodwill at cost 7,925 7,599 2,522 2,522
Closing balance 7,925 7,599 2,522 2,522
Computer Software Costs
Cost 3,823 3,359 3,361 2,982
Accumulated amortisation (1,595) (1,270) (1,300) (1,038)
Closing balance 2,228 2,089 2,061 1,944
Core Deposits (1)
Cost 495 495 495 495
Accumulated amortisation (495) (461) (495) (461)
Closing balance - 34 - 34
Brand Names (2)
Cost 190 190 186 186
Accumulated amortisation (1) (1) - -
Closing balance 189 189 186 186
Other Intangibles (3)
Cost 156 162 38 38
Accumulated amortisation (114) (103) (29) (24)
Closing balance 42 59 9 14
Total Intangible assets 10,384 9,970 4,778 4,700
(1) Core deposits represent the value of the Bankwest deposit base compared to the avoided cost of alternative funding sources such as securitisation and
wholesale funding. This asset was acquired on 19 December 2008 with a useful life of seven years based on the weighted average attrition rates of the Bankwest deposit portfolio. It was fully amortised during the 2016 financial year.
(2) Brand names predominantly represent the value of royalty costs foregone by the Group through acquiring the Bankwest brand name. The royalty costs that would have been incurred by an entity using the Bankwest brand name are based on an annual percentage of income generated by Bankwest. The Bankwest brand name has an indefinite useful life. It is not subject to amortisation, but is subject to annual impairment testing. No impairment was required as a result of this test. The balance also includes Count Financial Limited brand name ($4 million) that is amortised over the estimated useful life of 20 years.
(3) Other intangibles include the value of credit card relationships acquired from Bankwest and Count franchise relationships. This value represents future net income generated from the relationships that existed at Balance Sheet date. The assets have a useful life of 10 years based on the attrition rates of customers.
Impairment Tests for Goodwill and Intangible Assets with Indefinite Lives
To assess whether goodwill and other assets with indefinite useful lives are impaired, the carrying amount of a cash-generating
unit or a group of cash-generating units are compared to the recoverable amount. The recoverable amount is determined based
on fair value less cost to sell, using an earnings multiple applicable to that type of business. The category of this fair value is Level
3 as defined in Note 40.
Earnings multiples relating to the Group‘s Banking and Wealth Management cash-generating units are sourced from publicly
available data associated with Australian businesses displaying similar characteristics to those cash-generating units, and are
applied to current earnings. The key assumption is the Price-Earnings (P/E) multiple observed for these businesses, which for the
Banking businesses (excluding IFS) were in the range of 10.4 – 12.4 (2015: 12.1 – 13.0), for the IFS businesses 6.2 – 16.4 (2015:
7.4 – 17.2) and for Wealth Management businesses were in the range of 11.6 – 15.1 (2015: 12.7 – 17.1).

Notes to the Financial Statements
Commonwealth Bank of Australia – Annual Report 2016 79
Note 15 Intangible Assets (continued)
Goodwill Allocation to Cash-Generating Units
Group
2016 2015
$M $M
Retail Banking Services 4,149 4,149
Business and Private Banking 297 297
Wealth Management 2,732 2,410
New Zealand 698 679
IFS and Other 49 64
Total 7,925 7,599
Reconciliation of the carrying amounts of Intangible Assets is set out below:
Group Bank
2016 2015 2016 2015
$M $M $M $M
Goodwill
Opening balance 7,599 7,566 2,522 2,522
Additions 304 43 - -
Transfers/disposals/other adjustments (1) 22 (10) - -
Closing balance 7,925 7,599 2,522 2,522
Computer Software Costs
Opening balance 2,089 1,854 1,944 1,724
Additions:
From purchases 16 7 - -
From internal development 503 547 450 494
Amortisation and write-offs (380) (319) (333) (274)
Closing balance 2,228 2,089 2,061 1,944
Core Deposits
Opening balance 34 105 34 106
Amortisation (34) (71) (34) (72)
Closing balance - 34 - 34
Brand Names
Opening balance 189 189 186 186
Amortisation - - - -
Closing balance 189 189 186 186
Other Intangibles
Opening balance 59 78 14 17
Additions 2 2 - -
Disposals - (1) - -
Amortisation (19) (20) (5) (3)
Closing balance 42 59 9 14
(1) Includes foreign currency revaluation.

Notes to the Financial Statements
80 Commonwealth Bank of Australia – Annual Report 2016
Note 16 Other Assets
Group Bank
2016 2015 2016 2015
$M $M $M $M
Accrued interest receivable 2,312 2,164 3,118 2,988
Accrued fees/reimbursements receivable 1,110 1,247 157 147
Securities sold not delivered 2,177 2,483 1,726 1,874
Intragroup current tax receivable - - 213 200
Current tax assets 17 15 - -
Prepayments (1) 381 206 200 164
Life insurance other assets 537 497 39 37
Defined benefit superannuation plan surplus 261 276 261 276
Other 487 650 283 235
Total other assets 7,282 7,538 5,997 5,921
(1) Comparative information has been reclassified to conform to presentation in the current year.
Except for the defined benefits superannuation plan surplus, the above amounts are expected to be recovered within 12 months
of the Balance Sheet date.
Note 17 Deposits and Other Public Borrowings
Group Bank
2016 2015 2016 2015
$M $M $M $M
Australia
Certificates of deposit 43,762 46,083 45,639 47,802
Term deposits 138,443 143,285 138,664 143,481
On-demand and short-term deposits (1) (2) 281,648 265,620 281,059 265,798
Deposits not bearing interest (1) (2) 35,164 12,568 35,145 12,550
Securities sold under agreements to repurchase 17,124 12,964 17,305 13,036
Total Australia 516,141 480,520 517,812 482,667
Overseas
Certificates of deposit 9,098 7,060 6,254 4,980
Term deposits 32,069 30,812 9,359 8,508
On-demand and short term deposits 27,327 22,159 2,597 1,382
Deposits not bearing interest 3,410 2,668 64 76
Securities sold under agreements to repurchase - 12 - 12
Total overseas 71,904 62,711 18,274 14,958
Total external deposits and other public borrowings 588,045 543,231 536,086 497,625
(1) Comparative information has been restated to conform to presentation in the current year.
(2) During the period, following a change in terms, Interest bearing transaction deposits of $18,314 million became Non-interest bearing and have been disclosed accordingly.
The majority of the amounts are due to be settled within 12 months of the Balance Sheet date.
The contractual maturity profile of Certificates of deposit and Term deposits are shown in the table below:
Group
At 30 June 2016
Maturing Maturing Maturing Maturing
Three Between Between Six after
Months or Three and and Twelve Twelve
Less Six Months Months Months Total
$M $M $M $M $M
Australia
Certificates of deposit (1) 21,571 11,370 653 10,168 43,762
Term deposits 84,848 20,852 26,012 6,731 138,443
Total Australia 106,419 32,222 26,665 16,899 182,205
Overseas
Certificates of deposit (1) 6,906 1,452 532 208 9,098
Term deposits 16,534 7,815 4,851 2,869 32,069
Total overseas 23,440 9,267 5,383 3,077 41,167
Total certificates of deposits and term deposits 129,859 41,489 32,048 19,976 223,372
(1) All certificates of deposit issued by the Group are for amounts greater than $100,000.
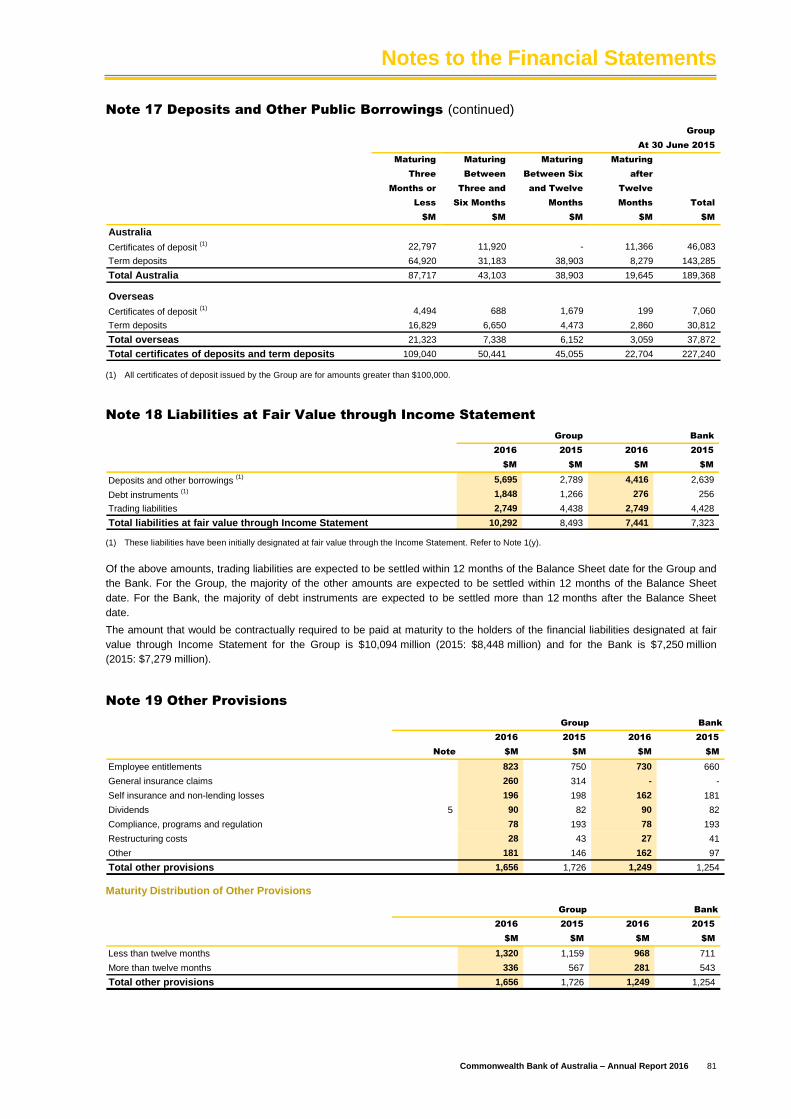
Notes to the Financial Statements
Commonwealth Bank of Australia – Annual Report 2016 81
Note 17 Deposits and Other Public Borrowings (continued)
Group
At 30 June 2015
Maturing Maturing Maturing Maturing
Three Between Between Six after
Months or Three and and Twelve Twelve
Less Six Months Months Months Total
$M $M $M $M $M
Australia
Certificates of deposit (1) 22,797 11,920 - 11,366 46,083
Term deposits 64,920 31,183 38,903 8,279 143,285
Total Australia 87,717 43,103 38,903 19,645 189,368
Overseas
Certificates of deposit (1) 4,494 688 1,679 199 7,060
Term deposits 16,829 6,650 4,473 2,860 30,812
Total overseas 21,323 7,338 6,152 3,059 37,872
Total certificates of deposits and term deposits 109,040 50,441 45,055 22,704 227,240
(1) All certificates of deposit issued by the Group are for amounts greater than $100,000.
Note 18 Liabilities at Fair Value through Income Statement
Group Bank
2016 2015 2016 2015
$M $M $M $M
Deposits and other borrowings (1) 5,695 2,789 4,416 2,639
Debt instruments (1) 1,848 1,266 276 256
Trading liabilities 2,749 4,438 2,749 4,428
Total liabilities at fair value through Income Statement 10,292 8,493 7,441 7,323
(1) These liabilities have been initially designated at fair value through the Income Statement. Refer to Note 1(y).
Of the above amounts, trading liabilities are expected to be settled within 12 months of the Balance Sheet date for the Group and
the Bank. For the Group, the majority of the other amounts are expected to be settled within 12 months of the Balance Sheet
date. For the Bank, the majority of debt instruments are expected to be settled more than 12 months after the Balance Sheet
date.
The amount that would be contractually required to be paid at maturity to the holders of the financial liabilities designated at fair
value through Income Statement for the Group is $10,094 million (2015: $8,448 million) and for the Bank is $7,250 million
(2015: $7,279 million).
Note 19 Other Provisions
Group Bank
2016 2015 2016 2015
Note $M $M $M $M
Employee entitlements 823 750 730 660
General insurance claims 260 314 - -
Self insurance and non-lending losses 196 198 162 181
Dividends 5 90 82 90 82
Compliance, programs and regulation 78 193 78 193
Restructuring costs 28 43 27 41
Other 181 146 162 97
Total other provisions 1,656 1,726 1,249 1,254
Maturity Distribution of Other Provisions
Group Bank
2016 2015 2016 2015
$M $M $M $M
Less than twelve months 1,320 1,159 968 711
More than twelve months 336 567 281 543
Total other provisions 1,656 1,726 1,249 1,254

Notes to the Financial Statements
82 Commonwealth Bank of Australia – Annual Report 2016
Note 19 Other Provisions (continued)
Group Bank
2016 2015 2016 2015
Reconciliation $M $M $M $M
General insurance claims:
Opening balance 314 161 - -
Additional provisions 502 615 - -
Amounts utilised during the year (556) (462) - -
Closing balance 260 314 - -
Self insurance and non-lending losses:
Opening balance 198 112 181 109
Additional provisions 15 90 15 76
Amounts utilised during the year (17) (4) (17) (4)
Release of provision - - (17) -
Closing balance 196 198 162 181
Compliance, programs and regulation:
Opening balance 193 49 193 49
Additional provisions - 218 - 218
Amounts utilised during the year (115) (74) (115) (74)
Closing balance 78 193 78 193
Restructuring:
Opening balance 43 60 41 57
Additional provisions - 3 - 3
Amounts utilised during the year (15) (20) (14) (19)
Closing balance 28 43 27 41
Other:
Opening balance 146 183 97 154
Additional provisions 60 22 85 2
Amounts utilised during the year (11) (21) (6) (21)
Release of provision (14) (38) (14) (38)
Closing balance 181 146 162 97
Provision Commentary
General Insurance Claims
This provision is to cover future claims on general insurance contracts that have been incurred but not reported. The provision will
be realised upon settlement of claims whose maturities were uncertain at the reporting date.
Self Insurance and Non-Lending Losses
Self insurance provision relates to non-transferred insurance risks on lending products the Group originates. The self insurance
provision is reassessed annually in accordance with actuarial advice.
This provision covers certain non-lending losses, including customer remediation, and represents losses that have not arisen as a
consequence of an impaired credit decision.
Compliance, Programs and Regulation
This provision relates to project and other administrative costs associated with certain compliance and regulatory programs of the
Group.
Restructuring
Provisions are recognised for restructuring activities when a detailed plan has been developed and a valid expectation that the
plan will be carried out is held by those affected by it. The majority of the provision is expected to be used within 12 months of the
Balance Sheet date.
Advice Review Programs
Certain remediation programs are being undertaken in the Group’s advice business as follows:
The Open Advice Review program for customers of Commonwealth Financial Planning Limited (CFPL) and Financial
Wisdom Limited (FWL), who received advice between 1 September 2003 and 1 July 2012. Registrations for the program are
now closed, with customer file assessments and remediation ongoing.
Variations to CFPL’s and FWL’s licences has led to a review of six customer files from each of the 17 advisers identified by
ASIC’s compliance expert. The review will confirm if the advice provided before 2012 was appropriate and whether further
reviews are required.
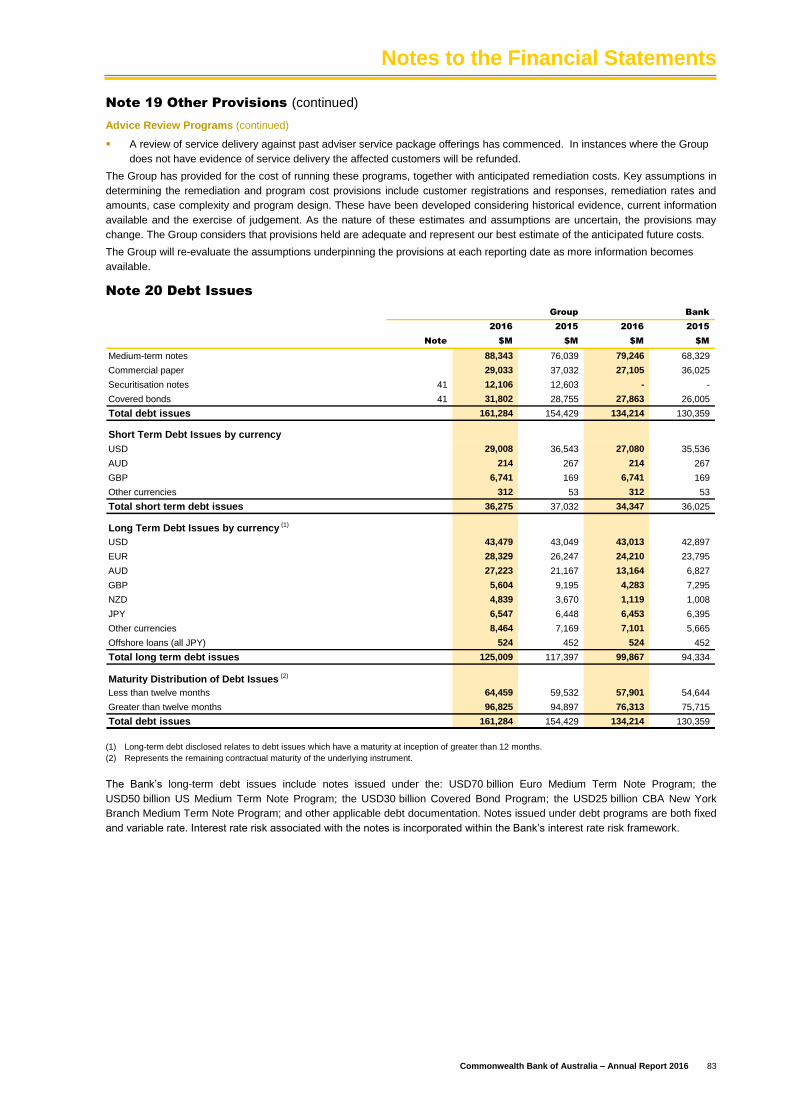
Notes to the Financial Statements
Commonwealth Bank of Australia – Annual Report 2016 83
Note 19 Other Provisions (continued)
Advice Review Programs (continued)
A review of service delivery against past adviser service package offerings has commenced. In instances where the Group
does not have evidence of service delivery the affected customers will be refunded.
The Group has provided for the cost of running these programs, together with anticipated remediation costs. Key assumptions in
determining the remediation and program cost provisions include customer registrations and responses, remediation rates and
amounts, case complexity and program design. These have been developed considering historical evidence, current information
available and the exercise of judgement. As the nature of these estimates and assumptions are uncertain, the provisions may
change. The Group considers that provisions held are adequate and represent our best estimate of the anticipated future costs.
The Group will re-evaluate the assumptions underpinning the provisions at each reporting date as more information becomes
available.
Note 20 Debt Issues
Group Bank
2016 2015 2016 2015
Note $M $M $M $M
Medium-term notes 88,343 76,039 79,246 68,329
Commercial paper 29,033 37,032 27,105 36,025
Securitisation notes 41 12,106 12,603 - -
Covered bonds 41 31,802 28,755 27,863 26,005
Total debt issues 161,284 154,429 134,214 130,359
Short Term Debt Issues by currency
USD 29,008 36,543 27,080 35,536
AUD 214 267 214 267
GBP 6,741 169 6,741 169
Other currencies 312 53 312 53
Total short term debt issues 36,275 37,032 34,347 36,025
Long Term Debt Issues by currency (1)
USD 43,479 43,049 43,013 42,897
EUR 28,329 26,247 24,210 23,795
AUD 27,223 21,167 13,164 6,827
GBP 5,604 9,195 4,283 7,295
NZD 4,839 3,670 1,119 1,008
JPY 6,547 6,448 6,453 6,395
Other currencies 8,464 7,169 7,101 5,665
Offshore loans (all JPY) 524 452 524 452
Total long term debt issues 125,009 117,397 99,867 94,334
Maturity Distribution of Debt Issues (2)
Less than twelve months 64,459 59,532 57,901 54,644
Greater than twelve months 96,825 94,897 76,313 75,715
Total debt issues 161,284 154,429 134,214 130,359
(1) Long-term debt disclosed relates to debt issues which have a maturity at inception of greater than 12 months.
(2) Represents the remaining contractual maturity of the underlying instrument.
The Bank’s long-term debt issues include notes issued under the: USD70 billion Euro Medium Term Note Program; the
USD50 billion US Medium Term Note Program; the USD30 billion Covered Bond Program; the USD25 billion CBA New York
Branch Medium Term Note Program; and other applicable debt documentation. Notes issued under debt programs are both fixed
and variable rate. Interest rate risk associated with the notes is incorporated within the Bank’s interest rate risk framework.

Notes to the Financial Statements
84 Commonwealth Bank of Australia – Annual Report 2016
Note 20 Debt Issues (continued)
Group
2016 2015 2014
Short term borrowings by Commercial paper program (1)
Total
Outstanding at year-end (2) 29,033 37,032 32,905
Maximum amount outstanding at any month end 41,453 39,774 33,174
Average amount outstanding 37,368 35,621 31,096
US Commercial Paper Program
Outstanding at year-end (2) 27,117 35,754 31,158
Maximum amount outstanding at any month end 38,528 38,147 32,405
Average amount outstanding 35,208 34,018 29,667
Weighted average interest rate on:
Average amount outstanding 0.5% 0.3% 0.2%
Outstanding at year end 0.8% 0.3% 0.2%
Euro Commercial Paper Program
Outstanding at year-end (2) 1,916 1,278 1,747
Maximum amount outstanding at any month end 2,925 2,327 1,983
Average amount outstanding 2,160 1,603 1,429
Weighted average interest rate on:
Average amount outstanding 0.7% 0.7% 0.4%
Outstanding at year end 0.9% 0.9% 0.4%
$M (except where indicated)
(1) Short term borrowings include callable medium term notes of $7,242 million which have been excluded from the table above.
(2) The amount outstanding at year end is measured at amortised cost.
As At As At
30 June 30 June
Currency 2016 2015
AUD 1.00 = USD 0.7431 0.7681
EUR 0.6689 0.6880
GBP 0.5534 0.4893
NZD 1.0470 1.1283
JPY 76.2441 94.0578
Exchange rates utilised (1)
(1) End of day, Sydney time.
Guarantee Arrangement
Guarantee under the Commonwealth Bank Sale Act
Historically, the due payment of all monies payable by the Bank was guaranteed by the Commonwealth of Australia under
section 117 of the Commonwealth Banks Act 1959 (as amended) at 30 June 1996. With the sale of the Commonwealth’s
shareholding in the Bank this guarantee has been progressively phased out under transitional arrangements found in the
Commonwealth Bank Sale Act 1995.
Demand deposits are no longer guaranteed by the Commonwealth under this guarantee. However, debt issues payable by the
Bank under a contract entered into prior to 19 July 1996 and outstanding at 19 July 1999 remain guaranteed until maturity.
Note 21 Bills Payable and Other Liabilities
Group Bank
2016 2015 2016 2015
Note $M $M $M $M
Bills payable 948 917 891 870
Accrued interest payable 2,659 2,971 1,925 2,220
Accrued fees and other items payable 2,453 2,718 1,755 1,822
Defined benefit superannuation plan deficit 35 51 57 51 57
Securities purchased not delivered 1,438 2,357 964 1,707
Unearned income 1,018 913 599 531
Life insurance other liabilities and claims payable 214 236 81 24
Other 993 936 5,376 7,130
Total bills payable and other liabilities 9,774 11,105 11,642 14,361
Other than the defined benefit superannuation plan deficit, the majority of the amounts are expected to be settled within
12 months of the Balance Sheet date.

Notes to the Financial Statements
Commonwealth Bank of Australia – Annual Report 2016 85
Note 22 Loan Capital
Group Bank
Currency 2016 2015 2016 2015
Amount (M) Footnotes $M $M $M $M
Tier 1 Loan Capital
Undated FRN USD 100 (1) 135 130 135 130
Undated PERLS III AUD 1,166 (2) - 1,164 - 1,163
Undated PERLS VI AUD 2,000 (3) 1,990 1,986 1,990 1,986
Undated PERLS VII AUD 3,000 (3) 2,978 2,961 2,978 2,961
Undated PERLS VIII AUD 1,450 (3) 1,437 - 1,437 -
Undated TPS USD 700 (4) - - - 908
Total Tier 1 Loan Capital 6,540 6,241 6,540 7,148
Tier 2 Loan Capital
AUD denominated (5) 1,772 1,024 1,772 1,024
USD denominated (6) 2,145 455 2,145 455
JPY denominated (7) 262 627 262 627
GBP denominated (8) 270 306 270 306
NZD denominated (9) 378 349 - -
EUR denominated (10) 3,351 3,256 3,351 3,256
Other currencies denominated (11) 202 209 202 209
Total Tier 2 Loan Capital 8,380 6,226 8,002 5,877
Fair value hedge adjustments 624 357 596 339
Total Loan Capital 15,544 12,824 15,138 13,364
As at the reporting date, there are no securities of the Group or the Bank that are contractually due for redemption in the next 12
months (note the Group has the right to call some securities earlier than the contractual maturity date).
(1) USD100 million Floating Rate Notes
On 15 October 1986, the State Bank of Victoria issued
USD125 million of floating rate notes current outstanding
balance of USD100 million. The floating rate notes are
perpetual but were able to be redeemed from October 1991.
They were assigned to the Bank on 1 January 1991.
The Bank entered into an agreement with the Commonwealth
of Australia on 31 December 1991 which provides that, if
certain events occur, the Bank may either issue CBA ordinary
shares to the Commonwealth of Australia, or (with the
consent of the Commonwealth of Australia) conduct a
renounceable rights issue for CBA ordinary shares to all
shareholders. The capital raised must be used to pay any
amounts due and payable on the floating rate notes.
The floating rate notes were issued into the international
markets and are subject to English law. They qualify as
Additional Tier 1 Capital of the Bank under the Basel III
transitional arrangements for capital instruments as
implemented by APRA.
(2) PERLS III
On 6 April 2006, a wholly owned entity of the Bank (Preferred
Capital Limited or “PCL”) issued $1,166 million of Perpetual
Exchangeable Repurchaseable Listed Shares (PERLS III).
PERLS III are preference shares which were able to be
exchanged for CBA ordinary shares or $200 cash each (or a
combination of both) on 6 April 2016. All PERLS III were
exchanged for cash on 6 April 2016 and subsequently
cancelled.
(3) PERLS VI, PERLS VII and PERLS VIII
On 17 October 2012, the Bank issued $2,000 million of
Perpetual Exchangeable Resaleable Listed Securities
(PERLS VI). On 1 October 2014, the Bank issued
$3,000 million of CommBank PERLS VII Capital Notes
(PERLS VII). On 30 March 2016, the Bank issued
$1,450 million of CommBank PERLS VIII Capital Notes
(PERLS VIII). PERLS VI, PERLS VII and PERLS VIII are
subordinated, unsecured notes.
PERLS VI, PERLS VII and PERLS VIII are listed on the ASX
and are subject to New South Wales law. They qualify as
Additional Tier 1 Capital of the Bank under Basel III as
implemented by APRA.
(4) TPS 2006
On 15 March 2006, a wholly owned entity of the Bank (CBA
Capital Trust II) issued USD700 million of Trust Preferred
Securities (TPS 2006) which were able to be redeemed for
cash, CBA Tier 1 Capital securities or CBA preference shares
on 15 March 2016.
All TPS 2006 were redeemed for cash on 15 March 2016.
(5) AUD denominated Tier 2 Loan Capital issuances
$25 million subordinated floating rate notes, issued April 1999, due April 2029;
$1,000 million subordinated notes issued November 2014, due November 2024; and
$750 million subordinated notes issued June 2016, due June 2026.
(6) USD denominated Tier 2 Loan Capital issuances
USD350 million subordinated fixed rate notes, issued June 2003, due June 2018; and
USD1,250 million subordinated notes issued December 2015, due December 2025.
(7) JPY denominated Tier 2 Loan Capital issuances
JPY20 billion perpetual subordinated EMTN (Euro Medium Term Notes), issued February 1999;
JPY30 billion subordinated EMTN, issued October 1995, and redeemed in October 2015; and
JPY9 billion perpetual subordinated notes, issued May 1996, and redeemed in May 2016.
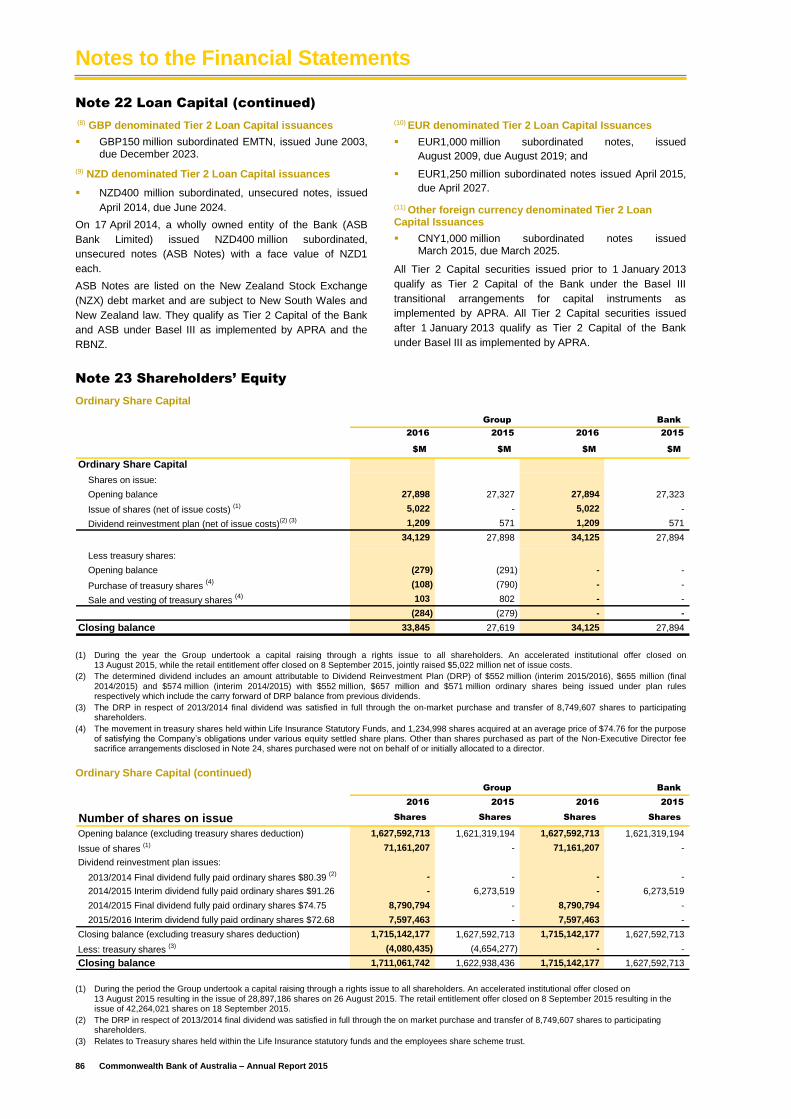
Notes to the Financial Statements
86 Commonwealth Bank of Australia – Annual Report 2015
Note 22 Loan Capital (continued)
(8) GBP denominated Tier 2 Loan Capital issuances
GBP150 million subordinated EMTN, issued June 2003, due December 2023.
(9) NZD denominated Tier 2 Loan Capital issuances
NZD400 million subordinated, unsecured notes, issued
April 2014, due June 2024.
On 17 April 2014, a wholly owned entity of the Bank (ASB
Bank Limited) issued NZD400 million subordinated,
unsecured notes (ASB Notes) with a face value of NZD1
each.
ASB Notes are listed on the New Zealand Stock Exchange
(NZX) debt market and are subject to New South Wales and
New Zealand law. They qualify as Tier 2 Capital of the Bank
and ASB under Basel III as implemented by APRA and the
RBNZ.
(10) EUR denominated Tier 2 Loan Capital Issuances
EUR1,000 million subordinated notes, issued
August 2009, due August 2019; and
EUR1,250 million subordinated notes issued April 2015,
due April 2027.
(11) Other foreign currency denominated Tier 2 Loan Capital Issuances
CNY1,000 million subordinated notes issued March 2015, due March 2025.
All Tier 2 Capital securities issued prior to 1 January 2013
qualify as Tier 2 Capital of the Bank under the Basel III
transitional arrangements for capital instruments as
implemented by APRA. All Tier 2 Capital securities issued
after 1 January 2013 qualify as Tier 2 Capital of the Bank
under Basel III as implemented by APRA.
Note 23 Shareholders’ Equity
Ordinary Share Capital
Group Bank
2016 2015 2016 2015
$M $M $M $M
Ordinary Share Capital
Shares on issue:
Opening balance 27,898 27,327 27,894 27,323
Issue of shares (net of issue costs) (1) 5,022 - 5,022 -
Dividend reinvestment plan (net of issue costs)(2) (3) 1,209 571 1,209 571
34,129 27,898 34,125 27,894
Less treasury shares:
Opening balance (279) (291) - -
Purchase of treasury shares (4) (108) (790) - -
Sale and vesting of treasury shares (4) 103 802 - -
(284) (279) - -
Closing balance 33,845 27,619 34,125 27,894
(1) During the year the Group undertook a capital raising through a rights issue to all shareholders. An accelerated institutional offer closed on 13 August 2015, while the retail entitlement offer closed on 8 September 2015, jointly raised $5,022 million net of issue costs.
(2) The determined dividend includes an amount attributable to Dividend Reinvestment Plan (DRP) of $552 million (interim 2015/2016), $655 million (final 2014/2015) and $574 million (interim 2014/2015) with $552 million, $657 million and $571 million ordinary shares being issued under plan rules respectively which include the carry forward of DRP balance from previous dividends.
(3) The DRP in respect of 2013/2014 final dividend was satisfied in full through the on-market purchase and transfer of 8,749,607 shares to participating shareholders.
(4) The movement in treasury shares held within Life Insurance Statutory Funds, and 1,234,998 shares acquired at an average price of $74.76 for the purpose of satisfying the Company’s obligations under various equity settled share plans. Other than shares purchased as part of the Non-Executive Director fee sacrifice arrangements disclosed in Note 24, shares purchased were not on behalf of or initially allocated to a director.
Ordinary Share Capital (continued)
Group Bank
2016 2015 2016 2015
Number of shares on issue Shares Shares Shares Shares
Opening balance (excluding treasury shares deduction) 1,627,592,713 1,621,319,194 1,627,592,713 1,621,319,194
Issue of shares (1) 71,161,207 - 71,161,207 -
Dividend reinvestment plan issues:
2013/2014 Final dividend fully paid ordinary shares $80.39 (2) - - - -
2014/2015 Interim dividend fully paid ordinary shares $91.26 - 6,273,519 - 6,273,519
2014/2015 Final dividend fully paid ordinary shares $74.75 8,790,794 - 8,790,794 -
2015/2016 Interim dividend fully paid ordinary shares $72.68 7,597,463 - 7,597,463 -
Closing balance (excluding treasury shares deduction) 1,715,142,177 1,627,592,713 1,715,142,177 1,627,592,713
Less: treasury shares (3) (4,080,435) (4,654,277) - -
Closing balance 1,711,061,742 1,622,938,436 1,715,142,177 1,627,592,713
(1) During the period the Group undertook a capital raising through a rights issue to all shareholders. An accelerated institutional offer closed on
13 August 2015 resulting in the issue of 28,897,186 shares on 26 August 2015. The retail entitlement offer closed on 8 September 2015 resulting in the issue of 42,264,021 shares on 18 September 2015.
(2) The DRP in respect of 2013/2014 final dividend was satisfied in full through the on market purchase and transfer of 8,749,607 shares to participating shareholders.
(3) Relates to Treasury shares held within the Life Insurance statutory funds and the employees share scheme trust.

Notes to the Financial Statements
Commonwealth Bank of Australia – Annual Report 2016 87
Note 23 Shareholders’ Equity (continued)
Ordinary shares have no par value and the Company does not have a limited amount of share capital.
Ordinary shares entitle holders to receive dividends payable to ordinary shareholders and to participate in the proceeds available
to ordinary shareholders on winding up of the Company in proportion to the number of fully paid ordinary shares held.
On a show of hands every holder of fully paid ordinary shares present at a meeting in person or by proxy is entitled to one vote,
and upon a poll one vote for each share held.
Other Equity Instruments
Group Bank
2016 2015 2016 2015
Other equity instruments $M $M $M $M
Issued and paid up - 939 406 1,895
Shares Shares Shares Shares
Number of shares - 700,000 300,000 1,400,000
On 15 March 2006, a wholly owned entity of the Bank (CBA Capital Trust II) issued USD700 million of Trust Preferred Securities
(TPS 2006) into the US capital markets. All TPS 2006 were redeemed for cash on 15 March 2016. Shares issued by the Bank
were partially redeemed on 15 March 2016.
Retained Profits and Reserves
Group Bank
2016 2015 2016 2015
Retained Profits Note $M $M $M $M
Opening balance 21,528 18,827 18,763 16,206
Actuarial gains and (losses) from defined benefit superannuation plans 10 311 10 311
Gains and (losses) on liabilities at fair value due to changes in own credit risk (1) (3) (1) (3)
Realised gains and dividend income on treasury shares 20 42 - -
Operating profit attributable to Equity holders of the Bank 9,227 9,063 8,639 8,976
Total available for appropriation 30,784 28,240 27,411 25,490
Transfer on sale/redemption of other equity (1) (10) - - -
Transfers (to)/from general reserve (120) 47 (4) (1)
Transfers from asset revaluation reserve 19 21 19 18
Transfers from employee compensation reserve (2) - (2) -
Interim dividend - cash component (2,829) (2,636) (2,829) (2,636)
Interim dividend - Dividend Reinvestment Plan (552) (574) (552) (574)
Final dividend - cash component (2,958) (3,534) (2,958) (3,534)
Final dividend - Dividend Reinvestment Plan (655) - (655) -
Other dividends (2) (50) (36) - -
Closing balance 23,627 21,528 20,430 18,763
(1) Includes other equity instruments and non-controlling interests.
(2) Dividends relating to equity instruments on issue other than ordinary shares.

Notes to the Financial Statements
88 Commonwealth Bank of Australia – Annual Report 2016
Note 23 Shareholders’ Equity (continued)
Retained Profits and Reserves (continued)
Group Bank
2016 2015 2016 2015
Reserves $M $M $M $M
General Reserve
Opening balance 819 866 574 573
Appropriation from/(to) retained profits 120 (47) 4 1
Closing balance 939 819 578 574
Capital Reserve
Opening balance - - 1,254 1,254
Closing balance - - 1,254 1,254
Asset Revaluation Reserve
Opening balance 191 197 165 172
Revaluation of properties 2 19 1 16
Transfer to retained profits (19) (21) (19) (18)
Tax on revaluation of properties (1) (4) - (5)
Closing balance 173 191 147 165
Foreign Currency Translation Reserve
Opening balance 356 (42) (7) (178)
Currency translation adjustments of foreign operations 389 439 62 176
Currency translation on net investment hedge (12) (3) (9) (5)
Tax on translation adjustments 6 (38) - -
Closing balance 739 356 46 (7)
Cash Flow Hedge Reserve
Opening balance 263 224 530 424
Gains and losses on cash flow hedging instruments:
Recognised in other comprehensive income 250 706 479 802
Transferred to Income Statement:
Interest income (968) (1,135) (916) (1,125)
Interest expense 1,018 488 725 475
Tax on cash flow hedging instruments (90) (20) (86) (46)
Closing balance 473 263 732 530
Employee Compensation Reserve
Opening balance 122 125 122 125
Current period movement 10 (3) 10 (3)
Closing balance 132 122 132 122
Available-for-Sale Investments Reserve
Opening balance 594 639 557 641
Net gains and losses on revaluation of available-for-sale investments (236) 140 (248) 82
Net gains and losses on available-for-sale investments transferred to
Income Statement on disposal (222) (223) (222) (218)
Tax on available-for-sale investments 142 38 139 52
Closing balance 278 594 226 557
Total Reserves 2,734 2,345 3,115 3,195

Notes to the Financial Statements
Commonwealth Bank of Australia – Annual Report 2016 89
Note 24 Share-Based Payments
The Group operates a number of cash and equity settled share plans as detailed below.
Group Leadership Reward Plan (GLRP)
The GLRP is the Group’s long-term incentive plan for the CEO and Group Executives. The GLRP focuses on driving performance
and shareholder alignment in the longer term.
Participants are awarded a maximum number of Reward Rights, which may convert into CBA shares on a 1-for-1 basis. The
Board has discretion to apply a cash equivalent.
The Reward Rights may vest at the end of a performance period of up to four years subject to the satisfaction of performance
hurdles as follows:
25% of the award is assessed against Customer Satisfaction compared to ANZ, NAB, Westpac and other key competitors
for the Group’s wealth management business by reference to independent external surveys; and
75% of the award is assessed against TSR compared to the 20 largest companies listed on the ASX (by market
capitalisation) at the beginning of each respective performance period, excluding resource companies and CBA.
Each performance hurdle is independent, such that the total number of Reward Rights that vest will be the aggregate of rights
that vest against the Customer Satisfaction and the TSR hurdles at the end of the performance period.
A scale is applied to each performance hurdle, to determine the portion of each award that vests as follows:
Hurdle Scale
Customer
satisfaction
100% vests where the weighted average ranking for CBA over the performance period is 1st (i.e. 1.00),
50% where CBA’s weighted average ranking is 2nd (i.e. 2.00). If CBA’s weighted average ranking is
between 1st and 2nd (i.e. between 1.00 and 2.00), vesting occurs on a sliding scale between 100% and
50% on a pro-rata straight line basis. If CBA’s weighted average ranking is lower than 2nd (i.e. greater
than 2.00), none of this portion will vest.
TSR Full vesting applies where CBA is ranked in the top quartile of the peer group at the end of the
performance period, 50% will vest if CBA is ranked at the median, with vesting on a sliding scale between
the median and 75th percentile. If the Group’s TSR is ranked below the median of the peer group, none
of this portion will vest.
The 2012 financial year award reached the end of its performance period on 30 June 2015 and in line with the plan rules 86.25%
of the awarded rights vested.
The following table provides details of outstanding awards of performance rights granted under the GLRP.
Outstanding Outstanding Expense
Period 1 July Granted Vested Forfeited 30 June ($M)
2016 1,265,446 291,188 (263,969) (42,076) 1,250,589 13
2015 1,423,773 283,410 (338,512) (103,225) 1,265,446 10
The average fair value at the grant date for TSR and Customer satisfaction Reward Rights issued during the year was $75.21 and
$32.96 respectively per right (2015: $78.97 and $37.90 respectively). The fair value of TSR hurdled Reward Rights granted during
the period has been independently calculated at grant date using a Monte-Carlo pricing model. The assumptions included in the
valuation of the 2016 financial year award include a risk-free interest rate ranging from 2.14% to 2.35%, a nil dividend yield on the
Bank’s ordinary shares and a volatility in the Bank share price of 20%. The fair value for customer satisfaction hurdled Reward
Rights granted during the period is the closing price of CBA shares on the grant date.
Group Rights Plan (GRP)
The GRP facilitates mandatory short-term incentive deferral, sign-on incentives and retention awards. Participants are awarded
rights to shares, that vest on a 1-for-1 basis, provided the participant remains in employment of the Group until vesting date. The
Board has discretion to apply a cash equivalent.
The following table provides details of outstanding awards of shares granted under the GRP.
Outstanding Outstanding Expense
Period1 July Granted Vested Forfeited 30 June ($M)
2016 1,238,974 825,705 (181,138) (87,813) 1,795,728 53
2015 654,116 708,577 (80,271) (43,448) 1,238,974 40
The weighted average fair value at grant date of the awards issued during the year was $74.11 (2015: $81.44).
Employee Share Acquisition Plan (ESAP)
Under the ESAP eligible employees have the opportunity to receive up to $1,000 worth of shares each year if the Group meets
the required performance hurdle of growth in the Group’s net profit after tax (“cash basis”). If the hurdle is not met, the Board has
discretion to determine whether a full award, a partial award or no award is made.

Notes to the Financial Statements
90 Commonwealth Bank of Australia – Annual Report 2016
Note 24 Share-Based Payments (continued)
The number of shares a participant receives is calculated by dividing the award amount by the average price paid for CBA shares
purchased during the purchase period preceding the grant date. Shares granted are restricted from sale until the earlier of three
years or until such time as the participant ceases employment with the Group. Participants receive full dividend entitlements and
voting rights attached to those shares.
The Group achieved the performance target for 2015 resulting in shares being awarded to each eligible employee during the
financial year ended 30 June 2016. The following table provides details of shares granted under the ESAP.
Number of Shares Total Number Total
Period Allocation date Participants Allocated by Participant of Shares Allocated Issue Price $ Fair Value $
2016 17 Sep 2015 32,336 13 420,368 74.88 31,477,156
2015 19 Sep 2014 32,092 12 385,104 80.39 30,958,511
It is estimated that approximately $34 million of CBA shares will be purchased on market at the prevailing market price for the
2016 grant.
Other Employee Awards
A number of other plans are operated by the Group, including:
The Employee Share (Performance Unit) Plan, which is the cash-based version of the GRP;
The International Employee Share Acquisition Plan, which is the cash-based version of the ESAP; and
The Employee Share Plan and Group Employee Rights Plan, which are predecessors to the GRP, and closed to new
awards.
The following table provides a summary of the movement in awards during the year.
Outstanding Outstanding Expense
Period1 July Granted Vested Forfeited 30 June ($M)
2016 677,708 209,170 (573,959) (14,226) 298,693 10
2015 1,423,891 105,323 (811,721) (39,785) 677,708 18
The average fair value at grant date of the awards issued during the year was $74.86 (2015: $81.46).
Salary Sacrifice Arrangements
The Group facilitates the purchase of CBA shares via salary sacrifice as follows:
Type Arrangements
Australian-based
employees
(ESSSP)
Can elect to sacrifice between $2,000 and $5,000 p.a. of their fixed remuneration and/or annual STI
Restricted from sale for a minimum of two years and a maximum of seven years or earlier, if the
employee ceases employment with the Group.
Non-executive
directors
Required to defer 20% of post-tax fees until a minimum shareholding requirement of 5,000 shares is
reached.
Restricted from sale for ten years or when the Non-Executive Director retires from the Board earlier.
Shares are purchased on market at the prevailing market price at that time and receive full dividend entitlements and voting
rights. The following table provides details of shares granted under the ESSSP.
Number of Average purchase Total purchase
Period Participants shares purchased price $ consideration $
2016 775 36,264 75.66 2,743,646
2015 557 22,059 84.53 1,864,604
During the year, one (2015: one) Non-Executive Director applied $28,994 in fees (2015: $28,502) to purchase 382 shares
(2015: 341 shares).
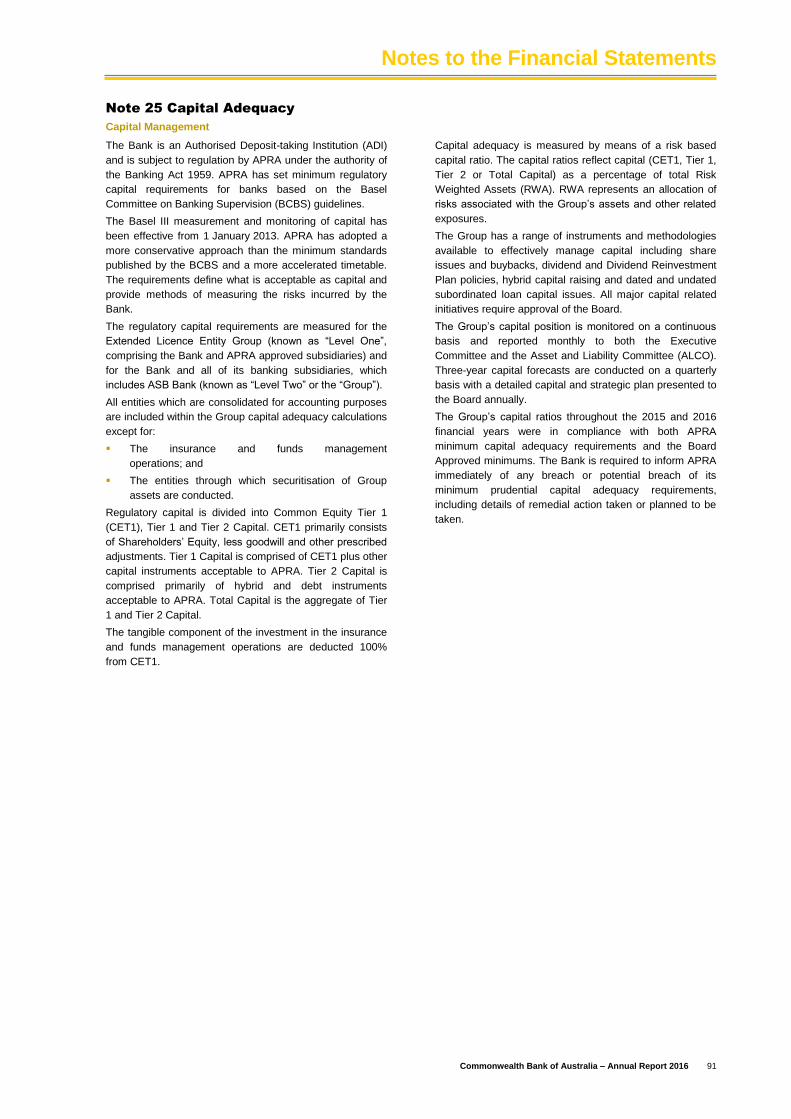
Notes to the Financial Statements
Commonwealth Bank of Australia – Annual Report 2016 91
Note 25 Capital Adequacy
Capital Management
The Bank is an Authorised Deposit-taking Institution (ADI)
and is subject to regulation by APRA under the authority of
the Banking Act 1959. APRA has set minimum regulatory
capital requirements for banks based on the Basel
Committee on Banking Supervision (BCBS) guidelines.
The Basel III measurement and monitoring of capital has
been effective from 1 January 2013. APRA has adopted a
more conservative approach than the minimum standards
published by the BCBS and a more accelerated timetable.
The requirements define what is acceptable as capital and
provide methods of measuring the risks incurred by the
Bank.
The regulatory capital requirements are measured for the
Extended Licence Entity Group (known as “Level One”,
comprising the Bank and APRA approved subsidiaries) and
for the Bank and all of its banking subsidiaries, which
includes ASB Bank (known as “Level Two” or the “Group”).
All entities which are consolidated for accounting purposes
are included within the Group capital adequacy calculations
except for:
The insurance and funds management
operations; and
The entities through which securitisation of Group
assets are conducted.
Regulatory capital is divided into Common Equity Tier 1
(CET1), Tier 1 and Tier 2 Capital. CET1 primarily consists
of Shareholders’ Equity, less goodwill and other prescribed
adjustments. Tier 1 Capital is comprised of CET1 plus other
capital instruments acceptable to APRA. Tier 2 Capital is
comprised primarily of hybrid and debt instruments
acceptable to APRA. Total Capital is the aggregate of Tier
1 and Tier 2 Capital.
The tangible component of the investment in the insurance
and funds management operations are deducted 100%
from CET1.
Capital adequacy is measured by means of a risk based
capital ratio. The capital ratios reflect capital (CET1, Tier 1,
Tier 2 or Total Capital) as a percentage of total Risk
Weighted Assets (RWA). RWA represents an allocation of
risks associated with the Group’s assets and other related
exposures.
The Group has a range of instruments and methodologies
available to effectively manage capital including share
issues and buybacks, dividend and Dividend Reinvestment
Plan policies, hybrid capital raising and dated and undated
subordinated loan capital issues. All major capital related
initiatives require approval of the Board.
The Group’s capital position is monitored on a continuous
basis and reported monthly to both the Executive
Committee and the Asset and Liability Committee (ALCO).
Three-year capital forecasts are conducted on a quarterly
basis with a detailed capital and strategic plan presented to
the Board annually.
The Group’s capital ratios throughout the 2015 and 2016
financial years were in compliance with both APRA
minimum capital adequacy requirements and the Board
Approved minimums. The Bank is required to inform APRA
immediately of any breach or potential breach of its
minimum prudential capital adequacy requirements,
including details of remedial action taken or planned to be
taken.
Notes to the Financial Statements
92 Commonwealth Bank of Australia – Annual Report 2016
Note 26 Financial Reporting by Segments
The principal activities of the Group are carried out in the
business segments below. These segments are based on the
distribution channels through which the customer relationship
is being managed.
During the year, refinements have been made to the
allocation of customer balances and associated revenue and
expenses between business segments, including updated
transfer pricing allocations and realignment between
Institutional Banking and Markets and Group Treasury.
Finally, ASB’s interest expense disclosure was changed to
include the impact of hedging offshore debt. These changes
have not impacted the Group’s net profit, but have resulted in
changes to the presentation of the Income Statement and
Balance Sheet of the Group and the affected segments.
Comparative information has been restated to reflect these
changes.
The primary sources of revenue are interest and fee income
(Retail Banking Services, Institutional Banking and Markets,
Business and Private Banking, Bankwest, New Zealand, IFS
and Other Divisions) and insurance premium and funds
management income (Wealth Management, New Zealand,
IFS and Other Divisions).
Revenues and expenses occurring between segments are
subject to transfer pricing arrangements. All intra-group profits
are eliminated on consolidation.
Business segments are managed on the basis of net profit
after income tax (“cash basis”). Management uses “cash
basis” to assess performance and it provides the basis for the
determination of the Bank’s dividends. The “cash basis”
presents a clear view of the Group’s underlying operating
results, excluding a number of items that introduce volatility
and/or one-off distortions of the Group’s current period
performance. These items, such as hedging and IFRS
volatility, are calculated consistently year on year and do not
discriminate between positive and negative adjustments.
(i) Retail Banking Services
Retail Banking Services provides home loan, consumer
finance and retail deposit products and servicing to all Retail
bank customers and non-relationship managed small
business customers. In addition, commission is received for
the distribution of Wealth Management products through the
retail distribution network.
(ii) Business and Private Banking
Business and Private Banking provides specialised banking
services to relationship managed business and Agribusiness
customers, private banking to high net worth individuals and
margin lending and trading through CommSec.
(iii) Institutional Banking and Markets
Institutional Banking and Markets services the Group’s major
corporate, institutional and government clients using a
relationship management model based on industry expertise
and insights. The client offering includes debt raising,
financial and commodities price risk management and
transactional banking capabilities. The institutional equities
business ceased operations during the year. Institutional
Banking and Markets has international operations in London,
New York, Houston, Japan, Singapore, Malta, Hong Kong,
New Zealand, Beijing and Shanghai.
(iv) Wealth Management
Wealth Management includes Global Asset Management
(including operations in Asia and Europe), Platform
Administration and Financial Advice and Life and General
Insurance businesses of the Australian operations.
(v) New Zealand
New Zealand includes the Banking, Funds Management and
Insurance businesses operating in New Zealand (excluding
Institutional Banking and Markets).
(vi) Bankwest
Bankwest is active in all domestic market segments, with
lending diversified between the business, rural, housing and
personal markets, including a full range of deposit products.
(vii) IFS and Other Divisions
The following parts of the business are included in IFS and
Other Divisions:
International Financial Services incorporates the Asian
retail and business banking operations (Indonesia,
China, India and Vietnam), investments in Chinese and
Vietnamese banks, the joint venture Chinese life
insurance business, the life insurance operations in
Indonesia and a financial services technology business
in South Africa. It does not include the Business and
Private Banking, Institutional Banking and Markets and
Colonial First State Global Asset Management
businesses in Asia;
Corporate Centre includes the results of unallocated
Group support functions such as Investor Relations,
Group Strategy, Marketing, Secretariat and Treasury;
and
Group wide Eliminations/Unallocated includes intra-
group elimination entries arising on consolidation,
centrally raised provisions and other unallocated
revenue and expenses.

Notes to the Financial Statements
Commonwealth Bank of Australia – Annual Report 2016 93
Note 26 Financial Reporting by Segments (continued)
2016
Retail Business and Institutional
Banking Private Banking and Wealth New IFS and
Services Banking Markets Management Zealand Bankwest Other Total
$M $M $M $M $M $M $M $M
Net interest income 8,599 3,049 1,565 - 1,575 1,638 509 16,935
Other banking income 1,762 859 1,288 - 288 217 446 4,860
Total banking income 10,361 3,908 2,853 - 1,863 1,855 955 21,795
Funds management income - - - 1,891 80 - 45 2,016
Insurance income - - - 502 242 - 51 795
Total operating income 10,361 3,908 2,853 2,393 2,185 1,855 1,051 24,606
Investment experience (1) - - - 122 16 - 3 141
Total net operating income before impairment and operating
expenses 10,361 3,908 2,853 2,515 2,201 1,855 1,054 24,747
Operating expenses (3,373) (1,489) (1,081) (1,676) (889) (773) (1,148) (10,429)
Loan impairment expense (660) (179) (252) - (120) 10 (55) (1,256)
Net profit before income tax 6,328 2,240 1,520 839 1,192 1,092 (149) 13,062
Corporate tax expense (1,892) (673) (356) (222) (315) (329) 195 (3,592)
Non-controlling interests - - - - - - (20) (20)
Net profit after tax - "cash basis" (2) 4,436 1,567 1,164 617 877 763 26 9,450
Hedging and IFRS volatility - - - - (139) - (61) (200)
Other non-cash items - - - 4 - (27) - (23)
Net profit after tax - "statutory basis" 4,436 1,567 1,164 621 738 736 (35) 9,227
Additional information
Amortisation and depreciation (206) (86) (124) (39) (77) (60) (157) (749)
Balance Sheet
Total assets 331,818 104,211 182,199 21,080 80,386 82,880 130,504 933,078
Total liabilities 237,765 76,690 154,769 26,119 73,831 51,100 252,048 872,322
(1) Investment experience is presented on a pre-tax basis.
(2) This balance excludes non-cash items, including unrealised gains and losses relating to hedging and IFRS volatility ($200 million expense), Bankwest non-cash items ($27 million expense) and treasury shares valuation adjustment ($4 million gain).

Notes to the Financial Statements
94 Commonwealth Bank of Australia – Annual Report 2016
Note 26 Financial Reporting by Segments (continued)
2015 (1)
Retail Business and Institutional
Banking Private Banking and Wealth New IFS and
Services Banking Markets Management Zealand Bankwest Other Total
$M $M $M $M $M $M $M $M
Net interest income 7,848 2,925 1,442 - 1,533 1,658 421 15,827
Other banking income 1,754 793 1,360 - 280 216 408 4,811
Total banking income 9,602 3,718 2,802 - 1,813 1,874 829 20,638
Funds management income - - - 1,846 71 - 21 1,938
Insurance income - - - 503 232 - 57 792
Total operating income 9,602 3,718 2,802 2,349 2,116 1,874 907 23,368
Investment experience (2) - - - 231 12 - (33) 210
Total net operating income before impairment and operating
expenses 9,602 3,718 2,802 2,580 2,128 1,874 874 23,578
Operating expenses (3,276) (1,428) (970) (1,726) (861) (787) (945) (9,993)
Loan impairment expense (626) (152) (167) - (83) 50 (10) (988)
Net profit before income tax 5,700 2,138 1,665 854 1,184 1,137 (81) 12,597
Corporate tax expense (1,706) (643) (380) (201) (302) (342) 135 (3,439)
Non-controlling interests - - - - - - (21) (21)
Net profit after tax - "cash basis" (3) 3,994 1,495 1,285 653 882 795 33 9,137
Hedging and IFRS volatility - - - - 43 - (37) 6
Other non-cash items - - - (28) - (52) - (80)
Net profit after tax - "statutory basis" 3,994 1,495 1,285 625 925 743 (4) 9,063
Additional information
Amortisation and depreciation (185) (84) (65) (33) (78) (112) (155) (712)
Balance Sheet
Total assets 309,543 98,990 164,963 20,792 69,608 79,489 130,061 873,446
Total liabilities 221,950 71,106 143,161 24,655 62,488 49,499 247,594 820,453
(1) Comparative information has been restated to conform to presentation in the current year.
(2) Investment experience is presented on a pre-tax basis.
(3) This balance excludes non-cash items, including unrealised gains and losses relating to hedging and IFRS volatility ($6 million gain), Bankwest non-cash items ($52 million expense) and treasury shares valuation adjustment ($28 million expense).
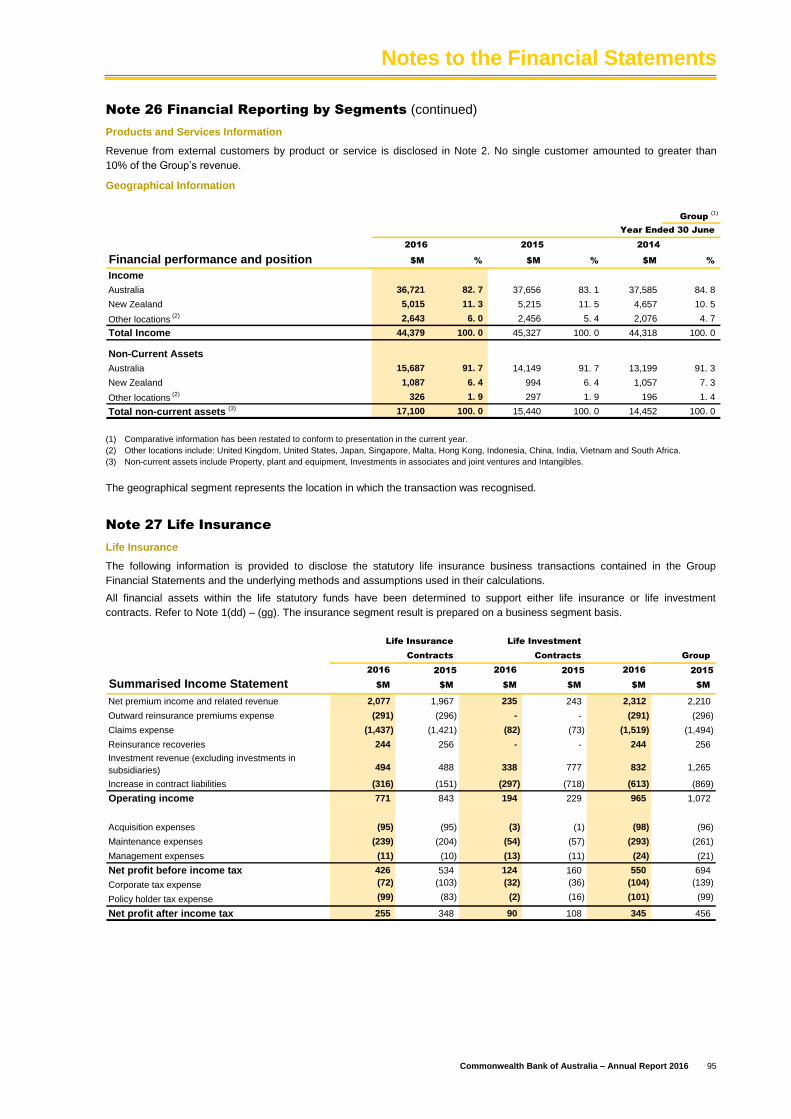
Notes to the Financial Statements
Commonwealth Bank of Australia – Annual Report 2016 95
Note 26 Financial Reporting by Segments (continued)
Products and Services Information
Revenue from external customers by product or service is disclosed in Note 2. No single customer amounted to greater than
10% of the Group’s revenue.
Geographical Information
Group (1)
Year Ended 30 June
2016 2015 2014
Financial performance and position $M % $M % $M %
Income
Australia 36,721 82. 7 37,656 83. 1 37,585 84. 8
New Zealand 5,015 11. 3 5,215 11. 5 4,657 10. 5
Other locations (2) 2,643 6. 0 2,456 5. 4 2,076 4. 7
Total Income 44,379 100. 0 45,327 100. 0 44,318 100. 0
Non-Current Assets
Australia 15,687 91. 7 14,149 91. 7 13,199 91. 3
New Zealand 1,087 6. 4 994 6. 4 1,057 7. 3
Other locations (2) 326 1. 9 297 1. 9 196 1. 4
Total non-current assets (3) 17,100 100. 0 15,440 100. 0 14,452 100. 0
(1) Comparative information has been restated to conform to presentation in the current year.
(2) Other locations include: United Kingdom, United States, Japan, Singapore, Malta, Hong Kong, Indonesia, China, India, Vietnam and South Africa.
(3) Non-current assets include Property, plant and equipment, Investments in associates and joint ventures and Intangibles.
The geographical segment represents the location in which the transaction was recognised.
Note 27 Life Insurance
Life Insurance
The following information is provided to disclose the statutory life insurance business transactions contained in the Group
Financial Statements and the underlying methods and assumptions used in their calculations.
All financial assets within the life statutory funds have been determined to support either life insurance or life investment
contracts. Refer to Note 1(dd) – (gg). The insurance segment result is prepared on a business segment basis.
Life Insurance Life Investment
Contracts Contracts Group
2016 2015 2016 2015 2016 2015
Summarised Income Statement $M $M $M $M $M $M
Net premium income and related revenue 2,077 1,967 235 243 2,312 2,210
Outward reinsurance premiums expense (291) (296) - - (291) (296)
Claims expense (1,437) (1,421) (82) (73) (1,519) (1,494)
Reinsurance recoveries 244 256 - - 244 256
Investment revenue (excluding investments in
subsidiaries) 494 488 338 777 832 1,265
Increase in contract liabilities (316) (151) (297) (718) (613) (869)
Operating income 771 843 194 229 965 1,072
Acquisition expenses (95) (95) (3) (1) (98) (96)
Maintenance expenses (239) (204) (54) (57) (293) (261)
Management expenses (11) (10) (13) (11) (24) (21)
Net profit before income tax 426 534 124 160 550 694
Corporate tax expense (72) (103) (32) (36) (104) (139)
Policy holder tax expense (99) (83) (2) (16) (101) (99)
Net profit after income tax 255 348 90 108 345 456

Notes to the Financial Statements
96 Commonwealth Bank of Australia – Annual Report 2016
Note 27 Life Insurance (continued)
Life Insurance Life Investment
Contracts Contracts Group
2016 2015 2016 2015 2016 2015
Sources of life insurance net profit $M $M $M $M $M $M
The net profit after income tax is represented by:
Emergence of planned profit margins 269 257 94 108 363 365
Difference between actual and planned experience (43) (20) (3) - (46) (20)
Effects of changes to underlying assumptions (2) 1 - - (2) 1
Reversal of previously recognised losses or loss recognition on
groups of related products (60) 1 (2) (1) (62) -
Investment earnings on assets in excess of policyholder
liabilities 70 107 1 1 71 108
Other movements 21 2 - - 21 2
Net profit after income tax 255 348 90 108 345 456
Life insurance premiums received and receivable 2,460 2,377 501 433 2,961 2,810
Life insurance claims paid and payable 1,480 1,478 1,243 1,296 2,723 2,774
The disclosure of the components of net profit after income tax is required to be separated between policyholders’ and
shareholders’ interests. As policyholder profits are an expense of the Group and not attributable to shareholders, no such
disclosure is required.
Life Insurance Life Investment
Contracts Contracts Group
Reconciliation of movements in 2016 2015 2016 2015 2016 2015
policy liabilities $M $M $M $M $M $M
Contract policy liabilities
Gross policy liabilities opening balance 3,752 3,631 9,159 9,535 12,911 13,166
Movement in policy liabilities reflected in the Income Statement 344 183 297 718 641 901
Contract contributions recognised in policy liabilities 7 7 216 140 223 147
Contract withdrawals recognised in policy liabilities (50) (55) (1,163) (1,224) (1,213) (1,279)
Non-cash movements (17) (19) - - (17) (19)
FX translation adjustment 18 5 73 (10) 91 (5)
Gross policy liabilities closing balance 4,054 3,752 8,582 9,159 12,636 12,911
Liabilities ceded under reinsurance
Opening balance (357) (325) - - (357) (325)
Increase in reinsurance assets (28) (32) - - (28) (32)
Closing balance (385) (357) - - (385) (357)
Net policy liabilities
Expected to be realised within 12 months 479 574 1,872 1,538 2,351 2,112
Expected to be realised in more than 12 months 3,190 2,821 6,710 7,621 9,900 10,442
Total net insurance policy liabilities 3,669 3,395 8,582 9,159 12,251 12,554
Capital Adequacy of The Group’s Life Insurance Company
Under the Life Insurance Act 1995, life insurers are required to hold reserves in excess of the amount of policy liabilities. These
additional reserves are necessary to support the life insurer's capital requirements under its business plan and to provide a
cushion against adverse experience in managing long-term risks. APRA has issued Life Prudential Standard (LPS) 110 'Capital
Adequacy' for determining the level of capital reserves. LPS110 prescribes the minimum capital requirement for each statutory
fund and the minimum level of assets required to be held in each statutory fund.
The table below shows the Capital Adequacy Multiple representing the ratio or assets available for capital over the capital
reserve.
2016 2015
Capital Adequacy Multiple Times Times
The Colonial Mutual Life Assurance Society Limited, Australia 1. 44 1. 68

Notes to the Financial Statements
Commonwealth Bank of Australia – Annual Report 2016 97
Note 28 Remuneration of Auditors
During the financial year, the following fees were paid or payable for services provided by the auditor of the Group and the Bank,
and its network firms:
Group Bank
2016 2015 2016 2015
$'000 $'000 $'000 $'000
a) Audit and audit related services
Audit services
PricewaterhouseCoopers Australian firm 15,779 15,575 11,271 11,469
Network firms of PricewaterhouseCoopers Australian firm 4,886 5,154 703 637
Total remuneration for audit services 20,665 20,729 11,974 12,106
Audit related services
PricewaterhouseCoopers Australian firm 3,433 3,403 2,564 2,299
Network firms of PricewaterhouseCoopers Australian firm 1,083 569 374 90
Total remuneration for audit related services 4,516 3,972 2,938 2,389
Total remuneration for audit and audit related services 25,181 24,701 14,912 14,495
b) Non-audit services
Taxation services
PricewaterhouseCoopers Australian firm 1,215 1,808 1,161 1,721
Network firms of PricewaterhouseCoopers Australian firm 1,465 1,363 598 732
Total remuneration for tax related services 2,680 3,171 1,759 2,453
Other Services
PricewaterhouseCoopers Australian firm 4,741 6,443 4,394 5,508
Network firms of PricewaterhouseCoopers Australian firm 123 90 - -
Total remuneration for other services 4,864 6,533 4,394 5,508
Total remuneration for non-audit services 7,544 9,704 6,153 7,961
Total remuneration for audit and non-audit services (1) 32,725 34,405 21,065 22,456
(1) An additional amount of $9,429,368 (2015: $8,254,111) was paid to PricewaterhouseCoopers by way of fees for entities not consolidated into the Financial
Statements. Of this amount, $7,279,197 (2015: $6,295,642) relates to audit and audit-related services.
The Audit Committee has considered the non-audit services provided by PricewaterhouseCoopers and is satisfied that the
services and the level of fees are compatible with maintaining auditors’ independence. All such services were approved by the
Audit Committee in accordance with pre-approved policies and procedures.
Audit related services principally includes assurance and attestation reviews of the Group’s foreign disclosures for overseas
investors, services in relation to regulatory requirements, acquisition accounting advice as well as reviews of internal control
systems and financial or regulatory information.
Taxation services included assistance and training in relation to tax legislation and developments.
Other services include project assurance, reviews of compliance with legal and regulatory frameworks, review of governance, risk
and control frameworks as well as benchmarking reviews.
Note 29 Lease Commitments
Group Bank
2016 2015 2016 2015
$M $M $M $M
Lease Commitments - Property, Plant and Equipment
Due within one year 606 573 550 521
Due after one year but not later than five years 1,847 1,570 1,672 1,398
Due after five years 2,436 881 2,212 659
Total lease commitments - property, plant and equipment 4,889 3,024 4,434 2,578
Lease Arrangements
Operating leases are entered into to meet the business needs of entities in the Group. Leases are primarily over commercial and
retail premises and plant and equipment.
Lease rentals are determined in accordance with market conditions when leases are entered into or on rental review dates.
The total expected future sublease payments to be received are $110 million as at 30 June 2016 (2015: $114 million).

Notes to the Financial Statements
98 Commonwealth Bank of Australia – Annual Report 2016
Note 30 Contingent Liabilities, Contingent Assets and Commitments
Details of contingent liabilities and off Balance Sheet business are presented below. The face (contract) value represents the
maximum potential amount that could be lost if the counterparty fails to meet its financial obligations. The credit commitments
shown in the table below also constitute contingent assets. These commitments would be classified as loans and other assets in
the Balance Sheet on the occurrence of the contingent event.
Group
Face Value Credit Equivalent
2016 2015 2016 2015
Credit risk related instruments $M $M $M $M
Guarantees (1) 6,216 6,181 6,216 6,181
Documentary letters of credit (2) 1,308 1,764 1,153 1,621
Performance related contingents (3) 2,568 2,007 2,560 1,881
Commitments to provide credit (4) 170,742 165,511 162,967 157,387
Other commitments (5) 1,636 2,113 1,359 1,852
Total credit risk related instruments 182,470 177,576 174,255 168,922
Bank
Face Value Credit Equivalent
2016 2015 2016 2015
Credit risk related instruments $M $M $M $M
Guarantees (1) 5,873 5,778 5,873 5,778
Documentary letters of credit (2) 1,227 1,704 1,075 1,573
Performance related contingents (3) 2,568 2,007 2,560 1,881
Commitments to provide credit (4) 155,446 152,772 149,272 145,935
Other commitments (5) 1,073 1,468 1,036 1,438
Total credit risk related instruments 166,187 163,729 159,816 156,605
(1) Guarantees are unconditional undertakings given to support the obligations of a customer to third parties.
(2) Documentary letters of credit are undertakings by the Group and Bank to pay or accept drafts drawn by a supplier of goods against presentation of documents in the event of payment default by a customer.
(3) Performance related contingents are undertakings that oblige the Group and Bank to pay third parties should a customer fail to fulfil a contractual non-monetary obligation.
(4) Commitments to provide credit include all obligations on the part of the Group and Bank to provide credit facilities. As facilities may expire without being drawn upon, the notional amounts do not necessarily reflect future cash requirements.
(5) Other commitments include underwriting facilities, commitments with certain drawdowns, standby letters of credit and bill endorsements.
Contingent Credit Liabilities
The Group and Bank is party to a range of financial instruments that give rise to contingent and/or future liabilities. These
transactions are a consequence of the Group’s normal course of business to meet the financing needs of its customers and in
managing its own risk. These financial instruments include guarantees, letters of credit, bill endorsements and other commitments
to provide credit.
These transactions combine varying levels of credit, interest rate, foreign exchange and liquidity risk. In accordance with Bank
policy, exposures to any of these transactions (net of collateral) are not carried at a level that would have a material adverse
effect on the financial condition of the Bank and its controlled entities.
Commitments to provide credit include both fixed and variable facilities. Fixed rate or fixed spread commitments extended to
customers that allow net settlement of the change in the value of the commitment are written options and are recorded at fair
value. Other commitments include the Group’s and Bank’s obligations under sale and repurchase agreements, outright forward
purchases, forward deposits and underwriting facilities. Other commitments also include obligations not otherwise disclosed
above to extend credit, which are irrevocable because they cannot be withdrawn at the discretion of the Group or Bank without
the risk of incurring significant penalty or expense. In addition, commitments to purchase or sell loans are included in other
commitments.
These transactions are categorised and credit equivalents calculated under APRA guidelines for the risk-based measurement of
capital adequacy. The credit equivalent amounts are a measure of potential loss to the Group in the event of non-performance by
the counterparty.
Under the Basel III advanced internal ratings based approach for credit risk, the credit equivalent amount is the face value of the
transaction, on the basis that at default the exposure is the amount fully advanced. Only when approved by APRA may an
exposure less than that fully-advanced amount be used as the credit equivalent exposure amount.
Notes to the Financial Statements
Commonwealth Bank of Australia – Annual Report 2016 99
Note 30 Contingent Liabilities, Contingent Assets and Commitments (continued)
Contingent Credit Liabilities (continued)
As the potential loss depends on counterparty performance,
the Group utilises the same credit policies in making
commitments and conditional obligations as it does for on
Balance Sheet instruments. The Group and Bank takes
collateral where it is considered necessary to support off
Balance Sheet financial instruments with credit risk. If an
event has occurred that gives rise to a present obligation and
it is probable a loss will eventuate, then provisions are raised.
Failure to Settle Risk
The Group is subject to a credit risk exposure in the event
that another financial institution fails to settle for its payments
clearing activities, in accordance with the regulations and
procedures of the following clearing systems of the Australian
Payments Clearing Association Limited: The Australian Paper
Clearing System, The Bulk Electronic Clearing System, The
Issuers and Acquirers Community and the High Value
Clearing System (only if operating in “fallback mode”). This
credit risk exposure is unquantifiable in advance, but is well
understood, and is extinguished upon settlement following
each exchange during the business day or at 9am next
business day.
Litigation related Contingent Liabilities
The Group is not engaged in any litigation or claim which is
likely to have a materially adverse effect on the business,
financial condition or operating results of the Group. For all
litigation exposure where some loss is probable and can be
reliably estimated an appropriate provision has been made.
Litigation related contingent liabilities at 30 June 2016
included:
Storm Financial
Class action proceedings were commenced in the Federal
Court against the Group in relation to Storm Financial on
1 July 2010. The hearing of the proceedings concluded in
November 2013 and judgment was reserved.
The parties exchanged a Deed of Settlement in an attempt to
resolve the class action on 27 February 2015, and the
Federal Court approved the proposed settlement on
7 July 2015. The settlement of the Class action proceedings
has now been implemented in accordance with the Deed of
Settlement dated 27 February 2015 and the orders of the
Court.
Exception Fee Class Actions
In May 2011, Maurice Blackburn announced that it intended
to sue various Australian banks with respect to exception
fees. Proceedings were issued against Commonwealth Bank
of Australia in December 2011 and against Bankwest in
April 2012. Neither claim has been progressed and both have
been stayed since issue, pending the outcome of similar
proceedings against another bank where an appeal process
to the High Court was commenced. On 27 July 2016 the High
Court handed down its Judgment dismissing the appeal. The
Proceedings against Commonwealth Bank of Australia and
Bankwest are expected to be discontinued.
Other Contingent Liabilities
Services Agreements
The maximum contingent liability for termination benefits in
respect of service agreements with the Chief Executive
Officer and other Group Key Management Personnel at
30 June 2016 was $5.0 million (2015: $4.9 million).

Notes to the Financial Statements
100 Commonwealth Bank of Australia – Annual Report 2016
Note 31 Risk Management
Risk Management Framework
The Group has an embedded Risk Management Framework
(Framework) that enables the appropriate development and
implementation of strategies, policies and procedures to
manage its risks.
The Framework incorporates the requirements of APRA’s
prudential standard for risk management (CPS 220), and is
supported by the three key documentary components:
The Group’s Risk Appetite Statement articulates the type
and degree of risk the Board is prepared to accept
(appetite) and the maximum level of risk that the
institution must operate within (tolerances).
The Group’s Business Plan (Plan) summarises the
Group’s approach to the implementation of its strategic
objectives. The Plan has a rolling three year duration
which also takes into consideration material risks arising
from its implementation.
The Group’s Risk Management Strategy describes each
material risk, the approach taken to managing these
risks and how this is operationalised through
governance, policies and procedures.
This framework requires each business to plan and manage
the outcome of its risk-taking activities including proactively
managing its risk profile within risk appetite levels; using risk-
adjusted outcomes and considerations as part of its day-to-
day business decision-making processes; and establishing
and maintaining appropriate risk controls.
These documents, together with the key operational elements
described below, offer the Board the opportunity to direct
management in its risk taking activities and facilitate dialogue
between Board and management about risk management
practices.
Risk Governance
The Group is committed to ensuring that its risk management
practices reflect a high standard of governance. This enables
Management to undertake, in an effective manner, prudent
risk-taking activities.
The Board operates as the highest level of the Group’s risk
governance as specified in its Charter. In addition, an annual
declaration is made by the chair of the Board and Risk
Committee to APRA on Risk Management requirements as
set out in the prudential standard (CPS220).
The Risk Committee oversees the Framework and helps
formulate the Group’s risk appetite for consideration by the
Board. In particular it:
Reviews regular reports from Management on the
measurement of risk and the adequacy and
effectiveness of the Group’s risk management and
internal controls systems;
Monitors the health of the Group’s risk culture (via both
formal reports and through its dialogues with the risk
leadership team and executive management) and
reports any significant issues to the Board; and
Forms a view on the independence of the risk function
by meeting with the Group Chief Risk Officer (CRO) at
the will of the Committee or the CRO.
The Group risk management structure is a Three Lines of
Defence (3LoD) model which supports the Framework by:
Reinforcing that risk is best owned and managed where
it occurs – so the business (Line 1) is responsible for the
management of risk;
Having a separate group of experienced staff with
specific risk management skills (Line 2) to facilitate the
development of, and monitor / measure the effectiveness
of the risk management process and systems used by
Line 1; and
Having an independent third group (Line 3) provide
assurance to the Board, regulators and other
stakeholders on the appropriateness and effectiveness
of the activities of Lines 1 and 2.
Risk Culture
Risk Culture is the collection of values, ideas, skills and habits
that equip Group employees and directors to see and talk
about risks, and make sound judgments in the absence of
definitive rules, regulations or market signals.
The Group regards risk culture as an aspect of overall culture.
As such, the Group’s risk culture flourishes within an
organisational context that emphasises and rewards integrity,
accountability, collaboration, service and excellence. This
encourages employees at all levels to “speak up” if they
believe the Group as a whole, their part of the organisation or
specific colleagues are conspicuously failing to uphold those
values, damaging risk culture or taking ill-considered risks.
APRA requires the Group Board to form a view regarding the
effectiveness of the institution’s risk culture in keeping risk-
taking within appetite, and to take any corrective action that
may be appropriate.
Risk Policies & Procedures
Risk Policies and Procedures provide guidance to the
business on the management of each material risk. They
support the Framework by:
Summarising the principles and practices to be used by
the Group in identifying and assessing its material risks;
Outlining a process for monitoring, communicating and
reporting risk issues, including escalation procedures for
the reporting of material risks; and
Quantifying the limits (risk tolerances) for major risks and
stating risk actions to which the Group is intolerant.

Notes to the Financial Statements
Commonwealth Bank of Australia – Annual Report 2016 101
Note 31 Risk Management (continued)
Risk Management Infrastructure
The Framework is supported by the following Group-wide
processes:
A Management Information System to measure and
aggregate material risks across the Group;
A Risk-Adjusted-Performance Measurement (RAPM)
process which is a means of assessing the performance
of a business after adjustment for its risks and is used as
a basis for executive incentives; and
An Internal Capital Adequacy Assessment Process
(ICAAP) used, in combination with other risk
management practices (including Stress testing), to
understand, manage and quantify the Group’s risks; the
outcomes of which are used to inform risk decisions, set
capital buffers and assist strategic planning.
Material Risks
A description of the major risk classes and the Group’s approach to managing them is summarised in the following table:
Risk Type Description Governing Policies and Key Management Committees
Key Limits, Standards and Measurement Approaches
Credit Risk
(refer to Note 32)
Credit risk is the potential for loss
arising from the failure of a customer or
counterparty to meet their contractual
obligations to the Group. At a portfolio
level, credit risk includes concentration
risk arising from interdependencies
between customers, and concentrations
of exposures to geographical regions,
industry sectors and products/portfolio
types.
Governing Policies:
Group Credit Risk Principles, Frameworks and Governance (incl. Risk Appetite, principles, and frameworks; and Credit Risk governance); and
Credit Risk Policies (incl. Origination, Decisioning, Verification/Fulfilment, and Whole of Life Servicing).
Key Management Committee:
Executive Risk Committee
The following key credit risk policies set credit portfolio concentration limits and standards:
Large Credit Exposure Policy;
Country Risk Exposure Policy;
Industry Sector Concentration Policy; and
Exposure to consumer credit products are managed within limits and standards set in the Group Level RAS, BU Level RAS and Credit Portfolio & Product Standards.
The measurement of credit risk is primarily
based on an APRA accredited Advanced
Internal Ratings Based (AIRB) approach
(albeit some exposures are subject to the
standardised approach). The approach
uses judgemental assessment on
individuals or management, supported by
analytical tools (including scorecards) to
estimate expected and unexpected loss
within the credit portfolio.
Market Risk
(including Equity
Risk)
(refer to Note 33)
Market risk is the risk that market rates
and prices will change and that this
may have an adverse effect on the
profitability and/or net worth of the
Group. This includes changes in
interest rates, foreign exchange rates,
equity and commodity prices, credit
spreads, and the resale value of assets
underlying operating leases at maturity
(lease residual value risk).
Governing Policies:
The Group Market Risk Manual (including the Group Market Risk Policy and Trading Book Policy Statement)
Key Management Committee:
Asset and Liability Committee
The Group Market Risk Policy sets limits and standards with respect to the following:
Traded Market Risk;
Interest Rates Risk in the Banking Book (IRRBB);
Residual Value Risk;
Non-traded Equity Risk; and
Market Risk in Insurance Businesses.
The respective measurement approaches for the underlying market risks noted above include:
Value at Risk (VaR), Stress Testing;
Market Value Sensitivity, Net Interest Earnings at Risk;
Profit & Loss Adjustment Account Balance, Aggregate Residual Value Risk Weighted Exposure, Aggregate Residual Value Risk Margin; and
Aggregate Portfolio Limit.
Liquidity and
Funding Risk
(refer to Note 34)
Liquidity risk is the combined risks of
not being able to meet financial
obligations as they fall due (funding
liquidity risk), and that liquidity in
financial markets, such as the market
for debt securities, may reduce
significantly (market liquidity risk).
Governing Policies:
Group Liquidity Risk Management Policy and Strategy
Key Management Committee:
Asset and Liability Committee
The Group Liquidity Risk Management Policy and Strategy sets limits and standards with respect to the following:
The Liquidity Coverage Ratio, which requires liquid assets exceed modelled 30 day stress outflows;
Additional market and idiosyncratic stress test scenarios; and
Limits that set tolerances for the sources and tenor of funding.
The measurement of liquidity risk uses
scenario analysis, covering both:
“Stress” scenarios, which assess the behaviour of cash flows in adverse operating circumstances; and
“Going concern” scenarios, which assess behaviour of cash flows in ordinary operating circumstances.

Notes to the Financial Statements
102 Commonwealth Bank of Australia – Annual Report 2016
Note 31 Risk Management (continued)
Material Risks (continued)
Risk Type Description Governing Policies and Key Management Committees
Key Limits, Standards and Measurement Approaches
Operational
Risk
Operational risk is risk of economic loss
arising from inadequate or failed
internal processes, people, systems or
external events.
Governing Policies:
Group Operational Risk Management Framework
Key Management Committees:
Executive Committee,
Data Governance Committee
The Group Operational Risk Management
Framework sets limits and standards with
respect to the following:
Investigation and reporting of loss, compliance and near miss incidents;
Comprehensive Risk and Control Self-Assessment, control assurance and issues management processes; and
Comprehensive Scenario Analysis assessment process (also called Quantitative
Risk Assessments).
The measurement of operational risk is based
on an APRA accredited Advanced
Measurement Approach (some exposures are
subject to standardised). The approach
combines internal and external loss experience
and business judgements captured through
Scenario Analysis.
Compliance
Risk
Compliance risk is the risk of legal or
regulatory sanctions, material financial
loss, or loss of reputation that the
Group may incur as a result of its failure
to comply with its Compliance
Obligations.
Compliance Obligations are formal
requirements that may arise from
various sources including but not
limited to; laws; regulations; legislation;
industry standards; rules; codes or
guidelines.
Governing Policies:
Group Operational Risk Management Framework
Compliance Risk Management Framework
Compliance Incident Management Group Policy
Key Management Committees:
Executive Committee,
Data Governance Committee
The key limits with respect to compliance risk
are set via the Group Operational Risk
Management Framework. The Group
Compliance Risk Management Framework sets
standards with respect to the understanding of
obligations, establishing policies and
procedures, managing non-compliance,
monitoring and reporting.
The measurement of compliance risk is
undertaken within the operational risk
approach.
Insurance
Risk
Insurance risk is the risk of loss due to
increases in policy benefits arising from
variations in the incidence or severity of
insured events.
In the life insurance business this arises
primarily through mortality (death) or
morbidity (illness or injury) claims being
greater than expected. In the general
insurance business, variability arises
mainly through weather related
incidents and similar events, as well as
general variability in home, motor and
travel insurance claim amounts.
Insurance risk also covers inadequacy
in product design, pricing, underwriting,
claims management and reinsurance
management as well as variations in
policy lapses, servicing expenses, and
option take up rates.
Governing Policies:
Product Management Policy, Underwriting Policy, Claims Management Policy and Reinsurance Management Policy (end-to-end policies of insurance writing businesses).
Key Management Committees:
Executive Committees
of Insurance writing businesses
The key limits and standards with respect to
insurance risk are set via the end-to-end
policies of insurance writing businesses. The
major methods include:
Sound product design and pricing, to ensure that customers understand the extent of their cover and that premiums are sufficient to cover the risk involved;
Regular review of insurance experience, so that product design, policy liabilities and pricing remains sound;
Claims management to ensure that claims are paid within the agreed policy terms and that genuine claims are paid as soon as possible after documentation is received and reasonable investigations are undertaken; and
Transferring a proportion of insurance risk to reinsurers to keep within risk appetite.
Insurance risk is measured using actuarial
techniques which are used to establish the
likelihood and severity of possible insurance
claims. Insurance risk is further monitored with
key financial and performance metrics, such as
loss ratios, new business volumes and lapse
rates.

Notes to the Financial Statements
Commonwealth Bank of Australia – Annual Report 2016 103
Note 31 Risk Management (continued)
Material Risks (continued)
Risk Type Description Governing Policies and Key Management Committees
Key Limits, Standards and Measurement Approaches
Strategic Risk Strategic Risk is the risk of economic
loss arising from changes in the
business environment (caused by
macroeconomic conditions,
competitive forces at work,
technology, regulatory or social
trends) or internal weaknesses, such
as a poorly implemented or flawed
strategy.
Governing Policies:
Group Risk Management Strategy (RMS)
Key Management Committee:
Executive Committee
The key limits and standards with respect to
strategic risk are set via the Board’s
consideration of Group and BU strategic plans
and the most significant risks (current and
emerging) arising from these.
Strategic risk is measured using a combination
of judgemental assessments captured through
Scenario Analysis and an internal profit
simulation model.
Reputational
Risk
Reputational risk arises from negative
perception on the part of customers,
counterparties, shareholders,
investors, debt holders, market
analysts, regulators and other relevant
stakeholders of the Group.
Governing Policies:
Group RMS
Group Risk Appetite Statement
Statement of Professional Practice
Environmental, Social and Governance Lending Policy
Key Management Committee:
Executive Committee
Potential adverse Reputational impacts are
managed as an outcome of all other material
risks. In addition, the Group:
Sets clear behavioural standards (as set out in the Group’s Risk Appetite Statement) and Group-wide requirements of leadership that support the Group’s vision and values; and
Has a Sustainability framework which supports the Group in managing its Environmental, Social and Governance (ESG) risks.

Notes to the Financial Statements
104 Commonwealth Bank of Australia – Annual Report 2016
Note 32 Credit Risk
Credit Risk Management Principles and Portfolio Standards
The Group has clearly defined credit policies for the approval
and management of credit risk. Formal credit standards apply
to all credit risks, with specific portfolio standards applying to
all major lending areas. These set the minimum requirements
in assessing the integrity and ability of debtors and/or
counterparties to meet their contracted financial obligations
for repayment, acceptable forms of collateral and security and
the frequency of credit reviews.
The principles and portfolio standards are designed to
achieve portfolio outcomes that are consistent with the
Group’s risk appetite and risk/return expectations.
The Credit Portfolio Assurance unit, part of Group Audit and
Assurance, reviews credit portfolios and business unit
compliance with policies, portfolio standards, application of
credit risk ratings and other key practices on a regular basis.
The credit risk portfolio has two major segments:
(i) Retail Managed Segment
This segment has sub-segments covering housing loans,
credit cards, personal loans, some leasing products, some
unsecured commercial lending and most secured commercial
lending up to $1 million.
Auto-decisioning is used to approve credit applications for
eligible customers in this segment. Auto-decisioning uses a
scorecard approach based on the Group’s historical
experience on similar applications, information from a credit
reference bureau and/or from the Group’s existing knowledge
of a customer’s behaviour.
Loan applications that do not meet scorecard Auto-
decisioning requirements may be referred to a Risk
Management Officer with a Personal Credit Approval
Authority (PCAA) for manual decisioning.
After loan origination, these portfolios are managed using
behavioural scoring systems and on a delinquency band
approach, e.g. actions taken when loan payments are greater
than 30 days past due differ from actions when payments are
greater than 60 days past due, and are reviewed by the
relevant Risk Management or Business Unit Credit Support
Team.
(ii) Risk-Rated Segment
This segment comprises commercial exposures, including
bank and sovereign exposures. Each exposure is assigned
an internal Credit Risk-Rating (CRR) based on Probability of
Default (PD) and Loss Given Default (LGD).
For credit risk rated exposures either a PD Rating Tool or
expert judgement is used to determine the PD. Expert
judgement is used where the complexity of the transaction
and/or the debtor is such that it is inappropriate to rely
completely on a statistical model. External ratings may be
used as inputs into the expert judgement assessment.
The CRR is designed to:
Aid in assessing changes to the client quality of the
Group's credit portfolio;
Influence decisions on approval, management and
pricing of individual credit facilities; and
Provide the basis for reporting details of the Group's
credit portfolio.
Credit risk-rated exposures are generally reviewed on an
individual basis, at least annually, although small transactions
may be managed on a behavioural basis after their initial
rating at origination. Credit risk-rated exposures fall within the
following categories:
“Pass” – these credit facilities qualify for approval of new
or increased exposure on normal commercial terms; and
“Troublesome or Impaired Assets (TIAs)” – these credit
facilities are not eligible for new or increased exposure,
unless it will protect or improve the Group’s position by
maximising recovery prospects or to facilitate
rehabilitation. Where a client is in default but the facility
is well secured, the facility may be classed as
troublesome but not impaired. Where a client’s facility is
not well secured and a loss is expected, the facility is
classed as impaired. Restructured facilities, where the
original contractual arrangements have been modified to
provide concessions for the customer’s financial
difficulties, are rendered non-commercial to the Group
and considered impaired.
Default is usually consistent with one or more of the following:
The customer is 90 days or more overdue on a
scheduled credit obligation repayment; or
The customer is unlikely to repay their credit obligation
to the Group in full without taking action, such as
realising on available security.
Credit Risk Measurement
The measurement of credit risk uses analytical tools to
calculate both: (i) Expected, and (ii) Unexpected Loss
probabilities for the credit portfolio. The use of analytical tools
is governed by a Credit Rating Governance Committee.
(i) Expected Loss
Expected Loss (EL) is the product of:
PD;
Exposure at Default (EAD); and
LGD.
The PD, expressed as a percentage, is the estimate of the
probability that a client will default within the next 12 months.
It reflects a client's ability to generate sufficient cash flows into
the future to meet the terms of all their credit obligations with
the Group.
The dollar amount of EAD is the estimate of the amount of a
facility that will be outstanding in the event of default.
Estimates are based on downturn economic conditions. For
defaulted facilities it is the actual amount outstanding at
default.
For non-defaulted committed facilities it is based on the actual
amount outstanding, plus the undrawn amount multiplied by a
credit conversion factor which represents the potential rate of
conversion from undrawn 12 months prior to default to drawn
at default. For most committed facilities, the Group applies a
credit conversion factor of 100% to the undrawn amount.
For uncommitted facilities the EAD will generally be the drawn
balance only.
For retail exposures, a modelling approach can be used
based on factors including limit usage, arrears and loan type
to segment accounts into homogeneous pools for the
calculation. LGD expressed as a percentage, is the estimated
proportion of a facility likely to be lost in the event of default.
LGD is impacted by:
Notes to the Financial Statements
Commonwealth Bank of Australia – Annual Report 2016 105
Note 32 Credit Risk (continued)
Credit Risk Measurement (continued)
Type and level of any collateral held;
Liquidity and volatility of collateral;
Carrying costs (effectively the costs of providing a facility
that is not generating an interest return); and
Realisation costs.
Various factors are considered when calculating PD, EAD
and LGD. Considerations include the potential for default by a
borrower due to economic, management, industry and other
risks, and the mitigating benefits of any collateral or security.
(ii) Unexpected Loss
In addition to EL, a more stressed loss amount is calculated.
This Unexpected Loss estimate directly affects the calculation
of regulatory and internal economic capital requirements.
Refer to the Group Operations and Business Settings section
and Note 25 for information relating to regulatory capital.
Credit Risk Mitigation, Collateral and Other Credit Enhancements
The Group has policies and procedures in place setting out
the circumstances where acceptable and appropriate
collateral is to be taken to mitigate credit risk, including
valuation parameters, review frequency and independence of
valuation.
The general nature of collateral that may be taken, and the
balances held, are summarised below by financial asset
classes.
Cash and Liquid Assets
Collateral is not usually sought on the majority of Cash and
liquid asset balances as these types of exposures are
generally considered low risk. However, securities purchased
under agreement to resell are collateralised by highly liquid
debt securities. The collateral related to agreements to resell
has been legally transferred to the Group subject to an
agreement to return them for a fixed price.
The Group’s cash and liquid asset balance included
$11,629 million (2015: $16,028 million) deposited with central
banks and is considered to carry less credit risk.
Receivables Due from Other Financial Institutions
Collateral is usually not sought on these balances as
exposures are generally considered to be of low risk. The
exposures are mainly short term and to relatively low risk
banks (Rated A+, AA- or better).
Trading Assets at Fair Value through Income Statement and Available-for-Sale (AFS) Investments
These assets are carried at fair value, which accounts for the
credit risk. Collateral is not generally sought from the issuer or
counterparty however collateral may be implicit in the terms of
the instrument (e.g asset-backed security). Credit derivatives
have been used to a limited extent to mitigate the exposure to
credit risk.
Insurance Assets
These assets are carried at fair value, which accounts for the
credit risk. Collateral is not generally sought or provided on
these types of assets, other than a fixed charge over
properties backing Australian mortgage investments.
In most cases the credit risk of insurance assets is borne by
policyholders. However, on certain insurance contracts the
Group retains exposure to credit risk.
Other Assets at Fair Value through Income Statement
These assets are carried at fair value, which accounts for the
credit risk. Credit derivatives used to mitigate the exposure to
credit risk are not significant.
Derivative Assets
The Group’s use of derivative contracts is outlined in Note 10.
The Group is exposed to credit risk on derivative contracts,
which arises as a result of counterparty credit risk. The
Group’s exposure to counterparty credit risk is affected by the
nature of the trades, the creditworthiness of the counterparty,
netting, and collateral arrangements.
Credit risk from derivatives is mitigated where possible
(typically for financial markets counterparties, but less
frequently for corporate or government counterparties)
through netting agreements, whereby derivative assets and
liabilities with the same counterparty can be offset and
clearing of trades with Central Counterparties (CCPs). Group
policy requires all netting arrangements to be legally
documented. The International Swaps and Derivatives
Association (ISDA) Master Agreement (or other derivative
agreements) are used by the Group as an agreement for
documenting Over-the-Counter (OTC) derivatives.
Collateral is obtained against derivative assets, depending on
the creditworthiness of the counterparty and/or nature of the
transaction. The fair value of collateral held and the potential
effect of offset obtained by applying master netting
agreements are disclosed in Note 43.
Due from Controlled Entities
Collateral is not generally taken on these intergroup balances.
Credit Commitments and Contingent Liabilities
The Group applies fundamentally the same risk management
policies for off Balance Sheet risks as it does for its on
Balance Sheet risks. Collateral may be sought depending on
the strength of the counterparty and the nature of the
transaction. Of the Group’s off Balance Sheet exposures,
$96,111 million (2015: $93,047 million) are secured.
Loans, Bills Discounted and Other Receivables
The principal collateral types for loans and receivable
balances are:
Mortgages over residential and commercial real estate;
Charges over business assets such as cash, stock or
scrip, inventory, fixed assets and accounts receivables;
and
Guarantees received from third parties.
Collateral security, in the form of real estate or a charge over
income or assets, is generally taken except for government,
bank and corporate counterparties that are often externally
risk-rated and of strong financial standing. Longer term
consumer finance, such as housing loans, is generally
secured against real estate, while short term revolving
consumer credit is generally not secured by formal collateral.
Specifically, the collateral mitigating credit risk of the key
lending portfolios is addressed in the table ‘Collateral held
against Loans, Bills Discounted and Other Receivables’ within
this note.

Notes to the Financial Statements
106 Commonwealth Bank of Australia – Annual Report 2016
Note 32 Credit Risk (continued)
Maximum Exposure to Credit Risk by Industry and Asset Class before Collateral Held or Other Credit Enhancements
The tables below detail the concentration of credit exposure assets by significant geographical locations and counterparty types.
Disclosures do not take into account collateral held and other credit enhancements.
Group
At 30 June 2016
Bank Asset Other
Agri- and Other Home Constr- Other Financ- Comm and
Sovereign culture Financial Loans uction Personal ing Indust. Other Total
$M $M $M $M $M $M $M $M $M $M
Australia
Credit risk exposures relating to on Balance Sheet assets:
Cash and liquid assets - - 10,971 - - - - - - 10,971
Receivables due from other
financial institutions - - 2,930 - - - - - - 2,930
Assets at fair value through
Income Statement:
Trading 16,763 - 1,552 - - - - 12,900 - 31,215
Insurance 1,402 - 5,963 - - - - 3,781 - 11,146
Other 43 - 532 - - - - 905 - 1,480
Derivative assets 1,622 115 29,767 - 133 - - 2,755 - 34,392
Available-for-sale investments 43,400 - 23,856 - - - - 821 - 68,077
Loans, bills discounted
and other receivables (1) 5,380 7,191 14,794 409,452 3,114 23,524 8,543 132,136 - 604,134
Bank acceptances 2 707 68 - 338 - - 44 - 1,159
Other assets (2) 1,531 4 3,845 708 3 8 - 363 15,703 22,165
Total on Balance Sheet
Australia 70,143 8,017 94,278 410,160 3,588 23,532 8,543 153,705 15,703 787,669
Credit risk exposures relating to off Balance Sheet assets:
Guarantees 63 18 345 58 542 6 - 4,815 - 5,847
Loan commitments 850 1,406 6,207 68,577 2,227 22,957 - 38,894 - 141,118
Other commitments 55 24 1,105 59 986 1 14 2,572 - 4,816
Total Australia 71,111 9,465 101,935 478,854 7,343 46,496 8,557 199,986 15,703 939,450
Overseas
Credit risk exposures relating to on Balance Sheet assets:
Cash and liquid assets - - 12,401 - - - - - - 12,401
Receivables due from other
financial institutions - - 8,661 - - - - - - 8,661
Assets at fair value through
Income Statement:
Trading 890 - 1,559 - - - - 403 - 2,852
Insurance - - 2,401 - - - - - - 2,401
Other - - - - - - - - - -
Derivative assets 908 33 4,620 - - - - 6,614 - 12,175
Available-for-sale investments 9,507 - 3,166 - - - - 148 - 12,821
Loans, bills discounted
and other receivables (1) 9,164 8,744 5,359 46,622 352 1,719 220 23,985 - 96,165
Bank acceptances - - - - - - - 272 - 272
Other assets (2) 17 - 247 70 - 6 5 30 2,187 2,562
Total on Balance Sheet
overseas 20,486 8,777 38,414 46,692 352 1,725 225 31,452 2,187 150,310
Credit risk exposures relating to off Balance Sheet assets:
Guarantees 1 4 57 - 53 - - 254 - 369
Loan commitments 313 827 2,768 7,309 194 1,940 5 16,268 - 29,624
Other commitments 43 - - - 1 - - 652 - 696
Total overseas 20,843 9,608 41,239 54,001 600 3,665 230 48,626 2,187 180,999
Total gross credit risk 91,954 19,073 143,174 532,855 7,943 50,161 8,787 248,612 17,890 1,120,449
(1) Loans, bills discounted and other receivables is presented gross of provisions for impairment and unearned income on lease receivables in line with Note 12.
(2) For the purpose of reconciling to the Balance Sheet, “Other assets” predominantly comprises assets which do not give rise to credit exposure, including Property, plant and equipment, Investment in Associates and Joint Ventures, Intangible assets, Deferred tax assets and Other assets.

Notes to the Financial Statements
Commonwealth Bank of Australia – Annual Report 2016 107
Note 32 Credit Risk (continued)
Maximum Exposure to Credit Risk by Industry and Asset Class before Collateral Held or Other Credit Enhancements (continued)
Group
At 30 June 2015
Bank Asset Other
Agri- and Other Home Constr- Other Financ- Comm and
Sovereign culture Financial Loans uction Personal ing Indust. Other Total
$M $M $M $M $M $M $M $M $M $M
Australia
Credit risk exposures relating to on Balance Sheet assets:
Cash and liquid assets - - 15,939 - - - - - - 15,939
Receivables due from other
financial institutions (1) - - 4,141 - - - - - - 4,141
Assets at fair value through
Income Statement:
Trading 10,477 - 2,087 - - - - 10,267 - 22,831
Insurance 696 - 7,269 - - - - 3,885 - 11,850
Other 95 - 470 - - - - 615 - 1,180
Derivative assets 1,282 115 29,319 - 48 - - 6,898 - 37,662
Available-for-sale investments 34,795 - 28,510 - - - - 1,040 - 64,345
Loans, bills discounted
and other receivables (2) 5,521 6,258 15,157 383,174 2,722 22,313 8,356 117,557 - 561,058
Bank acceptances 2 1,299 61 - 353 - - - - 1,715
Other assets (1) (3) 786 37 5,455 608 70 51 4 959 12,838 20,808
Total on Balance Sheet
Australia 53,654 7,709 108,408 383,782 3,193 22,364 8,360 141,221 12,838 741,529
Credit risk exposures relating to off Balance Sheet assets:
Guarantees 109 14 149 45 679 7 - 4,759 - 5,762
Loan commitments 577 1,595 3,845 66,437 3,253 22,605 - 40,482 - 138,794
Other commitments 50 13 1,727 24 874 2 164 2,263 - 5,117
Total Australia 54,390 9,331 114,129 450,288 7,999 44,978 8,524 188,725 12,838 891,202
Overseas
Credit risk exposures relating to on Balance Sheet assets:
Cash and liquid assets - - 17,177 - - - - - - 17,177
Receivables due from other
financial institutions (1) - - 8,922 - - - - - - 8,922
Assets at fair value through
Income Statement:
Trading 1,010 - 1,358 - - - - 1,225 - 3,593
Insurance - - 2,238 - - - - - - 2,238
Other - - 98 - - - - - - 98
Derivative assets 710 24 5,848 - - - - 1,910 - 8,492
Available-for-sale investments 7,092 - 3,133 - - - - 114 - 10,339
Loans, bills discounted
and other receivables (2) 12,929 7,990 7,572 39,677 407 1,128 558 12,909 - 83,170
Bank acceptances - - - - - - - 229 - 229
Other assets (1) (3) 45 - 743 1 1 19 54 77 1,685 2,625
Total on Balance Sheet
overseas 21,786 8,014 47,089 39,678 408 1,147 612 16,464 1,685 136,883
Credit risk exposures relating to off Balance Sheet assets:
Guarantees 1 3 60 - 69 - - 286 - 419
Loan commitments 512 989 1,401 5,887 154 1,711 3 16,060 - 26,717
Other commitments 71 - - - 5 - - 691 - 767
Total overseas 22,370 9,006 48,550 45,565 636 2,858 615 33,501 1,685 164,786
Total gross credit risk 76,760 18,337 162,679 495,853 8,635 47,836 9,139 222,226 14,523 1,055,988
(1) Comparative information has been reclassified to conform to presentation in the current year.
(2) Loans, bills discounted and other receivables is presented gross of provisions for impairment and unearned income on lease receivables in line with Note 12.
(3) For the purpose of reconciling to the Balance Sheet, “Other assets” predominantly comprises assets which do not give rise to credit exposure, including Property, plant and equipment, Investment in Associates and Joint Ventures, Intangible assets, Deferred tax assets and Other assets.
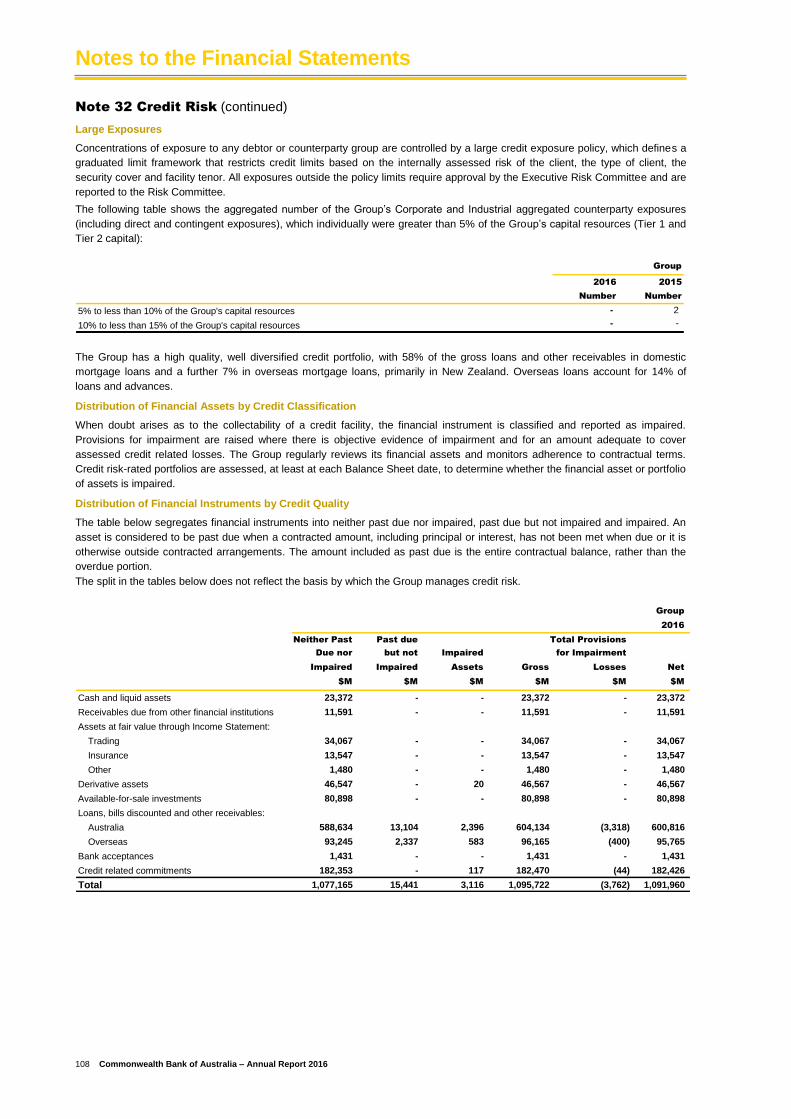
Notes to the Financial Statements
108 Commonwealth Bank of Australia – Annual Report 2016
Note 32 Credit Risk (continued)
Large Exposures
Concentrations of exposure to any debtor or counterparty group are controlled by a large credit exposure policy, which defines a
graduated limit framework that restricts credit limits based on the internally assessed risk of the client, the type of client, the
security cover and facility tenor. All exposures outside the policy limits require approval by the Executive Risk Committee and are
reported to the Risk Committee.
The following table shows the aggregated number of the Group’s Corporate and Industrial aggregated counterparty exposures
(including direct and contingent exposures), which individually were greater than 5% of the Group’s capital resources (Tier 1 and
Tier 2 capital):
Group
2016 2015
Number Number
5% to less than 10% of the Group's capital resources - 2
10% to less than 15% of the Group's capital resources - -
The Group has a high quality, well diversified credit portfolio, with 58% of the gross loans and other receivables in domestic
mortgage loans and a further 7% in overseas mortgage loans, primarily in New Zealand. Overseas loans account for 14% of
loans and advances.
Distribution of Financial Assets by Credit Classification
When doubt arises as to the collectability of a credit facility, the financial instrument is classified and reported as impaired.
Provisions for impairment are raised where there is objective evidence of impairment and for an amount adequate to cover
assessed credit related losses. The Group regularly reviews its financial assets and monitors adherence to contractual terms.
Credit risk-rated portfolios are assessed, at least at each Balance Sheet date, to determine whether the financial asset or portfolio
of assets is impaired.
Distribution of Financial Instruments by Credit Quality
The table below segregates financial instruments into neither past due nor impaired, past due but not impaired and impaired. An
asset is considered to be past due when a contracted amount, including principal or interest, has not been met when due or it is
otherwise outside contracted arrangements. The amount included as past due is the entire contractual balance, rather than the
overdue portion.
The split in the tables below does not reflect the basis by which the Group manages credit risk.
Group
2016
Neither Past Past due Total Provisions
Due nor but not Impaired for Impairment
Impaired Impaired Assets Gross Losses Net
$M $M $M $M $M $M
Cash and liquid assets 23,372 - - 23,372 - 23,372
Receivables due from other financial institutions 11,591 - - 11,591 - 11,591
Assets at fair value through Income Statement:
Trading 34,067 - - 34,067 - 34,067
Insurance 13,547 - - 13,547 - 13,547
Other 1,480 - - 1,480 - 1,480
Derivative assets 46,547 - 20 46,567 - 46,567
Available-for-sale investments 80,898 - - 80,898 - 80,898
Loans, bills discounted and other receivables:
Australia 588,634 13,104 2,396 604,134 (3,318) 600,816
Overseas 93,245 2,337 583 96,165 (400) 95,765
Bank acceptances 1,431 - - 1,431 - 1,431
Credit related commitments 182,353 - 117 182,470 (44) 182,426
Total 1,077,165 15,441 3,116 1,095,722 (3,762) 1,091,960
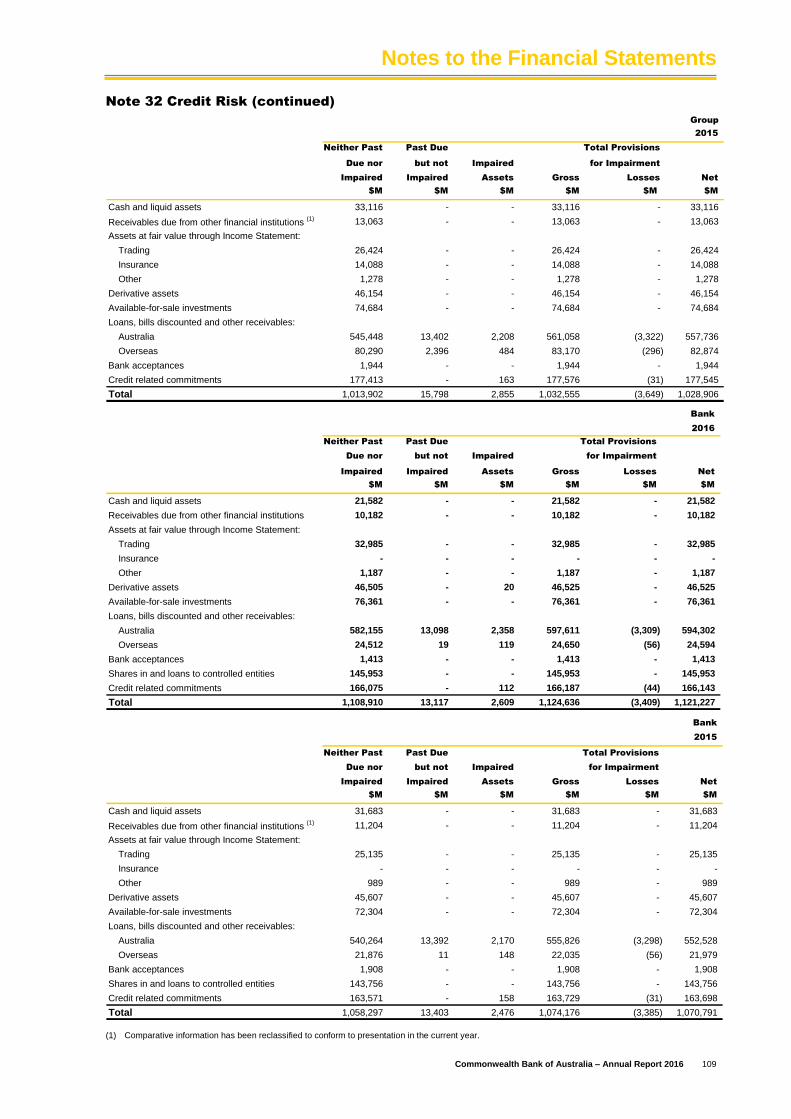
Notes to the Financial Statements
Commonwealth Bank of Australia – Annual Report 2016 109
Note 32 Credit Risk (continued)
Group
2015
Neither Past Past Due Total Provisions
Due nor but not Impaired for Impairment
Impaired Impaired Assets Gross Losses Net
$M $M $M $M $M $M
Cash and liquid assets 33,116 - - 33,116 - 33,116
Receivables due from other financial institutions (1) 13,063 - - 13,063 - 13,063
Assets at fair value through Income Statement:
Trading 26,424 - - 26,424 - 26,424
Insurance 14,088 - - 14,088 - 14,088
Other 1,278 - - 1,278 - 1,278
Derivative assets 46,154 - - 46,154 - 46,154
Available-for-sale investments 74,684 - - 74,684 - 74,684
Loans, bills discounted and other receivables:
Australia 545,448 13,402 2,208 561,058 (3,322) 557,736
Overseas 80,290 2,396 484 83,170 (296) 82,874
Bank acceptances 1,944 - - 1,944 - 1,944
Credit related commitments 177,413 - 163 177,576 (31) 177,545
Total 1,013,902 15,798 2,855 1,032,555 (3,649) 1,028,906
Bank
2016
Neither Past Past Due Total Provisions
Due nor but not Impaired for Impairment
Impaired Impaired Assets Gross Losses Net
$M $M $M $M $M $M
Cash and liquid assets 21,582 - - 21,582 - 21,582
Receivables due from other financial institutions 10,182 - - 10,182 - 10,182
Assets at fair value through Income Statement:
Trading 32,985 - - 32,985 - 32,985
Insurance - - - - - -
Other 1,187 - - 1,187 - 1,187
Derivative assets 46,505 - 20 46,525 - 46,525
Available-for-sale investments 76,361 - - 76,361 - 76,361
Loans, bills discounted and other receivables:
Australia 582,155 13,098 2,358 597,611 (3,309) 594,302
Overseas 24,512 19 119 24,650 (56) 24,594
Bank acceptances 1,413 - - 1,413 - 1,413
Shares in and loans to controlled entities 145,953 - - 145,953 - 145,953
Credit related commitments 166,075 - 112 166,187 (44) 166,143
Total 1,108,910 13,117 2,609 1,124,636 (3,409) 1,121,227
Bank
2015
Neither Past Past Due Total Provisions
Due nor but not Impaired for Impairment
Impaired Impaired Assets Gross Losses Net
$M $M $M $M $M $M
Cash and liquid assets 31,683 - - 31,683 - 31,683
Receivables due from other financial institutions (1) 11,204 - - 11,204 - 11,204
Assets at fair value through Income Statement:
Trading 25,135 - - 25,135 - 25,135
Insurance - - - - - -
Other 989 - - 989 - 989
Derivative assets 45,607 - - 45,607 - 45,607
Available-for-sale investments 72,304 - - 72,304 - 72,304
Loans, bills discounted and other receivables:
Australia 540,264 13,392 2,170 555,826 (3,298) 552,528
Overseas 21,876 11 148 22,035 (56) 21,979
Bank acceptances 1,908 - - 1,908 - 1,908
Shares in and loans to controlled entities 143,756 - - 143,756 - 143,756
Credit related commitments 163,571 - 158 163,729 (31) 163,698
Total 1,058,297 13,403 2,476 1,074,176 (3,385) 1,070,791
dfdgd ggggggfgfffffg (1) Comparative information has been reclassified to conform to presentation in the current year.
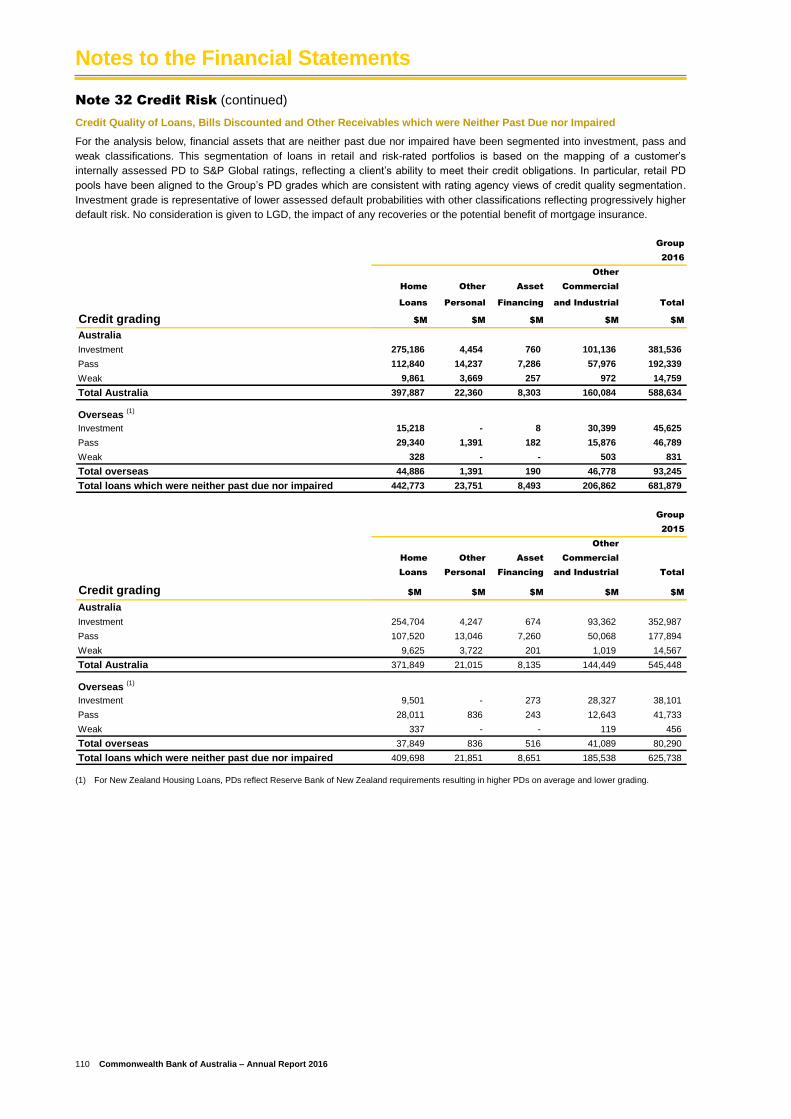
Notes to the Financial Statements
110 Commonwealth Bank of Australia – Annual Report 2016
Note 32 Credit Risk (continued)
Credit Quality of Loans, Bills Discounted and Other Receivables which were Neither Past Due nor Impaired
For the analysis below, financial assets that are neither past due nor impaired have been segmented into investment, pass and
weak classifications. This segmentation of loans in retail and risk-rated portfolios is based on the mapping of a customer’s
internally assessed PD to S&P Global ratings, reflecting a client’s ability to meet their credit obligations. In particular, retail PD
pools have been aligned to the Group’s PD grades which are consistent with rating agency views of credit quality segmentation.
Investment grade is representative of lower assessed default probabilities with other classifications reflecting progressively higher
default risk. No consideration is given to LGD, the impact of any recoveries or the potential benefit of mortgage insurance.
Group
2016
Other
Home Other Asset Commercial
Loans Personal Financing and Industrial Total
Credit grading $M $M $M $M $M
Australia
Investment 275,186 4,454 760 101,136 381,536
Pass 112,840 14,237 7,286 57,976 192,339
Weak 9,861 3,669 257 972 14,759
Total Australia 397,887 22,360 8,303 160,084 588,634
Overseas (1)
Investment 15,218 - 8 30,399 45,625
Pass 29,340 1,391 182 15,876 46,789
Weak 328 - - 503 831
Total overseas 44,886 1,391 190 46,778 93,245
Total loans which were neither past due nor impaired 442,773 23,751 8,493 206,862 681,879
Group
2015
Other
Home Other Asset Commercial
Loans Personal Financing and Industrial Total
Credit grading $M $M $M $M $M
Australia
Investment 254,704 4,247 674 93,362 352,987
Pass 107,520 13,046 7,260 50,068 177,894
Weak 9,625 3,722 201 1,019 14,567
Total Australia 371,849 21,015 8,135 144,449 545,448
Overseas (1)
Investment 9,501 - 273 28,327 38,101
Pass 28,011 836 243 12,643 41,733
Weak 337 - - 119 456
Total overseas 37,849 836 516 41,089 80,290
Total loans which were neither past due nor impaired 409,698 21,851 8,651 185,538 625,738
(1) For New Zealand Housing Loans, PDs reflect Reserve Bank of New Zealand requirements resulting in higher PDs on average and lower grading.

Notes to the Financial Statements
Commonwealth Bank of Australia – Annual Report 2016 111
Note 32 Credit Risk (continued)
Credit Quality of Loans, Bills Discounted and Other Financial Assets which were Neither Past Due nor Impaired (continued)
Bank
2016
Other
Home Other Asset Commercial
Loans Personal Financing and Industrial Total
Credit grading $M $M $M $M $M
Australia
Investment 275,033 4,461 737 100,285 380,516
Pass 107,899 14,191 7,230 57,617 186,937
Weak 9,858 3,655 257 932 14,702
Total Australia 392,790 22,307 8,224 158,834 582,155
Overseas
Investment 115 - - 20,690 20,805
Pass 417 16 - 3,062 3,495
Weak - - - 212 212
Total overseas 532 16 - 23,964 24,512
Total loans which were neither past due nor impaired 393,322 22,323 8,224 182,798 606,667
Bank
2015
Other
Home Other Asset Commercial
Loans Personal Financing and Industrial Total
Credit grading $M $M $M $M $M
Australia
Investment 256,784 4,443 638 89,964 351,829
Pass 101,794 13,717 7,210 50,890 173,611
Weak 9,606 3,942 201 1,075 14,824
Total Australia 368,184 22,102 8,049 141,929 540,264
Overseas
Investment 128 - 258 18,659 19,045
Pass 378 19 - 2,416 2,813
Weak 6 - - 12 18
Total overseas 512 19 258 21,087 21,876
Total loans which were neither past due nor impaired 368,696 22,121 8,307 163,016 562,140

Notes to the Financial Statements
112 Commonwealth Bank of Australia – Annual Report 2016
Note 32 Credit Risk (continued)
Other Financial Assets which were Neither Past Due nor Impaired
The majority of all other financial assets of the Group and the Bank that were neither past due nor impaired as of 30 June 2016
and 30 June 2015 were of investment grade.
Age Analysis of Loans, Bills Discounted and Other Receivables that are Past Due but Not Impaired
For the purposes of this analysis an asset is considered to be past due when any payment under the contractual terms has been
missed.
Past due loans are not classified as impaired if no loss to the Group is expected or if the loans are unsecured consumer loans
and less than 90 days past due.
Group
2016
Other
Home Other Asset Commercial
Loans Personal (1)
Financing and Industrial Total
Loans which were past due but not impaired $M $M $M $M $M
Australia
Past due 1 - 29 days 6,166 592 85 767 7,610
Past due 30 - 59 days 1,755 188 45 154 2,142
Past due 60 - 89 days 877 124 23 102 1,126
Past due 90 - 179 days 1,027 - - 177 1,204
Past due 180 days or more 819 5 2 196 1,022
Total Australia 10,644 909 155 1,396 13,104
Overseas
Past due 1 - 29 days 1,328 238 8 277 1,851
Past due 30 - 59 days 187 41 2 40 270
Past due 60 - 89 days 69 15 1 14 99
Past due 90 - 179 days 38 16 1 6 61
Past due 180 days or more 15 6 - 35 56
Total overseas 1,637 316 12 372 2,337
Total loans which were past due but not impaired 12,281 1,225 167 1,768 15,441
Group
2015
Other
Home Other Asset Commercial
Loans Personal (1)
Financing and Industrial Total
Loans which were past due but not impaired $M $M $M $M $M
Australia
Past due 1 - 29 days 6,131 691 59 878 7,759
Past due 30 - 59 days 1,835 204 43 204 2,286
Past due 60 - 89 days 839 129 27 156 1,151
Past due 90 - 179 days 956 - 1 218 1,175
Past due 180 days or more 729 8 - 294 1,031
Total Australia 10,490 1,032 130 1,750 13,402
Overseas
Past due 1 - 29 days 1,410 218 8 324 1,960
Past due 30 - 59 days 177 32 3 12 224
Past due 60 - 89 days 71 12 1 11 95
Past due 90 - 179 days 49 12 1 21 83
Past due 180 days or more 19 5 - 10 34
Total overseas 1,726 279 13 378 2,396
Total loans which were past due but not impaired 12,216 1,311 143 2,128 15,798
(1) Included in these balances are credit card facilities and other unsecured portfolio managed facilities up to 90 days past due. At 90 days past due, the loans
are classified as impaired.

Notes to the Financial Statements
Commonwealth Bank of Australia – Annual Report 2016 113
Note 32 Credit Risk (continued)
Age Analysis of Loans, Bills Discounted and Other Receivables that are Past Due but Not Impaired (continued)
Bank
2016
Other
Home Other Asset Commercial
Loans Personal (1)
Financing and Industrial Total
Loans which were past due but not impaired $M $M $M $M $M
Australia
Past due 1 - 29 days 6,162 592 85 767 7,606
Past due 30 - 59 days 1,754 188 45 154 2,141
Past due 60 - 89 days 877 124 23 102 1,126
Past due 90 - 179 days 1,026 - - 177 1,203
Past due 180 days or more 819 5 2 196 1,022
Total Australia 10,638 909 155 1,396 13,098
Overseas
Past due 1 - 29 days 9 1 - 3 13
Past due 30 - 59 days - - - 2 2
Past due 60 - 89 days - - - 1 1
Past due 90 - 179 days - - - 2 2
Past due 180 days or more 1 - - - 1
Total overseas 10 1 - 8 19
Total loans which were past due but not impaired 10,648 910 155 1,404 13,117
Bank
2015
Other
Home Other Asset Commercial
Loans Personal (1)
Financing and Industrial Total
Loans which were past due but not impaired $M $M $M $M $M
Australia
Past due 1 - 29 days 6,126 691 59 878 7,754
Past due 30 - 59 days 1,834 204 43 204 2,285
Past due 60 - 89 days 838 129 26 156 1,149
Past due 90 - 179 days 955 - 1 218 1,174
Past due 180 days or more 728 8 - 294 1,030
Total Australia 10,481 1,032 129 1,750 13,392
Overseas
Past due 1 - 29 days 7 - - 1 8
Past due 30 - 59 days - - - - -
Past due 60 - 89 days - - - - -
Past due 90 - 179 days 1 - - 1 2
Past due 180 days or more - - - 1 1
Total overseas 8 - - 3 11
Total loans which were past due but not impaired 10,489 1,032 129 1,753 13,403
(1) Included in these balances are credit card facilities and other unsecured portfolio managed facilities up to 90 days past due. At 90 days past due, the loans
are classified as impaired.
Impaired Assets by Classification
Assets in credit risk rated portfolios and retail managed portfolios are assessed for objective evidence that the financial asset is
impaired.
Impaired assets are split into the following categories:
Non-Performing Facilities;
Restructured Facilities; and
Unsecured retail products 90 days or more past due.
Non-performing facilities are facilities against which an individually assessed provision for impairment has been raised and
facilities where loss of principal or interest is anticipated.
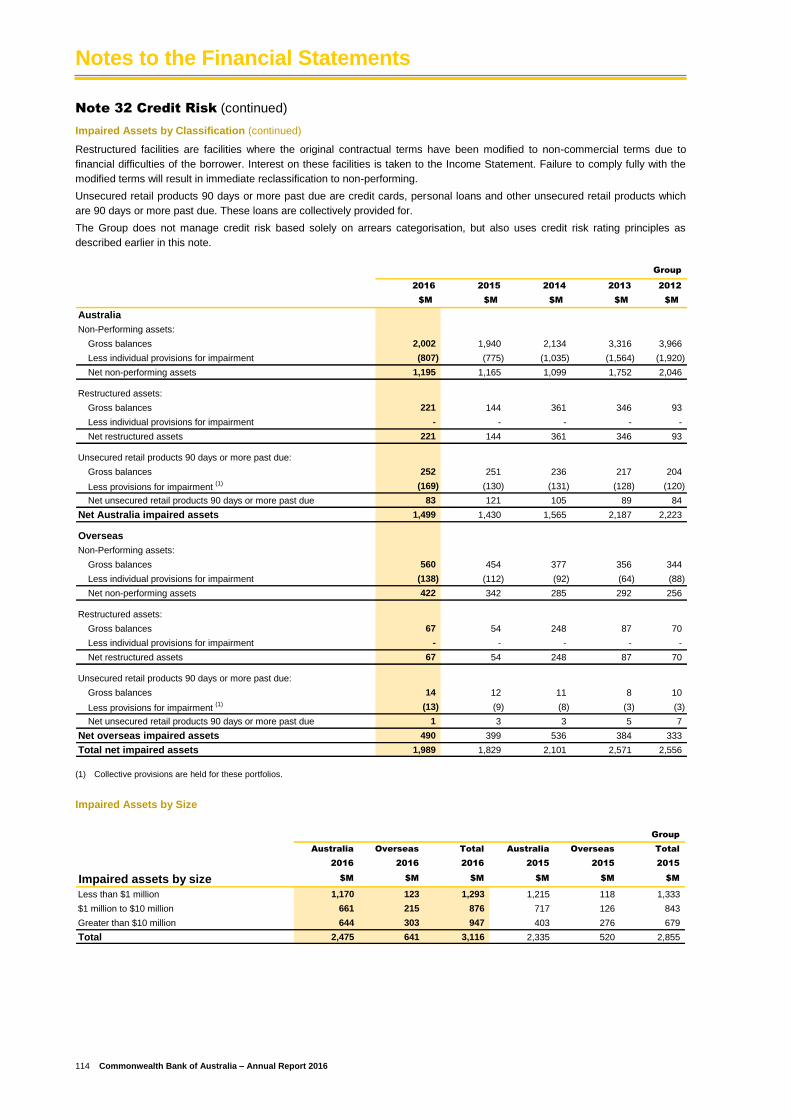
Notes to the Financial Statements
114 Commonwealth Bank of Australia – Annual Report 2016
Note 32 Credit Risk (continued)
Impaired Assets by Classification (continued)
Restructured facilities are facilities where the original contractual terms have been modified to non-commercial terms due to
financial difficulties of the borrower. Interest on these facilities is taken to the Income Statement. Failure to comply fully with the
modified terms will result in immediate reclassification to non-performing.
Unsecured retail products 90 days or more past due are credit cards, personal loans and other unsecured retail products which
are 90 days or more past due. These loans are collectively provided for.
The Group does not manage credit risk based solely on arrears categorisation, but also uses credit risk rating principles as
described earlier in this note.
Group
2016 2015 2014 2013 2012
$M $M $M $M $M
Australia
Non-Performing assets:
Gross balances 2,002 1,940 2,134 3,316 3,966
Less individual provisions for impairment (807) (775) (1,035) (1,564) (1,920)
Net non-performing assets 1,195 1,165 1,099 1,752 2,046
Restructured assets:
Gross balances 221 144 361 346 93
Less individual provisions for impairment - - - - -
Net restructured assets 221 144 361 346 93
Unsecured retail products 90 days or more past due:
Gross balances 252 251 236 217 204
Less provisions for impairment (1) (169) (130) (131) (128) (120)
Net unsecured retail products 90 days or more past due 83 121 105 89 84
Net Australia impaired assets 1,499 1,430 1,565 2,187 2,223
Overseas
Non-Performing assets:
Gross balances 560 454 377 356 344
Less individual provisions for impairment (138) (112) (92) (64) (88)
Net non-performing assets 422 342 285 292 256
Restructured assets:
Gross balances 67 54 248 87 70
Less individual provisions for impairment - - - - -
Net restructured assets 67 54 248 87 70
Unsecured retail products 90 days or more past due:
Gross balances 14 12 11 8 10
Less provisions for impairment (1) (13) (9) (8) (3) (3)
Net unsecured retail products 90 days or more past due 1 3 3 5 7
Net overseas impaired assets 490 399 536 384 333
Total net impaired assets 1,989 1,829 2,101 2,571 2,556 (1) Collective provisions are held for these portfolios.
Impaired Assets by Size
Group
Australia Overseas Total Australia Overseas Total
2016 2016 2016 2015 2015 2015
Impaired assets by size $M $M $M $M $M $M
Less than $1 million 1,170 123 1,293 1,215 118 1,333
$1 million to $10 million 661 215 876 717 126 843
Greater than $10 million 644 303 947 403 276 679
Total 2,475 641 3,116 2,335 520 2,855

Notes to the Financial Statements
Commonwealth Bank of Australia – Annual Report 2016 115
Note 32 Credit Risk (continued)
Movement in Impaired Assets
Group
2016 2015 2014 2013 2012
Movement in gross impaired assets $M $M $M $M $M
Gross impaired assets - opening balance 2,855 3,367 4,330 4,687 5,502
New and increased 2,370 2,095 2,393 3,016 3,389
Balances written off (1,328) (1,355) (1,697) (1,774) (1,687)
Returned to performing or repaid (1,460) (1,903) (2,303) (2,165) (3,040)
Portfolio managed - new/increased/return to performing/repaid 679 651 644 566 523
Gross impaired assets - closing balance 3,116 2,855 3,367 4,330 4,687
Impaired Assets by Industry and Status
Group
2016
Gross Total Provisions Net
Total Impaired for Impaired Impaired Net (1)
Balance Assets Assets Assets Write-offs (1)
Recoveries (1)
Write-offs
Industry $M $M $M $M $M $M $M
Loans - Australia
Sovereign 5,380 - - - - - -
Agriculture 7,191 136 (42) 94 84 (1) 83
Banks and other financial 14,794 18 (29) (11) 10 (27) (17)
Home loans 409,452 921 (193) 728 82 (3) 79
Construction 3,114 28 (25) 3 11 (1) 10
Other personal 23,524 255 (176) 79 747 (154) 593
Asset financing 8,543 85 (28) 57 54 (4) 50
Other commercial and industrial 132,136 953 (483) 470 249 (21) 228
Total loans - Australia 604,134 2,396 (976) 1,420 1,237 (211) 1,026
Loans - Overseas
Sovereign 9,164 - - - - - -
Agriculture 8,744 277 (23) 254 7 - 7
Banks and other financial 5,359 10 (4) 6 - (1) (1)
Home loans 46,622 99 (6) 93 7 (1) 6
Construction 352 14 (8) 6 - - -
Other personal 1,719 12 (15) (3) 54 (10) 44
Asset financing 220 18 (10) 8 - - -
Other commercial and industrial 23,985 153 (76) 77 112 (2) 110
Total loans - overseas 96,165 583 (142) 441 180 (14) 166
Total loans 700,299 2,979 (1,118) 1,861 1,417 (225) 1,192
Other balances - Australia
Credit commitments 151,781 59 - 59 - - -
Derivatives 34,392 20 - 20 - - -
Total other balances -
Australia186,173 79 - 79 - - -
Other balances - Overseas
Credit commitments 30,689 58 (9) 49 - - -
Derivatives 12,175 - - - - - -
Total other balances -
overseas42,864 58 (9) 49 - - -
Total other balances 229,037 137 (9) 128 - - -
Total 929,336 3,116 (1,127) 1,989 1,417 (225) 1,192
(1) Write-offs, recoveries and net write-offs are not recognised against credit commitments or derivatives as these exposures are closed out and converted to loans and receivables on impairment. Write-offs and recoveries take place subsequent to this conversion.

Notes to the Financial Statements
116 Commonwealth Bank of Australia – Annual Report 2016
Note 32 Credit Risk (continued)
Impaired Assets by Industry and Status (continued)
Group
2015
Gross Total Provisions Net
Total Impaired for Impaired Impaired Net (1)
Balance Assets Assets Assets Write-offs (1)
Recoveries (1)
Write-offs
Industry $M $M $M $M $M $M $M
Loans - Australia
Sovereign 5,521 - - - - - -
Agriculture 6,258 347 (133) 214 65 - 65
Bank and other financial 15,157 24 (36) (12) 36 (9) 27
Home loans 383,174 835 (148) 687 72 (3) 69
Construction 2,722 30 (20) 10 14 - 14
Other personal 22,313 266 (140) 126 686 (125) 561
Asset financing 8,356 91 (28) 63 45 (4) 41
Other commercial and industrial 117,557 615 (400) 215 404 (24) 380
Total loans - Australia 561,058 2,208 (905) 1,303 1,322 (165) 1,157
Loans - Overseas
Sovereign 12,929 - - - - - -
Agriculture 7,990 146 (14) 132 3 - 3
Bank and other financial 7,572 10 - 10 69 - 69
Home loans 39,677 102 (10) 92 8 (1) 7
Construction 407 5 (1) 4 - - -
Other personal 1,128 13 (9) 4 42 (10) 32
Asset financing 558 29 (10) 19 - - -
Other commercial and industrial 12,909 179 (69) 110 35 - 35
Total loans - overseas 83,170 484 (113) 371 157 (11) 146
Total loans 644,228 2,692 (1,018) 1,674 1,479 (176) 1,303
Other balances - Australia
Credit commitments 149,673 127 - 127 - - -
Derivatives 37,662 - - - - - -
Total other balances -
Australia 187,335 127 - 127 - - -
Other balances - Overseas
Credit commitments 27,903 36 (8) 28 - - -
Derivatives 8,492 - - - - - -
Total other balances -
overseas 36,395 36 (8) 28 - - -
Total other balances 223,730 163 (8) 155 - - -
Total 867,958 2,855 (1,026) 1,829 1,479 (176) 1,303
(1) Write-offs, recoveries and net write-offs are not recognised against credit commitments or derivatives as these exposures are closed out and converted to
loans and receivables on impairment. Write-offs and recoveries take place subsequent to this conversion.
Collateral held against Loans, Bills Discounted and Other Receivables
Group
2016
Other
Home Other Asset Commercial
Loans Personal Financing and Industrial Total
Maximum exposure ($M) 456,074 25,243 8,763 210,219 700,299
Collateral classification:
Secured (%) 99. 3 13. 6 98. 7 41. 8 78. 9
Partially secured (%) 0. 7 - 1. 3 15. 4 5. 1
Unsecured (%) - 86. 4 - 42. 8 16. 0

Notes to the Financial Statements
Commonwealth Bank of Australia – Annual Report 2016 117
Note 32 Credit Risk (continued)
Collateral held against Loans, Bills Discounted and Other Receivables (continued)
Group
2015
Other
Home Other Asset Commercial
Loans Personal Financing and Industrial Total
Maximum exposure ($M) 422,851 23,441 8,914 189,022 644,228
Collateral classification:
Secured (%) 99. 3 14. 0 98. 7 40. 2 78. 7
Partially secured (%) 0. 7 - 1. 3 13. 7 4. 5
Unsecured (%) - 86. 0 - 46. 1 16. 8
Bank
2016
Other
Home Other Asset Commercial
Loans Personal Financing and Industrial Total
Maximum exposure ($M) 404,902 23,467 8,476 185,416 622,261
Collateral classification:
Secured (%) 99. 2 14. 3 98. 8 40. 7 78. 5
Partially secured (%) 0. 8 - 1. 2 14. 6 4. 9
Unsecured (%) - 85. 7 - 44. 7 16. 6
Bank
2015
Other
Home Other Asset Commercial
Loans Personal Financing and Industrial Total
Maximum exposure ($M) 380,022 23,419 8,307 166,113 577,861
Collateral classification:
Secured (%) 99. 2 14. 5 98. 4 39. 3 78. 7
Partially secured (%) 0. 8 - 1. 6 13. 1 4. 3
Unsecured (%) - 85. 5 - 47. 6 17. 0
A facility is determined to be secured where its ratio of exposure to the estimated value of collateral (adjusted for lending margins)
is less than or equal to 100%. A facility is deemed to be partly secured when this ratio exceeds 100% but not more than 250%,
and unsecured when either no security is held (e.g. can include credit cards, personal loans, small business loans, and exposures
to highly rated corporate entities), or where the secured loan to estimated value of collateral exceeds 250%.
Home Loans
All home loans are secured by fixed charges over borrowers’ residential properties, other properties (including commercial and
broad acre), or cash (usually in the form of a charge over a deposit). Further, with the exception of some relatively small
portfolios, for loans with a Loan to Valuation (LVR) of higher than 80% either a Low Deposit Premium or margin is levied, or
Lenders Mortgage Insurance (LMI) is taken out to cover 100% of the principal amount at default plus interest.
Personal Lending
Personal lending (such as credit cards), is predominantly unsecured.
Asset Finance
The Group leases assets to corporate and retail clients. When the title to the underlying assets is held by the Group as collateral,
the balance is deemed fully secured. In other instances, a client’s facilities may be secured by collateral valued at less than the
carrying amount of credit exposure. These facilities are deemed partly secured or unsecured.
Other Commercial and Industrial Lending
The Group’s main collateral types for other commercial and industrial lending consists of secured rights over specified assets of
the borrower in the form of: commercial property; land rights; cash (usually in the form of a charge over a deposit); guarantees by
company directors supporting commercial lending; a charge over a company’s assets (including debtors, inventory and work in
progress); or a charge over stock or scrip. In other instances, a client’s facilities may be secured by collateral with value less than
the carrying amount of the credit exposure. These facilities are deemed partly secured or unsecured.

Notes to the Financial Statements
118 Commonwealth Bank of Australia – Annual Report 2016
Note 33 Market Risk
Market Risk Measurement
The Group uses Value-at-Risk (VaR) as one of the measures
of Traded and Non-traded market risk. VaR is a statistical
measure of potential loss using historically observed market
movements.
VaR is modelled at a 97.5% confidence level. This means
that there is a 97.5% probability that the loss will not exceed
the VaR estimate on any given day.
The VaR measured for Traded market risk uses two years of
daily movement in market rates. The VaR measure for Non-
traded Banking Book market risk uses six years of daily
movement in market rates.
A 1-day holding period is used for trading book positions. A
20-day holding period is used for Interest Rate Risk in the
Banking Book, insurance business market risk and Non-
traded equity risk.
VaR is driven by historical observations and is not an
estimate of the maximum loss that the Group could
experience from an extreme market event. As a result of this
limitation, management also uses additional controls to
measure and manage market risk including stress testing, risk
sensitivity and position limits.
Average As at Average As at
Total Market Risk June June June June
VaR (1-day 97.5% 2016 (1)
2016 2015 (1)
2015
confidence) $M $M $M $M
Traded Market Risk (2) (3) 10. 1 16. 9 8. 9 8. 9
Non-Traded Interest Rate
Risk (4) 14. 7 17. 2 15. 1 16. 7
Non-Traded Equity Risk (4) 10. 2 7. 5 14. 3 12. 9
Non-Traded Insurance
Market Risk (4) 4. 5 5. 0 5. 0 3. 7
(1) Average VaR calculated for each 12 month period.
(2) For the balance as at 30 June 2016, the increase in traded market risk VaR was mainly driven by a conservative measurement approach for longer term interest rates, particularly in currencies with negative or near zero rates. This approach is under review.
(3) The increase in average VaR on the prior year relates to higher market volatility and the above conservative measurement approach.
(4) The risk of these exposures has been represented in this table using a one day holding period. In practice however, these ‘non-traded’ exposures are managed to a longer holding period.
Traded Market Risk
Traded Market Risk is generated through the Group’s
participation in financial markets to service its customers. The
Group trades and distributes interest rate, foreign exchange,
debt, equity and commodity products, and provides treasury,
capital markets and risk management services to its
customers globally.
The Group maintains access to markets by quoting bid and
offer prices with other market makers and carries an inventory
of financial instruments, including a broad range of securities
and derivatives.
(1) Average VaR calculated for each 12 month period. (2) For the balance as at 30 June 2016, the increase in traded market risk
VaR was mainly driven by a conservative measurement approach for longer term interest rates, particularly in currencies with negative or near zero rates. This approach is under review.
(3) The increase in average VaR on the prior year relates to higher market volatility and the above conservative measurement approach.
Non-Traded Market Risk
Interest Rate Risk in the Banking Book
Interest rate risk is the current and prospective impact to the
Group’s financial condition due to adverse changes in interest
rates to which the Group’s Balance Sheet is exposed.
Maturity transformation activities of the Group result in
mismatched assets and liabilities positions which direct that
the propensity, timing and quantum of interest rate
movements have undesired outcomes over both the short-
term and long-term. The Group’s objective is to manage
interest rate risk to achieve stable and sustainable net interest
income in the long-term.
The Group measures and manages the impact of interest rate
risk in two ways:
(a) Next 12 months’ earnings
Interest rate risk from an earnings perspective is the impact
based on changes to the net interest income over the next 12
months.
The risk to net interest income over the next 12 months from
changes in interest rates is measured on a monthly basis.
Earnings risk is measured through sensitivity analysis, which
applies an instantaneous 100 basis point parallel shock in
interest rates across the yield curve.
The prospective change to the net interest income is
measured by using an Asset and Liability Management
simulation model which incorporates both existing and
anticipated new business in its assessment. The change in
the Balance Sheet product mix, growth, funding and pricing
strategies is incorporated. Assets and liabilities that reprice
directly from observable market rates are measured based on
the full extent of the rate shock that is applied.
Products that are priced based on Group administered or
discretionary interest rates and that are impacted by customer
behaviour are measured by taking into consideration the
historic repricing strategy of the Group and repricing
behaviours of customers. In addition to considering how the
products have repriced in the past the expected change in
price based on both the current and anticipated competitive
market forces are also considered in the sensitivity analysis.
Average As at Average As at
Traded Market Risk June June June June
VaR (1-day 97.5% 2016 (1)
2016 2015 (1)
2015
confidence) $M $M $M $M
Interest rate risk (2) (3) 7. 9 16. 7 5. 8 5. 2
Foreign exchange risk 2. 4 1. 7 2. 0 1. 9
Equities risk 0. 4 1. 1 0. 6 0. 3
Commodities risk 2. 2 2. 3 1. 5 2. 3
Credit spread risk 3. 0 3. 2 2. 7 3. 2
Diversification benefit (8. 3) (10. 4) (7. 3) (7. 8)
Total general market risk 7. 6 14. 6 5. 3 5. 1
Undiversified risk 2. 3 2. 1 3. 4 3. 7
ASB Bank 0. 2 0. 2 0. 2 0. 1
Total 10. 1 16. 9 8. 9 8. 9
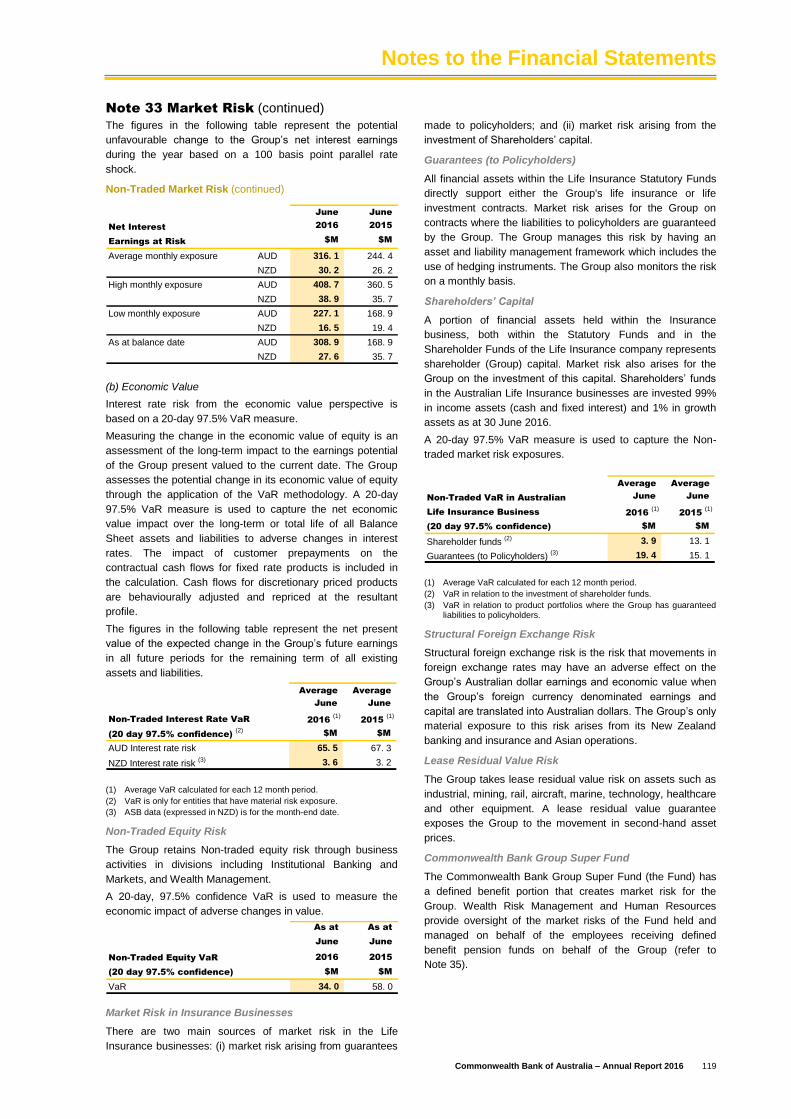
Notes to the Financial Statements
Commonwealth Bank of Australia – Annual Report 2016 119
Note 33 Market Risk (continued)
The figures in the following table represent the potential
unfavourable change to the Group’s net interest earnings
during the year based on a 100 basis point parallel rate
shock.
Non-Traded Market Risk (continued)
June June
Net Interest 2016 2015
Earnings at Risk $M $M
Average monthly exposure AUD 316. 1 244. 4
NZD 30. 2 26. 2
High monthly exposure AUD 408. 7 360. 5
NZD 38. 9 35. 7
Low monthly exposure AUD 227. 1 168. 9
NZD 16. 5 19. 4
As at balance date AUD 308. 9 168. 9
NZD 27. 6 35. 7
(b) Economic Value
Interest rate risk from the economic value perspective is
based on a 20-day 97.5% VaR measure.
Measuring the change in the economic value of equity is an
assessment of the long-term impact to the earnings potential
of the Group present valued to the current date. The Group
assesses the potential change in its economic value of equity
through the application of the VaR methodology. A 20-day
97.5% VaR measure is used to capture the net economic
value impact over the long-term or total life of all Balance
Sheet assets and liabilities to adverse changes in interest
rates. The impact of customer prepayments on the
contractual cash flows for fixed rate products is included in
the calculation. Cash flows for discretionary priced products
are behaviourally adjusted and repriced at the resultant
profile.
The figures in the following table represent the net present
value of the expected change in the Group’s future earnings
in all future periods for the remaining term of all existing
assets and liabilities.
Average Average
June June
Non-Traded Interest Rate VaR 2016 (1)
2015 (1)
(20 day 97.5% confidence) (2)
$M $M
AUD Interest rate risk 65. 5 67. 3
NZD Interest rate risk (3) 3. 6 3. 2
(1) Average VaR calculated for each 12 month period.
(2) VaR is only for entities that have material risk exposure.
(3) ASB data (expressed in NZD) is for the month-end date.
Non-Traded Equity Risk
The Group retains Non-traded equity risk through business
activities in divisions including Institutional Banking and
Markets, and Wealth Management.
A 20-day, 97.5% confidence VaR is used to measure the
economic impact of adverse changes in value.
As at As at
June June
Non-Traded Equity VaR 2016 2015
(20 day 97.5% confidence) $M $M
VaR 34. 0 58. 0
Market Risk in Insurance Businesses
There are two main sources of market risk in the Life
Insurance businesses: (i) market risk arising from guarantees
made to policyholders; and (ii) market risk arising from the
investment of Shareholders’ capital.
Guarantees (to Policyholders)
All financial assets within the Life Insurance Statutory Funds
directly support either the Group's life insurance or life
investment contracts. Market risk arises for the Group on
contracts where the liabilities to policyholders are guaranteed
by the Group. The Group manages this risk by having an
asset and liability management framework which includes the
use of hedging instruments. The Group also monitors the risk
on a monthly basis.
Shareholders’ Capital
A portion of financial assets held within the Insurance
business, both within the Statutory Funds and in the
Shareholder Funds of the Life Insurance company represents
shareholder (Group) capital. Market risk also arises for the
Group on the investment of this capital. Shareholders’ funds
in the Australian Life Insurance businesses are invested 99%
in income assets (cash and fixed interest) and 1% in growth
assets as at 30 June 2016.
A 20-day 97.5% VaR measure is used to capture the Non-
traded market risk exposures.
Average Average
Non-Traded VaR in Australian June June
Life Insurance Business 2016 (1)
2015 (1)
(20 day 97.5% confidence) $M $M
Shareholder funds (2) 3. 9 13. 1
Guarantees (to Policyholders) (3) 19. 4 15. 1
(1) Average VaR calculated for each 12 month period.
(2) VaR in relation to the investment of shareholder funds.
(3) VaR in relation to product portfolios where the Group has guaranteed liabilities to policyholders.
Structural Foreign Exchange Risk
Structural foreign exchange risk is the risk that movements in
foreign exchange rates may have an adverse effect on the
Group’s Australian dollar earnings and economic value when
the Group’s foreign currency denominated earnings and
capital are translated into Australian dollars. The Group’s only
material exposure to this risk arises from its New Zealand
banking and insurance and Asian operations.
Lease Residual Value Risk
The Group takes lease residual value risk on assets such as
industrial, mining, rail, aircraft, marine, technology, healthcare
and other equipment. A lease residual value guarantee
exposes the Group to the movement in second-hand asset
prices.
Commonwealth Bank Group Super Fund
The Commonwealth Bank Group Super Fund (the Fund) has
a defined benefit portion that creates market risk for the
Group. Wealth Risk Management and Human Resources
provide oversight of the market risks of the Fund held and
managed on behalf of the employees receiving defined
benefit pension funds on behalf of the Group (refer to
Note 35).

Notes to the Financial Statements
120 Commonwealth Bank of Australia – Annual Report 2016
Note 34 Liquidity and Funding Risk
Overview
The Group’s liquidity and funding policies are designed to
ensure it will meet its obligations as and when they fall due
by ensuring it is able to borrow funds on an unsecured
basis, has sufficient liquid assets to borrow against on a
secured basis, or sell to raise immediate funds without
adversely affecting the Group’s net asset value.
The Group’s liquidity policies are designed to ensure it
maintains sufficient cash balances and liquid asset holdings
to meet its obligations to customers, in both ordinary
market conditions and during periods of extreme stress.
These policies are intended to protect the value of the
Group’s operations during periods of unfavourable market
conditions.
The Group’s funding policies are designed to achieve
diversified sources of funding by product, term, maturity
date, investor type, investor location, jurisdiction, currency
and concentration, on a cost effective basis. This objective
applies to the Group’s wholesale and retail funding
activities.
Liquidity and Funding Risk Management Framework
The Group’s liquidity and funding policies, structured under
a formal Group Liquidity and Funding Risk Management
Framework, are approved by the Board and agreed with
APRA. The Group has an Asset and Liability Committee
(ALCO) whose charter includes reviewing the management
of assets and liabilities, reviewing liquidity and funding
policies and strategies, as well as regularly monitoring
compliance with those policies across the Group. Group
Treasury manages the Group’s liquidity and funding
positions in accordance with the Group’s liquidity policies
and has ultimate authority to execute liquidity decisions
should the Group Contingent Funding Plan be activated.
Group Risk Management provides oversight of the Group’s
liquidity and funding risks, compliance with Group policies
and manages the Group’s relationship with prudential
regulators.
Subsidiaries within the Colonial Group apply their own
liquidity and funding strategies to address their specific
needs. The Group’s New Zealand banking subsidiary, ASB
Bank, manages its own domestic liquidity and funding
needs in accordance with its own liquidity policies and the
policies of the Group. ASB’s liquidity policy is also overseen
by the Reserve Bank of New Zealand. The Group also has
a small banking subsidiary in Indonesia that manages its
own liquidity and funding on a similar basis. The Group’s
Board is ultimately responsible for the sound and prudent
management of liquidity risk across the Group.
Liquidity and Funding Policies and Management
The Group’s liquidity and funding policies provide that:
An excess of liquid assets over the level prescribed
under APRA’s Liquidity Coverage Ratio (LCR)
requirement is maintained. Australian ADIs are
required to meet a 100% LCR, calculated as the ratio
of high quality liquid assets to 30 day net cash
outflows projected under a prescribed stress scenario;
Group ‘going concern’ funding and liquidity metrics are
also calculated and stress tests additional to the LCR
are run;
Short and long-term wholesale funding limits are
established, monitored and reviewed regularly. The
Group’s market capacity is regularly assessed and
used as a factor in funding strategies;
Balance Sheet assets that cannot be liquidated quickly
are funded with deposits or term borrowings that meet
minimum maturity requirements with appropriate
liquidity buffers;
Liquid assets are held in Australian dollar and foreign
currency denominated securities in accordance with
expected requirements;
The Group has three categories of liquid assets within
its domestic liquid assets portfolio. The first includes
cash, government and Australian semi-government
securities. The second includes negotiable certificates
of deposit, bank bills, bank term securities,
supranational bonds and Australian Residential
Mortgage-backed Securities (RMBS), securities that
meet Reserve Bank of Australia (RBA) criteria for
purchases under reverse repo. The final category is
internal RMBS, being mortgages that have been
securitised but retained by the Bank, that are repo-
eligible with the RBA under stress; and
Offshore branches and subsidiaries adhere to liquidity
policies and hold appropriate foreign currency liquid
assets as required. All securities are central bank
repo-eligible under normal market conditions.
The Group’s key funding tools include:
Its consumer retail funding base, which includes a
wide range of retail transaction accounts, savings
accounts and term deposits for individual consumers;
Its small business customer and institutional deposit
base; and
Its wholesale international and domestic funding
programs which include its Australian dollar
Negotiable Certificates of Deposit; Australian dollar
bank bills; Asian Transferable Certificates of Deposit
program; Australian, U.S. and Euro Commercial Paper
programs; U.S. Extendible Notes programs; Australian
dollar Domestic Debt Program; U.S.144a and 3a2
Medium-Term Note Programs; Euro Medium-Term
Note Program, multi jurisdiction Covered Bond
program, and its Medallion securitisation program.
The Group’s key liquidity tools include:
A regulatory liquidity management reporting system
delivering granular customer and product type
information to inform business decision making,
product development and resulting in a greater
awareness of the liquidity risk adjusted value of
banking products;
A liquidity management model similar to a “maturity
ladder” or “liquidity gap analysis”, that allows
forecasting of liquidity needs on a daily basis;
An additional liquidity management model that
implements the agreed prudential liquidity policies.
This model is calibrated with a series of “stress”
liquidity crisis scenarios, incorporating both systemic
and “name” crisis assumptions, such that the Group
will have sufficient liquid assets available to ensure it
meets all of its obligations as and when they fall due;

Notes to the Financial Statements
Commonwealth Bank of Australia – Annual Report 2016 121
Note 34 Liquidity and Funding Risk (continued)
Liquidity and Funding Policies and Management (continued)
Central bank repurchase agreement facilities including
the RBA’s open-ended Committed Liquidity Facility
that provide the Group with the ability to borrow funds
on a secured basis, even when normal funding
markets are unavailable; and
A robust Contingent Funding Plan that is regularly
tested so that it can be activated in case of need due
to a liquidity event.
The Group’s wholesale funding costs were impacted by
elevated levels of volatility over the course of the financial
year as slowing growth in China, lower commodity prices,
headline risk in European banks and equity price volatility
combined to push credit spreads wider in domestic and
international debt capital markets. The Group has managed
its debt portfolio to avoid concentrations such as
dependence on single sources of funding, by type or by
investor, and continues to maintain a diversified funding
base and significant funding capacity in the domestic and
global unsecured and secured debt markets.
Details of the Group’s regulatory capital management
activities and processes are disclosed in Note 25.
Maturity Analysis of Monetary Liabilities
Amounts shown in the tables below are based on contractual undiscounted cash flows for the remaining contractual maturities.
Group
Maturity Period as at 30 June 2016
0 to 3 3 to 12 1 to 5 Over 5 Not
Months Months Years Years Specified Total
$M $M $M $M $M $M
Monetary liabilities
Deposits and other public borrowings (1) 492,838 75,236 20,773 561 - 589,408
Payables due to other financial institutions 27,247 1,545 3 - - 28,795
Liabilities at fair value through Income Statement 6,128 1,724 1,247 1,209 - 10,308
Derivative financial instruments:
Held for trading 27,959 - - - - 27,959
Held for hedging purposes (net-settled) (510) 514 1,889 2,729 - 4,622
Held for hedging purposes (gross-settled):
Outflows 3,431 22,451 35,336 22,289 - 83,507
Inflows (3,271) (20,072) (32,938) (20,982) - (77,263)
Bank acceptances 1,378 53 - - - 1,431
Insurance policy liabilities - - - - 12,636 12,636
Debt issues and loan capital 19,059 46,358 82,969 32,358 - 180,744
Managed funds units on issue - - - - 1,606 1,606
Other monetary liabilities 4,657 1,445 88 4 13 6,207
Total monetary liabilities 578,916 129,254 109,367 38,168 14,255 869,960
Guarantees (2) 6,216 - - - - 6,216
Loan commitments (2) 170,742 - - - - 170,742
Other commitments (2) 5,512 - - - - 5,512
Total off Balance Sheet items 182,470 - - - - 182,470
Total monetary liabilities and off Balance Sheet
items 761,386 129,254 109,367 38,168 14,255 1,052,430
(1) Includes deposits that are contractually at call, customer savings and cheque accounts. Historical experience is that such accounts provide a stable source
of long-term funding for the Group.
(2) All off Balance Sheet items are included in the 0 to 3 months maturity band to reflect their earliest possible maturity.

Notes to the Financial Statements
122 Commonwealth Bank of Australia – Annual Report 2016
Note 34 Liquidity and Funding Risk (continued)
Maturity Analysis of Monetary Liabilities (continued)
Group
Maturity Period as at 30 June 2015
0 to 3 3 to 12 1 to 5 Over 5 Not
Months Months Years Years Specified Total
$M $M $M $M $M $M
Monetary liabilities
Deposits and other public borrowings (1) 441,294 82,068 23,334 139 - 546,835
Payables due to other financial institutions 33,142 3,297 - - - 36,439
Liabilities at fair value through Income Statement 3,016 1,404 2,183 1,950 - 8,553
Derivative financial instruments:
Held for trading 22,765 - - - - 22,765
Held for hedging purposes (net-settled) 66 410 2,418 1,978 - 4,872
Held for hedging purposes (gross-settled):
Outflows 208 7,382 30,763 11,537 - 49,890
Inflows (206) (5,962) (25,434) (10,025) - (41,627)
Bank acceptances 1,870 74 - - - 1,944
Insurance policy liabilities - - - - 12,911 12,911
Debt issues and loan capital 22,217 42,421 79,059 38,707 - 182,404
Managed funds units on issue - - - - 1,149 1,149
Other monetary liabilities 6,176 1,320 329 - 54 7,879
Total monetary liabilities 530,548 132,414 112,652 44,286 14,114 834,014
Guarantees (2) 6,181 - - - - 6,181
Loan commitments (2) 165,511 - - - - 165,511
Other commitments (2) 5,884 - - - - 5,884
Total off Balance Sheet items 177,576 - - - - 177,576
Total monetary liabilities and off Balance Sheet
items 708,124 132,414 112,652 44,286 14,114 1,011,590
Bank
Maturity Period as at 30 June 2016
0 to 3 3 to 12 1 to 5 Over 5 Not
Months Months Years Years Specified Total
$M $M $M $M $M $M
Monetary liabilities
Deposits and other public borrowings (1) 456,306 63,101 17,641 180 - 537,228
Payables due to other financial institutions 26,804 1,545 3 - - 28,352
Liabilities at fair value through Income Statement 3,844 1,151 1,247 1,210 - 7,452
Derivative financial instruments:
Held for trading 27,672 - - - - 27,672
Held for hedging purposes (net-settled) (604) 327 1,620 2,813 - 4,156
Held for hedging purposes (gross-settled):
Outflows 3,143 26,209 40,622 35,132 - 105,106
Inflows (2,906) (22,059) (36,762) (31,333) - (93,060)
Bank acceptances 1,359 54 - - - 1,413
Debt issues and loan capital 16,495 41,229 65,816 27,965 - 151,505
Due to controlled entities 6,681 6,365 24,266 92,735 - 130,047
Other monetary liabilities 4,442 4,688 56 2 5 9,193
Total monetary liabilities 543,236 122,610 114,509 128,704 5 909,064
Guarantees (2) 5,873 - - - - 5,873
Loan commitments (2) 155,446 - - - - 155,446
Other commitments (2) 4,868 - - - - 4,868
Total off Balance Sheet items 166,187 - - - - 166,187
Total monetary liabilities and off Balance Sheet
items 709,423 122,610 114,509 128,704 5 1,075,251
(1) Includes deposits that are contractually at call, customer savings and cheque accounts. Historical experience is that such accounts provide a stable source
of long-term funding for the Group and Bank.
(2) All off Balance Sheet items are included in the 0 to 3 months maturity band to reflect their earliest possible maturity.

Notes to the Financial Statements
Commonwealth Bank of Australia – Annual Report 2016 123
Note 34 Liquidity and Funding Risk (continued)
Maturity Analysis of Monetary Liabilities (continued)
Bank
Maturity Period as at 30 June 2015
0 to 3 3 to 12 1 to 5 Over 5 Not
Months Months Years Years Specified Total
$M $M $M $M $M $M
Monetary liabilities
Deposits and other public borrowings (1) 409,892 70,024 20,589 139 - 500,644
Payables due to other financial institutions 32,305 3,233 - - - 35,538
Liabilities at fair value through Income Statement 2,015 1,229 2,170 1,950 - 7,364
Derivative financial instruments:
Held for trading 22,527 - - - - 22,527
Held for hedging purposes (net-settled) 27 261 2,339 2,036 - 4,663
Held for hedging purposes (gross-settled):
Outflows - 6,722 41,272 20,695 - 68,689
Inflows - (5,342) (33,776) (17,576) - (56,694)
Bank acceptances 1,845 63 - - - 1,908
Debt issues and loan capital 20,109 37,777 62,332 35,837 - 156,055
Due to controlled entities 6,501 5,678 23,365 90,964 - 126,508
Other monetary liabilities 5,535 6,589 70 - 21 12,215
Total monetary liabilities 500,756 126,234 118,361 134,045 21 879,417
Guarantees (2) 5,778 - - - - 5,778
Loan commitments (2) 152,772 - - - - 152,772
Other commitments (2) 5,179 - - - - 5,179
Total off Balance Sheet items 163,729 - - - - 163,729
Total monetary liabilities and off Balance Sheet
items 664,485 126,234 118,361 134,045 21 1,043,146
(1) Includes deposits that are contractually at call, customer savings and cheque accounts. Historical experience is that such accounts provide a stable source
of long-term funding for the Bank.
(2) All off Balance Sheet items are included in the 0 to 3 months maturity band to reflect their earliest possible maturity.
Note 35 Retirement Benefit Obligations
Name of Plan Type Form of Benefit
Date of Last Actuarial
Assessment of the Fund
Commonwealth Bank Group
Super
Defined Benefits (1)
and Accumulation
Indexed pension and lump sum 30 June 2015
Commonwealth Bank of
Australia (UK) Staff Benefits
Scheme (CBA (UK) SBS)
Defined Benefits (1)
and Accumulation
Indexed pension and lump sum 30 June 2013 (2)
(1) The defined benefit formulae are generally comprised of final salary, or final average salary, and service.
(2) An actuarial assessment of the Fund at 30 June 2016 is currently in progress.
Regulatory Framework
Both plans operate under trust law with the assets of the plans held separately in trust. The Trustee of Commonwealth Bank
Group Super is Commonwealth Bank Officers Superannuation Corporation Pty Limited. The Trustee of CBA (UK) SBS is
Commonwealth Bank of Australia (UK) Staff Benefits Scheme Trustee Company Limited. Both Trustees are wholly owned
subsidiaries of the Group. The Trustees do not conduct any business other than trusteeship of the plans. The plans are managed
and administered on behalf of the members in accordance with the terms of each trust deed and relevant legislation. The funding
of the plans complies with regulations in Australia and the UK respectively.
Funding and Contributions
An actuarial assessment as at 30 June 2015 showed Commonwealth Bank Group Super remained in funding surplus. The Bank
agreed to continue contributions of $20 million per month to the plan. Employer contributions paid to the plan are subject to tax at
the rate of 15% in the plan.
An actuarial assessment of the CBA (UK) SBS as at 30 June 2013 confirmed a funding deficit of GBP62 million ($112 million at
the 30 June 2016 exchange rate). The Bank agreed to continue the deficit recovery contributions of GBP15 million per annum
($27 million at the 30 June 2016 exchange rate) until 31 December 2017 to CBA (UK) SBS in addition to the regular GBP3 million
per annum ($6 million at the 30 June 2016 exchange rate) contributions for future defined benefit accruals.
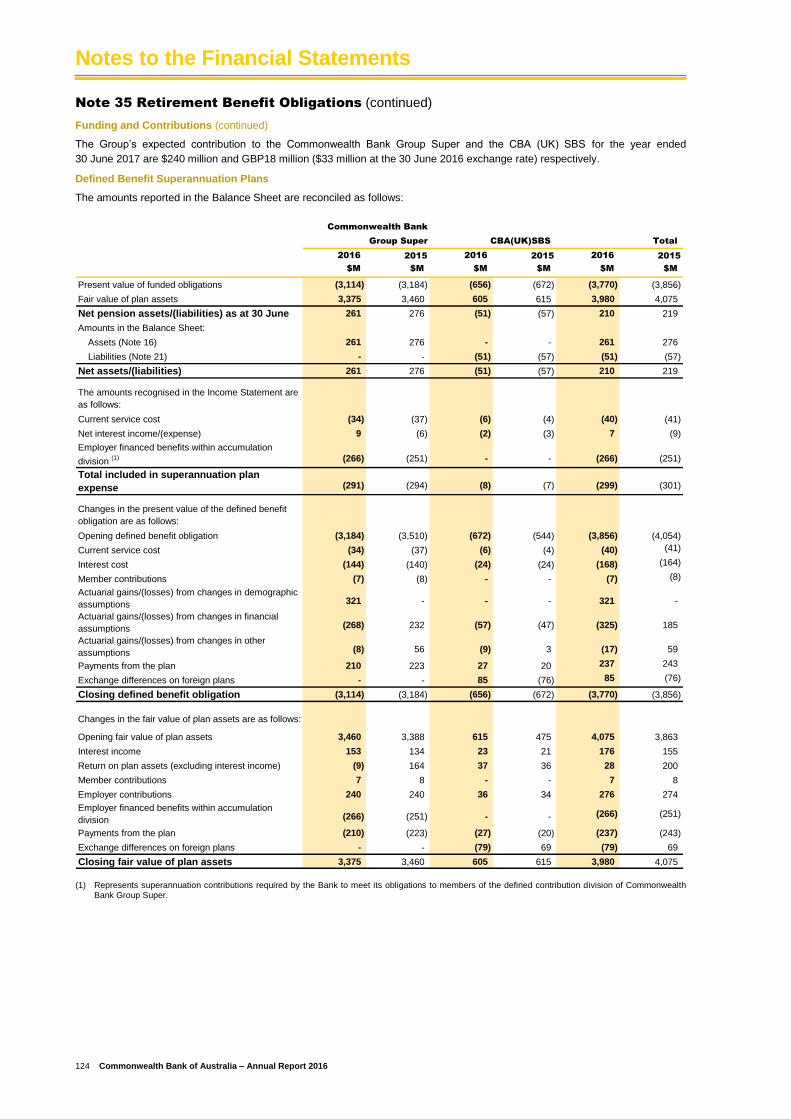
Notes to the Financial Statements
124 Commonwealth Bank of Australia – Annual Report 2016
Note 35 Retirement Benefit Obligations (continued)
Funding and Contributions (continued)
The Group’s expected contribution to the Commonwealth Bank Group Super and the CBA (UK) SBS for the year ended
30 June 2017 are $240 million and GBP18 million ($33 million at the 30 June 2016 exchange rate) respectively.
Defined Benefit Superannuation Plans
The amounts reported in the Balance Sheet are reconciled as follows:
CBA(UK)SBS Total
2016 2015 2016 2015 2016 2015
$M $M $M $M $M $M
Present value of funded obligations (3,114) (3,184) (656) (672) (3,770) (3,856)
Fair value of plan assets 3,375 3,460 605 615 3,980 4,075
Net pension assets/(liabilities) as at 30 June 261 276 (51) (57) 210 219
Amounts in the Balance Sheet:
Assets (Note 16) 261 276 - - 261 276
Liabilities (Note 21) - - (51) (57) (51) (57)
Net assets/(liabilities) 261 276 (51) (57) 210 219
The amounts recognised in the Income Statement are
as follows:
Current service cost (34) (37) (6) (4) (40) (41)
Net interest income/(expense) 9 (6) (2) (3) 7 (9)
Employer financed benefits within accumulation
division (1) (266) (251) - - (266) (251)
Total included in superannuation plan
expense (291) (294) (8) (7) (299) (301)
Changes in the present value of the defined benefit
obligation are as follows:
Opening defined benefit obligation (3,184) (3,510) (672) (544) (3,856) (4,054)
Current service cost (34) (37) (6) (4) (40) (41)
Interest cost (144) (140) (24) (24) (168) (164)
Member contributions (7) (8) - - (7) (8)
Actuarial gains/(losses) from changes in demographic
assumptions 321 - - - 321 -
Actuarial gains/(losses) from changes in financial
assumptions (268) 232 (57) (47) (325) 185
Actuarial gains/(losses) from changes in other
assumptions (8) 56 (9) 3 (17) 59
Payments from the plan 210 223 27 20 237 243
Exchange differences on foreign plans - - 85 (76) 85 (76)
Closing defined benefit obligation (3,114) (3,184) (656) (672) (3,770) (3,856)
Changes in the fair value of plan assets are as follows:
Opening fair value of plan assets 3,460 3,388 615 475 4,075 3,863
Interest income 153 134 23 21 176 155
Return on plan assets (excluding interest income) (9) 164 37 36 28 200
Member contributions 7 8 - - 7 8
Employer contributions 240 240 36 34 276 274
Employer financed benefits within accumulation
division (266) (251) - - (266) (251)
Payments from the plan (210) (223) (27) (20) (237) (243)
Exchange differences on foreign plans - - (79) 69 (79) 69
Closing fair value of plan assets 3,375 3,460 605 615 3,980 4,075
Commonwealth Bank
Group Super
(1) Represents superannuation contributions required by the Bank to meet its obligations to members of the defined contribution division of Commonwealth Bank Group Super.

Notes to the Financial Statements
Commonwealth Bank of Australia – Annual Report 2016 125
Note 35 Retirement Benefit Obligations (continued)
Economic Assumptions
Commonwealth Bank
Group Super CBA(UK)SBS
2016 2015 2016 2015
Economic assumptions % % % %
The above calculations were based on the following assumptions:
Discount rate 3. 40 4. 60 3. 00 3. 70
Inflation rate 1. 60 2. 25 3. 10 3. 50
Rate of increases in salary 2. 60 3. 50 4. 10 4. 50
In addition to financial assumptions, the mortality assumptions for pensioners can materially impact the defined benefit
obligations. These assumptions are age related and allowances are made for future improvement in mortality. The expected life
expectancies (longevity) for pensioners are set out below:
Commonwealth Bank
Group Super CBA(UK)SBS
2016 2015 2016 2015
Expected life expectancies for pensioners Years Years Years Years
Male pensioners currently aged 60 28. 6 29. 6 28. 7 28. 5
Male pensioners currently aged 65 23. 6 24. 7 23. 8 23. 7
Female pensioners currently aged 60 33. 0 34. 7 31. 2 31. 1
Female pensioners currently aged 65 27. 9 29. 5 26. 2 26. 1
Sensitivity to Changes in Assumptions
The table below sets out the sensitivities of the present value of defined benefit obligations at 30 June to a change in the principal
actuarial assumptions:
Commonwealth Bank
Group Super CBA(UK)SBS
2016 2016
Impact of change in assumptions on liabilities % %
0.25% decrease in discount rate 3. 44 4. 70
0.25% increase in inflation rate 2. 67 2. 90
0.25% increase to the rate of increases in salary 0. 48 0. 30
Longevity increase of 1 year 4. 37 3. 40
Average Duration
The average duration of defined benefit obligation at 30 June is as follows:
Commonwealth Bank
Group Super CBA(UK)SBS
2016 2016
Years Years
Average duration at balance date 12 19
Risk Management
The pension plans expose the Group to longevity risk, currency risk, interest rate risk, inflation risk and market risk. The Trustees
perform Asset-Liability Matching (ALM) exercises to ensure the plan assets are well matched to the nature and maturities of the
defined benefit obligations.
The Commonwealth Bank Group Super’s investment strategy comprises 39% growth and 61% defensive assets. Inflation and
interest rate risks are partly mitigated by investing in long dated fixed interest securities which better match the average duration
of liabilities and entering into inflation and interest swaps.

Notes to the Financial Statements
126 Commonwealth Bank of Australia – Annual Report 2016
Note 35 Retirement Benefit Obligations (continued)
Risk Management (continued)
The allocation of assets backing the defined benefit portion of Commonwealth Bank Group Super is as follows:
Commonwealth Bank Group Super
2016 2015
Fair value % of plan Fair value % of plan
Asset allocations ($M) asset ($M) asset
Cash 108 3. 2 159 4. 6
Equities - Australian (1) 311 9. 2 289 8. 4
Equities - Overseas (1) 431 12. 8 608 17. 6
Bonds - Commonwealth Government (1) 670 19. 9 595 17. 2
Bonds - Semi-Government (1) 1,150 34. 1 1,071 31. 0
Bonds - Corporate and other (1) 122 3. 6 78 2. 2
Real Estate (2) 214 6. 3 205 5. 9
Derivatives (2) (14) (0. 4) 8 0. 2
Other (3) 383 11. 3 447 12. 9
Total fair value of plan assets 3,375 100 3,460 100
(1) Values based on prices or yields quoted in an active market.
(2) Values based on non-quoted information.
(3) These are assets which are not included in the traditional asset classes of equities, fixed interest securities, real estate and cash. They include infrastructure investments as well as high yield and emerging market debt.
The Australian equities fair value includes $111 million of Commonwealth Bank shares. The real estate fair value includes
$6 million of property assets leased to the Bank.
Note 36 Investments in Subsidiaries and Other Entities
Subsidiaries
The key subsidiaries of the Bank are:
Entity Name Entity Name
Australia
(a) Banking
CBA Covered Bond Trust Medallion Trust Series 2014-1
CBA International Finance Pty Limited Medallion Trust Series 2014-2
Commonwealth Securities Limited Medallion Trust Series 2015-1
Medallion Trust Series 2007-1G Medallion Trust Series 2015-2
Medallion Trust Series 2008-1R Medallion Trust Series 2016-1
Medallion Trust Series 2011-1 Residential Mortgage Group Pty Ltd
Medallion Trust Series 2013-1 Series 2008-1D SWAN Trust
Medallion Trust Series 2013-2
(b) Insurance and Funds Management
Capital 121 Pty Limited Commonwealth Insurance Limited
Colonial Holding Company Limited The Colonial Mutual Life Assurance Society Limited
Commonwealth Insurance Holdings Limited
All the above subsidiaries are 100% owned and incorporated in Australia.

Notes to the Financial Statements
Commonwealth Bank of Australia – Annual Report 2016 127
Note 36 Investments in Subsidiaries and Other Entities (continued)
Subsidiaries (continued)
Extent of Beneficial
Entity Name Interest if not 100% Incorporated in
New Zealand and Other Overseas
(a) Banking
ASB Bank Limited New Zealand
ASB Covered Bond Trust New Zealand
ASB Finance Limited New Zealand
ASB Holdings Limited New Zealand
ASB Term Fund New Zealand
CBA Funding (NZ) Limited New Zealand
CommBank Europe Limited Malta
Medallion NZ Series Trust 2009-1R New Zealand
PT Bank Commonwealth 99% Indonesia
(b) Insurance and Funds Management
ASB Group (Life) Limited New Zealand
PT Commonwealth Life 80% Indonesia
Sovereign Assurance Company Limited New Zealand
The Group also consolidates a number of unit trusts and other companies as part of the ongoing investment activities of the life
insurance and wealth businesses. These investment vehicles are excluded from the above list.
Significant Judgements and Assumptions
Control and Voting Rights
Holding more than 50% of an entity’s voting rights typically indicates that the Group has control over the entity. Significant
judgement is involved where the Group either holds more than 50% of the voting rights but does not control an entity, which
occurs in the case of AHL Holdings Pty Limited (AHL) as outlined below or where the Group is deemed to control an entity
despite holding less than 50% of the voting rights.
AHL Holdings Pty Limited (AHL)
Management have determined that the Group does not control AHL despite owning 80% of the issued share capital of this entity.
According to the Shareholders Deed agreed between the shareholders of AHL, unanimous consent is required from all parties to
the Deed for all key decisions. This results in joint control and hence the Group accounts for its investment in AHL as a joint
venture using the equity method.
Agent or principal
The Group is deemed to have power over an investment fund when it holds either the responsible entity (RE) and/or the manager
function of that fund. Whether that power translates to control depends on whether the Group is deemed to act as an agent or a
principal of that fund. Management have determined that the Group acts as a principal and controls a fund when it cannot be
easily removed as a manager or RE by investors and when its economic interest in that fund is substantial compared to the
economic interest of other investors. In all other cases the Group acts as agent and does not control the fund.
Non-Controlling Interests
Group
2016 2015
$M $M
Shareholders' Equity 550 562
Total non-controlling interests 550 562
The share capital above comprises predominantly New Zealand Perpetual Preference Shares (PPS) of AUD505 million.
On 10 December 2002, ASB Capital Limited, a New Zealand subsidiary, issued NZD200 million (AUD182 million) of PPS. The
PPS were issued into the New Zealand capital markets and are subject to New Zealand law. Such shares are non-redeemable
and carry limited voting rights. Dividends are payable quarterly based on the New Zealand one year swap rate plus a margin of
1.3% and are non-cumulative. The payments of dividends are subject to a number of conditions including the satisfaction of
solvency tests and the ability of the Board to cancel payments.
On 22 December 2004, ASB Capital No.2 Limited, a New Zealand subsidiary, issued NZD350 million (AUD323 million) of PPS.
The PPS were issued into the New Zealand capital markets and are subject to New Zealand law. Such shares are non-
redeemable and carry limited voting rights. Dividends are payable quarterly on the New Zealand one year swap rate plus a
margin of 1.0% and are non-cumulative. The payments of dividends are subject to a number of conditions including the
satisfaction of solvency tests and the ability of the Board to cancel payments.

Notes to the Financial Statements
128 Commonwealth Bank of Australia – Annual Report 2016
Note 36 Investments in Subsidiaries and Other Entities (continued)
ASB Capital Limited and ASB Capital No.2 Limited have advanced proceeds from the above public issues to ASB Funding
Limited, a New Zealand subsidiary. ASB Funding Limited in turn invested the proceeds in PPS issued by ASB Limited (ASB
PPS), also a New Zealand subsidiary. In relation to ASB Capital No.2 Limited, if an APRA Event occurs, the loan to ASB Funding
Limited will be repaid and ASB Capital No.2 Limited will become the holder of the corresponding ASB PPS.
The PPS may be purchased by a Commonwealth Bank subsidiary exercising a buy-out right five years or more after issue, or on
the occurrence of regulatory or tax events.
Significant Restrictions
There were no significant restrictions on the ability to transfer cash or other assets, pay dividends or other capital distributions,
provide or repay loans and advances between the entities within the Group. There were also no significant restrictions on the
Group's ability to access or use the assets and settle the liabilities of the Group resulting from protective rights of non-controlling
interests.
Associates and Joint Ventures
There were no individually significant investments in associates or joint ventures held by the Group as at 30 June 2016 and
30 June 2015. In addition, there were no significant restrictions on the ability of associates or joint ventures to transfer funds to
the Bank or its subsidiaries in the form of cash dividends or to repay loans or advances made.
The Group’s investments in associates and joint ventures are shown in the table below.
Group
2016 2015 2016 2015
Ownership Ownership Principal Country of Balance
$M $M Interest % Interest % Activities Incorporation Date
AHL Holdings Pty Limited (1) 272 267 80 80 Mortgage Broking Australia 30-Jun
Bank of Hangzhou Co., Ltd 1,405 1,282 20 20 Commercial Banking China 31-Dec
BoCommLife Insurance Company Limited 174 159 38 38 Insurance China 31-Dec
First State European Diversified Infrastructure
Fund FCP-SIF (2) 110 198 4 9 Funds Management Luxembourg 31-Dec
Qilu Bank Co., Ltd 444 420 20 20 Commercial Banking China 31-Dec
Vietnam International Commercial Joint Stock
Bank192 197 20 20 Financial Services Vietnam 31-Dec
Other 179 114 Various Various Various Various Various
Carrying amount of investments in
associates and joint ventures 2,776 2,637
(1) The Group’s 80% interest in AHL Holdings Pty Limited (trading as Aussie Home Loans) is jointly controlled as the key financial and operating decisions
require the unanimous consent of all directors. AHL Holdings Pty Limited is considered a structured entity. The Group’s maximum exposure to loss in relation to its investment is its carrying value and the total assets of Aussie Home Loans equals $280 million (2015: $329 million).
(2) In 2015, $96 million of this investment was carried as Held for Sale and measured at the lower of carrying amount and fair value less costs to sell. The component was subsequently sold in the 2016 financial year.
Group
2016 2015
Share of Associates' and Joint Ventures profits $M $M
Operating profits before income tax 367 336
Income tax expense (78) (68)
Operating profits after income tax (1)289 268
(1) This amount is recognised within Note 2 in the share of profits of associates and joint ventures net of impairment.
Structured Entities
A structured entity is an entity in which voting or similar rights are not the dominant factor in deciding control. Structured entities
are generally created to achieve a narrow and well defined objective with restrictions around their ongoing activities. Depending
on the Group’s power over the activities of the entity and its exposure to and ability to influence its own returns, it may consolidate
the entity. In other cases it may sponsor or have exposure to such an entity but not consolidate it.
Consolidated Structured Entities
The Group has the following contractual arrangements which require it to provide financial support to its structured entities.
Securitisation Structured Entities
The Group provides liquidity facilities to Medallion and Swan structured entities and a loan facility to SHIELD 50 entity. The
liquidity facilities can only be drawn to cover cash flow shortages relating to mismatches in timing of cash inflows due from
securitised asset pools and cash outflows due to note holders. These ‘timing mismatch’ facilities rank pari passu with other senior
secured creditors. The facilities limit is $1,118 million.
The Group has no contractual obligations to purchase assets from its securitisation structured entities.

Notes to the Financial Statements
Commonwealth Bank of Australia – Annual Report 2016 129
Note 36 Investments in Subsidiaries and Other Entities (continued)
Consolidated Structured Entities (continued)
Covered Bonds Trust
The Group provides funding and support facilities to CBA Covered Bond Trust and ASB Covered Bond Trust (the ‘Trusts’). CBA
Covered Bond Trust and ASB Covered Bond Trust are bankruptcy remote SPVs that guarantee any debt obligations owing under
the US$30 billion CBA Covered Bond Programme and the EURO 7 billion ASB Covered Bond Programme, respectively. The
funding facilities allow the Trusts to hold sufficient residential mortgage loans to support the guarantees provided to the Covered
Bonds. The Group also provides various swaps to the Trusts to hedge any interest rate and currency mismatches. The Group,
either directly or via its wholly owned subsidiaries, Securitisation Advisory Services Pty Limited and Securitisation Management
Services Limited, provides various services to the Trusts including servicing and monitoring of the residential mortgages.
Structured Asset Finance Structured Entities
The Group has no contractual obligation to provide financial support to any of its Structured Asset Finance structured entities.
During the year ended 30 June 2016, the Bank entered into a debt forgiveness arrangement with two wholly owned structured
entities for the total of $69 million. The financial impact of the debt forgiveness was fully eliminated on consolidation. Unconsolidated Structured Entities
The Group has exposure to various securitisation vehicles via Residential Mortgage-backed Securities (RMBS) and Asset-backed
Securities (ABS). The Group may also provide derivatives and other commitments to these vehicles. The Group also has
exposure to Investment Funds and other financing vehicles.
Securitisations
Securitisations involve transferring assets into an entity that sells beneficial interests to investors through the issue of debt and
equity notes with varying levels of subordination. The notes are collateralised by the assets transferred to these vehicles and pay
a return based on the returns of those assets, with residual returns paid to the most subordinated investor.
The Group may trade or invest in Residential Mortgage-backed Securities and Asset-backed Securities which are backed by
Commercial Properties, Consumer Receivables, Equipment and Auto Finance. The Group may also provide lending, derivatives,
liquidity and commitments to these securitisation entities.
Other Financing
Asset-backed entities are used to provide tailored lending for the purchase or lease of assets transferred by the Group or its
clients. The assets are normally pledged as collateral to the lenders. The Group engages in raising finance for assets such as
aircraft, trains, vessels and other infrastructure. The Group may also provide lending, derivatives, liquidity and commitments to
these entities.
Investment Funds
The Group conducts investment management and other fiduciary activities as responsible entity, trustee, custodian, advisor or
manager for investment funds and trusts, including superannuation and approved deposit funds, wholesale and retail trusts. The
Group’s exposure to Investment Funds includes holding units in the investment funds and trusts, providing lending facilities,
derivatives and receiving fees for services.
The nature and extent of the Group’s interests in these entities are summarised below. Interests do not include plain vanilla
derivatives (e.g. interest rate swaps and currency swaps) and positions where the Group creates rather than absorbs variability of
the Structured Entity, for example deposits. These have been excluded from the below table.
2016
Other Investment
Exposures to unconsolidated RMBS ABS Financing Funds Total
structured entities $M $M $M $M $M
Assets at fair value through income statement - trading 5 - - 1,078 1,083
Available-for-sale investments 7,123 872 - 205 8,200
Loans, bills discounted and other receivables 2,432 1,606 2,627 9,861 16,526
Other assets - - - 123 123
Total on Balance Sheet exposures 9,560 2,478 2,627 11,267 25,932
Total notional amounts of off Balance Sheet exposures (1) 1,338 543 501 3,915 6,297
Total maximum exposure to loss 10,898 3,021 3,128 15,182 32,229
Total assets of the entities (2) 47,626 15,066 9,967 290,261 362,920
(1) Relates to undrawn facilities.
(2) Size of the entities is generally the total assets of the entities, except for Real Estate Investment Trusts where the size is based on the Group’s credit exposure of $11.2 billion.

Notes to the Financial Statements
130 Commonwealth Bank of Australia – Annual Report 2016
Note 36 Investments in Subsidiaries and Other Entities (continued)
Unconsolidated Structured Entities (continued)
2015
Other Investment
Exposures to unconsolidated RMBS ABS Financing Funds Total
structured entities $M $M $M $M $M
Assets at fair value through income statement - trading 28 - - 1,374 1,402
Available-for-sale investments 7,674 1,002 - 186 8,862
Loans, bills discounted and other receivables 1,809 391 2,555 10,499 15,254
Other assets - - - 210 210
Total on Balance Sheet exposures 9,511 1,393 2,555 12,269 25,728
Total notional amounts of off Balance Sheet exposures (1) 1,571 1,027 157 6,118 8,873
Total maximum exposure to loss 11,082 2,420 2,712 18,387 34,601
Total assets of the entities (2) 52,979 7,373 10,102 293,509 363,963
(1) Relates to undrawn facilities.
(2) Size of the entities is generally the total assets of the entities, except for Real Estate Investment Trusts where the size is based on the Group’s credit exposure of $13.7 billion and newly established securisation vehicles that have no assets where the Group’s exposure is represented by undrawn credit facilities of $1,240 million.
The Group’s exposure to loss depends on the level of subordination of the interest which indicates the extent to which other
parties are obliged to absorb credit losses before the Group. An overview of the Group’s interests, relative ranking and external
credit rating, for vehicles that have credit subordination in place, is summarised in the table below, and include securitisation
vehicles and other financing.
2016
Other
Ranking and credit rating of exposures RMBS ABS Financing Total
to unconsolidated structured entities $M $M $M $M
Senior (1) 10,853 3,008 3,128 16,989
Mezzanine (2) 18 13 - 31
Subordinated (3) 27 - - 27
Total maximum exposure to loss 10,898 3,021 3,128 17,047 (1) $10,853 million of RMBS exposures, $3,008 million of ABS exposures and $1,522 million of other financing exposures are rated investment grade, the
remaining $1,606 million exposures are rated sub-investment grade.
(2) All RMBS and ABS exposures are rated investment grade.
(3) All exposures are rated sub-investment grade.
2015
Other
Ranking and credit rating of exposures RMBS ABS Financing Total
to unconsolidated structured entities $M $M $M $M
Senior (1) 11,025 2,406 2,679 16,110
Mezzanine (2) 28 14 33 75
Subordinated (3) 29 - - 29
Total maximum exposure to loss 11,082 2,420 2,712 16,214
(1) $11,025 million of RMBS exposures, $2,406 million of ABS exposures and $1,506 million of other financing exposures are rated investment grade, the remaining $1,173 million exposures are rated sub-investment grade.
(2) All RMBS and ABS exposures are rated investment grade, all other financing exposures are rated sub-investment grade.
(3) All exposures are rated sub-investment grade.
Sponsored Unconsolidated Structured Entities
For the purposes of this disclosure, the Group sponsors an entity when it manages or advises the entity’s program, places
securities into the market on behalf of the entity, provides liquidity and/or credit enhancements to the entity, or the Group’s name
appears in the Structured Entity.
During the year ended 30 June 2016, the Group has sponsored two unconsolidated structured entities being Security Holding
Investment Entity Linking Deals Limited (SHIELD) and SHIELD Trust No. 2. A wholly owned subsidiary of the Group,
Securitisation Advisory Services Pty Limited (SAS), is the manager of SHIELD and SHIELD is the trustee of SHIELD Trust No. 2.
The Group continues to hold an interest in these structured entities.
There has been no significant income earned or expense incurred directly from these entities during the year ended
30 June 2016. There also have been no assets transferred by all parties to the sponsored entities during the year ended
30 June 2016.

Notes to the Financial Statements
Commonwealth Bank of Australia – Annual Report 2016 131
Note 37 Key Management Personnel
Detailed remuneration disclosures by Key Management Personnel are provided in the Remuneration Report of the Directors’
Report on pages 26 to 33 and have been audited.
Group Bank
2016 2015 2016 2015
Key management personnel compensation $'000 $'000 $'000 $'000
Short-term benefits 34,707 34,086 34,707 34,086
Post-employment benefits 457 450 457 450
Share-based payments 12,243 9,090 12,243 9,090
Long-term benefits 1,134 1,300 1,134 1,300
Total 48,541 44,926 48,541 44,926
Shareholdings
Details of the aggregate shareholdings of Key Management Personnel are set out below.
Reward/
Acquired/ Deferred Net
Balance Granted as Shares Change Balance
Class 1 July 2015 Remuneration Vested (1)(2)
Other (3)
30 June 2016 (4)
Non-Executive Directors Ordinary (5) 191,368 36,260 - (27,063) 200,565
PERLS 12,980 9,550 - (12,700) 9,830
Other securities (6) 5,000 - - (5,000) -
Executives Ordinary 442,518 - - 188,242 630,760
GLRP - Reward Shares/Rights 1,092,787 290,938 (212,185) (33,822) 1,137,718
Deferred Shares/Rights 45,206 4,361 (22,934) - 26,633
(1) Reward Rights represent rights granted under the GLRP which are subject to performance hurdles. Deferred Shares/Rights represent the deferred STI awarded under Executive General Manager arrangements, sign-on and retention awards received as restricted shares/rights. PERLS include cumulative holdings of all PERLS securities issued by the Group.
(2) Reward Rights and Deferred Shares/Rights become ordinary shares upon vesting. A portion of Ian Narev’s vested equity award was delivered in the form of cash, which was paid to registered charities pursuant to an option that the Board made available.
(3) Net Change Other incorporates changes resulting from purchases, sales, forfeitures and retirement of Non-Executive Directors during the financial year.
(4) 30 June 2016 balances represent aggregate shareholdings of all KMP at balance date.
(5) Non-Executive Directors who hold less than 5,000 Commonwealth Bank shares are required to receive 20% of their total post-tax annual fees as Commonwealth Bank shares. These shares are subject to a 10 year trading restriction (the shares will be released earlier if the director leaves the Board).
(6) Other securities: Jane Hemstritch retired effective 31 March 2016 (2015: held Colonial Sub notes).
Loans to Key Management Personnel
All loans to Key Management Personnel (or close family members or entities controlled, jointly controlled, or significantly
influenced by them, or any entity over which any of the aforementioned held significant voting power) have been provided on
normal commercial terms and conditions no more favourable than those given to other employees and customers including the
term of the loan, security required and the interest rate (which may be fixed or variable).
Details of aggregate loans to Key Management Personnel are set out below:
2016 2015
KMP's $'000 $'000
Loans 11,355 10,130
Interest Charged 456 501
Other transactions of Key Management Personnel
Financial Instrument Transactions
Financial instrument transactions (other than loans and shares disclosed within this report) of Key Management Personnel occur
in the ordinary course of business on normal commercial terms and conditions no more favourable than those given to other
employees and customers.
Disclosure of financial instrument transactions regularly made as part of normal banking operations is limited to disclosure of such
transactions with Key Management Personnel and entities controlled or significantly influenced by them.
All such financial instrument transactions that have occurred between entities within the Group and their Key Management
Personnel have been trivial or domestic in nature and were in the nature of normal personal banking and deposit transactions.
Transactions other than Financial Instrument Transactions of Banks
All other transactions with Key Management Personnel and their related entities and other related parties are conducted on an
arm’s length basis in the normal course of business and on commercial terms and conditions. These transactions principally
involve the provision of financial and investment services by entities not controlled by the Group. A related party of an Executive
has also been employed by the Group, and is remunerated in a manner consistent with normal employee relationships.

Notes to the Financial Statements
132 Commonwealth Bank of Australia – Annual Report 2016
Note 38 Related Party Disclosures
Commonwealth Bank of Australia, which is incorporated in Australia, is the ultimate parent of the Group.
Parties are considered to be related if one party has the ability to control the other party or exercise significant influence over the
other party in making financial or operational decisions, or a separate party controls both. The definition includes subsidiaries,
associates, joint ventures, pension plans as well as other persons.
A number of banking transactions are entered into with related parties in the normal course of business on an arm’s length basis.
These include loans, deposits and foreign currency transactions, upon which some fees and commissions may be earned. Details
of amounts paid or received from related parties, in the form of dividends or interest, are set out in Note 2.
The Bank’s aggregate investments in, and loans to controlled entities are disclosed in the table below. Amounts due to controlled
entities are disclosed in the Balance Sheet of the Bank.
Bank
2016 2015
$M $M
Shares in controlled entities 11,720 13,027
Loans to controlled entities (1) 134,233 130,729
Total shares in and loans to controlled entities 145,953 143,756
(1) On 31 March 2015 internal RMBS issued to the Bank by controlled entities of $75,041 million were reclassified to Loans to controlled entities. Refer to
Note 11 for further detail.
The Group also receives fees on an arm’s length basis of $49 million (2015: $24 million) from funds classified as associates.
The Bank provides letters of comfort to other entities within the Group on standard terms. Guarantees include a $40 million
(2015: $40 million) guarantee to AFS license holders in respect of excess compensation claims and a $5 million bank guarantee
provided to Colonial First State Investments Limited which expired on 30 June 2016 (2015: $5 million).
The Bank is the head entity of the tax consolidated group and has entered into tax funding and tax sharing agreements with its
eligible Australian resident subsidiaries. The terms and conditions of these agreements are set out in Note 1(r). The amount
receivable by the Bank under the tax funding agreement with the tax consolidated entities is $213 million as at 30 June 2016
(2015: $200 million receivable). This balance is included in ‘Other assets’ in the Bank’s separate Balance Sheet.
All transactions between Group entities are eliminated on consolidation.

Notes to the Financial Statements
Commonwealth Bank of Australia – Annual Report 2016 133
Note 39 Notes to the Statements of Cash Flows
(a) Reconciliation of Net Profit after Income Tax to Net Cash (used in)/provided by Operating Activities
Group Bank
2016 2015 2014 2016 2015
$M $M $M $M $M
Net profit after income tax 9,247 9,084 8,650 8,639 8,976
(Increase)/decrease in interest receivable (148) 3 (22) (130) (251)
(Decrease)/increase in interest payable (312) 14 (295) (295) (70)
Net increase in assets at fair value through Income Statement
(excluding life insurance) (8,538) (5,490) (1,016) (8,787) (4,997)
Net gain on sale of controlled entities and associates - (13) (60) (21) -
Net gain on sale of investments - - (2) - -
Net movement in derivative assets/liabilities 5,988 6,180 5,375 6,288 9,058
Net loss on sale of property, plant and equipment 21 8 12 15 4
Equity accounting profit (289) (268) (192) - -
Loan impairment expense 1,256 988 918 1,153 837
Depreciation and amortisation (including asset write downs) 857 803 874 666 631
Increase/(decrease) in liabilities at fair value through Income
Statement (excluding life insurance) 1,651 975 (1,674) 123 2,105
(Decrease)/increase in other provisions (78) 354 7 (13) 161
Increase/(decrease) in income taxes payable 486 (32) (617) 181 (423)
Decrease in deferred tax liabilities (162) (15) (104) - -
Decrease/(increase) in deferred tax assets 110 131 363 (22) 25
Decrease/(increase)in accrued fees/reimbursements receivable 137 66 (158) (10) 8
(Decrease)/increase in accrued fees and other items payable (265) 349 94 (67) 230
Decrease in life insurance contract policy liabilities (991) (1,133) (1,082) - -
Cash flow hedge ineffectiveness 5 20 9 (5) (4)
(Gain)/loss on changes in fair value of hedged items (642) (493) 71 (1,369) (660)
Dividend received - controlled entities - - - (1,462) (1,972)
Changes in operating assets and liabilities arising from cash flow
movements (13,640) (4,658) (8,280) (11,367) (10,966)
Other 746 310 1,092 1,020 512
Net cash (used in)/provided by operating activities (4,561) 7,183 3,963 (5,463) 3,204
(b) Reconciliation of Cash
For the purposes of the Statements of Cash Flows, cash includes cash and money at short call.
Group Bank
2016 2015 2014 2016 2015
$M $M $M $M $M
Notes, coins and cash at banks 12,103 15,683 12,490 10,809 14,821
Other short-term liquid assets 2,344 3,587 6,638 2,100 3,344
Cash and cash equivalents at end of year 14,447 19,270 19,128 12,909 18,165
(c) Non-cash Financing and Investing Activities
Group
2016 2015 2014
$M $M $M
Shares issued under the Dividend Reinvestment Plan (1) 1,209 571 707
(1) No part of the Dividend Reinvestment Plan paid out in the 2016 financial year was satisfied through the on-market purchase and transfer of shares to
participating shareholders (2015: $704 million and 2014: $722 million).
(d) Disposal of Controlled Entities - Fair Value of Asset Disposal
The Group disposed of certain CFS GAM operations including Colonial First State Property Management Pty Limited,
Commonwealth Management Investments Limited and Colonial First State Management Pty Limited during the 2014 financial
year.
Group
2016 2015 2014
$M $M $M
Net assets - - 440
Cash consideration received - - 569
Cash and cash equivalents held in disposed entities - - 38

Notes to the Financial Statements
134 Commonwealth Bank of Australia – Annual Report 2016
Note 39 Notes to the Statements of Cash Flows (continued)
(e) Acquisition of Controlled Entities
On 20 April 2016, 100% of the contributed equity of Vector Gas Limited was purchased for NZ$952.5 million and renamed to First
Gas Limited (FGL). The acquisition occurred via the Global Diversified Infrastructure Fund (GDIF), which is partly owned by the
Group’s life insurance business.
The investment in GDIF is used to back life insurance policy liabilities, the majority of which are investment-linked contracts where
the returns to policyholders are linked to GDIF’s overall returns. Notwithstanding this, GDIF and consequently FGL, have been
consolidated due to the overall equity ownership in GDIF.
FGL is the owner and operator of gas transmission and distribution networks within New Zealand. The determination of the fair
value of identifiable assets acquired and liabilities assumed is ongoing. The provisional fair value of net tangible assets acquired
was $553 million, resulting in provisional goodwill of $304 million. These figures will be revised upon completion of the purchase
price allocation, in accordance with Australian Accounting Standards.
The Group acquired 100% of the issued share capital of the TYME Group and gained control on 26 January 2015. TYME is a
South African based global leader in designing, building and operating digital banking systems. This acquisition will support the
Group in growing into emerging markets, as well as provide capability to enhance innovation in our core markets.
The fair value of the identifiable assets acquired and liabilities assumed at the acquisition date are as follows:
Group
2016 2015 2014
$M (1)
$M $M
Net identifiable assets at fair value 553 (2) -
Add: Goodwill 304 43 -
Purchase consideration transferred 857 41 -
Less: Cash and cash equivalents acquired - - -
857 41 -
Less: Contingent consideration - (12) -
Net cash outflow on acquisition 857 29 -
(1) As the purchase price allocation is ongoing, the provisional fair value of net identifiable assets has been disclosed in accordance with Australian Accounting Standards.
Note 40 Disclosures about Fair Values
(a) Valuation
The best evidence of fair value is a quoted market price in an active market. Therefore, where possible, fair value is based on
quoted market prices. Where no quoted market price for an instrument is available, the fair value is based on present value
estimates or other valuation techniques based on current market conditions. These valuation techniques rely on market
observable inputs wherever possible, or in a limited number of instances, rely on inputs which are reasonable assumptions based
on market conditions.
Determination of the fair value of Over-the-Counter (OTC) derivatives includes credit valuation adjustments (CVA) for derivative
assets to reflect the credit worthiness of the counterparty. Fair value of uncollateralised derivative assets and uncollateralised
derivative liabilities incorporate funding valuation adjustments (FVA) to reflect funding costs and benefits to the Group. These
adjustments are applied after considering any relevant collateral or master netting arrangements.
The Group utilises various valuation techniques and applies a hierarchy for valuation inputs that maximise the use of observable
market data, if available.
Under AASB 13 ‘Fair Value Measurement’ all financial and non-financial assets and liabilities measured or disclosed at fair value
are categorised into one of the following three fair value hierarchy levels:
Quoted Prices in Active Markets – Level 1
This category includes assets and liabilities for which the valuation is determined by reference to unadjusted quoted prices for
identical assets or liabilities in active markets where the quoted price is readily available, and the price represents actual and
regularly occurring market transactions on an arm’s length basis.
An active market is one in which transactions occur with sufficient volume and frequency to provide pricing information on an
ongoing basis.
Financial instruments included in this category are liquid government bonds, financial institution and corporate bonds, certificates
of deposit, bank bills, listed equities and exchange traded derivatives.
Valuation Technique Using Observable Inputs – Level 2
This category includes assets and liabilities that have been valued using inputs other than quoted prices as described for Level 1,
but which are observable for the asset or liability, either directly or indirectly. The valuation techniques include the use of
discounted cash flow analysis, option pricing models and other market accepted valuation models.
Financial instruments included in this category are commercial papers, mortgage-backed securities and OTC derivatives including
interest rate swaps, cross currency swaps and FX options.

Notes to the Financial Statements
Commonwealth Bank of Australia – Annual Report 2016 135
Note 40 Disclosures about Fair Values (continued)
Valuation Technique Using Significant Unobservable Inputs – Level 3
This category includes assets and liabilities where the valuation incorporates significant inputs that are not based on observable
market data (unobservable inputs). Unobservable inputs are those not readily available in an active market due to market
illiquidity or complexity of the product. These inputs are generally derived and extrapolated from observable inputs to match the
risk profile of the financial instrument, and are calibrated against current market assumptions, historic transactions and economic
models, where available. These inputs may include the timing and amount of future cash flows, rates of estimated credit losses,
discount rates and volatility.
Financial instruments included in this category for the Group and Bank are certain exotic OTC derivatives and certain asset-
backed securities valued using unobservable inputs.
(b) Fair Value Hierarchy for Financial Assets and Liabilities Measured at Fair Value
The classification in the fair value hierarchy of the Group’s and the Bank’s financial assets and liabilities measured at fair value is
presented in the tables below:
Group
Fair Value as at 30 June 2016 Fair Value as at 30 June 2015
Level 1 Level 2 Level 3 Total Level 1 Level 2 Level 3 Total
$M $M $M $M $M $M $M $M
Financial assets measured at fair value on a
recurring basis
Assets at fair value through Income Statement:
Trading 23,180 10,887 - 34,067 18,623 7,801 - 26,424
Insurance 4,014 9,533 - 13,547 5,395 8,693 - 14,088
Other 43 1,437 - 1,480 95 1,183 - 1,278
Derivative assets 16 46,491 60 46,567 12 46,062 80 46,154
Available-for-sale investments 71,244 9,353 301 80,898 64,341 10,228 115 74,684
Bills Discounted 10,507 - - 10,507 14,847 - - 14,847
Total financial assets measured at fair value 109,004 77,701 361 187,066 103,313 73,967 195 177,475
Financial liabilities measured at fair value
on a recurring basis
Liabilities at fair value through Income Statement 2,749 7,543 - 10,292 4,437 4,056 - 8,493
Derivative liabilities 38 39,819 64 39,921 - 35,190 23 35,213
Life investment contracts - 8,582 - 8,582 - 9,159 - 9,159
Total financial liabilities measured at fair
value 2,787 55,944 64 58,795 4,437 48,405 23 52,865
Bank
Fair Value as at 30 June 2016 Fair Value as at 30 June 2015
Level 1 Level 2 Level 3 Total Level 1 Level 2 Level 3 Total
$M $M $M $M $M $M $M $M
Financial assets measured at fair value on a
recurring basis
Assets at fair value through Income Statement:
Trading 22,731 10,254 - 32,985 18,211 6,924 - 25,135
Other - 1,187 - 1,187 - 989 - 989
Derivative assets 16 46,449 60 46,525 7 45,520 80 45,607
Available-for-sale investments 68,190 7,870 301 76,361 62,435 9,754 115 72,304
Bills Discounted 10,507 - - 10,507 14,847 - - 14,847
Total financial assets measured at fair value 101,444 65,760 361 167,565 95,500 63,187 195 158,882
Financial liabilities measured at fair value
on a recurring basis
Liabilities at fair value through Income Statement 2,749 4,692 - 7,441 4,428 2,895 - 7,323
Derivative liabilities 33 43,781 70 43,884 - 39,611 25 39,636
Total financial liabilities measured at fair
value 2,782 48,473 70 51,325 4,428 42,506 25 46,959

Notes to the Financial Statements
136 Commonwealth Bank of Australia – Annual Report 2016
Note 40 Disclosures about Fair Values (continued)
(c) Analysis of Movements between Fair Value Hierarchy Levels
During the year ended 30 June 2016, the Group and the Bank reclassified $547 million of available-for-sale securities
(30 June 2015: $1,379 million) from Level 2 to Level 1. The Group also had insurance security reclassifications of $628 million
(30 June 2015: $nil) from Level 1 to Level 2. There were no trading security reclassifications (30 June 2015: $525 million) from
Level 2 to Level 1, due to changes in the observability of inputs. The tables below summarise movements in Level 3 balance
during the year. Transfers have been reflected as if they had taken place at the end of the reporting periods.
Level 3 Movement Analysis for the year ended 30 June 2016
Group
Available
Derivative for Sale Derivative
Assets Investments Liabilities Total
$M $M $M $M
As at 1 July 2014 135 97 (14) 218
Purchases - 8 - 8
Sales/Settlements (122) (28) 8 (142)
Gains/(losses) in the period:
Recognised in the Income Statement 70 3 (13) 60
Recognised in the Statement of Comprehensive Income - 1 - 1
Transfers in 9 34 (7) 36
Transfers out (12) - 3 (9)
As at 30 June 2015 80 115 (23) 172
Gains/(losses) recognised in the Income Statement for financial
instruments held as at 30 June 2015 70 - (14) 56
As at 1 July 2015 80 115 (23) 172
Purchases 13 4 - 17
Sales/Settlements - (104) (46) (150)
Gains/(losses) in the period:
Recognised in the Income Statement (33) (2) 5 (30)
Recognised in the Statement of Comprehensive Income - - - -
Transfers in - 305 - 305
Transfers out - (17) - (17)
As at 30 June 2016 60 301 (64) 297
Gains/(losses) recognised in the Income Statement for financial
instruments held as at 30 June 2016 - 1 - 1

Notes to the Financial Statements
Commonwealth Bank of Australia – Annual Report 2016 137
Note 40 Disclosures about Fair Values (continued)
Level 3 Movement Analysis for the year ended 30 June 2016 (continued)
Bank
Available
Derivative for Sale Derivative
Assets Investments Liabilities Total
$M $M $M $M
As at 1 July 2014 247 68,294 (116) 68,425
Purchases - 7,967 - 7,967
Sales/Settlements (235) (337) 110 (462)
Gains/(losses) in the period:
Recognised in the Income Statement 71 3 (15) 59
Recognised in the Statement of Comprehensive Income - 106 - 106
Transfers in 9 34 (7) 36
Transfers out (12) (75,952) 3 (75,961)
As at 30 June 2015 80 115 (25) 170
Gains/(losses) recognised in the Income Statement for financial
instruments held as at 30 June 2015 71 - (16) 55
As at 1 July 2015 80 115 (25) 170
Purchases 14 4 - 18
Sales/Settlements - (104) (46) (150)
Gains/(losses) in the period:
Recognised in the Income Statement (34) (2) 1 (35)
Recognised in the Statement of Comprehensive Income - - - -
Transfers in - 305 - 305
Transfers out - (17) - (17)
As at 30 June 2016 60 301 (70) 291
Gains/(losses) recognised in the Income Statement for financial
instruments held as at 30 June 2016 - 1 - 1
On 31 March 2015, internal residential mortgage backed securities issued to the Bank by controlled entities of $75,041 million
were reclassified to loans to controlled entities. They were reclassified prospectively at their fair value of $75,041 million. As at the
date of reclassification the available for sale reserve was $nil. All other transfers in and out of Level 3 were due to changes in the
observability of the inputs.
The Group’s exposure to financial instruments measured at fair value based in full or in part on non-market observable inputs is
restricted to a small number of financial instruments, which comprise an insignificant component of the portfolios to which they
belong. As such, the purchases, sales, as well as any change in the assumptions used to value the instruments to a reasonably
possible alternative do not have a material effect on the portfolio balance of the Group’s results.

Notes to the Financial Statements
138 Commonwealth Bank of Australia – Annual Report 2016
Note 40 Disclosures about Fair Values (continued)
(d) Fair Value Information for Financial Instruments not measured at Fair Value
The estimated fair values and fair value hierarchy of the Group’s and the Bank’s financial instruments not measured at fair value
as at 30 June 2016 are presented below:
Group
Carrying
value Fair value
Total Level 1 Level 2 Level 3 Total
$M $M $M $M $M
Financial assets not measured at fair value on a
recurring basis
Cash and liquid assets 23,372 14,447 8,925 - 23,372
Receivables due from other financial institutions 11,591 - 11,591 - 11,591
Loans and other receivables 684,891 - - 685,341 685,341
Bank acceptances of customers 1,431 1,431 - - 1,431
Other assets 5,599 2,177 3,422 - 5,599
Total financial assets 726,884 18,055 23,938 685,341 727,334
Financial liabilities not measured at fair value on a
recurring basis
Deposits and other public borrowings 588,045 - 588,405 - 588,405
Payables due to other financial institutions 28,771 - 28,771 - 28,771
Bank acceptances 1,431 1,431 - - 1,431
Debt issues 161,284 - 161,049 - 161,049
Managed funds units on issue 1,606 1,400 206 - 1,606
Bills payable and other liabilities 7,498 1,414 6,084 - 7,498
Loan capital 15,544 6,151 8,950 - 15,101
Total financial liabilities 804,179 10,396 793,465 - 803,861
Financial guarantees, loan commitments
and other off Balance Sheet instruments 179,902 - - 179,902 179,902
30 June 2016
Group
Carrying
value Fair value
Total Level 1 Level 2 Level 3 Total
$M $M $M $M $M
Financial assets not measured at fair value on a
recurring basis
Cash and liquid assets 33,116 19,270 13,846 - 33,116
Receivables due from other financial institutions (1) 13,063 - 13,063 - 13,063
Loans and other receivables 624,415 - - 625,265 625,265
Bank acceptances of customers 1,944 - - 1,944 1,944
Other assets 5,894 499 5,395 - 5,894
Total financial assets 678,432 19,769 32,304 627,209 679,282
Financial liabilities not measured at fair value on a
recurring basis
Deposits and other public borrowings 543,231 - 529,738 14,819 544,557
Payables due to other financial institutions 36,416 - 36,416 - 36,416
Bank acceptances 1,944 1,944 - - 1,944
Debt issues 154,429 1,010 154,278 - 155,288
Managed funds units on issue 1,149 1,149 - - 1,149
Bills payable and other liabilities 8,963 - 8,963 - 8,963
Loan capital 12,824 2,852 9,454 - 12,306
Total financial liabilities 758,956 6,955 738,849 14,819 760,623
Financial guarantees, loan commitments
and other off Balance Sheet instruments 175,569 - - 175,569 175,569
30 June 2015
(1) Comparative information has been restated to align to presentation in the current year.

Notes to the Financial Statements
Commonwealth Bank of Australia – Annual Report 2016 139
Note 40 Disclosures about Fair Values (continued)
(d) Fair Value Information for Financial Instruments not measured at Fair Value (continued)
Bank
Carrying
value Fair value
Total Level 1 Level 2 Level 3 Total
$M $M $M $M $M
Financial assets not measured at fair value on a
recurring basis
Cash and liquid assets 21,582 12,909 8,673 - 21,582
Receivables due from other financial institutions 10,182 - 10,182 - 10,182
Loans and other receivables 607,412 - - 607,899 607,899
Bank acceptances of customers 1,413 1,413 - - 1,413
Loans to controlled entities 134,233 - - 133,567 133,567
Other assets 5,001 1,727 3,274 - 5,001
Total financial assets 779,823 16,049 22,129 741,466 779,644
Financial liabilities not measured at fair value on a
recurring basis
Deposits and other public borrowings 536,086 - 536,331 - 536,331
Payables due to other financial institutions 28,328 - 28,328 - 28,328
Bank acceptances 1,413 1,413 - - 1,413
Due to controlled entities 130,046 - - 130,046 130,046
Debt issues 134,214 - 134,968 - 134,968
Bills payable and other liabilities 5,535 964 4,571 - 5,535
Loan capital 15,138 6,155 8,543 - 14,698
Total financial liabilities 850,760 8,532 712,741 130,046 851,319
Financial guarantees, loan commitments
and other off Balance Sheet instruments 163,619 - - 163,619 163,619
30 June 2016
Bank
Carrying
value Fair value
Total Level 1 Level 2 Level 3 Total
$M $M $M $M $M
Financial assets not measured at fair value on a
recurring basis
Cash and liquid assets 31,683 18,166 13,517 - 31,683
Receivables due from other financial institutions (1) 11,204 - 11,204 - 11,204
Loans and other receivables 558,588 - - 559,366 559,366
Bank acceptances of customers 1,908 - - 1,908 1,908
Loans to controlled entities 130,729 - - 130,441 130,441
Other assets 5,009 488 4,521 - 5,009
Total financial assets 739,121 18,654 29,242 691,715 739,611
Financial liabilities not measured at fair value on a
recurring basis
Deposits and other public borrowings 497,625 - 484,781 13,660 498,441
Payables due to other financial institutions 35,516 - 35,516 - 35,516
Bank acceptances 1,908 1,908 - - 1,908
Due to controlled entities 126,496 - 2,483 124,013 126,496
Debt issues 130,359 - 131,741 - 131,741
Bills payable and other liabilities 6,619 - 6,619 - 6,619
Loan capital 13,364 1,703 11,104 - 12,807
Total financial liabilities 811,887 3,611 672,244 137,673 813,528
Financial guarantees, loan commitments
and other off Balance Sheet instruments 161,722 - - 161,722 161,722
30 June 2015
(1) Comparative information has been restated to align to presentation in the current year.

Notes to the Financial Statements
140 Commonwealth Bank of Australia – Annual Report 2016
Note 40 Disclosures about Fair Values (continued)
(d) Fair Value Information for Financial Instruments not measured at Fair Value (continued)
The fair values disclosed above represent estimates of prices at which these instruments could be sold or transferred in an
orderly transaction between market participants. However, many of the instruments lack an available trading market and it is the
intention to hold to maturity. Thus it is possible that realised amounts may differ to amounts disclosed above. Due to the wide
range of valuation techniques and the numerous estimates that must be made, it may be difficult to make a reasonable
comparison of the fair value information disclosed here, against that disclosed by other financial institutions.
The fair value estimates disclosed above have been derived as follows:
Loans and Other Receivables
The carrying value of loans and other receivables is net of accumulated collective and individually assessed provisions for
impairment. Customer creditworthiness is regularly reviewed in line with the Group's credit policies and where necessary, pricing
is adjusted in accordance with individual credit contracts.
For the majority of variable rate loans, excluding impaired loans, the carrying amount is considered a reasonable estimate of fair
value. For Institutional variable rate loans, the fair value is calculated using discounted cash flow models with a discount rate
reflecting market rates offered on similar loans to customers with similar creditworthiness. The fair value of impaired loans is
calculated by discounting estimated future cash flows using the loan's market interest rate.
The fair value of fixed rate loans is calculated using discounted cash flow models where the discount rate reflects market rates
offered for loans of similar remaining maturities and creditworthiness as the customer.
Deposits and Other Public Borrowings
Fair value of non-interest bearing, call and variable rate deposits, and fixed rate deposits repricing within six months, approximate
their carrying value as they are short-term in nature or payable on demand.
Fair value of term deposits are estimated using discounted cash flows, applying market rates offered for deposits of similar
remaining maturities.
Debt Issues and Loan Capital
The fair values are calculated using quoted market prices, where available. Where quoted market prices are not available,
discounted cash flow and option pricing models are used. The discount rate applied reflects the terms of the instrument, the
timing of the cash flows and is adjusted for any change in the Group's applicable credit rating.
Other Financial Assets and Liabilities
For all other financial assets and liabilities fair value approximates carrying value due to their short-term nature, frequent repricing
or high credit rating.
Note 41 Securitisation, Covered Bonds and Transferred Assets
Transfer of Financial Assets
In the normal course of business the Group enters into transactions by which it transfers financial assets to counterparties or
directly to Special Purpose Vehicles (SPVs). These transfers do not give rise to derecognition of those financial assets for the
Group.
Repurchase Agreements
Securities sold under agreement to repurchase are retained on the Balance Sheet when substantially all the risks and rewards of
ownership remain with the Group, and the counterparty liability is included separately on the Balance Sheet when cash
consideration is received.
Securitisation Programs
Residential mortgages securitised under the Group’s securitisation programs are equitably assigned to bankruptcy remote
Special Purpose Vehicles (SPVs). The Group is entitled to any residual income of the securitisation program after all payments
due to investors have been met. In addition, where derivatives are transacted between the SPV and the Bank, such that the Bank
retains exposure to the variability in cash flows from the transferred residential mortgages, the mortgages will continue to be
recognised on the Bank’s Balance Sheet. The investors have full recourse only to the residential mortgages segregated into an
SPV.
Covered Bonds Programs
To complement the existing wholesale funding sources, the Group has established two global covered bond programs for the
Bank and ASB. Certain residential mortgages have been assigned to a bankruptcy remote SPV associated with covered bond
programs to provide security for the obligations payable on the covered bonds issued by the Group. Similarly to securitisation
programs, the Group is entitled to any residual income after all payments due to covered bonds investors have been met. As the
Bank retains substantially all of the risks and rewards associated with the mortgages through derivatives transacted with the SPV,
the Bank and ASB continue to recognise the mortgages on its Balance Sheet. The covered bond holders have dual recourse to
the Bank and the covered pool assets.
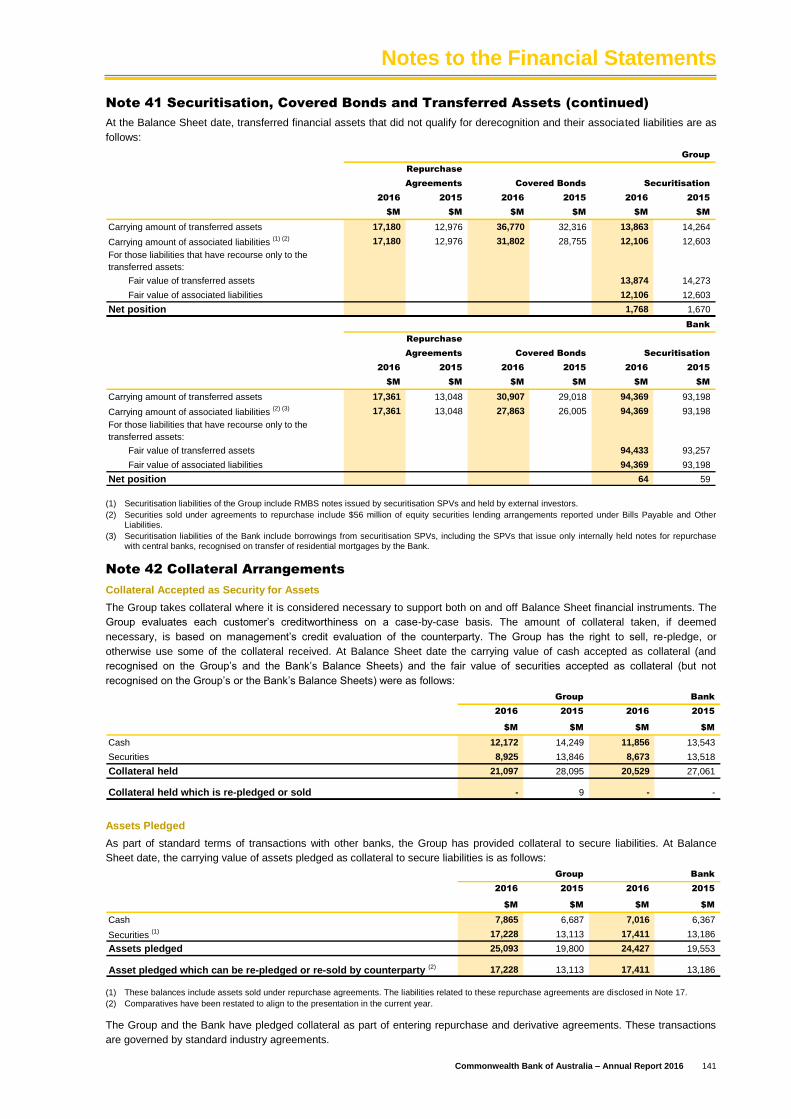
Notes to the Financial Statements
Commonwealth Bank of Australia – Annual Report 2016 141
Note 41 Securitisation, Covered Bonds and Transferred Assets (continued)
At the Balance Sheet date, transferred financial assets that did not qualify for derecognition and their associated liabilities are as
follows:
Group
Repurchase
Agreements Covered Bonds Securitisation
2016 2015 2016 2015 2016 2015
$M $M $M $M $M $M
Carrying amount of transferred assets 17,180 12,976 36,770 32,316 13,863 14,264
Carrying amount of associated liabilities (1) (2) 17,180 12,976 31,802 28,755 12,106 12,603
For those liabilities that have recourse only to the
transferred assets:
Fair value of transferred assets 13,874 14,273
Fair value of associated liabilities 12,106 12,603
Net position 1,768 1,670 Bank
Repurchase
Agreements Covered Bonds Securitisation
2016 2015 2016 2015 2016 2015
$M $M $M $M $M $M
Carrying amount of transferred assets 17,361 13,048 30,907 29,018 94,369 93,198
Carrying amount of associated liabilities (2) (3) 17,361 13,048 27,863 26,005 94,369 93,198
For those liabilities that have recourse only to the
transferred assets:
Fair value of transferred assets 94,433 93,257
Fair value of associated liabilities 94,369 93,198
Net position 64 59
(1) Securitisation liabilities of the Group include RMBS notes issued by securitisation SPVs and held by external investors.
(2) Securities sold under agreements to repurchase include $56 million of equity securities lending arrangements reported under Bills Payable and Other Liabilities.
(3) Securitisation liabilities of the Bank include borrowings from securitisation SPVs, including the SPVs that issue only internally held notes for repurchase with central banks, recognised on transfer of residential mortgages by the Bank.
Note 42 Collateral Arrangements
Collateral Accepted as Security for Assets
The Group takes collateral where it is considered necessary to support both on and off Balance Sheet financial instruments. The
Group evaluates each customer’s creditworthiness on a case-by-case basis. The amount of collateral taken, if deemed
necessary, is based on management’s credit evaluation of the counterparty. The Group has the right to sell, re-pledge, or
otherwise use some of the collateral received. At Balance Sheet date the carrying value of cash accepted as collateral (and
recognised on the Group’s and the Bank’s Balance Sheets) and the fair value of securities accepted as collateral (but not
recognised on the Group’s or the Bank’s Balance Sheets) were as follows:
Group Bank
2016 2015 2016 2015
$M $M $M $M
Cash 12,172 14,249 11,856 13,543
Securities 8,925 13,846 8,673 13,518
Collateral held 21,097 28,095 20,529 27,061
Collateral held which is re-pledged or sold - 9 - -
Assets Pledged
As part of standard terms of transactions with other banks, the Group has provided collateral to secure liabilities. At Balance
Sheet date, the carrying value of assets pledged as collateral to secure liabilities is as follows:
Group Bank
2016 2015 2016 2015
$M $M $M $M
Cash 7,865 6,687 7,016 6,367
Securities (1) 17,228 13,113 17,411 13,186
Assets pledged 25,093 19,800 24,427 19,553
Asset pledged which can be re-pledged or re-sold by counterparty (2) 17,228 13,113 17,411 13,186
(1) These balances include assets sold under repurchase agreements. The liabilities related to these repurchase agreements are disclosed in Note 17.
(2) Comparatives have been restated to align to the presentation in the current year.
The Group and the Bank have pledged collateral as part of entering repurchase and derivative agreements. These transactions
are governed by standard industry agreements.

Notes to the Financial Statements
142 Commonwealth Bank of Australia – Annual Report 2016
Note 43 Offsetting Financial Assets and Financial Liabilities
The table below identifies amounts that have been offset on the Balance Sheet and amounts covered by enforceable netting arrangements or similar agreements that do not qualify for set off. Cash settled
derivatives that trade on an exchange are deemed to be economically settled and therefore outside the scope of these disclosures.
Group
30 June 2016
Amounts offset on the Balance Sheet Amounts not offset on the Balance Sheet
Gross Balance Reported on the Financial Financial Collateral Not subject to Total Balance
Sheet Amount Amount offset Balance Sheet Instruments (1)
(Received)/ Pledged (1)
Net Amount Netting Agreements Sheet amount
Financial Instruments $M $M $M $M $M $M $M $M
Derivative assets 48,681 (7,795) 40,886 (23,077) (11,173) 6,636 5,681 46,567
Securities purchased under agreements to
resell 8,925 - 8,925 (489) (8,427) 9 - 8,925
Equity securities sold not delivered 915 (531) 384 - - 384 - 384
Total financial assets 58,521 (8,326) 50,195 (23,566) (19,600) 7,029 5,681 55,876
Derivative liabilities (47,622) 11,479 (36,143) 23,077 7,421 (5,645) (3,778) (39,921)
Securities sold under agreements to
repurchase (2) (17,180) - (17,180) 489 16,691 - - (17,180)
Equity securities purchased not delivered (988) 531 (457) - - (457) - (457)
Total financial liabilities (65,790) 12,010 (53,780) 23,566 24,112 (6,102) (3,778) (57,558)
Subject to Enforceable Master Netting or Similar Agreements
Group
30 June 2015
Amounts offset on the Balance Sheet Amounts not offset on the Balance Sheet
Gross Balance Reported on the Financial Financial Collateral Not subject to Total Balance
Sheet Amount Amount offset Balance Sheet Instruments (1)
(Received)/ Pledged (1)
Net Amount Netting Agreements Sheet amount
Financial Instruments (3)$M $M $M $M $M $M $M $M
Derivative assets 43,197 (3,169) 40,028 (20,799) (14,016) 5,213 6,126 46,154
Securities purchased under agreements to
resell 13,846 - 13,846 (264) (13,525) 57 - 13,846
Equity securities sold not delivered 1,969 (710) 1,259 - - 1,259 - 1,259
Total financial assets 59,012 (3,879) 55,133 (21,063) (27,541) 6,529 6,126 61,259
Derivative liabilities (35,931) 4,832 (31,099) 20,799 6,292 (4,008) (4,114) (35,213)
Securities sold under agreements to
repurchase (12,976) - (12,976) 264 12,712 - - (12,976)
Equity securities purchased not delivered (1,201) 710 (491) - - (491) - (491)
Total financial liabilities (50,108) 5,542 (44,566) 21,063 19,004 (4,499) (4,114) (48,680)
Subject to Enforceable Master Netting or Similar Agreements
(1) For the purpose of this disclosure, the related amounts of financial instruments and financial collateral not set off on the Balance Sheet have been capped by relevant netting agreements so as not to exceed the net amounts of financial assets/ (liabilities) reported on the Balance Sheet, i.e. over-collateralisation, where it exists, is not reflected in the tables. As a result the above collateral balances will not correspond to the tables on page 141.
(2) Securities sold under agreements to repurchase include $56 million of equity securities lending arrangements reported under Bills Payable and Other Liabilities.
(3) Certain comparative information has been restated to align to presentation in the current year.

Notes to the Financial Statements
Commonwealth Bank of Australia – Annual Report 2016 143
Bank
30 June 2016
Subject to Enforceable Master Netting or Similar Agreements
Amounts offset on the Balance Sheet Amounts not offset on the Balance Sheet
Gross Balance Reported on the Financial Financial Collateral Not subject to Total Balance
Sheet Amount Amount offset Balance Sheet Instruments (1)
(Received)/ Pledged (1)
Net Amount Netting Agreements Sheet amount
Financial Instruments $M $M $M $M $M $M $M $M
Derivative assets 48,975 (7,795) 41,180 (23,653) (11,022) 6,505 5,345 46,525
Securities purchased under agreements
to resell 8,673 - 8,673 (489) (8,175) 9 - 8,673
Total financial assets 57,648 (7,795) 49,853 (24,142) (19,197) 6,514 5,345 55,198
Derivative liabilities (51,578) 11,479 (40,099) 23,653 6,607 (9,839) (3,785) (43,884)
Securities sold under agreements to
repurchase (2) (17,361) - (17,361) 489 16,872 - - (17,361)
Total financial liabilities (68,939) 11,479 (57,460) 24,142 23,479 (9,839) (3,785) (61,245)
Bank
30 June 2015
Subject to Enforceable Master Netting or Similar Agreements
Amounts offset on the Balance Sheet Amounts not offset on the Balance Sheet
Gross Balance Reported on the Financial Financial Collateral Not subject to Total Balance
Sheet Amount Amount offset Balance Sheet Instruments (1)
(Received)/ Pledged (1)
Net Amount Netting Agreements Sheet amount
Financial Instruments (3)$M $M $M $M $M $M $M $M
Derivative assets 42,597 (3,169) 39,428 (21,107) (13,316) 5,005 6,179 45,607
Securities purchased under agreements
to resell 13,518 - 13,518 (264) (13,196) 58 - 13,518
Total financial assets 56,115 (3,169) 52,946 (21,371) (26,512) 5,063 6,179 59,125
Derivative liabilities (40,308) 4,832 (35,476) 21,107 5,979 (8,390) (4,160) (39,636)
Securities sold under agreements to
repurchase (13,048) - (13,048) 264 12,784 - - (13,048)
Total financial liabilities (53,356) 4,832 (48,524) 21,371 18,763 (8,390) (4,160) (52,684)
(1) For the purpose of this disclosure, the related amounts of financial instruments and financial collateral not set off on the Balance Sheet have been capped by relevant netting agreements so as not to exceed the net amounts of financial assets/
(liabilities) reported on the Balance Sheet, i.e. over-collateralisation, where it exists, is not reflected in the tables. As a result the above collateral balances will not correspond to the tables on page 141.
(2) Securities sold under agreements to repurchase include $56 million of equity securities lending arrangements reported under Bills Payable and Other Liabilities.
(3) Certain comparative information has been restated to align to presentation in the current year.

Notes to the Financial Statements
144 Commonwealth Bank of Australia – Annual Report 2016
Note 43 Offsetting Financial Assets and Financial Liabilities including Collateral
Arrangements (continued)
Related Amounts not Set Off on the Balance Sheet
Derivative Assets and Liabilities
The “Financial Instruments” column identifies financial assets and liabilities that are subject to set off under netting agreements,
such as the ISDA Master Agreement. All outstanding transactions with the same counterparty can be offset and close-out netting
applied if an event of default or other predetermined events occur. Financial collateral refers to cash and non-cash collateral
obtained to cover the net exposure between counterparties by enabling the collateral to be realised in an event of default or if
other predetermined events occur.
Repurchase and Reverse Repurchase Agreements and Security Lending Agreements
The “Financial Instruments” column identifies financial assets and liabilities that are subject to set off under netting agreements,
such as global master repurchase agreements and global master securities lending agreements. Under these netting
agreements, all outstanding transactions with the same counterparty can be offset and close-out netting applied if an event of
default or other predetermined events occur. Financial collateral typically comprises highly liquid securities which are legally
transferred and can be liquidated in the event of counterparty default.
Note 44 Subsequent Events
The Bank expects the DRP for the final dividend for the year ended 30 June 2016 will be satisfied by the issue of shares of
approximately $628 million.
The Directors are not aware of any other matter or circumstance that has occurred since the end of the financial year that has
significantly affected or may significantly affect the operations of the Group, the results of those operations or the state of affairs
of the Group in subsequent financial years.

Directors’ Declaration
Commonwealth Bank of Australia – Annual Report 2016 145
In accordance with a resolution of the Directors of the Commonwealth Bank of Australia (Bank), the Directors declare that:
(a) the Financial Statements and the accompanying notes for the financial year ended 30 June 2016 in relation to the Bank and
the consolidated entity (Group) are in accordance with the Corporations Act 2001, including:
(i) s 296 (which requires the Financial Report, including the Financial Statements and the notes to the Financial
Statements, to comply with the accounting standards); and
(ii) s 297 (which requires the Financial Statements, and the notes to the Financial Statements, to give a true and fair view
of the financial position and performance of the Group and the Bank);
(b) in compliance with the accounting standards, the notes to the Financial Statements include an explicit and unreserved
statement of compliance with international financial reporting standards (see Note 1(a)); and
(c) in the opinion of the Directors, there are reasonable grounds to believe that the Bank will be able to pay its debts as and
when they become due and payable.
The Directors have been given the declarations required by s 295A in respect of the financial year ended 30 June 2016.
Signed in accordance with a resolution of the Directors.
David Turner
Chairman
9 August 2016
Ian Narev
Managing Director and Chief Executive Officer
9 August 2016

146 Commonwealth Bank of Australia – Annual Report 2016
Independent auditor’s report to the members of Commonwealth Bank of Australia
Report on the financial report
We have audited the accompanying financial report of Commonwealth Bank of Australia (the Company), which comprises the
balance sheets as at 30 June 2016, the income statements, statements of comprehensive income, statements of changes in
equity and statements of cash flows for the year ended on that date, a summary of significant accounting policies, other
explanatory notes and the directors’ declaration for both Commonwealth Bank of Australia and the Group (the Consolidated
Entity). The Consolidated Entity comprises the Company and the entities it controlled at year’s end or from time to time during the
financial year.
Directors’ responsibility for the financial report
The directors of the Company are responsible for the preparation of the financial report that gives a true and fair view in
accordance with Australian Accounting Standards and the Corporations Act 2001 and for such internal control as the directors
determine is necessary to enable the preparation of the financial report that is free from material misstatement, whether due to
fraud or error. In Note 1(a), the directors also state, in accordance with Accounting Standard AASB 101 Presentation of Financial
Statements, that the financial statements comply with International Financial Reporting Standards.
Auditor’s responsibility
Our responsibility is to express an opinion on the financial report based on our audit. We conducted our audit in accordance with
Australian Auditing Standards. Those standards require that we comply with relevant ethical requirements relating to audit
engagements and plan and perform the audit to obtain reasonable assurance whether the financial report is free from material
misstatement.
An audit involves performing procedures to obtain audit evidence about the amounts and disclosures in the financial report. The
procedures selected depend on the auditor’s judgement, including the assessment of the risks of material misstatement of the
financial report, whether due to fraud or error. In making those risk assessments, the auditor considers internal control relevant to
the entity’s preparation and fair presentation of the financial report in order to design audit procedures that are appropriate in the
circumstances, but not for the purpose of expressing an opinion on the effectiveness of the entity’s internal control. An audit also
includes evaluating the appropriateness of accounting policies used and the reasonableness of accounting estimates made by
the directors, as well as evaluating the overall presentation of the financial report.
We believe that the audit evidence we have obtained is sufficient and appropriate to provide a basis for our audit opinions.
Independence
In conducting our audit, we have complied with the independence requirements of the Corporations Act 2001.
PricewaterhouseCoopers, ABN 52 780 433 757
Darling Park Tower 2, 201 Sussex Street, GPO BOX 2650, SYDNEY NSW 1171
T: +61 2 8266 0000, F: +61 2 8266 9999, www.pwc.com.au
Liability limited by a scheme approved under Professional Standards Legislation.

147 Commonwealth Bank of Australia – Annual Report 2016
Independent auditor’s report to the members of Commonwealth Bank of Australia
(continued)
Auditor’s opinion
(a) the financial report of Commonwealth Bank of Australia is in accordance with the Corporations Act 2001, including:
(i) giving a true and fair view of the Company’s and the Consolidated Entity's financial position as at 30 June 2016
and of their performance for the year ended on that date; and
(ii) complying with Australian Accounting Standards and the Corporations Regulations 2001.
(b) the financial report also complies with International Financial Reporting Standards as disclosed in Note 1(a).
Report on the Remuneration Report
We have audited the remuneration report included in pages 12 to 34 of the directors’ report for the year ended 30 June 2016. The
directors of the Company are responsible for the preparation and presentation of the remuneration report in accordance with
section 300A of the Corporations Act 2001. Our responsibility is to express an opinion on the remuneration report, based on our
audit conducted in accordance with Australian Auditing Standards.
Auditor’s opinion
In our opinion, the remuneration report of Commonwealth Bank of Australia for the year ended 30 June 2016 complies with
section 300A of the Corporations Act 2001.
PricewaterhouseCoopers
Marcus Laithwaite
Sydney
Partner 9 August 2016

Shareholding Information
148 Commonwealth Bank of Australia – Annual Report 2016
Top 20 Holders of Fully Paid Ordinary Shares as at 5 August 2016
Rank Name of Holder Number of Shares %
1 HSBC Custody Nominees (Australia) Limited 295,339,382 17.22
2 J P Morgan Nominees Australia Limited 182,660,882 10.65
3 National Nominees Limited 100,493,201 5.86
4 Citicorp Nominees Pty Limited 100,457,862 5.86
5 BNP Paribas Nominees Pty Limited 55,488,308 3.24
6 Bond Street Custodians Limited 22,950,957 1.34
7 RBC Dexia Investor Services Australia Nominees Pty Limited 16,932,163 0.99
8 Australian Foundation Investment Company limited 7,900,000 0.46
9 Navigator Australia Limited 3,920,319 0.23
10 Argo Investments Limited 3,203,731 0.19
11 Milton Corporation Limited 3,111,148 0.18
12 Pacific Custodians Pty Limited 2,865,992 0.17
13 UBS Nominees Pty Ltd 2,419,038 0.14
14 Nulis Nominees (Australia) Limited 2,258,286 0.13
15 Invia Custodian Pty Limited 1,938,770 0.11
16 Netwealth Investments Limited 1,765,984 0.10
17 IOOF Investment Management Limited 1,689,445 0.10
18 Mr. Barry Martin Lambert 1,643,613 0.10
19 McCusker Holdings Pty Ltd 1,451,000 0.08
20 ANZ Executors & Trustee 1,411,899 0.08
The top 20 shareholders hold 809,901,980 shares which is equal to 47.22% of the total shares on issue.
Substantial Shareholding
As at 5 August 2016 there were no shareholders who had a ‘substantial holding’ of our shares within the meaning of the
Corporation Act. A person has a substantial holding of our shares if the total votes attached to our voting shares in which they or
their associates have relevant interests is 5% or more of the total number of votes attached to all our voting shares. The above
table of the Top 20 ordinary shareholders includes shareholders that may hold shares for the benefit of third parties.
Stock Exchange Listing
The shares of the Commonwealth Bank of Australia (Bank) are listed on the Australian Securities Exchange under the trade
symbol CBA, with Sydney being the home exchange.
Details of trading activity are published in most daily newspapers, generally under the abbreviation of CBA or C’wealth Bank. The
Bank is not currently in the market conducting an on market buy-back of its shares.
Range of Shares (Fully Paid Ordinary Shares and Employee Shares) as at 5 August 2016
Range
Number of
Shareholders
Percentage of
Shareholders
Number of
Shares
Percentage of
Issued
Capital
1 – 1,000 599,302 73.12 191,078,177 11.14
1,001 – 5,000 192,068 23.43 397,721,422 23.19
5,001 – 10,000 19,645 2.40 133,255,192 7.77
10,001 – 100,000 8,410 1.03 158,786,770 9.26
100,001 and over 188 0.02 834,300,616 48.64
Total 819,613 100.00 1,715,142,177 100.00
Less than marketable parcel of $500 15,120 1.84 44,968 0.00
Voting Rights
Under the Bank’s Constitution, each person who is a voting Equity holder and who is present at a general meeting of the Bank in
person or by proxy, attorney or official representative is entitled:
On a show of hands – to one vote; and
On a poll – to one vote for each share held or represented. Every voting Equity holder who casts a vote by direct vote, shall
also have one vote for each share held or represented.
If a person present at a general meeting represents personally or by proxy, attorney or official representative more than one
Equity holder, on a show of hands the person is entitled to one vote even though he or she represents more than one Equity
holder.
If an Equity holder is present in person and votes on a resolution, any proxy or attorney of that Equity holder is not entitled to vote.
If more than one official representative or attorney is present for an Equity holder:
None of them is entitled to vote on a show of hands; and
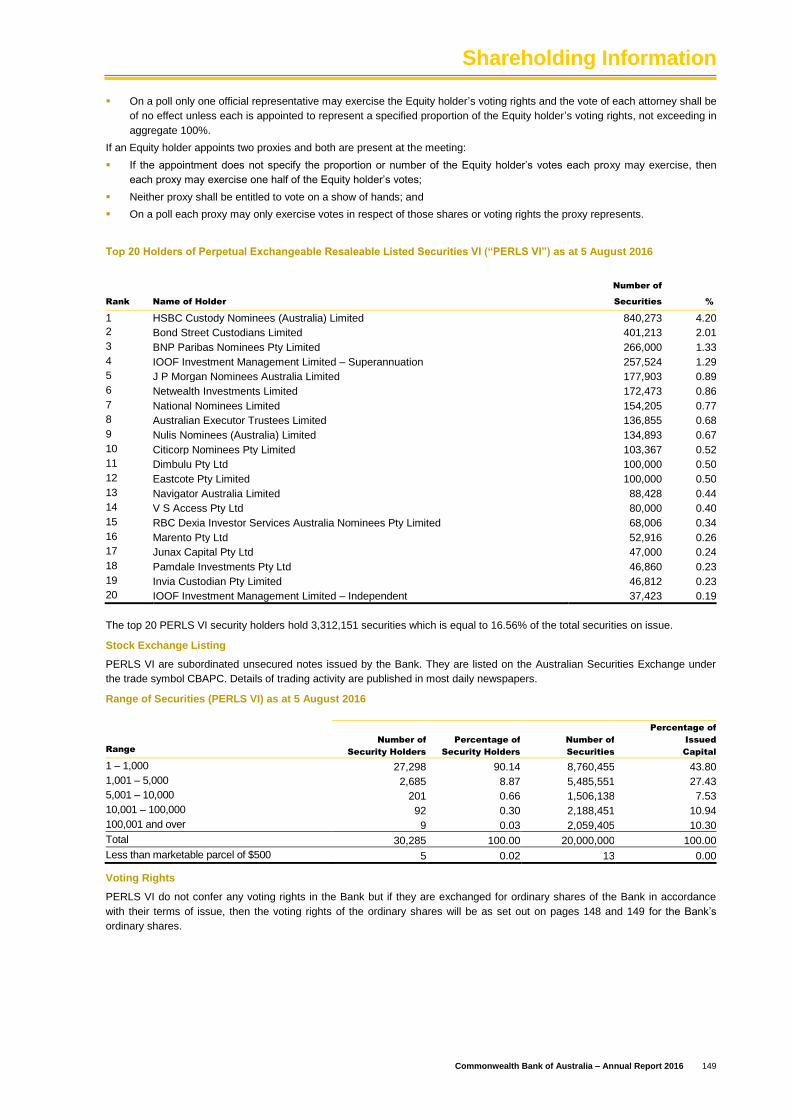
Shareholding Information
Commonwealth Bank of Australia – Annual Report 2016 149
On a poll only one official representative may exercise the Equity holder’s voting rights and the vote of each attorney shall be
of no effect unless each is appointed to represent a specified proportion of the Equity holder’s voting rights, not exceeding in
aggregate 100%.
If an Equity holder appoints two proxies and both are present at the meeting:
If the appointment does not specify the proportion or number of the Equity holder’s votes each proxy may exercise, then
each proxy may exercise one half of the Equity holder’s votes;
Neither proxy shall be entitled to vote on a show of hands; and
On a poll each proxy may only exercise votes in respect of those shares or voting rights the proxy represents.
Top 20 Holders of Perpetual Exchangeable Resaleable Listed Securities VI (“PERLS VI”) as at 5 August 2016
Rank Name of Holder
Number of
Securities %
1 HSBC Custody Nominees (Australia) Limited 840,273 4.20
2 Bond Street Custodians Limited 401,213 2.01
3 BNP Paribas Nominees Pty Limited 266,000 1.33
4 IOOF Investment Management Limited – Superannuation 257,524 1.29
5 J P Morgan Nominees Australia Limited 177,903 0.89
6 Netwealth Investments Limited 172,473 0.86
7 National Nominees Limited 154,205 0.77
8 Australian Executor Trustees Limited 136,855 0.68
9 Nulis Nominees (Australia) Limited 134,893 0.67
10 Citicorp Nominees Pty Limited 103,367 0.52
11 Dimbulu Pty Ltd 100,000 0.50
12 Eastcote Pty Limited 100,000 0.50
13 Navigator Australia Limited 88,428 0.44
14 V S Access Pty Ltd 80,000 0.40
15 RBC Dexia Investor Services Australia Nominees Pty Limited 68,006 0.34
16 Marento Pty Ltd 52,916 0.26
17 Junax Capital Pty Ltd 47,000 0.24
18 Pamdale Investments Pty Ltd 46,860 0.23
19 Invia Custodian Pty Limited 46,812 0.23
20 IOOF Investment Management Limited – Independent 37,423 0.19
The top 20 PERLS VI security holders hold 3,312,151 securities which is equal to 16.56% of the total securities on issue.
Stock Exchange Listing
PERLS VI are subordinated unsecured notes issued by the Bank. They are listed on the Australian Securities Exchange under
the trade symbol CBAPC. Details of trading activity are published in most daily newspapers.
Range of Securities (PERLS VI) as at 5 August 2016
Range
Number of
Security Holders
Percentage of
Security Holders
Number of
Securities
Percentage of
Issued
Capital
1 – 1,000 27,298 90.14 8,760,455 43.80
1,001 – 5,000 2,685 8.87 5,485,551 27.43
5,001 – 10,000 201 0.66 1,506,138 7.53
10,001 – 100,000 92 0.30 2,188,451 10.94
100,001 and over 9 0.03 2,059,405 10.30
Total 30,285 100.00 20,000,000 100.00
Less than marketable parcel of $500 5 0.02 13 0.00
Voting Rights
PERLS VI do not confer any voting rights in the Bank but if they are exchanged for ordinary shares of the Bank in accordance
with their terms of issue, then the voting rights of the ordinary shares will be as set out on pages 148 and 149 for the Bank’s
ordinary shares.

Shareholding Information
150 Commonwealth Bank of Australia – Annual Report 2016
Top 20 Holders of CommBank PERLS VII Capital Notes (“PERLS VII”) as at 5 August 2016
Rank Name of Holder
Number of
Securities %
1 HSBC Custody Nominees (Australia) Limited 1,948,603 6.50
2 Bond Street Custodians Limited 491,600 1.64
3 Pejr Pty Ltd 450,917 1.50
4 J P Morgan Nominees Australia Limited 373,256 1.24
5 National Nominees Limited 359,035 1.20
6 IOOF Investment Management 336,582 1.12
7 Netwealth Investments Limited 293,309 0.98
8 BNP Paribas Nominees Pty Limited 286,389 0.95
9 Citicorp Nominees Pty Limited 248,954 0.83
10 RBC Dexia Investor Services Australia Nominees Pty Limited 201,059 0.67
11 Nulis Nominees (Australia) Limited 188,869 0.63
12 Navigator Australia Limited 186,561 0.62
13 Australian Executor Trustees Limited 136,948 0.46
14 Dimbulu Pty Ltd 100,000 0.33
15 Invia Custodian Pty Limited 99,186 0.33
16 Simply Brilliant Pty Ltd 90,500 0.30
17 Randazzo C & G Developments Pty Ltd 84,286 0.28
18 Paul Lederer Pty Ltd 84,211 0.28
19 Trend Equities Pty Ltd 80,934 0.27
20 Tsco Pty Ltd 80,000 0.27
The top 20 PERLS VII security holders hold 6,121,199 securities which is equal to 20.40% of the total securities on issue.
Stock Exchange Listing
PERLS VII are subordinated unsecured notes issued by the Bank. They are listed on the Australian Securities Exchange under
the trade symbol CBAPD. Details of trading activity are published in most daily newspapers.
Range of Securities (PERLS VII) as at 5 August 2016
Range
Number of
Security holders
Percentage of
Security holders
Number of
Securities
Percentage of
Issued
Capital
1 – 1,000 29,257 87.00 10,114,784 33.72
1,001 – 5,000 3,862 11.49 8,104,784 27.02
5,001 – 10,000 292 0.87 2,156,146 7.19
10,001 – 100,000 202 0.60 4,891,716 16.31
100,001 and over 14 0.04 4,732,570 15.78
Total 33,627 100.00 30,000,000 100.00
Less than marketable parcel of $500 11 0.03 42 0.00
Voting Rights
PERLS VII do not confer any voting rights in the Bank but if they are exchanged for ordinary shares of the Bank in accordance
with their terms of issue, then the voting rights of the ordinary shares will be as set out on pages 148 and 149 for the Bank’s
ordinary shares.
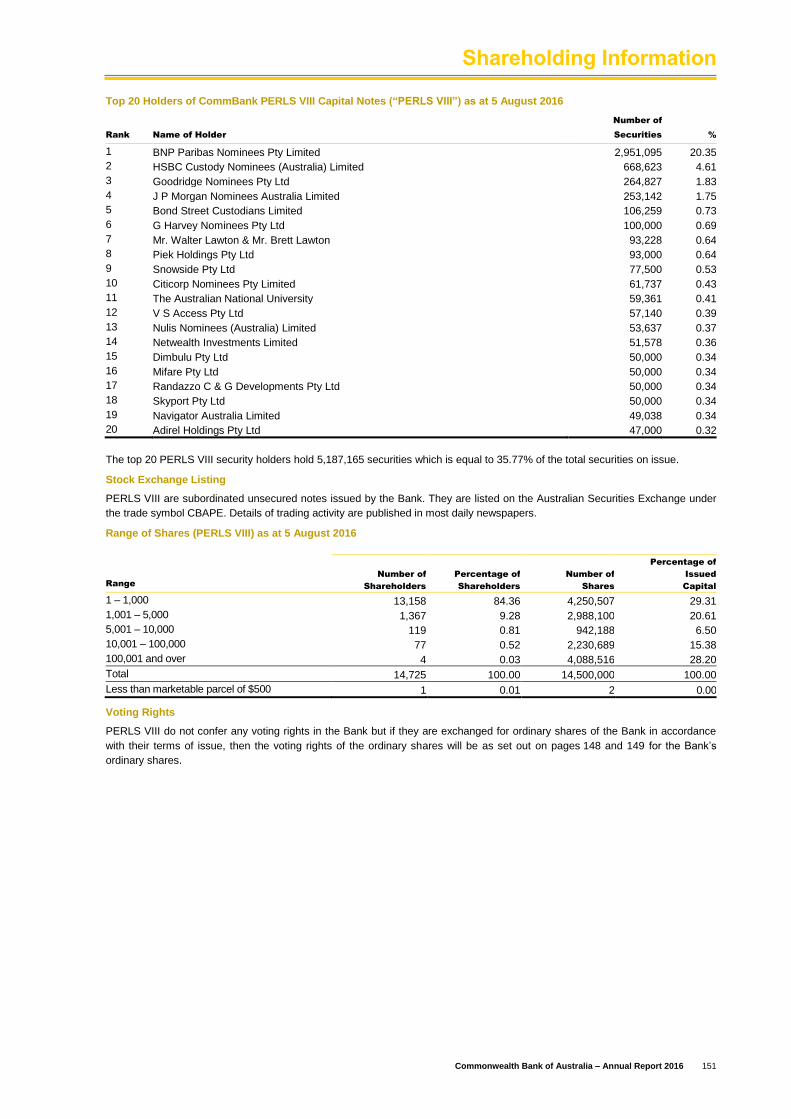
Shareholding Information
Commonwealth Bank of Australia – Annual Report 2016 151
Top 20 Holders of CommBank PERLS VIII Capital Notes (“PERLS VIII”) as at 5 August 2016
Rank Name of Holder
Number of
Securities %
1 BNP Paribas Nominees Pty Limited 2,951,095 20.35
2 HSBC Custody Nominees (Australia) Limited 668,623 4.61
3 Goodridge Nominees Pty Ltd 264,827 1.83
4 J P Morgan Nominees Australia Limited 253,142 1.75
5 Bond Street Custodians Limited 106,259 0.73
6 G Harvey Nominees Pty Ltd 100,000 0.69
7 Mr. Walter Lawton & Mr. Brett Lawton 93,228 0.64
8 Piek Holdings Pty Ltd 93,000 0.64
9 Snowside Pty Ltd 77,500 0.53
10 Citicorp Nominees Pty Limited 61,737 0.43
11 The Australian National University 59,361 0.41
12 V S Access Pty Ltd 57,140 0.39
13 Nulis Nominees (Australia) Limited 53,637 0.37
14 Netwealth Investments Limited 51,578 0.36
15 Dimbulu Pty Ltd 50,000 0.34
16 Mifare Pty Ltd 50,000 0.34
17 Randazzo C & G Developments Pty Ltd 50,000 0.34
18 Skyport Pty Ltd 50,000 0.34
19 Navigator Australia Limited 49,038 0.34
20 Adirel Holdings Pty Ltd 47,000 0.32
The top 20 PERLS VIII security holders hold 5,187,165 securities which is equal to 35.77% of the total securities on issue.
Stock Exchange Listing
PERLS VIII are subordinated unsecured notes issued by the Bank. They are listed on the Australian Securities Exchange under
the trade symbol CBAPE. Details of trading activity are published in most daily newspapers.
Range of Shares (PERLS VIII) as at 5 August 2016
Range
Number of
Shareholders
Percentage of
Shareholders
Number of
Shares
Percentage of
Issued
Capital
1 – 1,000 13,158 84.36 4,250,507 29.31
1,001 – 5,000 1,367 9.28 2,988,100 20.61
5,001 – 10,000 119 0.81 942,188 6.50
10,001 – 100,000 77 0.52 2,230,689 15.38
100,001 and over 4 0.03 4,088,516 28.20
Total 14,725 100.00 14,500,000 100.00
Less than marketable parcel of $500 1 0.01 2 0.00
Voting Rights
PERLS VIII do not confer any voting rights in the Bank but if they are exchanged for ordinary shares of the Bank in accordance
with their terms of issue, then the voting rights of the ordinary shares will be as set out on pages 148 and 149 for the Bank’s
ordinary shares.
International Representation
152 Commonwealth Bank of Australia – Annual Report 2016
Australia
Head Office
Commonwealth Bank of Australia
Ground Floor, Tower 1
201 Sussex Street
Sydney NSW 2000
Telephone: +61 2 9378 2000
New Zealand
ASB Bank Limited
ASB North Wharf
12 Jellicoe Street
Auckland Central
Auckland 1010
Telephone: +64 9 377 8930
Chief Executive Officer
Barbara Chapman
CBA NZ Branch
ASB North Wharf
12 Jellicoe Street
Auckland Central
Auckland 1010
Telephone: +64 9 337 4748
General Manager
Andrew Woodward
Sovereign Assurance Company Limited
Level 4, Sovereign House
74 Taharoto Road,
Takapuna, Auckland 0622
Telephone: + 64 9 487 9000
Chief Executive Officer
Nicholas Stanhope
First State Investments
ASB North Wharf
12 Jellicoe Street
Auckland Central
Auckland 1010
Telephone: +64 2 195 1520
Head of Business Development,
Australia & New Zealand
Harry Moore
Africa
South Africa
CBA South Africa,
2nd Floor, 30 Jellicoe Avenue, Rosebank
Johannesburg 2196
Telephone: + 27 87 286 8833
Executive General Manager,
South Africa
Rowan Munchenberg
Americas
United States
CBA Branch Office
Level 17, 599 Lexington Avenue
New York NY 10022
Telephone: +1 212 848 9200
Facsimile: +1 212 336 7758
Managing Director, Americas
Leon Allen
First State Investments
Level 17, 599 Lexington Avenue
New York NY 10022
Telephone: +1 212 848 9293
Facsimile: +1 212 336 7725
Managing Director, Americas
James Twiss
Asia
China
CMG, Beijing Representative Office
Unit 2908, Level 29
China World Tower 1,
1 Jianguomenwai Avenue,
Beijing 100004
Telephone: +86 10 6505 5023
Facsimile: +86 10 6505 5004
China Chief Representative
James Gao
CBA Beijing Branch Office
Room 4606 China World Tower,
1 Jianguomenwai Avenue,
Beijing 100004
Telephone: +86 10 5680 3000
Facsimile: +86 10 5961 1916
Branch Manager Beijing
Tony Zhang
CBA Shanghai Branch Office
Level 11 Azia Centre
1233 Lujiazui Ring Road
Pudong
Shanghai 200120
Telephone: +86 21 6123 8900
Facsimile: +86 21 6165 0285
Branch Manager Shanghai
Vivienne Yu
CommBank Management Consulting
(Shanghai) Co. Ltd
11F Azia Centre
1233 Lujiazui Ring Road, Pudong
Shanghai 200120
Telephone: +86 21 6058 0100
Facsimile: +86 21 6168 3298
Executive General Manager China
Vivienne Yu
Additional Chinese representation
The Group has established 15 County
Banks in China in Henan Province
(County: Jiyuan, Dengfeng, Lankao,
Mianchi, Yichuan, Yongcheng, Wenxian)
and Hebei Province (County: Xinji,
Yongnian, Cixian, Luancheng, Cheng’an,
Weixian, Shexian, Handan).
Telephone: +86 216058 0100
First State Investments
24th Floor, China Merchants Bank
Building
7088, Shen Nan Road, Shenzhen
China 518040
Telephone: +86 755 8317 2666
Facsimile: +86 755 8319 6151
Managing Partner, First State Stewart
Michael Stapleton
Hong Kong
CBA Hong Kong Branch,
Level 13, One Exchange Square,
8 Connaught Place,
Central, Hong Kong
Telephone: +852 2844 7500
Managing Director, Hong Kong
Maaike Steinebach
CBA International Financial Services
Limited
Level 14, One Exchange Square
8 Connaught Place,
Central, Hong Kong
Telephone: +852 2844 7500
Facsimile: +852 2845 9194
Group Executive International Financial
Services
Robert Jesudason
First State Investments
Level 25, One Exchange Square
8 Connaught Place,
Central, Hong Kong
Telephone: +852 2846 7566
Facsimile: +852 2868 4036
Regional Managing Director, Asia
Joe Fernandes
India
CBA Mumbai Branch
Level 2, Hoechst House
Nariman Point
Mumbai 400021
Telephone: +91 22 6139 0100
Facsimile: +91 22 6139 0200
Chief Executive Officer
Ravi Kushan

International Representation
Commonwealth Bank of Australia – Annual Report 2016 153
Indonesia
PT Bank Commonwealth
World Trade Centre 6, 3A Floor
Jl. Jendral Sudirman Kav. 29-31
Jakarta 12920
Telephone: +62 21 5296 1222
Facsimile: +62 21 5296 2293
President Director
Lauren Sulistiawati
PT Commonwealth Life
World Trade Centre 6, 8th Floor,
JI. Jendral Sudirman Kav. 29-31
Jakarta 12920
Telephone: +62 21 570 5000
Facsimile: +62 21 520 5353
President Director
Simon Bennett
First State Investments
29th Floor, Gedung Artha Graha
Sudirman Central Business District
Jl. Jend. Sudirman Kav. 52-53
Jakarta 12190
Telephone: +62 21 515 0088
Facsimile: +62 21 515 0033
Regional Managing Director, Asia
Joe Fernandes
Japan
CBA Branch Office
8th Floor, Toranomon Waiko Building
12-1 Toranomon 5-chome
Minato-ku, Tokyo 105-0001
Telephone: +81 3 5400 7280
Facsimile: +81 3 5400 7288
Branch Head Tokyo
Martin Spann
First State Investments
8th Floor, Toranomon Waiko Building
12-1 Toranomon 5-chome
Minato-ku, Tokyo 105-0001
Telephone: +81 3 5402 4831
Facsimile: +81 3 5402 4839
Regional Managing Director, Asia
Joe Fernandes
Singapore
CBA Branch Office
38 Beach Road
06-11 South Beach Tower
Singapore 189767
Telephone: +65 6349 7000
Facsimile: +65 6224 5812
Managing Director, Singapore
Scott Speedie
First State Investments
38 Beach Road
06-11 South Beach Tower
Singapore 189767
Telephone: +65 6538 1390
Facsimile: +65 6538 1421
Regional Managing Director, Asia
Joe Fernandes
UAE
First State Investments
Level 14, The Gate Building
P.O Box 74777, Dubai
Telephone: +971 14 4019340
Managing Director, EMEA
Chris Turpin
Vietnam
CBA Representative Office
Suite 603-604
Central Building
31 Hai Ba Trung, Hanoi
Telephone: +84 4 3824 3213
Facsimile: +84 4 3824 3961
Chief Representative and Director of
Investment and Banking
Hanh Nguyen
CBA Ho Chi Minh City Branch
Hoa Lam Building
4B Ton Duc Thang, Dist. 1
Ho Chi Minh City
Telephone: +84 8 3824 1525
Facsimile: +84 8 3824 2703
General Director
Shane O’Connor
Europe
France
First State Investments
14, Avenue d’Eylau
75016 Paris
Telephone: +33 1 7302 4674
Managing Director, EMEA
Chris Turpin
Germany
First State Investments
Westhafen Tower
Westhafenplatz 1
60327 Frankfurt a.M.
Telephone: +49 0 69 710456 - 302
Managing Director, EMEA
Chris Turpin
Malta
CommBank Europe Limited
Level 3 Strand Towers
36 The Strand
Sliema SLM07
Telephone: +356 2132 0812
Facsimile: +356 2132 0811
Chief Financial Officer
Brett Smith
United Kingdom
England
CBA Branch Office
1 New Ludgate
60 Ludgate Hill
London EC4V 4HA
Telephone: +44 20 7710 3999
Facsimile: +44 20 7710 3939
Managing Director, Europe
Paul Orchart
First State Investments
Finsbury Circus House
15 Finsbury Circus
London EC2M 7EB
Telephone: +44 0 20 7332 6500
Facsimile: +44 0 20 7332 6501
Managing Director, EMEA
Chris Turpin
Scotland
First State Investments
23 St Andrew Square
Edinburgh EH2 1BB
Telephone: +44 0 131 473 2200
Facsimile: +44 0 131 473 2222
Managing Director, EMEA
Chris Turpin
Contact Us
154 Commonwealth Bank of Australia – Annual Report 2016
132 221 General Enquiries
For your everyday banking including paying bills using
BPAY® our automated service is available 24 hours a day,
7 days a week.
132 221 Lost, Stolen or Damaged Cards
To report a lost or stolen card 24 hours a day, 7 days a week.
From overseas call +61 2 9999 3283. Operator assistance is
available 24 hours a day, 7 days a week.
® Registered to BPAY Pty Ltd ABN 69 079 137 518
132 224 Home Loans and Investment Home Loans
To apply for a new home loan or investment home loan or to
maintain an existing loan. Available from 8am to 8pm, 7 days
a week.
131 431 Personal Loan Sales
To apply for a new personal loan.
Available from 8am to 8pm, 7 days a week.
1800 805 605 Customer Relations
If you would like to pay us a compliment or are dissatisfied
with any aspect of the service you have received.
Internet Banking
You can apply for a home loan, credit card, personal loan,
term deposit or a savings account on the internet by visiting
our website at www.commbank.com.au available 24 hours a
day, 7 days a week.
Do your everyday banking on our internet banking service
NetBank at www.commbank.com.au/netbank available 24
hours a day, 7 days a week.
To apply for access to NetBank, call 132 221.
Available 24 hours a day, 7 days a week.
Do your business banking on our Business Internet Banking
Service CommBiz at www.commbank.com.au/CommBiz
available 24 hours a day, 7 days a week.
To apply for access to CommBiz, call 132 339.
Available 24 hours a day, 7 days a week.
Special Telephony Services
Customers who are hearing or speech impaired can contact
us via the National Relay Service (www.relayservice.com.au)
available 24 hours a day, 7 days a week.
Telephone Typewriter (TTY) service users can be connected to any of our telephone numbers via 133 677.
Speak and Listen (speech-to-speech relay) users can also connect to any of our telephone numbers by calling 1300 555 727.
Internet relay users can be connected to our telephone numbers via National Relay Service.
131 519 CommSec (Commonwealth Securities)
For enquiries about CommSec products and services
visit www.commsec.com.au.
Available from 8am to 7pm (Sydney Time), Monday to Friday,
for share trading and stock market enquiries, and 8am to 7pm
7 days a week for Commsec Cash Management. A 24 hour
lost and stolen card line is available 24 hours, 7 days a week.
131 709 CommSec Margin Loan
Enables you to expand your portfolio by borrowing against
your existing shares and managed funds. To find out more
simply call 131 709 8am to 6pm (Sydney Time) Monday to
Friday or visit www.commsec.com.au.
1800 019 910 Corporate Financial Services
For a full range of financial solutions for medium-size and
larger companies.
Available from 8am to 6pm (Sydney Time), Monday to Friday.
131 998 Local Business Banking
A dedicated team of Business Banking Specialists, supporting
a network of branch business bankers, will help you with your
financial needs.
Available 24 hours a day, 7 days a week or visit
www.commbank.com.au/lbb.
1300 772 968 (1300 AGLINE) AgriLine
A dedicated team of Agribusiness Specialists will help you
with your financial needs. With our Business Banking team
living in regional and rural Australia, they understand the
challenges you face. Available 24 hours a day, 7 days a
week.
Colonial First State
Existing investors can call 131 336 from 8am to 7pm (Sydney
Time) Monday to Friday.
New investors without a financial adviser can call
1300 360 645. Financial advisers can call 131 836.
Alternatively, visit www.colonialfirststate.com.au.
1300 362 081 Commonwealth Private
Commonwealth Private offers clients with significant financial
resources a comprehensive range of services, advice and
opportunities to meet their specific needs. For a confidential
discussion about how Commonwealth Private can help you,
call 1300 362 081 between 8am to 5:30pm (Sydney time),
Monday to Friday or visit
www.commbank.com.au/commonwealthprivate
132 015 Commonwealth Financial Services
For enquiries on retirement and superannuation products, or
managed investments. Available from 8.30am to 6pm
(Sydney Time), Monday to Friday.
Unit prices are available 24 hours a day, 7 days a week.
CommInsure
For all your general insurance needs call 132 423 8am to
8pm (Sydney Time), Monday to Friday and 8am to 5pm
(Sydney Time) on Saturday.
For all your life insurance needs call 131 056 8am to 8pm
(Sydney Time), Monday to Friday.
Alternatively, visit www.comminsure.com.au.

Corporate Directory
Commonwealth Bank of Australia – Annual Report 2016 155
Registered Office
Ground Floor, Tower 1
201 Sussex Street
Sydney NSW 2000
Telephone +61 2 9378 2000
Facsimile +61 2 9118 7192
Company Secretary
Taryn Morton
Shareholder Information
www.commbank.com.au/shareholder
Share Registrar
Link Market Services Limited
Level 12
680 George Street
Sydney NSW 2000
Telephone: 1800 022 440
Facsimile: +61 2 9287 0303
Internet: www.linkmarketservices.com.au
Email: [email protected]
Telephone numbers for overseas shareholders
New Zealand
0800 442 845
United Kingdom
0845 640 6130
Fiji
008 002 054
Other International
+61 2 8280 7199
Australian Securities Exchange Listing
CBA
Annual Report
To request a copy of the Annual Report, please call Link Market Services Limited on 1800 022 440 or by email at
Electronic versions of Commonwealth Bank’s past and current Annual Reports are available on
www.commbank.com.au/shareholder/annualreports.