financial report (u.s. version) year ended 30 june 2009 · financial statements for the years ended...
TRANSCRIPT

Commonwealth Bank of Australia
ACN 123 123 124
Financial Report (U.S. Version)
Year Ended 30 June 2009


Contents
Commonwealth Bank of Australia Financial Report (U.S. Version) 2009 1
Introduction 2
Directors‟ Report 3
Financial Statements 33
Income Statements 34
Balance Sheets 35
Statements of Recognised Income and Expense 36
Statements of Cash Flows 37
Notes to the Financial Statements 39
Directors‟ Declaration 167
Independent Audit Report 168

Introduction
2 Commonwealth Bank of Australia Financial Report (U.S. Version) 2009
Introduction
The Commonwealth Bank of Australia Financial Report (U.S.
Version) – Year Ended 30 June 2009, which contains the
Financial Statements for the years ended 30 June 2007, 2008
and 2009 and as of 30 June 2008 and 2009 (the “2009
Financial Report”) should be read in conjunction with:
The Commonwealth Bank of Australia Financial Report
(U.S. Version) – Year Ended 30 June 2008, which
contains the Financial Statements for the years ended 30
June 2006, 2007 and 2008 and as of 30 June 2007 and
2008 (the “2008 Financial Report”);
as found on the U.S. Investor Website located at
http://www.commbank.com.au/usinvestors.

Directors’ Report
Commonwealth Bank of Australia Financial Report (U.S. Version) 2009 3
The Directors of the Commonwealth Bank of Australia submit
their report, together with the financial report of the
Commonwealth Bank of Australia (“the „Bank”) and of the
Group, being the Bank and its controlled entities, for the year
ended 30 June 2009.
The names of the Directors holding office during the financial
year are set out below, together with details of Directors‟
experience, qualifications, special responsibilities and
organisations in which each of the Directors has declared an
interest.
John M Schubert, Chairman
Dr Schubert has been a member of the Board since 1991 and
Chairman since November 2004. He is Chairman of the Board
Performance & Renewal Committee and a member of the Risk
Committee and People & Remuneration Committee. He holds a
Bachelor‟s Degree and PhD in Chemical Engineering and has
executive experience in the petroleum, mining and building
materials industries. Dr Schubert is the former Managing
Director and Chief Executive Officer of Pioneer International
Limited and the former Chairman and Managing Director of
Esso Australia Ltd.
Chairman: G2 Therapies Limited, Great Barrier Reef
Foundation.
Director: BHP Billiton Limited, BHP Billiton Plc and Qantas
Airways Limited.
Other Interests: Academy of Technological Science and
Engineering (Fellow), Institute of Engineers (Fellow) and
Honorary Member & Past President, Business Council of
Australia.
Dr Schubert is a resident of New South Wales. Age 66.
David Turner will succeed John Schubert as Chairman in
February 2010.
Ralph J Norris, KNZM, Managing Director and Chief
Executive Officer
Mr Norris was appointed as Managing Director and Chief
Executive Officer with effect from September 2005. Mr Norris
had been Chief Executive Officer and Managing Director of Air
New Zealand since 2002 and had been a Director of that
Company since 1998. He retired from that Board in 2005 to take
up his position with the Group. He is a member of the Risk
Committee.
Mr Norris has a 30 year career in Banking. He was Chief
Executive Officer of ASB Bank Limited from 1991 until 2001 and
Head of International Financial Services from 1999 until 2001.
In 2005, Mr Norris retired from the Board of Fletcher Building
Limited where he had been a Director since 2001.
Chairman: Australian Bankers‟ Association and
CommFoundation Pty Limited
Director: Business Council of Australia and Financial Markets
Foundation for Children
Other Interests: New Zealand Institute of Management (Fellow)
and New Zealand Computer Society (Fellow).
Mr Norris is a resident of New South Wales. Age 60.
Sir John A Anderson, KBE
Sir John joined the Board on 12 March 2007. He is a member of
the Risk Committee. Sir John is a highly respected business and
community leader, having held many senior positions in New
Zealand finance including Chief Executive and Director of ANZ
National Bank Limited from 2003 to 2005 and the National Bank
of New Zealand Limited from 1989 to 2003.
In 1994, Sir John was awarded Knight Commander of the Civil
Division of the Order of the British Empire, and in 2005 received
the inaugural Blake Medal for “Outstanding Leadership
Contributions to New Zealand”.
Chairman: Television New Zealand Limited, Capital and Coast
District Health Board, New Zealand Venture Investment Fund
and Hawke‟s Bay District Health Board.
Other Interests: Institute of Financial Professionals New Zealand
(Fellow), Institute of Directors (Fellow), New Zealand Society of
Accountants (Fellow), Australian Institute Banking and Finance
(Life Member).
Sir John is a resident of Wellington, New Zealand. Age 64.
Reg J Clairs, AO
Mr Clairs has been a member of the Board since 1999 and is
Chairman of the People & Remuneration Committee, and a
member of the Risk Committee. As the former Chief Executive
Officer of Woolworths Limited, he had 33 years experience in
retailing, branding and customer service.
Director: David Jones Limited
Other Interests: Australian Institute of Company Directors
(Member).
Mr Clairs is a resident of Queensland. Age 71.
Colin R Galbraith, AM
Mr Galbraith has been a member of the Board since 2000 and is
a member of the Risk Committee, Audit Committee and Board
Performance & Renewal Committee. He is a special advisor for
Gresham Partners Limited.
Chairman: BHP Billiton Community Trust.
Director: OneSteel Limited and Australian Institute of Company
Directors.
Other Interests: CARE Australia (Director) and Royal Melbourne
Hospital Neuroscience Foundation (Trustee).
Mr Galbraith is a resident of Victoria. Age 61.
Jane S Hemstritch
Ms Hemstritch was appointed to the Board effective 9 October
2006 and is a member of the People & Remuneration
Committee and Risk Committee.
Ms Hemstritch was Managing Director - Asia Pacific, Accenture
Limited from 2004 until her retirement in February 2007. In this
role, she was a member of Accenture‟s global executive
leadership team and oversaw the management of Accenture‟s
business portfolio in Asia Pacific. She holds a Bachelor of
Science Degree in Biochemistry and Physiology and has
professional expertise in technology, communications, change
management and accounting. She also has experience across
the financial services, telecommunications, government, energy
and manufacturing sectors and in business expansion in Asia.
Director: The Global Foundation and Tabcorp (Appointed 13
November 2008).
Other Interests: Institute of Chartered Accountants in Australia
(Fellow), Institute of Chartered Accountants in England and
Wales (Fellow), Chief Executive Women Inc. (Member), Council
of Governing Members of The Smith Family and CEDA‟s Policy
and Research Committee (Member).
Ms Hemstritch is a resident of Victoria. Age 55.

Directors’ Report
4 Commonwealth Bank of Australia Financial Report (U.S. Version) 2009
Carolyn H Kay
Ms Kay has been a member of the Board since 2003 and is also
a member of the Audit, People & Remuneration and Risk
Committees. She holds Bachelor Degrees in Law and Arts and a
Graduate Diploma in Management. She has extensive
experience in Finance, particularly in International Finance
having worked as both a banker and a lawyer at Morgan
Stanley, JP Morgan and Linklaters & Paines in London, New
York and Australia.
Director: Allens Arthur Robinson, Brambles Industries Limited
and Sydney Institute.
Other Interests: Australian Institute of Company Directors
(Fellow) and Chief Executive Women‟s Inc (member).
Ms Kay is a resident of New South Wales. Age 48.
Fergus D Ryan
Mr Ryan has been a member of the Board since 2000 and is
Chairman of the Audit Committee and a member of the Risk
Committee. He has extensive experience in accounting, audit,
finance and risk management. He was a senior partner of Arthur
Andersen until his retirement in 1999 after 33 years with that firm
including five years as Managing Partner Australasia. Until 2002,
he was Strategic Investment Co-ordinator and Major Projects
Facilitator for the Commonwealth Government.
Director: Australian Foundation Investment Company Limited,
Centre for Social Impact, National Australia Day Council and
Deputy Chairman for National Library of Australia.
Other Interests: Committee for Melbourne (Counsellor) and
Pacific Institute (Patron).
Mr Ryan is a resident of Victoria. Age 66.
David J Turner
Mr Turner was appointed to the Board in August 2006 and is a
member of the Risk, Audit and Board Performance and Renewal
Committees.
Until his retirement on 30 June 2007, Mr Turner was CEO of
Brambles. He occupied that role since October 2003. He joined
Brambles as Chief Financial Officer in 2001 having previously
been Finance Director of GKN plc. Mr Turner has also served as
a member of the Board of Whitbread plc and as Chairman of its
Audit Committee from 2000 until 2006. He is a Fellow of The
Institute of Chartered Accountants in England and Wales and
has wide experience in finance, international business and
governance.
Chairman: Cobham plc.
Mr Turner is a resident of the United Kingdom. Age 64.
Harrison H Young
Mr Young has been a member of the Board since 2007. He is
Chairman of the Risk Committee and a member of the Audit
Committee. At the time of appointment to the Board, Mr Young
retired as Chairman of Morgan Stanley Australia, a position he
had held since 2003. From 1997 to 2003 he was a Managing
Director and Vice Chairman of Morgan Stanley Asia. Prior to
that, he spent two years in Beijing as Chief Executive of China
International Capital Corporation. From 1991 to 1994 he was a
senior officer of the Federal Deposit Insurance Corporation in
Washington.
Mr Young serves on the Court of Directors of the Bank of
England and is a member of its Financial Stability Committee.
Chairman: Howard Florey Institute Foundation.
Deputy Chairman: The Asia Society AustralAsia and Asialink.
Director: Florey Neuroscience Institutes and Financial Services
Volunteer Corps.
Trustee: The Asia Society AustralAsia.
Mr Young is a resident of Victoria. Age 64.
Andrew M Mohl
Mr Mohl was appointed to the Board effective 1 July 2008 and is
a member of the Risk and People & Remuneration Committees.
He has over 30 years of financial services experience. Mr Mohl
was Managing Director and Chief Executive Officer of AMP
Limited from October 2002 until the end of December 2007.
Previous roles at AMP included Managing Director, AMP
Financial Services and Managing Director and Chief Investment
Officer, AMP Asset Management.
Mr Mohl was a former Chief Economist and Managing Director,
ANZ Funds Management at ANZ Banking Group. He began his
career at the Reserve Bank of Australia where his roles included
Senior Economist and Deputy Head of Research.
Chairman: Federal Government Export Finance and Insurance
Corporation.
Director: AMP Foundation.
Other Interests: Coaching services to senior executives,
member of the Advisory Council of the Australian School of
Business.
Mr Mohl is a resident of New South Wales. Age 53.

Directors’ Report
Other Directorships
The Directors held directorships on listed companies within the last three years as follows:
Director Company Date Appointed Date of Ceasing
(if applicable)
J M Schubert BHP Biliton Limited 01/06/2000
Qantas Airways Limited 23/10/2000
BHP Biliton Plc 29/06/2001
R J Clairs David Jones Limited 22/02/1999
Cellnet Group Limited 01/07/2004 20/08/2007
C R Galbraith OneSteel Limited 25/10/2000
GasNet Australia Group 17/12/2001 10/11/2006
J S Hemstritch Tabcorp Holdings Ltd 13/11/2008
S C H Kay Brambles Industries Limited 01/06/2006
Symbion Health Limited 28/09/2001 02/03/2007
F D Ryan Australian Foundation Investment Company Limited 08/08/2001
D J Turner Brambles Limited 21/03/2006 16/11/2007
Cobham plc 01/12/2007
Directors’ Meetings
The number of Directors‟ meetings (including meetings of committees of Directors) and number of meetings attended by each of the
Directors of the Commonwealth Bank of Australia during the financial year were:
Director No. of Meetings
Held (1)
No. of Meetings
Attended
J M Schubert 20 20
R J Norris 20 20
J A Anderson 20 18
R J Clairs 20 17
C R Galbraith 20 19
J S Hemstritch 20 18
S C H Kay 20 17
A M Mohl 20 19
F D Ryan 20 20
D J Turner 19 16
H H Young 19 19
(1) The number of meetings held during the time the Director was a member of the Board and was eligible to attend.

Directors’ Report
6 Commonwealth Bank of Australia Financial Report (U.S. Version) 2009
Principal Activities
The Commonwealth Bank Group is one of Australia‟s leading
providers of integrated financial services including retail,
business and institutional banking, superannuation, life
insurance, general insurance, funds management, broking
services and finance company activities. The principal activities
of the Commonwealth Bank Group during the financial year
were:
(i) Retail Banking Services
The Group provides retail banking services within Australia
including housing loans, credit cards, personal loans, savings
and cheque accounts, and demand and term deposits.
(ii) Business and Private Banking
The Group offers commercial products within Australia including
business loans, deposits and asset finance facilities to small and
medium sized corporate customers and to rural and
agribusiness customers. In addition, the division also provides
private banking services to high net worth individuals and margin
lending through CommSec.
(iii) Institutional Banking and Markets
The Group provides Total Capital Solutions offering debt and
capital markets products, risk management solutions and
transactional banking to corporate and institutional clients. This
segment also has wholesale banking operations in London, New
York, Singapore, Hong Kong and Malta.
(iv) Wealth Management
The Wealth Management segment conducts Australian funds
management business comprising wholesale and retail
investment, superannuation and retirement funds. Investments
are across all major asset classes including Australian and
international shares, property, fixed interest and cash. St
Andrew‟s is also reported as part of the Wealth Management
segment. This segment also has funds management businesses
in the United Kingdom and Asia.
The Wealth Management segment also provides Australian term
insurance, disability insurance, annuities, master trusts,
investment products and general insurance.
(v) International Financial Services
The Group has full service banking operations in New Zealand,
Fiji, Indonesia and Vietnam. The Group conducts wholesale
operations in London and Hong Kong and is represented in
Japan and selected regions of China together with a
representative office in India. The Group‟s International Financial
Services segment also conducts Life Insurance operations in
New Zealand, where it has the leading market share, as well as
Asia and the Pacific, and conducts Funds Management
business in New Zealand.
(vi) Bankwest
Bankwest offers retail and small business banking services and
provides a comprehensive range of products for these clients.
Bankwest is a market leader in Western Australia with more than
a quarter of Western Australians having a relationship with the
Bankwest.
Committee Meetings
Risk Committee Audit Committee People & Remuneration
Committee
Director No. of Meetings
Held (1)
No. of Meetings
Attended
No. of Meetings
Held (1)
No. of Meetings
Attended
No. of Meetings
Held (1)
No. of Meetings
Attended
J M Schubert 3 3 - - 8 8
R J Norris 8 8 - - - -
J A Anderson 8 8 - - - -
R J Clairs 3 3 - - 8 7
C R Galbraith 3 3 9 9 - -
J S Hemstritch 8 8 - - 8 8
S C H Kay 3 3 9 9 8 8
A M Mohl 3 3 - - 8 8
F D Ryan 8 8 9 9 - -
D J Turner 8 8 9 8 - -
H H Young 8 8 9 9 - -
Board Performance & Renewal
Committee
Director No. of Meetings
Held (1)
No. of Meetings
Attended
J M Schubert 6 6
C R Galbraith 6 6
D J Turner 6 6
(1) The number of meetings held during the time the Director was a member of the relevant committee.
Directors’ Report
Consolidated Profit
Consolidated net profit after income tax and minority interests for
the financial year ended 30 June 2009 was $4,723 million (2008:
$4,791 million).
The net operating profit for the year ended 30 June 2009 after
tax and minority interests and before the gain on acquisition of
controlled entities, Bankwest integration expenses, merger
related amortisation, the gain on Visa Initial Public Offering,
provisions for investment and restructuring, defined benefit
superannuation plan expense, treasury shares valuation
adjustment, hedging and AIFRS volatility and other one off
expenses was $4,415 million. This is a decrease of $318 million
or 7% over the year ended 30 June 2008. The results include
the contribution of Bankwest and St Andrew‟s since the date of
acquisition.
The result for the year has been impacted by a substantial
increase in loan impairment expense.
Despite the challenging market environment the Group‟s
operating performance has been solid. Operating income growth
was strong, reflecting solid volume growth, improved margins
and higher trading income.
Operating expense growth reflects the effect of inflation on
salary and general expenses as well as higher occupancy and
volume expenses.
There have been no significant changes in the nature of the
principal activities of the Group during the financial year.
Dividends
The Directors have declared a fully franked (at 30%) final
dividend of 115 cents per share amounting to $1,747 million.
The dividend will be payable on 1 October 2009 to shareholders
on the register at 5pm on 21 August 2009. Dividends paid in the
year to 30 June 2009 were as follows:
As declared in the 30 June 2008 Annual Report, a fully
franked final dividend of 153 cents per share amounting to
$2,029 million was paid on 1 October 2008. The payment
comprised cash disbursements of $1,335 million with $694
million being reinvested by participants through the
Dividend Reinvestment Plan (DRP); and
In respect of the year to 30 June 2009, a fully franked
interim dividend of 113 cents per share amounting to
$1,662 million was paid on 23 March 2009. The payment
comprised direct cash disbursements of $1,257 million,
with $405 million being reinvested by participants through
the DRP.
Review of Operations
An analysis of operations for the financial year is set out in the
Highlights section in pages 8 to 12 and in the sections for Retail
Banking Services, Business and Private Banking, Institutional
Banking and Markets, Wealth Management, International
Financial Services, Bankwest and Other on pages 26 to 49.
Changes in State of Affairs
During the year, the Group continued to make significant
progress in implementing a number of initiatives designed to
ensure a better service outcome for the Group‟s customers.
Highlights included:
Restructure of the Premium Business Services division into
Business & Private Banking and Institutional Banking &
Markets enabling the Group to further improve its focus on
supporting and servicing these diverse customer
segments;
Free access to over 4,000 CBA and Bankwest ATMs for
Group customers;
A home loan “repayment holiday” of up to 12 months for
customers who lose their jobs due to the current economic
downturn and assistance packages for victims of Victorian
bushfires and New South Wales and Queensland floods;
Continued investment in Local Business Banking including
a personalised 24 hour, 7 days a week support centre and
continued roll-out of Business Bankers in branches; and
On 19 December 2008, the Group acquired 100% of the
share capital of Bank of Western Australia Ltd (consisting
of retail and business banking), St Andrew's Australia Pty
Ltd (consisting of insurance and wealth management
services businesses) and HBOSA Group (Services) Pty Ltd
(an internal administrative support entity) for cash
consideration (including transaction costs) of $2.2 billion.
There were no other significant changes in the state of affairs of
the Group during the financial year.
Events Subsequent to Balance Date
On 6 August 2009 the Group issued a 10 year EUR 1,000
million Subordinated Note with a coupon of 5.500% as part of its
ongoing funding activities.
On 6 August 2009 the Group announced that effective from
February 2010 the current Chairman, John Schubert, will step
down and be succeeded by David Turner.
On 12 August 2009 the Group announced the issue of a new
security Perpetual Exchangeable Resalable Listed Securities
(PERLS V). PERLS V will have similar terms to the Group‟s
existing non-innovative Tier 1 securities, PERLS IV. It is
anticipated that the Group will raise at least $700 million from the
issue and that the offering will strengthen the Group‟s Tier 1 ratio
by at least 24 basis points.
The PERLS II securities ($750 million), which were redeemed in
March 2009, were funded from the proceeds of the December
2008 share placement.
The Directors are not aware of any matter or circumstance that
has occurred since the end of the financial year that has
significantly affected or may significantly affect the operations of
the Group, the results of those operations or the state of affairs
of the Group in subsequent financial years.
The Bank expects to issue around $507 million of shares in
respect of the Dividend Reinvestment Plan for the final dividend
for the year ended 30 June 2009.
Business Strategies and Future Developments
Acquisition of Bank of Western Australia Ltd and St
Andrew’s Australia Pty Ltd
On 19 December 2008 the Group acquired the businesses of
Bank of Western Australia Ltd (“Bankwest”) and St. Andrew‟s
Australia Pty Ltd (“St Andrews”) from the former parent HBOS
Australia. The acquisition has seen the Group expand its
customer base and market share in Western Australia, and
broaden the range of products available to customers around
Australia. The integration of these two entities is ongoing, and
due for completion within three years of the acquisition date.
Accommodation Strategy
The Group is implementing a property strategy to relocate
approximately 3,500 staff from the Sydney Central Business
District (CBD) to Sydney Olympic Park or Parramatta by 30
June 2010. This will result in rationalisation of the existing
Sydney CBD property space.
As part of the Group‟s accommodation strategy, staff in the CBD
are being located across fewer sites, including rationalisation of
certain CBD sites in line with lease expiry profiles.

Directors’ Report
8 Commonwealth Bank of Australia Financial Report (U.S. Version) 2009
These changes have not had a material financial impact on the
Group‟s results and it is not anticipated that the future relocation
will have a material impact on the Group‟s results.
Environmental Reporting
The Group is subject to The Energy Efficiency Opportunities Act
2006 (EEO Act) which encourages large energy-using
businesses to improve their energy efficiency.
The Group, including several Colonial First State managed
funds, is required to comply with the EEO Act due to exceeding
certain energy consumption thresholds.
As required by the EEO Act, the Group lodged a five year
energy efficiency assessment plan and reported to Federal
Government on 31 December 2008. The Group is subsequently
required to report to the Federal Government every three years
and to release a public report annually, covering all preceding
years‟ assessment outcomes.
The Group is also subject to the National Greenhouse and
Energy Reporting Scheme (NGERS). The Scheme makes it
mandatory for controlling corporations to report annually on
greenhouse gas emissions, energy production and energy
consumption, if these exceed certain threshold levels. As a
result of a long history of voluntary reporting, the Group is well
placed to meet the NGERS‟ mandatory requirements, and has
recently updated its data capture and reporting systems to
comply with the new legislation.
The Group is not subject to any other particular or significant
environmental regulation under any law of the Commonwealth
or of a State or Territory, but can incur environmental liabilities
as a lender. The Group has developed policies to ensure this is
managed appropriately.
Directors’ Shareholdings and options
Particulars of shares held by Directors in the Commonwealth
Bank or in a related body corporate are set out in the
Remuneration Report within this report.
An Executive Option Plan (“EOP”) was approved by
shareholders at the Annual General Meeting on 8 October 1996
and its continuation was further approved by shareholders at the
Annual General Meeting on 29 October 1998. At the 2000
Annual General Meeting, the EOP was discontinued and
shareholders approved the establishment of the Equity Reward
Plan (“ERP”).
The last grant of options to be made under the ERP was the
2001 grant, with options being granted on 31 October 2001, 31
January 2002 and 15 April 2002.
A total of 3,007,000 options were granted by the Bank to 81
executives in the 2001 grant.
All option grants have now met their specified performance
hurdles and are available for exercise by participants.
During the financial year and for the period to the date of this
report 30,000 shares were allotted by the Bank consequent to
the exercise of options granted under the EOP and ERP. Full
details of the Plan are disclosed in Note 32 to the Financial
Statements. No options have been allocated since the beginning
of the 2002 financial year.
The names of persons who currently hold options in the Plan are
entered in the register of option holders kept by the Bank
pursuant to Section 170 of the Corporations Act 2001. The
register may be inspected free of charge.
No options have previously been granted to the Chief Executive
Officer. Refer to the Remuneration Report within this report for
further details.
Directors’ Interests in Contracts
A number of Directors have given written notices, stating that
they hold office in specified companies and accordingly are to be
regarded as having an interest in any contract or proposed
contract that may be made between the Bank and any of those
companies.
Directors’ and Officers’ Indemnity
Articles 19.1, 19.2 and 19.3 of the Commonwealth Bank of
Australia‟s Constitution provides:
“19. Indemnity
19.1 Persons to whom articles 19.2 and 19.4 apply
Articles 19.2 and 19.4 apply:
(a) to each person who is or has been a Director, secretary or
senior manager of the Company; and
(b) to such other officers, employees, former officers or former
employees of the Company or of its related bodies corporate as
the directors in each case determine,
(each an “Officer” for the purposes of this article).
19.2 Indemnity
The Company must indemnify each Officer on a full indemnity
basis and to the full extent permitted by law against all losses,
liabilities, costs, charges and expenses (“Liabilities”) incurred by
the Officer as an officer of the Company or of a related body
corporate.
19.3 Extent of indemnity
The indemnity in article 19.2:
(a) is enforceable without the Officer having to first incur any
expense or make any payment;
(b) is a continuing obligation and is enforceable by the Officer
even though the Officer may have ceased to be an officer of the
Company or its related bodies corporate; and
(c) applies to Liabilities incurred both before and after the
adoption of this constitution.”
An indemnity for employees, who are not Directors, secretaries
or senior managers, is not expressly restricted in any way by the
Corporations Act 2001.
The Directors, as named on pages 59 and 60 of this report, and
the Secretaries of the Commonwealth Bank of Australia, being J
D Hatton, and C F Collingwood are indemnified under articles
19.1, 19.2 and 19.3 as are all the senior managers of the
Commonwealth Bank of Australia.
Deeds of indemnity have been executed by the Commonwealth
Bank of Australia consistent with the above articles in favour of
each Director.
A deed poll has been executed by the Commonwealth Bank of
Australia consistent with the above articles in favour of each
secretary and senior manager of the Bank, each Director,
secretary and senior manager of a related body corporate of the
Bank (except where in the case of a partly owned subsidiary the
person is a nominee of an entity which is not a related body
corporate of the Bank unless the Bank's Chief Executive Officer
has certified that the indemnity shall apply to that person), and
any employee of the Bank or any related body corporate of the
Bank who acts as a Director or secretary of a body corporate
which is not a related body corporate of the Bank.

Directors’ Report
Directors’ and Officers’ Insurance
The Commonwealth Bank has, during the financial year, paid an
insurance premium in respect of an insurance policy for the
benefit of those named and referred to above and the Directors,
secretaries, executive officers and employees of any related
bodies corporate as defined in the insurance policy. The
insurance grants indemnity against liabilities permitted to be
indemnified by the Company under Section 199B of the
Corporations Act 2001. In accordance with commercial practice,
the insurance policy prohibits disclosure of the terms of the
policy including the nature of the liability insured against and the
amount of the premium.

Directors’ Report - Remuneration Report
10 Commonwealth Bank of Australia Financial Report (U.S. Version) 2009
Remuneration Report
Key Terms 11
Introduction 12
Remuneration Philosophy 12
Executive Remuneration Guiding Principles 12
Remuneration Governance 12
Revised Remuneration Initiatives from 1 July 2009 13
Remuneration for the Year Ended 30 June 2009 15
Remuneration Mix 15
Fixed Remuneration 15
Short Term Incentive (STI) 15
Summary of Group Performance for the Year Ended 30 June 2009 16
Long Term Incentive (LTI) 17
LTI Vested in the Year Ended 30 June 2009 17
Group Leadership Share Plan (GLSP) 17
Equity Reward Plan (ERP) 18
Other LTI Style Arrangements 19
Group Long Term Performance 19
Directors’ Remuneration 20
Managing Director and CEO 20
Non-Executive Directors 20
Remuneration of Key Management Personnel and Other Executives 22
Remuneration of Directors 23
Remuneration of Executives 24
STI Allocations to Executives for the Year Ended 30 June 2009 25
LTI Allocations to Executives for the Year Ended 30 June 2009 26
Termination Arrangements of Key Management Personnel and Other Executives 26
Equity Holdings of Key Management Personnel and Other Executives 27
Shareholdings 27
Share Trading Policy 27
Shares Held by Directors 27
Shares Held by Executives 28
Total Loans to Key Management Personnel and Other Executives 29
Individual Loans above $100,000 to Key Management Personnel and Other Executives 29
Terms and Conditions of Loans 30
Other Transactions of Key Management Personnel and Other Executives and Related Parties 30
Audit 30

Directors’ Report - Remuneration Report
Commonwealth Bank of Australia Financial Report (U.S. Version) 2009 11
Key Terms
To assist readers a number of key terms and abbreviations used in the Remuneration Report are set out below:
Term Definition
Base Remuneration Cash and non-cash remuneration paid regularly with no performance conditions. Calculated on a total cost
basis and includes any Fringe Benefits tax related to Salary Packaging.
Board The Board of Directors of the Bank.
Committee The People & Remuneration Committee of the Board.
Earnings Per Share (EPS) Net profit after tax divided by the weighted average number of ordinary shares outstanding during the year.
Equity Reward (Performance
Units) Plan (ERPUP)
The Group‟s previous cash-based Equity Reward Plan (see below) replicator scheme where grants are
delivered in the form of Performance Units.
Equity Reward Plan (ERP) The Group's previous long term incentive plan.
Executive Committee A management committee comprising the Chief Executive Officer (CEO), Group Executives and any other
executives selected by the CEO.
Fixed Remuneration Consists of Base Remuneration plus employer contributions to superannuation. For further details refer to
page 15.
Group Commonwealth Bank of Australia and its subsidiaries.
Group Executive Key Management Personnel who are also members of the Group‟s Executive Committee.
Group Leadership Reward Plan
(GLRP)
The Group‟s new long term incentive plan from 1 July 2009 for the CEO and Group Executives. For further
details please refer to page 13.
Group Leadership Share Plan
(GLSP)
The Group's long term incentive plan from for the 2008 and 2009 financial years for the CEO and Group
Executives. For further details please refer to page 17.
Key Management Personnel
(KMP)
Persons having authority and responsibility for planning, directing and controlling the activities of an entity,
directly or indirectly, including any Director (whether executive or otherwise) of that entity.
Long Term Incentive (LTI) A remuneration arrangement which grants benefits to participating executives that may vest if, and to the
extent that, performance hurdles are met over a three year or more period. For further details please refer
to page 17.
The Group‟s long term incentive plans include the GLSP, ERP, ERPUP and the new GLRP.
NPAT Net profit after tax.
Options Rights to acquire a Bank share on payment of an exercise price if relevant performance hurdles are met.
Other Executives Those executives who are not Key Management Personnel but are amongst the “Company Executives” or
“Group Executives” as defined by the Corporations Act 2001 and for whom disclosure is required in
accordance with section 300A(1)(c) of the Corporations Act 2001.
Performance Rights Rights to acquire a Bank share with no payment by the recipient if relevant performance hurdles are met.
PACC Profit after capital charge.
Remuneration All forms of consideration paid, payable or provided by the Group, or on behalf of the Group, in exchange
for services rendered to the Group. In reading this report, the term “remuneration” means the same as the
term “compensation” for the purposes of the Corporations Act 2001 and the accounting standard
AASB124.
Remuneration Mix The weighting of each component of remuneration (Fixed Remuneration, STI and LTI) for each employee
group.
Reward Shares Shares in the Bank granted under the ERP or the GLSP and subject to performance hurdles.
Salary Packaging An arrangement where an employee agrees to forego part of his or her cash component of Base
Remuneration in return for non-cash benefits of a similar value.
Short Term Incentive (STI) Remuneration paid with direct reference to the Group‟s and the individual‟s performance over one financial
year. For further details please refer to page 17.
Total Remuneration The total combination of fixed and at risk remuneration components received by an employee.
Total Shareholder Return (TSR) Calculated by combining the reinvestment of dividends and the movement in the Bank‟s share price, the
performance hurdle used to determine vesting of grants made under the ERP, ERPUP and GLSP.

Directors’ Report - Remuneration Report
12 Commonwealth Bank of Australia Financial Report (U.S. Version) 2009
Introduction
This remuneration report sets out the Group‟s remuneration
framework for Key Management Personnel and Other
Executives. It demonstrates the links between the performance
of the Group and individual‟s remuneration. It discloses
remuneration arrangements, equity holdings, loans and other
transactions.
In this Report, in addition to the required disclosures, included is
additional background to the Group‟s remuneration framework.
The Group is aware of shareholder and community concerns
about remuneration practices within the financial services sector,
especially during these uncertain economic times. Whilst these
concerns have not been specifically directed at the Group, they
are taken into account in the Group‟s remuneration framework.
The Group has strengthened the focus on ensuring
remuneration arrangements continue to support the delivery of
the Group‟s strategy and help enable the delivery of sustainable
value for shareholders.
Remuneration Philosophy
The Group‟s remuneration philosophy for all Key Management
Personnel, Other Executives, and employees generally are:
To motivate employees to work as a team to produce
superior sustainable performance achieving the Group‟s
vision;
To be transparent and simple to understand, administer
and communicate; and
To be market-competitive.
Executive Remuneration Guiding Principles
The Board‟s approach to executive remuneration is underpinned
by the following principles:
1. The CEO and Group Executives are rewarded with an
appropriate mix of remuneration elements which are both
fixed and “at risk” – referred to as “Total Remuneration”.
The amount of Total Remuneration is “market competitive”
- predominately, measured against major banking peers,
and is set in such a way that it does not put upward
pressure on the market. The proportion of remuneration at
risk will typically be greater at higher levels of Total
Remuneration.
2. At risk remuneration will include a combination of short and
long term elements. Short term elements will be aligned to
the long term interests of the company and the amount is
subject to a cap.
At risk remuneration will be based on a clear definition of
sustainable performance that:
Reflects the Group‟s strategic priorities;
Is based on both financial and non-financial
measures;
Does not reward excessive risk taking; and
Is based on performance measures set at the start of
the performance period.
3. Termination arrangements included in CEO and Group
Executive contracts are disclosed. For all new contracts,
notice periods will be 12 months or less. Unsatisfactory
performance is managed appropriately and is not rewarded
with generous severance payments.
4. Where the Board deems it appropriate, pro-rata incentives
may be paid to terminating Group Executives and the
CEO, reflecting the portion of the measurement period that
the Group Executive or CEO was employed with the
Group. Where the payment of a previously awarded
incentive has been deferred and still subject to
performance criteria which extend beyond the date of
termination, then the deferred incentive will be forfeited if
the performance criteria are not ultimately satisfied.
5. In recognition that the business environment changes over
time and it is not always possible to anticipate these
changes, the Board will continue to retain discretion to
adjust remuneration outcomes to ensure consistency with
the Group‟s Remuneration Philosophy. This discretion may
be applied to either increase or decrease remuneration
outcomes and will only be used when, without the
application of this judgement, an inappropriate reward
outcome would occur. Where this discretion is used, it is
explained in the Remuneration Report.
6. Remuneration philosophy and practice will meet best
practice governance and regulatory guidelines, align with
the Group‟s strategy, and be mindful of the interests of the
Group‟s stakeholders including shareholders, employees,
customers and the community. Communication to
stakeholders and participants will be clear and easy to
understand.
Remuneration Governance
The People & Remuneration Committee of the Board (the
Committee) consists entirely of independent Non-Executive
Directors and oversees all CEO and Group Executive
remuneration arrangements. The Committee operates in line
with the following remuneration governance principles:
1. The Board determines the contract and remuneration of
the CEO. Independent advice is obtained on the
remuneration and contract terms of the CEO.
2. The Committee consists of members with diverse skills
and experience that remain appropriate in a dynamic
industry, including risk management. The Committee has
access to independent advice as appropriate to its
decision-making.
3. The Committee determines the contract and remuneration
of the Heads of Business/Service units. If any employee
within a business unit has the potential to earn more than
the head of that unit, the potential and actual remuneration
outcomes will be reviewed by the Committee; and
4. Remuneration policies and decisions impacting on the
CEO, Group Executives and others required by law to be
disclosed will be clearly presented in the Remuneration
Report and, subject to continuous disclosure obligations.
The Board will engage with major shareholders and other
relevant stakeholders about the Group‟s remuneration
philosophy and design.
The Committee currently consists of:
R J Clairs (Chairman);
J S Hemstritch;
S C H Kay;
A Mohl; and
J M Schubert.
The Committee‟s activities are governed by its terms of
reference, which are available on the Group‟s website at
www.commbank.com.au/shareholder.

Directors’ Report - Remuneration Report
Commonwealth Bank of Australia Financial Report (U.S. Version) 2009 13
Revised Remuneration Initiatives from 1 July
2009
The Group constantly reviews the remuneration arrangements
to ensure they continue to aid the delivery of the Group‟s
strategic objectives, reflect the changing operating environment
and are in line with emerging regulatory guidelines. Following
the most recent review, the Board has approved some changes
to the remuneration arrangements for Key Management
Personnel. In particular, the Group has reviewed the
arrangements to ensure alignment with the Australian Prudential
Regulation Authority‟s (APRA) guidelines.
Effective from 1 July 2009, the Group is implementing the
following:
1. Director‟s fees and the CEO‟s Fixed Remuneration have
been reduced by 10% and Group Executive Fixed
Remuneration reduced by 5%. As the target short term
incentive (STI) and long term incentive (LTI) amounts are
based on Fixed Remuneration, they are also effectively
reduced;
2. Termination payments for all new contracts will be capped
at twelve months or less; and
3. An enhanced remuneration structure for the CEO and
Group Executives (as detailed below).
Enhanced Remuneration Structure effective from 1 July
2009 for CEO and Group Executives
Remuneration Mix
From 1 July 2009 the target remuneration mix will reflect a
higher relative proportion of the LTI to encourage long term
shareholder value creation into the future.
41%
39%
41%
39%
18%
22%
Group Executives
CEO
Previous On Target Remuneration Mix
Fixed STI LTI
33.3% 33.3% 33.4%All
Executives
New On Target Remuneration Mix
Fixed STI LTI
Previously the Group communicated remuneration on a
maximum potential basis. Under the new structure remuneration
is expressed in terms of reward for on-target performance.
STI Enhancements
The maximum STI opportunity has been reduced from 200% of
fixed remuneration to a target of 100%, with a maximum of
125%.
Potential STI payment levels have been reduced with 50% of
STI payment deferred into shares for one year. The proportion
deferred has increased and the vesting period has decreased, in
recognition of the increased relative size of the LTI.
A strengthened scorecard approach will be implemented with
financial and non-financial measures, including specific risk-
related KPIs. Cash net profit after tax and profit after capital
charge (PACC) measures will continue to generate the total
value of STI that may be awarded in any financial year.
LTI Enhancements
The LTI proportion of total remuneration will be increased to
encourage long term shareholder value creation. The vesting
period will be extended from three to four years and separate
performance measures of customer satisfaction and relative
Total Shareholder Return (TSR) will apply.
The following diagram highlights the main features of the
proposed LTI, the Group Leadership Reward Plan (GLRP):
Reward shares granted at
beginning of 4 year
performance period equal in
value to fixed remuneration
Perfo
rman
ce C
on
ditio
ns
50% measured
against strategic
measure,
currently
customer
satisfaction
ranking within
peer group of
ANZ, NAB, St
George, Westpac
50% measured
against TSR
performance
relative to the 20
largest ASX
listed companies
(exc. materials
and energy
companies and
CBA)
Reward shares converted to
shares at end of 4 year
period

Directors’ Report - Remuneration Report
14 Commonwealth Bank of Australia Financial Report (U.S. Version) 2009
The Board will continue to exercise discretion when determining
incentive payments, taking account of the Group‟s strategic
initiatives and the changing operating environment to ensure the
rewards reflect the CEO and Group Executives‟ contribution to
the outcome. The Board‟s decisions in this regard will be fully
disclosed in the annual Remuneration Report.
Performance Measures
Inclusion of a relative TSR measure aims to provide more direct
alignment with shareholder outcomes, as it provides a direct
comparison of relative performance and ensures the Group is
rewarding for returns that are at or above the median of other
similar sized organisations. This may not be the case with an
absolute TSR hurdle.
The ASX20 index (excluding materials and energy companies
and CBA) was chosen as the peer group as it includes the
majority of the Group‟s financial services peers. This peer group
is therefore considered to be an appropriate pool of companies
to provide a benchmark of the Group‟s performance.
Retention of the customer satisfaction measure ensures a key
platform of the Group‟s organisational strategy is included.
Transitional LTI Arrangements
In consideration that the new LTI plan has a four year
performance period and the current LTI has a three year period,
a one-off transitional LTI grant will be made in the 2010 financial
year under the new LTI arrangements. The transitional grant will
be in addition to the 2010 LTI grant and will be pro rated to
reflect a three year vesting period. The same performance
conditions as described above will apply to the transitional grant.
Vesting Scales
As illustrated above, there are two performance measures that will combine to determine the number of reward shares that vest at the
end of the four year performance period. The reward shares will be divided into two equal components, with the Group‟s customer
satisfaction ranking determining the level of vesting for one component and the Group‟s relative TSR performance compared to the 20
largest ASX listed companies by market capitalisation (excluding materials and energy companies and CBA) determining the level of
vesting for the other component. The peer group is determined at commencement of the performance period. The vesting scale for each
performance measure is detailed below.
Relative TSR Customer Satisfaction Ranking
Percentile Rank Percentage to Vest Ranking Percentage to Vest
50th – 75
th 50% – 100% 1 100%
<50th Nil 2 75%
3 50%
4 Nil

Directors’ Report - Remuneration Report
Commonwealth Bank of Australia Financial Report (U.S. Version) 2009 15
Remuneration for the Year Ended 30 June 2009
Remuneration Mix
For the year ended 30 June 2009, the Group provided
remuneration for its employees in the form of fixed, STI and LTI
components.
The weighting of each of these components differs for each
employee, depending on their role and seniority within the
Group.
There is greater weighting on the variable components for more
senior employees and employees below Group Executive level
generally do not receive an LTI component.
For the financial year ended 30 June 2009, the potential
remuneration mixes that generally applied for individuals in
each of the following executive groups based on the maximum
reward opportunity were:
Potential Remuneration Mix Fixed STI Deferred STI LTI
CEO 27% 37% 18% 18%
Group Executives 30% 40% 20% 10%
Executive General Managers 40% 40% 20%
General Managers 50% 33% 17%
* Percentages may alter from year to year due to changing LTI fair values
Fixed Remuneration
Fixed Remuneration comprises base remuneration, calculated
on a total cost basis including the cost of salary packaging and
employer contributions to superannuation (note that salary
packaging arrangements are available to employees on
individual contracts and to a limited extent to some other
employees).
Fixed Remuneration is generally set at the market median,
facilitated by regular independent benchmarking analysis and
advice.
Short Term Incentive (STI)
All permanent employees participate in some form of STI
arrangement. Individual STI potentials are set at the beginning of
the financial year.
The funding calculation of these rewards is based on the
Group‟s profitability – performance against target net profit after
tax and performance against the risk adjusted measure, Profit
After Capital Charge (PACC). This combination of measures
aims to balance short term performance with longer term
shareholder value creation.
Individual performance for the CEO, Group Executives and the
next two levels of management is assessed through the Group‟s
performance management system by measuring actual results
of key performance indicators (KPIs) against operating targets
and behavioural standards with reference to their area of
responsibility. Examples of KPIs can include measures such as
safety, profitability, market share, balance growth, costs,
margins, customer satisfaction, employee engagement,
succession planning and strategic priorities.
These priorities and the Group‟s performance against them for
the year ending 30 June 2009 are detailed on page 16.
The performance of the CEO and Group Executives for the
year ended 30 June 2009 was measured against:
Safety and people development measures;
Business and financial results, with reference to market
growth, competitor performance and market shares across
business lines;
Customer satisfaction levels, as measured by external
providers; and
Outcomes connected to other strategic priorities - Customer
Service, Business Banking, Technology & Operational
Excellence, Trust & Team Spirit and Profitable Growth.
The targets within the Group‟s performance management
framework allow for three levels of stretch targets on each KPI.
This means that the ability of the participant to access the STI
potential will only occur where there have been outstanding
levels of performance. Employees must achieve a minimum of
“Meets Expectations” on the behaviours and compliance KPIs
to trigger any STI payment.
One third of any STI awarded to the CEO, Group Executives,
and the next two levels of management is deferred into the
Bank‟s shares for three years. This longer term holding of CBA
shares helps to align the interests of these executives with
those of shareholders. Shares will be held in trust for three
years. After the three year vesting period, the executive will
receive the shares and any dividends accrued over that time.
These shares are forfeited if the executive resigns or is
dismissed before the shares are due to vest. In cases of
retrenchment or retirement, the shares vest early.

Directors’ Report - Remuneration Report
16 Commonwealth Bank of Australia Financial Report (U.S. Version) 2009
Summary of Group Performance for the Year Ended 30 June 2009
The following table gives an overview of the Group‟s
performance for the year ended 30 June 2009, in the context of
its strategic priorities. Continuing solid results, driven by
progress made on strategic priorities, has been reflected in STI
payments made to these executives.
Details of the STI outcomes based on business performance
are provided on page 25 of this remuneration report.
Strategic Priorities Commentary
Customer Service The Group's vision is "to be Australia's finest financial services organisation through excelling in customer
service" and significant progress continues to be made on this strategic priority. The Group continues to
invest in the front line so they are more accessible to customers, refine the product offering and introduce
new and improved products, refurbish and open new branches and simplify procedures to improve
responsiveness.
The continued commitment to this strategic priority has seen customer satisfaction levels, as measured
by Roy Morgan (1)
, improve over the year with the gap to the top rated peer closing from 7.8% to 3.1%.
FirstChoice was rated Best Master Trust/Wrap Provider in the 2009 Wealth Insights Service Level Survey
while Business and Private Banking was rated in the TNS (2)
survey as the most improved business bank
over the past 12 months.
Business Banking In January 2009 the Group announced the restructure of its Premium Business Services division into
Business & Private Banking and Institutional Banking & Markets. Separating these businesses will enable
the Group to further improve the focus on servicing and supporting these diverse customer segments.
During the year progress was made in improving the Group‟s competitive position in Business Banking
including the launch of the Small Business Investment Package which is a dedicated financial support
service to help small business and agribusiness customers during the challenging economic conditions.
In addition new products were developed including eVolve which provides customers with e-commerce
functionality. Institutional Banking and Markets expanded global distribution capabilities to position the
Group as the leader in the Australian market of fixed income markets, grow foreign exchange capacity
and institutional equities to meet the needs of clients.
Technology & Operational
Excellence Initiatives in this area are designed to deliver greater efficiency across the Group as well as providing
competitive leverage through innovative process and systems. The Group‟s Core Banking Modernisation
program is central to this and is progressing well. Three new customer offers have been delivered in the
form of a First Home Saver Account, a new term deposit account through Colonial and a new real-time
online savings product being trialled. Systems integration has been enhanced and a new technology
infrastructure has been introduced to support the future banking platform. This project is designed to
drive improvements in customer service and productivity, further IT efficiency savings and additional
systems stability and resilience.
Trust & Team Spirit The Group‟s people remain the single most important resource and they have continued to deliver
outstanding results under difficult conditions. Key metrics such as employee turnover and absenteeism
have continued to improve as has the Group‟s safety record with Lost Time Injury Frequency Rate falling
yet again. The Group has recorded continued improvement in the people engagement survey and is
ranked in the 80th percentile worldwide (Source: Gallup).
Profitable Growth The Group continues to pursue a disciplined Profitable Growth strategy, with focus on targeted
investment and acquisition opportunities which are “on strategy” and which offer value and longer term
benefit to shareholders. During the year the Group acquired Bankwest, leveraging the Group‟s financial
strength to take advantage of a unique opportunity to expand its presence in Western Australia. The
Group also secured a strategic stake in Australia‟s leading home loan mortgage broker – Aussie Home
Loans. The Group was subsequently in a position to support Aussie‟s acquisition of Wizard in conjunction
with acquiring a portfolio of around $2.25 billion of seasoned prime residential mortgages originated by
Wizard. In December 2008, the Group elected to increase its shareholding in the Qilu Bank (formerly
Jinan City Commercial Bank), from the existing 11% to 20%. (1) Source: Roy Morgan Research MFI Customer Satisfaction is based on Australians aged 14+, Very or Fairly Satisfied, a 6 month moving average.
(2) Source: TNS Business Finance Monitor, measuring businesses with annual turnover to $100 million (excluding agribusiness).

Directors’ Report - Remuneration Report
Commonwealth Bank of Australia Financial Report (U.S. Version) 2009 17
Long Term Incentive (LTI)
The Group‟s LTI arrangements for grants made during the year
ended 30 June 2009 are known as the Group Leadership Share
Plan (“GLSP”). New grants under the Group‟s previous LTI plan,
the Equity Reward Plan (“ERP”), have ceased.
The following table provides a summary of the LTI grants that
were in operation during the year ended 30 June 2009.
Year of Grant Performance Period Retesting
Expiry date
if unvested
Status
as at 30 June 2009
Current LTI - GLSP
2007 July 2007 to July 2010 None 1 July 2010 Unvested
2008 July 2008 to July 2011 None 1 July 2011 Unvested
Previous LTI - ERP
2005 July 2005 to July 2008 Every 6 months to July 2010 15 July 2010 100% vested
2006 July 2006 to July 2009 Once only in July 2010 14 July 2010 70th percentile*
*The 2006 grant vested at 100% on 14 July 2009
LTI Vested in the Year Ended 30 June 2009
The long term incentive that was granted under the Equity
Reward Plan (ERP) in 2005 fully vested in July 2008, reflecting
total shareholder returns from 14 July 2005 to 14 July 2008 that
were above the 75th percentile of returns of companies within the
peer group. The ability to retest was not utilised as the grant fully
vested at the first measurement date.
Group Leadership Share Plan (GLSP)
The GLSP is directly linked to the Group‟s strategy to become
number one in customer satisfaction. If this goal is reached and
profit increases more than the average of the peer banks, the
CEO and Group Executives (the participants) will be rewarded
with a grant of Bank shares. If this goal is not met but the Group
has improved its position over the vesting period, a lesser
number of shares will be awarded. The risk adjusted
performance measure, PACC, determines the value of the pool
available to be awarded as shares at the end of the
performance period.
Participation in the plan is currently limited to the CEO and
other Executive Committee members. The following diagram
illustrates the main features of the GLSP and how each grant
operates:
GLSP rights
granted to
participants
Start of 3 year
performance period
Pool determined
based on percentage
of growth in the
Group‟s Profit After
Capital Charge
(PACC), capped and
subject to
performance against
the 2 hurdles:
Not
met Nothing vests
The Group‟s customer
satisfaction ranking
against the peer group is
determined
A proportion of the pool
value may vest and rights
are immediately exercised
into shares
Met
The Group‟s cash NPAT
growth over the 3 year
period must be above
the average of NPAT
growth of the peer group
End of 3 year performance period

Directors’ Report - Remuneration Report
18 Commonwealth Bank of Australia Financial Report (U.S. Version) 2009
Performance Conditions
The cash NPAT performance relative to peers and growth in
PACC are incorporated in the GLSP to ensure the Group
continues to provide above average long term financial
performance for all stakeholders.
Customer satisfaction is of the highest importance to the
Group‟s overall performance, forming the basis of its vision.
Research has also shown a direct correlation between high
levels of customer satisfaction and high shareholder returns.
These performance measures place the Group‟s profitability and
customer service uppermost, and reward participants for driving
long term shareholder value. The criteria are based on results
which participants can directly influence and which are publicly
available.
Three well established independent external surveys are used to
determine the Group‟s customer satisfaction performance at the
end of the three year performance period. These surveys have
been chosen as they measure customer satisfaction across the
operations of the Group as follows:
Roy Morgan, which measures customer satisfaction across
the retail bank base, including CommInsure products sold
through retail bank sales channels;
TNS Business Finance Monitor, which measures business
banking customer satisfaction; and
Wealth Insights Service Level Survey Master Trust/WRAP,
which measures wealth management service performance of
master trusts/wraps in Australia.
The Group‟s level of achievement against the customer
satisfaction performance hurdle is determined by taking scores
for both the Group and the peer group from the three
independent external surveys and applying a ranking (detailed
below).
The Board may exercise discretion to ensure the rewards
resulting from the GLSP are reflective of the Group‟s
performance over the three year period.
The vesting scale used to measure achievement of the current
GLSP grants over the three year performance periods is as
follows:
2007 Grant 2008 Grant
Customer Satisfaction Group Ranking % of Pool to Invest
1 100 100
2 75 75
3 50 50
4 30 Nil
5 Nil Nil
Pool – PACC Growth 2. 2% 3. 5%
Pool Cap $34m $36. 1m Peer Group ANZ, NAB, St George, Westpac
Equity Reward Plan (ERP)
New grants under the Group‟s previous LTI plan, the ERP, have
ceased. Selected executives in General Manager roles and
above participated in this plan. The last grant from July 2006
fully vested on 14 July 2009, the first measurement date. Grants
were delivered in the form of ordinary shares in the Bank that
may vest in the executive in some proportion, to the extent that a
performance hurdle is met.
For a limited number of executives, a cash-based ERP replicator
plan was operated where grants were delivered in the form of
Performance Units. This was known as the Equity Reward
(Performance Unit) Plan (ERPUP).
In assessing whether the performance hurdles for each ERP or
ERPUP grant have been met, the Group received independent
data from Standard & Poor‟s which provides both the Bank‟s
TSR growth from the commencement of each grant and that of
the peer group (excluding CBA, as shown in the below table).
The Group‟s performance against the hurdle was then
determined by ranking each company in the peer group against
the Group in order of TSR growth from the commencement of
each grant.
A weighting for each company in the peer group was
determined by dividing the market capitalisation of the relevant
company by the total market capitalisation of the peer group.
The Group‟s percentile ranking is determined by aggregating
the calculated weighting of each company ranked below the
Bank.
Relative TSR was selected as the performance measure based
on its link to shareholder value. Grants under the ERP and
ERPUP were made annually and vesting is subject to the
Group‟s Total Shareholder Return (TSR) performance relative
to the other entities in the peer group over a three to four year
period as follows:
Year of Grant Vesting Scale Peer Group
2005 <50th percentile = Nil Shares
50th – 67th percentile = 50% - 75% of shares
68th – 75th percentile = 76% - 100% of shares
AMP Macquarie Bank
ANZ Group National Australia Bank
AXA QBE insurance
2006
<51st percentile = Nil Shares
51st – 75th percentile = 50% - 100% of shares
Bank of Queensland St George (2)
Bendigo Bank(1) Suncorp-Metway
IAG Westpac Banking Group
(1) Adelaide Bank was removed from the peer group when it was taken over by Bendigo Bank in November 2007.
(2) St George was acquired by Westpac on 18 November 2008. For the period from commencement of the vesting period up to the acquisition date St George‟s TSR
movement was used. From the date of the acquisition their TSR moved in line with the merged entity‟s TSR performance.

Directors’ Report - Remuneration Report
Commonwealth Bank of Australia Financial Report (U.S. Version) 2009 19
Other LTI Style Arrangements
Certain executives in Colonial First State Global Asset
Management (CFS GAM) participate in a specific cash-settled
LTI style arrangement relating to that business. The purpose of
this LTI style arrangement is the retention and motivation of key
employees with specific and unique skill sets highly valued in the
market. The decision of investors to grant an investment
mandate to CFS GAM is highly dependent on their confidence in
the investment capability and experience of individual fund
managers. As such, the loss of these individuals from CFS GAM
could put current and future mandates at risk.
During the 2009 financial year this LTI style arrangement was
allocated a five year vesting period, compared to a three year
vesting period for previous allocations. The vesting period was
increased as performance hurdles were removed to focus more
directly on the long term retention of key individuals in an
increasingly volatile market. There were also limits on how much
of the vested entitlement employees were eligible to redeem in
any one year.
A profit share arrangement also operates in the CFS GAM
business, Global Emerging Markets Asia Pacific (GEM AP) to
reward and retain key employees. Each year allocations are
made from a pool that reflects a percentage of profit generated
by this part of the CFS GAM business. Allocations to
participants are co-invested into GEM AP funds and allocations
may vest after either three or five years depending upon the
seniority of the individual.
Group Long Term Performance
The objective of LTI grants during the year ended 30 June 2009
is to improve shareholder return over the long term while
remunerating our CEO and Group Executives for their
performance in line with the Group‟s remuneration philosophy.
The following graphs show the Group‟s long term performance
measures and how they compare with changes in executive
remuneration over the last 5 years.
The Board retains discretion in determining actual remuneration
awarded to the CEO and Group Executives to ensure the value
received is reflective of the individual‟s performance in
achieving these results, as per our executive remuneration
guiding principles described on page 12.
0%
10%
20%
30%
40%
50%
60%
70%
Cu
mu
lati
ve C
han
ge
Cumulative Change in Senior Executive Remuneration compared to Changes in Group Performance
Cash NPAT Earnings Per Share Snr Exec Total Remuneration
June
2006
June
2007
June
2008
June
2009
June
2005
June
2004
0
10
20
30
40
50
60
70
0
50
100
150
200
250
300
Sh
are
Pri
ce
($
)
Div
iden
ds P
er
Sh
are
(cen
ts)
Group Performance Measures
Dividends Per Share Share Price
June
2005June
2006June
2007June
2008June
2009

Directors’ Report - Remuneration Report
20 Commonwealth Bank of Australia Financial Report (U.S. Version) 2009
Directors’ Remuneration
Ralph Norris (Managing Director and CEO)
Summary of Remuneration Arrangements
For the year ended 30 June 2009, Mr Norris‟ remuneration
consisted of fixed and variable (at risk) components.
Variable Remuneration
For the year ended 30 June 2009, an STI was delivered in two
components; 2/3 made as an immediate cash payment and 1/3
deferred into Bank shares for three years. Performance was
measured against Key Performance Indicators. The Board has
assessed Mr Norris‟ performance for the year and has approved
a total STI payment of $2.6 million or 42% of the 200% (of Fixed
Remuneration) available.
This assessment took into account the following factors:
Business and financial results;
The Group‟s customer service levels;
Technology and operational excellence;
The Group‟s core behaviours; and
Key profitable growth initiatives
The Board also took into consideration events that have had a
negative impact on the Group in finalising the CEO‟s STI award
for 2009.
Following shareholder approval at the 2008 Annual General
Meeting, an LTI was allocated in December 2008 in the form of
Performance Rights under the Group Leadership Share Plan
(GLSP). Vesting will occur subject to the satisfaction of the
performance conditions – the Group‟s relative NPAT and
customer satisfaction ranking against the peer group at the end
of the three year performance period (refer to the GLSP on page
17).
Terms and conditions of appointment
The Board determines Mr Norris‟ remuneration, pursuant to the
Constitution, as part of the terms and conditions of his
appointment. Those terms and conditions are established in a
contract of employment with Mr Norris which was effective from
22 September 2005. Remuneration is subject to review annually
by the Board. Mr Norris‟ remuneration arrangements are
detailed on page 23 and follow the executive remuneration
guiding principles described on page 12.
Mr Norris‟ contract provides for no end date, although he may
resign at any time by giving six months‟ notice. The Group may
terminate Mr Norris‟ employment, in cases other than
misconduct, on six months‟ notice. In this case, the Group will
pay all Fixed Remuneration relating to the notice period, and any
outstanding statutory entitlements. Any unvested STI or LTI
amounts will be payable at the discretion of the Board. There is
also a provision allowing Mr Norris to terminate the agreement if
a material change to his status occurs, and to receive benefits
as if the Group had terminated his employment.
On ceasing employment with the Group, Mr Norris is entitled to
receive his statutory entitlements of accrued annual and long
service leave as well as accrued superannuation benefits. This
arrangement is the same for all employees.
Non-Executive Directors
Remuneration Arrangements
Remuneration for Non-Executive Directors consists of base and
committee fees within a maximum of $4,000,000 per annum as
approved by shareholders at the Annual General Meeting
(AGM) held on 13 November 2008. The total remuneration for
Non-Executive Directors is less than that approval. No
component of Non-Executive Director remuneration is
contingent upon performance.
On appointment to the Board, Non-Executive Directors enter into
a service agreement with the Bank in the form of a letter of
appointment. The letter of appointment, a copy of which appears
on the Group's website, summarises the Board policies and
terms, including remuneration, relevant to the office of Director.
The policy of the Board is that the aggregate amount of fees
should be set at a level which provides the Group with the
necessary degree of flexibility to enable it to attract and retain
the services of Directors of the highest calibre.
The Board Performance and Renewal Committee annually
reviews the fees payable to individual Non-Executive Directors,
takes into account relevant factors and, where appropriate,
receives external advice on comparable remuneration. In April
2009 and in line with the salary reduction and constraints being
imposed on employees in the current economic climate, it was
agreed that the Directors‟ remuneration would be reduced by
10% with effect from 1 July 2009.
Non-Executive Directors have 20% of their annual fees applied
to the mandatory on-market acquisition of shares in the Bank,
under the Non-Executive Director Share Plan. In addition, Non-
Executive Directors can voluntarily elect to sacrifice up to a
further 80% of their fees for the acquisition of shares, or into
superannuation.
The Non-Executive Directors‟ fee structure provides for a base
fee for the Chairman and Directors. In addition, amounts are
payable where Directors are members of, or chair a Committee.
Details of the breakdown of each Non-Executive Directors' fees
as at 30 June 2009 and the new fee structure from 1 July 2009
is detailed on page 21. The Bank also contributes to compulsory
superannuation on behalf of Non-Executive Directors.
Total Potential Remuneration
Fixed
Remuneration At Risk – performance based
STI LTI
27% 55% 18%

Directors’ Report - Remuneration Report
Commonwealth Bank of Australia Financial Report (U.S. Version) 2009 21
Details of Components of Non-Executive Directors’ Fees
Committee Remuneration
Position
Fees for the year ended
30 June 2009 (1)
$
Fees from
1 July 2009 (1)
$
Board Chairman 695,000 625,500
Non-Executive Director 210,000 189,000
Audit Committee Chairman 50,000 45,000
Member 25,000 22,500
Risk Committee Chairman 50,000 45,000
Member 25,000 22,500
People & Remuneration Committee Chairman 40,000 36,000
Member 20,000 18,000
Board Performance & Renewal Committee Chairman 10,000 9,000
Member 10,000 9,000
(1) Non-Executive Directors sacrifice 20% of these fees on a mandatory basis under the Non-Executive Directors Share Plan (NEDSP).
Retirement Benefits
Under the Directors‟ Retirement Allowance Scheme, which was
approved by shareholders at the 1997 Annual General Meeting,
Directors previously accumulated a retirement benefit on a pro
rata basis to a maximum of four years total emoluments after 12
years service. No benefit accrued until the Director had served
three years on the Board.
In 2002, the Board decided to discontinue the Directors‟
Retirement Allowance Scheme without affecting the
entitlements of the existing Non-Executive Directors at the time.
Since that year, new Directors have not been entitled to
participate in the scheme.
The entitlements of the Non-Executive Directors under the Directors‟ Retirement Allowance Scheme are:
Directors’ Retirement Allowance Scheme
Director
Increase in Accrued Benefit
in Year $
Entitlement as at 30 June 2009
$
J M Schubert - 636,398
J A Anderson (1) - -
R J Clairs - 202,989
C R Galbraith - 159,092
J S Hemstritch (1) - -
S C H Kay (1) - -
A M Mohl (1) - -
F D Ryan - 168,263
D J Turner (1) - -
H H Young (1) - -
Total - 1,166,742
(1) Sir John Anderson, Ms Hemstritch, Ms Kay, Mr Mohl, Mr Turner and Mr Young were appointed as Directors after the closure of the scheme.

Directors’ Report - Remuneration Report
22 Commonwealth Bank of Australia Financial Report (U.S. Version) 2009
Remuneration of Key Management Personnel and Other Executives
The executives and Directors listed in the tables below include
Key Management Personnel (KMP) and Other Executives
during the year ended 30 June 2009. The KMP are the CEO,
members of the Group‟s Executive Committee and all members
of the Board.
The position and tenure for each of the executives and
Directors listed are shown on the following table. The
subsequent tables refer to these employees by surname and
initials only.
Name Position Tenure (if not full year)
Non-Executive Directors
J M Schubert Chairman
J A Anderson Director
R J Clairs Director
C R Galbraith Director
J S Hemstritch Director
S C Kay Director
A Mohl Director
F D Ryan Director
D J Turner Director
H H Young Director
Managing Director and CEO
R J Norris Managing Director and CEO
Executives
B J Chapman Group Executive, Human Resources and Group Services
D Cohen Group General Counsel
D P Craig Group Executive, Financial Services
S I Grimshaw Group Executive, Premium Business Services Ceased employment on 30 December
2008
M R Harte Group Executive, Enterprise Services & Chief Information
Officer
G L Mackrell Group Executive, International Financial Services Ceased employment on 30 June 2009
R M McEwan Group Executive, Retail Banking Services
I M Narev Group Executive, Business and Private Banking Appointed a KMP on 27 January 2009
G A Petersen Group Executive, Wealth Management
I M Saines Group Executive, Institutional Banking and Markets Appointed a KMP on 31 December
2008
A Toevs Group Chief Risk Officer
Other Executives
M Lau Director, Greater Asia Equities (First State Investments)
M Lazberger Chief Executive Officer, Colonial First State Global Asset
Management (CEO CFS GAM)
Commenced on 1 September 2008
S Paul Joint Managing Partner (First State Investments)

Directors’ Report - Remuneration Report
Commonwealth Bank of Australia Financial Report (U.S. Version) 2009 23
The executives and Directors listed in the tables below include Key Management Personnel (KMP) and Other Executives during the year ended 30 June
2009. The KMP are the CEO, members of the Group‟s Executive Committee and all members of the Board.
Individual remuneration details for Directors for the year ended 30 June 2009 are set out below.
Remuneration of Directors
Short Term Benefits
Post-
employment
Benefits Share-based Payments
Cash
Fixed (1)
$
Cash STI
payment
At Risk
$
STI
Deferred
in Shares
At Risk
$
Other
Short
Term
Benefits
$
Super-
annuation
Fixed (2)
$
LTI
Reward
Shares
At Risk
$
Perform-
ance
Rights
$
NEDSP
Fixed (1)
$
Termina-
tion
Benefits
$
Other
Long
Term
Benefits
$
Total
Remunera-
tion
$
Chairman
J M Schubert
2009 589,918 - - - 53,093 - - 147,480 - - 790,491
2008 551,342 - - - 52,570 - - 137,836 - - 741,748
Non- Executive Directors
J A Anderson
2009 188,000 - - - 16,920 - - 47,000 - - 251,920
2008 178,433 - - - 17,012 - - 44,608 - - 240,053
R J Clairs
2009 209,918 - - - - - - 52,480 - - 262,398
2008 192,482 - - - 18,367 - - 48,121 - - 258,970
C R Galbraith
2009 205,918 - - - 18,533 - - 51,480 - - 275,931
2008 188,471 - - - 17,983 - - 47,118 - - 253,572
J S Hemstritch
2009 204,000 - - - 18,360 - - 51,000 - - 273,360
2008 113,980 - - - 90,161 - - 46,603 - - 250,744
S C H Kay
2009 213,918 - - - 19,253 - - 53,479 - - 286,650
2008 196,493 - - - 18,751 - - 49,123 - - 264,367
A M Mohl
2009 129,072 - - - 82,299 - - 48,479 - - 259,850
2008 - - - - - - - - - - -
F D Ryan
2009 228,000 - - - 20,520 - - 57,000 - - 305,520
2008 218,542 - - - 20,848 - - 54,636 - - 294,026
D J Turner
2009 - - - - 99,313 - - 176,617 - - 275,930
2008 97,731 - - - 104,524 - - 46,159 - - 248,414
H H Young
2009 228,000 - - - 20,520 - - 57,000 - - 305,520
2008 203,803 - - - 19,417 - - 50,951 - - 274,171
Non-Executive Director Total
2009 2,196,744 - - - 348,811 - - 742,015 - - 3,287,570
2008 1,977,111 - - - 490,479 - - 550,361 425,265 - 3,443,216
Managing Director and CEO
R J Norris (3)
2009 3,253,551 1,733,333 866,667 - 100,000 1,237,635 1,936,546 - - 82,020 9,209,752
2008 3,122,450 1,900,000 950,000 - 100,014 1,237,635 1,280,790 - - 72,031 8,662,920
Director Grand Totals
2009 5,450,295 1,733,333 866,667 - 448,811 1,237,635 1,936,546 742,015 - 82,020 12,497,322
2008 5,099,561 1,900,000 950,000 - 590,493 1,237,635 1,280,790 550,361 425,265 72,031 12,106,136
Group totals in respect of the financial year ended 30 June 2008 do not necessarily equal the sum of amounts disclosed for individuals listed above as there are some different individuals specified
as Directors in 2009.
Amounts in the table above reflect remuneration for the time the Director has been in a Key Management Personnel role i.e. pro-rating is applied relative to the date the Director commenced or
ceased a Key Management Personnel role.
(1) For Non-Executive Directors, this includes that portion of base fees and committee fees paid as cash. Non-Executive Directors also salary sacrifice 20% of their fees on a mandatory basis
under the Non-Executive Directors Share Plan (NEDSP). Further details on the NEDSP is contained in Note 32 to the Financial Statements.
(2) Represents company contribution to superannuation and includes any allocations made by way of salary sacrifice by Directors.
(3) Cash STI payment represents the amount of cash immediately payable in recognition of performance for the year ended 30 June 2009, with the exception of STI sacrificed to superannuation
which is included under 'Superannuation'. STI deferred in shares represents the compulsory deferral of 1/3 of the STI payment for the performance year ended 30 June 2009. This amount is
deferred until 1 July 2012. Generally, Mr Norris will need to be an employee of the Bank at the end of the deferral period to receive this portion. The 2008 financial year figure also represents
1/3 of STI deferred in shares. The value of LTI Performance Rights under the GLSP and Reward Shares under the ERP has been calculated using a Monte-Carlo simulation method. Details
on the assumptions incorporated are set out on page 80 under Reward Shares Valuation Assumptions and Performance Rights Valuation Assumptions.

Directors’ Report - Remuneration Report
24 Commonwealth Bank of Australia Financial Report (U.S. Version) 2009
Individual remuneration details for Executives for the year ended 30 June 2009 are set out below:
Remuneration of Executives
Short Term Benefits
Post-
employ-
ment
Benefits Share-based Payments
Cash
Fixed (1)
$
Non
Monetary
Fixed (2)
$
Cash STI
payment
At Risk (3)
$
STI
Deferred in
Shares
At Risk (4)
$
Other Short
Term
Benefits (5)
$
Super-
annuation
Fixed (6)
$
Performance
Rights (7)
$
LTI Reward
Shares
At Risk (7)
$
LTI
Performance
Units At Risk
(7)
$
Other Long
Term
Benefits (8)
$
Total
Remuneration
$
B J Chapman
2009 861,370 13,233 600,000 300,000 10,357 50,000 403,956 133,255 87,861 20,635 2,480,667
2008 807,709 13,763 666,667 333,333 263,352 49,838 263,692 133,247 110,997 18,703 2,661,301
D Cohen
2009 834,452 13,233 800,000 400,000 573,004 50,000 403,956 - - 12,612 3,087,257
2008 33,960 564 - - - 2,271 263,692 - - 786 301,273
D P Craig
2009 1,049,649 13,233 800,000 400,000 4,711 79,944 454,521 177,673 - 31,175 3,010,906
2008 931,854 13,763 1,000,000 500,000 100,000 86,128 301,362 177,673 - 22,094 3,132,874
S I Grimshaw (9)
2009 755,803 6,225 - - - 50,512 (376,703) (25,938) - 29,661 439,560
2008 1,406,154 13,507 1,000,000 500,000 - 94,030 376,703 715,296 - 32,560 4,138,250
M R Harte
2009 969,041 13,218 800,000 400,000 14,058 50,000 403,956 111,929 - 14,449 2,776,651
2008 862,067 13,653 866,667 433,333 73,756 49,352 263,692 111,929 - 19,961 2,694,410
G L Mackrell (10)
2009 814,051 13,233 950,000 - - 177,397 131,349 (8,716) 925,713 776,968 3,779,995
2008 770,205 13,763 633,333 316,667 - 173,753 301,362 534,536 - 20,178 2,763,797
R M McEwan
2009 1,185,722 13,268 933,333 466,667 11,492 100,231 542,317 - 220,393 62,670 3,536,093
2008 924,144 13,653 1,000,000 500,000 101,036 93,838 376,703 - 238,692 22,094 3,270,160
I M Narev (11)
2009 370,006 5,491 254,820 127,410 5,445 24,087 143,334 - - 7,120 937,713
2008 - - - - - - - - - - -
G A Petersen
2009 1,080,395 12,446 666,667 333,333 - 101,026 516,753 372,781 - 86,307 3,169,708
2008 1,022,877 13,763 733,333 366,667 - 50,000 339,033 400,040 - 23,685 2,949,398
I M Saines (12)
2009 651,383 3,660 403,280 201,640 - 43,298 143,334 - - 55,459 1,502,054
2008 - - - - - - - - - - -
A Toevs
2009 1,399,726 - 1,066,667 533,333 241,699 100,000 194,000 - - 532,797 4,068,222
2008 1,130,595 - - - 61,222 2,186 - - - 42,374 1,236,377
Total Remuneration
2009 9,971,598 107,240 7,274,767 3,162,383 860,766 826,495 2,960,773 760,984 1,233,967 1,629,853 28,788,826
2008 8,375,607 104,589 5,900,000 2,950,000 599,366 635,073 2,486,239 1,993,821 349,689 202,435 23,596,819
Other Executives (13)
M Lau
2009 388,734 - 344,920 - - 36,382 - - 4,505,748 - 5,275,784
2008 - - - - - - - - - - -
M J Lazberger (14)
2009 615,611 9,335 498,000 249,000 1,000,000 41,679 - - 1,750,000 1,743,674 5,907,299
2008 - - - - - - - - - - -
S Paul
2009 528,854 - 482,579 - - 93,122 - - 4,707,603 - 5,812,158
2008 - - - - - - - - - - -
Total Remuneration of Executives
2009 11,504,797 116,575 8,600,266 3,411,383 1,860,766 997,678 2,960,773 760,984 12,197,318 3,373,527 45,784,067
2008 9,398,484 118,352 7,366,666 2,950,000 599,366 685,073 2,486,239 2,206,541 653,846 226,120 26,690,687
Grand totals in respect of the financial year ended 30 June 2008 do not necessarily equal the sum of amounts disclosed for individuals listed above as there are different individuals specified as
Executives in 2009.
Amounts in the table above reflect remuneration for the time the Executive has been in a Key Management Personnel role i.e. pro-rating is applied relative to the date the Executive commenced or
ceased a Key Management Personnel role.
(1) Reflects the amounts paid in the year ended 30 June 2009 and is calculated on a total cost basis. Included may be annual leave accruals and salary sacrifice amounts with the exception of
salary sacrifice superannuation which is included under 'Superannuation'.
(2) Represents the cost of car parking (including FBT).
(3) Cash STI payment represents the amount of cash immediately payable to an Executive in recognition of performance for the year ended 30 June 2009, with the exception of STI sacrificed to
superannuation which is included under 'Superannuation'.
(4) STI deferred in Shares represents the compulsory deferral of 1/3 of STI payments for Executives for performance to the year ended 30 June 2009. These amounts are deferred until 1 July 2012.
Generally, the Executive will need to be an employee of the Group at the end of the deferral period to receive this portion.

Directors’ Report - Remuneration Report
Commonwealth Bank of Australia Financial Report (U.S. Version) 2009 25
(5) All Other Short Term Benefits payable that are not covered above. Includes sign on arrangements for Mr Cohen, Mr Toevs and Mr Lazberger.
(6) Represents company contribution to superannuation and includes any allocations made by way of salary sacrifice by Executives.
(7) The „fair value‟ of LTI performance rights under the GLSP and ERP has been calculated using a Monte-Carlo simulation method, incorporating the assumptions
below:
Reward Share Valuation Assumptions
Purchase Date Fair Value Exercise Price Risk Free Rate Assumption Term Dividend Yield Volatility
22-Sep-04 $16.72 $0.00 5.48% 59 mths Nil 15.00%
5-Nov-04 $19.72 $0.00 5.61% 57 mths Nil 15.00%
23-Nov-05 $24.51 $0.00 5.65% 56 mths Nil 15.00%
3-Nov-06 $30.62 $0.00 5.44% 47 mths Nil 30.00%
Performance Rights Valuation Assumptions
12-Oct-07 $53.50 $0.00 4.70% 33mths 6.75% 30.00%
3-Dec-08 $26.20 $0.00 4.70% 31mths 6.75% 30.00%
- The Reward Shares assessment has been made as at purchase date for the 2004 and 2005 ERP grants and 30 June 2009 for the 2006 ERP grant based on the
expected future TSR performance of the Bank and each member of its peer group. The annualised equivalent of the „fair value‟ in respect of the number of shares
for each grant has been amortised on a straight line basis over the term of the grant.
- The Performance Rights assessment under the GLSP has been made at 30 June 2009 based on the expected future NPAT growth (using TSR) and customer
satisfaction outcomes of the Group and each member of the peer group. The annualised equivalent of the „fair value‟ in respect of the number of performance rights
for the grant is the basis for management‟s decision to determine the amount to be amortised on a straight line basis over the term of the grant.
- For the GLSP, the final allocation pool can only be determined at the end of the performance period. As each participant‟s allocation is based on the proportion of the
pool that may vest, the above assumptions have been used to determine the maximum number of performance rights that may vest. Each participant has been
granted their allocated percentage of the pool based on the above valuation assumptions.
(8) All other benefits payable that are not covered above. For Mr Mackrell this includes long service leave termination benefits. For Mr Toevs and Mr Lazberger, this
reflects retention arrangements which they will forfeit if they resign or are dismissed, including for poor performance before the vesting date.
(9) Mr Grimshaw ceased employment on 30 December 2008.
(10) Mr Mackrell ceased employment on 30 June 2009.
(11) Mr Narev was appointed a KMP on 27 January 2009. Remuneration disclosed relates to the portion of the year he was a KMP.
(12) Mr Saines was appointed a KMP on 31 December 2008. Remuneration disclosed relates to the portion of the year he was a KMP.
(13) Messrs Lau, Lazberger and Paul, who are not Key Management Personnel, and Messrs Mackrell and Toevs are the five executives who received the highest
remuneration for the year ended 30 June 2009 as defined in the Section 300A of the Corporations Act 2001.
(14) Mr Lazberger commenced employment on 1 September 2008.
STI Allocations to Executives for the Year Ended 30 June 2009
Portion Paid
Percentage
Forfeited
%
Portion
Deferred (1)
Minimum Total
Value (2)
$
Maximum Total
Value (3)
$
Percentage of
Maximum
Opportunity Paid
%
Directors
R J Norris 2/3 - 1/3 1,733,333 2,600,000 42
Executives
B J Chapman 2/3 - 1/3 600,000 900,000 53
D Cohen 2/3 - 1/3 800,000 1,200,000 73
D P Craig 2/3 - 1/3 800,000 1,200,000 57
S I Grimshaw (4) - 100 - - - n/a
M R Harte 2/3 - 1/3 800,000 1,200,000 63
G L Mackrell 100% - - 950,000 950,000 51
R M McEwan 2/3 - 1/3 933,333 1,400,000 58
I M Narev (5) 2/3 - 1/3 254,820 382,230 64
G A Petersen 2/3 - 1/3 666,667 1,000,000 45
I M Saines (6) 2/3 1/3 403,280 604,920 63
A Toevs 2/3 - 1/3 1,066,667 1,600,000 57
Other Executives
M Lau 100% - - 344,920 344,920 95
M J Lazberger (7) 2/3 - 1/3 498,000 747,000 60
S Paul 100% - - 482,579 482,579 99
(1) Used to acquire shares in the Bank that will generally vest on 1 July 2012 subject to not being forfeited due to resignation or misconduct including misrepresentation
of performance outcomes. Will generally vest early in circumstances of retrenchment, retirement or death.
(2) For those executives with a minimum total value greater than zero, this reflects the 2/3 component of the STI payment which is immediately payable determined by
actual performance over the year ended 30 June 2009. Executives generally do not receive an STI payment unless their individual performance is at least meeting
expectations.
(3) Includes value of shares purchased at commencement of vesting period for the deferred portion.
(4) Mr Grimshaw ceased employment on 30 December 2008.
(5) Mr Narev was appointed a KMP on 27 January 2009. Reflects pro-rated portion for service during the year as a KMP.
(6) Mr Saines was appointed a KMP on 31 December 2008. Reflects pro-rated portion for service during the year as a KMP.
(7) Mr Lazberger commenced on 1 September 2008.

Directors’ Report - Remuneration Report
26 Commonwealth Bank of Australia Financial Report (U.S. Version) 2009
LTI Allocations to Executives for the Year Ended 30 June 2009
Percentage
Paid
%
Percentage
Forfeited
%
Percentage
Deferred (1)
%
Current
Allocation
(Percentage of
Pool) (2)
Minimum Total
Value
$
Maximum Total
Value (3)
$000s
Directors
R J Norris - - 100 32.02 - 11,560
Executives
B J Chapman - - 100 6.75 - 2,437
D Cohen - - 100 6.75 - 2,437
D P Craig - - 100 7.50 - 2,708
S I Grimshaw (4) - 100 - - - -
M R Harte - - 100 6.75 - 2,437
G L Mackrell (5) - 67 100 2.87 - 1,036
R M McEwan - - 100 8.60 - 3,105
I M Narev (6) - - 100 4.30 - 1,552
G A Petersen - - 100 8.60 - 3,105
I M Saines (7) 100 4.30 1,552
A Toevs - - 100 5.82 - 2,101
Other Executives
M Lau (3) - - 100 n/a - 5,661
M J Lazberger (3) - - 100 n/a - 1,750
S Paul (3) - - 100 n/a - 5,444
(1) Will vest in July 2011 under the GLSP subject to the performance conditions and the performance hurdle being met (see page 18).
(2) Each participant‟s allocated percentage of the proportion of the pool that may vest (capped at $36.1million). See page 18.
(3) Equals the participant‟s allocated percentage of the maximum pool that may vest – $36.1 million, except for Messrs Lau, Lazberger and Paul who participate in cash
settled LTI style arrangements that are specific to Colonial First State Global Asset Management (CFS GAM). Allocations under this arrangement vest depending on
the CFS GAM net profit before tax growth rate over three to five years (See page 19). To receive the maximum the performance hurdles must be achieved at the
maximum level.
(4) Mr Grimshaw ceased employment on 30 December 2008.
(5) Mr Mackrell ceased employment on 30 June 2009. The allocation reflects a pro rata value (of his original allocation) as his exit was due to retirement. Vesting
remains subject to performance conditions being met as per footnote 1 above.
(6) Mr Narev was appointed a KMP on 27 January 2009.
(7) Mr Saines was appointed a KMP on 31 December 2008.
Termination Arrangements of Key Management Personnel and Other Executives
The Group‟s executive contracts provide for the following termination arrangements for KMP and Other Executives:
Name Contract Type Notice Severance (1)
B J Chapman Permanent 6 months 6 months
D Cohen Permanent 6 months 6 months
D P Craig Permanent 6 months 6 months
S I Grimshaw (2) Permanent 3 months 12 months
M R Harte Permanent 4 weeks 6 months
G L Mackrell (3) Permanent 4 weeks 6 months
R M McEwan Permanent 6 months 6 months
I M Narev Permanent 6 months 6 months
G A Petersen Permanent 6 months 6 months
I M Saines Permanent 6 months 6 months
A Toevs 2 year fixed term with the option
to extend to a maximum of 3
years. Not Applicable
If terminated in first two years, the greater of
$5,000,000 or remuneration for remainder of term
Other Executives
M Lau Permanent 9 months 9 months
M J Lazberger (4) Permanent 3 months 3 months
S Paul Permanent 6 months 6 months
(1) Severance applies where termination is initiated by the Group, other than for misconduct or unsatisfactory performance.
(2) Mr Grimshaw ceased employment on 30 December 2008.
(3) Mr Mackrell ceased employment on 30 June 2009.
(4) Mr Lazberger commenced on 1 September 2008.

Directors’ Report - Remuneration Report
Commonwealth Bank of Australia Financial Report (U.S. Version) 2009 27
Upon ceasing employment with the Group, executives are
entitled to receive their statutory entitlements of accrued annual
and long service leave, as well as accrued superannuation
benefits.
Executives who cease employment with the Group during a
given performance year (i.e. 1 July to 30 June) will generally not
receive an STI payment for that year except in the
circumstances of retrenchment, retirement or death.
Deferred cash or shares from previous STI awards are usually
forfeited where the executive resigns or is dismissed. In
circumstances of retrenchment, retirement or death any cash
will generally be paid and unvested shares will generally vest
immediately. LTI grants are generally forfeited where the
executive resigns or is dismissed. In circumstances of
retrenchment, retirement or death, the executive or their estate
may, at Board discretion, retain their full or pro-rata grant of LTI.
Vesting of any LTI retained by the executive will still be subject
to the performance hurdle relevant to that grant.
Equity Holdings of Key Management Personnel and Other Executives
Shareholdings
All shares were acquired by Directors on normal terms and
conditions or through the Non-Executive Directors‟ Share Plan.
Shares awarded under the Equity Reward Plan and the
mandatory components of the Equity Participation Plan are
registered in the name of the Trustee of the employee share
plan trust. For further details of the Non-Executive Directors‟
Share Plan, previous Equity Reward Plan, previous Executive
Option Plan and Equity Participation Plan refer to Note 32 to the
Financial Statements.
Share trading policy
The Group has guidelines restricting the dealings of Directors
and certain executives in Bank securities. In particular, they are
prohibited from hedging and from using instruments or
arrangements for margin borrowing, short selling or stock
lending in relation to unvested securities of the Bank or of any
other member of the Group.
Directors and executives are reminded of the share trading
policy each six months and are required to complete an annual
declaration confirming their compliance with the policy.
Details of shareholdings of Key Management Personnel and
Other Executives (or close family or entities controlled, jointly
controlled, or significantly influenced by them, or any entity over
which any of the aforementioned hold significant voting power)
are as follows:
Shares Held by Directors
Name Class (1)
Balance
1 July 2008
Acquired/Granted
as
Remuneration (2)
On Exercise
of
Options
Reward Shares
Vested (3)
Net Change
Other (4)
Balance
30 June 2009
Directors
J M Schubert Ordinary 27,308 4,214 - - 1,261 32,783
R J Norris Ordinary 10,000 - - - 100,713 110,713
Reward Shares 191,238 - - (100,328) - 90,910
Deferred Shares - 22,707 - - - 22,707
J A Anderson Ordinary 11,565 1,366 - - 1,219 14,150
R J Clairs Ordinary 18,900 1,453 - - - 20,353
C R Galbraith Ordinary 13,054 1,424 - - 856 15,334
J S Hemstritch Ordinary 16,491 1,482 - - 3,385 21,358
S C H Kay Ordinary 9,037 1,482 - - - 10,519
A M Mohl (5) Ordinary - 788 - - 8,500 9,288
F D Ryan Ordinary 15,342 1,657 - - 385 17,384
D J Turner Ordinary 1,241 5,691 - - 2,000 8,932
H H Young Ordinary 21,997 1,656 - - 1,631 25,284
Total For
Directors
Ordinary 144,935 21,213 - - 119,950 286,098
Reward Shares 191,238 - - (100,328) - 90,910
Deferred Shares - 22,707 - - - 22,707
(1) Reward shares represents shares granted under the Equity Reward Plan (ERP) and are subject to a performance hurdle. These shares fully vested on 14 July 2009.
See page 18 for further details on the ERP. Deferred shares represent one third of the 2007/2008 payment deferred into shares for these years.
(2) Represents shares acquired under NEDSP on 28 August 2008 and 20 February 2009 by mandatory sacrifice of fees. All shares acquired through NEDSP are
subject to a 10 year trading restriction (shares will be tradeable earlier if the Director leaves the Board). See Note 32 to the Financial Statements for further details on
the NEDSP.
(3) Reward Shares become ordinary shares upon vesting.
(4) “Net Change Other” incorporates changes resulting from purchases and sales during the year.
(5) Mr Mohl commenced on 1 July 2008.

Directors’ Report - Remuneration Report
28 Commonwealth Bank of Australia Financial Report (U.S. Version) 2009
Shares Held by Executives
Name Class (1)
Balance
1 July 2008
Acquired/Granted
as
Remuneration
On Exercise of
Options
Reward/
Deferred Shares
Vested (2)
Net Change
Other (3)
Balance
30 June 2009
Executives
B J Chapman Ordinary 450 - - - 1,121 1,571
Reward Shares 17,046 - - - - 17,046
Deferred Shares - 7,968 - - - 7,968
D Cohen Ordinary - 13,781 - - - 13,781
Reward Shares - - - - - -
Deferred Shares - - - - - -
D P Craig Ordinary 6,000 - - - 6,385 12,385
Reward Shares 22,728 - - - - 22,728
Deferred Shares - 11,951 - - - 11,951
S I Grimshaw (4) Ordinary 29,999 - - - - 29,999
Reward Shares 67,640 - - (35,140) (32,500) -
Deferred Shares - 11,951 - - (11,951) -
M R Harte Ordinary - - - - - -
Reward Shares 14,318 - - - - 14,318
Deferred Shares - 10,358 - - - 10,358
G L Mackrell (5) Ordinary 42,196 - - - 7,455 49,651
Reward Shares 51,888 - - (27,570) (24,318) -
Deferred Shares - 7,569 - (7,569) - -
R M McEwan Ordinary - - - - - -
Reward Shares - - - - - -
Deferred Shares - 11,951 - - - 11,951
I M Narev (6) Ordinary - - - - - -
Reward Shares 1,137 - - - - 1,137
Deferred Shares 6,610 5,976 - - - 12,586
G A Petersen Ordinary 13,365 - - - 22,879 36,244
Reward Shares 45,280 - - (20,280) - 25,000
Deferred Shares - 8,765 - - - 8,765
I M Saines (7) Ordinary 8,563 - - - 5,661 14,224
Reward Shares 10,000 - - (5,000) - 5,000
Deferred Shares 12,653 13,943 - - - 26,596
A Toevs Ordinary - - - - 9,000 9,000
Reward Shares - - - - - -
Deferred Shares 37,784 - - - - 37,784
Other Executives
M Lau Ordinary - - - - - -
Reward Shares - - - - - -
Deferred Shares - - - - - -
M Lazberger (8) Ordinary - - - - - -
Reward Shares - - - - - -
Deferred Shares - 93,852 - - - 93,852
S Paul Ordinary - - - - - -
Reward Shares - - - - - -
Deferred Shares - - - - - -
Total for
Executives
Ordinary 100,573 13,781 - - 52,501 166,855
Reward Shares 230,037 - - (87,990) (56,818) 85,229
Deferred Shares 57,047 184,284 - (7,569) (11,951) 221,811
(1) Reward Shares represents shares granted under the Equity Reward Plan (ERP) and are subject to a performance hurdle. These shares fully vested on 14 July 2009.
See page 18 for further details on the ERP. Deferred shares represents one third of the 2007/08 STI payment deferred into shares for three years, except for Mr
Lazberger where deferred shares represents shares granted as part of his commencement arrangements.
(2) Reward Shares and Deferred Shares become ordinary shares upon vesting.
(3) “Net Change Other” incorporates changes resulting from purchases, sales and forfeitures during the year.
(4) Mr Grimshaw ceased employment on 30 December 2008.
(5) Mr Mackrell ceased employment on 30 June 2009.
(6) Mr Narev was appointed a KMP on 27 January 2009.
(7) Mr Saines was appointed a KMP on 31 December 2008.
(8) Mr Lazberger commenced on 1 September 2008.

Directors’ Report - Remuneration Report
Commonwealth Bank of Australia Financial Report (U.S. Version) 2009 29
Total Loans to Key Management Personnel and Other Executives
Year Ended
30 June
Balance
1 July
$000s
Interest
Charged
$000s
Interest Not
Charged
$000s
Write-off
$000s
Balance
30 June
$000s
Number in
Group at
30 June
Directors
2009 2,840 211 - - 1,991 1
2008 3,648 258 - - 2,795 1
Executives
2009 11,359 667 - - 8,462 10
2008 6,103 781 - - 12,369 9
Total for Key
Management
Personnel
2009 14,199 878 - - 10,453 11
2008 9,751 1,039 - - 15,164 10
Other Executives
2009 - - - - - -
2008 1,442 68 - - 1,335 1
Total
2009 14,199 878 - - 10,453 11
2008 11,193 1,107 - - 16,499 11
Details of Individuals with Loans above $100,000 in the reporting period are as follows:
Individual Loans above $100,000 to Key Management Personnel and Other Executives
Balance
1 July 2008
$000s
Interest
Charged
$000s
Interest Not
Charged
$000s
Write-off
$000s
Balance
30 June 2009
$000s
Highest
Balance
in Period
$000s (2)
Directors R J Norris (1) 2,840 211 - - 1,991 2,771 Executives
B J Chapman 2,667 148 - - 2,230 2,726
D Cohen 941 59 - - 601 941
D P Craig 233 16 - - 11 228
M R Harte 3,394 217 - - 3,024 3,442
G L Mackrell 647 8 - - - 805
R M McEwan (1) 977 125 - - 1,560 2,967
I Narev
754 40 - - 472 754
G A Petersen 976 15 - - 2 930
I Saines 721 39 - - 562 1,201
Total for Key
Management Personnel 14,150 878 - - 10,453 16,765
Other Executives
Total for Other Executives - - - - - -
Total for Key Management
Personnel & Other Executives 14,150 878 - - 10,453 16,765
(1) Balance declared in NZD for Mr Norris and Mr McEwan. Exchange rates are taken from Forex as at 30 June 2009 for interest charged, 30 June 2009 balances and
highest balance in period. The exchange rate as at 30 June 2008 has been used for the 1 July 2008 balances. Highest in period appears lower than the opening
balance due to the application of exchange rates.
(2) Represents the highest balance of loans outstanding at any period during the year ended 30 June 2009.

Directors’ Report – Remuneration Report
30 Commonwealth Bank of Australia Financial Report (U.S. Version) 2009
Terms and Conditions of Loans
All loans to Key Management Personnel and Other Executives
(or close family members or entities controlled, jointly controlled,
or significantly influenced by them, or any entity over which any
of the aforementioned held significant voting power) have been
provided on an arm‟s length commercial basis including the term
of the loan, security required and the interest rate (which may be
fixed or variable).
Other Transactions of Key Management Personnel and
Other Executives and Related Parties
Financial Instrument Transactions
Financial instrument transactions (other than loans and shares
disclosed within this report) of Key Management Personnel and
Other Executives occur in the ordinary course of business on an
arm‟s length basis.
Disclosure of financial instrument transactions regularly made as
part of normal banking operations is limited to disclosure of such
transactions with Key Management Personnel and Other
Executives and entities controlled or significantly influenced by
them.
All such financial instrument transactions that have occurred
between entities within the Group and their Key Management
Personnel and Other Executives have been trivial or domestic
in nature and were in the nature of normal personal banking
and deposit transactions.
Transactions other than Financial Instrument Transactions
of Banks
All other transactions with Key Management Personnel, Other
Executives and their related entities and other related parties
are conducted on an arm‟s length basis in the normal course of
business and on commercial terms and conditions. These
transactions principally involve the provision of financial and
investment services by entities not controlled by the Group.
Audit
Certain disclosures required by the Corporations Act 2001 and
accounting standard AASB124 Related Party Disclosures have
been made in this Remuneration Report. The entire
Remuneration Report has been audited as required.

Directors’ Report
Commonwealth Bank of Australia Financial Report (U.S. Version) 2009 31
Company Secretaries
The details of the Bank‟s Company Secretaries, including their
experience and qualifications are set out below.
John Hatton has been Company Secretary of the
Commonwealth Bank of Australia since 1994.
From 1985 until 1994, he was a solicitor with the Bank‟s Legal
Department.
He has a Bachelor of Laws degree from Sydney University and
was admitted as a solicitor in New South Wales. He is a Fellow
of Chartered Secretaries Australia and a Member of the
Australian Institute of Company Directors.
Carla Collingwood was appointed a Company Secretary to the
Bank in July 2005.
From 1994 until 2005, she was a solicitor with the Bank‟s Legal
Department, before being appointed to the position of General
Manager, Secretariat. She holds a Bachelor of Laws degree
(Hons.) and a Graduate Diploma in Company Secretary Practice
from Chartered Secretaries Australia.
Non-Audit Services
Amounts paid or payable to PricewaterhouseCoopers for non-
audit services provided during the year, as set out in Note 37 to
the Financial Statements are as follows:
Signed in accordance with a resolution of the Directors.
Audit Services
Amounts paid or payable for audit services to
PricewaterhouseCoopers totalled $16,929,000.
The Bank has in place an External Auditor Services Policy,
details of which are set out in the Corporate Governance section
of this Annual Report, to assist in ensuring the independence of
the Bank‟s external auditor.
The Audit Committee has considered the provision, during the
year, of non-audit services by PricewaterhouseCoopers and has
concluded that the provision of those services did not
compromise the auditor independence requirements of the
Corporations Act.
The Audit Committee advised the Board accordingly and, after
considering the Committee‟s advice, the Board of Directors
agreed that it was satisfied that the provision of the non-audit
services by PricewaterhouseCoopers during the year was
compatible with the general standard of independence imposed
by the Corporations Act.
The reasons for the Directors being satisfied that the provision of
the non-audit services during the year did not compromise the
auditor independence requirements of the Corporations Act are:
The operation of the External Auditor Services Policy
during the year to restrict the nature of non-audit services
engagements, to prohibit certain services and to require
Audit Committee pre-approval for all such engagements;
and
The relative quantum of fees paid for non-audit services
compared to the quantum of audit fees.
The above Directors‟ statements are in accordance with the
advice received from the Audit Committee.
Auditor’s Declaration of Independence
We have obtained an independence declaration from our
auditor, PricewaterhouseCoopers as presented on the following
page.
Incorporation of Additional Material
This report incorporates the Highlights (pages 5 to 10), Analysis
sections for Retail Banking Services (pages 26 to 28), Business
and Private Banking (pages 29 to 32), Institutional Banking and
Markets (pages 33 to 35), Wealth Management (pages 37 to
40), International Financial Services (pages 41 to 44) and
Bankwest (page 45 to 46) sections of the Group‟s Annual U.S.
Disclosure Document year ended 30 June 2009.
2009
$’000
Regulatory audits, reviews, attestations and
assurances for Group entities – Australia 707
Regulatory audits, reviews, attestations and
assurances for Group entities – Offshore 96
APRA reporting (including the tripartite review) 277
Financial and other audits, reviews, attestations
and assurances for Group entities - Australia 1,128
Financial and other audits, reviews, attestations
and assurances for Group entities – Offshore 197
Agreed upon procedures and comfort letters in
respect of financing, debt raising and related
activities 387
Taxation services 2,721
Controls review and related work 600
Other 1,024
Total (1) 7,137
(1) An additional amount of $7,132,535 was paid to PricewaterhouseCoopers
by way of fees for entities not consolidated into the Financial Statements.
Of this amount $6,065,331 relates to statutory audits.
J M Schubert
Chairman
12 August 2009
R J Norris
Managing Director and Chief Executive Officer

32 Commonwealth Bank of Australia Financial Report (U.S. Version) 2009
Auditor’s Independence Declaration
As lead auditor for the audit of Commonwealth Bank of Australia for the year ended 30 June 2009, I
declare that to the best of my knowledge and belief, there have been:
a) no contraventions of the auditor independence requirements of the Corporations Act 2001 in
relation to the audit; and
b) no contraventions of any applicable code of professional conduct in relation to the audit.
This declaration is in respect of Commonwealth Bank of Australia and the entities it controlled during the period.
Rahoul Chowdry Sydney
Partner 12 August 2009
PricewaterhouseCoopers
Liability limited by a scheme approved under Professional Standards Legislation
PricewaterhouseCoopers
ABN 52 780 433 757
Darling Park Tower 2
201 Sussex Street
GPO BOX 2650
SYDNEY NSW 1171
DX 77 Sydney
Australia
Telephone +61 2 8266 0000
Facsimile +61 2 8266 9999

Financial Statements
Commonwealth Bank of Australia Financial Report (U.S. Version) 2009 33
Income Statements 34
Balance Sheets 35
Statements of Recognised Income and Expense 36
Statements of Cash Flows 37
Note 1 Accounting Policies 39
Note 2 Profit 52
Note 3 Income from Ordinary Activities 54
Note 4 Average Balances and Related Interest 55
Note 5 Income Tax Expense 61
Note 6 Dividends 64
Note 7 Earnings Per Share 65
Note 8 Cash and Liquid Assets 65
Note 9 Receivables due from Other Financial Institutions 66
Note 10 Assets at Fair Value through Income Statement 66
Note 11 Derivative Assets and Liabilities 68
Note 12 Available-for-Sale Investments 74
Note 13 Loans, Bills Discounted and Other Receivables 77
Note 14 Provisions for Impairment 80
Note 15 Credit Risk Management 84
Note 16 Asset Quality 91
Note 17 Shares in and Loans to Controlled Entities 99
Note 18 Property, Plant and Equipment 100
Note 19 Intangible Assets 102
Note 20 Other Assets 104
Note 21 Assets Held for Sale 104
Note 22 Deposits and Other Public Borrowings 104
Note 23 Payables due to Other Financial Institutions 105
Note 24 Liabilities at Fair Value through Income Statement 105
Note 25 Income Tax Liability 106
Note 26 Other Provisions 106
Note 27 Debt Issues 107
Note 28 Managed Funds Units on Issue 109
Note 29 Bills Payable and Other Liabilities 110
Note 30 Loan Capital 110
Note 31 Detailed Statements of Changes in Equity 117
Note 32 Share Capital 120
Note 33 Minority Interests 125
Note 34 Capital Adequacy 126
Note 35 Financial Reporting by Segments 127
Note 36 Life Insurance Business 129
Note 37 Remuneration of Auditors 131
Note 38 Commitments for Capital Expenditure Not Provided for 131
Note 39 Lease Commitments – Property, Plant and Equipment 132
Note 40 Contingent Liabilities, Assets and Commitments 133
Note 41 Market Risk Management 136
Note 42 Retirement Benefit Obligations 147
Note 43 Controlled Entities 150
Note 44 Investments in Associated Entities and Joint Ventures 153
Note 45 Director and Executive Disclosures 154
Note 46 Related Party Disclosures 155
Note 47 Notes to the Statements of Cash Flows 160
Note 48 Disclosures about Fair Value of Financial Instruments 162
Note 49 Acquisition of Controlled Entities 166

Financial Statements
34 Commonwealth Bank of Australia Financial Report (U.S. Version) 2009
Income Statements
For the year ended 30 June 2009
Group Bank
2009 2008 2007 2009 2008
Note $M $M $M $M $M
Interest income 2 31,519 29,234 23,862 27,991 25,585
Interest expense 2 21,218 21,327 16,826 19,956 19,667
Net interest income 10,301 7,907 7,036 8,035 5,918
Other operating income 2 3,914 3,559 3,341 4,151 5,786
Net banking operating income (1) 14,215 11,466 10,377 12,186 11,704
Funds management income 1,618 2,369 1,871 - -
Investment (expense)/revenue (859) (525) 2,120 - -
Claims and policyholder liability revenue/(expense) 731 519 (2,020) - -
Net funds management operating income 2 1,490 2,363 1,971 - -
Premiums from insurance contracts 1,651 1,373 1,117 - -
Investment (expense)/revenue (232) (27) 858 - -
Claims and policyholder liability expense from
insurance contracts (650) (606) (932) - -
Insurance margin on services operating income 2 769 740 1,043 - -
Total net operating income 2 16,474 14,569 13,391 12,186 11,704
Gain on acquisition of controlled entities 49 983 - - - -
Impairment expense 2,14 3,048 930 434 2,703 902
Operating expenses 2 7,946 7,398 6,427 5,539 5,593
Defined benefit superannuation plan (expense)/income 2,42 (14) 14 8 (14) 14
Net profit before income tax 2 6,449 6,255 6,538 3,930 5,223
Corporate tax expense 5 1,860 1,548 1,775 844 865
Policyholder tax (benefit)/expense 5 (164) (115) 266 - -
Net profit after income tax 4,753 4,822 4,497 3,086 4,358
Minority interests 30 31 27 - -
Net profit attributable to Equity holders of the Bank 4,723 4,791 4,470 3,086 4,358
(1) Net banking operating income of the Bank in 2008 is greater than the Group due to the receipt of tax exempt intragroup dividends.
Group
2009 2008 2007
Note
Earnings per share:
Basic 7 328.5 363. 0 344. 7
Fully diluted 7 313.4 348. 7 339. 7
Dividends per share attributable to shareholders
of the Bank:
Ordinary shares 6 228 266 256
Trust preferred securities (TPS) 8,142 6,850 7,821
Cents per share
These Financial Statements should be read in conjunction with the accompanying notes.

Financial Statements
Commonwealth Bank of Australia Financial Report (U.S. Version) 2009 35
Balance Sheets
As at 30 June 2009
Group Bank
2009 2008 2009 2008
Note $M $M $M $M
Assets
Cash and liquid assets 8 11,340 7,736 9,684 7,282
Receivables due from other financial institutions 9 14,421 6,984 13,986 6,731
Assets at fair value through Income Statement: 10
Trading 25,401 21,676 20,988 19,168
Insurance 17,260 20,650 - -
Other 1,677 3,266 60 274
Derivative assets 11 26,358 18,232 25,536 19,287
Available-for-sale investments 12 21,504 11,488 60,659 27,067
Loans, bills discounted and other receivables 13 466,631 361,282 353,408 309,714
Bank acceptances of customers 14,728 18,278 14,726 18,278
Shares in and loans to controlled entities 17 - - 54,671 37,472
Property, plant and equipment 18 2,472 1,640 1,572 1,336
Investment in associates 44 1,047 906 845 757
Intangible assets 19 9,245 8,258 3,101 2,826
Deferred tax assets 5 1,653 76 1,628 54
Other assets 20 6,070 6,492 3,866 5,369
619,807 486,964 564,730 455,615
Assets held for sale 21 565 608 370 412
Total assets 620,372 487,572 565,100 456,027
Liabilities
Deposits and other public borrowings 22 368,721 263,706 305,170 240,871
Payables due to other financial institutions 23 15,109 17,672 14,942 17,625
Liabilities at fair value through Income Statement 24 16,596 15,526 3,485 2,930
Derivative liabilities 11 32,134 19,541 29,442 19,367
Bank acceptances 14,728 18,278 14,726 18,278
Due to controlled entities - - 81,084 54,119
Current tax liabilities 25 883 768 835 708
Deferred tax liabilities 25 168 266 40 19
Other provisions 26 1,243 1,174 913 983
Insurance policy liabilities 36 16,056 18,495 - -
Debt issues 27 101,819 85,817 62,894 55,778
Managed funds units on issue 28 914 1,109 - -
Bills payable and other liabilities 29 8,520 7,524 7,969 6,301
576,891 449,876 521,500 416,979
Loan capital 30 12,039 11,559 12,174 11,620
Total liabilities 588,930 461,435 533,674 428,599
Net assets 31,442 26,137 31,426 27,428
Shareholders' Equity
Share capital:
Ordinary share capital 32 21,642 15,727 21,825 15,927
Other equity instruments 32 939 939 1,895 1,895
Reserves 31 516 1,206 1,697 2,253
Retained profits 31 7,825 7,747 6,009 7,353
Shareholders' equity attributable to Equity holders of the
Bank 30,922 25,619 31,426 27,428
Minority interests:
Controlled entities 33 520 518 - -
Total minority interests 520 518 - -
Total Shareholders' equity 31,442 26,137 31,426 27,428
These Financial Statements should be read in conjunction with the accompanying notes.

Financial Statements
36 Commonwealth Bank of Australia Financial Report (U.S. Version) 2009
Statements of Recognised Income and Expense
For the year ended 30 June 2009
Group Bank
2009 2008 2007 2009 2008
Note $M $M $M $M $M
Actuarial (losses)/gains from defined benefit superannuation
plans 31,42 (739) (240) 414 (739) (240)
(Losses)/gains on cash flow hedging instruments:
Recognised in equity 31 (1,630) 422 429 (872) 426
Transferred to Income Statement 31 (21) (573) 120 (199) (318)
Gains/(losses) on available-for-sale investments:
Recognised in equity 31 10 262 28 52 240
Transferred to Income Statement on disposal 31 (24) (312) (138) (24) (272)
Transferred to Income Statement on impairment 31 37 - - - -
Revaluation of properties 31 (25) 20 79 (20) 19
Exchange differences on translation of foreign operations31 168 (648) 54 158 (103)
Income tax on items transferred directly to/from equity:
Foreign Currency Translation Reserve 31 94 53 (13) - 1
Available-for-sale investments revaluation reserve 31 (37) 44 10 (17) 7
Revaluation of properties 31 9 (4) (23) 8 (4)
Cash flow hedge reserve 31 497 52 (168) 319 (27)
Net (expense)/income recognised directly in equity (1,661) (924) 792 (1,334) (271)
Profit for the period 4,753 4,822 4,497 3,086 4,358
Total net income recognised for the period 3,092 3,898 5,289 1,752 4,087
Attributable to:
Equity holders of the Bank 3,062 3,867 5,262 1,752 4,087
Minority interests 30 31 27 - -
Total net income recognised for the period 3,092 3,898 5,289 1,752 4,087
These Financial Statements should be read in conjunction with the accompanying notes.

Financial Statements
Commonwealth Bank of Australia Financial Report (U.S. Version) 2009 37
Statements of Cash Flows (1)
For the year ended 30 June 2009
Group Bank
2009 2008 2007 2009 2008
Note $M $M $M $M $M
Cash Flows from Operating Activities
Interest received 31,745 29,464 23,123 28,380 25,445
Interest paid (20,986) (20,786) (16,405) (20,254) (19,098)
Other operating income received 5,551 5,314 4,627 3,371 3,485
Expenses paid (7,334) (6,882) (5,699) (5,028) (5,385)
Income taxes paid (2,043) (1,905) (1,942) (1,938) (1,601)
Net decrease/(increase) in assets at fair value through
Income Statement (excluding life insurance) 4,864 (990) (1,715) 4,705 200
Net increase/(decrease) in liabilities at fair value through
Income Statement:
Life insurance:
Investment income 275 509 2,296 - -
Premiums received (2) 2,063 2,304 2,431 - -
Policy payments (2) (3,144) (3,789) (5,346) - -
Other liabilities at fair value through Income Statement 287 810 4,831 405 (2,279)
Cash flows from operating activities before
changes in operating assets and liabilities 11,278 4,049 6,201 9,641 767
Changes in operating assets and liabilities arising
from cash flow movements
Movement in available-for-sale investments:
Purchases (37,200) (35,113) (22,214) (59,909) (48,162)
Proceeds from sale 4,996 610 1,480 4,996 577
Proceeds at or close to maturity 22,189 31,974 21,139 22,049 28,432
Net change in deposits with regulatory authorities 25 13 (8) (2) 1
Net (increase) in loans, bills discounted and other receivables (52,878) (51,570) (37,885) (48,392) (47,536)
Net (increase)/decrease in receivables due from other
financial institutions not at call (5,575) (2,621) 833 (3,959) (2,126)
Net (increase)/decrease in securities purchased under
agreements to resell (507) 634 (1,647) 363 311
Life insurance business:
Purchase of insurance assets at fair value through Income
Statement (11,950) (8,719) (8,476) - -
Proceeds from sale/maturity of insurance assets at fair
value through Income Statement
fair value through Income Statement
14,478 11,159 8,842 - -
Net increase in deposits and other public borrowings 47,394 49,603 26,361 57,471 48,418
Net proceeds from issuance of debt securities 10,253 (4,816) 7,207 6,754 6,274
Net (decrease)/increase in payables due to other financial
institutions not at call (8,012) 4,486 1,865 (5,641) 4,584
Net increase/(decrease) in securities sold under
agreements to repurchase 6,985 (1,764) 1,943 6,824 (1,835)
Changes in operating assets and liabilities arising
from cash flow movements (9,802) (6,124) (560) (19,446) (11,062)
Net cash provided/(used in) by operating activities47(a) 1,476 (2,075) 5,641 (9,805) (10,295)
Cash Flows from Investing Activities
Payments for acquisition of controlled entities 47(e) (1,741) (241) (7) (2,101) -
Proceeds from disposal of controlled entities 47(c) - 2 - - -
Proceeds from disposal of entities and businesses (net of
cash disposals) - - 16 - -
Dividends received 76 39 3 863 1,667
Net amounts received from controlled entities - - - 11,833 8,864
Proceeds from sale of property, plant and equipment 9 14 53 6 10
Purchases of property, plant and equipment (987) (482) (314) (499) (421)
Payments for acquistions of investments in associates/joint
ventures (144) - (6) (144) -
Purchase of intangible assets (405) (226) (130) (369) (183)
(Purchase)/sale of assets held for sale (22) 766 (1,091) (23) (391)
Net (increase)/decrease in other assets (77) (24) (800) (180) 1,025
Net cash provided by/(used in) operating activities (3,291) (152) (2,276) 9,386 10,571
(1) It should be noted that the Group does not use these accounting Statements of Cash Flows in the internal management of its liquidity positions.
(2) Represents gross premiums and policy payments before splitting between policyholders and shareholders.
These Financial Statements should be read in conjunction with the accompanying notes.

Financial Statements
38 Commonwealth Bank of Australia Financial Report (U.S. Version) 2009
Statements of Cash Flows (1)
For the year ended 30 June 2009
Group Bank
2009 2008 2007 2009 2008
Note $M $M $M $M $M
Cash Flows from Financing Activities
Proceeds from issue of shares (net of issue costs) 4,830 3 19 4,830 3
Dividends paid (excluding Dividend Reinvestment Plan) (2) (2,620) (2,351) (2,284) (2,580) (2,317)
Net movement in other liabilities 344 553 219 1,956 453
Net (purchase) /sale of treasury shares (14) (9) 55 (31) (17)
Issue of loan capital 500 2,091 1,969 500 1,784
Redemption of loan capital (1,250) (7) (1,069) (1,250) (7)
Other (54) 128 (228) 93 34
Net cash provided by/(used in) financing activities 1,736 408 (1,319) 3,518 (67)
Net (decrease)/increase in cash and cash
equivalents (79) (1,819) 2,046 3,099 209
Cash and cash equivalents at beginning of period 2,265 4,084 2,038 337 128
Cash and cash equivalents at end of period (3) 47(b) 2,186 2,265 4,084 3,436 337
(1) It should be noted that the Group does not use these accounting Statements of Cash Flows in the internal management of its liquidity positions.
(2) Includes $98 million allocated to participants under the Dividend Reinvestment Plan in the year ended 30 June 2008.
(3) For the purposes of the Statements of Cash Flows, cash includes cash, money at short call, at call deposits with other financial institutions and settlement account
balances with other banks.
These Financial Statements should be read in conjunction with the accompanying notes.

Notes to the Financial Statements
Commonwealth Bank of Australia Financial Report (U.S. Version) 2009 39
Note 1 Accounting Policies
The Financial Statements of the Commonwealth Bank of
Australia (the “Bank”) and the Bank and its subsidiaries (the
“Group”) for the year ended 30 June 2009, were approved and
authorised for issue by the Board of Directors on 12 August
2009.
The Bank is incorporated and domiciled in Australia. It is a
company limited by shares that are publicly traded on the
Australian Securities Exchange. The address of its registered
office is Level 7, 48 Martin Place, Sydney, NSW 1155, Australia.
The Group is one of Australia‟s leading providers of integrated
financial services including retail, business and institutional
banking, superannuation, life insurance, general insurance,
funds management, broking services and finance company
activities. The principal activities of the Group during the financial
year were:
(i) Retail Banking Services
The Group provides retail banking services within Australia
including housing loans, credit cards, personal loans, savings
and cheque accounts, and demand and term deposits.
(ii) Business and Private Banking
The Group offers commercial products within Australia including
business loans and deposits and asset finance facilities to small
and medium sized corporate customers and to rural and
agribusiness customers. This segment also provides private
banking services to high net worth individuals, and margin
lending through CommSec.
(iii) Institutional Banking and Markets
The Group provides a range of resources to assist clients to
grow and manage their business, creating customised solutions
based on specific needs, industry trends and market conditions.
The Total Capital Solutions offering includes debt and capital
markets, risk management and transactional banking to
corporate and institutional clients. This segment also has
wholesale banking operations in London, New York, Singapore,
Hong Kong and Malta.
(iv) Wealth Management
The Wealth Management segment conducts Australian funds
management business comprising wholesale and retail
investment, superannuation and retirement funds. Investments
are across all major asset classes including Australian and
international shares, property, fixed interest and cash. This
segment also has funds management businesses in the United
Kingdom and Asia.
The Wealth Management segment also provides Australian term
insurance, disability insurance, annuities, master trusts,
investment products and general insurance.
(v) International Financial Services
The Group has full service banking operations in New Zealand,
Fiji and Indonesia and a branch in Vietnam. The Group also has
wholesale banking operations in Indonesia, regions of China and
Tokyo. The Group‟s International Financial Services segment
also conducts Life Insurance operations in New Zealand, where
it has the leading market share, as well as Asia and the Pacific,
and conducts Funds Management business in New Zealand.
(vi) Bankwest
Since the acquisition of Bank of Western Australia Ltd on 19
December 2008, the Group operates full service retail and
commercial banking services within Australia under the
Bankwest brand.
In February 2009 the Group split the Premium Business
Services division into two new segments; Business and Private
Banking and Institutional Banking and Markets.
In so doing the Group can deliver specific client solutions for
their business needs.
There have been no significant changes in the nature of the
principal activities of the Group during the financial year.
(a) Bases of accounting
This general purpose Financial Report for the year ended 30
June 2009 has been prepared in accordance with the Australian
equivalents to International Financial Reporting Standards
(“AIFRS”) and the requirements of the Corporations Act 2001.
The basis of the AIFRS standards are the International Financial
Reporting Standards (“IFRS”) as issued by the International
Accounting Standards Board (“IASB”). As a result of complying
with AIFRS, the Group Financial Statements comply with IFRS,
and interpretations as issued by the IASB.
The preparation of the Annual Financial Report conforming with
AIFRS requires management to make estimates and
assumptions that affect the amounts reported in the Financial
Statements and accompanying notes. Further information is
included in Note 1 (mm) Critical Accounting Policies and
Estimates.
The use of available information and the application of
judgement are inherent in the formation of estimates. Actual
results could differ from these estimates.
(b) Basis of preparation
The Financial Statements are prepared on the basis of historical
cost except that the following assets and liabilities are measured
at fair value: derivative financial instruments, assets and
liabilities at fair value through Income Statement, available-for-
sale investments, insurance policy liabilities, domestic bills
discounted which are included in loans, bills discounted and
other receivables, investment property which backs liabilities
paying a return linked to the fair value or returns from assets
including the investment property, owner-occupied property,
defined benefit plan assets and liabilities, employee share-based
remuneration liabilities and recognised assets and liabilities
attributable to the hedged risk in a hedging relationship that
qualifies for hedge accounting treatment.
The Financial Report is presented in Australian dollars.
No standards, interpretations and amendments have been early
adopted during the financial year commencing 1 July 2008.
The following standards, interpretations and amendments have
been applied by the Group during the financial year
commencing 1 July 2008:
AASB Interpretation 4 Determining Whether an
Arrangement contains a Lease, is applicable to annual
reporting periods beginning on or after 1 January 2008;
AASB Interpretation 12 Service Concession Arrangements
and AASB 2007-2 Amendments to Australian Accounting
Standards arising from AASB Interpretation 12 are
applicable to annual reporting periods beginning on or after
1 January 2008; and
AASB Interpretation 14 The Limit on a Defined Benefit
Asset, Minimum Funding Requirements and their
Interaction is applicable to annual reporting periods
beginning on or after 1 January 2008.
None of these standards, interpretations and amendments had a
material effect on the financial results or position of the Bank or
the Group.

Notes to the Financial Statements
40 Commonwealth Bank of Australia Financial Report (U.S. Version) 2009
Note 1 Accounting Policies (continued)
The following standards and amendments will be applied from
the financial year commencing 1 July 2009:
Revised AASB 3 Business Combinations, AASB 127
Consolidated and Separate Financial Statements and
AASB 2008-3 Amendments to Australian Accounting
Standards arising from AASB 3 and AASB 127. The initial
application of these revised standards are not expected to
materially impact the financial results of the Bank or the
Group;
AASB 2007-6 Amendments to Australian Accounting
Standards Arising from AASB 123 (June 2007) and
Revised AASB 123 Borrowing Costs (June 2007) which
removes the option to expense borrowing costs related to
“qualifying assets”. AASB 2007-6 and the revised AASB
123 are applicable for annual reporting periods beginning
on or after 1 January 2009. The initial application of AASB
2007-6 is not expected to materially impact the financial
results of the Bank or the Group;
AASB 2008-1 Amendments to Australian Accounting
Standards – Share based Payments: Vesting Conditions
and Cancellations, clarifies that vesting conditions
comprise service conditions and performance conditions
only and that other features of a share-based payment
transaction are not vesting conditions and specifies that all
cancellations, whether by the entity or by other parties,
should receive the same accounting treatment. It is
applicable for annual reporting periods beginning on or
after 1 January 2009 and is not expected to materially
impact the Bank or the Group;
AASB 2008-2 Amendments to Australian Accounting
Standards – Puttable Financial Instruments and
Obligations Arising on Liquidation introduces an exception
to the definition of financial liability, to classify as equity
instruments certain puttable financial instruments and
certain instruments that impose on an entity an obligation
to deliver to another party a pro rata share of the net assets
of the entity only on liquidation of the entity. It is applicable
for annual reporting periods beginning on or after 1
January 2009 and is not expected to materially impact the
Bank or the Group;
AASB 2008-5 Amendments to Australian Accounting
Standards arising from the Annual Improvements Project
[AASB 5,7,101,102,107,108,110,116,118,119,120,123,
127,128,129,131,132,134,136,138,139,140,141,1023 &
1038] is applicable for annual reporting periods beginning
on or after 1 January 2009 and is not expected to
materially impact the Bank or the Group;
AASB 2008-6 Further Amendments to Australian
Accounting Standards arising from the Annual
Improvements Project [AASB 1 & AASB 5] amends AASB
1 and AASB 5 to include requirements relating to a sale
plan involving the loss of control of a subsidiary. The
amendments require all the assets and liabilities of such a
subsidiary to be classified as Held for Sale and clarify the
disclosures required when the subsidiary is part of a
disposal group that meets the definition of a discontinued
operation. It is not expected to materially impact the Bank
or the Group;
AASB 2008-7 Amendments to Australian Accounting
Standards – Cost of an Investment in a Subsidiary, Jointly
Controlled Entity or Associate [AASB 1,118,121,127 & 136;
removes from AASB 118 the requirement to deduct
dividends declared out of pre-acquisition profits from the
cost of an investment in a subsidiary, jointly controlled
entity or associate, amends AASB 127 to require a new
parent entity established in a group reorganisation to
measure the cost of its investment at the carrying amount
of equity of the original parent, amends AASB 136 to
include recognising a dividend together with other evidence
as an indication of impairment. It is applicable for annual
reporting periods beginning on or after 1 January 2009 and
is not expected to materially impact the Bank or the Group;
AASB 2008-8 Amendments to Australian Accounting
Standards – Eligible Hedged Items [AASB 139] clarifies
how the principles that determine whether a hedged risk or
portion of cash flows is eligible for designation as a hedged
item, should be applied in particular situations. It is not
expected to materially impact the Bank or the Group;
AASB 2008-12 Amendments to Australian Accounting
Standards – Reclassification of Financial Assets [AASB 7,
AASB 139 & AASB 2008-10] clarifies the application date
of amendments made by the IASB and issued in Australia
in October 2008 as AASB 2008-10. It is not expected to
materially impact the Bank or the Group;
Revised AASB 101 Presentation of Financial Statements
and AASB 2007-8 Amendments to Australian Accounting
Standards arising from AASB 101 and AASB 2007-10
Further Amendments to Australian Accounting Standards
arising from AASB 101. The initial application of the revised
AASB 101 and the revised AASB 2007-10 did not have
any impact on the Bank or the Group‟s financial position or
results;
AASB 2009-2 Improving Disclosures about Financial
Instruments: Disclosures requires the disclosure of
valuation techniques used to determine the carrying values
of financial instruments held at fair value in the Balance
Sheet, with additional disclosures required for valuations
with significant unobservable inputs. It is applicable for
annual reporting periods beginning on or after 1 January
2009 and is not expected to materially impact the Bank or
the Group;
AASB 2009-3 Embedded Derivatives requires an entity to
assess whether an embedded derivative is required to be
separated from a host contract when the entity reclassifies
a hybrid (combined) financial asset out of the fair value
through Income Statement category. It is not expected to
materially impact the Bank or the Group;
AASB 2009-4 Amendments to Australian Accounting
Standards arising from the Annual Improvements Project
makes consequential amendments to AASB 2, AASB 138
and AASB Interpretation 9 arising from revised AASB 3. It
also amends the restriction on the entity that can hold
hedging instruments in AASB Interpretation 16. It is not
expected to materially impact the Bank or the Group;
AASB 2009-6 Amendments to Australian Accounting
Standards makes additional amendments as a
consequence of the issuance of revised AASB 101. These
amendments were omitted from or incorrectly stated in
AASB 2007-8 Amendments to Australian Accounting
Standards arising from AASB 101. It is not expected to
materially impact the Bank or the Group;
AASB 2009-7 Amendments to Australian Accounting
Standards [AASB 5,7,107,112,136 &139 and Interpretation
17] The amendments to AASB 5, AASB 7, AASB 139 and
Interpretation 17 correct errors that occurred in AASB
2008-12 Amendments to Australian Accounting Standards
– Reclassification of Financial Assets – Effective Date and
Transition, AASB 2008-13 Amendments to Australian
Accounting Standards arising from AASB Interpretation 17
Note 1 Accounting Policies (continued)
Notes to the Financial Statements
Commonwealth Bank of Australia Financial Report (U.S. Version) 2009 41
– Distributions of Non-cash Assets to Owners and
Interpretation 17 itself. The other amendments reflect
changes made by the IASB to its pronouncements. It is not
expected to materially impact the Bank or the Group;
AASB Interpretation 12 Service Concession Arrangements
provides guidance on the accounting by operators of
public-to-private service concession arrangements and
applies if: the grantor controls or regulates what services
the operator must provide with the infrastructure, to whom it
must provide them, and at what price; and if the grantor
controls – through ownership, beneficial entitlement or
otherwise – any significant residual interest in the
infrastructure at the end of the term of the arrangement. It
is applicable for annual reporting periods beginning on or
after 1 January 2009 and is not expected to materially
impact the Bank or the Group;
AASB Interpretation 16 Hedges of a Net Investment in a
Foreign Operation requires that the hedged risk in a hedge
of a net investment in a foreign operation is the foreign
currency risk arising between the functional currency of the
net investment and the functional currency of any parent
entity. This also applies to foreign operations in the form of
joint ventures, associates or branches. It is applicable for
annual reporting periods beginning on or after 1 July 2009
and is not expected to materially impact the Bank or the
Group;
AASB Interpretation 17 and AASB 2008-13 Amendments
to Australian Accounting Standards arising from AASB
Interpretation 17 – Distributions of Non-cash Assets to
Owners [AASB 5 and AASB 110] clarifies that a dividend
payable should be recognised when the dividend is
appropriately authorised and is no longer at the discretion
of the entity, an entity should measure the dividend
payable at the fair value of the net assets to be distributed;
and an entity should recognise the difference between the
dividend paid and the carrying amount of the net assets
distributed in profit or loss. It is not expected to materially
impact the Bank or the Group; and
AASB Interpretation 1 Changes in Existing
Decommissioning Restoration and Similar Liabilities,
provides guidance on how to account for the effect of
changes in the measurement of existing decommissioning,
restoration and similar liabilities. It is applicable for annual
reporting periods beginning on or after 1 January 2009 and
is not expected to materially impact the Bank or the Group.
The following standards and amendments are available for early
adoption at 1 July 2009 and will be applied from the financial
year commencing 1 July 2010:
AASB 2009-5 Further Amendments to Australian
Accounting Standards arising from the Annual
Improvements Project [AASB 5,8,101,107,117,118,136 &
139] makes presentation, recognition, measurement,
terminology and editorial changes. It is applicable for
annual reporting periods beginning on or after 1 January
2010 and is not expected to materially impact the Bank or
the Group.
Other standards, interpretations and amendments are unlikely to
have a material effect on the Bank or the Group.
(c) Consolidation
The consolidated Financial Statements include the Financial
Statements of the Bank and all entities where it is determined
that there is a capacity to control the entity.
Potential voting rights are considered when assessing control. A
number of consolidated entities were formed by the Group for
the purpose of asset securitisation transactions and structured
debt issuance, or to accomplish certain other narrow and well-
defined objectives. Such entities may acquire assets directly or
indirectly from the Bank or its affiliates.
Additionally, some of these entities are bankruptcy-remote (i.e.
their assets are not available to satisfy the claims of creditors of
the Group or any other of its subsidiaries). These entities are
consolidated in the Group‟s Financial Statements when the
majority of exposure to risks and benefits from the entity resides
with the Group.
All balances and transactions between Group entities, including
unrealised gains and losses, have been eliminated on
consolidation.
The consolidated Financial Statements also include the Group‟s
share of the financial results of entities where the Group holds
an investment in, and has significant influence over, the financial
and operating policies of the entity. This is normally evidenced
when the Group owns 20% or more of the voting rights.
Associated companies are defined as those entities over which
the Group has significant influence but there is no capacity to
control. Investments in associates are carried at cost plus the
Group‟s share of post-acquisition profit or loss and other
reserves. The Group‟s share of profit or loss of associates is
included in the Group‟s Income Statement.
(d) Revenue recognition
Revenue is recognised to the extent it is probable that economic
benefits will flow to the Group and the revenue can be reliably
measured. The principal sources of revenue are interest income
and fees and commissions.
Interest income
Interest income is recognised on an accrual basis using the
effective interest method. Further information is included in Note
1 (g) Receivables from other financial institutions, Note 1 (i)
Assets at fair value through Income Statement, Note 1 (j)
Available-for-sale investments, Note 1 (l) Loans, bills discounted
and other receivables, and Note 1 (m) Leasing.
Lending fees
Fee income and direct costs relating to loan origination,
financing or restructuring and to loan commitments are deferred
and amortised to interest income over the expected life of the
loan using the effective interest method. Fees received for
commitments which are not expected to result in a loan are
recognised in the Income Statement over the commitment
period.
Loan syndication fees where the Group does not retain a portion
of the syndicated loan are recognised in income once the
syndication has been completed. Where fees are received on an
ongoing basis and represent the recoupment of the costs of
maintaining and administering existing loans, these fees are
recognised in Income Statement on an accrual basis.
Fees and commissions
When commission charges and fees relate to specific
transactions or events, they are recognised in income in the
period in which they are earned. However, when they are
charged for services provided over a period, they are recognised
in income on an accrual basis.

Notes to the Financial Statements
42 Commonwealth Bank of Australia Financial Report (U.S. Version) 2009
Note 1 Accounting Policies (continued)
Other income
Trading income is recognised when earned based on changes
in fair value of financial instruments and is recorded from trade
date. Further information is included in Notes 1 (e) Foreign
currency translations, 1 (i) Assets at fair value through Income
Statement, and Note 1 (ff) Derivative financial instruments.
Life insurance business income recognition is explained in Note
1 (hh).
(e) Foreign currency translations
The functional and presentation currency of the domestic
operations of the Bank has been determined to be Australian
Dollars (“AUD”) as this currency best reflects the economic
substance of the underlying events and circumstances relevant
to the Bank. Each entity and overseas branch within the Group
has also determined their functional currency based on their own
primary economic indicators.
All foreign currency monetary items are revalued at spot rates of
exchange prevailing at Balance Sheet date and changes in the
spot rate are recorded in the Income Statement. Foreign
currency forward, futures, swaps and option positions are
revalued at appropriate market rates applying at Balance Sheet
date.
Non-monetary assets and liabilities that are measured in terms
of historical cost in a foreign currency are translated using the
exchange rate at the date of transaction.
With the exception of the revaluations classified in equity,
unrealised foreign currency gains and losses arising from these
revaluations and gains and losses arising from foreign exchange
dealings are included in the Income Statement.
The foreign currency assets and liabilities of overseas branches
and controlled entities with an overseas functional currency are
converted to AUD at Balance Sheet date in accordance with the
foreign exchange rates ruling at that date. Profit and loss items
for overseas branches and controlled entities are converted to
AUD progressively throughout the year at the spot exchange
rate at the date of the transaction. All resulting exchange
differences are recognised in the Foreign Currency Translation
Reserve (“FCTR”) as a separate component of equity.
Translation differences arising from translation of opening
balances of shareholders‟ funds of overseas branches and
controlled entities at year end exchange rates are reflected in
the FCTR. The Group maintains a substantially matched
position in assets and liabilities in foreign currencies and the
level of net foreign currency exposure does not have a material
impact on its financial position.
(f) Cash and liquid assets
Cash and liquid assets includes cash at branches, cash at
banks, nostro balances, money at short call with an original
maturity of three months or less and securities held under
reverse repurchase agreements. They are measured at face
value or the gross value of the outstanding balance. Interest is
recognised in the Income Statement using the effective interest
method.
(g) Receivables from other financial institutions
Receivables from other financial institutions include loans,
deposits with regulatory authorities and settlement account
balances due from other banks. They are measured at
amortised cost similar to loans and other receivables, refer Note
1 (l). Interest is recognised in the Income Statement using the
effective interest method.
(h) Financial instruments
Financial instruments are classified into one of the following
categories which determines their measurement basis:
Assets at fair value through Income Statement (Note 1 (i));
Available-for-sale investments (Note 1 (j));
Derivative assets (Note 1 (ff));
Loans, bills discounted and other receivables (Note 1 (l));
Liabilities at fair value through Income Statement (Note 1
(x));
Liabilities at amortised cost;
Derivative liabilities (Note 1 (ff)); and
Shareholders‟ equity (Note 1 (ee)).
Except for restructured facilities referred to in Note 1(l) Loans,
bills discounted and other receivables, financial instruments are
transacted on a commercial basis to derive an interest yield/cost
with terms and conditions having due regard to the nature of the
transaction and the risks involved.
The Group has no held to maturity investments.
Offsetting financial instruments
The Group offsets financial assets and liabilities where there is a
legally enforceable right to set off, and there is an intention to
settle on a net basis or to realise the asset and settle the liability
simultaneously.
Derecognition of financial assets
Financial assets are derecognised either when sold, or when the
rights to receive cash flows from the financial assets have
expired or have been transferred, or when the Group has
transferred substantially all the risks and rewards of ownership.
In transactions where substantially all the risks and rewards are
neither retained nor transferred, the Group derecognises assets
when control is no longer retained, or when control is retained
the assets are recognised to the extent of the Group‟s continuing
involvement.
(i) Assets at fair value through Income Statement
Assets classified at fair value through Income Statement include
assets held for trading and assets that upon initial recognition
are designated by the Group as at fair value through Income
Statement. This designation is made when it reduces significant
accounting mismatches between assets and related liabilities,
the group of financial assets are managed and their
performance is evaluated on a fair value basis, or where the
asset is a contract which contains an embedded derivative.
These assets are recognised on trade date at fair value with
transaction costs including brokerage, commissions and fees
expensed through the Income Statement. Subsequent changes
in fair value are recognised in other operating income. Dividends
earned are recorded in other operating income. Interest earned
is recorded within net interest earnings using the effective
interest method.
In addition the Group measures bills discounted intended to be
sold into the market at fair value, which are classified within
loans, bills discounted and other receivables.
Assets classified at fair value through Income Statement are
further classified into three subcategories: Trading, Insurance
and Other.
Trading
Trading assets are short and long term public, bank and other
debt securities and equities that are acquired and held for
trading purposes. Subsequent to initial recognition, where an
active market exists fair value is measured using quoted market
bid prices. In a trading portfolio with offsetting risk positions,
quoted mid prices, where available, are used to measure fair
value.

Notes to the Financial Statements
Commonwealth Bank of Australia Financial Report (U.S. Version) 2009 43
Note 1 Accounting Policies (continued)
Non market-quoted assets are valued using valuation
techniques based on market observable inputs existing at
Balance Sheet date. In a limited number of instances valuation
techniques are not based on observable market data.
Insurance
Insurance assets are investments that back life insurance
contracts and life investment contracts. They are measured at
fair value based on quoted bid prices or using appropriate
valuation techniques. Refer to Note 1 (hh), Life and general
insurance business for further details.
Other
Other investments include financial assets which the Group has
designated as at fair value through Income Statement at
inception to eliminate an accounting mismatch. Subsequent to
initial recognition, where an active market exists fair value is
measured using quoted market prices. Quoted mid prices,
where available, are used to measure fair value in a portfolio
with offsetting risk positions.
Non market-quoted instruments are valued using valuation
techniques, based on observable inputs existing at Balance
Sheet date. In a limited number of instances valuation
techniques are not based on observable market data.
(j) Available-for-sale investments
Available-for-sale investments are short and long term public,
bank and other securities and include bonds, notes, bills of
exchange, commercial paper, certificates of deposit, equities
and rolling loan originations and syndications.
Available-for-sale investments are initially recognised at fair
value including transaction costs. Subsequent to initial
recognition, where an active market exists fair value is
measured using quoted market bid prices. Quoted mid prices,
where available, are used to measure fair value in a portfolio
with offsetting risk positions.
Non market-quoted instruments are valued using valuation
techniques, based on observable inputs existing at Balance
Sheet date. In a limited number of instances valuation
techniques are not based on observable market data.
Equity investments whose fair value cannot be reliably
measured are valued at cost. Gains and losses arising from
changes in fair value are reported in the Available-for-sale
investments reserve within equity net of applicable income taxes
until such investments are sold, collected, otherwise disposed of,
or become impaired. Interest, premiums and dividends are
reflected in other operating income when earned.
Available-for-sale investments are tested for impairment in line
with Note 1 (n) Provisions for impairment.
Upon disposal or impairment, the accumulated change in fair
value within the Available-for-sale investments reserve is
transferred to the Income Statement and reported within other
operating income.
(k) Repurchase agreements
Securities sold under agreements to repurchase are retained
within the Available-for-sale investments or Assets at fair value
through Income Statement categories and accounted for
accordingly in line with Note 1 (j) and (i) respectively.
Liability accounts are used to record the obligation to repurchase
and disclosed as Deposits. Securities held under reverse
repurchase agreements are recorded within Cash and liquid
assets.
(l) Loans, bills discounted and other receivables
Loans, bills discounted and other receivables include financial
assets with fixed and determinable payments that are not quoted
in an active market, which are measured at amortised cost, and
bills discounted, which are measured at fair value.
They include overdrafts, home loans, credit card and other
personal lending, term loans, bill financing, redeemable
preference shares, securities and finance leases. Loans, bills
discounted and other receivables are initially recognised at fair
value including direct and incremental transaction costs. Loans
and receivables are subsequently measured at amortised cost
using the effective interest method and are presented net of
provisions for impairment. Bills discounted (bank acceptances)
intended to be sold into the market are measured at fair value
until sold.
Other loans and receivables which are originated with the intent
to be sold immediately or in the short term are classified as
Assets at fair value through Income Statement.
Note 1 (d) and Note 1 (n) provide additional information with
respect to revenue recognition and impairment respectively.
Non-Performing Facilities
Individual provisions for impairment are recognised to reduce
the carrying amount of loans, bills discounted and other
receivables to their estimated recoverable amounts. Individually
significant provisions are calculated based on discounted cash
flows.
The unwinding of the discount from initial recognition of
impairment through to recovery of the written down amount is
recognised as interest income. In subsequent periods, interest in
arrears/due on non-performing facilities is recognised in the
Income Statement using the interest rate used for the purpose of
measuring the impairment of the asset.
Restructured Facilities
When the original contractual terms of facilities (primarily loans)
are modified, the accounts become classified as restructured.
Such accounts continue to accrue interest as long as the facility
is performing in accordance with the restructured terms. If
performance is not maintained, or collection of interest and/or
principal is no longer probable, the account will be returned to
the non-performing classification. Facilities are generally kept as
non-performing until they are returned to a performing basis.
Assets Acquired Through Securities Enforcement
Assets acquired in satisfaction of facilities in default (primarily
loans) are recorded at net market value at the date of
acquisition. Any difference between the carrying amount of the
facility and the net market value of the assets acquired is
represented as an individually assessed provision or written off.
AATSE are further classified as Other Real Estate Owned or
Other Assets Acquired Through Security Enforcement and
classified in the appropriate asset classifications in the Balance
Sheet.
Impairment of loans, bills discounted and other receivables
The Group has individually assessed and collective provisions
for impairment as explained in Note 1 (n).
(m) Leasing
Leases where the Group transfers substantially all the risks and
rewards incident to ownership of an asset to the lessee or a third
party are classified as finance leases. A receivable at an amount
equal to the present value of the lease payments, including any
guaranteed residual value, is recognised.
Income on finance lease transactions is recognised on a basis
reflecting a constant periodic return based on the lessor‟s net
investment outstanding in respect of the finance lease.
The difference between the gross receivable and the present
value of the receivable is unearned finance income and is
recognised over the term of the lease using the effective interest

Notes to the Financial Statements
44 Commonwealth Bank of Australia Financial Report (U.S. Version) 2009
Note 1 Accounting Policies (continued)
method. Finance lease receivables are included in Loans, bills
discounted and other receivables.
Leases where the Group retains substantially all the risks and
rewards incident to ownership of an asset are classified as
operating leases.
Operating lease rental revenue and expense is recognised in the
Income Statement on a straight-line basis over the lease term.
The Group classifies assets leased out under operating leases
as property, plant and equipment. These assets are depreciated
over their expected useful lives on a basis consistent with similar
fixed assets.
(n) Provisions for impairment
Financial assets
Financial assets, excluding Derivative assets and Assets at fair
value through Income Statement, are reviewed at each Balance
Sheet date to determine whether there is objective evidence of
impairment.
A financial asset or portfolio of financial assets is impaired and
impairment losses are incurred if, and only if, there is objective
evidence of impairment as a result of one or more loss events
that occurred after the initial recognition of the asset and prior to
the Balance Sheet date (“a loss event”) and that loss event or
events has had an impact on the estimated future cash flows of
the financial asset or the portfolio that can be reliably estimated.
If any such indication exists, the asset‟s carrying amount is
written down to the asset‟s estimated recoverable amount.
Loans, bills discounted and other receivables
The Group assesses at each balance date whether there is any
objective evidence of impairment.
If there is objective evidence that an impairment loss on loans,
bills discounted and other receivables has been incurred, the
amount of the loss is measured as the difference between the
asset‟s carrying amount and the present value of the expected
future cash flows (excluding future credit losses that have not
been incurred), discounted at the financial asset‟s original
effective interest rate. Short-term balances are not discounted.
The Group has individually assessed provisions and collectively
assessed provisions. Individually assessed provisions are made
against individually significant financial assets.
Individually significant provisions are assessed as the difference
between an asset‟s carrying amount and the present value of
estimated future cash flows discounted at the asset‟s original
effective interest rate.
Impaired financial assets in the Retail segment are those
facilities that are not well secured and past due 180 days or
more.
The Group applies APRA‟s prudential standards in classifying
impaired assets into three categories, comprising:
(a) Non-Performing:
Any credit risk facility against which an individually
assessed provision for impairment has been raised;
Any credit risk facility maintained on a cash basis because
of significant deterioration in the financial position of the
borrower; and
Any credit risk facility where loss of principal or interest is
anticipated.
(b) Restructured Facilities:
Credit risk facilities on which the original contractual terms have
been modified due to financial difficulties of the borrower.
Interest on these facilities is taken to profit and loss. Failure to
comply fully with the modified terms will result in immediate
reclassification to non-performing. These loans are collectively
assessed for provisioning purposes.
(c) Assets Acquired through Security Enforcement:
Other Real Estate Owned, comprising real estate where
the Group assumed ownership or foreclosed in settlement
of a debt;
Other Assets Acquired through Securities Enforcement,
comprising assets other than real estate where the Group
has assumed ownership or foreclosed in settlement of a
debt; and
Other real estate owned and other assets acquired through
security enforcement are sold through the Group‟s existing
disposal processes. These processes are generally
expected to take no longer than six months.
All other loans and receivables that do not have an individually
assessed provision are assessed collectively for impairment.
Collective provisions are maintained to reduce the carrying
amount of portfolios of similar loans and receivables to their
estimated recoverable amounts at the Balance Sheet date.
The expected future cash flows for portfolios of assets with
similar risk characteristics are estimated on the basis of historical
loss experience. Loss experience is adjusted on the basis of
current observable data to reflect the effects of current
conditions that did not affect the period on which the loss
experience is based and to remove the effects of conditions in
the period that do not currently exist. Increases or decreases in
the provision amount are recognised in the Income Statement.
Available-for-sale investments
When a decline in the fair value of an Available-for-sale
investment has been recognised directly in equity and there is
objective evidence that the asset is impaired, the cumulative loss
is removed from equity and recognised in the Income
Statement. If in a subsequent period the amount of an
impairment loss for an available-for-sale debt security decreases
and the decrease can be linked objectively to an event occurring
after the impairment event, the impairment is reversed through
the Income Statement. However, impairment losses on
available-for-sale equity securities are not reversed through the
Income Statement while the asset is still recognised.
Goodwill and other non-financial assets
Goodwill balances and intangible assets with an indefinite useful
life are assessed for impairment at each reporting date or more
regularly where an indication of impairment exists. Refer to Note
1 (t) Intangibles for more details on goodwill and intangibles
impairment testing. If any such indication exists, the asset‟s
carrying amount is written down to the asset‟s estimated
recoverable amount and the loss is recognised in the Income
Statement in the period in which it occurs.
The carrying amounts of the Group‟s other non-financial assets
are reviewed at each Balance Sheet date to determine whether
there is any indication of impairment. If any such indication
exists, the asset‟s recoverable amount is estimated.
The recoverable amount of an asset or cash generating unit is
the greater of the fair value less cost to sell, or value in use. An
impairment loss is recognised whenever the carrying amount of
an asset or its cash-generating unit exceeds its recoverable
amount. Impairment losses are recognised in the Income
Statement.
A previously recognised impairment loss (except for goodwill) is
reversed if there has been a change in the estimates used to
determine the recoverable amount. However, the reversal is not
to an amount higher than the carrying amount that would have
been determined, net of amortisation or depreciation, if no
impairment loss had been recognised in prior years.

Notes to the Financial Statements
Commonwealth Bank of Australia Financial Report (U.S. Version) 2009 45
Note 1 Accounting Policies (continued)
Off-balance sheet items
Provisions for impairment for off-balance sheet items such as a
commitment are reported in other provisions. Measurement of
provisions is discussed further in Note 1 (aa) Provisions.
The Group recognises impairment provisions in respect of only
those advances and credit transactions for which there is
objective evidence of impairment at Balance Sheet date.
The amounts required to bring the provisions for impairment to
their assessed levels are recognised in the Income Statement.
(o) Bank acceptances of customers
The exposure arising from the acceptance of bills of exchange
that are sold into the market is recognised as a liability. An asset
of equal value is raised to reflect the offsetting claim against the
drawer of the bill. Bank acceptances generate fee income that is
recognised in the Income Statement when earned.
(p) Shares in and loans to controlled entities
Equity contributions to controlled entities are carried in the
Bank‟s Financial Statements at the lower of cost of acquisition or
recoverable amount, and loans to controlled entities are
measured at amortised cost using the effective interest method.
These assets are measured at fair value when impaired and a
provision is raised as per Note 1 (n) Provisions for impairment.
(q) Investment property
Investment properties are classified as properties held to earn
rental income and/or for capital appreciation.
The Group carries investment property which backs liabilities
paying a return linked to the fair value or returns from assets
including the investment property at fair value based on a
valuation performed by professional valuers. Valuations are
carried out annually. Fair value movements are recognised in
the Income Statement in the period in which they arise.
(r) Assets classified as held for sale
Assets are classified as held for sale when their carrying
amounts will be recovered principally through sale within 12
months. They are measured at the lower of carrying amount and
fair value less costs to sell unless the nature of the assets
requires they be measured in line with another accounting
standard. Where this is the case the asset‟s measurement basis
is separately outlined.
Assets classified as held for sale are neither amortised nor
depreciated unless the nature of the asset requires it.
(s) Property, plant and equipment
The Group measures its property assets (land and buildings) on
a fair value measurement basis using independent market
valuations.
Revaluation adjustments are generally reflected in the Asset
Revaluation Reserve, except to the extent they reverse a
revaluation decrease of the same asset previously recognised in
the Income Statement. Gains or losses on disposals are
determined as the difference between the net disposal
proceeds, if any, and the carrying amount of the item. Realised
amounts in the Asset Revaluation Reserve are transferred to the
Capital Reserve.
Equipment is measured at cost less accumulated depreciation
and provision for impairment, if any. Depreciation is calculated
principally on a category basis at rates applicable to each
category‟s useful life using the straight-line method and treated
as an operating expense charged to the Income Statement.
Computer software is capitalised at cost and classified as
Property, Plant and Equipment where it is integral to the
operation of associated hardware.
The useful lives of major depreciable asset categories are as
follows:
Buildings
Shell Maximum 30 years
Integral plant and equipment:
Carpets 10 years
All other (air-conditioning, lifts) 20 years
Non-integral plant and equipment:
Fixtures and fittings 10 years
Leasehold improvements
Leasehold improvements Lesser of unexpired lease
term or lives as above
Equipment
Security surveillance systems 7 years
Furniture 8 years
Office machinery 5 years
EFTPOS machines 3 years
Computer hardware 3-5 years
Depreciation rates and methods underlying the calculation of
depreciation of items of property, plant and equipment are kept
under review to take account of any change in circumstances.
Estimates of useful lives are revised when a change in
circumstances indicates a reassessment should be performed.
No depreciation is charged on freehold land, although, in
common with all long-lived assets, it is subject to impairment
testing, if deemed appropriate.
Property, plant and equipment are periodically reviewed for
impairment. Where the carrying amount of an asset is greater
than its estimated recoverable amount, it is written down
immediately through the Income Statement to its recoverable
amount.
Where the Group expects the carrying amount of assets held
within property, plant and equipment to be recovered principally
through a sale transaction in the short-term rather than through
continuing use, these assets are classified as Held for sale.
(t) Intangibles
Goodwill
Goodwill, representing the excess of purchase consideration
plus incidental expenses over the fair value of the identifiable net
assets at the time of acquisition of an entity, is capitalised and
recognised in the Balance Sheet.
Goodwill is reviewed annually for impairment at each reporting
date, or more frequently if events or changes in circumstances
indicate that it might be impaired. For the purposes of
impairment testing, goodwill is allocated to cash-generating units
or groups of units. A cash-generating unit is the smallest
identifiable group of assets that generate independent cash
flows. Goodwill is allocated by the Group to cash generating
units or groups of units based on how goodwill is monitored by
management.
An impairment loss is recognised for a cash-generating unit if
the higher of the recoverable amount or the value in use of the
unit/group of units is less than the carrying amount of the
unit/group of units.
The recoverable amount of the cash-generating unit is
calculated as the higher of fair value less costs to sell, and value
in use, measured using readily available market data and
assumptions. Impairment losses on goodwill are not
subsequently reversed.

Notes to the Financial Statements
46 Commonwealth Bank of Australia Financial Report (U.S. Version) 2009
Note 1 Accounting Policies (continued)
Gains and losses on the disposal of an entity are net of the
carrying amount of the goodwill relating to the entity.
Computer software costs
Where computer software costs are not integrally related to
associated hardware, the Group recognises them as an
intangible asset where they are clearly identifiable, can be
reliably measured and it is probable they will lead to future
economic benefits that the Group controls.
The Group carries capitalised software assets at cost less
amortisation and any impairment losses.
These assets are amortised over their estimated useful lives on
a straight-line basis which is usually between three and ten
years.
Estimates of useful lives are revised when a change in
circumstances indicates a reassessment should be performed.
Any impairment loss is recognised when incurred.
Software maintenance costs are expensed as incurred.
Core Deposits
Core deposits represent the value of a deposit base acquired in
a business combination. Core deposits are initially recognised at
fair value, representing the avoided cost of alternative funding
sources such as securitisation and wholesale funding and are
amortised over their estimated useful life. During 2009 the
Group recognised core deposits from the acquired deposit
portfolio of Bankwest, which have an estimated useful life of
seven years, based on their weighted average attrition rates.
Brand names
Brand names are recognised when acquired in a business
combination. Brand names are initially recognised at fair value,
representing the royalty costs that would have been incurred
had a brand name been used without acquiring it, measured
based on an annual percentage of income generated by the
acquired entity. During 2009 the Group acquired the Bankwest
brand name. This brand name is considered to have an
indefinite useful life and is subject to impairment testing.
Other Intangibles
Other intangibles comprise acquired management fee rights and
customer lists where they are clearly identifiable, can be reliably
measured and where it is probable they will lead to future
economic benefits that the Group controls.
Management fee rights have been assessed to have indefinite
lives and are carried at cost less any impairment losses.
Customer lists are carried at cost less amortisation, which is
generally over a period of ten years.
(u) Other assets
Other assets include all other financial assets and include
interest, fees and other unrealised income receivable, and
securities sold not delivered. These assets are recorded at the
amortised cost.
The net surpluses or deficits that arise within defined benefit
superannuation plans are recognised and disclosed separately
in Other assets and Bills payable and Other liabilities.
(v) Deposits from customers
Deposits and other public borrowings includes certificates of
deposits, term deposits, savings deposits, cheque and other
demand deposits, debentures and other funds raised publicly by
borrowing corporations. They are initially recognised at fair value
including directly attributable transaction costs and subsequently
measured at amortised cost. Interest and yield related fees are
recognised on an effective interest basis.
Where the Group has hedged deposits with derivative
instruments, hedge accounting rules are applied (refer to Note 1
(ff) Derivative financial instruments).
(w) Payables to other financial institutions
Payables to other financial institutions include deposits, vostro
balances and settlement account balances due to other banks.
They are recognised at fair value including directly attributable
transaction costs at inception.
Payables to other financial institutions are subsequently
recognised at amortised cost. Interest and yield related fees are
recognised using the effective interest method.
Where the Group has designated payables to other financial
institutions as Liabilities at fair value through Income Statement,
the changes in fair value are reported in the Income Statement
(refer Note 1 (x) Liabilities at fair value through Income
Statement).
(x) Liabilities at fair value through Income Statement
The Group designates certain liabilities at fair value through
Income Statement on origination where those liabilities are
managed on a fair value basis or where the liabilities eliminate
an accounting mismatch. The liabilities are recognised on trade
date at fair value and transaction costs are taken directly to the
Income Statement. Subsequent to initial recognition fair value is
measured using quoted market offer prices where an active
market exists. Quoted mid prices, where available, are used to
measure liabilities with offsetting risk positions in a portfolio at
fair value.
Non market-quoted instruments are valued using valuation
techniques based on observable inputs existing at Balance
Sheet date. In a limited number of instances valuation
techniques are not based on observable market data.
(y) Income taxes
Income tax on the profit and loss for the period comprises
current and deferred tax.
Income tax is recognised in the Income Statement, except to the
extent that it relates to items recognised directly in equity, in
which case it is recognised in equity.
Current tax is the expected tax payable on the taxable income
for the year, using tax rates enacted or substantially enacted at
the Balance Sheet date, and any adjustment to tax payable in
respect of previous years.
Deferred tax is provided using the Balance Sheet liability
method, providing for temporary differences between the
carrying amounts of assets and liabilities for financial reporting
purposes and the amounts used for taxation purposes.
The amount of deferred tax provided is based on the expected
manner of realisation or settlement of the carrying amount of
assets and liabilities, using tax rates enacted or substantially
enacted at the Balance Sheet date which are expected to apply
when the deferred tax asset is realised or the deferred tax
liability is settled.
A deferred tax asset is recognised only to the extent it is
probable that future taxable profits will be available against
which the asset can be utilised. Deferred tax assets are reduced
to the extent that it is no longer probable that the related tax
benefit will be realised.
The Commonwealth Bank of Australia Group elected to be taxed
as a single entity under the tax consolidation system with effect
from 1 July 2002.
The Bank has formally notified the Australian Taxation Office of
its adoption of the tax consolidation regime. In addition to the
Group electing to be taxed as a single entity under the tax
consolidation regime, the measurement and disclosure of

Notes to the Financial Statements
Commonwealth Bank of Australia Financial Report (U.S. Version) 2009 47
Note 1 Accounting Policies (continued)
deferred tax assets and liabilities has been performed in
accordance with the principles in AASB 112, and on a modified
stand alone basis under UIG 1052.
Any current tax liabilities/assets (after the elimination of intra-
Group transactions) and deferred tax assets arising from unused
tax losses assumed by the Bank from the subsidiaries in the tax
consolidated group are recognised in conjunction with any tax
funding arrangement amounts (refer below).
Any difference between these amounts is recognised by the
Bank as an equity contribution to or distribution from the
subsidiary.
The Bank recognises deferred tax assets arising from unused
tax losses of the tax-consolidated group to the extent it is
probable that future taxable profits of the tax-consolidated group
will be available against which the asset can be utilised.
Any subsequent period adjustments to deferred tax assets
arising from unused tax losses assumed from subsidiaries are
recognised by the Bank only.
The members of the tax-consolidated group have entered into a
tax funding arrangement which sets out the funding obligations
of members of the tax-consolidated group in respect of tax
amounts.
(z) Employee benefits
Annual leave
The provision for annual leave represents the current
outstanding liability to employees at Balance Sheet date.
Long service leave
The provision for long service leave is discounted to the present
value, is subject to actuarial review and is maintained at a level
that accords with actuarial advice.
Other employee benefits
The provision for other employee entitlements represents
liabilities for staff housing loan benefits, a subsidy to a registered
health fund with respect to retired and current employees, and
employee incentives under employee share plans and bonus
schemes.
The Group engages in share-based remuneration in respect of
services received from certain of its employees. The share
based remuneration may be cash settled or equity settled. The
fair value of equity settled remuneration is calculated at grant
date and amortised to the Income Statement over the vesting
period, with a corresponding increase in the Employee
Compensation Reserve. For these awards, market vesting
conditions, such as share price performance conditions, are
taken into account when estimating the fair value. Non–market
vesting conditions, such as service conditions, are taken into
account by adjusting the number of the equity instruments
included in the measurement of the expense.
Cash settled remuneration is recognised as a liability and
remeasured to fair value until settled, with changes in the fair
value recognised as an expense.
Defined benefit superannuation plans
The Group currently sponsors two defined benefit
superannuation plans for its employees. The assets and
liabilities of these plans are legally held in separate trustee-
administered funds. They are calculated separately for each
plan by assessing the fair value of plan assets and deducting the
amount of future benefit that employees have earned in return
for their service in current and prior periods discounted to
present value. The discount rate is the yield at Balance Sheet
date on government securities which have terms to maturity
approximating to the terms of the related liability.
The defined benefit superannuation plan surpluses and/or
deficits are calculated by fund actuaries. Contributions to all
superannuation plans are made in accordance with the rules of
the plans. As the Australian plan is in surplus, no funding is
currently necessary.
Actuarial gains and losses related to defined benefit
superannuation plans are directly recorded in Retained Profits.
The net surpluses or deficits that arise within defined benefit
superannuation plans are recognised and disclosed separately
in Other assets or Bills payable and other liabilities.
Defined contribution superannuation plans
The Group sponsors a number of defined contribution
superannuation plans. Certain plans permit employees to make
contributions and earn matching or other contributions from the
Group. The Group recognises contributions due in respect of the
accounting period in the Income Statement. Any contributions
unpaid at the Balance Sheet date are included as a liability.
(aa) Provisions
Provision for dividends
A provision for dividend payable is recognised when dividends
are declared by the Directors.
Provisions for restructuring
Provisions for restructuring are recognised where there is a
detailed formal plan for restructure and a demonstrated
commitment to that plan.
Provision for self-insurance
The provision for self-insurance covers certain non-lending
losses and non-transferred insurance risks. Actuarial reviews
are carried out at regular intervals with provisioning effected in
accordance with actuarial advice.
(bb) Debt issues
Debt issues are short and long term debt issues of the Group
including commercial papers, notes, term loans and medium
term notes. Commercial paper, floating, fixed and structured
debt issues are recorded at cost or amortised cost using the
effective interest method.
Premiums, discounts and associated issue expenses are
recognised in the Income Statement using the effective interest
method, from the date of issue, to ensure that securities attain
their redemption values by maturity date.
Interest is recognised in the Income Statement using the
effective interest method. Any profits or losses arising from
redemption prior to maturity are taken to the Income Statement
in the period in which they are realised.
Where the Group has designated debt instruments at fair value
through Income Statement, the changes in fair value are
recognised in the Income Statement. Refer to Note 1 (x)
Liabilities at fair value through Income Statement.
Embedded derivatives with economic characteristics and risks
that are not wholly related to the economic characteristics and
notes of the host instruments are separated from the debt
issues. Refer Note 1 (ff) Derivative financial instruments.
Hedging
The Group hedges interest rate and foreign currency risk on
certain debt issues. When hedge accounting is applied to fixed
rate debt issues, the carrying values are adjusted for changes in
fair value related to the hedged risks rather than carried at
amortised cost. Refer to Note 1 (ff) Derivative financial
instruments.

Notes to the Financial Statements
48 Commonwealth Bank of Australia Financial Report (U.S. Version) 2009
Note 1 Accounting Policies (continued)
(cc) Bills payable and other liabilities
Bills payable and other liabilities includes interest, fees, other
expenses payable, securities purchased not delivered and any
defined benefit superannuation plan deficit.
Any superannuation plan deficit is recorded in line with Note 1
(z) Employee benefits while the remaining liabilities are recorded
at amortised cost using the effective interest method.
Where the Group has designated bills payable and other
liabilities at fair value through Income Statement, the changes in
fair value are reported in the Income Statement (refer to Note 1
(x) Liabilities at fair value through Income Statement).
(dd) Loan capital
Loan capital is debt issued by the Group with terms and
conditions, such as being undated or subordinated, which qualify
for inclusion as capital under APRA Prudential Standards. Loan
capital debt issues are initially recorded at fair value plus directly
attributable transaction costs. After initial recognition loan capital
debt issues are measured at amortised cost using the effective
interest method.
Interest inclusive of premiums, discounts and associated issue
expenses is recognised in the Income Statement using the
effective interest method over the expected life of the instrument
so that they attain their redemption values by maturity date. Any
profits or losses arising from redemption prior to expected
maturity are recognised in the Income Statement in the period in
which they are realised.
(ee) Shareholders’ equity
Ordinary share capital is the amount of paid up capital from the
issue of ordinary shares.
Treasury Shares are deducted from Ordinary share capital.
Gains or losses on the reissue of Treasury Shares are
recognised in shareholders‟ equity within Retained Profits.
The movement between the acquisition and reissue price of
Treasury Shares remains within shareholders‟ equity.
The General Reserve is derived from revenue profits and is
available for dividend payments except for undistributable profits
in respect of the Group‟s life insurance businesses.
The Capital Reserve is derived from capital profits (refer to Note
1 (s) Property, Plant and Equipment) and is available for
dividend payments.
The General Reserve for Credit Losses was originally
appropriated from Retained Profits to comply with APRA
prudential requirements in prior periods and has been returned
to Retained Profits.
(ff) Derivative financial instruments
The Group has a significant volume of derivative financial
instruments that include foreign exchange contracts, forward
rate agreements, futures, options and interest rate, currency,
equity and credit swaps.
Derivative financial instruments are used as part of the Group‟s
trading activities and to hedge certain assets and liabilities.
Derivatives that do not meet the hedging criteria are classified as
derivatives held for trading, or as other derivatives.
The Group initially recognises derivative financial instruments at
the fair value of consideration given or received.
Subsequent to initial recognition, where an active market exists,
fair value is measured based on quoted market prices.
Non market-quoted instruments are valued using valuation
techniques based on observable inputs existing at Balance
Sheet date. In a limited number of instances valuation
techniques are not based on observable market data.
A positive revaluation amount of a contract is reported as an
asset and a negative revaluation amount of a contract as a
liability.
Changes in fair value of derivatives are recognised in the
Income Statement unless designated within a cash flow hedging
relationship.
Swaps
Interest rate swap receipts and payments are recognised within
net interest income using the effective interest method as
interest of the designated hedged item or class of items being
hedged over the term for which the swap is effective as a hedge,
whereas revaluation gains and losses are recognised within
other operating income.
Similarly with cross currency swaps, interest rate receipts and
payments are recognised on the same basis as for interest rate
swaps. In addition, the initial principal flows are revalued to fair
value at the current market exchange rate with revaluation gains
and losses recognised in the Income Statement against
revaluation losses and gains of the underlying hedged item or
class of items.
Derivative financial instruments utilised for hedging
relationships
The Group uses derivative instruments as part of its asset and
liability management activities to manage exposures to interest
rate, foreign currency and credit risks, including exposures
arising from forecast transactions. Hedge accounting can be
applied subject to certain rules for fair value hedges, cash flow
hedges and hedges of foreign operations. Cash flow and fair
value hedges are the predominant hedges applied by the Group.
Swaps are the major financial instruments used in the Group‟s
hedging arrangements.
Fair value hedges
For fair value hedges, the change in fair value of the hedging
derivative, and the hedged risk of the hedged item, is recognised
immediately in the Income Statement within other operating
income. If the fair value hedge relationship is terminated for
reasons other than the derecognition of the hedged item, fair
value hedge accounting ceases and, in the case of an interest
bearing item, the fair value adjustment of the hedged item is
amortised to the Income Statement over the remaining term of
the original hedge. If the hedged item is derecognised the
unamortised fair value adjustment is recognised immediately in
the Income Statement.
Cash flow hedges
A fair valuation gain or loss associated with the effective portion
of a derivative designated as a cash flow hedge is recognised
initially in shareholders‟ equity within the Cash flow hedge
reserve. Amounts in the Cash flow hedge reserve are
transferred to the Income Statement when the cash flows on the
hedged item are recognised in profit and loss.
Gains and losses resulting from cash flow hedge ineffectiveness
are recorded immediately in the Income Statement.
A fair valuation gain or loss represents the amount by which
changes in the fair value of the expected cash flow of the
hedging derivative differ from the fair value of the changes (or
expected changes) in the cash flow of the hedged item.
Where the hedged item is derecognised, the cumulative gain or
loss is recognised immediately in the Income Statement. If for
reasons other than the derecognition of the hedged item, cash
flow hedge accounting ceases, the cumulative gains or losses
are amortised to the Income Statement over the remaining term
of the original hedge.

Notes to the Financial Statements
Commonwealth Bank of Australia Financial Report (U.S. Version) 2009 49
Note 1 Accounting Policies (continued)
Net Investment Hedges
Hedges of net investments in overseas subsidiaries are
accounted for in a manner similar to cash flow hedges. Any gain
or loss on the hedging instrument relating to the effective portion
of the hedge is recognised in the Foreign Currency Translation
Reserve (“FCTR”) and the gain or loss relating to the ineffective
portion is immediately recognised in the Income Statement.
Gains and losses accumulated in the FCTR are transferred to
the Income Statement when the overseas subsidiary is disposed
of.
Embedded derivatives
A derivative may be embedded within a host contract. If the host
contract is not already measured at fair value with changes in
fair value reported in the Income Statement, and where the
economic characteristics and risks of the embedded derivative
are not closely related to the economic characteristics and risks
of the host contract, the embedded derivative is separated from
the host contract and accounted for as a stand-alone derivative
instrument at fair value.
(gg) Commitments to extend credit, letters of credit,
guarantees, warranties and indemnities issued
Contingent liabilities are possible obligations whose existence
will be confirmed only by uncertain future events, or present
obligations where the transfer of economic benefit is uncertain or
cannot be reliably measured. Contingent liabilities are not
recognised, but are disclosed, unless they are remote.
Financial guarantees are given to banks, financial institutions
and other bodies on behalf of customers to secure loans,
overdrafts and other banking facilities, and to other parties in
connection with the performance of customers under obligations
related to contracts, advance payments made by other parties,
tenders, retentions and the payment of import duties.
Financial guarantee contracts are initially recognised at fair
value.
Subsequent to initial recognition, financial guarantees are
measured at the higher of the initial measurement amount, less
amortisation calculated to recognise fee income earned, and the
best estimate of the expenditure required to settle any financial
obligation at the Balance Sheet date.
Any increase in the liability relating to financial guarantees is
recognised in the Income Statement. Any liability remaining is
recognised in the Income Statement when the guarantee is
discharged, cancelled or expires.
(hh) Life and general insurance business
Life Insurance business
The Group‟s life insurance business is comprised of insurance
contracts and investment contracts as defined by AASB 4.
Insurance contracts are accounted for in accordance with the
requirements of AASB 1038. Investment contracts are
accounted for as financial instruments with a separate
management services element in accordance with AASB 118,
139 and 1038. Details are set out below.
All assets, liabilities, revenues, expenses and equity are
recognised irrespective of whether they are designated as
relating to policyholders or to shareholders.
All assets backing insurance liabilities are classified as Assets at
fair value through Income Statement. They are measured at fair
value based on quoted bid prices or using appropriate valuation
techniques.
Life insurance contract liabilities are measured at the net present
value of future receipts from and payments to policyholders
using a risk free discount rate (or expected fund earning rate
where benefits are contractually linked to the asset
performance), and are calculated in accordance with the
principles of Margin on Services (“MoS”) profit reporting as set
out in Prudential Standard LPS 1.04 – Valuation of Policy
Liabilities (“LPS 1.04”) issued by APRA.
Life investment contract liabilities are measured at fair value in
accordance with AASB 139 as Liabilities at fair value through
Income Statement.
Returns on all investments controlled by life insurance entities
within the Group are recognised as revenues. Investments in the
Group‟s own equity instruments held within the life insurance
statutory funds and other funds are treated as Treasury Shares
in accordance with Note 1 (ee) Shareholders‟ equity.
Initial entry fee income on investment contracts issued by life
insurance entities is recognised upfront where the Group
provides financial advice. Other entry fees are deferred and
recognised over the life of the underlying investment contract.
Participating benefits vested in relation to the financial year,
other than transfers from unvested policyholder benefits
liabilities, are recognised as expenses.
Reinsurance contracts entered into are recognised on a gross
basis.
Premiums and claims
Premiums and claims are separated on a product basis into their
revenue, expense and change in liability components unless the
separation is not practicable or the components cannot be
reliably measured.
(i) Life insurance contracts
Premiums received for providing services and bearing risks are
recognised as revenue. Premiums with a regular due date are
recognised as revenue on a due and receivable basis.
Premiums with no due date are recognised on a cash received
basis. Insurance contract claims are recognised as an expense
when a liability has been established.
(ii) Investment contracts
Premiums received include the fee portion of the premium
recognised as revenue over the period the underlying service is
provided and the deposit portion recognised as an increase in
investment contract liabilities. Premiums with no due date are
recognised on a cash received basis.
Fees earned for managing the funds invested are recognised as
revenue. Claims under investment contracts represent
withdrawals of investment deposits and are recognised as a
reduction in investment contract liabilities.
Life insurance liabilities and profit
Life insurance contract policy liabilities are calculated in a way
that allows for the systematic release of planned profit margins
as services are provided to policyowners and the revenues
relating to those services are received. Selected profit carriers
including premiums and anticipated policy payments are used to
determine profit recognition.
Investment assets are held in excess of those required to meet
life insurance contract and investment contract liabilities.
Investment earnings are directly influenced by market conditions
and as such this component of profit varies from year to year.

Notes to the Financial Statements
50 Commonwealth Bank of Australia Financial Report (U.S. Version) 2009
Note 1 Accounting Policies (continued)
Participating policies
Life insurance contract policy liabilities attributable to
participating policies include the value of future planned
shareholder profit margins and an allowance for future
supportable bonuses.
The value of supportable bonuses and planned shareholder
profit margins account for all profit on participating policies based
on best estimate assumptions.
Under the “Margin on Services” profit recognition methodology,
the value of supportable bonuses and the shareholder profit
margin relating to a reporting year will emerge as planned profits
in that year.
Life insurance contract acquisition costs
Acquisition costs for life insurance contracts include the fixed
and variable costs of acquiring new business. These costs are
effectively deferred through the determination of life insurance
contract liabilities at the balance date to the extent that they are
deemed recoverable from the expected future profits of an
amount equivalent to the deferred cost.
Deferred acquisition costs are amortised over the expected life
of the life insurance contract.
Life investment contract acquisition costs
Acquisition costs for investment contracts include the variable
costs of acquiring new business. However, the deferral of
investment contract acquisition costs is limited by the application
of AASB 118 to the extent that only incremental transaction
costs (for example commissions and volume bonuses) are
deferred. The investment contract liability calculated in
accordance with AASB 139 is no less than the contract
surrender value.
Managed fund units on issue – held by minority unitholders
The life insurance statutory funds and other funds include
controlling interests in trusts and companies, and the total
amounts of each underlying asset, liability, revenue and
expense of the controlled entities are recognised in the Group‟s
consolidated Financial Statements.
When a controlled unit trust is consolidated, the share of the unit
holder liability attributable to the Bank is eliminated but amounts
due to external unitholders remain as liabilities in the Group‟s
consolidated Balance Sheet. The share of the net assets of
controlled companies attributable to minority unit holders is
disclosed separately on the Balance Sheet.
In the Income Statement, the net profit or loss of the controlled
entities relating to minority interests is eliminated before arriving
at the net profit or loss attributable to Equity holders of the Bank.
General Insurance Business
Premium revenue
Premium revenue comprises amounts charged to policyholders,
including fire service levies, but excludes taxes collected on
behalf of third parties. The earned portion of premiums received
and receivable is recognised as revenue. Premium revenue is
earned from the date of attachment of risk and over the term of
the policies written, based on assessment of the likely pattern in
which risk will emerge. The portion not earned as determined by
the above methods is recognised as unearned premium liability.
Unearned Premium Liability
The adequacy of the unearned premium liability is assessed by
considering current estimates of all expected future cash flows
relating to future claims covered by current insurance contracts.
If the present value of the expected future cash flows relating to
future claims, plus the additional risk margin to reflect the
inherent uncertainty in the estimate, exceeds the unearned
premium liability less related deferred acquisition costs, then the
unearned premium liability is deemed deficient. Any deficiency is
recognised immediately in the Income Statement as an
expense, both gross and net of reinsurance. The deficiency is
recognised by writing down any related deferred acquisition
costs, with any excess being recorded on the Balance Sheet as
an unexpired risk liability.
Reinsurance
Premium ceded to reinsurers is recognised as an expense from
the attachment date over the period of indemnity of the
reinsurance contract, in accordance with the pattern of
reinsurance service received. Accordingly, a portion of outwards
reinsurance premium is treated at the Balance Sheet date as
deferred reinsurance.
Claims expense
Claims expense and a liability for outstanding claims are
recognised in respect of all business. The liability covers claims
reported but not yet paid, incurred but not reported claims
("IBNR") and the anticipated direct and indirect costs of settling
those claims. The liability for outstanding claims is determined
having regard to an independent actuarial assessment. The
liability is measured as the estimate of the present value of the
expected future payments against claims incurred at the
Balance Sheet date, with an additional risk margin to allow for
the inherent uncertainty in the estimate. These payments are
estimated on the basis of the ultimate cost of settling claims,
which is affected by factors arising during the period to
settlement, such as inflation. The expected future payments are
discounted to present value at the Balance Sheet date using
market-determined, risk-adjusted discount rates.
A risk margin is applied to the outstanding claims liability,
sufficient to ensure the probability of adequacy of the liabilities to
a 75% confidence level.
Acquisition costs
Acquisition costs include brokerage and other selling and
underwriting costs incurred in obtaining general insurance
premiums. A portion of acquisition costs relating to unearned
premium revenue is recognised as an asset. Deferred
acquisition costs are amortised over the financial years expected
to benefit from the expenditure and are stated at the lower of
cost and recoverable value.
(ii) Asset securitisation
The Group conducts an asset securitisation program through
which it packages and sells assets as securities to investors.
The Group is entitled to any residual income of the program after
all payments due to investors and costs of the program have
been met. Therefore the Group is considered to hold the
majority of the residual risks and benefits within the entities
through which asset securitisation is conducted and so it
consolidates these entities.
Liabilities associated with asset securitisation entities and related
issue costs are accounted for on an amortised cost basis using
the effective interest method. Interest rate swaps and liquidity
facilities are provided at arm‟s length to the program by the
Group in accordance with APRA Prudential Guidelines.
Derivatives return the risks and rewards of ownership of the
securitised assets to the Group and consequently the Group
cannot derecognise these assets. An imputed liability is
recognised inclusive of the derivative and any related fees.
For further details on the treatment of securitisation entities, refer
to Note 1 (c) Consolidation.
Note 1 Accounting Policies (continued)

Notes to the Financial Statements
Commonwealth Bank of Australia Financial Report (U.S. Version) 2009 51
(jj) Fiduciary activities
The Bank and designated controlled entities act as Responsible
Entity, Trustee and/or Manager for a number of wholesale,
superannuation and investment funds, trusts and approved
deposit funds.
The assets and liabilities of these trusts and funds are not
included in the consolidated Financial Statements as the Group
does not have direct or indirect control of the trusts and funds.
Commissions and fees earned in respect of the activities are
included in the Income Statement of the Group.
(kk) Comparative figures
Where necessary, comparative figures have been adjusted to
conform with changes in presentation in these Financial
Statements.
(ll) Roundings
The amounts contained in this Financial Report and the
Financial Statements are presented in Australian Dollars and
have been rounded to the nearest million dollars unless
otherwise stated, under the option available to the company
under ASIC Class Order 98/100 (as amended by ASIC Class
Order 04/667).
(mm) Critical accounting policies and estimates
These Notes to the Financial Statements contain a summary of
the Group‟s significant accounting policies. Certain of these
policies are considered to be more important in the
determination of the Group‟s financial position, since they
require management to make difficult, complex or subjective
judgements, some of which may relate to matters that are
inherently uncertain. These decisions are reviewed by the Board
Audit Committee.
These policies include judgements as to levels of provisions for
impairment for loan balances, actuarial assumptions in
determining life insurance policy liabilities and determining
whether certain entities should be consolidated. An explanation
of these policies and the related judgements and estimates
involved is set out below.
Provisions for impairment
Provisions for impairment of financial assets are raised where
there is objective evidence of impairment and at an amount
adequate to cover assessed credit related losses. In addition,
provisions are raised where there is no observable evidence of
impairment, but for which a loss event has occurred which is
likely to result in a loss.
Credit losses arise primarily from loans but also from other credit
instruments such as bank acceptances, contingent liabilities,
guarantees and other financial instruments and assets acquired
through security enforcement.
Individually assessed provisions
Individually assessed provisions are raised where there is
objective evidence of impairment and full recovery of principal is
considered doubtful.
Individually assessed provisions are made against individual
facilities in the credit risk rated managed segment where a loss
of $10,000 or more is expected. The provisions are established
based primarily on estimates of the realisable (fair) value of
collateral taken and are measured as the difference between a
financial asset‟s carrying amount and the present value of the
expected future cash flows (excluding future credit losses that
have not been incurred), discounted at the financial asset‟s
original effective interest rate. Short term balances are not
discounted.
Collective provision
All other loans and receivables that do not have an individually
assessed provision are assessed collectively for impairment.
The collective provision is maintained to reduce the carrying
amount of portfolios of similar loans and receivables to their
estimated recoverable amounts at the Balance Sheet date.
The evaluation process is subject to a series of estimates and
judgements.
In the credit risk rated segment, the risk rating system, including
the frequency of default and loss given default rates, loss
history, and the size, structure and diversity of individual credits
are considered. Current developments in portfolios (industry,
geographic and term) are reviewed.
In the retail statistically managed segment the history of defaults
and losses, and the size, structure and diversity of portfolios are
considered.
In addition management considers overall indicators of portfolio
performance, quality and economic conditions.
Changes in these estimates could have a direct impact on the
level of provision determined.
The amount required to bring the collective provision to the level
assessed is recognised in the Income Statement as set out in
Note 14 Provisions for Impairment.
Life insurance policyholder liabilities
Life insurance policyholder liabilities are accounted for under
AASB 1038: Life Insurance Business. A significant area of
judgement is in the determination of policyholder liabilities, which
involve actuarial assumptions.
The areas of judgement where key actuarial assumptions are
made in the determination of policyholder liabilities are:
Business assumptions including:
Amount, timing and duration of claims/policy
payments;
Policy lapse rates; and
Acquisition and long term maintenance expense
levels;
Long term economic assumptions for discount and interest
rates, inflation rates and market earnings rates; and
Selection of methodology, either projection or accumulation
method. The selection of the method is generally governed
by the product type.
The determination of assumptions relies on making judgements
on variances from long-term assumptions. Where experience
differs from long term assumptions:
Recent results may be a statistical aberration; or
There may be a commencement of a new paradigm
requiring a change in long term assumptions.
The Group‟s actuaries arrive at conclusions regarding the
statistical analysis using their experience and judgement.
Additional information on the accounting policy is set out in Note
1 (hh) Life and General Insurance Business, and Note 36 Life
Insurance Business details the key actuarial assumptions.
Consolidation of special purpose entities
The Group assesses whether a special purpose entity should be
consolidated based on the risks and rewards of each entity and
whether the majority pass to the Group. Such assessments are
predominately required in the context of the Group‟s
securitisation program and structured transactions.

Notes to the Financial Statements
52 Commonwealth Bank of Australia Financial Report (U.S. Version) 2009
Note 2 Profit
Profit before income tax has been determined as follows:
Group Bank
2009 2008 2007 2009 2008
$M $M $M $M $M
Interest Income
Loans and bills discounted 28,438 25,598 20,711 22,136 21,369
Other financial institutions 434 474 443 391 423
Cash and liquid assets 510 473 483 397 427
Assets at fair value through Income Statement 1,236 1,933 1,495 1,024 1,409
Available-for-sale investments 901 756 730 2,835 880
Controlled entities - - - 1,208 1,077
Total interest income 31,519 29,234 23,862 27,991 25,585
Interest Expense
Deposits 14,216 12,393 8,995 14,199 12,168
Other financial institutions 509 989 674 403 903
Liabilities at fair value through Income Statement 1,021 1,129 1,087 163 217
Debt issues 4,767 6,024 5,506 3,565 4,241
Controlled entities - - - 898 1,295
Loan capital 705 792 564 728 843
Total interest expense 21,218 21,327 16,826 19,956 19,667
Net interest income 10,301 7,907 7,036 8,035 5,918
Other Operating Income
Loan service fees:
From financial assets 1,351 933 873 1,085 860
Other 45 43 23 40 43
Commission and other fees:
From financial liabilities 531 507 501 429 413
Other 1,496 1,320 1,228 1,115 959
Trading income 741 546 555 592 504
Net (loss)/gain on available-for-sale investments recognised in Income
Statement (12) 309 138 24 272
Net (loss)/gain on other non-trading instruments (9) (1) 9 (111) (36)
Net hedging ineffectiveness (18) (58) 30 (28) (33)
Net (loss)/gain on other financial instruments:
Fair value through Income Statement (66) (9) 65 1 (26)
Reclassification of net interest on swaps (275) (265) (107) (92) 73
Non-trading derivatives (187) 37 (98) (21) 44
Dividends - Controlled entities - - - 820 1,636
Dividends - Other 14 39 3 43 31
Net loss on sale of property, plant and equipment (11) (15) (15) (9) (14)
Funds management and investment contract income:
Fees receivable on trust and other fiduciary activities 1,291 1,835 1,449 - -
Other 199 528 522 - -
Insurance contracts income 769 740 1,043 - -
Other 314 173 136 263 1,060
Total other operating income 6,173 6,662 6,355 4,151 5,786
Total net operating income 16,474 14,569 13,391 12,186 11,704
Gain on acquisition of controlled entities (Note 49) 983 - - - -
Impairment expense
Loan impairment expense 2,683 930 434 2,338 902
Available-for-sale debt securities impairment expense 365 - - 365 -
Total impairment expense (Note 14) 3,048 930 434 2,703 902

Notes to the Financial Statements
Commonwealth Bank of Australia Financial Report (U.S. Version) 2009 53
Note 2 Profit (continued)
Group Bank
2009 2008 2007 2009 2008
$M $M $M $M $M
Staff Expenses
Salaries and wages 3,405 3,097 2,746 2,281 2,278
Share-based compensation 125 106 89 89 102
Superannuation contributions 44 14 8 (28) (28)
Provisions for employee entitlements 88 90 61 68 72
Payroll tax 188 162 139 137 129
Fringe benefits tax 36 32 34 30 28
Other staff expenses 94 160 152 69 108
Total staff expenses 3,980 3,661 3,229 2,646 2,689
Occupancy and Equipment Expenses
Operating lease rentals 488 403 367 394 345
Depreciation:
Buildings 29 27 22 26 26
Leasehold improvements 85 63 59 68 52
Equipment 89 84 73 55 54
Operating lease assets 37 20 22 18 11
Repairs and maintenance 80 81 71 65 74
Other 102 89 74 61 54
Total occupancy and equipment expenses 910 767 688 687 616
Information Technology Services
Application, maintenance and development 167 224 304 136 195
Data processing 202 195 206 197 195
Desktop 141 114 119 137 114
Communications 179 174 168 142 148
Amortisation of software assets 122 88 62 88 76
IT equipment depreciation 62 31 24 51 28
Total information technology services 873 826 883 751 756
Other Expenses
Postage 121 119 109 98 102
Stationery 100 98 104 71 70
Fees and commissions:
Fees payable on trust and other fiduciary activities 453 538 402 - -
Other 359 280 289 622 565
Advertising, marketing and loyalty 475 348 326 375 273
Amortisation of intangible assets (excluding software) 17 15 8 - 1
Non-lending losses 86 78 97 79 66
Other 391 291 292 143 90
Total other expenses 2,002 1,767 1,627 1,388 1,167
Investment and restructuring
Integration expenses (1) 112 - - 35 -
Merger related amortisation 37 - - - -
One-off expenses 32 - - 32 -
Investment and restructuring - 377 - - 365
Total investment and restructuring 181 377 - 67 365
Total operating expenses 7,946 7,398 6,427 5,539 5,593
Defined benefit superannuation plan (expense)/income (14) 14 8 (14) 14
Profit before income tax 6,449 6,255 6,538 3,930 5,223
Net hedging ineffectiveness comprises:
Gain/(Loss) on fair value hedges:
Hedging instruments 543 921 285 480 937
Hedged items (569) (970) (271) (510) (971)
Cash flow hedge ineffectiveness 8 (9) 16 2 1
Net hedging ineffectiveness (18) (58) 30 (28) (33)
(1) Includes software impairment (refer to Note 19).

Notes to the Financial Statements
54 Commonwealth Bank of Australia Financial Report (U.S. Version) 2009
Note 3 Income from Ordinary Activities
Group Bank
2009 2008 2007 2009 2008
$M $M $M $M $M
Banking
Interest income 31,519 29,234 23,862 27,991 25,585
Fees and commissions 3,423 2,803 2,625 2,669 2,275
Trading income 741 546 555 592 504
Net (loss)/gain on available-for-sale investments recognised in Income
Statement (12) 309 138 24 272
Net (loss)/gain on other non-trading instruments (9) (1) 9 (111) (36)
Net hedging ineffectiveness (18) (58) 30 (28) (33)
Net (loss)/ gain on other financial instruments:
Fair value through Income Statement (66) (9) 65 1 (26)
Reclassification of net interest on swaps (275) (265) (107) (92) 73
Non-trading derivatives (187) 37 (98) (21) 44
Dividends 14 39 3 863 1,667
Net loss on sale of property, plant and equipment (11) (15) (15) (9) (14)
Other 314 173 136 263 1,060
35,433 32,793 27,203 32,142 31,371
Funds Management, Investment contract and Insurance
contract revenue
Funds management and investment contract income including premiums1,618 2,369 1,871 - -
Insurance contract premiums and related income 1,651 1,373 1,117 - -
Funds management claims and policyholder liability revenue 731 519 - - -
Investment income - - 2,978 - -
4,000 4,261 5,966 - -
Total income 39,433 37,054 33,169 32,142 31,371

Notes to the Financial Statements
Commonwealth Bank of Australia Financial Report (U.S. Version) 2009 55
Note 4 Average Balances and Related Interest The overseas component comprises overseas branches of the
Bank and overseas domiciled controlled entities.
Non-accrual loans are included in interest earning assets under
loans, bills discounted and other receivables.
The official cash rate in Australia decreased by 425 basis points
during the year while rates in New Zealand decreased by a total
of 575 basis points.
The following table lists the major categories of interest earning
assets and interest bearing liabilities of the Group together with the
respective interest earned or paid and the average interest rate for
each of the years ended 30 June 2009, 30 June 2008 and 30 June
2007. Averages used were predominantly daily averages. Interest
is accounted for based on product yield, while all trading gains and
losses are disclosed as Trading income within Other operating
income.
Where assets or liabilities are hedged, the amounts are shown net
of the hedge, however individual items not separately hedged may
be affected by movements in exchange rates.
2009 2008 2007
Average Interest Average Average Interest Average Average Interest Average
Average Interest Earning Balance Rate Balance Rate Balance Rate
Assets and Income $M $M % $M $M % $M $M %
Cash and liquid assets
Australia 8,353 324 3. 9 3,930 238 6. 1 5,648 322 5. 7
Overseas 6,683 186 2. 8 4,101 235 5. 7 2,608 161 6. 2
Receivables due from other financial
institutions
Australia 9,205 227 2. 5 5,403 242 4. 5 3,089 170 5. 5
Overseas 7,238 207 2. 9 3,700 232 6. 3 4,581 273 6. 0
Assets at fair value through Income
Statement - Trading
Australia 17,614 922 5. 2 20,127 1,388 6. 9 15,458 1,075 7. 0
Overseas 4,378 231 5. 3 3,186 245 7. 7 2,818 210 7. 5
Assets at fair value through Income
Statement - Other
Australia 799 3 0. 4 383 27 7. 0 430 29 6. 7
Overseas 2,507 80 3. 2 4,813 273 5. 7 3,013 181 6. 0
Available-for-sale investments
Australia 10,553 628 6. 0 6,017 402 6. 7 4,932 315 6. 4
Overseas 7,831 273 3. 5 6,182 354 5. 7 6,944 415 6. 0
Loans, bills discounted and other
receivables
Australia (1) 344,534 23,098 6. 7 273,124 20,047 7. 3 234,022 16,016 6. 8
Overseas 61,553 4,584 7. 4 54,701 4,463 8. 2 48,949 3,686 7. 5
Intragroup loans
Australia - - - - - - - - -
Overseas 12,023 158 1. 3 8,144 295 3. 6 8,199 404 4. 9
Average interest earning assets and
interest income including intragroup 493,271 30,921 6. 3 393,811 28,441 7. 2 340,691 23,257 6. 8
Intragroup eliminations (12,023) (158) 1. 3 (8,144) (295) 3. 6 (8,199) (404) 4. 9
Total average interest earning
assets and interest income(2) 481,248 30,763 6. 4 385,667 28,146 7. 3 332,492 22,853 6. 9
Securitisation home loan assets 12,279 742 6. 0 13,427 1,088 8. 1 13,344 1,009 7. 6
(1) Excludes amortisation of acquisition related fair value adjustments made to fixed interest financial instruments.
(2) Used for calculating net interest margin.

Notes to the Financial Statements
56 Commonwealth Bank of Australia Financial Report (U.S. Version) 2009
Note 4 Average Balances and Related Interest (continued)
2009 2008 2007
Average Average Average
Balance Balance Balance
Average Non-Interest Earning Assets $M $M $M
Bank acceptances
Australia 16,983 19,735 18,779
Overseas - - -
Assets at fair value through Income Statement - Insurance
Australia 17,370 17,896 19,352
Overseas 2,316 2,634 2,680
Property, plant and equipment
Australia 1,744 1,242 1,075
Overseas 199 192 165
Other assets
Australia 48,487 28,182 19,951
Overseas 9,393 8,093 5,675
Provisions for impairment
Australia (2,492) (1,219) (1,132)
Overseas (299) (111) (96)
Total average non-interest earning assets 93,701 76,644 66,449
Total average assets 587,228 475,738 412,285
Percentage of total average assets applicable to overseas operations (%) 17. 3 18. 4 18. 8

Notes to the Financial Statements
Commonwealth Bank of Australia Financial Report (U.S. Version) 2009 57
Note 4 Average Balances and Related Interest (continued)
2009 2008 2007
Average Interest Bearing Average Interest Average Average Interest Average Average Interest Average
Liabilities, Loan Capital Balance Rate Balance Rate Balance Rate
and Interest Expense $M $M % $M $M % $M $M %
Time deposits
Australia (1) 133,587 8,398 6. 3 92,297 5,985 6. 5 67,186 4,107 6. 1
Overseas 30,249 1,625 5. 4 21,364 1,353 6. 3 18,406 1,018 5. 5
Savings deposits
Australia (1) 69,775 1,574 2. 3 46,472 1,468 3. 2 40,930 1,016 2. 5
Overseas 6,132 289 4. 7 4,759 324 6. 8 4,703 313 6. 7
Other demand deposits
Australia (1) 74,928 2,256 3. 0 71,525 2,947 4. 1 62,401 2,314 3. 7
Overseas 4,347 213 4. 9 4,501 316 7. 0 3,563 227 6. 4
Payables due to other financial
institutions
Australia 4,974 160 3. 2 5,748 290 5. 0 2,628 153 5. 8
Overseas 13,871 349 2. 5 13,658 699 5. 1 9,724 521 5. 4
Liabilities at fair value through
Income Statement
Australia 3,831 159 4. 2 3,124 197 6. 3 3,881 292 7. 5
Overseas 13,595 862 6. 3 11,893 932 7. 8 11,312 795 7. 0
Debt issues
Australia (1) 64,309 3,624 5. 6 57,440 4,234 7. 4 57,403 3,537 6. 2
Overseas 20,763 417 2. 0 16,929 822 4. 9 18,835 1,075 5. 7
Loan capital
Australia (1) 9,455 507 5. 4 8,781 566 6. 4 8,357 410 4. 9
Overseas 3,642 202 5. 5 3,758 226 6. 0 1,907 154 8. 1
Intragroup borrowings
Australia 12,023 158 1. 3 8,144 295 3. 6 8,199 404 4. 9
Overseas - - - - - - - - -
Average interest bearing liabilities and
loan capital and interest expense including
intragroup 465,481 20,793 4. 5 370,393 20,654 5. 6 319,435 16,336 5. 1
Intragroup eliminations (12,023) (158) 1. 3 (8,144) (295) 3. 6 (8,199) (404) 4. 9
Total average interest bearing
liabilities and loan capital and
interest expense 453,458 20,635 4. 6 362,249 20,359 5. 6 311,236 15,932 5. 1
Securitisation debt issues 12,842 684 5. 3 14,005 968 6. 9 13,861 894 6. 4
(1) Excludes amortisation of acquisition related fair value adjustments made to fixed interest financial instruments.
2009 2008 2007
Average Average Average
Balance Balance Balance
Average Non-Interest Bearing Liabilities $M $M $M
Deposits not bearing interest
Australia 5,940 6,132 5,896
Overseas 1,438 1,545 1,473
Liabilities on bank acceptances
Australia 16,983 19,735 18,779
Overseas - - -
Insurance policy liabilities
Australia 16,510 19,185 20,100
Overseas 1,766 2,296 2,344
Other liabilities
Australia 42,939 18,538 8,439
Overseas 6,163 6,647 7,399
Total average non-interest bearing liabilities 91,739 74,078 64,430
Total average liabilities and loan capital 558,039 450,332 389,527
Shareholders' equity 29,189 25,406 22,758
Total average liabilities, loan capital and Shareholders' equity 587,228 475,738 412,285
Total average liabilities and loan capital applicable to overseas operations (%) 18.3 19.4 20.5

Notes to the Financial Statements
58 Commonwealth Bank of Australia Financial Report (U.S. Version) 2009
Note 4 Average Balances and Related Interest (continued)
Avg Bal Interest Yield Avg Bal Interest Yield
Net interest margin $M $M % $M $M %
Total interest earning assets excluding securitisation 481,248 30,763 6. 39 385,667 28,146 7. 30
Total interest bearing liabilities excluding securitisation 453,458 20,635 4. 55 362,249 20,359 5. 62
Net interest income and interest spread (excluding
securitisation) 10,128 1. 84 7,787 1. 68
Benefit of free funds 0. 26 0. 34
Net interest margin 2. 10 2. 02
Full Year Ended 30/06/09 Full Year Ended 30/06/08
Geographical analysis of key categories
Avg Bal Interest Yield Avg Bal Interest Yield
$M $M % $M $M %
Loans, bills discounted and other receivables
Australia 344,534 23,098 6. 70 273,124 20,047 7. 34
Overseas 61,553 4,584 7. 45 54,701 4,463 8. 16
Total 406,087 27,682 6. 82 327,825 24,510 7. 48
Non-lending interest earning assets
Australia 46,524 2,104 4. 52 35,860 2,297 6. 41
Overseas 28,637 977 3. 41 21,982 1,339 6. 09
Total 75,161 3,081 4. 10 57,842 3,636 6. 29
Total interest bearing deposits
Australia 278,290 12,228 4. 39 210,294 10,400 4. 95
Overseas 40,728 2,127 5. 22 30,624 1,993 6. 51
Total 319,018 14,355 4. 50 240,918 12,393 5. 14
Other interest bearing liabilities
Australia 82,569 4,450 5. 39 75,093 5,287 7. 04
Overseas 51,871 1,830 3. 53 46,238 2,679 5. 79
Total 134,440 6,280 4. 67 121,331 7,966 6. 57
Full Year Ended 30/06/09 Full Year Ended 30/06/08
The overseas component comprises overseas branches of the
Bank and overseas domiciled controlled entities. Overseas
intragroup borrowings have been adjusted into the interest
spread and margin calculations to more appropriately reflect the
overseas cost of funds. Non–accrual loans were included in
interest earning assets under loans, bills discounted and other
receivables.
In calculating net interest margin, assets, liabilities, interest income
and interest expense related to securitisation vehicles have been
excluded. This has been done to more accurately reflect the
Group‟s underlying net margin.
Year Ended
2009 vs 2008 2008 vs 2007
Increase/(Decrease) Increase/(Decrease)
Change in net interest income $M $M
Due to changes in average volume of interest earning assets 1,971 1,090
Due to changes in interest margin 370 (224)
Change in net interest income 2,341 866

Notes to the Financial Statements
Commonwealth Bank of Australia Financial Report (U.S. Version) 2009 59
Note 4 Average Balances and Related Interest (continued)
June 2009 vs June 2008 June 2008 vs June 2007
Changes in Net Interest Income: Volume Rate Total Volume Rate Total
Volume and Rate Analysis $M $M $M $M $M $M
Interest Earning Assets
Cash and liquid assets
Australia 220 (134) 86 (101) 17 (84)
Overseas 110 (159) (49) 89 (15) 74
Receivables due from other financial institutions
Australia 132 (147) (15) 115 (43) 72
Overseas 162 (187) (25) (54) 13 (41)
Assets at fair value through Income Statement - Trading
Australia (152) (314) (466) 323 (10) 313
Overseas 77 (91) (14) 28 7 35
Assets at fair value through Income Statement - Other
Australia 15 (39) (24) (3) 1 (2)
Overseas (102) (91) (193) 105 (13) 92
Available-for-sale investments
Australia 286 (60) 226 71 16 87
Overseas 76 (157) (81) (45) (16) (61)
Loans, bills discounted and other receivables
Australia 5,014 (1,963) 3,051 2,773 1,258 4,031
Overseas 535 (414) 121 451 326 777
Intragroup loans
Australia - - - - - -
Overseas 96 (233) (137) (2) (107) (109)
Changes in interest income including intragroup 6,709 (4,229) 2,480 3,731 1,453 5,184
Intragroup eliminations (96) 233 137 2 107 109
Changes in interest income 6,543 (3,926) 2,617 3,768 1,525 5,293
Securitisation home loan assets (81) (265) (346) 7 72 79
Interest Bearing Liabilities and Loan Capital
Time deposits
Australia 2,637 (224) 2,413 1,582 296 1,878
Overseas 520 (248) 272 175 160 335
Savings deposits
Australia 631 (525) 106 156 296 452
Overseas 79 (114) (35) 4 7 11
Other demand deposits
Australia 121 (812) (691) 357 276 633
Overseas (9) (94) (103) 63 26 89
Payables due to other financial institutions
Australia (32) (98) (130) 170 (33) 137
Overseas 8 (358) (350) 206 (28) 178
Liabilities at fair value through Income Statement
Australia 37 (75) (38) (52) (43) (95)
Overseas 121 (191) (70) 43 94 137
Debt issues
Australia 447 (1,057) (610) 3 694 697
Overseas 132 (537) (405) (101) (152) (253)
Loan capital
Australia 40 (99) (59) 24 132 156
Overseas (7) (17) (24) 130 (58) 72
Intragroup borrowings
Australia 96 (233) (137) (2) (107) (109)
Overseas - - - - - -
Changes in interest expense including intragroup 4,775 (4,636) 139 2,724 1,594 4,318
Intragroup eliminations (96) 233 137 2 107 109
Changes in interest expense 4,638 (4,362) 276 2,739 1,688 4,427
Changes in net interest income 1,971 370 2,341 1,090 (224) 866
Securitisation debt issues (71) (213) (284) 10 64 74

Notes to the Financial Statements
60 Commonwealth Bank of Australia Financial Report (U.S. Version) 2009
Note 4 Average Balances and Related Interest (continued)
Changes in Net Interest Income: Volume and Rate Analysis Volume and rate variance for total interest earning assets and
interest bearing liabilities have been calculated separately
(rather than being the sum of the individual categories). The preceding table shows the movement in interest income and
expense due to changes in volume and interest rates. Volume
variances reflect the change in interest from the prior year due to
movement in the average balance. Rate variance reflects the
change in interest from the prior year due to changes in interest
rates.
Group
2009 2008 2007
Geographical analysis of key categories % % %
Australia
Interest spread (1) 1. 93 1. 79 1. 93
Benefit of interest-free liabilities, provisions and equity (2) 0. 21 0. 27 0. 23
Net interest margin (3) 2. 14 2. 06 2. 16
Overseas
Interest spread (1) 1. 32 1. 11 0. 92
Benefit of interest-free liabilities, provisions and equity (2) 0. 40 0. 57 0. 68
Net interest margin (3) 1. 72 1. 68 1. 60
Group
Interest spread (1) 1. 84 1. 68 1. 75
Benefit of interest-free liabilities, provisions and equity (2) 0. 26 0. 34 0. 33
Net interest margin (3) 2. 10 2. 02 2. 08
(1) Difference between the average interest rate earned and the average interest rate paid on funds.
(2) A portion of the Group‟s interest earning assets are funded by net interest free liabilities and Shareholders‟ equity. The benefit to the Group of these interest free funds
is the amount it would cost to replace them at the average cost of funds.
(3) Net interest income divided by average interest earning assets for the year.

Notes to the Financial Statements
Commonwealth Bank of Australia Financial Report (U.S. Version) 2009 61
Note 5 Income Tax Expense
Group Bank
2009 2008 2007 2009 2008
$M $M $M $M $M
Profit from ordinary activities before Income Tax
Retail Banking Services 2,996 2,687 2,522 n/a n/a
Business and Private Banking (1) 1,024 974 - n/a n/a
Institutional Banking and Markets (1) (17) 909 - n/a n/a
Premium Business Services (1) - - 1,905 n/a n/a
Wealth Management 170 991 1,090 n/a n/a
International Financial Services 613 767 678 n/a n/a
Bankwest 189 - - n/a n/a
Other 1,474 (73) 343 n/a n/a
6,449 6,255 6,538 3,930 5,223
Prima Facie Income Tax at 30%
Retail Banking Services 899 806 757 n/a n/a
Business and Private Banking (1) 307 292 - n/a n/a
Institutional Banking and Markets (1) (5) 273 - n/a n/a
Premium Business Services (1) - - 571 n/a n/a
Wealth Management 51 297 327 n/a n/a
International Financial Services 184 231 204 n/a n/a
Bankwest 57 - - n/a n/a
Other 442 (22) 103 n/a n/a
1,935 1,877 1,962 1,179 1,567
Tax effect of expenses that are non-deductible/income
non-assessable in determining taxable profit:
Current period
Taxation offsets and other dividend adjustments (59) (65) (55) (249) (479)
Tax adjustment referable to policyholder income (115) (81) 186 - -
Bankwest - Discount on acquisition 76 - - - -
Tax losses recognised - (89) (24) - (87)
Tax losses assumed by the Bank under UIG 1052 - - - (14) (72)
Difference in overseas tax rates (55) (35) (27) (19) (21)
Offshore banking unit (56) (16) (16) (56) (16)
Investment allowance (28) - - (14) -
Other (7) (36) 35 44 76
(244) (322) 99 (308) (599)
Prior periods
Other (2) 5 (122) (20) (27) (103)
Total income tax expense 1,696 1,433 2,041 844 865
Income Tax Attributable to Profit from ordinary activities
Retail Banking Services 889 805 756 n/a n/a
Business and Private Banking (1) 288 280 - n/a n/a
Institutional Banking and Markets (1) (160) 128 - n/a n/a
Premium Business Services (1) - - 463 n/a n/a
Wealth Management 111 318 275 n/a n/a
International Financial Services 139 168 150 n/a n/a
Bankwest 67 - - n/a n/a
Other 526 (151) 131 n/a n/a
Corporate tax expense 1,860 1,548 1,775 844 865
Policyholder tax (benefit)/expense (164) (115) 266 - -
Total income tax expense 1,696 1,433 2,041 844 865
% % % % %
Effective Tax Rate
Total - corporate 28. 1 24. 3 28. 3 21. 5 16. 6
Retail Banking Services - corporate 29. 7 30. 0 30. 0 n/a n/a
Business and Private Banking - corporate (1) 28. 1 28. 7 - n/a n/a
Institutional Banking and Markets - corporate (1) large 14. 1 - n/a n/a
Premium Business Services - corporate (1) - - 24. 3 n/a n/a
Wealth Management - corporate 30. 1 28. 5 33. 3 n/a n/a
International Financial Services - corporate 24. 0 22. 2 22. 2 n/a n/a
Bankwest - corporate 35. 4 - - n/a n/a (1) The Premium Business Services division was restructured into Business and Private Banking and Institutional Banking and Markets during the year. 2007
comparatives for the newly formed businesses were not available.
(2) The 2008 year prior period tax expense arose primarily due to the resolution of long outstanding tax issues with the tax authorities.

Notes to the Financial Statements
62 Commonwealth Bank of Australia Financial Report (U.S. Version) 2009
Note 5 Income Tax Expense (continued)
Group Bank
2009 2008 2007 2009 2008
$M $M $M $M $M
Recognised in the Income Statement
Australia
Current tax expense 2,265 1,522 2,209 1,628 854
Deferred tax benefit (886) (326) (390) (900) (22)
Total Australia 1,379 1,196 1,819 728 832
Overseas
Current tax expense 201 127 141 121 32
Deferred tax expense/(benefit) 116 110 81 (5) 1
Total Overseas 317 237 222 116 33
Total income tax expense 1,696 1,433 2,041 844 865
Group Bank
2009 2008 2007 2009 2008
$M $M $M $M $M
The significant temporary differences are as follows:
Deferred tax assets arising from:
Provision for employee benefits 338 294 288 295 268
Provisions for impairment on loans, bills discounted and other receivables 1,336 523 371 889 476
Other provisions not tax deductible until expense incurred 243 192 136 139 175
Recognised value of tax losses carried forward 6 6 8 5 6
Financial instruments 691 162 170 488 113
Other 425 171 316 195 54
Total deferred tax assets (before set off) 3,039 1,348 1,289 2,011 1,092
Set off of tax (1) (1,386) (1,272) (1,035) (383) (1,038)
Net deferred tax assets 1,653 76 254 1,628 54
Deferred tax liabilities arising from:
Property asset revaluations 51 59 55 51 59
Lease financing 299 287 330 112 105
Defined benefit superannuation plan surplus 138 461 544 138 461
Intangible assets 176 24 10 - -
Financial instruments 605 437 482 82 378
Other 285 270 522 40 54
Total deferred tax liabilities (before set off) 1,554 1,538 1,943 423 1,057
Set off of tax (1) (1,386) (1,272) (1,035) (383) (1,038)
Net deferred tax liabilities (Note 25) 168 266 908 40 19
Deferred tax assets opening balance: 76 254 48 54 25
Movement in temporary differences during the year:
Provisions for employee benefits 44 6 27 27 6
Provisions for impairment on loans, bills discounted and other receivables 813 152 21 413 150
Other provisions not tax deductible until expense incurred 51 56 (10) (36) 68
Recognised value of tax losses carried forward - (2) (1) (1) (2)
Financial instruments 529 (8) (25) 375 (43)
Other 254 (145) 19 141 (64)
Set off of tax (1) (114) (237) 175 655 (86)
Deferred tax assets closing balance 1,653 76 254 1,628 54
Deferred tax liabilities opening balance: 266 908 734 19 91
Movements in temporary differences during the year:
Property asset revaluations (8) 4 26 (8) 4
Lease financing 12 (43) 18 7 (5)
Defined benefit superannuation plan surplus (323) (83) 176 (323) (83)
Intangible assets 152 14 - - -
Financial instruments 168 (45) (144) (296) 88
Other 15 (252) (77) (14) 10
Set off of tax (1) (114) (237) 175 655 (86)
Deferred tax liabilities closing balance (Note 25) 168 266 908 40 19
(1) Deferred tax assets and liabilities are set off where they relate to income tax levied by the same taxation authority on either the same taxable entity or different taxable
entities within the same taxable group.

Notes to the Financial Statements
Commonwealth Bank of Australia Financial Report (U.S. Version) 2009 63
Note 5 Income Tax Expense (continued)
Group Bank
2009 2008 2007 2009 2008
$M $M $M $M $M
Deferred tax assets not taken to account
Tax losses and other temporary differences on revenue account 100 35 40 100 28
Tax losses on capital account - - 130 - -
Closing balance 100 35 170 100 28
Group Bank
Expiration of deferred tax assets not taken to 2009 2008 2007 2009 2008
account $M $M $M $M $M
At Balance Sheet date carry-forward losses expire as follows:
From one to two years - 2 3 - -
From two to four years 1 4 9 1 2
After four years 99 22 25 99 19
Losses that do not expire under current tax legislation - 7 133 - 7
Total 100 35 170 100 28
Potential deferred tax assets of the Group arose from:
Capital losses arising under the tax consolidations system;
and
Tax losses and temporary differences in offshore centres.
These deferred assets have not been recognised because it is
not considered probable that future taxable profit will be available
against which they can be realised.
These potential tax benefits will only be obtained if:
The company derives future capital gains and assessable
income of a nature and of an amount sufficient to enable the
benefit from the losses to be realised;
The company continues to comply with the conditions for
claiming capital losses and deductions imposed by tax
legislation; and
No changes in tax legislation adversely affect the company
in realising the benefit from deductions for the losses.
Tax Consolidation
Tax consolidation legislation has been enacted to allow
Australian resident entities to elect to consolidate and be treated
as single entities for Australian tax purposes. The
Commonwealth Bank of Australia elected to be taxed as a single
entity with effect from 1 July 2002.

Notes to the Financial Statements
64 Commonwealth Bank of Australia Financial Report (U.S. Version) 2009
Note 6 Dividends
Group Bank
2009 2008 2007 2009 2008
$M $M $M $M $M
Ordinary Shares
Interim ordinary dividend (fully franked) (2009: 113 cents, 2008:
113 cents, 2007: 107 cents)
Interim ordinary dividend paid - cash component only 1,257 1,087 862 1,257 1,087
Interim ordinary dividend paid - dividend reinvestment plan 405 400 518 405 400
Total dividend paid 1,662 1,487 1,380 1,662 1,487
Other Equity Instruments
Dividends paid 57 48 55 - -
Total dividends provided for, reserved or paid 1,719 1,535 1,435 1,662 1,487
Other provision carried 18 5 7 18 5
Dividends proposed and not recognised as a liability (fully franked) (2009:
115 cents, 2008: 153 cents, 2007: 149 cents) (1) 1,747 2,029 1,939 1,747 2,029
Provision for dividends
Opening balance 5 6 6 5 7
Provision made during year 3,691 3,425 3,048 3,691 3,425
Provision used during year (3,678) (3,426) (3,048) (3,678) (3,427)
Closing balance (Note 26) 18 5 6 18 5
(1) The 2009 final dividend is expected to be satisfied by cash disbursements of $1,240 million and the estimated issue of $507 million of ordinary shares through the
Dividend Reinvestment Plan (“DRP”). The 2008 final dividend was satisfied by cash disbursements of $1,335 million and the issue of $694 million of ordinary shares
through the DRP. The 2007 final dividend was satisfied by cash disbursements of $1,229 million and the issue of $709 million of ordinary shares through the DRP.
Dividend Franking Account
After fully franking the final dividend to be paid for the year
ended 30 June 2009, the amount of credits available, at the
30% tax rate as at 30 June 2009 to frank dividends for
subsequent financial years, is $758 million (2008: $495 million).
This figure is based on the combined franking accounts of the
Bank at 30 June 2009, which have been adjusted for franking
credits that will arise from the payment of income tax payable on
profits for the year ended 30 June 2009, franking debits that will
arise from the payment of dividends proposed for the year and
franking credits that the Bank may be prevented from
distributing in subsequent financial periods.
The Bank expects that future tax payments will generate sufficient
franking credits for the Bank to be able to continue to fully frank
future dividend payments. These calculations have been based
on the taxation law as at 30 June 2009.
Dividend History
Half-year Full Year DRP
Payout Payout DRP Participation
Cents Per Ratio (1)
Ratio (1)
Price Rate (2)
Half Year Ended Share Date Paid % % $ %
31 December 2006 107 05/04/2007 63. 8 - 50.02 37.6
30 June 2007 149 03/10/2007 86. 1 75.2 54.80 36.6
31 December 2007 113 02/04/2008 63. 4 - 39.44 33.5
30 June 2008 153 01/10/2008 84. 6 74.1 42.41 34.3
31 December 2008 113 23/03/2009 65. 3 - 28.45 24.4
30 June 2009 (3) 115 - 82. 4 73.1 - -
(1) Dividend Payout Ratio: dividends divided by statutory earnings.
(2) DRP Participation Rate: the percentage of total issued share capital participating in the Dividend Reinvestment Plan.
(3) Dividend expected to be paid on 1 October 2009.

Notes to the Financial Statements
Commonwealth Bank of Australia Financial Report (U.S. Version) 2009 65
Note 7 Earnings Per Share
Group
2009 2008 2007
Earnings per Ordinary Share
Basic 328. 5 363. 0 344. 7
Fully diluted 313. 4 348. 7 339. 7
$M $M $M
Reconciliation of earnings used in calculation of earnings per share
Profit after income tax 4,753 4,822 4,497
Less: Other equity instrument dividends (57) (48) (55)
Less: Minority interests (30) (31) (27)
Earnings used in calculation of basic earnings per share 4,666 4,743 4,415
Add: Profit impact of assumed conversions
Loan capital 187 222 150
Earnings used in calculation of fully diluted earnings per share 4,853 4,965 4,565
Cents per share
Number of Shares
2009 2008 2007
M M M
Weighted average number of ordinary shares (net of treasury shares) used in the calculation
of basic earnings per share 1,420 1,307 1,281
Effect of dilutive securities - share options and convertible loan capital instruments 128 118 62
Weighted average number of ordinary shares (net of treasury shares) used in the calculation of fully
diluted earnings per share (1) 1,548 1,424 1,344
(1) Figures presented in this table have been rounded.
Basic earnings per share amounts are calculated by dividing net
profit for the year attributable to ordinary equity holders of the
Bank by the weighted average number of ordinary shares
outstanding during the year.
Diluted earnings per share amounts are calculated by dividing
net profit attributable to ordinary equity holders of the Bank (after
deducting interest on the convertible redeemable loan capital
instruments) by the weighted average number of ordinary
shares outstanding during the year (adjusted for the effects of
dilutive options and dilutive convertible non-cumulative
redeemable loan capital instruments).
Note 8 Cash and Liquid Assets
Group Bank
2009 2008 2009 2008
$M $M $M $M
Australia
Notes, coins and cash at banks 1,997 1,512 1,690 1,298
Money at short call 1 1 - -
Securities purchased under agreements to resell 3,426 3,227 3,426 3,227
Bills received and remittances in transit 85 101 122 84
Total Australia 5,509 4,841 5,238 4,609
Overseas
Notes, coins and cash at banks 1,758 964 508 46
Money at short call 3,014 1,207 2,909 1,034
Securities purchased under agreements to resell 1,031 724 1,029 1,593
Bills received and remittances in transit 28 - - -
Total Overseas 5,831 2,895 4,446 2,673
Total cash and liquid assets 11,340 7,736 9,684 7,282

Notes to the Financial Statements
66 Commonwealth Bank of Australia Financial Report (U.S. Version) 2009
Note 9 Receivables Due from Other Financial Institutions
Group Bank
2009 2008 2009 2008
$M $M $M $M
Australia
Placements with and loans to other financial institutions 8,590 4,880 8,482 4,880
Total Australia 8,590 4,880 8,482 4,880
Overseas
Deposits with regulatory authorities (1) 44 61 5 3
Other placements with and loans to other financial institutions 5,787 2,043 5,499 1,848
Total Overseas 5,831 2,104 5,504 1,851
Total receivables from other financial institutions 14,421 6,984 13,986 6,731
(1) Required by law for the Group to operate in certain regions.
The majority of the above amounts are expected to be recovered within twelve months of the Balance Sheet date.
Note 10 Assets at Fair Value through Income Statement (1)
Group Bank
2009 2008 2009 2008
$M $M $M $M
Trading 25,401 21,676 20,988 19,168
Insurance 17,260 20,650 - -
Other 1,677 3,266 60 274
Total assets at fair value through Income Statement 44,338 45,592 21,048 19,442
(1) In addition to Asset classification of Fair Value through Income Statement, the Group also measures bills discounted intended to be sold into the market at fair value,
which are classified within Loans, bills discounted and other receivables (refer to Note 13).
Group Bank
2009 2008 2009 2008
Trading $M $M $M $M
Australia
Market Quoted: (1)
Australian Public Securities
Commonwealth and States 1,515 565 1,515 565
Local and semi-government 2,238 1,478 2,238 1,478
Bills of exchange 747 1,237 747 1,237
Certificates of deposit 13,691 11,673 13,691 11,673
Medium term notes 780 1,518 780 1,518
Other securities 80 261 75 261
Non-Market Quoted:
Medium term notes - 348 - 348
Commercial paper 451 1,377 451 1,377
Other securities 700 - 700 -
Total Australia 20,202 18,457 20,197 18,457
Overseas
Market Quoted: (1)
Government securities 2,407 823 528 453
Eurobonds 45 92 45 92
Certificates of deposit 1,543 1,425 - -
Medium term notes - 571 - -
Floating rate notes 210 250 210 166
Commercial paper - 56 - -
Other securities 6 2 - -
Non-Market Quoted:
Government securities 70 - - -
Medium term notes 853 - - -
Floating rate notes 35 - - -
Other securities 30 - 8 -
Total Overseas 5,199 3,219 791 711
Total trading assets 25,401 21,676 20,988 19,168
(1) Market quoted comprises financial instruments with either quoted prices or quoted rates.
The above amounts are expected to be recovered within twelve months of the Balance Sheet date.

Notes to the Financial Statements
Commonwealth Bank of Australia Financial Report (U.S. Version) 2009 67
Note 10 Assets at Fair Value through Income Statement (continued)
Investments Investments Investments Investments
Backing Life Backing Life Backing Life Backing Life
Risk Investment Risk Investment
Contracts Contracts Total Contracts Contracts Total
2009 2009 2009 2008 2008 2008
Insurance $M $M $M $M $M $M
Equity Security Investments:
Direct 219 110 329 523 1,650 2,173
Indirect 551 4,700 5,251 936 4,919 5,855
Total equity security investments 770 4,810 5,580 1,459 6,569 8,028
Debt Security Investments:
Direct 922 263 1,185 723 1,400 2,123
Indirect 2,741 5,325 8,066 2,335 5,361 7,696
Total debt security investments 3,663 5,588 9,251 3,058 6,761 9,819
Property Investments:
Direct 64 15 79 102 112 214
Indirect 345 863 1,208 525 804 1,329
Total property investments 409 878 1,287 627 916 1,543
Other Assets 153 989 1,142 70 1,190 1,260
Total life insurance investment assets 4,995 12,265 17,260 5,214 15,436 20,650
Of the above amounts $2,670 million is expected to be recovered within twelve months of the Balance Sheet date (30 June 2008: $4,114
million).
Direct investments refer to positions held directly in the issuer of
the investment. Indirect investments refer to investments that are
held through unit trusts or similar investment vehicles.
Disclosure on Asset Restriction
Investments held in the Australian statutory funds may only be
used within the restrictions imposed under the Life Insurance Act
1995.
The main restrictions are that assets in a fund may only be used
to meet the liabilities and expenses of the fund, to acquire
investments to further the business of the fund, or as distributions
when solvency and capital adequacy requirements are met.
Participating policyholders can receive a distribution when
solvency requirements are met, whilst shareholders can only
receive a distribution when the higher levels of capital adequacy
requirements are met.
All financial assets within the life statutory funds have been
determined to back either life insurance or life investment
contracts.
These investment assets held in the statutory funds are not
available for use by the Commonwealth Bank‟s operating
businesses.
The Group also holds investments in the Colonial First State
Property Trust Group and Colonial Mastertrust Wholesale funds
(including Fixed Interest, Australian Shares, International
Shares, Property Securities, Capital Stable, Balanced and
Diversified Growth funds) through controlled life insurance
entities, which have been designated as assets at fair value
through Income Statement instead of being accounted for under
the equity accounting method.
Instead, these investments are brought to account at fair value
at Balance Sheet date in compliance with the requirements of
AASB 1038: Life Insurance Business.
Group Bank
2009 2008 2009 2008
$M $M $M $M
Fair value structured transactions 552 1,980 - 274
Receivables due from financial institutions 909 318 - -
Term loans 156 948 - -
Other lending 60 20 60 -
Total other assets at fair value through Income Statement 1,677 3,266 60 274
Other (1)
(1) Designated at Fair Value through Income Statement at inception as they are managed by the Group on a fair value basis.
Of the above amounts $1,416 million is expected to be recovered within twelve months of the Balance Sheet date by the Group (30
June 2008: $2,308 million), and all of the above amounts are expected to be recovered within twelve months of the Balance Sheet
date by the Bank.
The change in fair value of loans and receivables designated at Fair Value through Income Statement due to changes in credit risk for
the Group resulted in a loss of $18 million for the year (30 June 2008: insignificant), and is insignificant for the Bank for the years
ending 30 June 2008 and 30 June 2009. The cumulative change in fair value due to changes in credit risk for the Group and the Bank
is consistent with the combined amounts disclosed for the period, as changes prior to 30 June 2008 did not have a material impact on
the Group or the Bank.

Notes to the Financial Statements
68 Commonwealth Bank of Australia Financial Report (U.S. Version) 2009
Note 11 Derivative Assets and Liabilities
Derivative contracts
Each derivative is classified as held for “Trading”, held for
“Hedging”, or as “Other” derivatives. Derivatives classified as
Trading are derivative transactions entered in order to meet
customers‟ needs and to undertake market-making and
positioning activities. Derivatives classified as Hedging are
derivative transactions entered into in order to manage the risks
arising from non-traded assets, liabilities and commitments in
Australia and offshore centres. Other derivatives are those held
in relation to a portfolio designated at fair value through Income
Statement.
Derivatives transacted for hedging purposes
The Group enters into derivative transactions which are
designated and qualify as either fair value or cash flow hedges
for recognised assets or liabilities or forecast transactions.
Forward Foreign Exchange transactions are also designated as
hedges of currency translation risk of net investments in foreign
operations. The Group also enters into derivative transactions
which provide economic hedges for risk exposures but do not
meet the accounting requirements for hedge accounting
treatment. As stated in Note 1 (ff) Derivative financial
instruments, the Group uses Credit Default Swaps (CDSs) and
equity swaps as economic hedges to manage credit risk in the
asset portfolio and risks associated with both the capital
investment in equities and the related yield respectively, but
cannot apply hedge accounting to such positions. Gains or
losses on these CDSs and equity swaps have therefore been
recorded in trading income.
Derivatives designated and accounted for as hedging
instruments
The Group‟s accounting policies for derivatives designated and
accounted for as hedging instruments are explained in Note 1
(ff) Derivative financial instruments where terms used in the
following sections are explained.
Fair value hedges
The Group‟s fair value hedges principally consist of interest rate
swaps, cross currency swaps and futures. Fair value hedges are
used to limit the Group‟s exposure to changes in the fair value of
its fixed-rate interest earning assets and interest bearing
liabilities that are due to interest rate or foreign exchange
volatility.
For the year ended 30 June 2009, the Group recognised a net
loss of $26 million (2008: $49 million net loss) (reported within
other operating income in the Financial Statements), which
represents the ineffective portion of fair value hedges.
As at 30 June 2009, the fair value of outstanding derivatives
designated as fair value hedges was $2,003 million (2008:
$1,381 million) of assets and $1,283 million (2008: $1,674
million) of liabilities.
Cash flow hedges
The Group uses interest rate swaps and cross currency swaps
to minimise the variability in cash flows of interest-earning
assets, interest-bearing liabilities or forecast transactions caused
by interest rate or foreign exchange fluctuations. For the year
ended 30 June 2009, there has been no material gain or loss
associated with ineffective portions of cash flow hedges.
Gains and losses on derivative contracts designated as cash
flow hedges are initially recorded in shareholders‟ equity but are
reclassified to current period earnings when the hedged cash
flows occur, as explained in Note 1 (ff) Derivative financial
instruments. As at 30 June 2009, deferred net losses on
derivative instruments designated as cash flow hedges
accumulated in shareholders‟ equity were $1,167 million (2008:
$486 million deferred net gains). The amount recognised in
shareholders‟ equity at 30 June 2009 related to cash flows
expected to occur within one month to approximately 30 years of
the Balance Sheet date, with the main portion expected to occur
within five years (refer to Note 31 Detailed Statements of
Changes in Equity).
As at 30 June 2009, the fair value of outstanding derivatives
designated as cash flow hedges was $1,293 million (2008:
$1,169 million) of assets and $2,591 million (2008: $711 million)
of liabilities. Amounts reclassified from gains/(losses) on cash
flow hedging instruments recognised in equity to current period
earnings due to discontinuation of hedge accounting were
immaterial.
Net Investment Hedges
The Group uses forward foreign exchange transactions to
minimise the Group‟s exposure to currency translation risk of
some of its net investments in foreign operations. For the year
ended 30 June 2009 there has been no material gain or loss
associated with ineffective portions of net investment hedges.
Gains and losses on derivative contracts relating to the effective
portion of the hedge are recognised in the Foreign Currency
Translation Reserve. Gains and losses accumulated in Foreign
Currency Translation Reserve are reclassified in current period
earnings when the overseas subsidiary is disposed of as
explained in Note 1 (ff) Derivative financial instruments.

Notes to the Financial Statements
Commonwealth Bank of Australia Financial Report (U.S. Version) 2009 69
Note 11 Derivative Assets and Liabilities (continued)
Group
2009 2008
Face Value Fair Value Fair Value Face Value Fair Value Fair Value
Asset Liability Asset Liability
$M $M $M $M $M $M
Derivative Assets and Liabilities
Held for trading 1,308,695 21,499 (25,989) 1,205,981 15,233 (16,791)
Held for hedging 182,170 3,296 (3,877) 155,095 2,550 (2,385)
Other derivatives 82,868 1,563 (2,268) 65,381 449 (365)
Total derivative assets/(liabilities) 1,573,733 26,358 (32,134) 1,426,457 18,232 (19,541)
Derivatives held for trading
Exchange rate related contracts:
Forward contracts 339,368 4,656 (6,891) 228,440 2,962 (4,367)
Swaps 316,280 8,531 (11,755) 129,152 4,609 (5,183)
Futures 94 3 - - - -
Options purchased and sold 25,038 466 (465) 35,610 544 (473)
Total exchange rate related contracts 680,780 13,656 (19,111) 393,202 8,115 (10,023)
Interest rate related contracts:
Forward contracts 35,343 5 (16) 22,228 2 (3)
Swaps 456,146 6,738 (6,146) 482,920 5,869 (5,795)
Futures 71,923 3 - 238,944 - (9)
Options purchased and sold 49,222 591 (401) 55,267 256 (350)
Total interest rate related contracts 612,634 7,337 (6,563) 799,359 6,127 (6,157)
Credit related contracts:
Swaps 8,035 295 (130) 6,958 142 (93)
Total credit related contracts 8,035 295 (130) 6,958 142 (93)
Equity related contracts:
Swaps 521 5 (1) 586 181 (30)
Options purchased and sold 2,279 12 (84) 2,839 10 (62)
Total equity related contracts 2,800 17 (85) 3,425 191 (92)
Commodity related contracts:
Swaps 2,305 189 (91) 1,436 523 (295)
Futures 24 - - - - -
Options purchased and sold 2,117 5 (9) 1,601 135 (131)
Total commodity related contracts 4,446 194 (100) 3,037 658 (426)
Total derivative assets/(liabilities) held for
trading 1,308,695 21,499 (25,989) 1,205,981 15,233 (16,791)
The majority of derivative assets and liabilities held for trading are expected to be recovered or settled within twelve months of the
Balance Sheet date. The majority of derivative assets and liabilities held for hedging and other derivative assets and liabilities are
expected to be recovered or settled after twelve months of the Balance Sheet date.

Notes to the Financial Statements
70 Commonwealth Bank of Australia Financial Report (U.S. Version) 2009
Note 11 Derivative Assets and Liabilities (continued)
Group
2009 2008
Face Value Fair Value Fair Value Face Value Fair Value Fair Value
Asset Liability Asset Liability
$M $M $M $M $M $M
Derivatives designated as fair value hedges
Exchange rate related contracts:
Forward contracts 153 1 (2) 137 1 -
Swaps 18,278 1,385 (846) 12,800 831 (871)
Total exchange rate related contracts 18,431 1,386 (848) 12,937 832 (871)
Interest rate related contacts:
Swaps 22,205 606 (379) 22,156 544 (749)
Futures 5,281 4 - - - -
Total interest rate related contracts 27,486 610 (379) 22,156 544 (749)
Equity related contracts:
Swaps 644 7 (56) 593 5 (54)
Total equity related contracts 644 7 (56) 593 5 (54)
Commodity related contracts:
Swaps 3 - - 16 - -
Total commodity related contracts 3 - - 16 - -
Total fair value hedges 46,564 2,003 (1,283) 35,702 1,381 (1,674)
Derivatives designated as cash flow hedges
Exchange rate related contracts:
Swaps 12,375 41 (77) 1,261 28 (2)
Total exchange rate related contracts 12,375 41 (77) 1,261 28 (2)
Interest rate related contacts:
Swaps 123,202 1,252 (2,514) 118,132 1,141 (709)
Total interest rate related contracts 123,202 1,252 (2,514) 118,132 1,141 (709)
Total cash flow hedges 135,577 1,293 (2,591) 119,393 1,169 (711)
Derivatives designated as net investment
hedges
Exchange rate related contracts:
Forward contracts 29 - (3) - - -
Total exchange rate related contracts 29 - (3) - - -
Total net investment hedges 29 - (3) - - -
Total derivative assets/(liabilities) held for
hedging 182,170 3,296 (3,877) 155,095 2,550 (2,385)

Notes to the Financial Statements
Commonwealth Bank of Australia Financial Report (U.S. Version) 2009 71
Note 11 Derivative Assets and Liabilities (continued)
Group
2009 2008
Face Value Fair Value Fair Value Face Value Fair Value Fair Value
Asset Liability Asset Liability
$M $M $M $M $M $M
Other Derivatives
Exchange rate related contracts:
Forward contracts 7,404 66 (482) 8,356 129 (17)
Swaps 4,050 61 (182) 3,071 49 (48)
Options purchased and sold 30 - (1) 12 - -
Total exchange rate related contracts 11,484 127 (665) 11,439 178 (65)
Interest rate related contacts:
Forward contracts 4,508 2 - 11,148 1 (2)
Swaps 54,167 1,298 (1,467) 34,329 224 (260)
Futures 11,507 1 (2) 7,032 1 (2)
Options purchased and sold 397 2 (1) 568 1 -
Total interest rate related contracts 70,579 1,303 (1,470) 53,077 227 (264)
Credit related contracts:
Swaps 803 133 (133) 818 37 (33)
Total credit related contracts 803 133 (133) 818 37 (33)
Equity related contracts:
Futures - - - 9 - -
Options purchased and sold - - - 37 7 (3)
Total equity related contracts - - - 46 7 (3)
Commodity related contracts:
Forward contracts 2 - - 1 - -
Total commodity related contracts 2 - - 1 - -
Total other derivatives 82,868 1,563 (2,268) 65,381 449 (365)
Total recognised derivative assets/(liabilities) 1,573,733 26,358 (32,134) 1,426,457 18,232 (19,541)

Notes to the Financial Statements
72 Commonwealth Bank of Australia Financial Report (U.S. Version) 2009
Note 11 Derivative Assets and Liabilities (continued)
Bank
2009 2008
Face Value Fair Value Fair Value Face Value Fair Value Fair Value
Asset Liability Asset Liability
$M $M $M $M $M $M
Derivative Assets and Liabilities
Held for trading 1,412,095 22,494 (26,321) 1,227,719 16,906 (17,189)
Held for hedging 158,908 3,042 (3,116) 127,093 2,376 (2,177)
Other derivatives 41 - (5) 439 5 (1)
Total derivative assets/(liabilities) 1,571,044 25,536 (29,442) 1,355,251 19,287 (19,367)
Derivatives held for trading
Exchange rate related contracts:
Forward contracts 339,222 4,651 (6,888) 228,440 2,963 (4,367)
Swaps 312,335 8,457 (11,498) 128,317 4,552 (5,053)
Futures 94 3 - - - -
Options purchased and sold 25,037 466 (465) 35,610 543 (473)
Derivatives held with controlled entities 92,511 890 (371) 16,679 1,605 (392)
Total exchange rate related contracts 769,199 14,467 (19,222) 409,046 9,663 (10,285)
Interest rate related contracts:
Forward contracts 35,343 5 (16) 22,228 2 (3)
Swaps 449,710 6,692 (6,081) 484,452 5,911 (5,799)
Futures 71,923 3 - 238,944 - (9)
Options purchased and sold 48,965 588 (401) 55,290 256 (350)
Derivatives held with controlled entities 21,770 233 (288) 4,210 83 (131)
Total interest rate related contracts 627,711 7,521 (6,786) 805,124 6,252 (6,292)
Credit related contracts:
Swaps 7,931 295 (128) 6,958 142 (93)
Total credit related contracts 7,931 295 (128) 6,958 142 (93)
Equity related contracts:
Swaps 521 5 (1) 586 160 (30)
Options purchased and sold 2,279 12 (84) 2,839 10 (63)
Derivatives held with controlled entities - - - 129 22 -
Total equity related contracts 2,800 17 (85) 3,554 192 (93)
Commodity related contracts:
Swaps 2,305 189 (91) 1,436 523 (295)
Futures 24 - - - - -
Options purchased and sold 2,117 5 (9) 1,601 134 (131)
Derivatives held with controlled entities 8 - - - - -
Total commodity related contracts 4,454 194 (100) 3,037 657 (426)
Total derivative assets/(liabilities) held for
trading 1,412,095 22,494 (26,321) 1,227,719 16,906 (17,189)
The majority of derivative assets and liabilities held for trading are expected to be recovered or settled within twelve months of the Balance
Sheet date. The majority of derivative assets and liabilities held for hedging and other derivative assets and liabilities are expected to be
recovered or settled after twelve months of the Balance Sheet date.

Notes to the Financial Statements
Commonwealth Bank of Australia Financial Report (U.S. Version) 2009 73
Note 11 Derivative Assets and Liabilities (continued)
Bank
2009 2008
Face Value Fair Value Fair Value Face Value Fair Value Fair Value
Asset Liability Asset Liability
$M $M $M $M $M $M
Derivatives designated as fair value hedges
Exchange rate related contracts:
Forward contracts 19 - (2) 16 - -
Swaps 18,278 1,385 (846) 12,800 831 (871)
Total exchange rate related contracts 18,297 1,385 (848) 12,816 831 (871)
Interest rate related contacts:
Swaps 18,919 435 (320) 18,662 510 (725)
Futures 5,281 4 - - - -
Derivatives held with controlled entities 711 66 - 601 16 -
Total interest rate related contracts 24,911 505 (320) 19,263 526 (725)
Equity related contracts:
Swaps 644 7 (56) 593 5 (54)
Total equity related contracts 644 7 (56) 593 5 (54)
Commodity related contracts:
Swaps 3 - - 16 - -
Total commodity related contracts 3 - - 16 - -
Total fair value hedges 43,855 1,897 (1,224) 32,688 1,362 (1,650)
Derivatives designated as cash flow hedges
Exchange rate related contracts:
Swaps 11,462 41 (37) 35 4 -
Derivatives held with controlled entities 679 - (6) 570 - (10)
Total exchange rate related contracts 12,141 41 (43) 605 4 (10)
Interest rate related contacts:
Swaps 102,912 1,104 (1,849) 93,800 1,010 (517)
Total interest rate related contracts 102,912 1,104 (1,849) 93,800 1,010 (517)
Total cash flow hedges 115,053 1,145 (1,892) 94,405 1,014 (527)
Total derivative assets/(liabilities) held for
hedging 158,908 3,042 (3,116) 127,093 2,376 (2,177)
Bank
2009 2008
Face Value Fair Value Fair Value Face Value Fair Value Fair Value
Asset Liability Asset Liability
$M $M $M $M $M $M
Other Derivatives
Interest rate related contacts:
Swaps 38 - (5) 4 - (1)
Total interest rate related contracts 38 - (5) 4 - (1)
Credit related contracts:
Swaps 3 - - 435 5 -
Total credit related contracts 3 - - 435 5 -
Total other derivatives 41 - (5) 439 5 (1)
Total recognised derivative assets/(liabilities) 1,571,044 25,536 (29,442) 1,355,251 19,287 (19,367)

Notes to the Financial Statements
74 Commonwealth Bank of Australia Financial Report (U.S. Version) 2009
Note 12 Available-for-Sale Investments
Group Bank
2009 2008 2009 2008
$M $M $M $M
Australia
Market Quoted: (1)
Australian Public Securities:
Local and semi-government 7,152 2,981 7,152 2,905
Shares and equity investments 241 203 180 201
Medium term notes 6,575 1,873 6,575 1,873
Floating rate notes 327 399 327 -
Other securities - 8 - -
Non-Market Quoted:
Australian Public Securities:
Local and semi-government 85 - - -
Medium term notes 56 59 917 784
Shares and equity investments 18 57 7 42
Mortgage backed securities (2) 1,384 1,392 40,379 17,064
Other securities 64 192 - 90
Total Australia 15,902 7,164 55,537 22,959
Overseas
Market Quoted: (1)
Government securities 660 167 314 53
Shares and equity investments 26 33 - 1
Certificates of deposit 1,681 2,031 1,677 2,017
Eurobonds 2,771 1,403 2,771 1,403
Medium term notes 113 304 113 304
Floating rate notes 220 272 220 272
Other securities 94 87 26 58
Non-Market Quoted:
Government securities 22 25 - -
Certificates of deposit 14 - - -
Floating rate notes 1 2 1 -
Total Overseas 5,602 4,324 5,122 4,108
Total available-for-sale investments 21,504 11,488 60,659 27,067
(1) Market quoted comprises financial instruments with either quoted prices or quoted rates.
(2) Included within Mortgage backed securities of the Bank are $35,754 million (2008: $15,020 million) of residential mortgage backed securities held within securitisation
vehicles for potential repurchase by the Reserve Bank of Australia.
Of the above amounts $6,128 million is expected to be recovered within twelve months of the Balance Sheet date (30 June 2008: $3,937
million).
Revaluation of Available-for-sale investments resulted in a gain of $10 million (2008: $262 million) recognised directly in equity. As a
result of sale, derecognition or impairment of Available-for-sale investments, net loss of $13 million (2008: $312 million gain) were
removed from equity and reported in profit and loss for the year.

Notes to the Financial Statements
Commonwealth Bank of Australia Financial Report (U.S. Version) 2009 75
Note 12 Available-for-Sale Investments (continued)
Group
As at 30 June 2009
Gross Gross
Amortised Unrealised Unrealised Fair
Cost Gains Losses Value
$M $M $M $M
Australia
Australian Public Securities:
Local and semi-government 7,328 79 (170) 7,237
Medium term notes 6,604 69 (42) 6,631
Floating rate notes 343 - (16) 327
Mortgage backed securities 1,415 8 (39) 1,384
Other securities and equity investments 253 70 - 323
Total Australia 15,943 226 (267) 15,902
Overseas
Government securities 681 2 (1) 682
Certificates of deposit 1,686 9 - 1,695
Eurobonds 2,769 3 (1) 2,771
Medium term notes 113 - - 113
Floating rate notes 225 - (4) 221
Other securities and equity investments 123 - (3) 120
Total Overseas 5,597 14 (9) 5,602
Total available-for-sale investments 21,540 240 (276) 21,504
Maturity Distribution and Weighted Average Yield
Group
Maturity Period at 30 June 2009
Non-
0 to 3 months 3 to 12 months 1 to 5 years 5 to 10 years 10 or more years Maturing Total
$M % $M % $M % $M % $M % $M $M
Australia
Australian Public Securities:
Local and semi-government 151 5. 84 354 6. 25 4,264 5. 91 1,985 5. 20 483 5. 37 - 7,237
Medium term notes 131 4. 66 658 5. 06 5,649 4. 20 193 5. 21 - - - 6,631
Floating rate notes - - 100 3. 81 50 3. 81 45 3. 81 132 3. 81 - 327
Mortgage backed securities - - - - - - - - 1,384 3. 68 - 1,384
Other securities and equity
investments 64 3. 91 - - 8 0. 01 - - 4 3. 00 247 323
Total Australia 346 - 1,112 - 9,971 - 2,223 - 2,003 - 247 15,902
Overseas
Government securities 161 9. 55 325 2. 57 196 3. 87 - - - - - 682
Certificates of deposit 885 1. 00 274 0. 71 - - 536 4. 00 - - - 1,695
Eurobonds 1,021 0. 56 1,725 0. 65 25 5. 50 - - - - - 2,771
Medium term notes 41 1. 56 72 3. 61 - - - - - - - 113
Floating rate notes 6 1. 98 146 1. 06 69 2. 33 - - - - - 221
Other securities and equity
investments 35 1. 98 58 3. 25 - - - - - - 27 120
Total Overseas 2,149 - 2,600 - 290 - 536 - - - 27 5,602
Total available-for-sale
investments 2,495 - 3,712 - 10,261 - 2,759 - 2,003 - 274 21,504
Additional Disclosure
Proceeds at or close to maturity of Available-for-sale investments in 2009 were $22,189 million (2008: $31,974 million).
Proceeds from sale of Available-for-sale investments in 2009 were $4,996 million (2008: $610 million).

Notes to the Financial Statements
76 Commonwealth Bank of Australia Financial Report (U.S. Version) 2009
Note 12 Available-for-Sale Investments (continued)
Group
As at 30 June 2008
Gross Gross
Amortised Unrealised Unrealised Fair
Cost Gains Losses Value
$M $M $M $M
Australia
Australian Public Securities:
Local and semi-government 2,980 78 (77) 2,981
Medium term notes 1,979 1 (48) 1,932
Floating rate notes 399 - - 399
Mortgage backed securities 1,419 - (27) 1,392
Other securities and equity investments 402 89 (31) 460
Total Australia 7,179 168 (183) 7,164
Overseas
Government securities 191 1 - 192
Certificates of deposit 2,056 - (25) 2,031
Eurobonds 1,405 9 (11) 1,403
Medium term notes 305 1 (2) 304
Floating rate notes 280 - (6) 274
Other securities and equity investments 106 15 (1) 120
Total Overseas 4,343 26 (45) 4,324
Total available-for-sale investments 11,522 194 (228) 11,488
Maturity Distribution and Weighted Average Yield
Group
Maturity Period at 30 June 2008
Non-
0 to 3 months 3 to 12 months 1 to 5 years 5 to 10 years 10 or more years Maturing Total
$M % $M % $M % $M % $M % $M $M
Australia
Australian Public Securities:
Local and semi-government - - - - 2,844 7. 65 137 7. 37 - - - 2,981
Medium term notes - - 30 8. 23 1,758 7. 89 144 7. 68 - - - 1,932
Floating rate notes - - 399 7. 64 - - - - - - - 399
Mortgage backed securities - - - - - - - - 1,392 7. 96 - 1,392
Other securities and equity
investments
investments
4 4. 80 123 7. 00 4 - 7 3. 00 - - 322 460
Total Australia 4 - 552 - 4,606 - 288 - 1,392 - 322 7,164
Overseas
Government securities 61 5. 33 19 7. 17 112 3. 30 - - - - - 192
Certificates of deposit 1,316 4. 18 684 3. 82 31 3. 30 - - - - - 2,031
Eurobonds 332 4. 03 715 6. 36 53 3. 05 303 4. 00 - - - 1,403
Medium term notes 16 3. 25 188 7. 23 100 5. 36 - - - - - 304
Floating rate notes 12 9. 95 59 4. 78 201 4. 17 2 2. 20 - - - 274
Other securities and equity
investments
investments
- - - - 87 4. 83 - - - - 33 120
Total Overseas 1,737 - 1,665 - 584 - 305 - - - 33 4,324
Total available-for-sale
investments 1,741 - 2,217 - 5,190 - 593 - 1,392 - 355 11,488

Notes to the Financial Statements
Commonwealth Bank of Australia Financial Report (U.S. Version) 2009 77
Note 13 Loans, Bills Discounted and Other Receivables
Group Bank
2009 2008 2009 2008
$M $M $M $M
Australia
Overdrafts 17,829 20,047 16,630 20,085
Housing loans (1) 261,504 186,926 224,811 184,326
Credit card outstandings 9,055 7,555 7,960 7,555
Lease financing 4,572 4,239 1,902 1,680
Bills discounted (2) 10,936 5,868 10,936 5,868
Term loans 107,337 83,431 81,139 80,664
Other lending 1,616 1,076 879 1,076
Other securities 524 13 524 13
Total Australia 413,373 309,155 344,781 301,267
Overseas
Overdrafts 744 716 - -
Housing loans 30,702 28,817 328 164
Credit card outstandings 573 538 - -
Lease financing 541 563 93 115
Term loans 27,079 23,916 12,570 10,587
Redeemable preference share financing 744 1,194 - -
Other lending 16 25 - -
Other securities - 300 - -
Total Overseas 60,399 56,069 12,991 10,866
Gross loans, bills discounted and other receivables 473,772 365,224 357,772 312,133
Less
Provisions for Loan Impairment (Note 14):
Collective provision (3,195) (1,434) (2,060) (1,328)
Individually assessed provisions (1,729) (279) (1,020) (238)
Unearned income:
Term loans (1,134) (1,047) (885) (491)
Lease financing (1,083) (1,182) (399) (362)
(7,141) (3,942) (4,364) (2,419)
Net loans, bills discounted and other receivables 466,631 361,282 353,408 309,714
(1) The Group has entered into securitisation transactions on residential mortgage loans that do not qualify for derecognition. The Group is entitled to any residual
income of the securitisation program after all payments due to investors and costs of the program have been met, to this extent the Group retains credit and
liquidity risk. In addition, derivatives return the interest rate and foreign currency risk to the Group. The carrying value of assets that did not qualify for
derecognition for the Group were $12,568 million (2008: $11,676 million) and for the Bank were $8,083 million (2008: $10,359 million). The carrying value of
liabilities associated with non-derecognised assets for the Group were $11,724 million (2008: $9,762 million) and for the Bank were $8,083 million (2008:
$10,359 million).
(2) The Group measures bills discounted intended to be sold into the market at fair value and includes these within loans, bills discounted and other receivables to
reflect the nature of the lending arrangement.
Of the amounts above, the following amounts are expected to be recovered within 12 months of the Balance Sheet date; Group:
$121,714 million (30 June 2008: $105,074 million), Bank $97,803 million (30 June 2008: $92,205 million).
Group Bank
2009 2008 2009 2008
$M $M $M $M
Finance Leases
Minimum lease payments receivable:
Not later than one year 1,479 1,354 531 532
Later than one year but not later than five years 2,554 2,328 1,132 868
Later than five years 1,080 1,120 332 395
Lease financing 5,113 4,802 1,995 1,795

Notes to the Financial Statements
78 Commonwealth Bank of Australia Financial Report (U.S. Version) 2009
Note 13 Loans, Bills Discounted and Other Receivables (continued)
Group
Maturity Period at 30 June 2009
Maturing 1 Maturing Maturing
Year Between After
or Less 1 & 5 Years 5 Years Total
$M $M $M $M
Australia
Sovereign 248 465 826 1,539
Agriculture 2,122 1,243 1,352 4,717
Bank and other financial 5,681 2,228 1,991 9,900
Real estate:
Mortgage 30,479 18,260 212,765 261,504
Construction 1,782 1,570 720 4,072
Personal 3,505 9,766 1,877 15,148
Asset financing 2,444 4,105 1,374 7,923
Other commercial and industrial 57,730 37,013 13,827 108,570
Total Australia 103,991 74,650 234,732 413,373
Overseas
Sovereign 1,186 150 130 1,466
Agriculture 2,182 1,489 1,812 5,483
Bank and other financial 3,309 1,613 2,697 7,619
Real estate:
Mortgage 5,154 4,502 21,046 30,702
Construction 146 398 91 635
Personal 677 52 14 743
Asset financing 91 245 381 717
Other commercial and industrial 4,978 6,436 1,620 13,034
Total Overseas 17,723 14,885 27,791 60,399
Gross loans, bills discounted and other receivables 121,714 89,535 262,523 473,772
Interest Rate Sensitivity of Lending
Australia 93,298 58,853 186,792 338,943
Overseas 6,626 8,935 8,361 23,922
Total variable interest rates 99,924 67,788 195,153 362,865
Australia 10,693 15,797 47,940 74,430
Overseas 11,097 5,950 19,430 36,477
Total fixed interest rates 21,790 21,747 67,370 110,907
Gross loans, bills discounted and other receivables 121,714 89,535 262,523 473,772

Notes to the Financial Statements
Commonwealth Bank of Australia Financial Report (U.S. Version) 2009 79
Note 13 Loans, Bills Discounted and Other Receivables (continued)
Group
Maturity Period at 30 June 2008
Maturing 1 Maturing Maturing
Year Between After
or Less 1 & 5 Years 5 Years Total
$M $M $M $M
Australia
Sovereign 84 397 1,087 1,568
Agriculture 417 1,375 755 2,547
Bank and other financial 4,612 3,125 1,180 8,917
Real estate:
Mortgage 23,535 11,338 152,053 186,926
Construction 735 839 73 1,647
Personal 9,613 8,826 794 19,233
Asset financing 2,329 3,991 1,574 7,894
Other commercial and industrial 45,074 28,878 6,471 80,423
Total Australia 86,399 58,769 163,987 309,155
Overseas
Sovereign 691 329 210 1,230
Agriculture 2,326 1,148 1,340 4,814
Bank and other financial 3,312 1,344 2,087 6,743
Real estate:
Mortgage 4,076 4,151 20,590 28,817
Construction 559 14 33 606
Personal 468 40 24 532
Asset financing 67 192 289 548
Other commercial and industrial 7,176 3,805 1,798 12,779
Total Overseas 18,675 11,023 26,371 56,069
Gross loans, bills discounted and other receivables 105,074 69,792 190,358 365,224
Interest Rate Sensitivity of Lending
Australia 78,501 44,571 107,947 231,019
Overseas 14,042 4,710 5,514 24,266
Total variable interest rates 92,543 49,281 113,461 255,285
Australia 7,898 14,198 56,040 78,136
Overseas 4,633 6,313 20,857 31,803
Total fixed interest rates 12,531 20,511 76,897 109,939
Gross loans, bills discounted and other receivables 105,074 69,792 190,358 365,224

Notes to the Financial Statements
80 Commonwealth Bank of Australia Financial Report (U.S. Version) 2009
Note 14 Provisions for Impairment
Group Bank
2009 2008 2007 2009 2008
$M $M $M $M $M
Provisions for impairment losses
Collective provision
Opening balance 1,466 1,156 1,161 1,360 1,029
Acquisitions 250 - - - -
Net collective provision funding 1,176 627 316 1,083 650
Impairment losses written off (472) (381) (432) (423) (366)
Impairment losses recovered 73 77 103 65 68
Fair value and other (1) 732 (13) 8 5 (21)
Closing balance (2) 3,225 1,466 1,156 2,090 1,360
Individually assessed provisions
Opening balance 279 100 80 238 77
Acquisitions 380 - - - -
Net new and increased individual provisioning 1,686 336 134 1,388 280
Write-back of provisions no longer required (179) (33) (16) (133) (28)
Discount unwind to interest income (45) (9) (6) (29) (9)
Fair value and other (3) 279 7 (5) 79 10
Impairment losses written off (671) (122) (87) (523) (92)
Closing balance (2) 1,729 279 100 1,020 238
Total provisions for impairment losses 4,954 1,745 1,256 3,110 1,598
Less: Off balance sheet provisions (30) (32) (23) (30) (32)
Total provisions for loan impairment 4,924 1,713 1,233 3,080 1,566
(1) Group in 2009 includes fair value adjustments related to the Bankwest acquisition of $723 million of which $286 million remains at 30 June 2009.
(2) Certain comparative information has been restated to conform to presentation in the current period.
(3) Group includes fair value adjustments related to the Bankwest acquisition of $180 million, of which nil remains at 30 June 2009.
Group Bank
2009 2008 2007 2009 2008
% % % % %
Provision Ratios (1)
Collective provision as a % of gross loans and acceptances 0.66 0.38 0.34 0.56 0.41
Collective provision as a % of risk weighted assets - Basel II 1.12 0.71 n/a n/a n/a
Individually assessed provisions for impairment as a % of gross impaired
assets 41.1 40.8 23.8 40.8 40.1
Total provisions for impairment losses as a % of gross loans and
acceptances 1.01 0.46 0.37 0.83 0.47
(1) Certain comparative information has been restated to conform to presentation in the current period.

Notes to the Financial Statements
Commonwealth Bank of Australia Financial Report (U.S. Version) 2009 81
Note 14 Provisions for Impairment (continued)
Group Bank
2009 2008 2007 2009 2008
Impairment Expense $M $M $M $M $M
Loan Impairment Expense
Net collective provisioning funding 1,176 627 316 1,083 650
Net new and increased individual provisioning 1,686 336 134 1,388 280
Write-back of individually assessed provisions (179) (33) (16) (133) (28)
Total loan impairment expense 2,683 930 434 2,338 902
Available-for-sale debt securities impairment expense 365 - - 365 -
Total impairment expense 3,048 930 434 2,703 902
Individually Assessed Provisions for Impairment by Industry Category
Group
2009 2008 2007 2006 2005
$M $M $M $M $M
Australia (1)
Sovereign - - - - -
Agriculture 77 4 3 4 16
Bank and other financial 393 27 2 1 1
Real estate:
Mortgage 82 34 23 17 3
Construction 104 1 1 2 7
Personal 23 9 5 5 1
Asset Financing 31 12 13 11 13
Other commercial and industrial 760 161 39 35 41
Total Australia 1,470 248 86 75 82
Overseas
Sovereign - - - - -
Agriculture 9 - - - -
Bank and other financial 158 4 1 1 1
Real estate:
Mortgage 10 7 4 2 11
Construction - 8 - - -
Personal - 2 1 2 1
Asset Financing - 2 1 - -
Other commercial and industrial 82 8 7 - -
Total Overseas 259 31 14 5 13
Total individually assessed provisions 1,729 279 100 80 95
(1) Certain comparative information has been restated to conform to presentation in the current period.

Notes to the Financial Statements
82 Commonwealth Bank of Australia Financial Report (U.S. Version) 2009
Note 14 Provisions for Impairment (continued)
Loan Impairments Written Off by Industry Category
Group
2009 2008 2007 2006 2005
$M $M $M $M $M
Loan Impairments Written Off
Australia
Sovereign - - - - -
Agriculture 2 3 1 8 1
Bank and other financial 84 5 - 1 3
Real estate:
Mortgage 36 23 20 8 8
Construction 4 1 1 3 3
Personal 496 364 408 388 280
Asset Financing 58 49 49 42 26
Other commercial and industrial 255 34 30 36 63
Total Australia 935 479 509 486 384
Overseas
Sovereign - - - - -
Agriculture - - - - -
Bank and other financial 112 4 - - -
Real estate:
Mortgage 18 1 - - 6
Construction 4 1 - - -
Personal 14 13 7 7 -
Asset Financing - - - - -
Other commercial and industrial 60 5 3 4 1
Total Overseas 208 24 10 11 7
Gross loan impairments written off 1,143 503 519 497 391
Loan Impairments Recovered
Australia 70 73 99 122 76
Overseas 3 4 4 5 5
Total loan impairments recovered 73 77 103 127 81
Net loan impairments written off 1,070 426 416 370 310

Notes to the Financial Statements
Commonwealth Bank of Australia Financial Report (U.S. Version) 2009 83
Note 14 Provisions for Impairment (continued)
Loan Impairments Recovered by Industry Category
Group
2009 2008 2007 2006 2005
$M $M $M $M $M
Loan Impairments Recovered
Australia
Sovereign - - - - -
Agriculture 1 - 1 1 1
Bank and other financial 1 - 1 - 3
Real estate:
Mortgage 1 1 1 1 1
Construction - 1 1 - -
Personal 52 61 77 99 59
Asset Financing 5 5 10 5 5
Other commercial and industrial 10 5 8 16 7
Total Australia 70 73 99 122 76
Overseas
Sovereign - - - - -
Agriculture - - - - -
Bank and other financial - - - - -
Real estate:
Mortgage - - - - -
Construction - - - - -
Personal 3 3 4 5 4
Asset Financing - - - - -
Other commercial and industrial - 1 - - 1
Total Overseas 3 4 4 5 5
Total loan impairments recovered 73 77 103 127 81
Notes to the Financial Statements
84 Commonwealth Bank of Australia Financial Report (U.S. Version) 2009
Note 15 Credit Risk Management
Credit risk management is one of the key areas of the Group‟s
Integrated Risk Management framework. The Group maintains a
robust system of controls and processes to optimise the Group‟s
credit risk-taking activities.
Credit risk is the potential of loss arising from failure for a debtor
or counterparty to meet their contractual obligations. It arises
primarily from lending activities, the provision of guarantees
including letters of credit and commitments to lend, investments
in bonds and notes, financial markets transactions,
securitisations and other associated activities. In the insurance
business, credit risk arises from investment in bonds and notes,
loans, and from reliance on reinsurance.
Credit Risk Management Principles and Portfolio Standards
The Risk Committee of the Board operates under a Charter by
which it oversees the Group‟s credit risk management policies
and portfolio standards. These are designed to achieve portfolio
outcomes that are consistent with the Group‟s risk/return
expectations. The Committee meets at least quarterly, and more
often if required.
The Group has clearly defined credit policies for the approval
and management of credit risk. Formal credit standards apply to
all credit risks, with specific portfolio standards applying to all
major lending areas. These incorporate income/repayment
capacity, acceptable terms and security and loan documentation
tests.
The Group uses a Risk Committee approved diversified portfolio
approach for the management of credit risk concentrations
comprised of the following:
A large credit exposures policy, which sets limits for
aggregate exposures to individual, commercial and
industrial client groups;
An industry concentrations policy that defines a system of
limits for exposures by industry; and
A system of country limits for managing geographic
exposures.
Following the acquisition of Bankwest, efforts are underway to
review and, where needed, align Bankwest‟s credit policies and
procedures with those of the Group.
The Group assesses the integrity and ability of debtors or
counterparties to meet their contracted financial obligations for
repayment. Collateral security, in the form of real estate or a
floating charge over assets, is generally taken for business credit
except for major government, bank and corporate counterparties
of externally risk rated and strong financial standing. Longer
term consumer finance (e.g. housing loans) is generally secured
against real estate while short term revolving consumer credit is
generally not secured by formal collateral.
While the Group applies policies, standards and procedures in
governing the credit process, the management of credit risk also
relies on the application of judgement and the exercise of good
faith and due care of relevant staff within their delegated
authority.
A centralised exposure management system is used to record
all significant credit risks borne by the Group. The credit risk
portfolio has two major segments:
(i) Retail
This segment has sub-segments covering housing loan, credit
card, personal loan facilities, some leasing products and most
secured commercial lending up to $1 million.
Auto-decisioning for the approval of credit risk exposures is used
for eligible business and consumer applications. Auto-
decisioning uses a scorecard approach whereby the
performance of historical applications is supplemented by
information from a credit reference bureau and/or from the
Group‟s existing knowledge of a customer‟s behaviour.
Where the loan application doesn‟t meet scorecard Auto-
decisioning requirements then these may be referred to manual
decisioning.
After loan origination, these portfolios are managed using
behavioural scoring systems and on a delinquency band
approach (e.g. actions taken when loan payments are greater
than 30 days past due differ from actions when payments are
greater than 60 days past due) and are reviewed by the relevant
business credit support unit. Commercial lending up to $1 million
is reviewed as part of the Group‟s quality assurance process
and overview is provided by the independent Portfolio Quality
Assurance unit. Facilities in the Retail segment become
classified for remedial management by centralised units based
on delinquency band.
(ii) Credit Risk Rated
This segment comprises commercial exposures, including bank
and government exposures. Each exposure with commercial
content exceeding $50,000 is assigned an internal Credit Risk
Rating (CRR). The CRR is normally assessed by reference to a
matrix where the likelihood of default (PD) and the amount of
loss in the event of default (LGD) combine to determine a CRR
grade commensurate with expected loss (EL).
For credit risk exposures greater than $2 million or decisioned
outside of the scorecard approach, a PD calculator or Expert
Judgement is used.
Expert Judgement is used where the complexity of the
transaction and/or the debtor is such that it is inappropriate to
rely completely on a statistical model. Ratings by Moody‟s or
Standard and Poor‟s may be used as inputs into the Expert
Judgement assessment.
The CRR is designed to:
Aid in assessing changes to the client quality of the
Group's credit portfolio;
Influence decisions on approval, management and pricing
of individual credit facilities; and
Provide the basis for reporting details of the Group's credit
portfolio to the Australian Prudential Regulatory Authority.
CRR exposures are generally reviewed on an individual basis, at
least annually, although small transactions may be managed on
a behavioural basis after their initial rating at origination.
CRR fall within the following categories:
“Pass” – Internal CRR of 1-6, or if not individually credit risk
rated, less than 30 days past due. These credit facilities
qualify for approval of new or increased exposure on normal
commercial terms; and
“Troublesome or Impaired Assets (TIAs)” - Internal CRR of
7-9 or, if not individually credit risk rated, 30 days or more
past due. These credit facilities are not eligible for new or
increased exposure unless it will protect or improve the
Group‟s position by maximising recovery prospects or to
facilitate rehabilitation. Where a client is in default but the
facility is well secured then the facility may be classed as
troublesome but not impaired. Where a client‟s facility is not
well secured and a loss is expected, then a facility is
impaired. Facilities that have been restructured are also
classified as a sub-set of impaired.

Notes to the Financial Statements
Commonwealth Bank of Australia Financial Report (U.S. Version) 2009 85
Note 15 Credit Risk Management (continued)
Default usually consists of one or more of the following:
A contractual payment is overdue by 90 days or more;
An approved overdraft limit has been exceeded for 90 days
or more;
A credit officer becomes aware that the client will not be
able to meet future repayments or service alternative
acceptable repayment arrangements e.g. the client has
been declared bankrupt;
A credit officer has determined that full recovery of both
principal and interest is unlikely. This may be the case even
if all the terms of the client's credit facilities are currently
being met; and
A credit obligation is sold at a material credit related
economic loss.
The Portfolio Quality Assurance unit, part of Group Audit,
reviews credit portfolios and receives reports covering business
unit compliance with policies, portfolio standards, application of
credit risk ratings and other key practices and policies on a
regular basis. The Portfolio Quality Assurance unit reports its
findings to the Board Audit and Risk Committees as appropriate.
Credit Risk Measurement
The measurement of credit risk uses analytical tools to calculate
both (i) expected and (ii) unexpected loss probabilities for the
credit portfolio. The use of analytical tools is governed by a
Credit Rating Governance Committee that reviews and
endorses the use of the tools prior to their implementation to
ensure they are sufficiently predictive of risk.
(i) Expected Loss
The Expected Loss (EL) is the product of:
Probability of Default (PD);
Exposure at Default (EAD); and
Loss Given Default (LGD).
For Credit Risk Rated facilities, EL is allocated within CRR
bands. All ratings are reviewed at least annually or as specified
by the Group Chief Risk Officer.
The PD, expressed as a percentage, is the estimate of the
probability that a client will default within the next twelve months.
It reflects a client's ability to generate sufficient cash flows into
the future to meet the terms of all its credit obligations with the
Group. When assessing a client's PD, all relevant and material
information is considered. The same PD is applied to all credit
facilities provided to a client.
EAD, expressed as a percentage of the facility limit, is the
proportion of a facility that may be outstanding in the event of
default. For committed facilities such as fully drawn loans and
advances this will generally be the higher of the limit or
outstanding balance. For uncommitted facilities this will generally
be the outstanding balance only.
LGD, expressed as a percentage, is the estimated proportion of
a facility likely to be lost in the event of default. LGD is impacted
by:
Type and level of any collateral held;
Liquidity and volatility of collateral; and
Carrying costs (effectively the costs of providing a facility
that is not generating an interest return) and management
expenses (realisation costs).
Various factors are considered when calculating PD, EAD and
LGD. Considerations include the potential for default by a
borrower due to economic, management, industry and other
risks and the mitigating benefits of any collateral.
Where it is considered appropriate, the Group has policies and
procedures in place setting out the circumstances where
acceptable and appropriate collateral is to be taken to mitigate
credit risk, including valuation parameters, review frequency and
independence of valuation. In some instances, such as certain
types of consumer loans (e.g. credit cards), a client‟s facilities
may not be secured by formal collateral.
Main collateral types include:
Residential mortgages;
Charges over other properties (including commercial and
broadacre);
Cash (usually in the form of a charge over a Term Deposit);
Guarantees by company directors supporting commercial
lending;
A floating charge over a company‟s assets, including stock
and work in progress; and
A charge over stock or scrip.
(ii) Unexpected Loss
In addition to expected loss, a more stressed loss amount is
calculated. This unexpected loss estimate directly affects the
calculation of regulatory and internal economic capital
requirements (for information relating to Regulatory and
Economic Capital refer to the section on Capital Management
and Note 34 Capital Adequacy).
In addition to the credit risk management processes used to
manage exposures to credit risk in the credit portfolio, the
internal ratings process also assists management in assessing
impairment and provisioning of financial assets (refer Note 16).

Notes to the Financial Statements
86 Commonwealth Bank of Australia Financial Report (U.S. Version) 2009
Note 15 Credit Risk Management (continued)
Maximum Exposure to Credit Risk by Industry and Asset Class before Collateral Held or Other Credit Enhancements
Group
At 30 June 2009
Real
Bank Real Estate Other
Agri- & Other Estate Constr- Asset Comm &
Sovereign culture Financial Mortgage uction Personal Financing Indust. Other Total
$M $M $M $M $M $M $M $M $M $M
Cash and liquid assets - - 5,509 - - - - - - 5,509
Receivables due from other
financial institutions - - 8,590 - - - - - - 8,590
Assets at fair value through
Income Statement:
Trading 3,473 - 14,438 - - - - 2,291 - 20,202
Insurance (1) 1,631 - 5,134 - 295 - - 8,509 - 15,569
Other - 60 1 - - - - 29 - 90
Derivative assets 284 33 15,441 - 43 - - 6,372 - 22,173
Available-for-sale investments 7,237 - 1,384 - - - - 7,281 - 15,902
Loans, bills discounted and other
receivables 1,539 4,717 9,900 261,504 4,072 15,148 7,923 108,570 - 413,373
Bank acceptances 7 2,972 327 - 547 - - 10,874 - 14,727
Other assets (2) 233 66 6,674 11 13 17 141 723 11,076 18,954
Total on balance sheet
Australia 14,404 7,848 67,398 261,515 4,970 15,165 8,064 144,649 11,076 535,089
Guarantees 64 22 197 26 279 - - 2,625 296 3,509
Loan commitments 900 1,286 2,415 52,253 1,348 16,413 - 31,213 718 106,546
Other commitments 26 21 145 12 443 - 1 2,174 28 2,850
Total Australia 15,394 9,177 70,155 313,806 7,040 31,578 8,065 180,661 12,118 647,994
Cash and liquid assets - - 5,831 - - - - - - 5,831
Receivables due from other
financial institutions - - 5,831 - - - - - - 5,831
Assets at fair value through
Income Statement:
Trading 2,476 - 1,543 - - - - 1,180 - 5,199
Insurance (1) 1,370 - 321 - - - - - - 1,691
Other 228 7 1,286 - - 3 - 63 - 1,587
Derivative assets 173 77 3,408 - 3 - - 524 - 4,185
Available-for-sale investments 435 - 1,694 - - - - 3,473 - 5,602
Loans, bills discounted and other
receivables 1,466 5,483 7,619 30,702 635 743 717 13,034 - 60,399
Bank acceptances - - - - - - - 1 - 1
Other assets (2) 185 1 125 2 - - - 111 1,674 2,098
Total on balance sheet
Overseas 6,333 5,568 27,658 30,704 638 746 717 18,386 1,674 92,424
Guarantees 24 1 - - 29 - - 79 - 133
Loan commitments 159 390 74 2,936 238 1,165 - 6,380 - 11,342
Other commitments 24 1 - 133 2 - - 174 - 334
Total Overseas 6,540 5,960 27,732 33,773 907 1,911 717 25,019 1,674 104,233
Total gross credit risk 21,934 15,137 97,887 347,579 7,947 33,489 8,782 205,680 13,792 752,227
Australia Credit risk exposures relating to on balance sheet assets:
Credit risk exposures relating to off balance sheet assets:
Overseas Credit risk exposures relating to on balance sheet assets:
Credit risk exposures relating to off balance sheet assets:
(1) In most cases the credit risk of insurance assets is borne by policyholders. However, on certain insurance contracts the Group retains exposure to credit risk.
(2) Other assets predominantly comprises assets which do not give rise to credit exposure, including intangible assets, property, plant and equipment, and defined benefit
superannuation plan surplus, which are shown in “Other” for the purpose of reconciling to the Balance Sheet.

Notes to the Financial Statements
Commonwealth Bank of Australia Financial Report (U.S. Version) 2009 87
Note 15 Credit Risk Management (continued)
Maximum Exposure to Credit Risk by Industry and Asset Class before Collateral Held or Other Credit Enhancements
Group
At 30 June 2008
Real
Bank Real Estate Other
Agri- & Other Estate Constr- Asset Comm &
Sovereign culture Financial Mortgage uction Personal Financing Indust. Other Total
$M $M $M $M $M $M $M $M $M $M
Cash and liquid assets - - 4,841 - - - - - - 4,841
Receivables due from other
financial institutions - - 4,880 - - - - - - 4,880
Assets at fair value through
Income Statement:
Trading 2,043 - 12,910 - - - - 3,504 - 18,457
Insurance (1) 4,096 - 3,527 313 24 - - 10,716 - 18,676
Other - - 295 - - - - - - 295
Derivative assets 204 15 13,560 - 5 - - 2,555 - 16,339
Available-for-sale investments 2,981 - 1,419 - - - - 2,764 - 7,164
Loans, bills discounted and other
receivables 1,568 2,547 8,917 186,926 1,647 19,233 7,894 80,423 - 309,155
Bank acceptances 8 2,764 485 - 533 - - 14,488 - 18,278
Other assets (2) 20 32 1,018 2,338 21 240 99 1,405 10,647 15,820
Total on balance sheet
Australia 10,920 5,358 51,852 189,577 2,230 19,473 7,993 115,855 10,647 413,905
Guarantees 51 9 176 25 110 - - 2,335 - 2,706
Loan commitments 907 840 8,262 38,094 770 12,124 - 24,256 - 85,253
Other commitments 155 6 634 69 2,145 - - 7,689 - 10,698
Total Australia 12,033 6,213 60,924 227,765 5,255 31,597 7,993 150,135 10,647 512,562
Overseas Credit risk exposures relating to on balance sheet assets:
Cash and liquid assets - - 2,895 - - - - - - 2,895
Receivables due from other
financial institutions - - 2,104 - - - - - - 2,104
Assets at fair value through
Income Statement:
Trading 823 - 1,425 - - - - 971 - 3,219
Insurance (1) 394 - 1,070 - - - - 510 - 1,974
Other 1,069 33 1,204 - 40 29 - 596 - 2,971
Derivative assets 54 19 1,213 - - - - 607 - 1,893
Available-for-sale investments 225 - 2,031 - - - - 2,068 - 4,324
Loans, bills discounted and other
receivables 1,230 4,814 6,743 28,817 606 532 548 12,779 - 56,069
Bank acceptances - - - - - - - - - -
Other assets (2) 23 89 125 535 11 10 10 433 924 2,160
Total on balance sheet
Overseas 3,818 4,955 18,810 29,352 657 571 558 17,964 924 77,609
Guarantees - 1 1 - 25 - - 69 - 96
Loan commitments 267 360 541 2,884 195 1,141 - 6,663 - 12,051
Other commitments 41 1 86 - 2 - - 145 - 275
Total Overseas 4,126 5,317 19,438 32,236 879 1,712 558 24,841 924 90,031
Total gross credit risk 16,159 11,530 80,362 260,001 6,134 33,309 8,551 174,976 11,571 602,593
Credit risk exposures relating to off balance sheet assets:
Credit risk exposures relating to off balance sheet assets:
Australia Credit risk exposures relating to on balance sheet assets:
(1) In most cases the credit risk of insurance assets is borne by policyholders. However, on certain insurance contracts the Group retains exposure to credit risk.
(2) Other assets predominantly comprises assets which do not give rise to credit exposure, including intangible assets, property, plant and equipment, and defined benefit
superannuation plan surplus, which are shown in “Other” for the purpose of reconciling to the Balance Sheet.
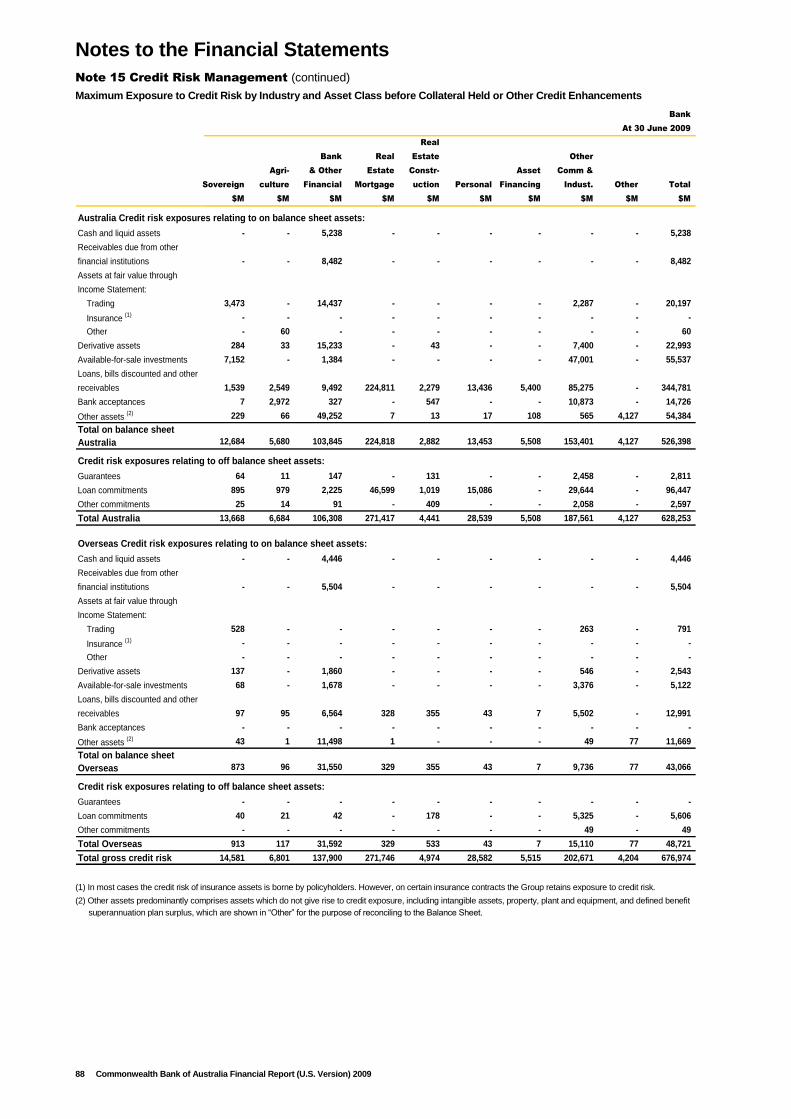
Notes to the Financial Statements
88 Commonwealth Bank of Australia Financial Report (U.S. Version) 2009
Note 15 Credit Risk Management (continued)
Maximum Exposure to Credit Risk by Industry and Asset Class before Collateral Held or Other Credit Enhancements
Bank
At 30 June 2009
Real
Bank Real Estate Other
Agri- & Other Estate Constr- Asset Comm &
Sovereign culture Financial Mortgage uction Personal Financing Indust. Other Total
$M $M $M $M $M $M $M $M $M $M
Cash and liquid assets - - 5,238 - - - - - - 5,238
Receivables due from other
financial institutions - - 8,482 - - - - - - 8,482
Assets at fair value through
Income Statement:
Trading 3,473 - 14,437 - - - - 2,287 - 20,197
Insurance (1) - - - - - - - - - -
Other - 60 - - - - - - - 60
Derivative assets 284 33 15,233 - 43 - - 7,400 - 22,993
Available-for-sale investments 7,152 - 1,384 - - - - 47,001 - 55,537
Loans, bills discounted and other
receivables 1,539 2,549 9,492 224,811 2,279 13,436 5,400 85,275 - 344,781
Bank acceptances 7 2,972 327 - 547 - - 10,873 - 14,726
Other assets (2) 229 66 49,252 7 13 17 108 565 4,127 54,384
Total on balance sheet
Australia 12,684 5,680 103,845 224,818 2,882 13,453 5,508 153,401 4,127 526,398
Guarantees 64 11 147 - 131 - - 2,458 - 2,811
Loan commitments 895 979 2,225 46,599 1,019 15,086 - 29,644 - 96,447
Other commitments 25 14 91 - 409 - - 2,058 - 2,597
Total Australia 13,668 6,684 106,308 271,417 4,441 28,539 5,508 187,561 4,127 628,253
Cash and liquid assets - - 4,446 - - - - - - 4,446
Receivables due from other
financial institutions - - 5,504 - - - - - - 5,504
Assets at fair value through
Income Statement:
Trading 528 - - - - - - 263 - 791
Insurance (1) - - - - - - - - - -
Other - - - - - - - - - -
Derivative assets 137 - 1,860 - - - - 546 - 2,543
Available-for-sale investments 68 - 1,678 - - - - 3,376 - 5,122
Loans, bills discounted and other
receivables 97 95 6,564 328 355 43 7 5,502 - 12,991
Bank acceptances - - - - - - - - - -
Other assets (2) 43 1 11,498 1 - - - 49 77 11,669
Total on balance sheet
Overseas 873 96 31,550 329 355 43 7 9,736 77 43,066
Credit risk exposures relating to off balance sheet assets:
Guarantees - - - - - - - - - -
Loan commitments 40 21 42 - 178 - - 5,325 - 5,606
Other commitments - - - - - - - 49 - 49
Total Overseas 913 117 31,592 329 533 43 7 15,110 77 48,721
Total gross credit risk 14,581 6,801 137,900 271,746 4,974 28,582 5,515 202,671 4,204 676,974
Australia Credit risk exposures relating to on balance sheet assets:
Credit risk exposures relating to off balance sheet assets:
Overseas Credit risk exposures relating to on balance sheet assets:
(1) In most cases the credit risk of insurance assets is borne by policyholders. However, on certain insurance contracts the Group retains exposure to credit risk.
(2) Other assets predominantly comprises assets which do not give rise to credit exposure, including intangible assets, property, plant and equipment, and defined benefit
superannuation plan surplus, which are shown in “Other” for the purpose of reconciling to the Balance Sheet.
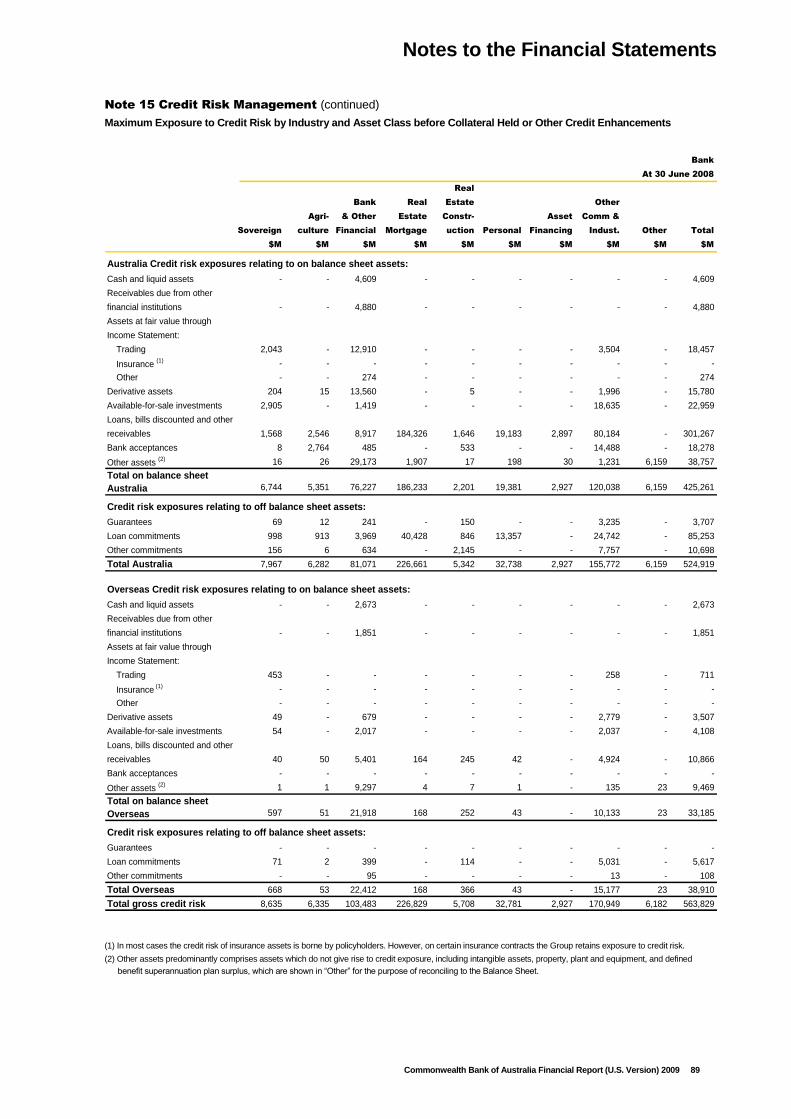
Notes to the Financial Statements
Commonwealth Bank of Australia Financial Report (U.S. Version) 2009 89
Note 15 Credit Risk Management (continued)
Maximum Exposure to Credit Risk by Industry and Asset Class before Collateral Held or Other Credit Enhancements
Bank
At 30 June 2008
Real
Bank Real Estate Other
Agri- & Other Estate Constr- Asset Comm &
Sovereign culture Financial Mortgage uction Personal Financing Indust. Other Total
$M $M $M $M $M $M $M $M $M $M
Cash and liquid assets - - 4,609 - - - - - - 4,609
Receivables due from other
financial institutions - - 4,880 - - - - - - 4,880
Assets at fair value through
Income Statement:
Trading 2,043 - 12,910 - - - - 3,504 - 18,457
Insurance (1) - - - - - - - - - -
Other - - 274 - - - - - - 274
Derivative assets 204 15 13,560 - 5 - - 1,996 - 15,780
Available-for-sale investments 2,905 - 1,419 - - - - 18,635 - 22,959
Loans, bills discounted and other
receivables 1,568 2,546 8,917 184,326 1,646 19,183 2,897 80,184 - 301,267
Bank acceptances 8 2,764 485 - 533 - - 14,488 - 18,278
Other assets (2) 16 26 29,173 1,907 17 198 30 1,231 6,159 38,757
Total on balance sheet
Australia 6,744 5,351 76,227 186,233 2,201 19,381 2,927 120,038 6,159 425,261
Guarantees 69 12 241 - 150 - - 3,235 - 3,707
Loan commitments 998 913 3,969 40,428 846 13,357 - 24,742 - 85,253
Other commitments 156 6 634 - 2,145 - - 7,757 - 10,698
Total Australia 7,967 6,282 81,071 226,661 5,342 32,738 2,927 155,772 6,159 524,919
Cash and liquid assets - - 2,673 - - - - - - 2,673
Receivables due from other
financial institutions - - 1,851 - - - - - - 1,851
Assets at fair value through
Income Statement:
Trading 453 - - - - - - 258 - 711
Insurance (1) - - - - - - - - - -
Other - - - - - - - - - -
Derivative assets 49 - 679 - - - - 2,779 - 3,507
Available-for-sale investments 54 - 2,017 - - - - 2,037 - 4,108
Loans, bills discounted and other
receivables 40 50 5,401 164 245 42 - 4,924 - 10,866
Bank acceptances - - - - - - - - - -
Other assets (2) 1 1 9,297 4 7 1 - 135 23 9,469
Total on balance sheet
Overseas 597 51 21,918 168 252 43 - 10,133 23 33,185
Guarantees - - - - - - - - - -
Loan commitments 71 2 399 - 114 - - 5,031 - 5,617
Other commitments - - 95 - - - - 13 - 108
Total Overseas 668 53 22,412 168 366 43 - 15,177 23 38,910
Total gross credit risk 8,635 6,335 103,483 226,829 5,708 32,781 2,927 170,949 6,182 563,829
Australia Credit risk exposures relating to on balance sheet assets:
Credit risk exposures relating to off balance sheet assets:
Overseas Credit risk exposures relating to on balance sheet assets:
Credit risk exposures relating to off balance sheet assets:
(1) In most cases the credit risk of insurance assets is borne by policyholders. However, on certain insurance contracts the Group retains exposure to credit risk.
(2) Other assets predominantly comprises assets which do not give rise to credit exposure, including intangible assets, property, plant and equipment, and defined
benefit superannuation plan surplus, which are shown in “Other” for the purpose of reconciling to the Balance Sheet.

Notes to the Financial Statements
90 Commonwealth Bank of Australia Financial Report (U.S. Version) 2009
Note 15 Credit Risk Management (continued)
Group
2009 2008
Industry $M $M
Australia
Sovereign 1,539 1,568
Agriculture 4,717 2,547
Bank and other financial 9,900 8,917
Real estate:
Mortgage 261,504 186,926
Construction 4,072 1,647
Personal 15,148 19,233
Asset Financing 7,923 7,894
Other commercial and industrial 108,570 80,423
Total Australia 413,373 309,155
Overseas
Sovereign 1,466 1,230
Agriculture 5,483 4,814
Bank and other financial 7,619 6,743
Real estate:
Mortgage 30,702 28,817
Construction 635 606
Personal 743 532
Asset Financing 717 548
Other commercial and industrial 13,034 12,779
Total Overseas 60,399 56,069
Gross loans and other receivables 473,772 365,224
Provisions for loan impairment and unearned income (7,141) (3,942)
Net loans and other receivables 466,631 361,282
Large Exposures
Concentrations of exposure to any debtor or counterparty
group are controlled by a large credit exposure policy, which
defines a graduated limit framework that restricts credit limits
based on the internally assessed riskiness of the client. All
exposures outside the policy require approval by the Executive
Risk Committee.
The following table shows the aggregated number of the
Group‟s Corporate and Industrial counterparty exposures
(including direct and contingent exposures) which individually
were greater than 5% of the Group‟s capital resources (Tier
One and Tier Two capital):
Group
2009 2008 2007
Number Number Number
5% to less than 10% of the Group's capital resources 1 1 -
10% to less than 15% of the Group's capital resources - - -
The Group has a good quality and well diversified credit
portfolio, with 55.2% of the gross loans and bills discounted in
domestic mortgage loans and a further 6.5% in overseas
mortgage loans primarily in New Zealand. Overseas loans
account for 12.7% of loans and advances at $60.4 billion.
The Group restricts its exposure to credit losses by entering
into master netting arrangements with counterparties with
which it undertakes a significant volume of transactions. Master
netting arrangements do not generally result in an offset of
Balance Sheet assets and liabilities as transactions are usually
settled on a gross basis.
However, the credit risk associated with favourable contracts is
reduced by a master netting arrangement to the extent that if
an event of default occurs, all amounts with the counterparty
are terminated and settled on a net basis. As at 30 June 2009,
master netting arrangements reduced the credit risk of the
Group by approximately $10.7 billion (2008: $6.5 billion).
Derivative financial instruments expose the Group to credit risk
where there is a positive fair value current. In the case of credit
derivatives, the Group is also exposed to or protected from the
risk of default of the underlying entity referenced by the
derivative. For further information regarding derivatives see
Notes 11, 41 and 48.
The Group also nets its credit exposure through the operation
of certain facilities that allow on balance sheet netting for credit
management purposes. As at 30 June 2009 these facilities
reduced the credit risk of the Group by approximately $14
billion (2008: $20 billion).

Notes to the Financial Statements
Commonwealth Bank of Australia Financial Report (U.S. Version) 2009 91
Note 16 Asset Quality
The Group administers its credit exposure to Credit Risk Rated
and Retail segments, as discussed in Note 15, Credit Risk
Management.
Provisions for impairment of financial assets are raised where
there is objective evidence of impairment and at an amount
adequate to cover assessed credit related losses. Credit Risk
Rated portfolios are assessed at least at each Balance Sheet
date for objective evidence that the financial asset or portfolio of
assets is impaired.
For further information about the accounting policy for provisions
for impairment and Group policy for the classification of impaired
assets see Note 1 (n).
Group Bank
2009 2008 2009 2008
Distribution of loans by credit quality $M $M $M $M
Gross loans
Australia
Neither past due nor impaired 399,322 302,156 335,060 294,578
Past due but not impaired 10,687 6,379 7,757 6,096
Impaired 3,364 620 1,964 593
Total Australia 413,373 309,155 344,781 301,267
Overseas
Neither past due nor impaired 56,649 53,440 12,448 10,838
Past due but not impaired 2,904 2,566 8 28
Impaired 846 63 535 -
Total Overseas 60,399 56,069 12,991 10,866
Total gross loans 473,772 365,224 357,772 312,133

Notes to the Financial Statements
92 Commonwealth Bank of Australia Financial Report (U.S. Version) 2009
Note 16 Asset Quality (continued)
The segmentation of Loans for the retail and risk-rated portfolios
into investment, pass and weak (including default grades)
excluding those past due or impaired, is based on the mapping of
Probability of Default (PD) to Standard and Poor‟s ratings,
reflecting a client‟s ability to meet their credit obligations. In
particular, retail PD pools have been aligned to the Group‟s risk-
rated PD grades which are consistent with rating agency views of
credit quality segmentation.
Investment grade is representative of lower assessed default
probabilities with other classifications reflecting progressively
higher default risk. No consideration is given to Loss Given
Default (LGD), the impact of any recoveries or the potential
benefit of mortgage insurance.
Group
2009
Other
Housing Other Asset Commercial
Loans (1)
Personal Financing Industrial Total
Loans which were neither past due nor impaired $M $M $M $M $M
Credit Grading
Australia
Investment 128,584 1,899 590 60,257 191,330
Pass 107,617 8,873 6,750 38,598 161,838
Weak 18,312 3,216 84 24,542 46,154
Total Australia 254,513 13,988 7,424 123,397 399,322
Overseas
Investment 20,509 62 378 16,859 37,808
Pass 6,326 380 301 9,537 16,544
Weak 1,410 - - 887 2,297
Total Overseas 28,245 442 679 27,283 56,649
Total loans which were neither past due nor impaired 282,758 14,430 8,103 150,680 455,971
(1) For Housing Loans, PD changes resulted in higher PDs on average and lower grading for Australian housing loans; and lower PDs on average and higher grading for
New Zealand housing Loans.
Group
2008
Other
Housing Other Asset Commercial
Loans Personal Financing Industrial Total
$M $M $M $M $M
Credit Grading
Australia (1)
Investment 147,377 2,575 - 53,820 203,772
Pass 31,696 13,583 7,500 37,655 90,434
Weak 3,583 2,200 - 2,167 7,950
Total Australia 182,656 18,358 7,500 93,642 302,156
Overseas
Investment 8,733 56 - 17,066 25,855
Pass 15,736 181 528 8,341 24,786
Weak 2,434 - - 365 2,799
Total Overseas 26,903 237 528 25,772 53,440
Total loans which were neither past due nor impaired 209,559 18,595 8,028 119,414 355,596
(1) Certain comparative information has been restated to conform to presentation in the current period.

Notes to the Financial Statements
Commonwealth Bank of Australia Financial Report (U.S. Version) 2009 93
Note 16 Asset Quality (continued)
Bank
2009
Other
Housing Other Asset Commercial
Loans Personal Financing Industrial Total
Loans which were neither past due nor impaired $M $M $M $M $M
Credit Grading
Australia
Investment 124,839 1,869 393 58,626 185,727
Pass 89,427 8,672 4,676 37,112 139,887
Weak 4,693 1,850 175 2,728 9,446
Total Australia 218,959 12,391 5,244 98,466 335,060
Overseas
Investment - - 1 10,078 10,079
Pass 150 43 6 2,116 2,315
Weak 54 - - - 54
Total Overseas 204 43 7 12,194 12,448
Total loans which were neither past due nor impaired 219,163 12,434 5,251 110,660 347,508
Bank
2008
Other
Housing Other Asset Commercial
Loans Personal Financing Industrial Total
$M $M $M $M $M
Credit Grading
Australia (1)
Investment 144,799 2,539 - 53,668 201,006
Pass 31,696 13,567 2,791 37,569 85,623
Weak 3,583 2,202 - 2,164 7,949
Total Australia 180,078 18,308 2,791 93,401 294,578
Overseas
Investment - - - 9,058 9,058
Pass 136 42 - 1,535 1,713
Weak - - - 67 67
Total Overseas 136 42 - 10,660 10,838
Total loans which were neither past due nor impaired 180,214 18,350 2,791 104,061 305,416
(1) Certain comparative information has been restated to conform to presentation in the current period.

Notes to the Financial Statements
94 Commonwealth Bank of Australia Financial Report (U.S. Version) 2009
Note 16 Asset Quality (continued)
Loans may be classed as performing (that is, not impaired) when past due where the Group has not ascertained a doubt as to whether
full amounts due will be received in a timely manner even though contractual payments are past due or facilities are well secured or
where matured facilities are in process of renegotiation and remain otherwise performing.
Group
2009
Other
Housing Other Asset Commercial
Loans Personal (2)
Financing Industrial Total
$M $M $M $M $M
Australia
Past due 1 - 29 days 3,071 683 256 1,626 5,636
Past due 30 - 59 days 1,349 186 63 203 1,801
Past due 60 - 89 days 711 101 39 137 988
Past due 90 - 179 days 808 156 35 207 1,206
Past due 180 days or more 756 44 19 237 1,056
Total Australia 6,695 1,170 412 2,410 10,687
Overseas
Past due 1 - 29 days 1,586 215 25 234 2,060
Past due 30 - 59 days 288 29 7 19 343
Past due 60 - 89 days 126 17 2 9 154
Past due 90 - 179 days 147 19 3 15 184
Past due 180 days or more 108 19 1 35 163
Total Overseas 2,255 299 38 312 2,904
Total loans which were past due but not impaired 8,950 1,469 450 2,722 13,591
Loans which were past due but not impaired (1)
(1) Collateral held against past due Housing Loans receivables comprises residential and other real estate with an estimated fair value of at least the amounts shown. Other
Personal receivables are generally unsecured. It has not been practicable to determine the fair value of collateral held against past due Asset Financing and Other
Commercial/ Industrial receivables.
(2) Personal loans, credit cards and other personal financing balances are generally unsecured and written off at 180 days past due unless agreements have been made
with the debtor. If they are not written off, they are classified as impaired.
Group
2008
Other
Housing Other Asset Commercial
Loans Personal (2)
Financing Industrial Total
$M $M $M $M $M
Australia
Past due 1 - 29 days 2,147 530 219 806 3,702
Past due 30 - 59 days 822 147 73 113 1,155
Past due 60 - 89 days 359 74 26 74 533
Past due 90 - 179 days 455 99 20 50 624
Past due 180 days or more 330 9 1 25 365
Total Australia 4,113 859 339 1,068 6,379
Overseas
Past due 1 - 29 days 1,529 216 14 281 2,040
Past due 30 - 59 days 212 45 4 33 294
Past due 60 - 89 days 74 16 1 18 109
Past due 90 - 179 days 42 10 1 23 76
Past due 180 days or more 19 6 - 22 47
Total Overseas 1,876 293 20 377 2,566
Total loans which were past due but not impaired 5,989 1,152 359 1,445 8,945
Loans which were past due but not impaired (1)
(1) Collateral held against past due Housing Loans receivables comprises residential and other real estate with an estimated fair value of at least the amounts shown. Other
Personal receivables are generally unsecured. It has not been practicable to determine the fair value of collateral held against past due Asset Financing and Other
Commercial/ Industrial receivables.
(2) Personal loans, credit cards and other personal financing balances are generally unsecured and written off at 180 days past due unless agreements have been made
with the debtor. If they are not written off, they are classified as impaired.

Notes to the Financial Statements
Commonwealth Bank of Australia Financial Report (U.S. Version) 2009 95
Note 16 Asset Quality (continued)
Bank
2009
Other
Housing Other Asset Commercial
Loans Personal (2)
Financing Industrial Total
$M $M $M $M $M
Australia
Past due 1 - 29 days 2,592 592 60 618 3,862
Past due 30 - 59 days 1,170 164 24 107 1,465
Past due 60 - 89 days 607 88 16 76 787
Past due 90 - 179 days 682 150 12 66 910
Past due 180 days or more 615 44 6 68 733
Total Australia 5,666 1,038 118 935 7,757
Overseas
Past due 1 - 29 days 6 - - - 6
Past due 30 - 59 days - - - - -
Past due 60 - 89 days - - - - -
Past due 90 - 179 days 1 - - - 1
Past due 180 days or more 1 - - - 1
Total Overseas 8 - - - 8
Total loans which were neither past due but not impaired 5,674 1,038 118 935 7,765
Loans which were past due but not impaired (1)
(1) Collateral held against past due Housing Loans receivables comprises residential and other real estate with an estimated fair value of at least the amounts shown. Other
Personal receivables are generally unsecured. It has not been practicable to determine the fair value of collateral held against past due Asset Financing and Other
Commercial/ Industrial receivables.
(2) Personal loans, credit cards and other personal financing balances are generally unsecured and written off at 180 days past due unless agreements have been made
with the debtor. If they are not written off, they are classified as impaired.
Bank
2008
Other
Housing Other Asset Commercial
Loans Personal (2)
Financing Industrial Total
$M $M $M $M $M
Australia
Past due 1 - 29 days 2,128 530 39 806 3,503
Past due 30 - 59 days 820 147 16 113 1,096
Past due 60 - 89 days 358 74 6 74 512
Past due 90 - 179 days 455 99 10 50 614
Past due 180 days or more 330 9 7 25 371
Total Australia 4,091 859 78 1,068 6,096
Overseas
Past due 1 - 29 days 20 - - - 20
Past due 30 - 59 days 6 - - - 6
Past due 60 - 89 days 1 - - - 1
Past due 90 - 179 days 1 - - - 1
Past due 180 days or more - - - - -
Total Overseas 28 - - - 28
Total loans which were neither past due but not impaired 4,119 859 78 1,068 6,124
Loans which were past due but not impaired (1)
(1) Collateral held against past due Housing Loans receivables comprises residential and other real estate with an estimated fair value of at least the amounts shown. Other
Personal receivables are generally unsecured. It has not been practicable to determine the fair value of collateral held against past due Asset Financing and Other
Commercial/ Industrial receivables.
(2) Personal loans, credit cards and other personal financing balances are generally unsecured and written off at 180 days past due unless agreements have been made
with the debtor. If they are not written off, they are classified as impaired.

Notes to the Financial Statements
96 Commonwealth Bank of Australia Financial Report (U.S. Version) 2009
Note 16 Asset Quality (continued)
Financial assets individually assessed as impaired
Group
2009 2008
Gross Individually Net Gross Individually Net
Impaired Assessed Impaired Impaired Assessed Impaired
Assets Provisions Assets Assets Provisions Assets
$M $M $M $M $M $M
Australia (1)
Loans and other receivables:
Housing loans 274 82 192 157 34 123
Other personal 27 23 4 14 9 5
Asset financing 72 31 41 55 12 43
Other commercial and industrial 2,991 1,334 1,657 394 193 201
Financial assets individually assessed as impaired
- Australia 3,364 1,470 1,894 620 248 372
Overseas
Loans and other receivables:
Housing loans 203 10 193 37 7 30
Other personal 1 - 1 2 2 -
Asset financing - - - 1 2 (1)
Other commercial and industrial 642 249 393 23 20 3
Financial assets individually assessed as impaired
- Overseas 846 259 587 63 31 32
Total financial assets individually assessed as
impaired 4,210 1,729 2,481 683 279 404
(1) Certain comparative information has been restated to conform to presentation in the current period.
Bank
2009 2008
Gross Individually Net Gross Individually Net
Impaired Assessed Impaired Impaired Assessed Impaired
Assets Provisions Assets Assets Provisions Assets
$M $M $M $M $M $M
Australia (1)
Loans and other receivables:
Housing loans 186 46 140 157 34 123
Other personal 7 2 5 14 9 5
Asset financing 38 23 15 28 3 25
Other commercial and industrial 1,733 771 962 394 192 202
Financial assets individually assessed as impaired
- Australia 1,964 842 1,122 593 238 355
Overseas
Loans and other receivables:
Housing loans 116 - 116 - - -
Other personal - - - - - -
Asset financing - - - - - -
Other commercial and industrial 419 178 241 - - -
Financial assets individually assessed as impaired
- Overseas 535 178 357 - - -
Total financial assets individually assessed as
impaired 2,499 1,020 1,479 593 238 355
(1) Certain comparative information has been restated to conform to presentation in the current period.

Notes to the Financial Statements
Commonwealth Bank of Australia Financial Report (U.S. Version) 2009 97
Note 16 Asset Quality (continued)
Impaired Assets by classification
Impaired Assets in Credit Risk Rated portfolios are assessed at
least at each Balance Sheet date for objective evidence that the
financial asset or portfolio of assets is impaired.
Impaired financial assets in the Retail segment are those facilities
that are not well secured and are past due 180 days or more.
The Group applies APRA‟s prudential standards in classifying
impaired assets into three categories, comprising:
Non-Performing Facilities:
Any credit risk facility against which an individually assessed
provision for impairment has been raised; and
Any credit risk facility where loss of principal or interest is
anticipated.
Restructured Facilities:
Credit risk facilities on which the original contractual terms have
been modified due to financial difficulties of the borrower. Interest
on these facilities is taken to profit and loss. Failure to comply
fully with the modified terms will result in immediate
reclassification to non-performing.
Assets Acquired through Security Enforcement:
Other Real Estate Owned, comprising real estate where
the Group assumed ownership or foreclosed in settlement
of a debt;
Other Assets Acquired through Securities Enforcement,
comprising assets other than real estate where the Group
has assumed ownership or foreclosed in settlement of a
debt; and
Other real estate owned and other assets acquired through
security enforcement are sold through the Group‟s existing
disposal processes. These processes are generally
expected to take no longer than six months.
The Group does not manage credit risk based solely on arrears
categorisation, but also uses Credit Risk Rating principles as
described in Note 15, Credit Risk Management.
Group
2009 2008 2007 2006 2005
$M $M $M $M $M
Australia
Non-Performing loans:
Gross balances 3,245 620 398 312 381
Less provisions for impairment (1,470) (248) (86) (75) (82)
Net non-performing loans 1,775 372 312 237 299
Restructured loans:
Gross balances 119 - - - -
Less provisions for impairment - - - - -
Net restructured loans 119 - - - -
Assets Acquired Through Security Enforcement:
Gross balances - - - - -
Less provisions for impairment - - - - -
Net assets acquired through security enforcement - - - - -
Net Australia impaired assets 1,894 372 312 237 299
Overseas
Non-Performing loans:
Gross balances 676 63 23 14 14
Less provisions for impairment (259) (31) (14) (5) (13)
Net non-performing loans 417 32 9 9 1
Restructured loans:
Gross balances 170 - - - -
Less provisions for impairment - - - - -
Net restructured loans 170 - - - -
Assets Acquired Through Security Enforcement:
Gross balances - - - - -
Less provisions for impairment - - - - -
Net assets acquired through security enforcement - - - - -
Net Overseas impaired assets 587 32 9 9 1
Total net impaired assets 2,481 404 321 246 300
Certain comparative information has been restated to conform to presentation in the current period.

Notes to the Financial Statements
98 Commonwealth Bank of Australia Financial Report (U.S. Version) 2009
Note 16 Asset Quality (continued)
Group
Australia Overseas Total Australia Overseas Total
2009 2009 2009 2008 2008 2008
$M $M $M $M $M $M
Non-Performing Loans by Size of Loan
Less than $1 million 493 172 665 189 39 228
$1 million to $10 million 843 171 1,014 175 24 199
Greater than $10 million 2,028 503 2,531 256 - 256
Total 3,364 846 4,210 620 63 683
Movement in Impaired Asset Balances
Group
2009 2008 2007 2006 2005
Gross Impaired Assets $M $M $M $M $M
Gross impaired assets - opening balance 683 421 326 395 363
Acquisitions 770 - - - -
New and increased 4,374 1,104 928 745 769
Balances written off (1,056) (470) (482) (450) (350)
Returned to performing or repaid (561) (372) (351) (364) (387)
Gross impaired assets - closing balance 4,210 683 421 326 395
Impaired Assets by Industry and Status
Group
2009
Gross Individually
Impaired Assessed Net Impaired Net
Loans Assets Provisions Assets Write-offs Recoveries Write-offs
Industry $M $M $M $M $M $M $M
Australia
Sovereign 1,539 - - - - - -
Agriculture 4,717 255 77 178 2 (1) 1
Bank and other financial 9,900 665 393 272 84 (1) 83
Real estate:
Mortgage 261,504 274 82 192 36 (1) 35
Construction 4,072 239 104 135 4 - 4
Personal 15,148 27 23 4 496 (52) 444
Asset Financing 7,923 72 31 41 58 (5) 53
Other commercial and industrial 108,570 1,832 760 1,072 255 (10) 245
Total Australia 413,373 3,364 1,470 1,894 935 (70) 865
Overseas
Sovereign 1,466 - - - - - -
Agriculture 5,483 60 9 51 - - -
Bank and other financial 7,619 322 158 164 112 - 112
Real estate:
Mortgage 30,702 203 10 193 18 - 18
Construction 635 - - - 4 - 4
Personal 743 1 - 1 14 (3) 11
Asset Financing 717 - - - - - -
Other commercial and industrial 13,034 260 82 178 60 - 60
Total Overseas 60,399 846 259 587 208 (3) 205
Gross balances 473,772 4,210 1,729 2,481 1,143 (73) 1,070

Notes to the Financial Statements
Commonwealth Bank of Australia Financial Report (U.S. Version) 2009 99
Note 16 Asset Quality (continued)
t (continued) Impaired Assets by Industry and Status
Group
2008
Gross Individually
Impaired Assessed Net Impaired Net
Loans Assets Provisions Assets Write-offs Recoveries Write-offs
Industry $M $M $M $M $M $M $M
Australia
Sovereign 1,568 - - - - - -
Agriculture 2,547 15 4 11 3 - 3
Bank and other financial 8,917 58 27 31 5 - 5
Real estate:
Mortgage 186,926 157 34 123 23 (1) 22
Construction 1,647 11 1 10 1 (1) -
Personal 19,233 14 9 5 364 (61) 303
Asset Financing 7,894 55 12 43 49 (5) 44
Other commercial and industrial 80,423 310 161 149 34 (5) 29
Total Australia 309,155 620 248 372 479 (73) 406
Overseas
Sovereign 1,230 - - - - - -
Agriculture 4,814 1 - 1 - - -
Bank and other financial 6,743 4 4 - 4 - 4
Real estate:
Mortgage 28,817 37 7 30 1 - 1
Construction 606 3 8 (5) 1 - 1
Personal 532 2 2 - 13 (3) 10
Asset Financing 548 1 2 (1) - - -
Other commercial and industrial 12,779 15 8 7 5 (1) 4
Total Overseas 56,069 63 31 32 24 (4) 20
Gross balances 365,224 683 279 404 503 (77) 426
Note 17 Shares in and Loans to Controlled Entities
Bank
2009 2008
$M $M
Shares in controlled entities 21,319 23,676
Loans to controlled entities 33,352 13,796
Total shares in and loans to controlled entities 54,671 37,472
The above amounts are expected to be recovered after twelve months of the Balance Sheet date.
A list of the Group‟s controlled entities is provided in Note 43 Controlled Entities.

Notes to the Financial Statements
100 Commonwealth Bank of Australia Financial Report (U.S. Version) 2009
Note 18 Property, Plant and Equipment
Group Bank
2009 2008 2009 2008
$M $M $M $M
Land and Buildings
Land
At 30 June 2009 valuation 277 - 198 -
At 30 June 2008 valuation - 258 - 232
Closing balance 277 258 198 232
Buildings
At 30 June 2009 valuation 395 - 318 -
At 30 June 2008 valuation - 341 - 312
Closing balance 395 341 318 312
Total land and buildings 672 599 516 544
Leasehold Improvements
At cost 1,147 941 934 819
Provision for depreciation (551) (475) (449) (424)
Investment and restructuring - (18) - (18)
Closing balance 596 448 485 377
Equipment
At cost 1,305 936 750 663
Provision for depreciation (878) (578) (479) (381)
Closing balance 427 358 271 282
Assets under Lease
At cost 866 290 331 152
Provision for depreciation (89) (55) (31) (19)
Closing balance 777 235 300 133
Total property, plant and equipment (1) 2,472 1,640 1,572 1,336
(1) Assets held for sale are separately disclosed in Note 21.
The majority of the above amounts have expected useful lives longer than twelve months after the Balance Sheet date.
Land and buildings are carried at fair value based on independent valuations performed in 2009, refer Note 1 (s). Under the cost model
these assets would have been recognised at the carrying amount outlined in the table below.
Group Bank
2009 2008 2009 2008
$M $M $M $M
Carrying Amount of Land and Buildings under the Cost Model:
Land 136 117 74 108
Buildings 298 244 235 229
Total land and buildings 434 361 309 337

Notes to the Financial Statements
Commonwealth Bank of Australia Financial Report (U.S. Version) 2009 101
Note 18 Property, Plant and Equipment (continued)
Reconciliation of movements in the carrying amount of Property, Plant and Equipment
Group Bank
2009 2008 2009 2008
Reconciliation $M $M $M $M
Land
Opening balance 258 215 232 193
Acquisitions attributed to business combinations 47 7 - -
Transfers to assets held for sale (8) - (8) -
Disposals (1) (2) (1) (1)
Net revaluations (20) 41 (24) 40
Foreign currency translation adjustment 1 (3) (1) -
Closing balance 277 258 198 232
Buildings
Opening balance 341 361 312 333
Acquisitions 35 35 30 33
Acquisitions attributed to business combinations 55 2 - -
Transfers to assets held for sale (1) - (2) -
Disposals (1) (7) (1) (6)
Net revaluations (6) (19) 3 (21)
Depreciation (29) (27) (26) (26)
Foreign currency translation adjustment 1 (4) 2 (1)
Closing balance 395 341 318 312
Leasehold Improvements
Opening balance 448 381 377 304
Acquisitions 193 170 179 150
Acquisitions attributed to business combinations 47 - - -
Disposals (6) (6) (4) (7)
Net revaluations (2) (2) - -
Depreciation (85) (63) (68) (52)
Investment and restructuring - (18) - (18)
Foreign currency translation adjustment 1 (14) 1 -
Closing balance 596 448 485 377
Equipment
Opening balance 358 326 282 240
Acquisitions 148 174 101 135
Acquisitions attributed to business combinations 76 - - -
Disposals/transfers (5) (17) (5) (11)
Depreciation (151) (115) (106) (82)
Foreign currency translation adjustment 1 (10) (1) -
Closing balance 427 358 271 282
Assets Under Lease
Opening balance 235 153 133 42
Acquisitions 611 103 189 103
Disposals/transfers (4) (1) (4) (1)
Net revaluations (2) - - -
Depreciation (37) (20) (18) (11)
Foreign currency translation adjustment (26) - - -
Closing balance 777 235 300 133

Notes to the Financial Statements
102 Commonwealth Bank of Australia Financial Report (U.S. Version) 2009
Note 19 Intangible Assets
Group Bank
2009 2008 2009 2008
$M $M $M $M
Intangible Assets
Goodwill 7,473 7,484 2,522 2,522
Computer software costs 673 353 579 304
Core deposits (1) 460 - - -
Management fee rights (2) 311 311 - -
Brand name (3) 186 - - -
Other (4) 142 110 - -
Total intangible assets 9,245 8,258 3,101 2,826
Goodwill
Purchased goodwill 7,484 7,484 2,522 2,522
Accumulated impairment (11) - - -
Total goodwill 7,473 7,484 2,522 2,522
Computer Software Costs
Cost 1,085 629 823 560
Accumulated amortisation (373) (199) (205) (191)
Accumulated impairment (39) (77) (39) (65)
Total computer software costs 673 353 579 304
Core Deposits (1)
Cost 495 - - -
Accumulated amortisation (35) - - -
Total core deposits 460 - - -
Management Fee Rights (2)
Cost 311 311 - -
Total management fee rights 311 311 - -
Brand Name (3)
Cost 186 - - -
Total brand name 186 - - -
Other (4)
Cost 210 159 - -
Accumulated amortisation (68) (49) - -
Total other 142 110 - -
Goodwill
Opening balance 7,484 7,163 2,522 2,522
Additions - 323 - -
Disposals - (2) - -
Impairment (11) - - -
Total goodwill 7,473 7,484 2,522 2,522
Computer Software Costs
Opening balance 353 297 304 262
Additions:
From acquisitions 120 90 44 89
From internal development 352 131 319 94
Amortisation (122) (88) (88) (76)
Impairment (30) (77) - (65)
Total computer software costs 673 353 579 304
(1) Core deposits represents the value of the Bankwest deposit base compared to the avoided cost of alternative funding sources such as securitisation and wholesale
funding. This asset has a useful life of seven years based on the weighted average attrition rates of the Bankwest deposit portfolio.
(2) Management fee rights have an indefinite useful life under the contractual terms of the management agreements and are subject to an annual valuation for
impairment testing purposes. No impairment was required as a result of this valuation.
(3) Brand names represents the value of royalty costs foregone by the Group through acquiring the Bankwest brand name. The royalty costs that would have been
incurred by an entity using the Bankwest brand name are based on an annual percentage of income generated by Bankwest. This asset has an indefinite useful life,
so is not subject to amortisation.
(4) Other includes $38 million for the value of credit card relationships acquired from Bankwest. This value represents future net income generated from the
relationships that existed at Balance Sheet date. The asset has a useful life of ten years based on the attrition rates of the Bankwest credit cardholders.

Notes to the Financial Statements
Commonwealth Bank of Australia Financial Report (U.S. Version) 2009 103
Note 19 Intangible Assets (continued)
Group Bank
2009 2008 2009 2008
$M $M $M $M
Core Deposits
Opening balance - - - -
Additions:
From acquisitions 495 - - -
Amortisation (35) - - -
Total core deposits 460 - - -
Management Fee Rights
Opening balance 311 311 - -
Total management fee rights 311 311 - -
Brand Name
Opening balance - - - -
Additions:
From acquisitions 186 - - -
Total brand name 186 - - -
Other
Opening balance 110 64 - 4
Additions:
From acquisitions 51 64 - -
Disposals - (3) - (3)
Amortisation (19) (15) - (1)
Total other 142 110 - -
Segment Allocation of Goodwill
Group
2009 2008
Segment $M $M
Retail Banking Services (1) 4,149 4,149
Business and Private Banking 297 297
Wealth Management (2) 2,358 2,358
International Financial Services 669 680
Total 7,473 7,484
(1) The allocation to Retail Banking Services includes goodwill related to the acquisitions of Colonial and State Bank of Victoria.
(2) The allocation to Wealth Management principally relates to the goodwill on acquisition of Colonial.
Impairment Tests for Goodwill and Intangible Assets with Indefinite Lives
To assess whether goodwill is impaired, the carrying amount of a cash generating unit is compared to the recoverable amount,
determined based on net selling price less costs to sell, using an earnings multiple applicable to that type of business, or actuarial
assessment.
Key Assumptions Used in Selling Price less Cost to Sell Calculations
Earnings multiples relating to the Group‟s Banking (Retail
Banking Services, Business and Private Banking and
International Financial Services) and Wealth Management cash-
generating units are sourced from publicly available data
associated with valuations performed on recent businesses
displaying similar characteristics to those cash-generating units,
and are applied to current earnings.
The New Zealand Life Insurance component of the International
Financial Services cash-generating unit is valued via an actuarial
assessment.
The key assumptions used when completing the actuarial
assessment include new business multiples, discount rates,
investment market returns, mortality, morbidity, persistency and
expense inflation. These have been determined by reference to
historical company and industry experience and publicly
available data.

Notes to the Financial Statements
104 Commonwealth Bank of Australia Financial Report (U.S. Version) 2009
Note 20 Other Assets
Group Bank
2009 2008 2009 2008
Note $M $M $M $M
Accrued interest receivable 1,579 1,904 1,550 2,067
Defined benefit superannuation plan surplus 42 495 1,536 495 1,536
Accrued fees/reimbursements receivable 943 985 214 387
Securities sold not delivered 1,277 766 628 325
Intragroup current tax receivable - - 100 419
Current tax assets 77 50 - -
Other 1,699 1,251 879 635
Total other assets 6,070 6,492 3,866 5,369
Other than the defined benefit superannuation plan surplus, the above amounts are expected to be recovered within twelve months of
the Balance Sheet date.
Note 21 Assets Held for Sale
Group Bank
2009 2008 2009 2008
$M $M $M $M
Available-for-sale investments (1) 373 406 228 262
Loans, bills discounted and other receivables (1) 180 191 130 139
Land and Buildings 12 11 12 11
Total assets held for sale (2) 565 608 370 412
(1) During the year ended 30 June 2007 the Group purchased, through Colonial First State, a 32% stake in AWG plc. The stake was acquired through the purchase of
preference shares and Eurobonds that on acquisition were classified as Assets held for sale ($1.3 billion) based on the Group‟s intention to dispose of its holding into
Australian and European based infrastructure funds within 12 months. Since acquisition the Group has sold down $1.0 billion worth of AWG related Eurobonds and
preference shares.
(1) During the year ended 30 June 2008 the Group purchased, through Colonial First State, a 50% stake in ENW Ltd. The stake was acquired through the purchase of
preference shares and Eurobonds that on acquisition were classified as Assets held for sale ($616 million) based on the Group‟s intention to dispose of its holding into
Australian and European based infrastructure funds within 12 months. Since acquisition the Group has sold down $200 million worth of ENW related Eurobonds and
preference shares.
(1) Until sold, the Eurobonds are being measured on the same basis as Loans, bills discounted and other receivables, while the preference shares are being measured on
the same basis as Available-for-sale investments.
(2) Impairments were recognised on Assets held for sale of $75 million during the year ended 30 June 2009 (30 June 2008: nil). These impairments are included in Funds
management and investment contract income-other for the Group and net gain/(loss) on Other non-trading instruments for the Bank.
Note 22 Deposits and Other Public Borrowings
Group Bank
2009 2008 2009 2008
$M $M $M $M
Australia
Certificates of deposit 56,735 36,981 57,266 36,981
Term deposits 95,126 71,637 78,205 70,858
On demand and short term deposits (1) 157,433 117,712 136,501 118,270
Deposits not bearing interest (2) 7,135 6,142 6,732 6,194
Securities sold under agreements to repurchase (1) 8,413 1,462 8,413 1,462
Total Australia 324,842 233,934 287,117 233,765
Overseas
Certificates of deposit 9,960 4,139 9,468 4,139
Term deposits 22,517 15,687 8,377 2,679
On demand and short term deposits (1) 9,760 8,351 203 159
Deposits not bearing interest (2) 1,481 1,468 5 2
Securities sold under agreements to repurchase (1) 161 127 - 127
Total Overseas 43,879 29,772 18,053 7,106
Total deposits and other public borrowings 368,721 263,706 305,170 240,871
(1) Expected to be settled within twelve months of the Balance Sheet date.
(2) Expected to be settled after twelve months of the Balance Sheet date.

Notes to the Financial Statements
Commonwealth Bank of Australia Financial Report (U.S. Version) 2009 105
Note 22 Deposits and Other Public Borrowings (continued)
Maturity Distribution of Certificates of Deposit and Time Deposits
Group
At 30 June 2009
Maturing Maturing Maturing Maturing
Three Between Between after
Months or Three & Six & Twelve Twelve
Less Six Months Months Months Total
$M $M $M $M $M
Australia
Certificates of deposit (1) 34,986 7,953 1,115 12,681 56,735
Time deposits 67,548 7,284 15,175 5,119 95,126
Total Australia 102,534 15,237 16,290 17,800 151,861
Overseas
Certificates of deposit (1) 5,239 3,450 1,232 39 9,960
Time deposits 14,246 3,230 3,218 1,823 22,517
Total Overseas 19,485 6,680 4,450 1,862 32,477
Total certificates of deposits and time deposits 122,019 21,917 20,740 19,662 184,338
(1) All certificates of deposit issued by the Bank are for amounts greater than $100,000.
Note 23 Payables due to Other Financial Institutions
Group Bank
2009 2008 2009 2008
$M $M $M $M
Australia 5,981 4,390 5,954 4,391
Overseas 9,128 13,282 8,988 13,234
Total payables due to other financial institutions 15,109 17,672 14,942 17,625
The majority of the above amounts are expected to be settled within twelve months of the Balance Sheet date.
Note 24 Liabilities at Fair Value through Income Statement
Group Bank
2009 2008 2009 2008
$M $M $M $M
Deposits and other borrowings (1) 4,816 4,586 - -
Debt instruments (1) 9,202 9,047 907 1,037
Trading liabilities 2,578 1,893 2,578 1,893
Total liabilities at fair value through Income Statement 16,596 15,526 3,485 2,930
(1) Designated at Fair Value through Income Statement at inception as they are managed by the Group on a fair value basis. Designating these liabilities at Fair
Value through Income Statement has also eliminated an accounting mismatch created by measuring assets and liabilities on a different basis.
Of the above amounts, trading liabilities are expected to be settled within twelve months of the Balance Sheet date for the Group
and the Bank. The majority of the other amounts are expected to be settled within twelve months of the Balance Sheet date for the
Group and after twelve months of the Balance sheet date for the Bank.
The change in fair value for those liabilities designated as Fair Value through Income Statement due to credit risk for the Group is a
$4 million loss (2008: $22 million gain) and for the Bank is a $3 million gain (2008: $15 million gain), which has been calculated by
determining the changes in credit spread implicit in the fair value of the instruments issued. The cumulative change in fair value due
to changes in credit risk for the Group and the Bank is consistent with the combined amounts disclosed for the period, as changes
prior to 30 June 2008 did not have a material impact on the Group or the Bank.
The amount that would be contractually required to be paid at maturity to the holders of the financial liabilities designated at Fair
Value through Income Statement for the Group is a $46 million decrement (2008: $267 million increment) and for the Bank is a $21
million decrement (2008: nil).

Notes to the Financial Statements
106 Commonwealth Bank of Australia Financial Report (U.S. Version) 2009
Note 25 Income Tax Liability
Group Bank
2009 2008 2009 2008
$M $M $M $M
Australia
Current tax liability 767 696 770 707
Deferred tax liability (Note 5) - - - 17
Total Australia 767 696 770 724
Overseas
Current tax liability 116 72 65 1
Deferred tax liability (Note 5) 168 266 40 2
Total Overseas 284 338 105 3
Total income tax liability 1,051 1,034 875 727
Note 26 Other Provisions
Group Bank
2009 2008 2009 2008
Note $M $M $M $M
Provision for:
Long service leave 346 299 317 292
Annual leave 239 205 196 185
Other employee entitlements 68 69 68 66
Restructuring costs 182 284 148 284
General insurance claims 185 117 - -
Self insurance/non-lending losses 56 64 54 64
Dividends 6 18 5 18 5
Other 149 131 112 87
Total other provisions 1,243 1,174 913 983
Other than annual leave and the restructuring provision, the above amounts are expected to be settled after twelve months of the
Balance Sheet date.
Group Bank
2009 2008 2009 2008
Reconciliation $M $M $M $M
Restructuring costs:
Opening balance 284 26 284 26
Additional provisions 87 282 40 282
Amounts utilised during the year (189) (24) (176) (24)
Closing balance 182 284 148 284
General insurance claims:
Opening balance 117 94 - -
Additional provisions 157 80 - -
Amounts utilised during the year (89) (57) - -
Closing balance 185 117 - -
Self insurance/non-lending losses:
Opening balance 64 83 64 82
Additional provisions 6 9 5 10
Acquisitions 1 - - -
Amounts utilised during the year (15) (28) (15) (28)
Closing balance 56 64 54 64
Other:
Opening balance 131 107 87 99
Additional provisions 388 83 311 37
Acquisitions 16 - - -
Amounts utilised during the year (386) (59) (286) (49)
Closing balance 149 131 112 87

Notes to the Financial Statements
Commonwealth Bank of Australia Financial Report (U.S. Version) 2009 107
Note 26 Other Provisions (continued)
Provision Commentary
Restructuring costs
Provisions are for amounts expected to be utilised in the short
to medium term.
At 30 June 2009 the Group had recognised a provision for
Investment and restructuring of $57 million relating to costs for
integration of Bankwest.
General Insurance Claims
This provision is to cover future claims on general insurance
contracts that have been incurred but not reported.
Self Insurance and Non-Lending Losses
This provision covers certain non-transferred insurance risk
and non-lending losses. The self insurance provision is
reassessed annually in consultation with actuarial advice.
Note 27 Debt Issues
Group Bank
2009 2008 2009 2008
$M $M $M $M
Short term debt issues 39,586 35,877 15,852 16,208
Long term debt issues 62,233 49,940 47,042 39,570
Total debt issues 101,819 85,817 62,894 55,778
Short Term Debt Issues
AUD Commercial Paper 258 1,024 94 265
USD Commercial Paper 20,419 14,116 1,367 1,861
EUR Commercial Paper 566 622 262 622
Other Currency Commercial Paper 609 416 95 416
Long Term Debt Issues with less than one year to maturity 17,734 19,699 14,034 13,044
Total short term debt issues 39,586 35,877 15,852 16,208
Long Term Debt Issues
USD Medium Term Notes 23,221 19,065 19,329 16,101
AUD Medium Term Notes 12,273 10,232 5,023 4,891
NZD Medium Term Notes 1,163 438 268 54
JPY Medium Term Notes 9,489 6,463 9,489 6,347
GBP Medium Term Notes 2,116 3,482 2,021 3,482
EUR Medium Term Notes 8,971 6,478 6,026 4,913
Other Currencies Medium Term Notes 4,851 3,630 4,738 3,630
Offshore Loans (all JPY) 149 152 148 152
Total long term debt issues 62,233 49,940 47,042 39,570
Maturity Distribution of Debt Issues
Less than three months 23,883 21,757 5,065 6,664
Between three months to 12 months 15,703 14,120 10,787 9,544
Between one year and five years 52,899 35,234 38,603 26,459
Greater than five years 9,334 14,706 8,439 13,111
Total debt issues 101,819 85,817 62,894 55,778
The Bank‟s debt issues include a Euro Medium Term Note
program under which it may issue notes up to an aggregate
amount outstanding of USD 70 billion. The Bank also has a
U.S. Medium Term Note program under which it may issue
notes up to an aggregate amount outstanding of USD 15
billion. Notes issued under debt programs are both fixed and
variable rate. Interest rate risk associated with the notes is
incorporated within the Bank‟s interest rate risk framework.
Subsequent to 30 June 2009, notable debt issuances of the
Bank under these specified programs include:
USD medium term notes: between one and five years –
USD 2,736 million (AUD 3,366 million);
USD extendible notes – USD 1,000 million (AUD 1,230
million);
EUR medium term notes greater than five years EUR1,000
million (AUD 1,738 million); and
AUD medium term notes: between one and five years –
AUD 2,705 million.
Where any debt issue is booked in an offshore branch or
subsidiary, the amounts have first been converted into the
functional currency of the branch at a branch defined
exchange rate, before being converted into the AUD
equivalent.
Where proceeds have been employed in currencies other than
that of the ultimate repayment liability, swaps or other risk
management arrangements have been entered into.

Notes to the Financial Statements
108 Commonwealth Bank of Australia Financial Report (U.S. Version) 2009
Note 27 Debt Issues (continued)
Short Term Borrowings
The following table analyses the Group‟s short term borrowings for the financial years ended 30 June 2009, 2008 and 2007.
Group
2009 2008 2007
USD Commercial Paper
Outstanding at period end (1) 20,419 14,116 7,793
Maximum amount outstanding at any month end (2) 23,428 14,693 10,438
Approximate average amount outstanding (2) 15,995 11,000 7,953
Approximate weighted average interest rate on:
Average amount outstanding 1.6% 4.2% 5.3%
Outstanding at period end 0.4% 2.6% 5.3%
EUR Commercial Paper
Outstanding at period end (1) 566 622 1,581
Maximum amount outstanding at any month end (2) 692 1,589 1,581
Approximate average amount outstanding (2) 536 885 940
Approximate weighted average interest rate on:
Average amount outstanding 0.7% 4.4% 4.2%
Outstanding at period end 0.6% 4.3% 4.7%
AUD Commercial Paper
Outstanding at period end (1) 258 1,024 3,955
Maximum amount outstanding at any month end (2) 1,059 2,588 9,619
Approximate average amount outstanding (2) 395 1,430 7,413
Approximate weighted average interest rate on:
Average amount outstanding 6.7% 7.0% 6.3%
Outstanding at period end 3.2% 7.9% 6.4%
Other Currency Commercial Paper
Outstanding at period end (1) 609 416 -
Maximum amount outstanding at any month end (2) 1,257 1,525 -
Approximate average amount outstanding (2) 907 827 -
Approximate weighted average interest rate on:
Average amount outstanding 0.8% 4.7% -
Outstanding at period end 0.7% 7.0% -
(AUD millions, except where indicated)
(1) The amount outstanding at period end is measured at amortised cost.
(2) The maximum and average amounts over the period are reported on a face value basis because the carrying values of these amounts are not available. Any
differences between face value and carrying value would not be material given the short term nature of the borrowings.
Group
Year Ended 30 June
Geographical Information2009 2008 2007
Financial Performance & Position $M % $M % $M %
Revenue
Australia 32,498 82. 4 29,131 78. 6 26,350 79. 5
New Zealand 4,904 12. 4 4,922 13. 3 4,517 13. 6
Other locations (1)
2,031 5. 2 3,001 8. 1 2,302 6. 9
39,433 100. 0 37,054 100. 0 33,169 100. 0
Non-Current Assets
Australia 11,909 89. 8 9,929 87. 7 9,260 85. 0
New Zealand 1,005 7. 6 1,129 10. 0 1,133 10. 4
Other locations (1)
343 2. 6 265 2. 3 496 4. 6
13,257 100. 0 11,323 100. 0 10,889 100. 0

Notes to the Financial Statements
Commonwealth Bank of Australia Financial Report (U.S. Version) 2009 109
Note 27 Debt Issues (continued)
Guarantee Arrangements
Commonwealth Bank of Australia
Australian Government Guarantee Scheme for Large Deposits
and Wholesale Funding (Guarantee Scheme)
The Bank may issue debt under its programs which have the benefit of a
guarantee by the Australian Government announced on 12 October 2008.
Arrangements are provided in a Deed of Guarantee dated 20 November
2008, Scheme Rules which detail the eligibility criteria and application
process for how Authorised Deposit taking Institutions (of which the Bank is
one) may apply for the Australian Government Guarantee under the
Scheme and in additional documentation for offers to residents of the
United States of America and other jurisdictions.
The text of the Australian Government Guarantee, the Australian
Government Guarantee Scheme Rules and related documents can be
found at the Australian Government Guarantee website at
www.guaranteescheme.gov.au.
Fees are payable in relation to the Guarantee Scheme, calculated by
reference to the term and amount of the liabilities guaranteed and the
Bank‟s credit rating.
Guarantee under the Commonwealth Bank Sale Act
Historically, the due payment of all monies payable by the Bank was
guaranteed by the Commonwealth of Australia under section 117 of the
Commonwealth Banks Act 1959 (as amended) at 30 June 1996. With the
sale of the Commonwealth‟s shareholding in the Bank this guarantee has
been progressively phased out under transitional arrangements found in
the Commonwealth Bank Sale Act 1995.
Demand deposits are no longer guaranteed by the
Commonwealth under this guarantee. However, term
deposits outstanding at 19 July 1999 and debt issues
payable by the Bank under a contract entered into prior to
19 July 1996 and outstanding at 19 July 1999 remain
guaranteed until maturity.
State Bank of NSW (also known as Colonial State
Bank)
New South Wales legislation provides, in general terms, for
a guarantee by the NSW Government of all funding
liabilities and off-balance sheet products (other than
demand deposits) incurred or issued prior to 31 December
1997 by the State Bank of New South Wales (SBNSW)
until maturity and a guarantee for demand deposits
accepted by SBNSW up to 31 December 1997. Other
obligations incurred before 31 December 1994 are also
guaranteed to their maturity. On 4 June 2001
Commonwealth Bank of Australia became the successor in
law to SBNSW pursuant to the Financial Sector Transfer of
Business Act 1999. The NSW Government guarantee of
the liabilities and products as described above continues
unchanged by the succession.
Guarantee under the Bank of Western Australia Act
Western Australian State Government legislation provides,
in general terms, for a guarantee by the WA State
Government of the financial obligations (including
contingent liabilities) of Bankwest as at 1 December 1995,
subject to certain phase out conditions. The WA State
Government guarantee does not apply to Bankwest
transactions after 1 December 1995. Demand deposits
accepted by Bankwest prior to 1 December 1995 are no
longer guaranteed by the WA State Government under the
guarantee, but term securities existing at that date remain
guaranteed until maturity. Certain other obligations incurred
before 1 December 1995 also continue to be guaranteed.
Note 28 Managed Funds Units on Issue
Group Bank
2009 2008 2009 2008
$M $M $M $M
Managed Funds Units on Issue 914 1,109 - -
Managed funds units on issue represents the liability to minority interest unit holders in funds which have been consolidated by the Group.

Notes to the Financial Statements
110 Commonwealth Bank of Australia Financial Report (U.S. Version) 2009
Note 29 Bills Payable and Other Liabilities
Group Bank
2009 2008 2009 2008
Note $M $M $M $M
Bills payable 975 884 786 653
Accrued interest payable 2,344 2,397 1,574 2,161
Accrued fees and other items payable 1,604 1,426 1,014 773
Defined benefit superannuation plan deficit 42 86 65 86 65
Securities purchased not delivered 1,124 1,018 574 533
Other liabilities 2,387 1,734 3,935 2,116
Total bills payable and other liabilities 8,520 7,524 7,969 6,301
Other than the defined benefit superannuation plan deficit, the above amounts are expected to be settled within twelve months of the
Balance Sheet date.
Note 30 Loan Capital (1)
Group Bank
Currency 2009 2008 2009 2008
Amount (M) Footnotes $M $M $M $M
Tier One Loan Capital
Exchangeable FRN USD 38 (2) 46 39 46 39
Exchangeable FRN USD 64 (3) 79 66 79 66
Undated FRN USD 100 (4) 123 104 123 104
Undated TPS USD 550 (5) 676 569 679 569
Undated PERLS II AUD 750 (6) - 749 - 749
Undated PERLS III AUD 1,166 (7) 1,152 1,151 1,152 1,151
Undated PERLS IV AUD 1,465 (8) 1,451 1,447 1,451 1,447
Undated TPS USD 700 (9) - - 857 718
Total Tier One loan capital 3,527 4,125 4,387 4,843
Tier Two Loan Capital
AUD demoninated (10) 2,098 2,098 2,098 2,098
USD demoninated (11) 2,898 2,439 2,898 2,439
JPY denominated (12) 1,115 732 966 732
GBP denominated (13) 306 307 306 307
NZD denominated (14) 738 726 279 277
EUR denominated (14) 521 490 521 490
CAD denominated (14) 639 614 639 614
Total Tier Two loan capital 8,315 7,406 7,707 6,957
Fair value hedge adjustments 197 28 80 (180)
Total loan capital 12,039 11,559 12,174 11,620
(1) Effective yield adjustments have been included in the carrying values of the issues.

Notes to the Financial Statements
Commonwealth Bank of Australia Financial Report (U.S. Version) 2009 111
Note 30 Loan Capital (continued) (2) USD 300 million undated Floating Rate Notes (FRNs) issued
11 July 1988 exchangeable into dated FRNs.
Outstanding notes at 30 June 2009 were:
Undated: USD 37.5 million
(3) USD 400 million undated FRNs issued 22 February 1989
exchangeable into dated FRNs.
Outstanding notes at 30 June 2009 were:
Due February 2011: USD 64 million
(4) USD 100 million undated capital notes issued on 15 October
1986.
The Bank has entered into separate agreements with the
Commonwealth of Australia relating to each of the above issues
(the “Agreements”) which qualify the issues as Tier One capital.
The Agreements provide that, upon the occurrence of certain
events listed below, the Bank may issue either fully paid ordinary
shares to the Commonwealth of Australia or (with the consent of
the Commonwealth of Australia) rights to all shareholders to
subscribe for fully paid ordinary shares up to an amount equal to
the outstanding principal value of the relevant note issue or
issues plus any interest paid in respect of the notes for the most
recent financial year and accrued interest. The issue price of
such shares will be determined by reference to the prevailing
market price for the Bank‟s shares.
Any one or more of the following events may trigger the issue of
shares to the Commonwealth of Australia or a rights issue:
A relevant event of default (discussed below) occurs in
respect of a note issue and the Trustee of the relevant notes
gives notice to the Bank that the notes are immediately due
and payable;
The most recent audited annual Financial Statements of the
Group show a loss (as defined in the Agreements);
The Bank does not declare a dividend in respect of its
ordinary shares;
The Bank, if required by the Commonwealth of Australia and
subject to the agreement of the APRA, exercises its option to
redeem a note issue; or
In respect of Undated FRNs which have been exchanged to
Dated FRNs, the Dated FRNs mature.
Any payment made by the Commonwealth of Australia pursuant
to its guarantee in respect of the relevant notes will trigger the
issue of shares to the Commonwealth of Australia to the value of
such payment.
The relevant events of default differ depending on the relevant
Agreement. In summary, they cover events such as failure of the
Bank to meet its monetary obligation in respect of the relevant
notes; the insolvency of the Bank; any law being passed to
dissolve the Bank or the Bank ceasing to carry on general
Banking business in Australia; and the Commonwealth of
Australia ceasing to guarantee the relevant notes. In relation to
Dated FRNs which have matured to date, the Bank and the
Commonwealth agreed to amend the relevant Agreement to
reflect that the Commonwealth of Australia was not called upon
to subscribe for fully paid ordinary shares up to an amount equal
to the principal value of the maturing FRNs.
(5) TPS 2003
Each trust preferred security represents a beneficial ownership
interest in the assets of CBA Capital Trust. The sole assets of
CBA Capital Trust are the funding preferred securities issued by
CBA Funding Trust, which represent preferred beneficial
ownership interests in the assets of CBA Funding Trust, and a
limited CBA guarantee. The securities qualify as innovative
residual Tier One capital of the Bank.
CBA Funding Trust applied all of the proceeds from the sale of
the funding preferred securities to purchase the convertible
notes from the Bank‟s New Zealand Branch.
The trust preferred securities provide for a semi-annual cash
distribution in arrears at the annual rate of 5.805%. The
distributions on the trust preferred securities are non-cumulative.
CBA Capital Trust‟s ability to pay distributions on the trust
preferred securities is ultimately dependent upon the ability of
CBA to make interest payments on the convertible notes.
The Bank‟s New Zealand branch will make interest payments on
the convertible notes only if and when declared by the Board of
Directors of CBA. The Board of Directors is not permitted, unless
approved by APRA, to declare interest.
If interest is not paid on the convertible notes on an interest
payment date, holders will not receive a distribution on the trust
preferred securities and, unless at the time of the non-payment
the Bank is prevented by applicable law from issuing the CBA
preference shares, convertible notes will automatically convert
into CBA preference shares, which will result in mandatory
redemption of trust preferred securities for American Depository
Shares (“ADS”).
No later than 35 business days prior period to June 30, 2015,
holders may deliver a notice to CBA requiring it to exchange
each trust preferred security for CBA ordinary shares. The Bank
may satisfy the obligation to deliver ordinary shares in exchange
for the trust preferred securities by either delivering the
applicable number of ordinary shares or by arranging for the
sale of the trust preferred securities at par and delivering the
proceeds to the holder. Subject to the approval of APRA,
holders may exchange trust preferred securities for the Bank‟s
ordinary shares earlier than June 30, 2015 if, prior to that date, a
takeover bid or scheme of arrangement in relation to a takeover
has occurred.
If CBA Capital Trust is liquidated, dissolved or wound up and its
assets are distributed, for each trust preferred security owned,
the holder is entitled to receive the stated liquidation amount of
U.S. $1,000, plus the accrued but unpaid distribution for the then
current distribution period. Holders may not receive the full
amount payable on liquidation if CBA Capital Trust does not
have enough funds.
The trustees of CBA Capital Trust can elect to dissolve CBA
Capital Trust and distribute the funding preferred securities if at
any time certain changes in tax law or other tax-related events or
the specified changes in U.S. investment Company law occur.
Neither the trust preferred securities nor the funding preferred
securities can be redeemed at the option of their holders. Other
than in connection with an acceleration of the principal of the
convertible notes upon the occurrence of an event of default,
neither the trust preferred securities nor the funding preferred
securities are repayable in cash unless the Bank‟s New Zealand
branch, at its sole option, redeems the convertible notes.

Notes to the Financial Statements
112 Commonwealth Bank of Australia Financial Report (U.S. Version) 2009
Note 30 Loan Capital (continued)
The Bank‟s New Zealand branch may redeem the convertible
notes for cash: before 30 June 2015, in whole, but not in part,
and only if the specified changes in tax law or other tax-related
events, the specified changes in U.S. investment Company law
and‚ changes in the "Tier One'' regulatory capital treatment of
the convertible notes, or certain corporate transactions involving
a takeover bid or a scheme of arrangement in relation to a
takeover described in this offering memorandum occur; and at
any time on or after 30 June 2015. The Bank‟s New Zealand
branch must first obtain the approval of APRA to redeem the
convertible notes for cash.
CBA guarantees:
Semi-annual distributions on the funding preferred securities
by CBA Funding Trust to CBA Capital Trust to the extent
CBA Funding Trust has funds available for distribution;
Semi-annual distributions on the trust preferred securities by
CBA Capital Trust to the extent CBA Capital Trust has funds
available for distribution;
The redemption amount due to CBA Capital Trust if CBA
Funding Trust is obligated to redeem the funding preferred
securities for cash and to the extent CBA Funding Trust has
funds available for payment;
The redemption amount due if CBA Capital Trust is obligated
to redeem the trust preferred securities for cash and to the
extent CBA Capital Trust has funds available for payment;
The delivery of ADSs to CBA Capital Trust by CBA Funding
Trust if CBA Funding Trust is obligated to redeem the
funding preferred securities for ADSs and to the extent that
CBA Funding Trust has ADSs available for that redemption;
The delivery of ADSs by CBA Capital Trust if CBA Capital
Trust is obligated to redeem the trust preferred securities for
ADSs and to the extent that CBA Capital Trust has ADSs
available for that redemption;
The delivery of funding preferred securities by CBA Capital
Trust upon dissolution of CBA Capital Trust as a result of a
tax event or an event giving rise to a more than insubstantial
risk that CBA Capital Trust is or will be considered an
investment Company which is required to be registered
under the Investment Company Act;
The payment of the liquidation amount of the funding
preferred securities if CBA Funding Trust is liquidated, to the
extent that CBA Funding Trust has funds available after
payment of its creditors; and
The liquidation amount of the trust preferred securities if CBA
Capital Trust is liquidated, to the extent that CBA Capital
Trust has funds available after payment of its creditors.
The CBA guarantee does not cover the non-payment of
distributions on the funding preferred securities to the extent that
CBA Funding Trust does not have sufficient funds available to
pay distributions on the funding preferred securities.
Trust preferred securities have limited voting rights.
Trust preferred securities have the right to bring a direct action
against the Bank if:
The Bank‟s New Zealand branch does not pay interest on or
the redemption price of the convertible notes to CBA Funding
Trust in accordance with their terms;
The Bank‟s New Zealand branch does not deliver ADSs
representing CBA preference shares to CBA Funding Trust
in accordance with the terms of the convertible notes;
The Bank does not perform its obligations under its
guarantees with respect to the trust preferred securities and
the funding preferred securities; or
The Bank does not deliver cash or ordinary shares on 30
June 2015.
(6) PERLS II Redemption
On 16 March 2009, the Bank redeemed the $750 million PERLS
II (which qualified as innovative residual Tier One capital of the
Bank).
(7) PERLS III
On 6 April 2006 a wholly owned entity of the Bank (Preferred
Capital Limited “PCL”) issued $1,166 million of Perpetual
Exchangeable Repurchaseable Listed Shares (PERLS III).
PERLS III are preference shares in a special purpose Company,
(the ordinary shares of which are held by the Bank), perpetual in
nature, offering a non-cumulative floating rate distribution
payable quarterly. The shares qualify as innovative residual Tier
One capital of the Bank.
The Dividends paid to PERLS III Holders will be primarily
sourced from interest paid on the Convertible Notes issued by
CBA NZ to PCL. The payment of interest on the underlying
Convertible Notes and Dividends on PERLS III are not
guaranteed and are subject to a number of conditions including
the availability of profits and the Board (of the Bank in relation to
Convertible Note interest, or of PCL in relation to PERLS III
Dividends) resolving to make the payment.
The Dividend Rate is a floating rate calculated for each Dividend
Period as the sum of the Margin per annum plus the Market
Rate per annum multiplied by (One – Tax Rate). The Initial
Margin is 1.05% over Bank Bill Swap Rate and the Step-up
Margin, effective from the “Step-up Date” on 6 April 2016, is the
Initial Margin plus 1.00% per annum.
If each PERLS III Holder is not paid a dividend in full within 20
Business Days of the Dividend Payment Date, the Bank is
prevented from paying any interest, dividends or distributions, or
undertaking certain other transactions, in relation to any
securities of the Bank that rank for interest payments or
distributions equally with, or junior to, the Convertible Notes or
Bank PERLS III Preference Shares. This Dividend Stopper
applies until an amount in aggregate equal to the full dividend on
PERLS III for four consecutive dividend periods has been paid to
PERLS III Holders.
PERLS III will automatically exchange for Bank PERLS III
Preference Shares:
On a failure by PCL to pay a Dividend;
At any time at the Bank‟s discretion; or
10 Business Days before the Conversion Date
Subject to APRA approval, PCL may elect to exchange PERLS
III for the Conversion Number of Bank Ordinary Shares or $200
cash for each PERLS III:
On the Step-up Date or any Dividend Payment Date after the
Step-up Date; or
If a Regulatory Event or Tax Event occurs
PERLS III will automatically exchange for Bank Ordinary Shares
if:
An APRA Event occurs;
A Default Event occurs; or
A Change of Control Event occurs.

Notes to the Financial Statements
Commonwealth Bank of Australia Financial Report (U.S. Version) 2009 113
Note 30 Loan Capital (continued)
PERLS III will be automatically exchanged for Bank PERLS III
Preference Shares no later than 10 Business Days prior to 6
April 2046 (if they have not been exchanged before that date).
Holders are not entitled to request exchange or redemption of
PERLS III or Bank PERLS III Preference Shares.
Holders of PERLS III are entitled to vote at a general meeting of
PCL on certain issues. PERLS III holders have no rights at any
meeting of the Bank.
(8) PERLS IV
On 12 July 2007 the Bank issued $1,465 million of Perpetual
Exchangeable Resalable Listed Securities (PERLS IV). PERLS
IV are stapled securities comprising an unsecured subordinated
note issued by the Bank‟s New York branch and a convertible
preference share issued by the Bank. These securities are
perpetual in nature, offer a non-cumulative floating distribution
rate payable quarterly, and qualify as non-innovative residual
Tier One capital of the Bank.
The payment of interest on the underlying convertible notes and
dividends on PERLS IV are not guaranteed and are subject to a
number of conditions including the availability of profits and the
ability of the Board to stop payments.
The distribution rate is a floating rate calculated for each
distribution period as the sum of the Bank Bill Swap Rate plus
1.05% per annum, multiplied by (1 – Tax Rate).
Distributions paid to holders will be interest on notes until an
Assignment Event, and dividends on preference shares after the
Assignment Event. Upon an Assignment Event, the notes are
de-stapled from the preference shares and are assigned to the
Bank and investors continue to hold preference shares.
If distributions on PERLS IV are not paid in full within 20
business days of the payment date, an Assignment Event will
occur and the Bank is prevented from paying any interest,
dividends or distributions in relation to any securities of the Bank
that rank equally with or junior to the preference shares. This
“dividend stopper” applies until:
A Special Resolution of Holders authorising the payment,
capital return, buy-back, redemption or repurchase is
approved, and APRA does not otherwise object;
An Optional Dividend of an amount in aggregate equal to the
unpaid amount for the preceding four consecutive
Distribution Periods has been paid to Holders;
Four consecutive Dividends scheduled to be payable on
PERLS IV thereafter have been paid in full; or
All PERLS IV have been exchanged.
PERLS IV are expected to be exchanged for cash or converted
into ordinary shares of the Bank on 31 October 2012. However,
exchange may not occur if certain conditions are not met. On 31
October 2012;
The Bank may arrange a resale by requiring all Holders to
sell their PERLS IV to a third party for $200 (the face value);
If the Bank does not arrange a resale, an Assignment Event
will occur and PERLS IV will convert into a variable number
of ordinary shares of the Bank subject to some conditions
relating to the ordinary share price at the time;
If these conversion conditions are not satisfied on that date,
then the conversion date moves to the next distribution
payment date on which they are satisfied; and
In certain circumstances, where the conversion conditions
are not satisfied, the Bank may (subject to APRA‟s prior
approval) elect to repurchase all PERLS IV for $200 each.
The Bank may, subject to APRA‟s prior approval, elect to
exchange all PERLS IV for cash and/or ordinary shares if any of
the following occurs:
Tax Event;
Regulatory Event; and
Non-Operating Holding Company (NOHC) Event.
The Bank‟s ability to convert PERLS IV on the occurrence of any
of these events is subject to the same conversion conditions as
mentioned above.
If a change of control event occurs, Holders will receive cash for
all of their PERLS IV (subject to APRA‟s approval).
Holders are not entitled to request exchange or redemption of
PERLS IV.
Holders of PERLS IV have no right to vote at any meeting of the
Bank except in the following specific circumstances:
during a period during which a Dividend (or part of a
Dividend) in respect of the Preference Shares is in arrears;
on a proposal to reduce the Bank‟s share capital;
on a proposal that affects rights attached to Preference
Shares;
on a resolution to approve the terms of a buy-back
agreement;
on a proposal to wind up the Bank;
on a proposal for the disposal of the whole of the Bank‟s
property, business and undertaking; and
during the winding-up of the Bank.
(9) TPS 2006
On 15 March 2006 a wholly owned entity of the Bank issued
USD 700 million (AUD 942 million) of perpetual non-call 10 year
trust preferred securities into U.S. Capital Markets.
Each trust preferred security represents a preferred beneficial
ownership interest in the assets of CBA Capital Trust II. The
trust preferred securities are guaranteed by CBA. The trust
preferred securities form part of the Bank‟s innovative residual
Tier One capital.
CBA Capital Trust II is a statutory trust established under
Delaware law that exists for the purpose of issuing the trust
preferred securities, acquiring and holding the subordinated
notes issued by a CBA NZ subsidiary, the subordinated notes
guarantee and the CBA preference shares.
Cash distributions on the trust preferred securities are at the
fixed rate of 6.024% payable semi-annually to 15 March 2016.
Cash distributions on the trust preferred securities will accrue at
the rate of LIBOR plus 1.740% per annum payable quarterly in
arrears after that date.
Cash distributions on the trust preferred securities will be limited
to the interest CBA NZ Subsidiary pays on the subordinated
notes, payments in respect of interest on the subordinated notes
by CBA NZ Branch as guarantor under the subordinated notes
guarantee and, after 15 March 2016, the dividends CBA pays on
the CBA preference shares. Payments in respect of cash
distributions will be guaranteed on a subordinated basis by CBA,
as guarantor, but only to extent CBA Capital Trust II has funds
sufficient for the payment.

Notes to the Financial Statements
114 Commonwealth Bank of Australia Financial Report (U.S. Version) 2009
Note 30 Loan Capital (continued)
There are restrictions on CBA NZ Subsidiary‟s ability to make
payments on the subordinated notes, CBA NZ Branch‟s ability to
make payments on the CBA NZ Branch notes and the
subordinated notes guarantee and CBA‟s ability to make
payments on the CBA preference shares. Distributions on the
trust preferred securities are not cumulative.
Failure to pay in full a distribution within 21 business days will
result in the distribution to holders of one CBA preference share
for each trust preferred security held in redemption of the trust
preferred securities.
If CBA Capital Trust II is liquidated, dissolved or wound up and
its assets are distributed, for each trust preferred security,
holders are entitled to receive the stated liquidation amount of
USD 1,000, plus the accrued but unpaid distribution for the then
current distribution payment period, after it has paid liabilities it
owes to its creditors.
The trust preferred securities are subject to redemption for cash,
qualifying Tier One securities or CBA preference shares if CBA
redeems or varies the terms of the CBA preference shares. The
trust preferred securities are also subject to redemption if any
other Assignment Event occurs.
If the CBA preference shares are redeemed for qualifying Tier
One securities or the terms thereof are varied, holders will
receive one CBA preference share or USD 1,000 liquidation
amount or similar amount of qualifying Tier One securities for
each trust preferred security held.
Holders of trust preferred securities generally will not have any
voting rights except in limited circumstances.
The holders of a majority in liquidation amount of the trust
preferred securities, acting together as a single class, however,
have the right to direct the time, method and place of conducting
any proceeding for any remedy available to the property trustee
of CBA Capital Trust II or direct the exercise of any trust or
power conferred upon the property trustee of CBA Capital Trust
II, as holder of the subordinated notes and the CBA preference
shares.
Trust preferred securities holders have the right to bring a direct
action against:
CBA NZ Subsidiary if CBA NZ Subsidiary does not pay when
due, interest on the subordinated notes or certain other
amounts payable under the subordinated notes to CBA
Capital Trust II in accordance with their terms;
The Bank if it does not perform its obligations under the trust
guarantee; and
CBA NZ Branch or the Bank if CBA NZ Branch does not
perform its obligations under the subordinated notes
guarantee or under the CBA NZ Branch notes.
The Bank will guarantee the trust preferred securities:
Cash distributions on the trust preferred securities by CBA
Capital Trust II to holders of trust preferred securities on
distribution payment dates, to the extent CBA Capital Trust II
has funds available for distribution;
The cash redemption amount due to holders of trust
preferred securities if CBA Capital Trust II is obligated to
redeem the trust preferred securities for cash, to the extent
CBA Capital Trust II has funds available for distribution;
The delivery of CBA preference shares or qualifying Tier One
securities to holders of trust preferred securities if CBA
Capital Trust II is obligated to redeem the trust preferred
securities for CBA preference shares or qualifying Tier One
securities, to the extent CBA Capital Trust II has or is entitled
to receive such securities available for distribution; and
The payment of the liquidation amount of the trust preferred
securities if CBA Capital Trust II is liquidated, to the extent
that CBA Capital Trust II has funds available for distribution.
The trust guarantee does not cover the failure to pay
distributions or make other payments or distributions on the trust
preferred securities to the extent that CBA Capital Trust II does
not have sufficient funds available to pay distributions or make
other payments or deliveries on the trust preferred securities.
Upon the occurrence of an Assignment Event, with respect to
the subordinated notes comprising a part of the units CBA
Capital Trust II holds to which such Assignment Event applies:
The subordinated notes will detach from the CBA preference
shares that are part of those units and automatically be
transferred to CBA;
If the Assignment Event is the cash redemption of CBA
preference shares, upon receipt, CBA Capital Trust II will pay
to the holders of the trust preferred securities called for
redemption the cash redemption price for those CBA
preference shares and the accrued and unpaid interest on
the subordinated notes that were part of the units with those
CBA preference shares; and
If the Assignment Event is not the cash redemption of CBA
preference shares, CBA Capital Trust II will deliver to all
holders of trust preferred securities in redemption thereof one
CBA preference share for each USD 1,000 liquidation
preference of trust preferred securities to be redeemed or, if
qualifying Tier One securities are delivered, USD 1,000
liquidation amount or similar amount of qualifying Tier One
securities for each USD 1,000 liquidation amount of trust
preferred securities to be redeemed, and the CBA preference
shares or qualifying Tier One securities will accrue non-
cumulative dividends or similar amounts at the rate of
6.024% per annum to but excluding March 15, 2016 and at
the rate of LIBOR plus 1.740% per annum thereafter.
If the Bank is liquidated, holders of CBA preference shares will
be entitled to receive an amount equal to a liquidation
preference out of surplus assets of USD 1,000 per CBA
preference share plus accrued and unpaid dividends for the then
current dividend payment period plus any other dividends or
other amounts to which the holder is entitled under the
Constitution.
Subject to APRA‟s prior approval, prior to the occurrence of an
Assignment Event that applies to all of the subordinated notes,
the Bank may pay an optional dividend on the CBA preference
shares if CBA NZ Subsidiary or CBA NZ Branch, as guarantor,
has failed to pay in full interest on the subordinated notes or the
Bank has failed to pay in full dividends on the CBA preference
shares on any interest payment date and/or dividend payment
date.
On or after 15 March 2016, the Bank may redeem the CBA
preference shares for cash, in whole or in part, on any date
selected by us at a redemption price equal to USD 1,000 per
share plus any accrued and unpaid dividends for the then
current dividend payment period, if any.
Prior to 15 March 2016, the Bank may redeem the CBA
preference shares for cash, vary the terms of the CBA
preference shares or redeem the CBA preference shares for
qualifying Tier One securities, in whole but not in part, on any
date selected by the Bank:

Notes to the Financial Statements
Commonwealth Bank of Australia Financial Report (U.S. Version) 2009 115
Note 30 Loan Capital (continued)
If the CBA preference shares are held by CBA Capital Trust
II, upon the occurrence of a trust preferred securities tax
event, an adverse tax event, an investment Company event
or a regulatory event; or
If the CBA preference shares are not held by CBA Capital
Trust II, upon the occurrence of a preference share
withholding tax event, an adverse tax event or a regulatory
event.
Holders of CBA preference shares will be entitled to vote
together with the holders of our ordinary shares on the basis of
one vote for each CBA preference share:
During a period in which a dividend (or part of a dividend) in
respect of the CBA preference shares is in arrears;
On a proposal to reduce share capital;
On a proposal that affects rights attached to the CBA
preference shares;
On a resolution to approve the terms of a Buy-back
agreement;
On a proposal for the disposal of the whole of the Group‟s
property, business and undertaking; and
On a proposal to wind up and during the winding up of the
Group.
The rights attached to the CBA preference shares may not be
changed except with any required regulatory approvals and with
the consent in writing of the holders of at least 75% of the CBA
preference shares.
CBA NZ Subsidiary may not make payments on the
subordinated notes, CBA NZ Branch may not make payments
on the subordinated notes guarantee or the CBA NZ Branch
notes and CBA may not make payments on the CBA preference
shares if an APRA condition exists; if a CBA stopper resolution
has been passed and not been rescinded or if CBA NZ
Subsidiary, CBA NZ branch or CBA, as the case may be, is
prohibited from making such a payment by instruments or other
obligations of CBA.
If distributions, interest or dividends are not paid in full on a
payment date; the redemption price is not paid or securities are
not delivered in full on a redemption date for the trust preferred
securities or the CBA preference shares, then the Bank may not
pay any interest; declare or pay any dividends or distributions
from the income or capital of CBA, or return any capital or
undertake any buy-backs, redemptions or repurchases of
existing capital securities or any securities, or instruments of
CBA that by their terms rank or are expressed to rank equally
with or junior to the CBA NZ Branch notes or the CBA
preference shares for payment of interest, dividends or similar
amounts unless and until,
In the case of any non-payment of distributions on the trust
preferred securities on any distribution payment date, on or
within 21 business days after any distribution payment date,
CBA Capital Trust II or CBA, as guarantor, has paid in full to
the holders of the trust preferred securities any distributions
owing in respect of that distribution payment date through the
date of actual payment in full;
In the case of any non-payment of a dividend on the CBA
preference shares on any dividend payment date, CBA has
paid (A) that dividend in full on or within 21 business days
after that dividend payment date, (B) an optional dividend
equal to the unpaid amount of scheduled dividends for the 12
consecutive calendar months prior to the payment of such
dividend or (C) dividends on the CBA preference shares in
full on each dividend payment date during a 12 consecutive
month period;
In the case of any non-payment of interest on the
subordinated notes on any interest payment date, (A) on or
within 21 business days after any interest payment date, (i)
CBA NZ Subsidiary or CBA NZ Branch, as guarantor, has
paid in full to the holders of the subordinated notes any
interest and other amounts owing in respect of that interest
payment date (excluding defaulted note interest) through the
date of actual payment in full or (ii) with the prior approval of
APRA, CBA has paid in full to holders of the subordinated
notes an assignment prevention optional dividend in an
amount equal to such interest and any other amounts, or (B)
CBA has paid dividends on the CBA preference shares in full
on each dividend payment date during a 12 consecutive
month period; and
In the case of any non-payment of the redemption price or
non-delivery of the securities payable or deliverable with
respect to CBA preference shares or the trust preferred
securities, such redemption price or securities have been
paid or delivered in full, as applicable.
then there are restrictions on the Bank paying any interest on
equal ranking or junior securities.
(10) AUD denominated Tier Two Loan Capital issuances
AUD 275 million extendible floating rate note issued
December 1989, due December 2014;
The Bank has entered into a separate agreement with the
Commonwealth of Australia relating to the above issue (the
“Agreement”) which qualifies the issue as Tier Two capital. The
Agreement provides for the Bank to issue either fully paid
ordinary shares to the Commonwealth of Australia or (with the
consent of the Commonwealth of Australia) rights to all
shareholders to subscribe for fully paid ordinary shares up to an
amount equal to the outstanding principal value of the note issue
plus any interest paid in respect of the notes for the most recent
financial year and accrued interest. The issue price will be
determined by reference to the prevailing market price for the
Bank‟s shares.
Any one or more of the following events will trigger the issue of
shares to the Commonwealth of Australia or a rights issue:
A relevant event of default occurs in respect of the note issue
and, where applicable, the Trustee of the notes gives notice
of such to the Bank;
The Bank, if required by the Commonwealth of Australia and
subject to the agreement of the APRA, exercises its option to
redeem such issue; or
Any payment made by the Commonwealth of Australia
pursuant to its guarantee in respect of the issue will trigger
the issue of shares to the Commonwealth of Australia to the
value of such payment.
Original issue size was $300 million; $25 million matured in
December 2004.
AUD 25 million subordinated FRN, issued April 1999, due
April 2029;
AUD 500 million subordinated notes, issued February 2004,
due February 2014; split into AUD 300 million fixed rate
notes and AUD 200 million floating rate notes. Early
redeemed in February 2009;
AUD 300 million subordinated floating rate notes, issued
February 2005, due February 2015;

Notes to the Financial Statements
116 Commonwealth Bank of Australia Financial Report (U.S. Version) 2009
Note 30 Loan Capital (continued)
AUD 300 million subordinated floating rate notes, issued
November 2005, due November 2015;
AUD 200 million subordinated floating rate notes, issued
September 2006, due September 2016;
AUD 500 million subordinated notes, issued May 2007, due
May 2017; split into AUD 150 million fixed rate notes and
AUD 350 million floating rate notes; and
AUD 500 million subordinated floating rate notes, issued
September 2008, due September 2018.
(11) USD denominated Tier Two Loan Capital issuances
USD 300 million subordinated notes, issued June 2000, due
June 2010;
USD 350 million subordinated fixed rate note, issued June
2003, due June 2018;
USD 500 million subordinated EMTN issued June 2004
(USD 250 million) and August 2004 (USD 250 million), due
August 2014;
USD 100 million subordinated EMTN, issued March 2005,
due March 2025. Partial redemption of USD 39.5 million in
September 2005;
USD 200 million subordinated notes, issued June 2006, due
July 2016;
USD 300 million subordinated floating rate notes, issued
September 2006, due September 2016; and
USD 650 million subordinated floating rate notes, issued
December 2007, due December 2016.
(12) JPY denominated Tier Two Loan Capital issuances
JPY 20 billion perpetual subordinated EMTN, issued
February 1999;
JPY 30 billion subordinated EMTN, issued October 1995 due
October 2015;
JPY 10 billion subordinated EMTN, issued May 2004, due
May 2034;
JPY 10 billion subordinated notes, issued November 2005,
due November 2015;
JPY 5 billion subordinated loan, issued March 2006, due
March 2018; and
JPY 9 billion perpetual subordinated notes, issued May 1996.
(13) GBP denominated Tier Two Loan Capital issuances
GBP 150 million subordinated EMTN, issued June 2003, due
December 2023.
(14) Other currencies Tier Two Loan Capital issuances
EUR 300 million subordinated EMTN, issued March 2005,
due March 2015;
CAD 300 million subordinated notes, issued November 2005,
due November 2015;
CAD 300 million subordinated notes, issued October 2007,
due October 2017;
NZD 350 million subordinated notes, issued May 2005, due
April 2015;
NZD 200 million subordinated notes issued June 2006, due
June 2016; and
NZD 370 million subordinated notes, issued November 2007,
due November 2017.

Notes to the Financial Statements
Commonwealth Bank of Australia Financial Report (U.S. Version) 2009 117
Note 31 Detailed Statements of Changes in Equity
Group Bank
2009 2008 2009 2008
$M $M $M $M
Equity Reconciliations
Ordinary Share Capital
Opening balance 15,727 14,483 15,927 14,691
Issue of shares (net of issue costs) 4,829 141 4,829 141
Dividend reinvestment plan 1,099 1,109 1,099 1,109
Exercise of executive options under employee share ownership schemes 1 3 1 3
(Purchase)/sale and vesting of treasury shares(1) (14) (9) (31) (17)
Closing balance 21,642 15,727 21,825 15,927
Other Equity Instruments
Opening balance 939 939 1,895 1,895
Closing balance 939 939 1,895 1,895
Retained Profits
Opening balance 7,747 6,367 7,353 6,315
Loyalty program adjustment - (5) - (5)
Restated opening balance 7,747 6,362 7,353 6,310
Actuarial (losses)/gains from defined benefit superannuation plans (739) (240) (739) (240)
Realised gains and dividend income on treasury shares held within the Group's
life insurance statutory funds (1) 18 26 - -
Operating profit attributable to Equity holders of the Bank 4,723 4,791 3,086 4,358
Total available for appropriation 11,749 10,939 9,700 10,428
Transfers (to)/from general reserve (193) (85) - -
Transfers from general reserve for credit losses - 350 - 350
Interim dividend - cash component(2) (1,257) (1,087) (1,257) (1,087)
Interim dividend - dividend reinvestment plan (405) (400) (405) (400)
Final dividend - cash component (1,335) (1,229) (1,335) (1,229)
Final dividend - dividend reinvestment plan (694) (709) (694) (709)
Other dividends (40) (32) - -
Closing balance 7,825 7,747 6,009 7,353
(1) Relates to movement in treasury shares held within life insurance statutory funds and the employee share scheme trust.
(2) Includes $98 million of shares purchased on-market to partly satisfy the Dividend Reinvestment Plan in the year ended 30 June 2008.

Notes to the Financial Statements
118 Commonwealth Bank of Australia Financial Report (U.S. Version) 2009
Note 31 Detailed Statements of Changes in Equity (continued)
Group Bank
2009 2008 2009 2008
$M $M $M $M
Reserves
General Reserve
Opening balance 1,252 1,167 570 570
Appropriation from/(to) retained profits 193 85 - -
Closing balance 1,445 1,252 570 570
Capital Reserve
Opening balance 293 287 1,544 1,538
Revaluation surplus on sale of property 6 6 6 6
Closing balance 299 293 1,550 1,544
Asset Revaluation Reserve
Opening balance 195 185 166 157
Revaluation of properties (25) 20 (20) 19
Transfers on sale of properties (6) (6) (6) (6)
Tax on revaluation of properties 9 (4) 8 (4)
Closing balance 173 195 148 166
Foreign Currency Translation Reserve
Opening balance (795) (200) (228) (126)
Currency translation adjustments of foreign operations 514 (555) 158 (103)
Currency translation on net investment hedge (346) (93) - -
Tax on translation adjustments (2) 23 - 1
Tax on net investment hedge movement 96 30 - -
Closing balance (533) (795) (70) (228)
Cash Flow Hedge Reserve
Opening balance 341 440 292 211
Gains and losses on cash flow hedging instruments:
Recognised in equity (1,630) 422 (872) 426
Transferred to Income Statement
Interest income (611) 88 (578) 86
Interest expense 590 (661) 379 (404)
Tax on cash flow hedging instruments 497 52 319 (27)
Closing balance (813) 341 (460) 292
Employee Compensation Reserve
Opening balance (39) (51) (39) (51)
Current period movement 39 12 39 12
Closing balance - (39) - (39)
General Reserve for Credit Losses (1)
Opening balance - 350 - 350
Transfer to retained profits - (350) - (350)
Closing balance - - - -
Available-for-Sale Investments Reserve
Opening balance (41) (35) (52) (27)
Net gains and losses on revaluation of available-for-sale investments 10 262 52 240
Net gains and losses on available-for-sale investments transferred to
Income Statement on disposal (24) (312) (24) (272)
Net gains and losses on available-for-sale investments transferred to
Income Statement for impairment 37 - - -
Tax on available-for-sale investments (37) 44 (17) 7
Closing balance (55) (41) (41) (52)
Total reserves 516 1,206 1,697 2,253
Shareholders' equity attributable to Equity holders of the Bank 30,922 25,619 31,426 27,428
Shareholders' equity attributable to minority interests 520 518 - -
Total Shareholders' equity 31,442 26,137 31,426 27,428
(1) The Group was previously required to maintain a Prudential General Reserve for Credit Losses (“GRCL”), however, as this is no longer required it has been returned
to Retained Profits.

Notes to the Financial Statements
Commonwealth Bank of Australia Financial Report (U.S. Version) 2009 119
Note 31 Detailed Statements of Changes in Equity (continued)
The following table shows the gross amount of deferred gains/(losses) in relation to cash flow hedges.
Cash Flow Hedges – Deferred Gains/(Losses)
Exchange Rate Interest Rate Group
Related Contracts Related Contracts Total
2009 2008 2009 2008 2009 2008
$M $M $M $M $M $M
Within 6 months 56 59 (125) 43 (69) 102
Within 6 months - 1 year 7 - (132) 30 (125) 30
Within 1 - 2 years - - (472) 72 (472) 72
Within 2 - 5 years - - (703) 137 (703) 137
After 5 years (2) 1 204 144 202 145
Net deferred gains/(losses) 61 60 (1,228) 426 (1,167) 486
Exchange Rate Interest Rate Bank
Related Contracts Related Contracts Total
2009 2008 2009 2008 2009 2008
$M $M $M $M $M $M
Within 6 months 27 34 (57) 31 (30) 65
Within 6 months - 1 year 7 - (26) 16 (19) 16
Within 1 - 2 years - - (217) 65 (217) 65
Within 2 - 5 years - - (563) 132 (563) 132
After 5 years (2) (8) 169 142 167 134
Net deferred gains/(losses) 32 26 (694) 386 (662) 412

Notes to the Financial Statements
120 Commonwealth Bank of Australia Financial Report (U.S. Version) 2009
Note 32 Share Capital
Share Capital Group Bank
2009 2008 2009 2008
Issued and Paid Up Ordinary Capital $M $M $M $M
Ordinary Share Capital
Opening balance (excluding Treasury Shares deduction) 15,991 14,738 15,991 14,738
Dividend reinvestment plan: Final dividend prior year 694 709 694 709
Dividend reinvestment plan: Interim dividend 405 400 405 400
Share Issue including issue costs 4,829 141 4,829 141
Exercise of executive options under employee share ownership
schemes 1 3 1 3
Closing balance (excluding Treasury Shares deduction) 21,920 15,991 21,920 15,991
Less: Treasury Shares (278) (264) (95) (64)
Closing balance 21,642 15,727 21,825 15,927
Shares Shares Shares Shares
Shares Authorised and on Issue
Opening balance (excluding Treasury Shares deduction) 1,326,130,877 1,300,583,376 1,326,130,877 1,300,583,376
Dividend reinvestment plan issues:
2006/2007 Final dividend fully paid ordinary shares $54.80 - 12,938,969 - 12,938,969
2007/2008 Interim dividend fully paid ordinary shares $39.44 - 10,156,101 - 10,156,101
2007/2008 Final dividend fully paid ordinary shares $42.41 16,372,698 - 16,372,698 -
2008/2009 Interim dividend fully paid ordinary shares $28.45 14,283,851 - 14,283,851 -
Issue of shares 161,983,643 2,327,431 161,983,643 2,327,431
Exercise of executive options under employee share ownership
schemes 30,000 125,000 30,000 125,000
Closing balance (excluding Treasury Shares deduction) 1,518,801,069 1,326,130,877 1,518,801,069 1,326,130,877
Less: Treasury Shares (7,192,560) (7,988,013) (2,121,299) (1,787,446)
Closing balance 1,511,608,509 1,318,142,864 1,516,679,770 1,324,343,431
Terms and Conditions of Ordinary Share Capital
Ordinary shares have the right to receive dividends as declared and in
the event of winding up the Company, to participate in the proceeds
from sale of surplus assets in proportion to the number of and amounts
paid up on shares held.
A shareholder has one vote on a show of hands and
one vote for each fully paid share on a poll. A
shareholder may be present at a general meeting in
person or by proxy or attorney, and if a body corporate,
it may also authorise a representative.
Group Bank
2009 2008 2009 2008
Other Equity Instruments $M $M $M $M
Other equity instruments issued and paid up 939 939 1,895 1,895
Shares Shares Shares Shares
700,000 700,000 1,400,000 1,400,000
Trust Preferred Securities 2006
On 15 March 2006 the Bank issued USD 700 million ($947 million) of
trust preferred securities into the U.S. capital markets. These securities
offer a non-cumulative fixed rate of distribution of 6.024% per annum
payable semi-annually.
These securities qualify as Tier One Capital of the
Bank. A related instrument was issued by the Bank to a
subsidiary for $956 million and eliminates on
consolidation.

Notes to the Financial Statements
Commonwealth Bank of Australia Financial Report (U.S. Version) 2009 121
Note 32 Share Capital (continued)
Dividends
The Directors have declared a fully franked final dividend of 115
cents per share amounting to $1,747 million. The dividend will
be payable on 1 October 2009 to shareholders on the register at
5pm on 21 August 2009.
The Board determines the dividends per share based on net
profit after tax (“cash basis”) per share, having regard to a range
of factors including:
Current and expected rates of business growth and the mix
of business;
Capital needs to support economic, regulatory and credit
ratings requirements;
Investments and/or divestments to support business
development;
Competitors comparison and market expectation; and
Earnings per share growth.
Dividends paid since the end of the previous financial
year:
As declared in the 31 December 2008 Profit Announcement, a
fully franked interim dividend of 113 cents per share amounting
to $1,662 million was paid on 23 March 2009. The payment
comprised cash disbursements of $1,257 million with $405
million being reinvested by participants through the Dividend
Reinvestment Plan.
Dividend Reinvestment Plan
The Bank expects to issue around $507 million of shares in
respect of the Dividend Reinvestment Plan for the final dividend
for the 2009 financial year.
Record date
The register closed for determination of dividend entitlement and
for participation in the dividend reinvestment plan at 5pm on 21
August 2009 at Link Market Services Limited, Locked Bag A14,
Sydney South, 1235.
Ex-dividend Date
The ex-dividend date was 17 August 2009.
Employee Share Plans
The Group had the following employee share plans in place
during the year ended 30 June 2009:
Commonwealth Bank Employee Share Acquisition Plan
(“ESAP”);
Commonwealth Bank Equity Participation Plan (“EPP”);
Commonwealth Bank Group Leadership Share Plan
(“GLSP”);
Commonwealth Bank Equity Reward Plan (“ERP”); and
Commonwealth Bank Non-Executive Directors Share Plan
(“NEDSP”).
The current ESAP and ERP arrangements were each approved
by Shareholders at the Annual General Meeting (“AGM”) on 26
October 2000. The GLSP was approved by Shareholders at the
AGM on 13 November 2007. Shareholders‟ consent was not
required for either the EPP or NEDSP but details were included
in the Explanatory Memorandum to the 2000 meeting to ensure
Shareholders were fully informed.
Changes Since 2008
Two new Share Plans have been developed and are governed
by the rules of the EPP. These new plans are known as the
Enterprise Services Retention Plan (“ESRP”) and the Sign-On
Incentive Share Plan (“SOI”).
As a result of the increased demand for individuals with the skills
required for the successful delivery of major IT change
programmes, the ESRP was introduced to assist the business to
retain and motivate identified key executives.
The SOI was introduced to facilitate the purchase of shares
offered in contract arrangements when recruiting for key roles
within the Group.
Shares for both plans are purchased on market and held in Trust
and vest subject to the meeting of vesting conditions.
Employee Share Acquisition Plan (“ESAP”)
The ESAP was introduced in 1996 and provides eligible
employees with the opportunity to receive up to $1,000 worth of
free shares each year if the Group meets the required
performance target. The performance target is growth in annual
profit of the greater of 5% or the consumer price index (CPI
change) plus 2%. Whenever annual profit growth exceeds CPI
change, the Board may use its discretion in determining whether
any grant of shares will be made. Notwithstanding the existence
of these performance hurdles, the Board has the authority to
apply discretion under the Plan Rules for a grant to be made.
Under ESAP, shares granted are restricted for sale for three
years or until such time as the participating employee ceases
employment with the Group, whichever is earlier. Shares
granted under the ESAP receive full dividend entitlements,
voting rights and there are no forfeiture or vesting conditions
attached to the shares granted.
While the Group did not achieve the performance target for the
2007/08 financial year, the Board exercised its discretion and
approved a partial grant of up to $720 worth of shares to be
made to eligible employees under the ESAP for 2008.
The grant recognised the commitment and efforts of employees
that contributed to the Group‟s positive results for the year
ended 30 June 2008 in a difficult economic environment.
The grant was allocated to eligible employees that achieved a
minimum performance rating of “Meets Expectations” during the
2007/08 financial year.
Effective from 1 July 2002, shares granted under ESAP offers
have been expensed through the profit and loss. On 19
September 2008, 400,367 shares were granted to 23,551
eligible employees in respect of the 2008 ESAP grant.
The Issue Price for the offer is equal to the volume weighted
average of the prices at which the CBA shares were traded on
the ASX during the 5 trading day period up to and including the
grant date. For the 2008 grant, this was $41.22.
It is estimated that approximately $16 million of ordinary shares
will be purchased on-market at the prevailing market price for
the 2009 ESAP grant.

Notes to the Financial Statements
122 Commonwealth Bank of Australia Financial Report (U.S. Version) 2009
Note 32 Share Capital (continued)
Equity Participation Plan (“EPP”)
The EPP comprises a voluntary and a mandatory component.
The voluntary component facilitates the voluntary sacrifice of
both fixed remuneration and annual short term incentives (STI)
to be applied in the acquisition of shares under the Voluntary
Equity Participation (VEP) plan. The mandatory component
comprises the sacrifice of one third of STI payments for
executives under the Leadership Incentive Plan (“LISP”) and
allocations under the ESRP and SOI.
Under the voluntary component of the EPP, shares purchased
are restricted for sale for two years or when a participating
employee ceases employment with the Group, whichever is
earlier. Shares purchased under the voluntary component of the
EPP carry full dividend entitlements, voting rights and there are
no forfeiture or vesting conditions attached to the shares.
Under the mandatory component of the EPP, fully paid ordinary
shares are purchased and held in trust until such time as the
vesting conditions have been met. The vesting condition
attached to the shares specifies that participants must generally
remain employees of the Group until the vesting date. Shares
previously granted under the mandatory component of the EPP
remain subject to their vesting conditions.
Each participant in the mandatory component of the EPP for
whom shares are held by the Trustee on their behalf has a right
to receive dividends. Once the shares vest, dividends which
have accrued in the trust during the vesting period are paid to
participants.
The participant may also direct the Trustee on how the voting
rights attached to the shares are to be exercised during the
vesting period. Where participating employees do not satisfy the
vesting conditions, shares and dividend rights are forfeited.
Shares acquired under the EPP are expensed. In the current
year, $31.4 million was expensed to reflect the cost of
allocations under the Plan. This current year expense is higher
than last year‟s due to the inclusion of the ESRP, SOI and 2008
LISP grants.
All shares acquired by employees under the EPP are purchased
on-market at the current market price. A total number of
10,077,516 shares have been acquired under the EPP since the
plan commenced in 2001.
For a limited number of executives a cash-based LISP replicator
scheme is operated by way of grants of Performance Units – the
Leadership Incentive (Performance Unit) Plan (“LIPUP”). A
Performance Unit is a monetary unit with a value linked to the
share price of Commonwealth Bank shares. Performance Units
granted under LIPUP are subject to the same vesting conditions
as the LISP. On meeting the vesting condition, a cash payment
is made to executives, the value of which is determined based
on the Group‟s share price upon vesting plus an accrued
dividend value.
A total of $1.0 million for the LIPUP has been expensed in
respect of the year ended 30 June 2009.
Details of purchases under the EPP from 1 July 2008 to 30 June 2009 were as follows:
Allotment Date Participants Shares Purchased Average Purchase Price
20 - 28 August 2008 307 764,677 $41.84
2 September 2008 1 93,825 $41.17
5 September 2008 157 149,146 $41.52
20 February 2009 76 63,101 $29.41
The movement in shares purchased under the mandatory component of the EPP has been as follows:
Details of Movements July 2008 - June 2009 July 2007 - June 2008
Shares held under the Plan at the beginning of year (no.) 614,029 63,444
Shares allocated during the year (no.) 967,237 652,055
Shares vested during the year (no.) (129,619) (21,148)
Shares forfeited during the year (no.) (40,937) (80,322)
Shares held under the Plan at end of year (no.) 1,410,710 614,029

Notes to the Financial Statements
Commonwealth Bank of Australia Financial Report (U.S. Version) 2009 123
Note 32 Share Capital (continued)
Group Leadership Share Plan (GLSP)
Effective 1 July 2007, the GLSP has been the Group‟s long term
incentive plan for the CEO and Group Executives.
Under the GLSP, participants will share in a pool that may vest
at the end of the three year performance period subject to
satisfaction of the performance conditions.
Two grants have been made under the GLSP. For the grant
made in:
2007/08, participants will share in a pool to the value of 2.2%
of the growth in the Group‟s Profit after Capital Charge
(PACC), capped at a maximum pool of $34 million.
2008/09, participants will share in a pool to the value of 3.5%
of the growth in the Group‟s Profit after Capital Charge
(PACC), capped at a maximum pool of $36.1 million.
The grants are subject to both of the following performance
hurdles:
The Group‟s NPAT growth over the three year period must
be above the average of NPAT growth of ANZ, NAB, and
Westpac; and
The Group‟s customer satisfaction relative to ANZ, NAB, St
George and Westpac.
The 2007/08 grant is measured from 1 July 2007 and may vest
depending on performance to 1 July 2010. The 2008/09 grant is
measured from 1 July 2008 and may vest depending on
performance to 1 July 2011.
In order to determine the Group‟s level of achievement against
the customer satisfaction performance hurdle, scores are taken
for both the Group and the peer group from independent
external surveys. A ranking is then determined and a vesting
scale applied.
If the Group‟s NPAT is below the average of the peer group,
then nothing will vest regardless of the Group‟s customer
satisfaction ranking.
The GLSP will provide reward shares to the participants if and
when grants vest. The number of reward shares to vest will be
determined by the value of the pool that vests at the end of the
performance period and the share price at the end of the
relevant performance period. As the GLSP commenced on 1
July 2007, no reward shares have yet been delivered.
A total of $8.4 million has been expensed in respect of the year
ended 30 June 2009.
Further details of the GLSP are available in the Remuneration
Report.
Equity Reward Plan (ERP)
The ERP was the Group‟s previous long term incentive
arrangement for executives, which has since been replaced by
the GLSP and LISP arrangements. No grants were made under
the ERP during the 2009 financial year. The last allocation under
the ERP was made in July 2006 and tested for vesting in July
2009. The measurement reached the 86th percentile resulting in
a 100% vesting. No further grants will be made under the ERP.
The Board envisaged that up to a maximum of 500 employees
would participate each year in the ERP.
Previous grants under the ERP were in two parts, comprising
grants of options, where recipients pay a set exercise price to
convert each option to one CBA share once the option has
vested, and grants of shares, where no exercise price is payable
for participants to receive CBA shares upon vesting. Since
2001/02, no options have been issued under the ERP. From
2002/03, only Reward Shares have been issued under this plan.
The exercise of previously granted options and the vesting of
employee legal title to the shares are conditional on the Group
achieving a prescribed performance hurdle. The ERP
performance hurdle is based on relative Total Shareholder
Return (TSR) with the Group‟s TSR performance being
measured against a comparator group of companies. TSR is
calculated by combining the reinvestment of dividends and
share price movements over the period.
For Reward Shares granted from 2002/03 to 2005/06 inclusive,
a tiered vesting scale was applied so that 50% of the allocated
shares vested if the Group‟s TSR return was equal to the 50th
percentile, 75% vested at the 67th percentile and 100% vested
when the Group‟s return was in the top quartile. The minimum
vesting period was three years. There were then four retesting
opportunities until the maximum five year vesting period
concluded. All unvested Reward Shares in the Plan at the end of
the vesting period were to be forfeited. Employees who exited
the Group before the grants vested forfeited their allocation.
Where the performance rating was at least at the 50th percentile
on the third anniversary of the grant, the shares would vest at a
time nominated by the executive, within the trading windows,
over the next two years. The vesting percentage would be at
least that achieved on the third anniversary of the grant and the
executive would be able to delay vesting until a subsequent half
yearly window prior to the fifth anniversary of the grant. The
vesting percentage would be calculated by reference to the
rating at that time.
Where the rating was below the 50th percentile on the third
anniversary of grant, the shares would still vest if the rating
reached the 50th percentile prior to the fifth anniversary, but the
maximum vesting would be 50%.
For Reward Shares granted in 2006/07 a straight line vesting
scale is applied, with 50% vesting at the 51st percentile, through
to 100% vesting at the 75th percentile. The minimum vesting
period for these grants is three years. Where at the first
measurement date the Group‟s percentile ranking is lower than
the 51st percentile, there will be one retest 12 months later at
which time 50% of shares will vest if the Group‟s percentile
reaches the 51st percentile. In this circumstance the maximum
vesting period is 4 years, the maximum number of shares that
may vest is 50%, the shares shall vest immediately and the
participant shall have no entitlement to further shares. All
unvested Reward Shares remaining in the Plan at the end of the
vesting period are forfeited. Employees who exit the Group
before the grant vests forfeit their allocation.
During the vesting period, Reward Shares are held in Trust.
Each participant on behalf of whom Reward Shares are held by
the Trustee has a right to receive dividends. If the shares vest,
dividends are paid in relation to those accrued during the vesting
period. The participant may also direct the Trustee on how the
voting rights attached to the shares are to be exercised during
the vesting period.
Reward Shares acquired under the share component of the
ERP are purchased on-market at the current market price. In the
current year, a total of $12.1 million has been expensed. The fair
value of shares allocated under the ERP is expensed over three
to five years, reflecting the expected vesting period.
For a limited number of executives a cash-based ERP replicator
scheme is operated by way of grants of Performance Units – the
Equity Reward (Performance Unit) Plan (ERPUP). A
Performance Unit is a monetary unit with a value linked to the
share price of Commonwealth Bank shares. Performance Unit
grants are subject to the same vesting conditions as the ERP.

Notes to the Financial Statements
124 Commonwealth Bank of Australia Financial Report (U.S. Version) 2009
Note 32 Share Capital (continued)
Equity Reward Plan (ERP) (continued)
On meeting the vesting condition, a cash payment is made to
executives the value of which is determined based on the Group‟s
share price on vesting plus an accrued dividend value.
A total of $5.1 million for the ERPUP has been expensed in
respect of the year ended 30 June 2009. The current year
expense is lower than last year‟s due to the run-off of the plans.
Executive options issued up to September 2001 have not been
recorded as an expense by the Group.
Details of movements in ERP options and shares are as follows:
Options – Details of Movements
July 2008 - June 2009 July 2007 - June 2008
Year of Grant 2000 (3)
2001 (4)
2000 (3)
2001 (4)
Exercise price (1) (2) 26.97 30.12 26.97 30.12
Held by participants at the start of the year (no.) 97,500 314,100 97,500 426,600
Granted during the year (no.) - - - -
Exercised during the year (no.) (12,500) (17,500) - (112,500)
Lapsed during the year (no.) - - - -
Outstanding at the end of year (no.) 85,000 296,600 97,500 314,100
Total consideration paid due to exercises to date of report (5) 337,125$ 527,100$ - 3,388,500$
(1) The Exercise Price is the market value at the commencement date. Market value is defined as the weighted average of the prices at which shares were traded on the ASX during the one week period before the
commencement date. This is the average exercise price.
(2) The premium adjustment (based on the actual difference between the dividend and bond yields at the date of vesting) was nil.
(3) Performance hurdle was satisfied on 31 March 2004 and options may be exercised up to 13 September 2010.
(4) Performance hurdle was satisfied on 3 October 2004 and options may be exercised up to 3 September 2011.
(5) No amount is unpaid in respect of the shares issued upon exercise of options during the above period.
Reward Shares – Details of Movements
July 2008 - June 2009 July 2007 - June 2008
Year of Grant - Total Reward Shares 2005 (3)
2006 (4)
2004 (2)
2005 (3)
2006 (4)
Held by participants at the start of the year (no.) 345,574 374,764 297,395 411,937 440,854
Allocated during the year (no.) (1) 345,574 - 282,645 - -
Vested during the year (no.) (691,148) - (540,290) - -
Lapsed during the year (no.) - (50,257) (39,750) (66,363) (66,090)
Outstanding at the end of year (no.) - 324,507$ - 345,574$ 374,764$ (1) Represents the total number of shares allocated and may not represent the total number that may vest at a later date. The Group purchases 50% of the maximum
number of shares a participant may receive. Additional shares are purchased if required to fulfil the Group‟s obligations to vest shares in participants once the
performance of the ERP grant is known.
(2) Performance hurdle was satisfied on 23 September 2007 when 100% of the maximum allocation of this grant vested.
(3) Performance hurdle was satisfied on 15 July 2008 when 100% of the maximum allocation of this grant vested.
(4) This grant will be tested for vesting on 14 July 2009. If performance is below the 51st percentile, one retest will be conducted 12 months later on 14 July 2010.
Non-Executive Directors Share Plan (NEDSP)
The NEDSP provides for the acquisition of shares by Non-Executive
Directors through the mandatory sacrifice of 20% of their annual fees
(paid on a quarterly basis). Shares purchased are restricted for sale
for 10 years or when the Director leaves the Board, whichever is
earlier. In addition, Non-Executive Directors can voluntarily elect to
sacrifice up to a further 80% of their fees for the acquisition of shares.
Shares are purchased on-market at the current market price and a
total of 91,972 shares have been purchased under the NEDSP
since the plan commenced in 2001. Since March 2005,
shares are acquired under the plan on a six monthly basis.
Shares acquired under the plan receive full dividend
entitlements and voting rights and there are no forfeiture or
vesting conditions attached to the shares granted under the
NEDSP.
For the current year, $735,257 was expensed through the
profit and loss reflecting shares purchased and allocated
under the NEDSP.
Grants made under the NEDSP from 1 July 2008 to 30 June 2009
Period Total Fees Sacrified Participants Shares Purchased Average Purchase Price
1 January to 30 June 2009 $360,287 10 12,249 $29.41
1 July to 31 December 2008 $374,970 9 8,964 $41.84
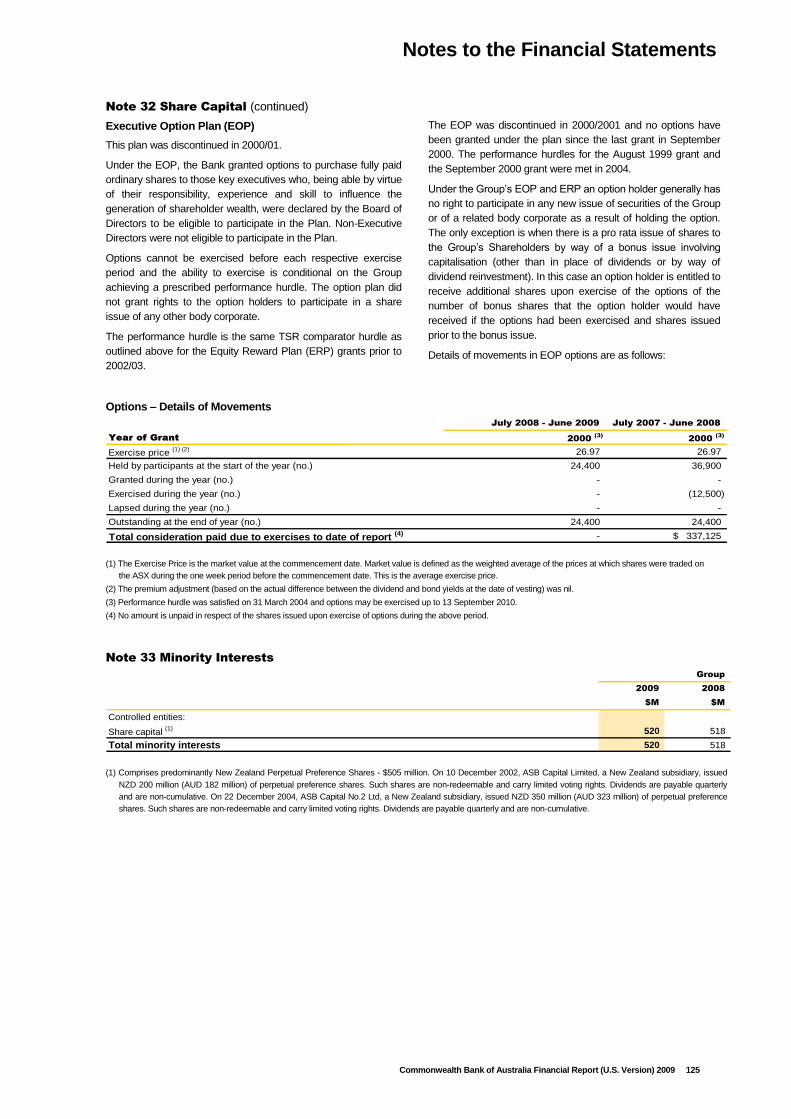
Notes to the Financial Statements
Commonwealth Bank of Australia Financial Report (U.S. Version) 2009 125
Note 32 Share Capital (continued)
Executive Option Plan (EOP)
This plan was discontinued in 2000/01.
Under the EOP, the Bank granted options to purchase fully paid
ordinary shares to those key executives who, being able by virtue
of their responsibility, experience and skill to influence the
generation of shareholder wealth, were declared by the Board of
Directors to be eligible to participate in the Plan. Non-Executive
Directors were not eligible to participate in the Plan.
Options cannot be exercised before each respective exercise
period and the ability to exercise is conditional on the Group
achieving a prescribed performance hurdle. The option plan did
not grant rights to the option holders to participate in a share
issue of any other body corporate.
The performance hurdle is the same TSR comparator hurdle as
outlined above for the Equity Reward Plan (ERP) grants prior to
2002/03.
The EOP was discontinued in 2000/2001 and no options have
been granted under the plan since the last grant in September
2000. The performance hurdles for the August 1999 grant and
the September 2000 grant were met in 2004.
Under the Group‟s EOP and ERP an option holder generally has
no right to participate in any new issue of securities of the Group
or of a related body corporate as a result of holding the option.
The only exception is when there is a pro rata issue of shares to
the Group‟s Shareholders by way of a bonus issue involving
capitalisation (other than in place of dividends or by way of
dividend reinvestment). In this case an option holder is entitled to
receive additional shares upon exercise of the options of the
number of bonus shares that the option holder would have
received if the options had been exercised and shares issued
prior to the bonus issue.
Details of movements in EOP options are as follows:
Options – Details of Movements
July 2008 - June 2009 July 2007 - June 2008
Year of Grant 2000 (3)
2000 (3)
Exercise price (1) (2) 26.97 26.97
Held by participants at the start of the year (no.) 24,400 36,900
Granted during the year (no.) - -
Exercised during the year (no.) - (12,500)
Lapsed during the year (no.) - -
Outstanding at the end of year (no.) 24,400 24,400
Total consideration paid due to exercises to date of report (4) - 337,125$
(1) The Exercise Price is the market value at the commencement date. Market value is defined as the weighted average of the prices at which shares were traded on
the ASX during the one week period before the commencement date. This is the average exercise price.
(2) The premium adjustment (based on the actual difference between the dividend and bond yields at the date of vesting) was nil.
(3) Performance hurdle was satisfied on 31 March 2004 and options may be exercised up to 13 September 2010.
(4) No amount is unpaid in respect of the shares issued upon exercise of options during the above period.
Note 33 Minority Interests
Group
2009 2008
$M $M
Controlled entities:
Share capital (1) 520 518
Total minority interests 520 518
(1) Comprises predominantly New Zealand Perpetual Preference Shares - $505 million. On 10 December 2002, ASB Capital Limited, a New Zealand subsidiary, issued
NZD 200 million (AUD 182 million) of perpetual preference shares. Such shares are non-redeemable and carry limited voting rights. Dividends are payable quarterly
and are non-cumulative. On 22 December 2004, ASB Capital No.2 Ltd, a New Zealand subsidiary, issued NZD 350 million (AUD 323 million) of perpetual preference
shares. Such shares are non-redeemable and carry limited voting rights. Dividends are payable quarterly and are non-cumulative.

Notes to the Financial Statements
126 Commonwealth Bank of Australia Financial Report (U.S. Version) 2009
Note 34 Capital Adequacy
Regulatory Capital
The Bank is an Authorised Deposit-taking Institution (“ADI”) and
is subject to regulation by APRA under the authority of the
Banking Act 1959. APRA has set minimum regulatory capital
requirements for banks that are consistent with the International
Convergence of Capital Measurement and Capital Standards: A
Revised Framework (“Basel II”) issued by the Basel Committee
on Banking Supervision. These requirements define what is
acceptable as capital and provide methods of measuring the
risks incurred by the Bank.
The regulatory capital requirements are measured for the
Extended Licence Entity Group (known as “Level One”
comprising the Bank and APRA approved subsidiaries) and for
the Bank and all of its banking subsidiaries (known as “Level
Two” or the “Group”).
All entities which are consolidated for accounting purposes are
included within the Group capital adequacy calculations except
for:
The insurance and funds management operations; and
The entities through which securitisation of Bank assets are
conducted.
Regulatory capital is divided into Tier One and Tier Two Capital.
Tier One Capital primarily consists of Shareholders‟ Equity plus
other capital instruments acceptable to APRA, less goodwill and
other prescribed deductions. Tier Two Capital is comprised
primarily of hybrid and debt instruments acceptable to APRA
less any prescribed deductions. Total Capital is the aggregate of
Tier One and Tier Two Capital.
The tangible component of the investment in the insurance and
funds management operations are deducted from capital, 50%
from Tier One and 50% from Tier Two.
Capital adequacy is measured by means of a risk based capital
ratio. The capital ratios reflect capital (Tier One, Tier Two or
Total Capital) as a percentage of total Risk Weighted Assets
(“RWA”). RWA represents an allocation of risks associated with
the Group‟s assets and other related exposures.
The Group actively manages its capital to balance the
requirements of various stakeholders (regulators, rating
agencies and shareholders). This is achieved by optimising the
mix of capital while maintaining adequate capital ratios
throughout the financial year.
The Group has a range of instruments and methodologies
available to effectively manage capital including share issues
and buybacks, dividend and dividend reinvestment plan policies,
hybrid capital raising and dated and undated subordinated debt
issues. All major capital related initiatives require approval of the
Board.
The Group‟s capital position is monitored on a continuous basis
and reported monthly to the Asset and Liability Committee of the
Group. Three year capital forecasts are conducted on a
quarterly basis and a detailed capital and strategy plan is
presented to the Board annually.
The Group‟s capital ratios throughout the 2008 and 2009
financial years were in compliance with both APRA minimum
capital adequacy requirements and the Board Approved Target
Ranges.
The Group‟s Tier One target range was formally amended by
the Board in February 2009 from a range of 6.5 to 7.0% to
above 7.0%.
The Bank is required to inform APRA immediately of any breach
or potential breach of its minimum capital adequacy
requirements, including details of remedial action taken or
planned to be taken.
Economic Capital
The Group uses an “Economic Capital” model to drive delivery
of “shareholder-value-added” (“SVA”) results. Measures are
applied to link the cost of the Group‟s physical capital to the
profit required from different business segments. This in turn
facilitates:
Pricing of products based on appropriate charges for use of
capital; and
Internal measurement of performance on a risk adjusted
basis.
Economic Capital provides an estimate of capital required to
cover the financial impact of unlikely events, at a level of
confidence consistent with the Board‟s target debt rating. As
such, the level of Economic Capital and physical capital is
aligned to the Board‟s overall risk appetite.
The Group calculates Economic Capital in accordance with the
following key principles:
Consistent application to all material risk types and
businesses across the Group;
Measurement of potential financial impacts over a time
period reflecting elimination of the risk under assumed
adverse conditions;
Use of a confidence level aligned with the Group‟s target
debt rating; and
Aggregation of Economic Capital by individual risk type.
Economic Capital provides a tool for evaluating which of the
Group‟s products and businesses provide the best return relative
to the credit, market, operational, strategic business, insurance
and other risks taken in achieving that return. These risk types
are defined in the Basel II Capital Framework, and influence the
level of capital held by the Group.
SVA is maximised through the use of two measures of risk-
adjusted performance – known as Profit After Capital Charge
(PACC) and Return on Target Equity (ROTE) – which are used
internally to measure business performance. These measures of
profit and return reflect the amount of Economic Capital used in
achieving these outcomes.
Business Unit segments are required to achieve minimum
returns on their allocated risk-based capital equal to a uniform
“Cost of Capital” which is set from time to time based on market
conditions.
The development of Economic Capital measures and the use of
risk adjusted return metrics within Business Unit segments is an
evolving area both within the Group and across the industry.
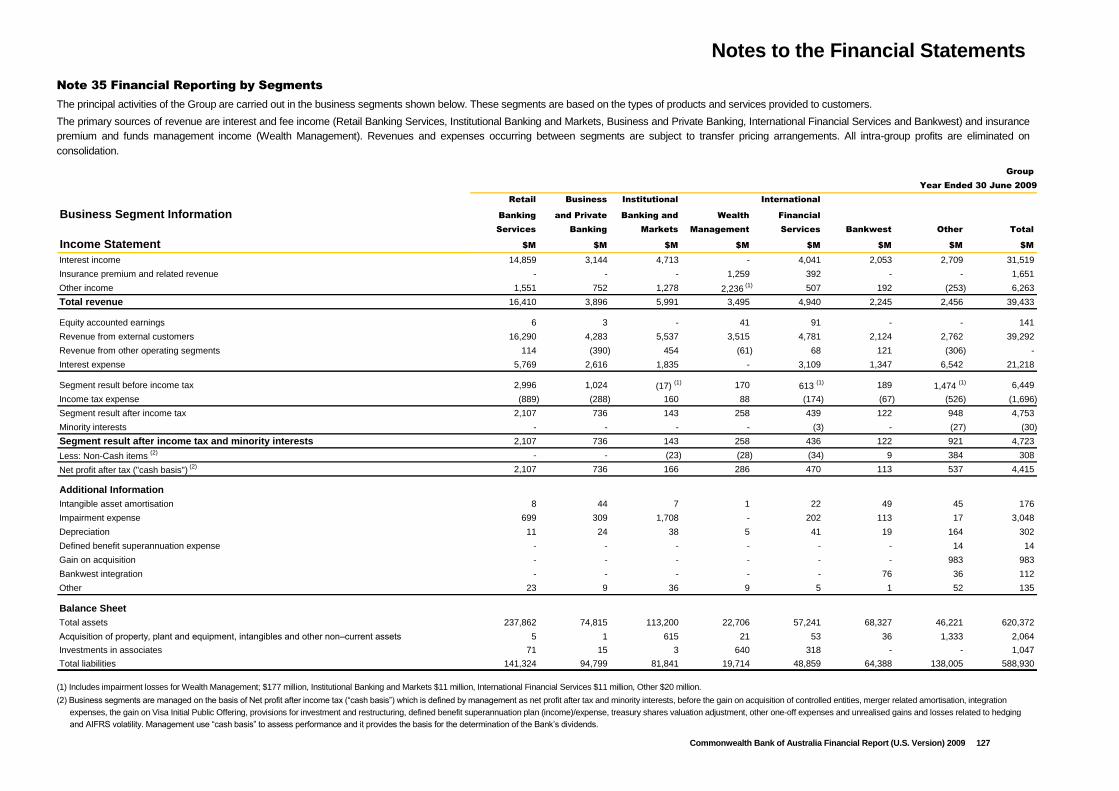
Notes to the Financial Statements
Commonwealth Bank of Australia Financial Report (U.S. Version) 2009 127
Note 35 Financial Reporting by Segments
The principal activities of the Group are carried out in the business segments shown below. These segments are based on the types of products and services provided to customers.
The primary sources of revenue are interest and fee income (Retail Banking Services, Institutional Banking and Markets, Business and Private Banking, International Financial Services and Bankwest) and insurance
premium and funds management income (Wealth Management). Revenues and expenses occurring between segments are subject to transfer pricing arrangements. All intra-group profits are eliminated on
consolidation.
Group
Retail Business Institutional International
Business Segment Information Banking and Private Banking and Wealth Financial
Services Banking Markets Management Services Bankwest Other Total
Income Statement $M $M $M $M $M $M $M $M
Interest income 14,859 3,144 4,713 - 4,041 2,053 2,709 31,519
Insurance premium and related revenue - - - 1,259 392 - - 1,651
Other income 1,551 752 1,278 2,236 (1) 507 192 (253) 6,263
Total revenue 16,410 3,896 5,991 3,495 4,940 2,245 2,456 39,433
Equity accounted earnings 6 3 - 41 91 - - 141
Revenue from external customers 16,290 4,283 5,537 3,515 4,781 2,124 2,762 39,292
Revenue from other operating segments 114 (390) 454 (61) 68 121 (306) -
Interest expense 5,769 2,616 1,835 - 3,109 1,347 6,542 21,218
Segment result before income tax 2,996 1,024 (17) (1) 170 613
(1) 189 1,474 (1) 6,449
Income tax expense (889) (288) 160 88 (174) (67) (526) (1,696)
Segment result after income tax 2,107 736 143 258 439 122 948 4,753
Minority interests - - - - (3) - (27) (30)
Segment result after income tax and minority interests 2,107 736 143 258 436 122 921 4,723
Less: Non-Cash items (2) - - (23) (28) (34) 9 384 308
Net profit after tax ("cash basis") (2) 2,107 736 166 286 470 113 537 4,415
Additional Information
Intangible asset amortisation 8 44 7 1 22 49 45 176
Impairment expense 699 309 1,708 - 202 113 17 3,048
Depreciation 11 24 38 5 41 19 164 302
Defined benefit superannuation expense - - - - - - 14 14
Gain on acquisition - - - - - - 983 983
Bankwest integration - - - - - 76 36 112
Other 23 9 36 9 5 1 52 135
Balance Sheet
Total assets 237,862 74,815 113,200 22,706 57,241 68,327 46,221 620,372
Acquisition of property, plant and equipment, intangibles and other non–current assets 5 1 615 21 53 36 1,333 2,064
Investments in associates 71 15 3 640 318 - - 1,047
Total liabilities 141,324 94,799 81,841 19,714 48,859 64,388 138,005 588,930
Year Ended 30 June 2009
(1) Includes impairment losses for Wealth Management; $177 million, Institutional Banking and Markets $11 million, International Financial Services $11 million, Other $20 million.
(2) Business segments are managed on the basis of Net profit after income tax (“cash basis”) which is defined by management as net profit after tax and minority interests, before the gain on acquisition of controlled entities, merger related amortisation, integration
expenses, the gain on Visa Initial Public Offering, provisions for investment and restructuring, defined benefit superannuation plan (income)/expense, treasury shares valuation adjustment, other one-off expenses and unrealised gains and losses related to hedging
and AIFRS volatility. Management use “cash basis” to assess performance and it provides the basis for the determination of the Bank‟s dividends.

Notes to the Financial Statements
128 Commonwealth Bank of Australia Financial Report (U.S. Version) 2009
Note 35 Financial Reporting by Segments (continued)
Group
Retail Business Institutional International
Business Segment Information Banking and Private Banking and Wealth Financial
Services Banking Markets Management Services Bankwest Other Total
Income Statement $M $M $M $M $M $M $M $M
Interest income 14,549 3,219 5,975 - 4,061 - 1,430 29,234
Insurance premium and related revenue - - - 994 379 - - 1,373
Other income 1,339 863 1,027 2,763 458 - (3) 6,447
Total revenue 15,888 4,082 7,002 3,757 4,898 - 1,427 37,054
Equity accounted earnings - - - 60 32 - - 92
Revenue from external customers 15,810 4,374 6,222 3,747 4,796 - 2,013 36,962
Revenue from other operating segments 78 (292) 780 (50) 70 - (586) -
Interest expense 5,306 2,980 3,765 - 3,092 - 6,184 21,327
Segment result before income tax 2,687 974 909 991 767 - (73) 6,255
Income tax expense (805) (280) (128) (194) (177) - 151 (1,433)
Segment result after income tax 1,882 694 781 797 590 - 78 4,822
Minority interests - - - - (2) - (29) (31)
Segment result after income tax and minority interests 1,882 694 781 797 588 - 49 4,791
Less: Non-Cash items (1) (29) (27) 10 60 7 - 37 58
Net profit after tax ("cash basis") (1) 1,911 721 771 737 581 - 12 4,733
Additional Information
Intangible asset amortisation 19 49 4 - 12 - 19 103
Impairment expense 331 167 259 - 43 - 130 930
Depreciation 10 27 18 4 39 - 127 225
Defined benefit superannuation expense/(income) - - - - - - (14) (14)
Investment and restructuring 41 22 - - 14 - 300 377
Other 28 10 4 10 6 - 32 90
Balance Sheet
Total assets 199,106 73,605 97,654 23,892 51,634 - 41,681 487,572
Acquisition of property, plant and equipment, intangibles and other non–current assets 15 420 127 8 71 - 321 962
Investments in associates - 15 2 724 165 - - 906
Total liabilities 122,349 89,677 76,561 20,609 42,750 - 109,489 461,435
Year Ended 30 June 2008
(1)
(2)
(1)
(1)
(1) Business segments are managed on the basis of Net profit after income tax (“cash basis”) which is defined by management as net profit after tax and minority interests, before the gain on Visa Initial Public Offering, Provisions for investment and restructuring, defined
benefit superannuation plan (income)/expense, treasury shares valuation adjustment and unrealised gains and losses related to hedging and AIFRS volatility. Management use “cash basis” to assess performance as it provides the basis for the determination of the
Bank‟s dividends.

Notes to the Financial Statements
Commonwealth Bank of Australia Financial Report (U.S. Version) 2009 129
Note 35 Financial Reporting by Segment (continued)
Group
Year Ended 30 June
Geographical Information2009 2008 2007
Financial Performance & Position $M % $M % $M %
Revenue
Australia 32,498 82. 4 29,131 78. 6 26,350 79. 5
New Zealand 4,904 12. 4 4,922 13. 3 4,517 13. 6
Other locations (1)
2,031 5. 2 3,001 8. 1 2,302 6. 9
39,433 100. 0 37,054 100. 0 33,169 100. 0
Non-Current Assets
Australia 11,909 89. 8 9,929 87. 7 9,260 85. 0
New Zealand 1,005 7. 6 1,129 10. 0 1,133 10. 4
Other locations (1)
343 2. 6 265 2. 3 496 4. 6
13,257 100. 0 11,323 100. 0 10,889 100. 0
(1) Other locations were: United Kingdom, United States of America, Japan, Singapore, Malta, Hong Kong, Grand Cayman, Fiji, Indonesia, China and Vietnam.
The geographical information represents the location in which the transaction was booked.
Note 36 Life Insurance Business
The following information is provided to disclose the statutory life
insurance business transactions contained in the Group
Financial Statements and the underlying methods and
assumptions used in their calculations.
All financial assets within the life statutory funds have been
determined to support either life insurance or life investment
contracts. Also refer to Note 1 (hh). The insurance segment
result is prepared on a business segment basis, refer to Note
35.
Life Insurance Life Investment
Contracts Contracts Group
2009 2008 2009 2008 2009 2008
Summarised Income Statement $M $M $M $M $M $M
Premium income and related revenue 1,629 1,412 248 292 1,877 1,704
Outward reinsurance premiums expense (271) (234) - - (271) (234)
Claims expense (992) (865) (21) (1) (1,013) (866)
Reinsurance recoveries 207 173 - - 207 173
Investment revenue (excluding investments in subsidiaries):
Equity securities (257) (246) (984) (852) (1,241) (1,098)
Debt securities 177 227 474 419 651 646
Property (150) (37) (197) (108) (347) (145)
Other (27) 81 (96) (102) (123) (21)
Decrease in net contract liabilities 410 198 686 574 1,096 772
Operating income 726 709 110 222 836 931
Acquisition expenses 254 190 11 21 265 211
Maintenance expenses 247 240 97 138 344 378
Management expenses 21 14 21 7 42 21
Other expense 1 39 - 53 1 92
Net profit before income tax 203 226 (19) 3 184 229
Income tax (benefit)/expense attributable to operating profit29 (13) (139) (48) (110) (61)
Net profit after income tax 174 239 120 51 294 290

Notes to the Financial Statements
130 Commonwealth Bank of Australia Financial Report (U.S. Version) 2009
Note 36 Life Insurance Business (continued)
Life Insurance Life Investment
Contracts Contracts Group
2009 2008 2009 2008 2009 2008
$M $M $M $M $M $M
Sources of Life Insurance Net Profit
The net profit after income tax is represented by:
Emergence of planned profit margins 169 190 97 98 266 288
Difference between actual and planned experience (47) 2 (11) (57) (58) (55)
Effects of changes to underlying assumptions 7 3 - - 7 3
Reversal of previously recognised losses or loss recognition
on groups of related products 11 - - - 11 -
Investment earnings on assets in excess of policyholder
liabilities 25 25 9 10 34 35
Other movements 9 19 25 - 34 19
Net profit after income tax 174 239 120 51 294 290
Life insurance premiums received and receivable 1,738 1,328 954 1,336 2,692 2,664
Life insurance claims paid and payable 1,085 939 2,269 2,929 3,354 3,868
The disclosure of the components of operating profit after income tax expense are required to be separated between policyholders‟ and
shareholders‟ interests. As policyholder profits are an expense of the Group and not attributable to shareholders, no such disclosure is
required.
Life Insurance Life Investment
Contracts Contracts Group
Reconciliation of Movements in 2009 2008 2009 2008 2009 2008
Policy Liabilities $M $M $M $M $M $M
Contract policy liabilities
Gross policy liabilities opening balance 4,122 4,801 14,373 16,970 18,495 21,771
Acquisition of controlled entities 39 - 164 - 203 -
Movement in policy liabilities reflected in the Income
Statement (338) (198) (686) (574) (1,024) (772)
Contract contributions recognised in policy liabilities 16 7 706 1,050 722 1,057
Contract withdrawals recognised in policy liabilities (91) (131) (2,248) (2,940) (2,339) (3,071)
Non-cash movements (27) (216) - 10 (27) (206)
FX translation adjustment 7 (141) 19 (143) 26 (284)
Gross policy liabilities closing balance 3,728 4,122 12,328 14,373 16,056 18,495
Liabilities ceded under reinsurance
Opening balance (145) (158) - - (145) (158)
Acquisition of controlled entities (2) - - - (2) -
(Decrease)/ increase in reinsurance assets (72) 13 - - (72) 13
Closing balance (219) (145) - - (219) (145)
Net policy liabilities at 30 June
Expected to be realised within 12 months 535 504 2,031 2,352 2,566 2,856
Expected to be realised in more than 12 months 2,974 3,473 10,297 12,021 13,271 15,494
Total net insurance policy liabilities 3,509 3,977 12,328 14,373 15,837 18,350

Notes to the Financial Statements
Commonwealth Bank of Australia Financial Report (U.S. Version) 2009 131
The Audit Committee has considered the non-audit services
provided by PricewaterhouseCoopers and is satisfied that the
services and the level of fees are compatible with maintaining
auditors‟ independence. All such services were approved by the
Audit Committee in accordance with pre-approved policies and
procedures.
Audit related fees principally include assurance and attestation
reviews of the Group‟s U.S. disclosures for U.S. investors,
services in relation to regulatory requirements, acquisition
accounting advice as well as reviews of internal control systems
and financial or regulatory information.
All other fees principally include taxation and advisory services.
Advisory services were both small in number and fee and
related to training of employees in new accounting standards
and attendance at a number of risk governance meetings.
Note 37 Remuneration of Auditors
Group Bank
2009 2008 2009 2008
$'000 $'000 $'000 $'000
a) Audit services
PricewaterhouseCoopers Australian firm 12,459 9,711 7,861 7,111
Related practice of PricewaterhouseCoopers Australian firm 4,470 4,330 711 571
Total remuneration for audit services 16,929 14,041 8,572 7,682
b) Non-audit services
Audit related services
PricewaterhouseCoopers Australian firm 3,742 3,066 2,878 2,544
Related practice of PricewaterhouseCoopers Australian firm 428 695 235 28
Total remuneration for audit related services 4,170 3,761 3,113 2,572
Taxation services
PricewaterhouseCoopers Australian firm 1,375 909 1,375 909
Related practice of PricewaterhouseCoopers Australian firm 1,346 1,102 318 440
Total remuneration for tax related services 2,721 2,011 1,693 1,349
Advisory
PricewaterhouseCoopers Australian firm 80 - 80 -
Related practice of PricewaterhouseCoopers Australian firm 166 123 88 38
Total remuneration for advisory services 246 123 168 38
Total remuneration for non-audit services 7,137 5,895 4,974 3,959
Total remuneration for audit and non-audit services (1) 24,066 19,936 13,546 11,641
(1) An additional amount of $7,132,535 was paid to PricewaterhouseCoopers (2008: $5,877,085) by way of fees for entities not consolidated into the Financial Statements.
Of this amount $6,065,331 (2008: $4,527,545 ) relates to statutory audits.
Note 38 Commitments for Capital Expenditure Not Provided for
Group Bank
2009 2008 2009 2008
$M $M $M $M
Not later than one year 18 45 16 41
Total commitments for capital expenditure not provided for 18 45 16 41

Notes to the Financial Statements
132 Commonwealth Bank of Australia Financial Report (U.S. Version) 2009
Lease Arrangements
Leases entered into by the Group are for the purpose of
accommodating the business needs. Leases may be over retail,
commercial, industrial and residential premises and reflect the
needs of the occupying business and market conditions. All
leases are negotiated using either internal or external
professional property resources acting for the Group.
Rental payments are determined in terms of relevant lease
requirements, usually reflecting market rentals.
The Group as lessee has no purchase options over premises
occupied. In a small number of cases, the Group as lessee has
a right of first refusal if the premises are to be sold.
There are no restrictions imposed on the Group‟s lease of space
other than those forming part of the negotiated lease
arrangements for each specific premise.
Note 39 Lease Commitments – Property, Plant and Equipment
Group Bank
2009 2008 2009 2008
$M $M $M $M
Commitments in respect of non-cancellable operating lease agreements due:
Not later than one year 376 347 341 314
Later than one year but not later than five years 954 850 868 756
Later than five years 375 419 347 357
Total lease commitments - property, plant and equipment 1,705 1,616 1,556 1,427
Group
2009 2008
$M $M
Group's share of lease commitments of associated entities due:
Not later than one year 3 2
Later than one year but not later than five years 6 3
Later than five years 9 2
Total lease commitments - property, plant and equipment 18 7

Notes to the Financial Statements
Commonwealth Bank of Australia Financial Report (U.S. Version) 2009 133
Guarantees represent unconditional undertakings by the Group
to support the obligations of its customers to third parties.
Standby letters of credit are undertakings by the Group to pay,
against production of documents, an obligation in the event of a
default by a customer.
Bill endorsements relate to bills of exchange that have been
endorsed by the Group and represent liabilities in the event of
default by the acceptor and the drawer of the bill.
Documentary letters of credit represent an undertaking to pay or
accept drafts drawn by an overseas supplier of goods against
production of documents in the event of payment default by a
customer.
Performance related contingents involve undertakings by the
Group to pay third parties if a customer fails to fulfil a contractual
non-monetary obligation.
Commitments to provide credit include all obligations on the part
of the Group to provide credit facilities. These credit facilities are
both fixed and variable.
Fixed rate or fixed spread commitments extended to customers
that allow net settlement of the change in the value of the
commitment are written options and are recorded at fair value
(Refer to Note 11 Derivative Assets and Liabilities).
Other commitments include the Group‟s obligations under sale
and repurchase agreements, outright forward purchases and
forward deposits and underwriting facilities. Other commitments
also include obligations not otherwise disclosed above to extend
credit, that are irrevocable because they cannot be withdrawn at
the discretion of the Bank without the risk of incurring significant
penalty or expense. In addition commitments to purchase or sell
loans are included in other commitments.
The transactions are categorised and credit equivalents
calculated under APRA guidelines for the risk based
measurement of capital adequacy. The credit equivalent
amounts are a measure of the potential loss to the Group in the
event of non-performance by the counterparty.
Under the Basel II advanced internal ratings approach for credit
risk, the credit equivalent amount is the face value of the
transaction, on the basis that at default the exposure is the
amount fully advanced. Only where approved by APRA may an
exposure less than the fully advanced amount be used as the
credit equivalent exposure.
As the potential loss depends on counterparty performance, the
Group utilises the same credit policies and assessment criteria
for off-balance sheet business as for on-balance sheet business
and if deemed necessary, collateral is obtained based on
management‟s credit evaluation of the counterparty. If an event
has occurred that gives rise to a present obligation and it is
probable a loss will eventuate then provisions are raised.
Contingent Assets
The credit risk related contingent liabilities of $124,709 million
(2008: $111,078 million) detailed above also represent
contingent assets of the Group, which may in the normal course
convert to loans and other assets of the Group.
Note 40 Contingent Liabilities, Assets and Commitments
The Group is involved in a range of transactions that give rise to
contingent and/or future liabilities which are distinct from
transactions and other events that result in the recognition of
liabilities. These transactions meet the financing requirements of
customers and include endorsed bills of exchange, letters of
credit, guarantees and commitments to provide credit. For
further details on these items refer Note 1 (gg).
These transactions combine varying levels of credit, interest
rate, foreign exchange and liquidity risk. In accordance with
Bank policy, exposure to any of these transactions is not
carried at a level that would have a material adverse effect on
the financial condition of the Bank and its controlled entities.
Details of contingent liabilities and off-balance sheet business are:
Group
Face Value Credit Equivalent
2009 2008 2009 2008
$M $M $M $M
Credit risk related instruments (1)
Guarantees 3,641 2,802 3,641 2,802
Standby letters of credit 206 142 206 142
Bill endorsements 537 61 538 61
Documentary letters of credit 43 53 43 53
Performance related contingents 1,994 1,870 1,951 1,870
Commitments to provide credit 117,887 97,304 100,798 83,499
Other commitments 401 8,846 265 672
Total credit risk related instruments 124,709 111,078 107,442 89,099
(1) Differences between 2009 and 2008 credit equivalent amounts relate to adopting Basel II advanced internal ratings based approach for credit risk (previously
calculated in accordance with Basel I). See below for more detail.

Notes to the Financial Statements
134 Commonwealth Bank of Australia Financial Report (U.S. Version) 2009
Litigation
Neither the Bank nor any of its controlled entities are engaged in
any litigation or claim which is likely to have a materially adverse
effect on the business, financial condition or operating results of
the Bank or any of its controlled entities. Where some loss is
probable and can be reliably estimated an appropriate provision
has been made.
Certain entities within the Group act as responsible entity or
trustee of virtually all managed investment schemes
(“schemes”), wholesale and retail trusts (“trusts”) managed by
the Group in Australia, the United Kingdom and New Zealand.
The above Funds Under Administration do not include on
balance sheet investments and policyholder liabilities held in the
statutory funds of the life insurance business (refer to Note 10)
where an entity within the Group may act as a trustee. Where
entities within the Group act as responsible entity of managed
investment schemes, obligations may exist under the relevant
constitutions whereby upon request from a scheme member, the
responsible entity has an obligation to redeem units from the
assets of those schemes. Liabilities are incurred by these
entities in their capacity as responsible entity or trustee. Rights
of Indemnity are held against the schemes and trusts whose
assets exceeded their liabilities at 30 June 2009. The Bank does
not provide a general guarantee of the performance or
obligations of its subsidiaries.
Long Term Contracts
In April 2009, the Bank entered into an agreement with Telstra
Corporation Ltd for the provision of telecommunications
services. The term of the agreement is ten years.
In 2009 the Bank entered into an Agreement for Lease with
Lend Lease Development and Australian Prime Property Fund
for Darling Walk, a new building in the Sydney CBD comprising
over 50,000m2 of commercial accommodation located above a
retail podium. It is currently under construction and will
accommodate around 4,900 of the Group‟s employees from
early 2012.
In April 2009 the Group entered into an Agreement to Lease for
12 years (with options to extend) on completion of Raine
Square, a new 21 level office tower in Perth that will provide
almost 40,000m2 of office accommodation above 3 levels of
retail space. Once complete it will accommodate over 3,500 of
the Group‟s Perth based employees. Bankwest has also
exercised an extension option on existing premises from
November 2009.
In April 2008, the Bank signed agreements with SAP Australia
Pty Limited and Accenture Australia Limited for its Core Banking
Modernisation program.
In December 2007, the Bank entered into separate agreements
with each of Tata Consultancy Services Ltd, HCL Technologies
Ltd and IBM Australia Ltd for the provision of application
software related services. As part of entering into these
contracts, the Bank terminated certain parts of the previous long
term agreement with EDS (Australia) Pty Ltd relating to
application software services. The remaining parts of the
contract with EDS (Australia) Pty Ltd - related to mainframe,
midrange, end user technology and cards-related services -
continue until 2012.
In November 2007, the Bank signed a lease agreement with a
term of 12 years with DPT Operator Pty Ltd and DPPT Operator
Pty Ltd for accommodating approximately 5,000 of the Group‟s
employees at Darling Park Tower 1 at 201 Sussex Street in the
Sydney CBD.
In July 2006, the Bank entered into a lease agreement with
Colonial First State Property Limited as trustee for both the Site
6 Homebush Bay Trust, and for the Site 7 Homebush Bay Trust
relating to the provision of accommodation. The development is
a campus style multi-building facility at Sydney Olympic Park to
accommodate around 3,500 employees. The average lease
term is 12 years.
In 2005, the Bank entered into lease agreements for a fully
refurbished existing building at 150 George Street Parramatta,
with Perpetual Nominees Limited (as a custodian for the
Colonial First State Commercial Property Trust) and a newly
constructed building at 101 George Street Parramatta, with
Commonwealth Custodial Services Limited, relating to the
provision of accommodation. Both buildings have an average
lease term of 10 years.
Failure to Settle Risk
The Bank is subject to a credit risk exposure in the event that
another financial institution fails to settle for its payments
clearing activities, in accordance with the regulations and
procedures of the following clearing systems of the Australian
Payments Clearing Association Limited: The Australian Paper
Clearing System, The Bulk Electronic Clearing System, The
Consumer Electronic Clearing System and the High Value
Clearing System (only if operating in “fallback mode”). This credit
risk exposure is unquantifiable in advance, but is well
understood, and is extinguished upon settlement at 9am each
business day.
Service Agreements
The maximum contingent liability for termination benefits in
respect of service agreements with the Chief Executive Officer
and other Group Key Management Personnel at 30 June 2009
was $12.2 million (2008: $13.6 million).
Note 40 Contingent Liabilities, Assets and Commitments (continued)
Fiduciary Activities
The Group and its associated entities conduct investment management and other fiduciary activities as responsible entity, trustee,
custodian or manager for numerous investment funds and trusts, including superannuation and approved deposit funds, wholesale
and retail trusts. The amounts of funds concerned that are not reported in the Group‟s Balance Sheet are as follows:
2009 2008
$M $M
Funds Under Administration
Australia 118,050 133,980
United Kingdom 22,759 20,632
New Zealand 8,667 8,959
Asia 10,451 10,389
Total 159,927 173,960

Notes to the Financial Statements
Commonwealth Bank of Australia Financial Report (U.S. Version) 2009 135
Note 40 Contingent Liabilities, Assets and Commitments (continued)
Collateral
The Group has entered into a range of transactions with counterparties which require lodgement of collateral subject to agreed market
valuation movement thresholds. Where these thresholds are exceeded, the Group may be required to either pledge assets to, or be
entitled to receive pledged assets from, the counterparty to secure these transactions. The assets pledged or received are primarily in the
form of cash and bonds.
The Group has the right to sell, repledge, or otherwise use collateral received from the pledgor, including any equity or right of redemption
by the pledgor.
Group Bank
2009 2008 2009 2008
Collateral held $M $M $M $M
Cash 1,497 1,055 1,463 1,031
Assets at fair value through Income Statement 1,734 2,532 1,733 2,017
Collateral held 3,231 3,587 3,196 3,048
No securities have been repledged.
The Group has secured liabilities of $5,650 million (2008: $4,143 million). The table below sets out the assets pledged to secure these
liabilities.
Group Bank
2009 2008 2009 2008
Assets pledged $M $M $M $M
Cash 7,175 40 6,248 40
Assets at fair value through Income Statement (1) 6,330 2,035 2,170 2,027
Assets pledged 13,505 2,075 8,418 2,067
Thereof can be repledged or resold by counterparty 2,086 1,435 2,086 1,427
(1) These balances include assets sold under repurchase agreements. The liabilities related to these repurchase agreements are disclosed in Note 22 Deposits and Other
Public Borrowings.

Notes to the Financial Statements
136 Commonwealth Bank of Australia Financial Report (U.S. Version) 2009
Note 41 Market Risk Management
On 10 December 2007, the Group was one of the first banks in
the world to be accredited to use the advanced internal ratings-
based approach (AIRB) for credit risk and the advanced
measurement approach (AMA) for operational risk for the
purposes of assessing risk weighted assets and regulatory
capital.
APRA gave approval to the Group to use an internal model
approach for assessing capital required for Interest Rate Risk in
the Banking Book (IRRBB) on 30 June 2008 (Note that Australia
is the only country where the prudential banking regulator
requires regulatory capital be held for IRRBB).
The measurement of market risk for traded assets remains
unchanged from the original Basel I approach.
Detail is provided about the Group‟s risk management in the
Integrated Risk Management section of this report and Note 15,
Credit Risk Management. Further detail on the Group‟s
assessment of regulatory capital required under the new Basel II
framework is discussed in Note 34, Capital Adequacy.
Market Risk
For the purposes of market risk management, the Group makes
a distinction between traded and non-traded market risks.
Traded market risks arise from the Group‟s trading book
activities within the Institutional Banking and Markets business.
Key non-traded market risks include IRRBB and non-traded
equity risk on the Group‟s Balance Sheet. Other non-traded
market risks are liquidity risk, funding risk, structural foreign
exchange risk arising from capital investments in offshore
operations, market risk arising from the insurance business and
residual value risk. These risks are considered separately below.
Market Risk Measurement
The Group uses Value-at-Risk (VaR) as one of the measures of
traded and non-traded market risk. VaR measures potential loss
using historically observed market volatility and correlation
between different markets. The VaR measured for traded
market risk uses two years of daily market movements. The VaR
measure for non-traded banking book market risk is based on
six years of daily market movement history.
VaR is modelled at a 97.5% confidence level over a 1-day
holding period for trading book positions and over a 20-day
holding period for IRRBB, insurance business market risk and
non-traded equity risk.
Because VaR is not an estimate of the maximum economic loss
that the Group could experience from an extreme market event,
management also uses stress testing to measure the potential
for economic loss at significantly higher confidence levels than
97.5%. Management then uses these results in decisions made
to manage the economic impact on market risk positions.
The following table provides a summary of VaR, where
applicable, for all market risks across the Group.
Traded Market Risk
The Group trades and distributes financial markets products and
provides risk management services to clients on a global basis.
The objectives of the Group‟s financial markets activities are to:
Provide risk management products and services to
customers;
Efficiently assist in managing the Group‟s own market
risks; and
Conduct profitable trading within a controlled framework,
leveraging off the Group‟s market presence and expertise.
The Group maintains access to markets by quoting bid and offer
prices with other market makers and carries an inventory of
treasury, capital market and risk management instruments,
including a broad range of securities and derivatives.
The Group is a participant in major markets across foreign
exchange and interest rate products, debt, equity and
commodities products as required to provide treasury, capital
markets and risk management services to institutional,
corporate, middle market and retail customers.
Income is earned from spreads achieved through market making
and from taking market risk. Trading positions are valued at fair
value and taken to profit and loss on a mark to market basis.
Market liquidity risk is controlled by concentrating trading activity
in highly liquid markets.
Trading assets at fair value through Income Statement are
detailed in Note 10. Trading liabilities at fair value through
Income Statement are in Note 24. Note 2 details the income
contribution of trading activities to the income of the Group.
Traded market risk is managed under a clearly defined risk
appetite within the market risk policy and limit structure approved
by the Risk Committee of the Board. Risk is monitored by an
independent Market Risk Management function.
Average Average Average Average
VaR VaR VaR VaR
Total Market Risk June Dec June Dec
VaR (1-day 97.5% 2009 2008 2008 2007
confidence) (1) (3)
$M $M $M $M
Traded Market Risk 10.30 10. 20 10. 85 9. 12
Non-Traded Interest Rate
Risk 18.10 16. 30 28. 50 15. 65
Structural FX Risk (2) n/a n/a n/a n/a
Non-Traded Equity Price
Risk (2) 44.00 42. 00 29. 00 38. 00
Non-Traded Insurance
Market Risk 7.10 15. 40 9. 30 8. 45
Residual Value Risk (2) n/a n/a n/a n/a
Defined Benefit
Superannuation Risk (2) n/a n/a n/a n/a
(1) Average VaR calculated for each six month period.
(2) Certain types of risk exposure are not suitable for VaR measurement.
(3) The risk on these exposures has been represented in this table using a 1 day
holding period. In practice however, these „non-traded‟ exposures are
managed to a longer expected holding period.

Notes to the Financial Statements
Commonwealth Bank of Australia Financial Report (U.S. Version) 2009 137
Note 41 Market Risk Management (continued)
The following table provides a summary of VaR for the trading
book of the Group. The VaR for ASB and Bankwest is shown
separately; all other data relates to the Group and is split by risk
type.
Non-Traded Market Risk
Average Average Average Average
VaR VaR VaR VaR
Traded Market Risk June Dec June Dec
VaR (1-day 97.5% 2009 2008 2008 2007
confidence) (1)
$M $M $M $M
Interest rate risk 4.70 4.10 3.88 3.92
Exchange rate risk 3.20 2.00 1.34 0.99
Implied volatility risk 2.10 1.40 1.04 0.86
Equities risk 0.90 1.00 0.45 0.35
Commodities risk 0.90 0.80 0.92 0.74
Credit Spread Risk 2.60 3.10 4.65 4.00
Diversification benefit (6.70) (5.80) (5.62) (4.80)
Total general market risk7.70 6.60 6.66 6.06
Undiversified Risk 1.40 2.10 3.08 2.33
ASB Bank 1.10 1.30 1.11 0.73
Bankwest (2) 0.10 0.20 - -
Total 10.30 10.20 10.85 9.12
(1) Average VaR calculated for each six month period.
(2) Bankwest has been included from 31 December 2008.
Non-traded market risk activities are governed by the Group
market risk framework approved by the Risk Committee of the
Board. Implementation of the policy, procedures and limits for
the Group is the responsibility of the Group Executive of the
associated Business Unit with senior management oversight by
the Group‟s Asset and Liability Committee. Independent
management of the non-traded market risk activities of offshore
banking subsidiaries is delegated to the CEO of each entity with
oversight by the local Asset and Liability Committee.
Interest Rate Risk in the Banking Book
Interest rate risk in the Group‟s Balance Sheet is the risk of
adverse changes in expected net interest earnings in current
and future years from changes in interest rates on mismatched
assets and liabilities in the banking book. The objective is to
manage interest rate risk to achieve stable and sustainable net
interest earnings in the long term.
The Group measures and manages Balance Sheet interest rate
risk in two ways:
(a) Next 12 months‟ earnings
The risk to net interest earnings over the next 12 months from
changes in interest rates is measured on a monthly basis. Risk
is measured assuming an instantaneous 100 basis point parallel
movement in interest rates across the yield curve.
Potential variations in net interest earnings are measured using
a simulation model that takes into account the projected change
in Balance Sheet asset and liability levels and mix. Assets and
liabilities with pricing directly based on market rates are repriced
based on the full extent of the rate shock that is applied. Risk on
the other assets and liabilities (those priced at the discretion of
the Group) are measured by taking into account both the
manner in which the products have repriced in the past as well
as the expected change in price based on the current
competitive market environment.
The figures in the following table represent the potential
unfavourable change to the Group‟s net interest earnings during the
year based on a 100 basis point parallel rate shock (increase) and
the expected unfavourable net change in price of assets and
liabilities held for purposes other than trading.
Net Interest 30/6/09 31/12/08 30/6/08 31/12/07
Earnings at Risk $M $M $M $M
Average monthly AUD 151.4 161.1 28.1 45.0
exposure NZD 11.0 19.9 15.6 6.9
High monthly AUD 214.1 209.9 70.0 57.5
exposure NZD 19.2 29.0 24.3 12.9
Low monthly AUD 86.5 91.1 0.4 29.0
exposure NZD 4.8 12.3 3.9 3.1
(b) Economic Value
A 20-day 97.5% VaR measure is used to capture the economic
impact of adverse changes in interest rates on all banking book
assets and liabilities. This analysis measures the potential change
in the net present value of cash flows of assets and liabilities. Cash
flows for fixed rate products are included on a contractual basis,
after adjustment for forecast prepayment activities. Cash flows for
products repriced at the discretion of the Group are based on the
expected repricing characteristics of those products.
The figures in the following table represent the net present value of
the expected change in the Group‟s future earnings in all future
periods for the remaining term of all existing assets and liabilities.
Average Average Average Average
Non-Traded VaR VaR VaR VaR
Interest Rate VaR June Dec June Dec
(20 day 97.5% 2009 2008 2008 2007
confidence) (1)
$M $M $M $M
AUD Interest rate risk 81.2 72.8 123.6 65.8
NZD Interest rate risk (2) 0.7 1.1 3.8 4.2
(1) VaR is only for entities that have material risk exposure.
(2) ASB data (expressed in NZD) is for the month end date.
Structural Foreign Exchange Risk
Foreign exchange risk is the risk to earnings and value caused by a
change in foreign exchange rates. Structural, Balance Sheet,
foreign exchange risk is managed in accordance with principles
approved by the Risk Committee of the Board. Hedging strategies
are based on the source of the funds and the expected life of the
investments. The Group principally hedges Balance Sheet foreign
exchange risks except for those associated with long term capital
investments in offshore branches and subsidiaries. The Group‟s
only significant structural foreign exchange exposure occurs due to
the Group‟s capitalisation of ASB.

Notes to the Financial Statements
138 Commonwealth Bank of Australia Financial Report (U.S. Version) 2009
Note 41 Market Risk Management (continued)
Non-traded Equity Price Risk
The Group retains non-traded equity risk through strategic
investments and business development activities in divisions
including Institutional Banking & Markets, International Financial
Services and Wealth Management. This activity is subject to
governance arrangements approved by the Risk Committee of
the Board, and is monitored on a centralised basis within the
Market Risk Management function. On an indicative basis a 20-
day 97.5% VaR measure is as follows:
Non-Traded Equity
VaR (20 day 97.5%
confidence)
June
2009
$M
Dec
2008
$M
June
2008
$M
Dec
2007
$M
VaR 171.0 168. 0 115. 0 155. 0
Notional Amount 1,404.0 1,437. 0 1,588. 0 2,267. 0
Market Risk in Insurance Businesses
Although still modest in the broader Group context, a significant
component of non-traded market risk activities result from the
holding of assets related to the Life Insurance Businesses.
There are two main sources of market risk in these Businesses
– market risk arising from guarantees made to policyholders and
market risk arising from the investment of Shareholders‟ capital.
A second order market risk also arises for the Group from assets
held for investment linked policies. On this type of contract the
policyholder takes the risk of falls in the market value of the
assets. However, falls in market value also impact funds under
management and reduce the fee income collected for this class
of business.
Guarantee (to Policyholders)
All financial assets within the Life Insurance statutory funds
directly support either the Group's life insurance or life
investment contracts. Market risk arises for the Group on
contracts where the liabilities to policyholders are guaranteed by
the Group. The Group manages this risk by the monthly
monitoring and rebalancing of assets to contract liabilities.
However, for some contracts the ability to match asset
characteristics with policy obligations is constrained by a number
of factors including regulatory constraints, the lack of suitable
investments as well as by the nature of the policy liabilities
themselves. Wherever possible within regulatory constraints, the
Group segregates policyholders‟ funds from Shareholders‟ funds
and sets investment mandates that are appropriate for each.
Shareholders’ Capital
A portion of financial assets held within the Insurance Business,
both within the Statutory Funds and in the Shareholder Funds of
the Life insurance company represents shareholder (Group)
capital. Market risk also arises for the Group on the investment
of this capital. As at 30 June 2009, Shareholders‟ funds in the
Australian Life Insurance Businesses are invested 80% in
income assets (cash and fixed interest) and 20% in growth
assets (shares and property).
A 20-day 97.5% VaR measure is used to capture the non-traded
market risk exposures in the table below.
Non-Traded VaR in
Australian life
insurance business
(20 day 97.5%
confidence)
Average
VaR
June
2009
$M
Average
VaR
Dec
2008
$M
Average
VaR
June
2008
$M
Average
VaR
Dec
2007
$M
Shareholder Funds (1) 23.4 28. 2 25. 7 22. 3
Guarantees (to Policyholders) (2) 42.8 40. 5 19. 2 14. 8
(1) VaR in relation to the investment of shareholder funds.
(2) VaR in relation to product portfolios where the Group has a guaranteed
liability to policyholders.
Further information on the life insurance business can be found
in Note 36, Life Insurance Business.
Residual Value Risk
The Group takes residual value risk on assets such as industrial
and mining equipment, rail, aircraft, marine technology,
healthcare and other equipment. A residual value guarantee
exposes the business to the movement in second hand asset
prices. The residual value risk within the Group is controlled
through a risk management framework approved by the Risk
Committee of the Board. The framework includes asset,
geographic and maturity concentration limits and stress testing
which is performed by the independent Market Risk
Management function.

Notes to the Financial Statements
Commonwealth Bank of Australia Financial Report (U.S. Version) 2009 139
Note 41 Market Risk Management (continued)
The following table represents the Group‟s contractual interest
rate sensitivity for repricing mismatches as at 30 June 2009 and
corresponding weighted average effective interest rates. The net
mismatch represents the net value of assets, liabilities and off-
balance sheet instruments that may be repriced in the time
periods shown.
All assets and liabilities are shown according to contractual
repricing dates. Options are shown in the mismatch report
using the delta equivalents of the option face values.
Interest Rate Risk Sensitivity Repricing Period at 30 June 2009
Balance Not Weighted
Sheet 0 to 1 1 to 3 3 to 6 6 to 12 1 to 5 Over 5 Interest Average
Total month months months months years years Bearing Rate
$M $M $M $M $M $M $M $M %
Australia
Assets
Cash and liquid assets 5,509 4,711 23 - - - - 775 1.74
Receivables due from other financial
institutions 8,590 7,954 504 - 15 - - 117 1.26
Assets at fair value through Income Statement:
Trading 20,202 19,852 295 - 33 16 2 4 3.01
Insurance 15,569 77 256 25 6 79 85 15,041 4.78
Other 90 61 23 5 - 1 - - 4.05
Derivative assets 22,173 - - - - - - 22,173 -
Available-for-sale investments 15,902 4,763 3,000 119 385 4,760 2,604 271 4.93
Loans, bills discounted and other receivables 406,638 325,585 15,139 8,636 13,243 43,400 3,687 (3,052) 5.03
Bank acceptances of customers 14,727 - - - - - - 14,727 -
Property, plant and equipment 2,269 - - - - - - 2,269 -
Investment in associates 1,047 - - - - - - 1,047 -
Intangible assets 8,641 - - - - - - 8,641 -
Deferred tax assets 1,526 - - - - - - 1,526 -
Other assets 5,101 - - - - - - 5,101 -
Assets held for sale 370 - - - - - 131 239 10.00
Total assets 528,354 363,003 19,240 8,785 13,682 48,256 6,509 68,879 (3)
Liabilities
Deposits and other public borrowings 324,842 228,856 50,372 20,486 6,631 11,343 19 7,135 4.05
Payables due to other financial institutions 5,981 5,970 4 - 7 - - - 1.12
Liabilities at fair value through Income
Statement 3,531 2,569 98 39 96 490 239 - 2.57
Derivative liabilities 26,430 - - - - - - 26,430 -
Bank acceptances 14,727 - - - - - - 14,727 -
Current tax liabilities 767 - - - - - - 767 -
Other provisions 1,215 - - - - - - 1,215 -
Insurance policy liabilities (1) 14,457 - - - - - - 14,457
Debt issues 77,994 17,096 19,218 3,772 3,798 31,984 2,126 - 2.47
Managed funds units on issue 914 - - - - - - 914 -
Bills payable and other liabilities 8,163 - - - - - - 8,163 -
479,021 254,491 69,692 24,297 10,532 43,817 2,384 73,808
Loan capital 9,441 3,579 2,788 - 572 1,414 1,088 - 3.50
Total liabilities 488,462 258,070 72,480 24,297 11,104 45,231 3,472 73,808 (3)
Shareholders' equity
Share capital and other equity 28,612 - - - - - - 28,612 -
Minority interests - - - - - - - - -
Total Shareholders' equity 28,612 - - - - - - 28,612
Derivatives (2) (43,355) (8,862) (11,473) 26,580 38,479 (1,369) - (3)
Net mismatch (2) 61,578 (62,102) (26,985) 29,158 41,504 1,668 (33,541) (3)
Cumulative mismatch (2) 61,578 (524) (27,509) 1,649 43,153 44,821 11,280 (3)
(1) Technically, the insurance policy liabilities are not interest bearing, but the amount of the liability may change in line with changes in interest rates, particularly with
investment linked policies.
(2) No Balance Sheet amount applicable.
(3) No rate applicable.

Notes to the Financial Statements
140 Commonwealth Bank of Australia Financial Report (U.S. Version) 2009
Note 41 Market Risk Management (continued)
Interest Rate Risk Sensitivity Repricing Period at 30 June 2009
Balance Not Weighted
Sheet 0 to 1 1 to 3 3 to 6 6 to 12 1 to 5 Over 5 Interest Average
Total month months months months years years Bearing Rate
$M $M $M $M $M $M $M $M %
Overseas
Assets
Cash and liquid assets 5,831 5,446 241 7 20 - - 117 0.72
Receivables due from other financial
institutions 5,831 3,406 1,674 713 24 8 - 6 1.15
Assets at fair value through Income Statement:
Trading 5,199 784 2,010 1,377 52 865 105 6 4.10
Insurance 1,691 767 9 132 3 19 - 761 3.74
Other 1,587 1,186 146 7 7 241 - - 2.34
Derivative assets 4,185 - - - - - - 4,185 -
Available-for-sale investments 5,602 786 1,380 1,557 1,026 290 536 27 1.59
Loans, bills discounted and other receivables 59,993 22,996 10,025 6,859 5,469 14,010 806 (172) 6.01
Bank acceptances of customers 1 - - - - - - 1 -
Property, plant and equipment 203 - - - - - - 203 -
Intangible assets 604 - - - - - - 604 -
Deferred tax assets 127 - - - - - - 127 -
Other assets 969 - - - - - - 969 -
Assets held for sale 195 - 50 - - - - 145 10.00
Total assets 92,018 35,371 15,535 10,652 6,601 15,433 1,447 6,979 (3)
Liabilities
Deposits and other public borrowings 43,879 22,373 7,748 6,368 4,080 1,809 20 1,481 1.02
Payables due to other financial institutions 9,128 6,514 1,758 733 123 - - - 0.72
Liabilities at fair value through Income
Statement 13,065 4,204 4,779 2,155 831 1,075 21 - 1.82
Derivative liabilities 5,704 - - - - - - 5,704 -
Bank acceptances 1 - - - - - - 1 -
Current tax liabilities 116 - - - - - - 116 -
Deferred tax liabilities 168 - - - - - - 168 -
Other provisions 28 - - - - - - 28 -
Insurance policy liabilities (1) 1,599 - - - - - - 1,599
Debt issues 23,825 4,927 15,590 2,160 115 680 353 - 1.08
Bills payable and other liabilities 357 - - - - - - 357 -
97,870 38,018 29,875 11,416 5,149 3,564 394 9,454
Loan capital 2,598 2,127 - - - 465 6 - 5.09
Total liabilities 100,468 40,145 29,875 11,416 5,149 4,029 400 9,454 (3)
Shareholders' equity
Share capital and other equity 2,310 - - - - - - 2,310 -
Minority interests 520 - - - - - - 520 -
Total Shareholders' equity 2,830 - - - - - - 2,830
Derivatives (2) (3,105) 4,927 4,870 (259) (7,934) 1,501 - (3)
Net mismatch (2) (7,879) (9,413) 4,106 1,193 3,470 2,548 (5,305) (3)
Cumulative mismatch (2) (7,879) (17,292) (13,186) (11,993) (8,523) (5,975) (11,280) (3)
(1) Technically, the insurance policy liabilities are not interest bearing, but the amount of the liability may change in line with changes in interest rates, particularly with
investment linked policies.
(2) No Balance Sheet amount applicable.
(3) No rate applicable.

Notes to the Financial Statements
Commonwealth Bank of Australia Financial Report (U.S. Version) 2009 141
Note 41 Market Risk Management (continued)
Interest Rate Risk Sensitivity Repricing Period at 30 June 2008
Balance Not Weighted
Sheet 0 to 1 1 to 3 3 to 6 6 to 12 1 to 5 Over 5 Interest Average
Total month months months months years years Bearing Rate
$M $M $M $M $M $M $M $M %
Australia
Assets
Cash and liquid assets 4,841 4,042 - - - - - 799 6.74
Receivables due from other financial
institutions 4,880 4,097 461 91 - - - 231 3.90
Assets at fair value through Income
Statement:
Trading 18,457 18,210 70 - 37 112 28 - 7.81
Insurance 18,676 1,503 1,301 42 465 2,961 2,769 9,635 7.86
Other 295 274 - - - 21 - - 7.98
Derivative assets 16,339 - - - - - - 16,339 -
Available-for-sale investments 7,164 2,131 466 412 - 3,584 251 320 8.85
Loans, bills discounted and other receivables 305,475 215,054 14,716 7,660 15,069 50,434 3,801 (1,259) 7.83
Bank acceptances of customers 18,278 - - - - - - 18,278 -
Property, plant and equipment 1,449 - - - - - - 1,449 -
Investment in associates 906 - - - - - - 906 -
Intangible assets 7,618 - - - - - - 7,618 -
Deferred tax assets 33 - - - - - - 33 -
Other assets 5,402 - - - - - - 5,402 -
Assets held for sale 412 - - - - - 140 272 10.00
Total assets 410,225 245,311 17,014 8,205 15,571 57,112 6,989 60,023 (3)
Liabilities
Deposits and other public borrowings 233,934 162,993 38,687 15,268 7,817 3,005 22 6,142 6.81
Payables due to other financial institutions 4,390 4,146 240 - 4 - - - 5.33
Liabilities at fair value through Income
Statement 2,915 1,871 15 18 56 698 257 - 6.86
Derivative liabilities 16,893 - - - - - - 16,893 -
Bank acceptances 18,278 - - - - - - 18,278 -
Current tax liabilities 696 - - - - - - 696 -
Other provisions 1,129 - - - - - - 1,129 -
Insurance policy liabilities (1) 16,594 - - - - - - 16,594 -
Debt issues 67,119 22,722 12,559 4,266 5,195 20,969 1,408 - 5.92
Managed funds units on issue 1,109 - - - - - - 1,109 -
Bills payable and other liabilities 6,532 - - - - - - 6,532 -
369,589 191,732 51,501 19,552 13,072 24,672 1,687 67,373
Loan capital 9,085 2,261 3,970 - 300 1,385 1,169 - 5.95
Total liabilities 378,674 193,993 55,471 19,552 13,372 26,057 2,856 67,373 (3)
Shareholders' equity
Share capital and other equity 24,542 - - - - - - 24,542 -
Minority interests 1 - - - - - - 1 -
Total Shareholders' equity 24,543 - - - - - - 24,543
Derivatives (2) (22,559) (4,501) 7,999 17,976 2,251 (1,166) - (3)
Net mismatch (2) 28,759 (42,958) (3,348) 20,175 33,306 2,967 (31,893) (3)
Cumulative mismatch (2) 28,759 (14,199) (17,547) 2,628 35,934 38,901 7,008 (3)
(1) Technically, the insurance policy liabilities are not interest bearing, but the amount of the liability may change in line with changes in interest rates, particularly with
investment linked policies.
(2) No Balance Sheet amount applicable.
(3) No rate applicable.

Notes to the Financial Statements
142 Commonwealth Bank of Australia Financial Report (U.S. Version) 2009
Note 41 Market Risk Management (continued)
Interest Rate Risk Sensitivity Repricing Period at 30 June 2008
Balance Not Weighted
Sheet 0 to 1 1 to 3 3 to 6 6 to 12 1 to 5 Over 5 Interest Average
Total month months months months years years Bearing Rate
$M $M $M $M $M $M $M $M %
Overseas
Assets
Cash and liquid assets 2,895 2,764 40 - 3 - - 88 4.19
Receivables due from other financial
institutions 2,104 1,249 467 216 47 - - 125 3.55
Assets at fair value through Income Statement:
Trading 3,219 569 1,676 166 5 667 134 2 7.80
Insurance 1,974 644 12 17 5 25 167 1,104 3.41
Other 2,971 1,079 793 87 291 701 - 20 5.28
Derivative assets 1,893 - - - - - - 1,893 -
Available-for-sale investments 4,324 1,061 165 1,269 1,226 567 3 33 4.34
Loans, bills discounted and other receivables 55,807 15,312 7,485 5,655 6,610 19,667 1,165 (87) 8.16
Property, plant and equipment 191 - - - - - - 191 -
Intangible assets 640 - - - - - - 640 -
Deferred tax assets 43 - - - - - - 43 -
Other assets 1,090 - - - - - - 1,090 -
Assets held for sale 196 - - - - - 51 145 10.00
Total assets 77,347 22,678 10,638 7,410 8,187 21,627 1,520 5,287 (3)
Liabilities
Deposits and other public borrowings 29,772 16,057 5,713 3,353 2,487 676 18 1,468 5.85
Payables due to other financial institutions 13,282 11,226 1,740 315 1 - - - 3.00
Liabilities at fair value through Income
Statement 12,611 1,635 4,218 2,768 1,262 2,712 16 - 6.34
Derivative liabilities 2,648 - - - - - - 2,648 -
Current tax liabilities 72 - - - - - - 72 -
Deferred tax liabilities 266 - - - - - - 266 -
Other provisions 45 - - - - - - 45 -
Insurance policy liabilities (1) 1,901 - - - - - - 1,901 -
Debt issues 18,698 6,436 9,723 1,031 858 498 152 - 3.69
Bills payable and other liabilities 992 - - - - - - 992 -
80,287 35,354 21,394 7,467 4,608 3,886 186 7,392
Loan capital 2,474 1,442 - - - 455 577 - 7.98
Total liabilities 82,761 36,796 21,394 7,467 4,608 4,341 763 7,392 (3)
Shareholders' equity
Share capital and other equity 1,077 - - - - - - 1,077 -
Minority interests 517 - - - - - - 517 -
Total Shareholders' equity 1,594 - - - - - - 1,594
Derivatives (2) 2,662 13,353 (1,604) (599) (13,543) (269) - (3)
Net mismatch (2) (11,456) 2,597 (1,661) 2,980 3,743 488 (3,699) (3)
Cumulative mismatch (2) (11,456) (8,859) (10,520) (7,540) (3,797) (3,309) (7,008) (3)
(1) Technically, the insurance policy liabilities are not interest bearing, but the amount of the liability may change in line with changes in interest rates, particularly with
investment linked policies.
(2) No Balance Sheet amount applicable.
(3) No rate applicable.

Notes to the Financial Statements
Commonwealth Bank of Australia Financial Report (U.S. Version) 2009 143
Note 41 Market Risk Management (continued)
Liquidity and Funding Risk
Overview
Balance Sheet liquidity risk is the risk of being unable to meet
financial obligations as they fall due. The Group manages
liquidity requirements by currency and by geographical location
of its operations. Subsidiaries are also included in the Group‟s
liquidity policy framework.
Funding risk is the risk of over-reliance on a funding source to
the extent that a change in that funding source could increase
overall funding costs or cause difficulty in raising funds. The
funding requirements are integrated into the Group‟s liquidity
and funding policy with its aim to ensure the Group has a stable
diversified funding base without over-reliance on any one market
sector.
The Group‟s liquidity and funding policies are designed to
ensure it will meet its obligations as and when they fall due, by
ensuring it is able to borrow funds on an unsecured basis, or has
sufficient quality assets to borrow against on a secured basis, or
has sufficient quality liquid assets to sell to raise immediate
funds without adversely affecting the Group‟s net asset value.
The Group‟s funding policies and risk management framework
complement the Group‟s liquidity policies by ensuring an optimal
liability structure to finance the Group‟s businesses. The long
term stability and security of the Group‟s funding is also
designed to protect its liquidity position in the event of a crisis
specific to the Group.
The Group‟s liquidity policies are designed to ensure it maintains
sufficient cash balances and liquid asset holdings to meet its
obligations to customers, in both ordinary market conditions and
during periods of extreme stress. These policies are intended to
protect the value of the Group‟s operations during periods of
unfavourable market conditions, such as have been experienced
since August 2007.
The Group‟s funding policies are designed to achieve diversified
sources of funding by product, term, maturity date, investor type,
investor location, jurisdiction, currency and concentration, on a
cost-effective basis. This objective applies to the Group‟s
wholesale and retail funding activities. The Group‟s retail funding
base formed approximately 58% of its total funding requirements
as at 30 June 2009 (June 2008: 57%).
The Risk Management Framework for Liquidity and
Funding
The Group‟s liquidity and funding policies are approved by the
Board and agreed with the Australian Prudential Regulation
Authority (“APRA”). The Group has an Asset and Liability
Committee whose charter includes reviewing the management
of assets and liabilities, reviewing liquidity and funding policies
and strategies, as well as regularly monitoring compliance with
those policies across the Group. The Group Treasury division
manages the Group‟s liquidity and funding positions in
accordance with the Group‟s liquidity policy, including monitoring
and satisfying the liquidity needs of the Group and its
subsidiaries.
Larger domestic subsidiaries, such as CBFC Limited and
subsidiaries within the Colonial Group, also apply their own
liquidity and funding methods to address their specific needs.
The Group‟s New Zealand banking subsidiary, ASB Bank
Limited (“ASB”), manages its own domestic liquidity and funding
needs in accordance with its own liquidity policies and the
policies of the Group. ASB‟s liquidity policy is also overseen by
the Reserve Bank of New Zealand.
The Group also has relatively small banking subsidiaries in
Indonesia and Fiji that manage their liquidity and funding on a
similar basis.
The Group‟s Financial Services and Risk Management divisions
provide prudential oversight of the Group‟s liquidity and funding
risk and manage the Group‟s relationship with prudential
regulators.
Liquidity and Funding Policies and Management
The Group‟s liquidity and funding policies provide that:
Balance sheet assets that cannot be liquidated quickly are
funded with deposits or term borrowings that meet minimum
maturity requirements with appropriate liquidity buffers;
Short and long term wholesale funding limits are established
and reviewed regularly based on surveys and analysis of
market capacity;
A minimum level of assets are retained in highly liquid form;
The level of liquid assets complies with crisis scenario
assumptions related to “worst case” wholesale and retail
market conditions; is adequate to meet known funding
obligations over certain timeframes and are allocated across
Australian dollar and foreign currency denominated securities
in accordance with specific calculations;
Certain levels of liquid assets are held to provide for the risk
of the Group‟s committed but un-drawn lending obligations
being drawn by customers, as calculated based on draw
down estimates and forecasts; and
The Group maintains certain levels of liquid assets
categories within its liquid assets portfolio. The first category
includes negotiable certificates of deposit of Australian
banks, bank bills, Commonwealth of Australia Government
and Australian state and semi-government bonds and supra-
national bonds eligible for repurchase by the Reserve Bank
of Australia (“RBA”) at any time. The second category is AAA
and A-1+ rated Australian residential mortgage backed
securities that meet certain minimum requirements.
At 30 June 2009 around 100% of the Group‟s Australian dollar
liquid assets qualified for repurchase by the RBA at any time.
The Group‟s key liquidity tools include:
A liquidity management model similar to a “cash flow ladder”
or “maturity gap analysis”, that allows forecasting of liquidity
needs on a daily basis;
An additional liquidity management model that implements
the agreed prudential liquidity policies. This model is
calibrated with a series of “worst case” liquidity crisis
scenarios, incorporating both systemic and “name” crisis
assumptions, such that the Group will have sufficient liquid
assets available to ensure it meets all of its obligations as
and when they fall due;
The RBA‟s repurchase agreement facilities provide the
Group with the ability to borrow funds on a secured basis,
even when normal funding markets are unavailable; and
The Group‟s various short term funding programmes are
supplemented by the Interbank Deposit Agreement between
the four major Australian banks. This agreement is similar to
a standby liquidity facility that allows the Group to access
funding in various crisis circumstances.

Notes to the Financial Statements
144 Commonwealth Bank of Australia Financial Report (U.S. Version) 2009
Note 41 Market Risk Management (continued)
Liquidity and Funding Risk (continued)
The Group‟s key funding tools include:
Its consumer, small business and institutional deposit base;
Its consumer retail funding base includes a wide range of
retail transaction accounts, investment accounts, term
deposits and retirement style accounts for individual
consumers; and
Its wholesale international and domestic funding
programmes which includes its: Australian dollar Negotiable
Certificates of Deposit programme; Transferable Certificate
of Deposit programme; Australian dollar bank bill
programme; Australian, U.S. and Euro Commercial Paper
programmes; U.S. Extendible Notes programme; Australian
dollar domestic borrowing programme; U.S. Medium Term
Note Programme; Euro Medium Term Note Programme and
its Medallion “Regulation AB” securitisation programme.
The chart below illustrates the liquidity profile of the Group‟s
outstanding wholesale debt liabilities at 30 June 2009, broken
down by type of debt instrument and maturity.
Recent Market Environment
Although the cost of liquidity and funding has increased
significantly since July 2007 due to unfavourable market
conditions, the Group‟s liquidity and funding policies have
remained unchanged throughout this period, as they have
proven to be effective during the recent global financial crisis.
Nonetheless, the Group plans on thoroughly reviewing its
liquidity policies and practices after new guidance is provided by
APRA, which is expected later this year.
The Group has managed its liquidity to avoid concentrations
such as dependence on single sources of funding and has
taken advantage of its diversified funding base and significant
funding capacity in the global unsecured debt markets.
Since October 2008, the Reserve Bank of Australia (RBA) and
the Reserve Bank of New Zealand (RBNZ) have accepted
internal residential mortgage-backed securities (RMBS) and
asset-backed commercial paper (ABCP) as collateral in their
repurchase operations. This has allowed the Group to borrow
funds from the RBA and the RBNZ using RMBS created by
securitising a portion of its prime residential mortgage portfolio.
At 30 June 2009 the Group has $43 billon of formally
securitised home loans which could provide additional funding
from the RBA and the RBNZ.
Details of the Group‟s regulatory capital position and capital
management activities are disclosed in Note 34 Capital
Adequacy.
5
10
15
20
25
30
Q1 Q2 Q3 Q4 2011 2012 2013 2014 2015 2016 2017 2018 2019 2020+
$ B
illi
on
Financial Year
Domestic Offshore Securitisation Structured

Notes to the Financial Statements
Commonwealth Bank of Australia Financial Report (U.S. Version) 2009 145
Note 41 Market Risk Management (continued)
Maturity Analysis of Monetary Liabilities
Amounts shown in the tables below are based on contractual undiscounted cash flows for the remaining contractual maturities.
Group
Maturity Period at 30 June 2009
0 to 3 3 to 12 1 to 5 Over 5 Not
At Call months months years years Specified Total
$M $M $M $M $M $M $M
Liabilities
Deposits and other public borrowings (1) 183,878 117,673 50,013 20,642 143 - 372,349
Payables due to other financial institutions 1,582 12,347 1,203 - - - 15,132
Liabilities at fair value through Income Statement - 8,915 3,694 3,082 1,564 - 17,255
Derivative liabilities (2) (3) - 33,687 2,018 3,967 2,765 - 42,437
Bank acceptances - 14,444 284 - - - 14,728
Insurance policy liabilities - - - - - 16,056 16,056
Debt issues and loan capital - 24,695 18,754 62,030 27,513 - 132,992
Managed funds units on issue - - - - - 914 914
Other monetary liabilities 1,094 3,020 1,620 127 - 444 6,305
Total monetary liabilities 186,554 214,781 77,586 89,848 31,985 17,414 618,168
Guarantees - 197 328 2,486 490 141 3,642
Loan commitments - 271 18,833 35,256 26,649 36,879 117,888
Other commitments - 65 413 2,549 85 72 3,184
Total off balance sheet items - 533 19,574 40,291 27,224 37,092 124,714
Total monetary liabilities and off balance sheet
items186,554 215,314 97,160 130,139 59,209 54,506 742,882
(1) Includes substantial “core” deposits that are contractually at call customer savings and cheque accounts. Historical experience is that such accounts provide a
stable source of long term funding for the Bank. Also refer to Interest Rate Risk Sensitivity table.
(2) Gross payable amounts on cross currency swaps have been reported in derivative liabilities. The Group has corresponding receivables on these cross currency
swaps that have not been reported, in accordance with the requirements of AASB 7 Financial Instruments Disclosures. The terms of the cross currency swap
agreements entered into by the Group allow for net settlement in the event of certain specific circumstances including default of the counterparties.
(3) All trading derivatives are included in the 0 to 3 months maturity band.
Group
Maturity Period at 30 June 2008
0 to 3 3 to 12 1 to 5 Over 5 Not
At Call months months years years Specified Total
$M $M $M $M $M $M $M
Liabilities
Deposits and other public borrowings (1) 135,763 76,884 50,896 4,537 62 - 268,142
Payables due to other financial institutions 1,893 15,436 419 - - - 17,748
Liabilities at fair value through Income Statement - 7,990 4,271 2,834 1,984 - 17,079
Derivative liabilities (2) (3) - 16,909 159 3,746 2,927 - 23,741
Bank acceptances - 18,041 237 - - - 18,278
Insurance policy liabilities - - - - - 18,495 18,495
Debt issues and loan capital - 24,008 16,794 43,924 33,533 - 118,259
Managed funds units on issue - - - - - 1,109 1,109
Other monetary liabilities 747 2,170 1,199 506 - 542 5,164
Total monetary liabilities 138,403 161,438 73,975 55,547 38,506 20,146 488,015
Guarantees - - 88 2,295 419 - 2,802
Loan commitments - - 11,980 36,463 21,290 27,571 97,304
Other commitments - - 2,238 7,741 994 - 10,973
Total off balance sheet items - - 14,306 46,499 22,703 27,571 111,079
Total monetary liabilities and off balance sheet
items138,403 161,438 88,281 102,046 61,209 47,717 599,094
(1) Includes substantial “core” deposits that are contractually at call customer savings and cheque accounts. Historical experience is that such accounts provide a
stable source of long term funding for the Bank. Also refer to Interest Rate Risk Sensitivity table.
(2) Gross payable amounts on cross currency swaps have been reported in derivative liabilities. The Group has corresponding receivables on these cross currency
swaps that have not been reported, in accordance with the requirements of AASB 7 Financial Instruments Disclosures. The terms of the cross currency swap
agreements entered into by the Group allow for net settlement in the event of certain specific circumstances including default of the counterparties.
(3) All trading derivatives are included in the 0 to 3 months maturity band.

Notes to the Financial Statements
146 Commonwealth Bank of Australia Financial Report (U.S. Version) 2009
Note 41 Market Risk Management (continued)
Maturity Analysis of Monetary Liabilities
Amounts shown in the tables below are based on contractual undiscounted cash flows for the remaining contractual maturities.
Bank
Maturity Period at 30 June 2009
0 to 3 3 to 12 1 to 5 Over 5 Not
At Call months months years years Specified Total
$M $M $M $M $M $M $M
Liabilities
Deposits and other public borrowings (1) 144,011 103,808 41,737 18,615 130 - 308,301
Payables due to other financial institutions 1,485 12,277 1,203 - - - 14,965
Liabilities at fair value through Income Statement - 116 269 2,033 1,703 - 4,121
Derivative liabilities (2) (3) - 29,511 559 992 2,745 - 33,807
Bank acceptances - 14,442 284 - - - 14,726
Debt issues and loan capital - 5,568 13,106 45,307 25,207 - 89,188
Due to controlled entities - 50,871 17,266 12,471 476 - 81,084
Other monetary liabilities 3,301 1,758 1,429 18 - 210 6,716
Total monetary liabilities 148,797 218,351 75,853 79,436 30,261 210 552,908
Guarantees - - 117 2,266 428 - 2,811
Loan commitments - - 15,439 32,349 22,489 31,776 102,053
Other commitments - - 246 2,317 83 - 2,646
Total off balance sheet items - - 15,802 36,932 23,000 31,776 107,510
Total monetary liabilities and off balance sheet
items148,797 218,351 91,655 116,368 53,261 31,986 660,418
(1) Includes substantial “core” deposits that are contractually at call customer savings and cheque accounts. Historical experience is that such accounts provide a
stable source of long term funding for the Bank. Also refer to Interest Rate Risk Sensitivity table.
(2) Gross payable amounts on cross currency swaps have been reported in derivative liabilities. The Group has corresponding receivables on these cross currency
swaps that have not been reported, in accordance with the requirements of AASB 7 Financial Instruments Disclosures. The terms of the cross currency swap
agreements entered into by the Group allow for net settlement in the event of certain specific circumstances including default of the counterparties.
(3) All trading derivatives are included in the 0 to 3 months maturity band.
Bank
Maturity Period at 30 June 2008
0 to 3 3 to 12 1 to 5 Over 5 Not
At Call months months years years Specified Total
$M $M $M $M $M $M $M
Liabilities
Deposits and other public borrowings (1) 126,725 72,993 41,533 3,126 62 - 244,439
Payables due to other financial institutions 1,845 15,436 419 - - - 17,700
Liabilities at fair value through Income Statement - 221 176 1,912 1,975 - 4,284
Derivative liabilities (2) (3) - 17,243 150 3,708 2,927 - 24,028
Bank acceptances - 18,041 237 - - - 18,278
Debt issues and loan capital - 8,718 11,650 33,688 34,224 - 88,280
Due to controlled entities - 25,981 7,642 23,366 1,508 - 58,497
Other monetary liabilities 48 2,513 1,055 407 - 256 4,279
Total monetary liabilities 128,618 161,146 62,862 66,207 40,696 256 459,785
Guarantees - - 116 3,036 555 - 3,707
Loan commitments - - 11,188 34,052 19,882 25,748 90,870
Other commitments - - 2,204 7,623 979 - 10,806
Total off balance sheet items - - 13,508 44,711 21,416 25,748 105,383
Total monetary liabilities and off balance sheet
items128,618 161,146 76,370 110,918 62,112 26,004 565,168
(1) Includes substantial “core” deposits that are contractually at call customer savings and cheque accounts. Historical experience is that such accounts provide a
stable source of long term funding for the Bank. Also refer to Interest Rate Risk Sensitivity table.
(2) Gross payable amounts on cross currency swaps have been reported in derivative liabilities. The Group has corresponding receivables on these cross currency
swaps that have not been reported, in accordance with the requirements of AASB 7 Financial Instruments Disclosures. The terms of the cross currency swap
agreements entered into by the Group allow for net settlement in the event of certain specific circumstances including default of the counterparties.
(3) All trading derivatives are included in the 0 to 3 months maturity band.

Notes to the Financial Statements
Commonwealth Bank of Australia Financial Report (U.S. Version) 2009 147
Note 42 Retirement Benefit Obligations
Name of Plan Type Form of Benefit
Date of Last Actuarial
Assessment of the Fund
Officers‟ Superannuation Fund
(“OSF”)
Defined Benefits (1) and
Accumulation
Indexed pension and
lump sum 30 June 2006 (2)
Commonwealth Bank of Australia
(UK) Staff Benefits Scheme
(“CBA(UK)SBS”)
Defined Benefits (1) and
Accumulation
Indexed pension and
lump sum 30 June 2007
(1) The defined benefit formulae are generally comprised of final superannuation salary, or final average superannuation salary, and service.
(2) An actuarial assessment of the OSF at 30 June 2009 is currently in progress.
Contributions
Entities of the Group contribute to the plans listed in the above
table in accordance with the Trust Deeds following the receipt of
actuarial advice.
With the exception of contributions corresponding to salary
sacrifice benefits, the Bank ceased contributions to the OSF
from 8 July 1994. Further, the Bank ceased contributions to the
OSF relating to salary sacrifice benefits from 1 July 1997.
An actuarial assessment of the OSF, as at 30 June 2006, was
completed during the year ended 30 June 2007. In line with the
actuarial advice contained in the assessment, the Bank does
not intend to make contributions to the OSF until further
consideration of the next actuarial assessment of the OSF as at
30 June 2009.
An actuarial assessment of the OSF at 30 June 2009 is
currently in progress.
An actuarial assessment of the CBA(UK)SBS, as at 30 June
2007 confirmed a deficit of GBP 25 million (AUD 51 million at
the 30 June 2009 exchange rate). Following from this
assessment, the Bank agreed to contribute at the fund actuary‟s
recommended contribution rates. These rates included
amounts to finance future accruals of defined benefits
(contributions estimated at AUD 3.7 million per annum at the 30
June 2009 exchange rate) and additional contributions of GBP
3.2 million per annum (AUD 6.7 million per annum at the 30
June 2009 exchange rate) payable over 10 years to finance the
fund deficit.

Notes to the Financial Statements
148 Commonwealth Bank of Australia Financial Report (U.S. Version) 2009
Note 42 Retirement Benefit Obligations (continued)
Defined Benefit Superannuation Plans
The amounts reported in the Balance Sheet are reconciled as follows:
OSF CBA(UK)SBS Total
2009 2008 2009 2008 2009 2008
$M $M $M $M $M $M
Present value of funded obligations (3,118) (2,892) (394) (386) (3,512) (3,278)
Fair value of plan assets 3,613 4,428 308 321 3,921 4,749
Total pension assets as at 30 June 495 1,536 (86) (65) 409 1,471
Present value of unfunded obligations - - - - - -
Unrecognised past service cost - - - - - -
Unrecognised actuarial gains/(losses) - - - - - -
Asset/(liability) in Balance Sheet as at 30 June 495 1,536 (86) (65) 409 1,471
Amounts in the Balance Sheet:
Liabilities (Note 29) - - (86) (65) (86) (65)
Assets (Note 20) 495 1,536 - - 495 1,536
Net asset 495 1,536 (86) (65) 409 1,471
The amounts recognised in the Income Statement are as
follows:
Current service cost (24) (26) (3) (3) (27) (29)
Interest cost (184) (194) (24) (20) (208) (214)
Expected return on plan assets 372 400 21 20 393 420
Past service cost - - - - - -
Employer financed benefits within Accumulation Division(172) (163) - - (172) (163)
Gains/(losses) on curtailment and settlements - - - - - -
Actuarial gains/(losses) recognised in Income Statement- - - - - -
Total included in defined benefit superannuation plan
expense (8) 17 (6) (3) (14) 14
Actuarial return on plan assets (457) (120) (5) (1) (462) (121)
Changes in the present value of the defined benefit
obligation are as follows:
Opening defined benefit obligation (2,892) (3,094) (386) (401) (3,278) (3,495)
Current service cost (20) (24) (3) (3) (23) (27)
Interest cost (184) (194) (24) (20) (208) (214)
Member contributions (13) (13) - - (13) (13)
Actuarial gains/(losses) (204) 226 2 (26) (202) 200
(Losses)/gains on curtailments - - - - - -
Liabilities extinguished on settlements - - - - - -
Liabilities assumed in a business combination - - - - - -
Benefits paid 195 207 15 14 210 221
Exchange differences on foreign plans - - 2 50 2 50
Closing defined benefit obligation (3,118) (2,892) (394) (386) (3,512) (3,278)
Changes in the fair value of plan assets are as follows:
Opening fair value of plan assets 4,428 4,907 321 372 4,749 5,279
Expected return 372 400 21 20 393 420
Experience (losses)/gains (829) (520) (26) (21) (855) (541)
Assets distributed on settlements - - - - - -
Total contributions 13 13 10 10 23 23
Assets acquired in a business combination - - - - - -
Exchange differences on foreign plans - - (3) (46) (3) (46)
Benefits and expenses paid (199) (209) (15) (14) (214) (223)
Employer financed benefits within Accumulation Division (172) (163) - - (172) (163)
Closing fair value of plan assets 3,613 4,428 308 321 3,921 4,749

Notes to the Financial Statements
Commonwealth Bank of Australia Financial Report (U.S. Version) 2009 149
Note 42 Retirement Benefit Obligations (continued)
Defined Benefit Superannuation Plans (continued) OSF CBA(UK)SBS Total
2009 2008 2009 2008 2009 2008
$M $M $M $M $M $M
Experience (losses)/gains on plan liabilities (120) 134 2 6 (118) 140
Experience (losses)/gains on plan assets (829) (520) (26) (21) (855) (541)
Gains/(losses) from changes in actuarial assumptions (84) 92 - (32) (84) 60
Total net actuarial (losses)/gains (1,033) (294) (24) (47) (1,057) (341)
Actuarial gains and losses represent experience adjustments on plan assets and liabilities as well as adjustments arising from changes
in actuarial assumptions. Total net actuarial losses recognised in equity from commencement of AIFRS (1 July 2005) to 30 June 2009
were $107 million.
OSF CBA(UK)SBS
2009 2008 2009 2008
Economic Assumptions % % % %
The above calculations were based on the following assumptions:
Discount rate at 30 June (gross of tax) 5.50 6.50 6.10 6.20
Expected return on plan assets at 30 June 8.00 8.75 6.60 6.50
Expected rate salary increases at 30 June (per annum) (1) 3.90 4.50 4.70 4.90
(1) For the OSF, additional age related allowances were made for the expected salary increases from future promotions. At 30 June 2008 and 30 June 2009, these
assumptions were broadly between 1.6% and 2.6% per annum for full-time employees and 1.0% per annum for part time employees.
The return on asset assumption for the OSF is determined as
the weighted average of the long term expected returns of each
asset class where the weighting is the benchmark asset
allocations of the assets backing the defined benefit risks. The
long term expected returns of each asset class are determined
following receipt of actuarial advice. The discount rate (gross of
tax) assumption for the OSF is based on the yield on 10 year
Australian Commonwealth Government securities.
In addition to financial assumptions, the mortality assumptions
for pensioners can materially impact the defined benefit
obligations. These assumptions are age related and allowances
are made for future improvement in mortality. The expected life
expectancies for pensioners are set out below:
OSF CBA(UK)SBS
2009 2008 2009 2008
Expected Life Expectancies for Pensioners Years Years Years Years
Male pensioners currently aged 60 28.8 30.4 26.8 26.8
Male pensioners currently aged 65 23.9 25.6 22.0 22.0
Female pensioners currently aged 60 33.9 33.8 29.7 29.7
Female pensioners currently aged 65 28.8 28.7 24.9 24.9
Further, the proportion of the retiring members of the main OSF
defined benefit division electing to take pensions instead of lump
sums may materially impact the defined benefit obligations.
Of these retiring members 34% were assumed to take pension
benefits, increasing to 50% by 2020.
Australian and UK legislation requires that superannuation
(pension) benefits be provided through trusts. These trusts
(including their investments) are managed by trustees who are
legally independent of the employer. The investment objective of
the OSF (the Bank‟s major superannuation (pension) plan) is “to
maximise the long term rate of return subject to net returns over
rolling five year periods exceeding the growth in Average
Weekly Ordinary Time Earnings 80% of the time”.
To meet this investment objective, the OSF Trustee invests a
large part of the OSF‟s assets in growth assets, such as shares
and property. These assets have historically earned higher
rates of return than other assets, but they also carry higher
risks, especially in the short term. To manage these risks, the
Trustee has adopted a strategy of spreading the OSF‟s
investments over a number of asset classes and investment
managers.
As at 30 June 2009, the benchmark asset allocations and
actual asset allocations for the assets backing the defined
benefit portion of the OSF are as follows:
Benchmark Allocation Actual Allocation
Asset Allocations % %
Australian Equities 27.5 24.6
Overseas Equities 21.0 14.5
Real Estate 12.0 18.5
Fixed Interest Securities 25.5 29.0
Cash 5.0 4.8
Other (1) 9.0 8.6
(1) These are assets which are not included in the traditional asset classes of equities, fixed interest securities, real estate and cash. They include infrastructure
investments as well as high yield and emerging market debt.
The value of the OSF‟s equity holding in the Group as at 30 June 2009 was $72 million (2008: $77 million). Amounts on deposit with
the Bank at 30 June 2009 totalled $22 million (2008: $26 million). Other financial instruments with the Group at 30 June 2009 totalled
$13 million (2008: $13 million).

Notes to the Financial Statements
150 Commonwealth Bank of Australia Financial Report (U.S. Version) 2009
Note 43 Controlled Entities
Extent of Beneficial Incorporated in
Entity Name Interest if not 100%
Australia
(a) Banking
Commonwealth Bank of Australia Australia
Controlled Entities:
CBFC Limited Australia
CBCL Australia Limited Australia
Commonwealth Securities Limited Australia
Homepath Pty Limited Australia
Sparad (No. 24) Pty Limited Australia
Colonial Finance Limited Australia
PERLS III Trust Australia
Loft No.1 Pty Limited Australia
Loft No.2 Pty Limited Australia
Loft No.3 Pty Limited Australia
Medallion Trust Series 2003-1G Australia
Medallion Trust Series 2004-1G Australia
Medallion Trust Series 2005-1G Australia
Medallion Trust Series 2005-2G Australia
Medallion Trust Series 2006-1G Australia
Medallion Trust Series 2007-1G Australia
Medallion Trust Series 2008-1R Australia
SHIELD Series 50 Australia
GT Operating No.2 Pty Limited Australia
GT Operating No.4 Pty Limited Australia
GT Funding No.6 Ltd Partnership Australia
Securitisation Advisory Services Pty Ltd Australia
MIS Funding No.1 Pty Limited Australia
IWL Limited Australia
IWL Broking Solutions Limited Australia
CBFC Leasing Pty Limited Australia
Christmas Break Pty Limited Australia
JDV Limited Australia
Bank of Western Australia Limited Australia
BWA Group Services Pty Limited Australia
Swan Trust Series 2006-1E Australia
Swan Trust Series 2007-1E Australia
Swan Trust Series 2008-1D Australia
CBA USD Investments Partnership Australia
Australian Investment Exchange Ltd Australia

Notes to the Financial Statements
Commonwealth Bank of Australia Financial Report (U.S. Version) 2009 151
Note 43 Controlled Entities (continued)
Extent of Beneficial Incorporated in
Entity Name Interest if not 100%
(b) Insurance and Funds Management
Commonwealth Insurance Limited Australia
Colonial Holding Company Limited Australia
Commonwealth Insurance Holdings Limited Australia
Commonwealth Managed Investments Limited Australia
Colonial First State Group Limited Australia
Colonial First State Investments Limited Australia
Avanteos Pty Limited Australia
Avanteos Investments Ltd Australia
Colonial First State Property Limited Australia
Colonial First State Property Retail Trust Australia
Colonial First State Property Management Trust Australia
Commonwealth International Holdings Pty Limited Australia
The Colonial Mutual Life Assurance Society Limited Australia
Jacques Martin Administration and Consulting Pty Limited Australia
Jacques Martin Pty Limited Australia
Commonwealth Financial Planning Limited Australia
Capital 121 Pty Limited Australia
Financial Wisdom Limited Australia
First State Investment Managers (Asia) Limited Australia
Colonial First State Asset Management (Australia) Limited Australia
CFS Managed Property Limited Australia
St Andrew's Australia Pty Limited Australia

Notes to the Financial Statements
152 Commonwealth Bank of Australia Financial Report (U.S. Version) 2009
Note 43 Controlled Entities (continued)
> 0 = Error in calculation
Extent of Beneficial Incorporated in
Entity Name Interest if not 100%
New Zealand
(a) Banking
ASB Holdings Limited New Zealand
ASB Bank Limited New Zealand
CBA Funding (NZ) Limited New Zealand
ASB Capital Limited New Zealand
ASB Capital No.2 Limited New Zealand
CBA NZ Holding Limited New Zealand
CBA USD Funding Limited New Zealand
Medallion Trust (New Zealand) Series 2009-1R New Zealand
(b) Insurance and Funds Management
ASB Group (Life) Limited New Zealand
Sovereign Group Limited New Zealand
Sovereign Limited New Zealand
Colonial First State Investments (NZ) Limited New Zealand
Kiwi Income Properties Limited New Zealand
Kiwi Property Management Limited New Zealand
Other Overseas
(a) Banking
CBA Asia Limited Singapore
CTB Australia Limited Hong Kong
PT Bank Commonwealth 97% Indonesia
National Bank of Fiji Limited Fiji
CBA (Delaware) Finance Incorporated Delaware USA
CBA Capital Trust 1 Delaware USA
CBA Funding Trust 1 Delaware USA
CBA Capital Trust II Delaware USA
CBA (Europe) Finance Limited United Kingdom
Pontoon (Funding) PLC United Kingdom
Burdekin Investments Limited Cayman Islands
Pavilion & Park Limited United Kingdom
Newport Limited Malta
CommInternational Limited Malta
CommCapital S.a.r.l Luxembourg
CommBank Europe Limited Malta
CommBank Management Consulting (Asia) Co Ltd Hong Kong
CommTrading Limited Malta
Watermark Limited Hong Kong
D Compartment ABI Lux Co Luxembourg
(b) Insurance and Funds Management
Colonial First State (UK) Holdings Limited United Kingdom
Colonial Fiji Life (Fiji) Limited Fiji
First State (Hong Kong) LLC United States
First State Investment Holdings (Singapore) Ltd Singapore
Indonesian Life Insurance Company 80% Indonesia
FS Investments (Bermuda) Ltd Bermuda
Non-operating and minor operating controlled entities and investment vehicles holding policyholder assets are excluded from the above
list.

Notes to the Financial Statements
Commonwealth Bank of Australia Financial Report (U.S. Version) 2009 153
Note 44 Investments in Associated Entities and Joint Ventures
Group
Extent of
2009 2008 Ownership Country of Balance
$M $M Interest % Principal Activities Incorporation Date
Acadian Asset Management (Australia) Limited 2 2 50 Investment Management Australia 30-Jun
CMG CH China Funds Management Limited 1 1 50 Investment Management Australia 31-Mar
Equion Health (Barts) Limited - 1 50 Financial Services United Kingdom 31-Dec
Equigroup Pty Limited 15 15 50 Leasing Australia 30-Jun
China Life CMG Life Assurance Company Limited 11 11 49 Life Insurance China 31-Dec
First State Cinda Fund Management Company Limited 14 13 46 Funds Management China 31-Dec
Healthcare Support (Newcastle) Limited 2 1 40 Financial Services United Kingdom 31-Dec
Aussie Home Loans Pty Limited 71 - 33 Mortgage Broking Australia 30-Jun
International Private Equity Real Estate Fund 5 5 33 Funds Management Australia 30-Jun
AMTD Group Company Limited 1 1 30 Financial Services Virgin Islands 31-Dec
452 Capital Pty Limited 30 44 30 Investment Management Australia 30-Jun
Qilu Bank Co. Ltd. 112 - 20 Commercial Banking China 31-Dec
Bank of Hangzhou Co. Ltd. 205 164 19.9 Commercial Banking China 31-Dec
FS Media Works Fund 1, LP 22 - 11 Investment Fund United Kingdom 31-Dec
CFS Retail Property Trust (1) 438 438 8.9 Funds Management Australia 30-Jun
Commonwealth Property Office Fund (2) 118 209 6.8 Funds Management Australia 30-Jun
Sandalwood Pty Ltd - 1 - Property Management Singapore 31-Dec
Total 1,047 906
(1) The value for CFS Retail Property Trust based on published quoted prices as at 30 June 2009 is $363 million (2008: $407 million).
(2) The value for Commonwealth Property Office Fund based on published quoted prices as at 30 June 2009 is $104 million (2008: $196 million). During the 2009
financial year an impairment loss of $91 million was recognised in Funds management and investment contracts income-other for the Group and net gain/(loss) on
Other non-trading instruments for the Bank.
Group
2009 2008
$M $M
Share of Associates' profits/(losses)
Operating profits/(losses) before income tax 144 98
Income tax expense (3) (6)
Operating profits/(losses) after income tax 141 92
Carrying amount of investments in associated entities 1,047 906

Notes to the Financial Statements
154 Commonwealth Bank of Australia Financial Report (U.S. Version) 2009
Note 44 Investments in Associated Entities and Joint Ventures (continued)
Group
2009 2008
$M $M
Financial Information of Associates
Assets 47,972 25,610
Liabilities 38,583 17,967
Revenues 2,454 2,213
Expenses 1,708 1,436
Group
2009 2008
$M $M
Financial Information of Joint Ventures
Assets 354 359
Liabilities 298 63
Revenues 157 231
Expenses 159 78
Note 45 Director and Executive Disclosures
Details of the Directors‟ and Specified Executives‟ remuneration, interests in long term incentive plans, shares, options and loans are
included in the Remuneration Report of the Directors‟ Report. The Company has applied the exemption under AASB 124 Related
Party Disclosures which exempts listed companies from providing remuneration disclosures in relation to their key management
personnel in their Annual Financial Reports. These remuneration disclosures are provided in the Remuneration Report of the Directors‟
Report on pages 65 to 85 and are designated as audited.
Group Bank
2009 2008 2009 2008
Key Management Personnel Compensation $M $M $M $M
Short Term Benefits 34 28 34 28
Post-employment Benefits 2 1 2 1
Share-based Payments 20 9 20 9
Termination benefits - 1 - 1
Long term benefits 3 - 3 -
59 39 59 39

Notes to the Financial Statements
Commonwealth Bank of Australia Financial Report (U.S. Version) 2009 155
Note 46 Related Party Disclosures
The Group is controlled by the Commonwealth Bank of Australia, the ultimate parent, which is incorporated in Australia.
A number of banking transactions are entered into with related parties in the normal course of business.
These include loans, deposits and foreign currency transactions, upon which some fees and commissions may be earned. The
table below indicates the values of such transactions for the financial year ended 30 June 2009.
For the Year Ended and as at 30 June 2009
Joint
Associates Ventures Total
Group $M $M $M
Interest and dividend income 68 7 75
Interest expense 3 - 3
Fees and commissions for services provided 117 15 132
Fees and commissions for services received 189 - 189
Loans, bills discounted and equity contributions 373 28 401
Other assets 91 10 101
Deposits 74 - 74
Derivative liabilities 4 - 4
Other liabilities - 7 7
For the Year Ended and as at 30 June 2008
Joint
Associates Ventures Total
Group $M $M $M
Interest and dividend income 86 6 92
Interest expense 3 - 3
Fees and commissions for services provided 87 10 97
Fees and commissions for services received 74 - 74
Loans, bills discounted and equity contributions 111 387 498
Other assets 31 8 39
Deposits 31 - 31
Derivative liabilities 283 - 283
Other liabilities 1 6 7

Notes to the Financial Statements
156 Commonwealth Bank of Australia Financial Report (U.S. Version) 2009
Note 46 Related Party Disclosures (continued)
For the Year Ended and as at 30 June 2009
Joint
Subsidiaries Associates Ventures Total
Bank $M $M $M $M
Interest and dividend income 4,075 62 6 4,143
Interest expense 3,627 2 - 3,629
Fees and commissions for services provided 601 - 12 613
Fees and commissions for services received 359 188 - 547
Available-for-sale securities 39,832 - - 39,832
Loans, bills discounted and equity contributions 54,808 372 - 55,180
Derivative assets 188 - - 188
Other assets 459 24 9 492
Deposits 82,008 65 - 82,073
Derivative liabilities 202 4 - 206
Debt issues and loan capital 3,006 - - 3,006
Other liabilities 2,287 - 4 2,291
For the Year Ended and as at 30 June 2008
Joint
Subsidiaries Associates Ventures Total
Bank $M $M $M $M
Interest and dividend income 3,110 76 6 3,192
Interest expense 2,974 2 - 2,976
Fees and commissions for services provided 755 5 9 769
Fees and commissions for services received 333 72 - 405
Available-for-sale securities 16,380 - - 16,380
Loans, bills discounted and equity contributions 37,472 110 380 37,962
Derivative assets 1,724 - - 1,724
Other assets 1,884 - 8 1,892
Deposits 54,711 31 - 54,742
Derivative liabilities 528 283 - 811
Debt issues and loan capital 3,501 - - 3,501
Other liabilities 1,221 1 6 1,228
Details of controlled entities are disclosed in Note 43.
The Bank‟s aggregate investment in and loans to controlled entities are disclosed in Note 17.
Amounts due to controlled entities are disclosed in the Balance Sheet of the Bank.
Details of amounts paid to or received from related parties, in the form of dividends or interest, are set out in Note 2.
All transactions between Group entities are eliminated on consolidation.
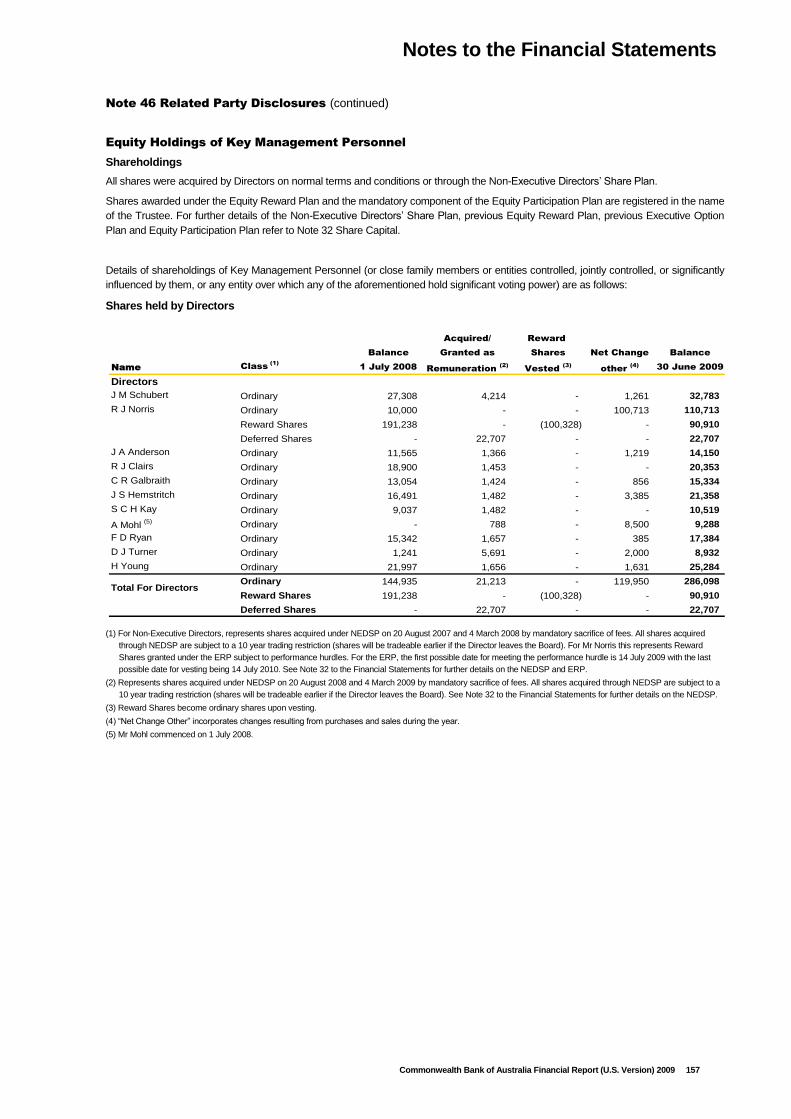
Notes to the Financial Statements
Commonwealth Bank of Australia Financial Report (U.S. Version) 2009 157
Note 46 Related Party Disclosures (continued)
Equity Holdings of Key Management Personnel
Shareholdings
All shares were acquired by Directors on normal terms and conditions or through the Non-Executive Directors‟ Share Plan.
Shares awarded under the Equity Reward Plan and the mandatory component of the Equity Participation Plan are registered in the name
of the Trustee. For further details of the Non-Executive Directors‟ Share Plan, previous Equity Reward Plan, previous Executive Option
Plan and Equity Participation Plan refer to Note 32 Share Capital.
Details of shareholdings of Key Management Personnel (or close family members or entities controlled, jointly controlled, or significantly
influenced by them, or any entity over which any of the aforementioned hold significant voting power) are as follows:
Shares held by Directors
Acquired/ Reward
Balance Granted as Shares Net Change Balance
Name Class (1)
1 July 2008 Remuneration (2)
Vested (3)
other (4)
30 June 2009
Directors
J M Schubert Ordinary 27,308 4,214 - 1,261 32,783
R J Norris Ordinary 10,000 - - 100,713 110,713
Reward Shares 191,238 - (100,328) - 90,910
Deferred Shares - 22,707 - - 22,707
J A Anderson Ordinary 11,565 1,366 - 1,219 14,150
R J Clairs Ordinary 18,900 1,453 - - 20,353
C R Galbraith Ordinary 13,054 1,424 - 856 15,334
J S Hemstritch Ordinary 16,491 1,482 - 3,385 21,358
S C H Kay Ordinary 9,037 1,482 - - 10,519
A Mohl (5) Ordinary - 788 - 8,500 9,288
F D Ryan Ordinary 15,342 1,657 - 385 17,384
D J Turner Ordinary 1,241 5,691 - 2,000 8,932
H Young Ordinary 21,997 1,656 - 1,631 25,284
Ordinary 144,935 21,213 - 119,950 286,098
Reward Shares 191,238 - (100,328) - 90,910
Deferred Shares - 22,707 - - 22,707
Total For Directors
(1) For Non-Executive Directors, represents shares acquired under NEDSP on 20 August 2007 and 4 March 2008 by mandatory sacrifice of fees. All shares acquired
through NEDSP are subject to a 10 year trading restriction (shares will be tradeable earlier if the Director leaves the Board). For Mr Norris this represents Reward
Shares granted under the ERP subject to performance hurdles. For the ERP, the first possible date for meeting the performance hurdle is 14 July 2009 with the last
possible date for vesting being 14 July 2010. See Note 32 to the Financial Statements for further details on the NEDSP and ERP.
(2) Represents shares acquired under NEDSP on 20 August 2008 and 4 March 2009 by mandatory sacrifice of fees. All shares acquired through NEDSP are subject to a
10 year trading restriction (shares will be tradeable earlier if the Director leaves the Board). See Note 32 to the Financial Statements for further details on the NEDSP.
(3) Reward Shares become ordinary shares upon vesting.
(4) “Net Change Other” incorporates changes resulting from purchases and sales during the year.
(5) Mr Mohl commenced on 1 July 2008.
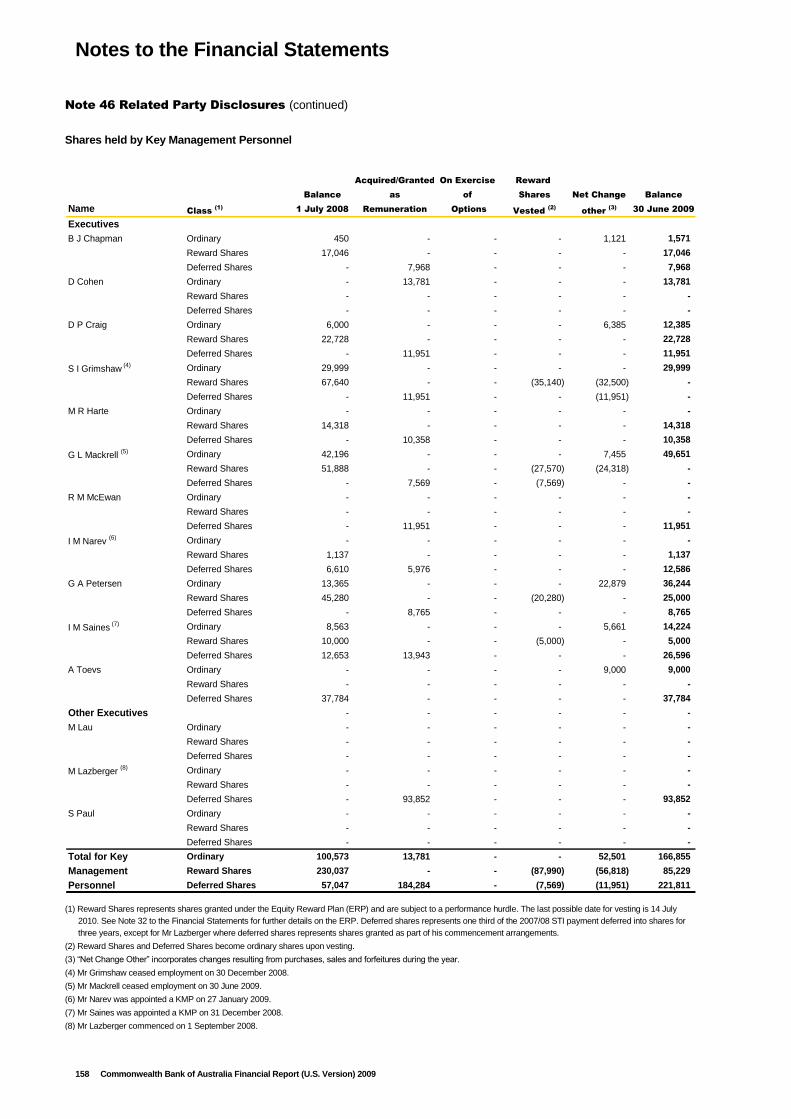
Notes to the Financial Statements
158 Commonwealth Bank of Australia Financial Report (U.S. Version) 2009
Note 46 Related Party Disclosures (continued)
Shares held by Key Management Personnel
Acquired/Granted On Exercise Reward
Balance as of Shares Net Change Balance
Name Class (1)
1 July 2008 Remuneration Options Vested (2)
other (3)
30 June 2009
Executives
B J Chapman Ordinary 450 - - - 1,121 1,571
Reward Shares 17,046 - - - - 17,046
Deferred Shares - 7,968 - - - 7,968
D Cohen Ordinary - 13,781 - - - 13,781
Reward Shares - - - - - -
Deferred Shares - - - - - -
D P Craig Ordinary 6,000 - - - 6,385 12,385
Reward Shares 22,728 - - - - 22,728
Deferred Shares - 11,951 - - - 11,951
S I Grimshaw (4) Ordinary 29,999 - - - - 29,999
Reward Shares 67,640 - - (35,140) (32,500) -
Deferred Shares - 11,951 - - (11,951) -
M R Harte Ordinary - - - - - -
Reward Shares 14,318 - - - - 14,318
Deferred Shares - 10,358 - - - 10,358
G L Mackrell (5) Ordinary 42,196 - - - 7,455 49,651
Reward Shares 51,888 - - (27,570) (24,318) -
Deferred Shares - 7,569 - (7,569) - -
R M McEwan Ordinary - - - - - -
Reward Shares - - - - - -
Deferred Shares - 11,951 - - - 11,951
I M Narev (6) Ordinary - - - - - -
Reward Shares 1,137 - - - - 1,137
Deferred Shares 6,610 5,976 - - - 12,586
G A Petersen Ordinary 13,365 - - - 22,879 36,244
Reward Shares 45,280 - - (20,280) - 25,000
Deferred Shares - 8,765 - - - 8,765
I M Saines (7) Ordinary 8,563 - - - 5,661 14,224
Reward Shares 10,000 - - (5,000) - 5,000
Deferred Shares 12,653 13,943 - - - 26,596
A Toevs Ordinary - - - - 9,000 9,000
Reward Shares - - - - - -
Deferred Shares 37,784 - - - - 37,784
Other Executives - - - - - -
M Lau Ordinary - - - - - -
Reward Shares - - - - - -
Deferred Shares - - - - - -
M Lazberger (8) Ordinary - - - - - -
Reward Shares - - - - - -
Deferred Shares - 93,852 - - - 93,852
S Paul Ordinary - - - - - -
Reward Shares - - - - - -
Deferred Shares - - - - - -
Total for Key Ordinary 100,573 13,781 - - 52,501 166,855
Management Reward Shares 230,037 - - (87,990) (56,818) 85,229
Personnel Deferred Shares 57,047 184,284 - (7,569) (11,951) 221,811
(1) Reward Shares represents shares granted under the Equity Reward Plan (ERP) and are subject to a performance hurdle. The last possible date for vesting is 14 July
2010. See Note 32 to the Financial Statements for further details on the ERP. Deferred shares represents one third of the 2007/08 STI payment deferred into shares for
three years, except for Mr Lazberger where deferred shares represents shares granted as part of his commencement arrangements.
(2) Reward Shares and Deferred Shares become ordinary shares upon vesting.
(3) “Net Change Other” incorporates changes resulting from purchases, sales and forfeitures during the year.
(4) Mr Grimshaw ceased employment on 30 December 2008.
(5) Mr Mackrell ceased employment on 30 June 2009.
(6) Mr Narev was appointed a KMP on 27 January 2009.
(7) Mr Saines was appointed a KMP on 31 December 2008.
(8) Mr Lazberger commenced on 1 September 2008.

Notes to the Financial Statements
Commonwealth Bank of Australia Financial Report (U.S. Version) 2009 159
Note 46 Related Party Disclosures (continued)
Loans to Key Management Personnel
All loans to Key Management Personnel (or close family members or entities controlled, jointly controlled or significantly influenced by them
or any entity over which any of the aforementioned hold significant voting power) have been provided on an arms-length commercial basis
including the term of the loan, security required and the interest rate (which may be fixed or variable).
Total Loans to Key Management Personnel
Year Ended Balance Interest Interest Not Write-off Balance Number in
30 June 1 July Charged Charged 30 June Group at
$000s $000s $000s $000s $000s 30 June
Directors
2009 2,840 211 - - 1,991 1
2008 3,648 258 - - 2,795 1
Executives
2009 11,359 667 - - 8,462 10
2008 6,103 781 - - 12,369 9
Total for key
Management 2009 14,199 878 - - 10,453 11
Personnel 2008 9,751 1,039 - - 15,164 10
Other Executives
2009 - - - - - -
2008 1,442 68 - - 1,335 1
Total
2009 14,199 878 - - 10,453 11
2008 11,193 1,107 - - 16,499 11
Individual Loans above $100,000 to Key Management Personnel
Highest
Balance Interest Interest Not Write-off Balance Balance
1 July 2008 Charged Charged 30 June 2009 in Period
$000s $000s $000s $000s $000s $000s
Directors
R J Norris (1) 2,840 211 - - 1,991 2,771
Executives
B J Chapman 2,667 148 - - 2,230 2,726
D Cohen 941 59 - - 601 941
D P Craig 233 16 - - 11 228
M R Harte 3,394 217 - - 3,024 3,442
G L Mackrell 647 8 - - - 805
R M McEwan (1) 977 125 - - 1,560 2,967
I M Narev 754 40 - - 472 754
G A Petersen 976 15 - - 2 930
I M Saines 721 39 - - 562 1,201
Total for Key
Management Personnel 14,150 878 - - 10,453 16,765
Other Executives
Total for Other Executives - - - - - -
Total for Key Management
Personnel & Other Executives 14,150 878 - - 10,453 16,765
(1) Balance declared in NZD for Mr Norris, Ms Chapman and Mr McEwan. Exchange rates are taken from Forex as at 30 June 2009 for interest charged, 30 June 2009
balances and highest balance in period. The exchange rate as at 30 June 2008 has been used for the 1 July 2008 balances. Highest in period appears lower than
opening balance due to the application of exchange rates.

Notes to the Financial Statements
160 Commonwealth Bank of Australia Financial Report (U.S. Version) 2009
Note 47 Notes to the Statements of Cash Flows
Note 47(a) Reconciliation of Net Profit after Income Tax to Net Cash provided by/(used in) Operating Activities
Year Ended 30 June
Group Bank
2009 2008 2007 2009 2008
$M $M $M $M $M
Net profit after income tax 4,753 4,822 4,497 3,086 4,358
Net decrease/(increase) in interest receivable 301 187 (745) 516 (174)
(Decrease)/increase in interest payable (54) 449 362 (587) 451
Net decrease/(increase) in assets at fair value through Income Statement
(excluding life insurance) 690 196 (7,272) 568 1,324
Net (gain)/loss on sale of investments (1) (1) - (1) 1
Net (increase) in derivative assets (7,789) (5,459) (3,068) (6,279) (5,654)
Net loss on sale of property, plant and equipment 11 15 16 9 14
Net (gain) on sale of Visa Initial Public Offering - (127) - - (111)
Equity accounting profit (141) (92) (34) - -
Gain on acquisition of controlled entities (983) - - - -
Impairment expense 3,048 930 434 2,703 902
Investment impairment expense - - - 110 -
Depreciation and amortisation (including asset write downs) 519 423 270 306 330
Increase/(decrease) in liabilities at fair value through Income Statement
(excluding life insurance) 661 (884) 5,799 405 (2,286)
Increase in derivative liabilities 13,361 4,622 5,860 10,700 4,149
Increase in other provisions 60 296 57 6 250
Increase/(decrease) in income taxes payable 521 29 297 440 (111)
(Decrease)/increase in deferred income taxes payable (355) (643) 175 21 (72)
(Increase)/decrease in deferred tax assets (967) 178 (272) (1,255) (97)
Decrease/(increase) in accrued fees/reimbursements receivable 41 (153) (163) 173 193
Increase/(decrease) in accrued fees and other items payable 178 (575) 386 575 (1,011)
(Decrease)/increase in life insurance contract policy liabilities (1,025) 184 (1,460) - (10)
(Decrease)/increase in cash flow hedge reserve (1,651) (150) 547 (1,068) 106
Dividend received from controlled entities - - - (820) (1,636)
Changes in operating assets and liabilities arising from cash flow
movements (9,802) (6,124) (560) (19,446) (11,062)
Other 100 (198) 515 33 (149)
Net cash provided/(used in) by operating activities 1,476 (2,075) 5,641 (9,805) (10,295)
Note 47(b) Reconciliation of Cash
For the purposes of the Statements of Cash Flows, cash includes cash, money at short call, at call deposits with other financial
institutions and settlement account balances with other banks.
Year Ended 30 June
Group Bank
2009 2008 2007 2009 2008
$M $M $M $M $M
Notes, coins and cash at banks 3,755 2,476 4,557 2,198 1,344
Other short term liquid assets 3,128 1,309 967 3,031 1,118
Receivables due from other financial institutions – at call (1) 1,889 3,357 4,607 5,962 2,672
Payables due to other financial institutions – at call (1) (6,586) (4,877) (6,047) (7,755) (4,797)
Cash and cash equivalents at end of year 2,186 2,265 4,084 3,436 337
(1) At call includes certain receivables and payables due from and to financial institutions within three months.
Note 47(c) Disposal of Controlled Entities
Group
2009 2008 2007
$M $M $M
Fair value of net tangible assets disposed
Other assets - 1 -
Profit on sale - 1 -
Cash consideration received - 2 -
Less cash and cash equivalents disposed - - -
Net cash inflow on disposal - 2 -

Notes to the Financial Statements
Commonwealth Bank of Australia Financial Report (U.S. Version) 2009 161
Note 47 Notes to the Statements of Cash Flows (continued)
Note 47(d) Non-cash Financing and Investing Activities
Group
2009 2008 2007
$M $M $M
Shares issued under the Dividend Reinvestment Plan 1,099 1,109 818
Note 47(e) Controlled Entities
On 19 December 2008, the Group acquired 100% of the share capital of Bank of Western Australia Ltd (consisting of retail and business
banking), St Andrew's Australia Pty Ltd (consisting of insurance and wealth management services businesses) and HBOSA Group
(Services) Pty Ltd (an internal administrative support entity) for cash consideration (including transaction costs) of $2.2 billion. These
businesses collectively represent the retail and business operations of HBOSA.
During the 2008 financial year, on 26 July 2007, PT Commonwealth Bank acquired 83% of Arta Niaga Kencana (ANK) Bank in Indonesia.
The merger was completed on 31 December 2007 and thereafter the Group owned 97% of the merged entities. On 27 November 2007, the
Group completed the 100% acquisition of IWL Limited, an online broking business. These acquisitions were considered individually
immaterial to the group.
The assets and liabilities arising from the acquisitions, are as follows:
Carrying value Fair Value Carrying value Fair Value Carrying value Fair Value
2009 2009 2008 2008 2007 2007
$M $M $M $M $M $M
Assets acquired
Cash and liquid assets 422 422 24 24 - -
Receivables due from other financial institutions 283 283 - - - -
Assets at fair value through Income Statement:
Trading 5,907 5,907 - - - -
Insurance 212 212 - - 4 4
Derivative assets 1,014 1,014 - - - -
Available-for-sale investments 3 3 112 112 - -
Loans, bills discounted and other receivables 58,153 57,351 241 241 - -
Property, plant and equipment 177 225 - - - -
Intangible assets 98 806 4 64 - -
Deferred tax assets 255 610 - - - -
Other assets 289 288 11 11 - -
Total assets 66,813 67,121 392 452 4 4
Liabilities acquired
Deposits and other public borrowings 50,401 50,677 202 202 - -
Payables due to other financial institutions 4,673 4,673 130 130 - -
Liabilities at fair value through Income Statement 250 250 - - - -
Derivative liabilities 512 512 - - - -
Deferred tax liabilities 54 258 - - - -
Other provisions 84 84 - - - -
Insurance policy liabilities 202 202 - - - -
Debt issues 5,221 5,221 - - - -
Bills payable and other liabilities 357 357 11 30 - -
Loan capital 1,211 1,211 - - - -
Total liabilities 62,965 63,445 343 362 - -
Net assets 3,848 3,676 49 90 4 4
Preference share placement - (530) - - - -
Goodwill - - 50 316 - 3
Gain on acquisition - (983) - - - -
Provision for remaining consideration - - - - - -
Cash consideration paid (including
transaction costs) - 2,163 - 406 - 7
Less: Cash and cash equivalents acquired - 422 - 24 - -
Net consideration paid- 1,741 - 382 - 7
Less: Non-cash consideration - - - 141 - -
Net cash outflow on acquisition - 1,741 - 241 - 7
As at time of acquisition

Notes to the Financial Statements
162 Commonwealth Bank of Australia Financial Report (U.S. Version) 2009
Note 47 Notes to the Statements of Cash Flows (continued)
2009 2008 2007
Details of equity instruments issued as part of business combinations
Number of equity instruments issued - 2,327,431 -
Fair value of equity issued ($) - 140,952,360 -
The gain on acquisition has arisen after the Group‟s reassessment of the fair value of the acquired entities‟ identifiable assets, liabilities
and contingent liabilities and the cost of the acquisition, and has been recognised in the Group‟s statutory net profit in the current
period.
Note 47(f) Financing Facilities
Standby funding lines are considered immaterial.
Note 48 Disclosures about Fair Value of Financial Instruments
48(a) Fair Value of Financial Assets and Financial
Liabilities
These amounts represent estimates of the fair values of the
Group‟s financial assets and financial liabilities at Balance Sheet
date based on the following valuation methods and assumptions.
Fair value is the amount for which an asset could be exchanged,
or a liability settled, between knowledgeable, willing parties in an
arm‟s length transaction. Quoted market prices are used to
determine fair value where an active market (such as a
recognised stock exchange) exists, as it is the best evidence of
the fair value of a financial instrument (level one). Quoted market
prices are not, however, available for a significant number of the
financial assets and liabilities held and issued by the Group.
Therefore, for financial instruments where no quoted market price
is available, the fair values presented in the following tables have
been estimated using present value or other valuation techniques
based on market conditions existing at Balance Sheet dates.
These valuation techniques rely on market observable inputs
wherever possible (level two), or in a limited number of instances,
rely on inputs which are reasonable assumptions based on
market conditions at balance date (level three).
While the fair value amounts are designed to represent estimates
at which these instruments could be exchanged in a current
transaction between willing parties, many of the Group‟s financial
instruments lack an available trading market as characterised by
willing parties engaging in an exchange transaction.
In addition, it is the Bank‟s intent to hold most of its financial
instruments to maturity and therefore it is not probable that the
fair values shown would be realised in a current transaction.
The estimated fair values disclosed do not reflect the value of
assets and liabilities that are not considered financial
instruments. In addition, the value of long term relationships with
depositors (core deposit intangibles) and other customers (credit
card intangibles) are not reflected. The value of these items is
considered significant.
Because of the wide range of valuation techniques and the
numerous estimates that must be made, it may be difficult to
make reasonable comparisons of the Bank‟s fair value
information with that of other financial institutions. It is important
that the many uncertainties discussed above be considered
when using the estimated fair value disclosures and to realise
that because of these uncertainties, the aggregate fair value
amount should in no way be construed as representative of the
underlying value of the Commonwealth Bank of Australia.

Notes to the Financial Statements
Commonwealth Bank of Australia Financial Report (U.S. Version) 2009 163
Note 48 Disclosures about Fair Value of Financial Instruments (continued)
48(a) Fair Value of Financial Assets and Financial Liabilities (continued)
Group
2009 2008
Carrying Fair Carrying Fair
Value Value Value Value
$M $M $M $M
Assets
Cash and liquid assets 11,340 11,340 7,736 7,736
Receivables due from other financial institutions 14,421 14,421 6,984 6,984
Assets at fair value through Income Statement:
Trading 25,401 25,401 21,676 21,676
Insurance 17,260 17,260 20,650 20,650
Other 1,677 1,677 3,266 3,266
Derivative assets 26,358 26,358 18,232 18,232
Available-for-sale investments 21,504 21,504 11,488 11,488
Loans, bills discounted and other receivables 466,631 467,774 361,282 357,618
Bank acceptances of customers 14,728 14,728 18,278 18,278
Other assets 5,895 5,895 6,694 6,694
Liabilities
Deposits and other public borrowings 368,721 368,668 263,706 262,832
Payables due to other financial institutions 15,109 15,109 17,672 17,672
Liabilities at fair value through Income Statement 16,596 16,596 15,526 15,526
Derivative liabilities 32,134 32,134 19,541 19,541
Bank acceptances 14,728 14,728 18,278 18,278
Insurance policy liabilities 16,056 16,056 18,495 18,495
Debt issues 101,819 102,231 85,817 84,979
Managed funds units on issue 914 914 1,109 1,109
Bills payable and other liabilities 6,046 6,046 5,724 5,724
Loan capital 12,039 11,900 11,559 11,724
Bank
2009 2008
Carrying Fair Carrying Fair
Value Value Value Value
$M $M $M $M
Assets
Cash and liquid assets 9,684 9,684 7,282 7,282
Receivables due from other financial institutions 13,986 13,986 6,731 6,731
Assets at fair value through Income Statement:
Trading 20,988 20,988 19,168 19,168
Other 60 60 274 274
Derivative assets 25,536 25,536 19,287 19,287
Available-for-sale investments 60,659 60,659 27,067 27,067
Loans, bills discounted and other receivables 353,408 354,061 309,714 306,655
Bank acceptances of customers 14,726 14,726 18,278 18,278
Loans to controlled entities 33,352 33,394 13,796 13,833
Other assets 4,090 4,090 5,473 5,473
Liabilities
Deposits and other public borrowings 305,170 304,886 240,871 239,996
Payables due to other financial institutions 14,942 14,942 17,625 17,625
Liabilities at fair value through Income Statement 3,485 3,485 2,930 2,930
Derivative liabilities 29,442 29,442 19,367 19,367
Bank acceptances 14,726 14,726 18,278 18,278
Due to controlled entities 81,084 80,646 54,119 54,171
Debt issues 62,894 63,675 55,778 54,802
Bills payable and other liabilities 3,947 3,947 4,121 4,121
Loan capital 12,174 11,626 11,620 11,822

Notes to the Financial Statements
164 Commonwealth Bank of Australia Financial Report (U.S. Version) 2009
Note 48 Disclosures about Fair Value of Financial Instruments (continued)
48(a) Fair Value of Financial Assets and Financial Liabilities (continued)
Level 1 Level 2 Level 3 Total
Group $M $M $M $M
Assets
Assets at fair value through Income Statement:
Trading 3,720 21,564 117 25,401
Insurance 16,164 1,096 - 17,260
Other - 1,677 - 1,677
Derivative assets 44 26,313 1 26,358
Available-for-sale investments 775 20,728 1 21,504
Total assets 20,703 71,378 119 92,200
Liabilities
Liabilities at fair value through Income Statement 1,048 15,548 - 16,596
Derivative liabilities 26 32,101 7 32,134
Life investment contracts 12,328 - - 12,328
Total liabilities 13,402 47,649 7 61,058
Fair Value at 30 June 2009
Level 1 Level 2 Level 3 Total
Bank $M $M $M $M
Assets
Assets at fair value through Income Statement:
Trading 1,830 19,150 8 20,988
Other - 60 - 60
Derivative assets 43 25,492 1 25,536
Available-for-sale investments 274 60,385 - 60,659
Total assets 2,147 105,087 9 107,243
Liabilities
Liabilities at fair value through Income Statement 1,048 2,437 - 3,485
Derivative liabilities 25 29,410 7 29,442
Total liabilities 1,073 31,847 7 32,927
Fair Value at 30 June 2009
The fair value estimates were determined by the following
methodologies and assumptions:
Liquid assets and Bank acceptances of customers
The carrying values of cash and liquid assets, receivables from
other financial institutions and bank acceptances of customers
approximate their fair value as they are short term in nature or
are receivable on demand.
Receivables due from other financial institutions also includes
statutory deposits with central banks. The fair value is assumed
to be equal to the carrying value as the Group is only able to
continue as a going concern with the maintenance of these
deposits.
Assets at Fair Value through Income Statement
Assets at fair value through Income Statement are carried at fair
value determined using quoted market prices or valuation
techniques including discounted cash flow models using market
observable and non-market observable inputs. Discount rates
have been adjusted for changes in customer credit ratings,
where appropriate.
Available-for-sale investments
Assets available-for-sale are measured at fair value determined
using quoted market prices. For shares in companies, the
estimated fair values are estimated based on market price
inputs.
Loans, bills discounted and other receivables
The carrying value of loans, bills discounted and other
receivables is net of accumulated collective and individually
assessed provisions for impairment. Customers credit
worthiness is regularly reviewed in line with the Group‟s credit
policies and where necessary, pricing is adjusted in
accordance with individual credit contracts.
For variable rate loans, excluding impaired loans, the carrying
amount is a reasonable estimate of fair value. The fair value for
fixed rate loans was calculated by utilising discounted cash flow
models (i.e. the net present value of the portfolio future
principal and interest cash flows), based on the maturity of the
loans. The discount rates applied were based on the current
benchmark rate offered for the average remaining term of the
portfolio plus an add-on of the average credit margin of the
existing portfolio, adjusted for changes in customer credit
ratings, where appropriate.
The fair value of impaired loans was calculated by discounting
estimated future cash flows using the loan‟s original effective
interest rate.

Notes to the Financial Statements
Commonwealth Bank of Australia Financial Report (U.S. Version) 2009 165
Note 48 Disclosures about Fair Value of Financial Instruments (continued)
48(a) Fair Value of Financial Assets and Financial
Liabilities (continued)
Retirement benefit surplus
The fair value of the retirement benefit surplus is the carrying
value at Balance Sheet date determined using a present value
calculation based on assumptions that are outlined in Note 42.
All other financial assets
Included in this category are interest and fees receivable,
unrealised income, and investments in associates of $1,047
million (2008: $906 million), where the carrying amount is
considered to be a reasonable estimate of fair value. Other
financial assets are net of goodwill and other intangibles, future
income tax benefits and prepayments/unamortised payments,
as these do not constitute financial instruments.
Deposits and other public borrowings
The carrying value of non-interest bearing, call and variable rate
deposits, and fixed rate deposits repricing within six months,
approximate their value as they are short term in nature or are
payable on demand. Discounted cash flow models based upon
deposit type and related maturity, were used to calculate the fair
value of other term deposits.
Short term liabilities
The carrying value of payables to other financial institutions and
bank acceptances approximate their fair value as they are short
term in nature and reprice frequently.
Debt issues and loan capital
The fair values of debt issues and loan capital were calculated
using quoted market prices at Balance Sheet date. For those
debt issues where quoted market prices were not available,
discounted cash flow and option pricing models were used,
utilising a yield curve appropriate to the expected remaining
maturity of the instrument and adjusted for any change in the
Group‟s applicable credit rating.
Liabilities at Fair Value through Income Statement
Liabilities at Fair Value through Income Statement are carried at
fair value determined using quoted market prices, or valuation
techniques including discounted cash flow models using market
observable inputs. Discount rates have been adjusted for any
changes in the Group‟s applicable credit rating.
Derivative Assets and Liabilities
The fair value of trading and hedging derivative contracts, were
obtained from quoted market prices, discounted cash flow
models or option pricing models that used market based and
non-market based inputs.
The fair value of these instruments is disclosed in Note 11.
Life Insurance Policy Holder Liabilities
Life insurance policyholder liabilities are measured on a net
present value basis using assumptions outlined in Note 36. This
treatment is in accordance with AASB 1038: Life Insurance
Business.
All other financial liabilities
This category includes interest payable and unrealised
expenses payable for which the carrying amount is considered
to be a reasonable estimate of net fair value. For liabilities that
are long term, fair values have been estimated using the rates
currently offered for similar liabilities with remaining maturities.
Other provisions including provision for dividend, income tax
liability and unamortised receipts are not considered financial
instruments.
Commitments to extend credit, letters of credit,
guarantees, warranties and indemnities issued
The fair value of these items was not calculated as estimated
fair values are not readily ascertainable. These financial
instruments generally relate to credit risk and attract fees in line
with market prices for similar arrangements. They are not
presently sold or traded. The items generally do not involve
cash payments other than in the event of default. The fee
pricing is set as part of the broader customer credit process and
reflects the probability of default. The fair value may be
represented by the present value of fees expected to be
received, less associated costs, however the overall level of
fees involved is not material.
48(b) The Impact of Fair Values Calculated Using Non-
market Observable Assumptions
The Group‟s exposure to financial instruments measured at fair
value based in full or in part on non-market observable inputs is
restricted to a small number of financial instruments which
comprise an insignificant component of the portfolios to which
they belong, such that any change in the assumptions used to
value the instruments to a reasonably possible alternative do
not have a material effect on the portfolio balance, the Group‟s
or the Bank‟s results.

Notes to the Financial Statements
166 Commonwealth Bank of Australia Financial Report (U.S. Version) 2009
Note 49 Acquisition of Controlled Entities
On 19 December 2008, the Group acquired 100% of the share capital of Bank of Western Australia Ltd (consisting of retail and
business banking), St Andrew's Australia Pty Ltd (consisting of insurance and wealth management services businesses) and
HBOSA Group (Services) Pty Ltd (an internal administrative support entity) for cash consideration (including transaction costs) of
$2.2 billion. These businesses collectively represent the retail and business operations in HBOSA.
Details of the purchase consideration and the gain arising on acquisition are as follows:
Purchase consideration $M
Cash paid 2,126
Direct costs relating to the acquisition 37
Total purchase consideration 2,163
Fair value of net identifiable assets acquired (see below) 3,676
Less: Preference share placement (530)
Gain on acquisition before tax 983
The gain on acquisition has arisen after the Group‟s reassessment of the fair value of the acquired entities‟ identifiable assets,
liabilities and contingent liabilities and the cost of the acquisition, and has been recognised in the Group‟s statutory net profit in the
current period.
The assets and liabilities arising from the acquisition, reported in aggregate for the acquired entities, are as follows:
Pre-acquisition carrying Recognised values on
amount acquisition
$M $M
Cash and liquid assets 422 422
Receivables due from other financial institutions 283 283
Assets at fair value through Income Statement:
Trading 5,907 5,907
Insurance 212 212
Derivative assets 1,014 1,014
Available-for-sale investments 3 3
Loans, bills discounted and other receivables 58,153 57,351
Property, plant and equipment 177 225
Intangible assets 98 806
Deferred tax assets 255 610
Other assets 289 288
Total assets 66,813 67,121
Deposits and other public borrowings 50,401 50,677
Payables due to other financial institutions 4,673 4,673
Liabilities at fair value through Income Statement 250 250
Derivative liabilities 512 512
Deferred tax liabilities 54 258
Other provisions 84 84
Insurance policy liabilities 202 202
Debt issues 5,221 5,221
Bills payable and other liabilities 357 357
Loan capital 1,211 1,211
Total liabilities 62,965 63,445
Net assets 3,848 3,676
Outflow of cash to to acquire business, net of cash acquired:
Cash consideration n/a 2,126
Direct costs relating to acquisition n/a 37
Cash and cash equivalents in subsidiaries acquired n/a (422)
Cash outflow on acquisition n/a 1,741
During the period 19 December 2008 to 30 June 2009, these operations contributed $113 million to the consolidated net profit after
tax (“cash basis”) and a net profit after tax of $42 million to the consolidated statutory net profit after tax for the year.
If the acquisition had occurred on 1 July 2008 the contribution to the Group‟s revenue would have been $1,561 million for the year
and contribution to the Group‟s net profit after tax would have been a net loss after tax of $184 million for the year ended 30 June
2009. This pro-forma financial information uses data for the twelve month period ended 30 June 2009 and represents the historical
operating results reported in accordance with the Group‟s accounting policies.

Directors’ Declaration
Commonwealth Bank of Australia Financial Report (U.S. Version) 2009 167
In accordance with a resolution of the Directors of the Commonwealth Bank of Australia the Directors declare that:
(a) the Financial Statements and notes thereto of the Bank and the Group, and the additional disclosures included in the Directors‟
Report designated as audited, comply with Accounting Standards and in their opinion are in accordance with the Corporations Act
2001;
(b) the Financial Statements and notes thereto give a true and fair view of the Bank‟s and the Group‟s financial position as at 30 June
2009 and of their performance for the year ended on that date;
(c) in the opinion of the Directors, there are reasonable grounds to believe that the Bank will be able to pay its debts as and when they
become due and payable; and
(d) the Directors have been given the declarations required under Section 295A of the Corporations Act 2001 for the financial year
ended 30 June 2009.
Signed in accordance with a resolution of the Directors.
J M Schubert
Chairman
12 August 2009
R J Norris
Managing Director and Chief Executive Officer
12 August 2009

168 Commonwealth Bank of Australia Financial Report (U.S. Version) 2009
Independent auditor’s report to the members of Commonwealth Bank of Australia
Report on the financial report
We have audited the accompanying financial report of Commonwealth Bank of Australia (the company), which comprises the balance
sheet as at 30 June 2009, and the income statement, statement of recognised income and expense and cash flow statement for the
year ended on that date, a summary of significant accounting policies, other explanatory notes and the directors‟ declaration for both
Commonwealth Bank of Australia and the Group. The consolidated entity comprises the Commonwealth Bank of Australia and the
entities it controlled at the year's end or from time to time during the financial year.
Directors’ responsibility for the financial report
The directors of the company are responsible for the preparation and fair presentation of the financial report in accordance with
Australian Accounting Standards (including the Australian Accounting Interpretations) and the Corporations Act 2001. This responsibility
includes establishing and maintaining internal controls relevant to the preparation and fair presentation of the financial report that is free
from material misstatement, whether due to fraud or error; selecting and applying appropriate accounting policies; and making
accounting estimates that are reasonable in the circumstances. In Note 1 (a), the directors also state, in accordance with Accounting
Standard AASB 101 Presentation of Financial Statements, that compliance with the Australian equivalents to International Financial
Reporting Standards ensures that the financial report, comprising the financial statements and notes, complies with International
Financial Reporting Standards.
Auditor’s responsibility
Our responsibility is to express an opinion on the financial report based on our audit. We conducted our audit in accordance with
Australian Auditing Standards. These Auditing Standards require that we comply with relevant ethical requirements relating to audit
engagements and plan and perform the audit to obtain reasonable assurance whether the financial report is free from material
misstatement.
An audit involves performing procedures to obtain audit evidence about the amounts and disclosures in the financial report. The
procedures selected depend on the auditor‟s judgement, including the assessment of the risks of material misstatement of the financial
report, whether due to fraud or error. In making those risk assessments, the auditor considers internal control relevant to the entity‟s
preparation and fair presentation of the financial report in order to design audit procedures that are appropriate in the circumstances, but
not for the purpose of expressing an opinion on the effectiveness of the entity‟s internal control. An audit also includes evaluating the
appropriateness of accounting policies used and the reasonableness of accounting estimates made by the directors, as well as
evaluating the overall presentation of the financial report.
Our procedures include reading the other information in the Annual Report to determine whether it contains any material inconsistencies
with the financial report.
For further explanation of an audit, visit our website http://www.pwc.com/au/financialstatementaudit.
Our audit did not involve an analysis of the prudence of business decisions made by directors or management.
We believe that the audit evidence we have obtained is sufficient and appropriate to provide a basis for our audit opinions.
Liability limited by a scheme approved under Professional Standards Legislation

Corporate Directory
Commonwealth Bank of Australia Financial Report (U.S. Version) 2009 169
Independent auditor’s report to the members of Commonwealth Bank of Australia (continued)
Independence
In conducting our audit, we have complied with the independence requirements of the Corporations Act 2001.
Auditor’s opinion
In our opinion:
(a) the financial report of Commonwealth Bank of Australia is in accordance with the Corporations Act 2001, including:
(i) giving a true and fair view of the company‟s and consolidated entity‟s financial position as at 30 June 2009 and of their
performance for the year ended on that date; and
(ii) complying with Australian Accounting Standards (including the Australian Accounting Interpretations) and the
Corporations Regulations 2001; and
(b) the financial report also complies with International Financial Reporting Standards as disclosed in Note 1 (a).
Report on the Remuneration Report
We have audited the Remuneration Report included in pages 65 to 85 of the directors‟ report for the year ended 30 June 2009. The
directors of the company are responsible for the preparation and presentation of the Remuneration Report in accordance with section
300A of the Corporations Act 2001. Our responsibility is to express an opinion on the Remuneration Report, based on our audit
conducted in accordance with Australian Auditing Standards.
Auditor’s opinion
In our opinion, the Remuneration Report of Commonwealth Bank of Australia for the year ended 30 June 2009, complies with section
300A of the Corporations Act 2001.
Matters relating to the electronic presentation of the audited financial report
This auditor‟s report relates to the financial report and remuneration report of Commonwealth Bank of Australia (the company) for the
year ended 30 June 2009 included on Commonwealth Bank of Australia web site. The company‟s directors are responsible for the
integrity of the Commonwealth Bank of Australia web site. We have not been engaged to report on the integrity of this web site. The
auditor‟s report refers only to the financial report and remuneration report named above. It does not provide an opinion on any other
information which may have been hyperlinked to/from these statements or the remuneration report. If users of this report are concerned
with the inherent risks arising from electronic data communications they are advised to refer to the hard copy of the audited financial
report and remuneration report to confirm the information included in the audited financial report and remuneration report presented on
this web site.
PricewaterhouseCoopers
Rahoul Chowdry
Partner
12 August 2009