financial report –fiscal year 2020 - capmetro
TRANSCRIPT

Financial Report – Fiscal Year 2020
Year to Date December 31, 2019
1

Major Highlights
2
Revenue• Sales tax remittances received YTD November 2019 are 7.6% higher than YTD November 2018
• Capital contributions and grants are below budget due to timing of processing eligible paid expenses
Operating Expenses• $66.1 million expended to date, or 23% of full year budget
• Professional services are below budget due to timing of consultation and other professional fee payments
Capital Projects• FY2020 capital project budget of $111.8 million
• $13.9 million expended to date, or 12.5% of full year budget
• Downtown Station, Positive Train Control, Bus Stop Enhancements and Track Undercutting
• $47.3 million outstanding commitments have been issued, or 42.3% of full year budget
• Positive Train Control, Downtown Station, 23 Transit Buses, 4 Battery Electric Buses, and Electric Bus Yard Paving
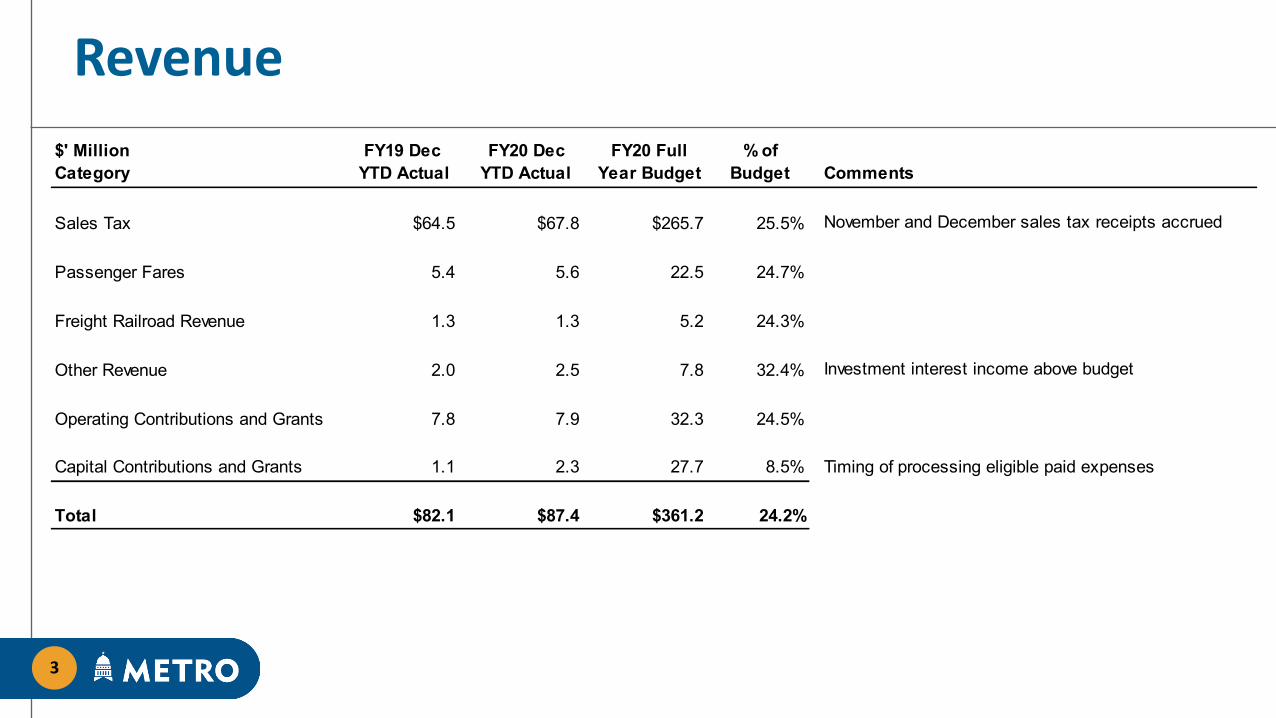
Revenue
3
$' MillionCategory
FY19 Dec YTD Actual
FY20 Dec YTD Actual
FY20 Full Year Budget
% of Budget Comments
Sales Tax $64.5 $67.8 $265.7 25.5% November and December sales tax receipts accrued
Passenger Fares 5.4 5.6 22.5 24.7%
Freight Railroad Revenue 1.3 1.3 5.2 24.3%
Other Revenue 2.0 2.5 7.8 32.4% Investment interest income above budget
Operating Contributions and Grants 7.8 7.9 32.3 24.5%
Capital Contributions and Grants 1.1 2.3 27.7 8.5% Timing of processing eligible paid expenses
Total $82.1 $87.4 $361.2 24.2%

Actual Sales Tax Receipts
4
Total $243.6M $261.5M $44.3MYOY % Growth 6.5% 7.5% 7.6%

Sales Tax Rolling Average Trend
5

Operating Expense
6
$' MillionCategory
FY19 Dec YTD Actual
FY20 Dec YTD Actual
FY20 Full Year Budget
% of Budget Comments
Salaries and Benefits $10.1 $10.8 $49.2 22.0% Vacancy savings through December
Professional Services 3.9 7.8 43.5 18.0% Timing of consultation and other professional fee payments
Materials and Supplies 0.1 0.1 2.2 6.6% Timing of maps, schedules and other supplies expense
Fuel and Fluids 3.0 3.3 13.7 24.1% $152K favorable variance - $2.18 per gallon actual cost
Utilities 0.7 0.5 3.2 15.8% Timing of Electricity, Water and Telephone expense
Insurance 0.3 0.2 1.0 16.1%
Purchased Transportation 41.9 42.4 165.1 25.7%
Lease/Rentals 0.4 0.4 2.0 18.9% Timing of Innovative Mobility leased vehicles
Other Expenses 0.7 0.5 7.2 7.5% Unspent contingency
Total $61.1 $66.1 $287.1 23.0%

Budget Transfers
7
October-19Transfer #1From: 510-5030303-920 Consultation Fees (1,865,000) To: 510-5090703-220 Budget Reallocation Account 1,865,000 October-19Transfer #2From: 510-5090703-220 Budget Reallocation Account (669,168) To: 510-5121201-550 Lease-Administrative Facility 669,168 October-19Transfer #3From: CPG1516 Downtown Station Improvements Funded by TxDOT (4,383,681) Realign funding between projects with CIP Reforecast.To: CPG1518 Bus Stop Signage 367,330
CPG1520 Bus Shelters 9 CPG1602 North Operations SERTA Demolition/Paving 1,797,000 CPG1605 Westgate Transit Center Park and Ride (299,737) CPG1607 Facility Improvement Projects (50,000) CPG1704 MetroRapid - Additional Stations for 801 and 803 (51,941) CPG1712 DT Station - Storm Water Improvements 308,745 CPG1713 Double Tracking - NBFR to Plaza Saltillo 240,000 CPG1803 Administrative Office Lease Space 3,053 CPG1807 Office Space Re-Configuration (Headquarters Facility) 3,695,082 CPG1808 Operations Control Center 125,000 CPG1901 Bus Electrification Infrastructure 310,100 CPG1902 Bus Stop Enhancements 609,000 CPG1903 North Lamar Mobility Hub - Engineering 19,738 CPG1904 Norwood Walmart (20,000) CPG2002 North Lamar Mobility Hub - Construction (4,750,000) CPG2004 Bus Stop Construction and Related Infrastructure 297,970 FIN2002 Capital Project FY2019 Carry Forward (299,357) ITS1601 ePaper DMS for BRT & Rail Plus IDIQ 391,806
Budget reallocation for the downtown Lavaca lease.
Consistent with Capital Metro's Financial Policies, there were four budget transfers that cumulatively exceeded $150,000 to report to the board for the 1st quarter of FY2020.
Transferring funds from Project Connect to budget reallocation account for accelerated work on the Blue and Orange lines completed in FY2019.

Budget Transfers (continued)
8
Transfer #3 (continued)
ITS1602 Customer Relationship Management System (80,000) Realign funding between projects with CIP Reforecast.ITS1704 Scheduling Systems Upgrade 100,000 ITS1803 Genfare Fare System Upgrades 69,875 ITS1804 Mobile Ticketing Payment Enhancements (50,100) ITS1806 Ticket Vending Machine Replacement 160,500 ITS1902 Transit On-Demand Software (400,000) ITS2001 Onboard Digital Displays (200,000) ITS2003 Enterprise Account-based Backend for Fare Collection 200,000 ITS2004 Onboard Validators Fleet Wide 378,251 ITS2006 CAD/AVL, APC and ITS Systems Replacement (2,900,000) ITS2009 Data Warehouse and Business Intelligence Enhancements (340,000) ITS2010 See Something Say Something App (230,400) ITS2012 Enterprise Customer Relationship Management System 2,900,000 PAM1611 Saltillo Crossings and Signals 230,000 PAM1902 Bus Wash (84,000) PAM1909 Plaza Saltillo - (Plaza) Revitalization 218,630 PAM2046 Water Bladder 509 (25,000) PAM2050 Additional AC Unit for OCC 40,000 PLN1901 North Lamar/Airport Intersection (380,000) RRC1407 TIGER Grant Project 1,782,332 SEC1501 Camera Replacements and Enhancements (243,367) SEC1702 Property Perimeter Hardening and Enhancements 456,795 SEC1801 Rail House Signal Security Enhancements 80,000 SEC1802 Security Cameras in Capital Metro Police Vehicles (48,633) SEC2002 Access Control Card Reader Replacement 55,000
December-19Transfer #4From: ITS2001 Onboard Digital Displays (440,000) To: ITS2013 Automated Passenger Count Real Time 440,000
Funding for new APC Real Time project.
Consistent with Capital Metro's Financial Policies, there were four budget transfers that cumulatively exceeded $150,000 to report to the board for the 1st quarter of FY2020.

Allocated & Restricted Funds
Reserve, Allocated & Restricted Funds
9
Notes: • Additional funding was allocated to the statutory operating and budget stabilization reserves based on the board approved funding formula. The statutory operating reserve
equals 2 months of estimated FY2019 operating expenses. Contributions to the budget stabilization reserve began in February 2016 with $7 million reserved in FY2016 and$3 million in FY2017. An additional contribution of $9.8 million was made in FY2018 to fully fund the budget stabilization reserve. The capital expansion fund wasestablished in FY2018 with $9.6 million reserved along with an additional $30.4 million from FY2019 as Capital Metro looks forward to future needs in the region.
• Funds for capital investment are required to help address extensive capital needs. The capital budget for FY2020 is $110 million, with $68 million funded by FY2020 incomeand $42 million from reserves. Due to project delays, $22 million of the FY2019 capital budget was carried forward to FY2020. These capital improvements are needed tomaintain the state of good repair of the community's transit infrastructure and to be in compliance with Federal regulations. The City of Austin Mobility Fund was reducedby $6 million in FY2019 to assist with Project Connect preliminary engineering and environmental analysis and by $1.6 million with a payment in November 2019.

Statement of Revenue, Expenses andChange in Net Position
10
$' MillionFY19 Dec
YTD ActualFY20 Dec
YTD ActualFY20 Full Year
Budget % of BudgetOperating Revenue
Passenger Fares $5.4 $5.6 $22.5 24.7%Freight Railroad Revenue 1.3 1.3 5.2 24.3%Other Revenue 1.0 1.3 5.3 23.8%
Total 7.8 8.1 33.0 24.5%
Operating ExpensesSalaries and Benefits 10.1 10.8 49.2 22.0%Professional Services 3.9 7.8 43.5 18.0%Fuel and Fluids 3.0 3.3 13.7 24.1%Utilities .7 .5 3.2 15.8%Purchased Transportation 41.9 42.4 165.1 25.7%Other Expenses 1.2 .8 10.3 8.2%Lease/Rental .4 .4 2.0 18.9%Depreciation & Amortization 10.7 11.4 50.7 22.5%
Total 71.9 77.5 337.8 22.9%
Operating Income/Loss (64.1) (69.4) (304.8) 22.8%
Non-Operating Revenue/(Expenses)Sales Tax 64.5 67.8 265.7 25.5%Investment Income 1.0 1.3 2.5 53.9%Operating Contributions and Grants 7.8 7.9 32.3 24.5%Capital Contributions and Grants 1.1 2.3 27.7 8.5%Mobility Interlocal Agreements (.8) (1.2) (6.9) 17.1%Other (.1) (.1) - 0.0%
Non-Operating Income/(Loss) 73.5 78.1 321.3 24.3%
Change in Net Position $9.4 $8.8 $16.6 52.9%

Budget Variances by Department
11
$'000Department
FY19 YTD Actual
FY20 YTD Actual
FY20 YTD Revised Budget
YTD % of Revised Budget
YTD Budgetvs. Actual
FY20 BudgetFull Year Comments
100 - Non-Allocated Benefits $2,589 $2,694 $3,452 78.0% $759 $14,380 Timing of admin pension and health plan expense102 - Wellness Center 61 64 72 89.8% 7 279103 - Child Care Center 309 239 253 94.4% 14 995105 - Business Center 91 6 97 6.6% 91 383 Timing of business center and office equipment expense110 - Executive Staff 172 182 344 52.8% 162 843 Vacancy savings - Director of Innovation and timing of dues and subscription expense115 - Communications 74 0 0 0.0% 0 0 Merged with Marketing department118 - Government Relations 174 125 160 78.6% 34 986 Timing of consulting fees119 - Diversity and Compliance 34 46 54 86.1% 7 227120 - Board Of Directors 70 35 54 64.8% 19 217 Timing of travel, conference and seminar expense125 - Internal Audit 90 91 94 97.0% 3 377130 - Strategic Oper Mgt. & Administration 209 265 198 133.8% (67) 821 Timing of sick and vacation payouts141 - Security 1,150 1,162 1,325 87.7% 163 5,162 Timing of APD officer salaries and wages150 - Legal 171 203 252 80.5% 49 1,021 Timing of general legal services220 - Finance 847 877 3,912 22.4% 3,034 8,396 Transfer of Project Connect budget for advanced FY2019 spending and unspent contingency230 - Information Technology 2,429 3,253 3,926 82.8% 674 12,120 Timing of software and hardware maintenance expense and vacancy savings for 6 positions250 - Procurement 324 378 416 90.9% 38 1,713275 - Rideshare 688 787 783 100.6% (5) 3,303320 - Planning 482 498 910 54.8% 412 4,061 Timing of consulting fees and vacancy savings for 4 positions330 - Marketing 588 746 1,495 49.9% 749 4,119 Timing of marketing campaigns331 - Community Engagement 192 238 482 49.3% 245 1,344 Timing of MetroArt and special events332 - Customer Service 232 247 291 85.0% 44 1,089 Vacancy savings for 4 positions340 - Human Resources 423 528 617 85.5% 89 2,428 Timing of consulting fees420 - Risk Management And Safety 637 469 1,356 34.6% 887 2,845 Timing of insurance premium payments457 - Public Facilities 924 937 1,370 68.4% 434 5,281 Timing of electrical and custodial services and utility expense530 - Capital Projects 308 419 500 83.8% 81 2,067 Timing of facility moving and miscellaneous street improvement expense540 - Real Estate And Property Mgt. 310 464 471 98.4% 8 2,991542 - Freight Rail Management 399 445 418 106.4% (27) 2,016544 - Commuter Rail Operations 5,720 4,369 5,247 83.3% 877 21,160 Purchased transportation savings from 15% fewer hours and timing of DMU engine overhaul550 - Real Estate and Facility Planning 583 509 708 71.8% 200 3,138 Timing of services and lease expense600 - Operations and Maintenance Oversight 33,050 34,744 33,922 102.4% (823) 130,783615 - Innovative Mobility 34 453 951 47.7% 498 4,405 Timing of purchased transportation, vehicle lease and services expense620 - Paratransit Contract Operations 6,667 7,184 7,366 97.5% 182 29,379 Timing of temporary help and other services and vehicle lease savings640 - Paratransit Reservation & Control 453 519 519 100.1% 0 2,117650 - Paratransit Eligibility 206 204 240 84.8% 37 931920 - Project Connect 460 2,685 3,867 69.4% 1,182 15,759 Vacancy savings - Director Project Connect and timing of marketing campaign
61,150 66,065 76,122 86.8% 10,057 287,133

Capital Projects Summary
12
$'000Project Category Expended
Outstanding Commitments Budget
Expended & Committed as % of Budget Comments
Commuter Rail $2,582 $11,616 $22,060 64.4% Positive Train Control and Track Undercutting
Vehicles 211 15,924 30,174 53.5% 23 Transit Buses and 4 Battery Electric Buses
Information Technology 707 1,760 15,337 16.1% Enterprise Asset Management System
Facilities 9,296 17,168 37,799 70.0% Downtown Station, N Ops Electric Bus Yard Paving and Bus Stop Enhancements
Freight Railroad 123 127 295 84.7%
Property and Asset Mgmt 455 301 1,524 49.6% Plaza Saltillo Revitalization, Crossings and Signals
Contingency - - 2,000 0.0%
Strategic Planning - - 500 0.0%
Security 557 366 2,093 44.1% Property Perimeter Hardening and Security Cameras in Metro Police Vehicles
Total $13,931 $47,262 $111,783 54.7%
Outstanding commitments are for the purchase orders that have been issued.

THANK YOU!