financial report - case western reserve …...statements of financial position statement of...
TRANSCRIPT

Roger Mastroianni
2019FINANCIAL REPORT

Selected Financial Data (unaudited)
Report of Independent Auditors
Statements of Financial Position
Statement of Activities
Statements of Cash Flows
Notes to Financial Statements
1
7
8
10
11
1
1
TABLE OF CONTENTS
Cover: The Health Education Campus of Case Western Reserve and Cleveland Clinic opened this spring as part of the two institutions’ commitment to preparing students to lead in this new era of team-based health care. The 477,000-square-foot Samson Pavilion (shown here) features state-of-the-art technology and simulation spaces, and also is expressly designed for students from our nursing, dental and medical schools (including the Cleveland Clinic Lerner College of Medicine) to learn, study and dine together. As a result, they will graduate
professions, but also how best to work together in the best interest of patients.

CASE WESTERN RESERVE UNIVERSITY FY19 FINANCIAL REPORT | 1
Case Western Reserve University (the “University”) continued to produce positive financial results during Fiscal Year 2019 (“FY19”), reflecting over a decade of solid financial performances.
The University’s FY19 financial plan continued to focus on maintaining momentum in core operating results, strengthening the balance sheet, and generating new funding for strategic capital projects by philanthropy. The results were a $61 million or 5.7% operating margin on a Generally Accepted Accounting Principles (“GAAP”) basis; an increase in total net assets of $45 million; and another successful year in attainment with $182 million in new gifts and pledges.
Following are additional comments related to the University’s operations and financial results, with Selected Financial Data shown on page 7.
FY19 FINANCIAL HIGHLIGHTS
Solid Core Operating ResultsThe University’s management of resources produced a net operating activity of $61 million or a 5.7% operating margin reflected on the Statement of Activities GAAP Basis. Likewise, the Statement of Operations (unaudited, management view) reports a positive operating indicator, an operating surplus, of $8 million, which is also positive compared against the FY19 operating budget. Both net operating activity and operating surplus have been positive for over a decade. See Selected Financial Data on page 7 for more information.
Strengthened Financial Position - Balance SheetThe University’s Statements of Financial Position, the balance sheet, reflects a year of positive growth as indicated by an increase in total assets of $58 million combined with an increase of total liabilities of $13 million yielding an increase in total net assets of $45 million. Working capital initiatives, continued flow of new capital pledges, and refinanced long-term debt, offset by an increase in the accrued pension liability, all contributed to a stronger balance sheet.
Attainment Level and Capital CampaignThe generosity of university donors once again produced a successful year in attainment of $182 million in FY19. In FY19, the University received gifts from 17,000 donors, totaling $113 million as reported on a cash and equivalent support basis. Realized gifts and pledges of $98 million are reported in the Statement of Activities (GAAP basis).
The University’s Forward Thinking capital campaign concluded with a total of $1.82 billion in pledges and gifts - far exceeding the updated goal of $1.5 billion set in 2014. Campaign support came from 60,000 donors, including 34,000 who gave to the university for the first time. Increasing scholarship support was a leading priority of the campaign and nearly $254 million was raised. Strategic capital projects was also a focus and garnered $393 million in contributions.
DISCUSSION OF FINANCIAL RESULTS

2 | DISCUSSION OF FINANCIAL RESULTS - unaudited
STATEMENT OF OPERATIONS unaudited
The University manages its daily operations using a Statement of Operations (management view) that is prepared on a modified-cash basis and presented by natural account class; it is unaudited. The Statement of Operations measures and reports the organization’s management center-based activities. It excludes non-operating transactions, depreciation expense, differs in its treatment of capital, and excludes most restricted funds transactions (e.g. restricted gift revenue).
The University produced a total surplus of $7.7 million in FY19, compared to a budgeted surplus of $4.7 million and a $9.0 million surplus in FY18. FY19 marked the twelfth consecutive year of positive operating results.
The FY19 operating results reflect increasing research and training revenue along with increased tuition revenues.
MANAGEMENT CENTER OPERATING REVENUESOperating revenues are classified in four categories: Tuition and Fees, Endowment, Research-related, and Other Revenue. The University reported $1.185 billion in total revenue, a $40 million or 3% increase over FY18.
Gross tuition and fees revenue was $480 million, a $19 million or 4% increase over FY18. Gross undergraduate tuition was $233 million, a $13 million or 6% increase over FY18. The increase is the result of a 3.25% rate increase and a 6% increase in undergraduate enrollment. Professional and graduate program gross tuition, along with summer programs and fees, was $247 million, a $6 million or 3% increase over FY18.
Endowment revenue used by operations was $95 million, a $5 million or 6% increase over FY18.
Research-related revenues (Research & Training, Overhead Recovery, and Restricted Gifts) were $464 million, a $10 million or 2% increase over FY18.
Other revenue was $146 million, an increase of $5 million or 3% over FY18.
MANAGEMENT CENTER OPERATING EXPENSESOperating expenses were $1.180 billion, a $40 million or 3% increase over FY18. Expenses are categorized as Salaries and Benefits, Other Direct, Indirect Expense and Auxiliaries.
Salaries and benefits were $340 million, a $7 million or 2% increase over FY18. Other direct expense was $562 million, a $23 million or 4% increase over FY18. Indirect expense and auxiliaries were $278 million, a $10 million or 4% increase over FY18.
2014 2015 2016 2017 2018 * 2019
Budget 6,127 3,868 4,269 5,401 8,548 4,739
Actual 7,179 8,964 10,096 7,052 8,967 7,680
-
2,000
4,000
6,000
8,000
10,000
12,000
UNIVERSITY SURPLUS/(DEFICIT)in thousands of dollars
418,965 443,228 460,527 479,951
88,328 84,820 89,706 95,103
422,162 437,751 453,905
464,261
154,198 141,489
141,041 145,863
-
200,000
400,000
600,000
800,000
1,000,000
1,200,000
2016 2017 2018 2019
OPERATING REVENUEin thousands of dollars
Other Revenue Research-related Endowment Tuition & Fees
320,272 328,631 333,232 340,123
494,768 512,767 539,804 562,421
259,698 264,024 267,676
277,804
-
200,000
400,000
600,000
800,000
1,000,000
1,200,000
2016 2017 2018 2019
OPERATING EXPENSESin thousands of dollars
Indirect Expense & Auxiliaries Other Direct Expense Salaries & Benefits

CASE WESTERN RESERVE UNIVERSITY FY19 FINANCIAL REPORT | 3
STATEMENT OF ACTIVITIES AND OTHER SUPPORT
The Statement of Activities (GAAP Basis) includes results from the University’s operating and non-operating activities which produced a positive change in net assets. In FY19, operating activity contributed $61 million to net assets.
OPERATING REVENUES AND OTHER SUPPORTTotal operating revenues and other support were $1.068 billion, an increase of $52 million or 5% over FY18. The components of the University’s revenues are shown below and additional detail of operating revenue follows.
Tuition incomeGross tuition income of $491 million increased $20 million or 4% over FY18, and includes fees and undergraduate, graduate, summer, and professional tuition. Gross tuition income is offset in part by financial aid awarded; the financial aid offset for FY19 was $190 million, resulting in net tuition of $301 million, or 28% of operating revenues.
The net tuition and fees income of $301 million represents a $11 million or 4% increase over FY18, with increased revenues generated by an increase in tuition rates and from higher student enrollment.
Investment returns Investment returns included $69 million in returns distributed from the long-term investment pool, $14 million in returns on operating investments, and $15 million in distributions from funds held in trust by others (“FHBO”) for endowment spending. Investment returns, which represent 9% of operating revenues, totaled $98 million, a less than 1% change from FY18.
Grants and contractsGrants and contracts revenue includes awards to the University and also its affiliates, most notably the Cleveland Clinic Lerner College of Medicine (“CCLCM”). Grants and contracts received for research and training purposes totaled $366 million, including $102 million in CCLCM awards. This amount reflects an increase of $5 million or 1% over FY18. The total represents 34% of overall University operating revenues. This increase corresponds with an increase in research operating expenses.
Overhead cost recoveryFacilities and administrative cost recovery applicable to federally sponsored projects and all other sponsored activity was $79 million in FY19, a $2 million or 3% increase over FY18. Overhead recovery represents 8% of operating revenues.
Gifts and pledgesGifts and pledges income was $98 million, an increase of $28 million or 39% over FY18. Gifts and pledges, which represent 9% of operating revenues, are recorded in the appropriate asset category when received.
Other revenueOther revenue of $51 million increased $2 million or 5% over FY18. Other revenue represents 5% of operating revenues and includes the State of Ohio appropriation, Organized Activities, and Other Sources.
AuxiliariesAuxiliaries revenue of $76 million increased $3 million or 4% over FY18. Auxiliaries revenue is categorized as either “Student,” which is largely Housing, Food, and Health Services, totaling $66 million, or “Other,” including Rental Properties and Parking, totaling $10 million for FY19. Auxiliaries revenue represents 7% of operating revenues.
Investment Returns
9%
Sponsored Research Activity
34%
Overhead Recovery
8%
Gifts & Pledges
9%
Other5%
Auxiliaries7%
Tuition (net of financial
aid)28%
OPERATING REVENUESAND OTHER SUPPORT
$1.068 billion
Statement of Activities data

4 | DISCUSSION OF FINANCIAL RESULTS - unaudited
OPERATING EXPENSESTotal expenses of $1.007 billion increased $25 million or 3% over FY18. The components of the University’s expenses are shown below and additional detail of operating expenses follows.
Instructional costs of $342 million, represents 34% of operating expenses, increased by $10 million or 3% over FY18. Included in direct instructional costs are faculty and staff salaries and benefits.
Sponsored research activity of $394 million, represents 39% of operating expenses, increased $8 million or 2% over FY18. Sponsored research activity includes sponsored research and training, other sponsored projects, and CCLCM research and training expenses.
Support services costs of $187 million, represents 19% of operating expenses, including libraries, student services, and university services, increased $6 million or 3% over FY18. The increase is primarily in university services due to an increase in benefit expenses.
Auxiliaries expenses of $85 million, represents 8% of operating expenses, increased $2 million or 2% over FY18.
NON-OPERATING ACTIVITIESNon-operating activities decreased net assets by $16 million, a $91 million decrease from FY18. The decrease is due to financial market fluctuations, less investment income and pension plan changes other than periodic benefit costs. Long-term investment activities (investment income and net appreciation) resulted in a $77 million increase in net assets. Other non-operating activities (investment returns distributed for operations, change in liabilities due under life-income agreements, pension plan changes other than periodic benefit costs, and loss on disposal of plant assets) resulted in a $93 million decrease in net assets.
CHANGE IN NET ASSETSThe combined net operating activity of $61 million and net non-operating activity of $(16) million resulted in an increase in net assets of $45 million or 2% over FY18.
THE UNIVERSITY’S ENDOWMENT Case Western Reserve University’s investment pool consist of a group of funds, including the endowment funds, funds functioning as endowments (also referred to as quasi-endowment), Board-designated funds, and operating funds, that are invested in a broadly diversified portfolio. The total investment return for the investment pool, net of external manager fees, approximated 6.04% (2019) and 9.15% (2018). Additional detail on the investment pool is shown in Footnote 6.
The University’s combined endowment, the purpose of which is to generate revenue in perpetuity, is comprised of funds invested and managed by the University, that includes endowment funds and quasi-endowments (referred to as the endowment pool) and funds invested and managed outside the University (referred to as funds held in trust). The University’s combined endowment at June 30, 2019 and 2018 is shown in the table below:
(in thousands) 2019 2018Endowment Pool:
Donor-restricted $ 1,198,275 $ 1,173,633
Donor-purpose restricted 292,772 291,863
Quasi-endowment 77,264 73,806
Funds held in trust 298,189 303,597
Total combined endowment $ 1,866,500 $ 1,842,899
Change in market value 1.28% 4.95%
Activities and total investment return for the combined endowment for the years ending June 30, 2019 and 2018 are shown in the table below:
(in thousands) 2019 2018Beginning combined endowment $ 1,842,899 $ 1,755,941
Additions 22,438 27,459
Spending distribution (83,634) (81,345)
Campaign support (6,000) (6,000)
Operating support (2,800) (3,239)
Other (264) (199)
Appreciation and investment income 93,861 150,282
Ending combined endowment $ 1,866,500 $ 1,842,899
Combined endowment investment return 5.86% 9.24%
Instructional34%
Sponsored Research Activity
39% Support Services
19%
Auxiliaries8%
Statement of Activities data
OPERATING EXPENSES $1.007 billion

CASE WESTERN RESERVE UNIVERSITY FY19 FINANCIAL REPORT | 5
The University’s Statements of Financial Position refl ect total assets of $3.217 billion with a primarily sizable cash and investment balance of $2.146 billion.
ASSETSTotal cash and investments of $2.146 billion, including cash and cash equivalents, operating investments, investments, held for long-term purposes and funds held in trust by others, combined total 67% of University assets. Property, plant, equipment and books represent an additional $733 million or 23% of assets. Total assets increased $58 million or 2% over FY18.
Cash and cash equivalentsThe University actively manages its cash and cash equivalents to maintain targeted levels of working capital in highly liquid assets to meet daily operating requirments. Working capital and Board designated-funds in excess of the liquidity target are retained in operating investments to produce a higher investment return. The University’s cash position on June 30 was $81 million, a decrease of $25 million or 24% from FY18. Cash equivalents include all highly liquid investments with original purchase maturity of 90 or fewer days, and appropriated endowment income which may be spent on demand.
Operating investmentsThe University’s operations were supported by $256 million of operational investments in addition to cash and cash equivalents. These investments generally have a maturity of greater than 90 days but may be liquidated on demand. Operating investments increased $17 million or 7% over FY18.
ReceivablesReceivables include net accounts and loans receivable as well as net pledges receivable. In total, the University had $268 million in receivables, which represent 8% of assets. Receivables increased $21 million or 8% over FY18.
Investments, held for long-term purposesLong-term investments of $1.511 billion increased $48 million or 3% over FY18. Because a majority of the University’s long-term investments are endowments or similar funds, the Board of Trustees’ annually-approved endowment spending allocation and support for certain development-related activities had an impact of approximately $69 $69 million on long-term investments in FY19.
Funds held in trust by othersFunds held in trust by others of $298 million decreased $5 million or 2% from FY18. It was determined that the community foundation holding certain funds held in trust by others has ultimate variance power and therefore right to ownership of the assets. As a result, the University removed a number of funds held in trust by others with a market value of $43 million as of June 30, 2017, aff ecting the beginning value of these assets for the fi scal year ended June 30, 2018.
Property, plant, equipment, and booksProperty, plant, equipment, and books, net of deprecia-tion, constitute 23% of the University’s assets, totaling $733 million for FY19. Net plant assets decreased $9 million or 1% from FY18.
LIABILITIESTotal liabilities of $819 million increased $13 million or 2% over FY18.
Retirement plansThe University provides defi ned benefi t and defi ned contribution pension plans for its faculty and staff . The pension plan discount rate for the defi ned benefi t plan of 3.90% in FY19 decreased from FY18. The University’s accrued pension liability increased $14 million over FY18, to a total accrued pension liability of $104 million in FY19.
STATEMENTS OF FINANCIAL POSITION
Cash and cash equivalents
3%
Operating investments 8%
Receivables8%
Investments held for
long-term purposes
47%
Funds held in trust by others
9%
Health Education Campus
2%
Property, plant, equipment,
and books, net of depreciation
23%
TOTAL ASSETS$3.217 billion
Statement of Financial Position data

6 | DISCUSSION OF FINANCIAL RESULTS - unaudited
CHANGE IN NET ASSETS
(in thousands) 2019 2018
Beginning net assets $ 2,353,440 $ 2,243,311
Increase in net assets 45,140 110,129
Ending net assets $ 2,398,580 $ 2,353,440
PROSPECTIVE DISCUSSIONThe University expects to maintain a positive operating position as reflected in its FY20 operating budget surplus of $6 million. The incoming Class of 2023 is at the targeted size with matched quality and diversity. Lastly, senior leadership is continuously engaged in improving operating performance and strengthening the University’s financial position using a disciplined approach.
Net assets without donor restrictions Net assets without donor restrictions increased $17 million or 7% from FY18 to $258 million. Net operating activity added $33 million and net non-operating activity decreased net assets by $16 million.
John F. Sideras, CPASenior Vice President and Chief Financial Officer
DebtTotal liability on notes and bonds payable, including the line of credit and unamortized bond premium and issuance costs, decreased $19 million from FY18 due to scheduled principal payments of $14 million and scheduled bond premium amortization of $5 million.
The University restructured a portion of its debt portfolio in FY19 to refinance the 2014A bank direct placement bonds ($68 million) with 2019A Series floating rate notes. The refinanced bonds had a mandatory call date of April 1, 2019, and the restructuring smooths out the debt service in later years. The University’s variable rate debt of $68 million is synthetically fixed with four floating-to-fixed rate swaps totaling $73 million. The restructuring, along with scheduled principal payments and premium amortization, reduced the University’s total long-term indebtedness to $447 million in FY19 from $461 million in FY18.
Net assets with donor restrictionsNet assets with donor restrictions increased $28 million or 1% over FY18 to $2.140 billion. The University received $75 million of new restricted gifts and pledges and $48 million in net assets released from restrictions in net operating activity. Non-operating activity increased net assets with donor restrictions by $70 million from long-term investment activities and decreased net assets with donor restrictions by $67 million in assets released from restrictions.
NET ASSETSIn August 2016, the FASB issued ASU 2016-14: “Presentation of Financial Statements of Not-for-Profit Entities,” which simplifies and improves how a not-for-profit entity classifies net assets, among other changes. Net assets are now presented as “without donor restrictions” and “with donor restrictions.” The University adopted the new standard in FY19.
In FY19, the University’s total net assets increased $45 million or 2% over FY18 to $2.399 billion. The FY18 beginning net assets balance was adjusted for retrospective application of new accounting principle ($16 million) and an adjustment for funds held in trust by others ($43 million).
Moody’s Investor Services long-term rating of A1 was affirmed, while they upgraded the outlook from stable to positive. S&P Global Ratings affirmed the rating of AA- and stable outlook.

CASE WESTERN RESERVE UNIVERSITY FY19 FINANCIAL REPORT | 7
Fiscal Years Ended June 30
2019 2018 2017 2016
STATEMENT OF OPERATIONS HIGHLIGHTS - Management ViewTotal revenue $ 1,185,178 $ 1,145,179 $ 1,107,288 $ 1,083,653Total expense 1,180,348 1,140,712 1,105,422 1,074,738
Operating margin 4,830 4,467 1,866 8,915Retained surplus use 2,850 4,500 5,186 1,181
Surplus $ 7,680 $ 8,967 $ 7,052 $ 10,096
STATEMENT OF ACTIVITIES HIGHLIGHTS - GAAP BasisTuition and fees (net of student aid) $ 300,703 $ 289,278 $ 278,258 $ 255,613Investment, FHBO, and operational returns 97,893 97,584 97,537 88,011Grants and contracts 365,693 361,177 350,171 335,208Facilities and administrative cost recovery 78,765 76,642 74,557 72,272Gifts and pledges 98,173 70,449 95,779 131,513Other revenue 50,914 48,523 53,933 68,608Auxiliary services 75,767 72,645 72,381 70,031
Total operating revenues and other support 1,067,908 1,016,298 1,022,616 1,021,256Instructional expenses 341,555 331,878 322,242 311,880Sponsored research activity 393,959 386,071 374,671 363,077Support services 186,782 180,568 176,230 162,105Auxiliary services 84,976 83,370 85,311 78,582
Total operating expense 1,007,272 981,887 958,454 915,644Net operating activity $ 60,636 $ 34,411 $ 64,162 $ 105,612
Long-term investment activities 77,014 136,238 190,376 (91,469)Other non-operating activities (92,510) (60,520) (46,306) (108,805)
Net non-operating activities $ (15,496) $ 75,718 $ 144,070 $ (200,274)Change in net assets $ 45,140 $ 110,129 $ 208,232 $ (94,662)
FINANCIAL POSITION HIGHLIGHTSCash and cash equivalents $ 80,586 $ 105,409 $ 143,589 $ 139,344Operating investments, at market 255,668 238,988 187,904 160,195Receivables 268,206 247,359 252,142 229,157Investments (held for long-term purposes) 1,511,280 1,463,671 1,395,449 1,298,508Funds held in trust by others 298,189 303,597 337,553 312,635Health Education Campus 59,890 46,120Property, plant, equipment, and books, net of depreciation 733,010 742,416 757,082 776,317Prepaid expenses and other assets 10,564 11,946 35,013 32,700
Total assets $ 3,217,393 $ 3,159,506 $ 3,108,732 $ 2,948,856Total liabilities $ 818,813 $ 806,066 $ 822,572 $ 870,928Total net assets $ 2,398,580 $ 2,353,440 $ 2,286,160 $ 2,077,928
OTHER FINANCIAL INFORMATIONNet investments (including FHBO), at fair value $ 2,065,137 $ 2,006,256 $ 1,920,906 $ 1,771,338Investments payout in support of operations $ 83,634 $ 81,345 $ 77,861 $ 81,675
Total gifts and pledges (attainment) $ 182,093 $ 207,973 $ 181,187 $ 174,136Total gifts - cash basis $ 112,557 $ 113,178 $ 113,983 $ 158,454
STUDENTSEnrollment *
Undergraduate 5,151 5,035 5,044 5,053Post-Baccalaureate 5,921 5,882 5,776 5,534
*Enrollment for fall semester of fi scal year in FTEs
in thousands of dollars
SELECTED FINANCIAL DATA unaudited
8 | REPORT OF INDEPENDENT AUDITORS
Report of Independent Auditors To the Board of Trustees Case Western Reserve University: We have audited the accompanying financial statements of Case Western Reserve University, which comprise the statements of financial position as of June 30, 2019 and 2018, and the related statements of activities and of cash flows for the years then ended. Management’s Responsibility for the Financial Statements Management is responsible for the preparation and fair presentation of the financial statements in accordance with accounting principles generally accepted in the United States of America; this includes the design, implementation and maintenance of internal control relevant to the preparation and fair presentation of financial statements that are free from material misstatement, whether due to fraud or error. Auditors’ Responsibility Our responsibility is to express an opinion on the financial statements based on our audit. We conducted our audit in accordance with auditing standards generally accepted in the United States of America. Those standards require that we plan and perform the audit to obtain reasonable assurance about whether the financial statements are free from material misstatement. An audit involves performing procedures to obtain audit evidence about the amounts and disclosures in the financial statements. The procedures selected depend on our judgment, including the assessment of the risks of material misstatement of the financial statements, whether due to fraud or error. In making those risk assessments, we consider internal control relevant to the University’s preparation and fair presentation of the financial statements in order to design audit procedures that are appropriate in the circumstances, but not for the purpose of expressing an opinion on the effectiveness of the University’s internal control. Accordingly, we express no such opinion. An audit also includes evaluating the appropriateness of accounting policies used and the reasonableness of significant accounting estimates made by management, as well as evaluating the overall presentation of the financial statements. We believe that the audit evidence we have obtained is sufficient and appropriate to provide a basis for our audit opinion. Opinion In our opinion, the financial statements referred to above present fairly, in all material respects, the financial position of Case Western Reserve University as of June 30, 2019 and 2018, and the changes in their net assets and their cash flows for the years then ended in accordance with accounting principles generally accepted in the United States of America.

CASE WESTERN RESERVE UNIVERSITY FY19 FINANCIAL REPORT | 9
Emphasis of Matter As discussed in Note 1 to the financial statements, the University changed the manner in which it accounts for net assets and reports certain aspects of the financial statements as a not-for-profit entity in 2019. Our opinion is not modified with respect to this matter. Cleveland, Ohio October 19, 2019

10 | FINANCIAL STATEMENTS
STATEMENTS OF FINANCIAL POSITION
June 30
In thousands of dollars 2019 2018
ASSETSCash and cash equivalents $ 80,586 $ 105,409 Operating investments 255,668 238,988 Accounts and loans receivable, net 103,950 100,558 Pledges receivable, net 164,256 146,801Prepaid expenses and other assets 10,564 11,946Investments, held for long-term purposes 1,511,280 1,463,671Funds held in trust by others 298,189 303,597Health Education Campus 59,890 46,120Property, plant, equipment and books, net 733,010 742,416
TOTAL ASSETS $ 3,217,393 $ 3,159,506
LIABILITIES AND NET ASSETSLIABILITIES
Accounts payable and accrued expenses $ 63,800 $ 63,221Deferred income and other liabilities 67,942 52,311Annuities payable 36,421 35,141Refundable advances 7,710 7,528Accrued pension liability 104,192 89,893Notes and bonds payable 512,650 531,244Refundable federal student loans 26,098 26,728
TOTAL LIABILITIES $ 818,813 $ 806,066NET ASSETS
Without donor restrictions $ 258,483 $ 241,668With donor restrictions 2,140,097 2,111,772
TOTAL NET ASSETS $ 2,398,580 $ 2,353,440TOTAL LIABILITIES AND NET ASSETS $ 3,217,393 $ 3,159,506
The accompanying notes are an integral part of the financial statements.

CASE WESTERN RESERVE UNIVERSITY FY19 FINANCIAL REPORT | 11
STATEMENT OF ACTIVITIES
In thousands of dollarsWithout Donor
RestrictionsWith Donor Restrictions
For the year ended .June 30, 2019
OPERATING REVENUES AND OTHER SUPPORTStudent tuition and fees, net of student aid of $190,262 $ 300,703 $ 300,703 Investment returns distributed for operations 68,687 68,687FHBO returns distributed 14,755 $ 192 14,947Investment returns on operating investments 14,259 14,259Grants and contracts 264,081 264,081CCLCM grants and contracts 101,612 101,612Gifts and pledges 23,027 75,146 98,173State of Ohio appropriation 2,555 2,555Facilities and administrative cost recovery 78,765 78,765Organized activities 11,997 11,997Other sources 36,047 315 36,362Auxiliary services - students 66,224 66,224Auxiliary services - other 9,543 9,543Net assets released from restrictions 47,588 (47,588) -.
TOTAL OPERATING REVENUES AND OTHER SUPPORT $ 1,039,843 $ 28,065 $ 1,067,908 OPERATING EXPENSES
Instructional 341,555 341,555Sponsored research and training 268,347 268,347Other sponsored projects 24,000 24,000CCLCM research and training 101,612 101,612Libraries 23,816 23,816Student services 34,748 34,748University services 128,218 128,218Auxiliary services - students 70,241 70,241Auxiliary services - other 14,735 14,735
TOTAL OPERATING EXPENSES $ 1,007,272 $ -. $ 1,007,272 NET OPERATING ACTIVITY $ 32,571 $ 28,065 $ 60,636
NON-OPERATING ACTIVITIESLong-term investment activities Investment (loss) income $ (89 ) $ 26,780 $ 26,691 Net appreciation 6,894 43,429 50,323Total long-term investment activities 6,805 70,209 77,014Investment returns distributed for operations (68,687) (68,687)Change in liabilities due under life-income agreements (4) (2,859) (2,863)Loss on disposal of plant assets (3,500) (3,500)Pension plan changes other than periodic benefit costs (17,460) (17,460)Net assets released from restrictions 67,090 (67,090) -.
NET NON-OPERATING ACTIVITY $ (15,756) $ 260 $ (15,496)
CHANGE IN NET ASSETS $ 16,815 $ 28,325 $ 45,140 Beginning net assets 241,668 2,111,772 2,353,440ENDING NET ASSETS $ 258,483 $ 2,140,097 $ 2,398,580
The accompanying notes are an integral part of the financial statements.

12 | FINANCIAL STATEMENTS
STATEMENT OF ACTIVITIES
In thousands of dollarsWithout Donor
RestrictionsWith Donor Restrictions
For the year EndedJune 30, 2018
OPERATING REVENUES AND OTHER SUPPORTStudent tuition and fees $ 470,870 $ 470,870 Less: Student aid (181,592) (181,592)
289,278 289,278 Investment returns distributed for operations 67,157 67,157FHBO returns distributed 13,922 $ 266 14,188Investment returns on operating investments 16,239 16,239Grants and contracts 261,210 261,210CCLCM grants and contracts 99,967 99,967Gifts and pledges 21,311 49,138 70,449State of Ohio appropriation 2,575 2,575Facilities and administrative cost recovery 76,642 76,642Organized activities 12,659 12,659Other sources 33,125 164 33,289Auxiliary services - students 62,795 62,795Auxiliary services - other 9,850 9,850Net assets released from restrictions 47,482 (47,482) -
TOTAL OPERATING REVENUES AND OTHER SUPPORT $ 1,014,212 $ 2,086 $ 1,016,298 OPERATING EXPENSES
Instructional 331,878 331,878Sponsored research and training 261,605 261,605Other sponsored projects 24,499 24,499CCLCM research and training 99,967 99,967Libraries 22,815 22,815Student services 33,120 33,120University services 124,633 124,633Auxiliary services - students 70,412 70,412Auxiliary services - other 12,958 12,958
TOTAL OPERATING EXPENSES $ 981,887 $ -. $ 981,887 NET OPERATING ACTIVITY $ 32,325 $ 2,086 $ 34,411
NON-OPERATING ACTIVITIESLong-term investment activities Investment income $ 7,043 $ 61,757 $ 68,800 Net appreciation 10,059 57,379 67,438Total long-term investment activities 17,102 119,136 136,238Investment returns distributed for operations (67,157) (67,157)Change in liabilities due under life-income agreements (19) (3,539) (3,558)Loss on disposal of plant assets (1,827) (1,827)Pension plan changes other than periodic benefit costs 12,022 12,022Net assets released from restrictions 27,579 (27,579) -
NET NON-OPERATING ACTIVITY $ (12,300) $ 88,018 $ 75,718
CHANGE IN NET ASSETS $ 20,025 $ 90,104 $ 110,129 Beginning net assets, as originally reported 205,826 2,080,334 2,286,160
Adjustment for retrospective application of new accounting principle 15,817 (15,817) - Adjustment for funds held in trust by others (42,849) (42,849)Beginning net assets, as adjusted 221,643 2,021,668 2,243,311ENDING NET ASSETS $ 241,668 $ 2,111,772 $ 2,353,440
The accompanying notes are an integral part of the financial statements.
CASE WESTERN RESERVE UNIVERSITY FY19 FINANCIAL REPORT | 13
STATEMENTS OF CASH FLOWS
For the year ended June 30
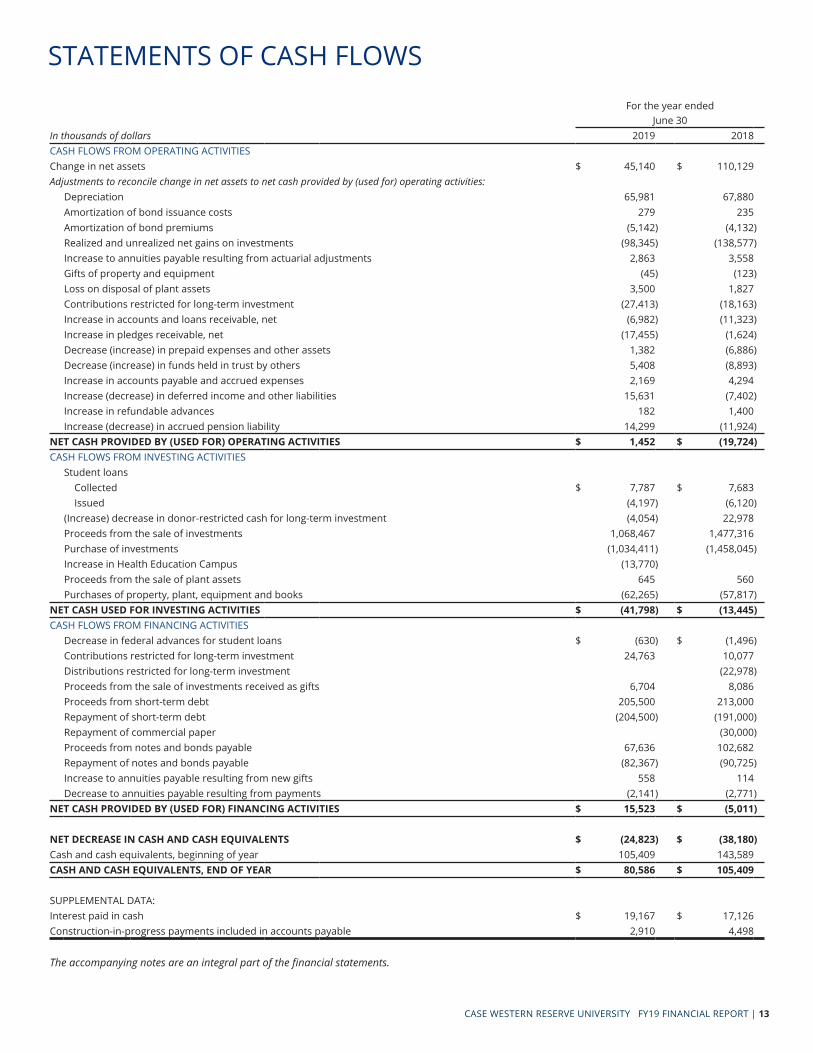
In thousands of dollars 2019 2018CASH FLOWS FROM OPERATING ACTIVITIESChange in net assets $ 45,140 $ 110,129 Adjustments to reconcile change in net assets to net cash provided by (used for) operating activities:
Depreciation 65,981 67,880Amortization of bond issuance costs 279 235Amortization of bond premiums (5,142) (4,132)Realized and unrealized net gains on investments (98,345) (138,577)Increase to annuities payable resulting from actuarial adjustments 2,863 3,558Gifts of property and equipment (45) (123)Loss on disposal of plant assets 3,500 1,827Contributions restricted for long-term investment (27,413) (18,163)Increase in accounts and loans receivable, net (6,982) (11,323)Increase in pledges receivable, net (17,455) (1,624)Decrease (increase) in prepaid expenses and other assets 1,382 (6,886)Decrease (increase) in funds held in trust by others 5,408 (8,893)Increase in accounts payable and accrued expenses 2,169 4,294Increase (decrease) in deferred income and other liabilities 15,631 (7,402)Increase in refundable advances 182 1,400Increase (decrease) in accrued pension liability 14,299 (11,924)
NET CASH PROVIDED BY (USED FOR) OPERATING ACTIVITIES $ 1,452 $ (19,724 )CASH FLOWS FROM INVESTING ACTIVITIES
Student loans Collected $ 7,787 $ 7,683 Issued (4,197) (6,120)(Increase) decrease in donor-restricted cash for long-term investment (4,054) 22,978Proceeds from the sale of investments 1,068,467 1,477,316Purchase of investments (1,034,411) (1,458,045)Increase in Health Education Campus (13,770)Proceeds from the sale of plant assets 645 560Purchases of property, plant, equipment and books (62,265) (57,817)
NET CASH USED FOR INVESTING ACTIVITIES $ (41,798) $ (13,445)CASH FLOWS FROM FINANCING ACTIVITIES
Decrease in federal advances for student loans $ (630) $ (1,496)Contributions restricted for long-term investment 24,763 10,077Distributions restricted for long-term investment (22,978)Proceeds from the sale of investments received as gifts 6,704 8,086Proceeds from short-term debt 205,500 213,000Repayment of short-term debt (204,500) (191,000)Repayment of commercial paper (30,000)Proceeds from notes and bonds payable 67,636 102,682Repayment of notes and bonds payable (82,367) (90,725)Increase to annuities payable resulting from new gifts 558 114Decrease to annuities payable resulting from payments (2,141) (2,771)
NET CASH PROVIDED BY (USED FOR) FINANCING ACTIVITIES $ 15,523 $ (5,011)
NET DECREASE IN CASH AND CASH EQUIVALENTS $ (24,823) $ (38,180)Cash and cash equivalents, beginning of year 105,409 143,589 CASH AND CASH EQUIVALENTS, END OF YEAR $ 80,586 $ 105,409
SUPPLEMENTAL DATA:Interest paid in cash $ 19,167 $ 17,126 Construction-in-progress payments included in accounts payable 2,910 4,498
The accompanying notes are an integral part of the financial statements.

14 | NOTES TO THE FINANCIAL STATEMENTS - in thousands of dollars
1. SUMMARY OF SIGNIFICANT ACCOUNTING POLICIES
Basis of Presentation
Case Western Reserve University (“the University”) is an Ohio not-for-profit corporation that operates a private research university in Cleveland, Ohio. The financial statements of the University as of June 30, 2019 and 2018, and for the years then ended, have been prepared in accordance with accounting principles generally accepted in the United States of America (“U.S. GAAP”). Accordingly, the accompanying financial statements have been prepared on the accrual basis of accounting.
Net Asset Categories
Standards for external financial reporting by not-for-profit organizations require that resources be classified for reporting purposes into two net asset categories according to donor-imposed restrictions (Note 15):
Without Donor Restrictions are those net assets not subject to donor-imposed restrictions. All revenues, gains and losses that are not restricted by donors are included in this classification. All operating expenses are reported as decreases in net assets without donor restrictions.
Contributions not subject to donor-imposed restrictions and donor-restricted contributions that are received and either spent, or deemed spent, for the restricted purpose within the same year are reported as increases to net assets without donor restrictions.
Net assets without donor restrictions include certain funds that are Board-designated as functioning as endowment and a liquidity reserve.
With Donor Restrictions are those net assets subject to donor-imposed time or purpose restrictions that are expected to be met and those subject to donor-imposed perpetual restrictions. These net assets include donor-restricted endowment, unconditional pledges, certain funds restricted for capital projects, split-interest agreements, and interests in perpetual trusts held by others.
For donor-imposed time or purpose restrictions, the University meets such donor restrictions through the passage of time, the appropriation of endowment earnings, placing gift-funded capital projects into service, and/or the University incurring expenses. When such
restrictions are met, the related net assets are reported as Net assets released from restrictions in the statement of activities.
Contributions
Contributions, including unconditional pledges to give and irrevocable trusts held by others with the University as the beneficiary, are recognized as revenues in the period received or promised. They are classified as net assets without donor restrictions or with donor restrictions depending upon the donor’s intent.
Contributions restricted for the acquisition of land, buildings and equipment are reported as revenues with donor restrictions. These contributions are reclassified to net assets without donor restrictions when the assets are placed in service. Promises to give that are subject to donor-imposed stipulations that the corpus be maintained in perpetuity are recognized as increases in net assets with donor restrictions.
Conditional promises to give are not recognized until the conditions on which they depend are substantially met. Contributions of assets other than cash are reported at their estimated fair value at the date of gift. Contributions scheduled to be received after one year are discounted using a market rate (Note 4).
Grants and Contracts (Government and Private)
Government and private grant contracts are reviewed to determine whether they constitute an exchange transaction or a contribution, and whether conditions are present that would affect the timing of revenue recognition. Those determined to be contributions without conditions will have revenue recognized in the period the grant or contract is entered into and those determined to have conditions will have revenue recognized once the condition has been met. Those determined to be exchange transactions will have revenue recognized when barriers to the grant or contract funding have been overcome as qualifying expenses are incurred. Any payment received before barriers to funding have been overcome is recorded as a refundable advance. Once recognition is allowed, projects funded by grants and contracts that incur expenses prior to payment receipts are recorded as revenue with a corresponding receivable.

CASE WESTERN RESERVE UNIVERSITY FY19 FINANCIAL REPORT | 15
Investment Returns on Operating Investments
The University has invested excess operating funds and certain Board-designated funds with the University’s investment pool. The operating funds are invested alongside other funds and receive a pro-rata portion of income, expenses, gains, and losses of the pool.
Cash and Cash Equivalents
The University considers all highly liquid investments with an original maturity of 90 days or less when purchased as cash and cash equivalents, except those amounts managed by investment managers as part of the investment pool that do not belong to operations, or unspent bond proceeds, which are classified as investments. The University maintains operating cash and reserves for replacement balances in financial institutions which, from time to time, may exceed federally insured limits. The University periodically assesses the financial condition of these institutions and believes that the risk of loss is minimal.
Operating Investments
Operating investments are stated at fair value and include all other current investments with original maturities greater than 90 days that are used to support operations. These investments may include obligations of triple A-rated banks, various United States Government agencies, other investments, and internal operating funds invested in the University’s investment pool. Although the pool primarily invests in mid- to long-term investments, the pool maintains a sufficient investment mix that allows operating assets to be liquidated upon demand.
Investments
Investments are made within guidelines authorized by the University’s Board of Trustees (“the Board”). Investments are initially recorded at cost at date of acquisition or fair value at date of donation in the case of gifts.
Ownership of marketable securities is recognized as of the trade date. Endowment returns are calculated net of internal and external investment management expenses.
Investments are stated at fair value as defined by Accounting Standards Codification (“ASC”) 820, “Fair Value Measurements and Disclosures.” Fair value is defined under ASC 820 as the exchange price that would be
received for an asset or paid to transfer a liability, i.e., an exit price, in the principal or most advantageous market for the asset or liability in an orderly transaction between market participants on the measurement date.
The fair value of all debt and equity securities with readily determinable fair values are based on quotations obtained from national securities exchanges. The alternative investments, which are not readily marketable, are carried at estimated fair values as provided by the investment managers. The University reviews and evaluates the values provided by the investment managers including the valuation methods and assumptions used in determining the fair value of the alternative investments. Those estimated fair values may differ significantly from the values that would have been used had a ready market for these securities existed.
Realized gains and losses on investments are included in Investment (loss) income. Average cost is generally used to determine gains or losses on securities sold. Unrealized changes in the fair value of investments are shown as net unrealized appreciation or depreciation.
The following describes the hierarchy of inputs used to measure fair value and the primary valuation methodologies used by the University for financial instruments measured at fair value on a recurring basis (Note 7). The three levels of inputs are as follows:
Level 1 — Quoted unadjusted prices in active markets for identical assets or liabilities. An active market is one in which transactions occur with sufficient frequency and volume to produce pricing information on an ongoing basis. Market price data are generally obtained from exchange or dealer markets.
Level 2 — Pricing inputs other than Level 1 that are observable, either directly or indirectly, such as quoted prices for similar assets or liabilities; quoted prices in markets that are not active; or other inputs that are observable or can be corroborated by observable market data for substantially the same term of the assets or liabilities. Inputs are obtained from various sources including market participants, dealers and brokers.
Level 3 — Unobservable inputs that are supported by little or no market activity and that are significant to the fair value of the assets or liabilities.

16 | NOTES TO THE FINANCIAL STATEMENTS - in thousands of dollars
Collections
The University’s collections of historically significant artifacts, scientific specimens, and art objects are held for education, research, scientific inquiry, and public exhibition. They are neither disposed of for financial gain nor encumbered in any manner. Accordingly, their value is not reflected in the University’s financial statements.
Funds Held in Trust by Others
Funds held in trust by others are assets held and administered by outside trustees from which the University derives income or residual interest. Funds held in trust by others are reported at their fair value as of June 30, 2019 and 2018.
Income received from funds held in trust by others is classified as net assets with donor restrictions until those amounts are appropriated and expended by the University. Income appropriated within the same year earned/received is classified as without donor restrictions. Unrealized changes in the fair value of investments are shown as net unrealized appreciation or depreciation in net assets with donor restrictions.
Certain reclassifications and revisions have been made to the prior year’s financial statements to enhance comparability with the current year’s financial statements and to correct the reporting of funds held in trust by others. The University derecognized a number of funds held in trust by others with a market value of $42,849 as of June 30, 2017, affecting the beginning value of net assets with donor restrictions for the fiscal year ended June 30, 2018. It was determined that the community foundation holding the funds has ultimate variance power and therefore right to ownership of the assets. As a result, certain line items have been revised in the statements of financial position, statement of activities, statements of cash flows and the related notes to the financial statements. Comparative figures have been adjusted to conform to the current year’s presentation. The impact of these changes are not considered material to the financial statements.
Health Education Campus The University currently has shared interests in the Health Education Campus (“HEC”) with the Cleveland Clinic Foundation (“CCF”). Commencing in fiscal year 2014, the University and CCF began a joint effort to raise funds for the construction of the HEC project estimated
to be approximately $515,000 (Note 11). The University has pledges receivable of $40,645 for the HEC project as of June 30, 2019. Occupancy of the HEC, which includes an academic building and separate dental clinic, began in spring 2019 and the University’s basis, determined on cash transfers toward the HEC project, was $59,890 (2019) and $46,120 (2018), respectively. Upon the completion of fundraising and final funding of the project, the parties are committed to joint ownership of the above described properties.
Fixed Assets
When capital assets are sold or disposed, the carrying value of such assets and any accumulated depreciation are removed from the asset accounts. Any resulting gain or loss on disposal is recognized in the non-operating portion of the statement of activities.
Expenditures for construction-in-progress are capitalized as incurred and depreciated over the estimated life of the asset when placed into service. All identifiable direct costs including other costs incurred to ready the asset for its intended use are included in the cost of the project. The University capitalizes interest on borrowings to finance facilities, net of any investment income earned through the temporary investment of project borrowings, during construction until the project has been substantially completed.
Split-Interest Agreements
The University has split-interest agreements consisting primarily of pooled income funds, charitable gift annuities and charitable remainder unitrusts and annuities. Contributions are recognized at the date the trusts and annuities are established, net of a liability for the present value of the estimated future cash outflows to beneficiaries, using a discount rate of 2.4% and 2.9% for June 30, 2019 and 2018, respectively. These assets are invested and payments are made to donors and beneficiaries in accordance with the respective agreements.
Allocation of Certain Expenses
The statement of activities presents expenses by function. Some expenses — such as depreciation, amortization, and expenses related to the operation of the physical plant — are allocated by square footage. Interest expense is allocated to the functions that derive

CASE WESTERN RESERVE UNIVERSITY FY19 FINANCIAL REPORT | 17
the greatest benefit from the facilities financed (Note 14).
Retirement Plans
The University accounts for its defined benefit postretirement plan in accordance with ASC 715, “Compensation - Retirement Benefits.” The University recognizes the overfunded or underfunded status of a defined benefit postretirement plan as an asset or liability in its statements of financial position in the year in which the change occurs, with an offsetting impact to net assets without donor restriction.
Use of Estimates
Financial statements using U.S. GAAP rely on estimates. At June 30, management makes certain estimates and assumptions, which affect assets and liabilities, disclosures of contingent assets and liabilities, and reported revenues and expenses during the period. Actual results may differ from these estimates.
Income Taxes
The University is exempt from federal income tax to the extent provided under section 501(c) (3) of the Internal Revenue Code (“IRC”). The University is classified as an organization that is not a private foundation under section 509(a) of the IRC, and as such, gifts to the University qualify for deduction as charitable contributions. The University is exempt from federal income tax; however, it is required to pay federal income tax on unrelated business income. The University did not have any material income tax liabilities for the years ended June 30, 2019 and 2018. ASC 740, “Income Taxes,” prescribes a recognition threshold and measurement requirements for financial statement recognition and measurement of a tax position taken or expected to be taken in a tax return. In addition, ASC 740 provides guidance on recognition, classification and disclosure requirements for uncertain tax provisions. The University has no financial reporting requirements associated with ASC 740 for the years ended June 30, 2019 and 2018.
Revenue Recognition
During the year ended June 30, 2019, the University implemented Accounting Standard Update (“ASU”) 2014-09: “Revenue from Contracts with Customers (Topic 606),” which allows users of financial statements to understand the nature, amount, timing, and uncertainty of revenues and cash flows arising from contracts with customers. The University applied the
modified retrospective method for implementation, applying the guidance to all contracts at the date of initial application resulting in no material changes to the presentation of financial statement line items. This standard, which was the conclusion of a joint effort with the International Accounting Standards Board to create common revenue recognition guidance for U.S. GAAP and international accounting standards, is effective for fiscal years beginning after December 15, 2017, and has been adopted by the University in the current fiscal year. This framework ensures that entities appropriately reflect the consideration to which they expect to be entitled in exchange for goods and services by allocating transaction price to identified performance obligations and recognizing revenue as performance obligations are satisfied. Significant judgments, such as the timing of satisfaction of performance obligation and associated transaction prices, may be required in the recognition of revenue, and certain economic factors, such as varying student class sizes, may affect revenue recognized in future years. Student tuition and fees are recorded as revenues during the year the related academic services are provided and are displayed net of student aid on the statement of activities. Student tuition and fees received in advance of services provided are recorded as deferred revenue. The University’s significant revenue sources, shown in disaggregated form, for the fiscal years ended June 30, 2019 and 2018 are as follows:
2019 2018
STUDENT TUITION AND FEES
Undergraduate tuition $ 241,295 $ 227,427
Less: Student aid (124,157) (117,358)
117,138 110,069
Graduate and professional tuition 242,020 236,677
Less: Student aid (66,105) (64,234)
175,915 172,443
Fees 7,650 6,766
TOTAL NET STUDENT TUITION AND FEES $ 300,703 $ 289,278
AUXILIARY SERVICES REVENUE
Food services $ 18,198 $ 16,432
Housing and greek life 41,035 39,912
Health services 5,914 5,791
Parking 5,990 6,410
Other 4,630 4,100
TOTAL AUXILIARY SERVICES REVENUES $ 75,767 $ 72,645
Reclassifications
Certain amounts in the 2018 financial statements have been reclassified to conform to the 2019 presentation.
18 | NOTES TO THE FINANCIAL STATEMENTS - in thousands of dollars
New Pronouncements
In February 2016, the FASB issued ASU 2016-02: “Leases (Topic 842),” which increases transparency and comparability among organizations by recognizing lease assets and lease liabilities on the statements of financial position and disclosing key information about leasing arrangements. This standard requires the recognition of lease assets and lease liabilities by lessees for those leases previously classified as operating leases. The standard is effective for fiscal years beginning after December 15, 2018. The University is evaluating the impact this will have on the financial statements for the fiscal year ending June 30, 2020, the first year in which the standard is effective.
In August 2016, the FASB issued ASU 2016-14: “Presentation of Financial Statements of Not-for-Profit Entities,” which simplifies and improves how a not-for-profit entity classifies net assets and presents and discloses information related to liquidity, financial performance, and cash flows in financial statements. The standard is effective for the fiscal years beginning after December 15, 2017, and has been adopted by the University in the current fiscal year.
In August 2016, the FASB issued ASU 2016-15: “Statement of Cash Flows (Topic 230): Classification of Certain Cash Receipts and Cash Payments,” which attempts to eliminate the diversity in practice in how certain cash receipts and cash payments are presented and classified in the statement of cash flows. This includes debt prepayment or debt extinguishment costs, certain contingent consideration payments and proceeds from the settlement of insurance claims, among others. The standard is effective for fiscal years beginning after December 15, 2018. The University is evaluating the impact this will have on the financial statements for the fiscal year ending June 30, 2020, the first year in which the standard is effective.
In November 2016, the FASB issued ASU 2016-18: “Statement of Cash Flows (Topic 230): Restricted Cash,” which requires amounts generally described as restricted cash and restricted cash equivalents to be included with cash and cash equivalents when reconciling the beginning-of-period and end-of-period total amounts shown on the statement of cash flows. The standard is effective for fiscal years beginning after December 15, 2018. The University is evaluating the impact this will have on the financial statements for the fiscal year ending June 30, 2020, the first year in which the standard is effective.
In March 2017, the FASB issued ASU 2017-07: “Compensation – Retirement Benefits (Topic 715): Improving the Presentation of Net Periodic Pension Cost and Net Periodic Postretirement Benefit Cost,” which requires an employer report the service cost component in the same line item or items as other compensation costs arising from services rendered by the pertinent employees during the period, among other improvements to benefit cost presentation. The standard is effective for fiscal years beginning after December 15, 2018. The University is evaluating the impact this will have on the financial statements for the fiscal year ending June 30, 2020, the first year in which the standard is effective.
In March 2017, the FASB issued ASU 2017-08: “Receivables – Nonrefundable Fees and Other Costs (Subtopic 310-20): Premium Amortization on Purchased Callable Debt Securities,” which shortens the amortization period of premiums on certain purchased callable debt securities to the earliest call date. The standard is effective for fiscal years beginning after December 15, 2019. The University is evaluating the impact this will have on the financial statements for the fiscal year ending June 30, 2021, the first year in which the standard is effective.
In August 2017, the FASB issued ASU 2017-12: “Targeted Improvements to Accounting for Hedging Activities,” which improves the financial reporting of hedging relationships to better portray the economic results of an entity’s risk management activities in its financialstatements. The standard is effective for fiscal years beginning after December 15, 2019. The University is evaluating the impact this will have on the financial statements for the fiscal year ending June 30, 2021, the first year in which the standard is effective.
In June 2018, the FASB issued ASU 2018-08: “Clarifying the Scope and the Accounting Guidance for Contributions Received and Contributions Made,” which will assist entities in evaluating whether transactions should be accounted for as contributions or as exchange transactions as well as determining whether a contribution is conditional. The standard is effective for fiscal years beginning after June 15, 2018, and has been adopted by the University in the current fiscal year.
In August 2018, the FASB issued ASU 2018-13: “Fair Value Measurement (Topic 820): Disclosure Framework - Changes to the Disclosure Requirements for Fair Value Measurement,” which modifies the disclosure

CASE WESTERN RESERVE UNIVERSITY FY19 FINANCIAL REPORT | 19
2. LIQUIDITY
The University manages its financial assets and liquidity resources in order to provide cash for payment of general expenditures, such as operating expenses, construction costs, and obligations related to debt. Financial assets classified below as available for general expenditure within one year are those that are considered both convertible to cash and free of donor-
imposed and/or contractual restrictions that would limit or prevent the use of such cash to fund general expenditures.
As of June 30, 2019, the University’s financial assets and liquidity resources available for general expenditure within one year are as follows:
2019FINANCIAL ASSETS AVAILABLE WITHIN ONE YEAR:
Cash and cash equivalents $ 80,586
Operating investments 56,193
Accounts and notes receivable, net 55,949
Expected pledge payments available for operations 11,453
Other assets 857
Fiscal year 2020 pooled endowment and similar funds spending allocation 67,100
Total 272,138
LIQUIDITY RESOURCES:
Committed lines of credit 100,000
Less: current borrowings under lines of credit (37,000)
Total 63,000
TOTAL FINANCIAL ASSETS AND LIQUIDITY RESOURCES AVAILABLE WITHIN ONE YEAR $ 335,138
Additionally, the University has Board-designated funds of $199,474, including a liquidity reserve of $122,210, as of June 30, 2019. Although the University does not intend to spend from these investment funds, other than amounts appropriated by the Board for fiscal year 2020, amounts from its Board-designated funds could be made available if necessary.
In addition to the financial assets above, a significant
portion of the University’s annual expenditures will be funded by current year operating revenues including tuition, grant and contract income and auxiliary services income. The University’s cash flows have seasonal variations during the year primarily attributable to student billings and the concentration of contributions received at calendar and fiscal year ends. As part of the University’s liquidity management, the University invests
requirements on fair value measurements in Topic 820, including disclosure related to Level 3 investments. The standard is effective for fiscal years beginning after December 15, 2019. The University is evaluating the impact this will have on the financial statements for the fiscal year ending June 30, 2021, the first year in which the standard is effective.
In August 2018, the FASB issued ASU 2018-14: “Compensation - Defined Benefit Plans (Subtopic 715-20): Disclosure Framework - Changes to the Disclosure Requirements for Defined Benefit Plans,” which modifies the disclosure requirements for employers that sponsor defined benefit pension or other postretirement plans, including disclosures related to plan cost and timing. The standard is effective for fiscal years ending after
December 15, 2021. The University is evaluating the impact this will have on the financial statements for the fiscal year ending June 30, 2022, the first year in which the standard is effective.
In March 2019, the FASB issued ASU 2019-03: “Not-for-Profit Entities (Topic 958): Updating the Definition of Collections,” which modifies the definition of the term collections and requires that a collection-holding entity disclose its policy for the use of proceeds from when collected items are deaccessioned. The standard is effective for fiscal years beginning after December 15, 2019. The University is evaluating the impact this will have on the financial statements for the fiscal year ending June 30, 2021, the first year in which the standard is effective.

20 | NOTES TO THE FINANCIAL STATEMENTS - in thousands of dollars
Management regularly assesses the adequacy of the allowance for doubtful accounts by performing ongoing evaluations of the various components of the accounts receivable and student loan portfolios, including such factors as the differing economic risks associated with each category, the financial condition of specific
3. ACCOUNTS AND LOANS RECEIVABLE
Accounts and loans receivable of the University at June 30, 2019 and 2018 were as follows:
borrowers, the economic environment in which the borrowers operate, the level of delinquent loans, and the past history of the various borrowers and the University.
Factors also considered by management when performing its assessment, in addition to general economic conditions and the other factors described above, included, but were not limited to, a detailed review of the aging of the various receivables and loans, and a review of the default rate by loan category in comparison to prior years. The level of the allowance is adjusted based on the results of management’s analysis.
Management considers the allowance for doubtful accounts to be prudent and reasonable. Furthermore, the University’s allowance is general in nature and is available to absorb losses from any loan category. Management believes that the allowance for doubtful accounts at June 30, 2019 is adequate to absorb credit losses inherent in the portfolio as of that date.
2019 2018ACCOUNTS RECEIVABLE, NET
Grants, contracts and others $ 54,929 $ 47,943
Students 1,677 2,096
STUDENT LOANS, NET 47,344 50,519
ACCOUNTS AND LOANS RECEIVABLE, NET$ 103,950 $ 100,558
ALLOWANCE FOR DOUBTFUL ACCOUNTS:
Accounts receivable $ 5,941 $ 4,945
Loans receivable $ 1,632 $ 2,067
4. PLEDGES RECEIVABLE
Unconditional promises to give are included in the financial statements as pledges receivable and revenue of the appropriate net asset category. Multi-year pledges are recorded after discounting based on the market rate to the present value of expected future cash flows. The discount rate utilized for fiscal 2019 and 2018 was 5%.
Unconditional promises to give at June 30, 2019 and 2018 are expected to be realized in the following periods:
2019 2018
Less than one year $ 51,719 $ 49,046
Between one year and five years 124,822 103,958
More than five years 17,237 17,696
193,778 170,700
Less: Discount (10,782) (10,994)
Less: Allowance (18,740) (12,905)
TOTAL PLEDGES RECEIVABLE, NET $ 164,256 $ 146,801
Management follows a similar approach as described in Note 3 for accounts and loans receivable in evaluating
the adequacy of the allowance for doubtful accounts for pledges receivable. Management considers the allowance for doubtful accounts to be prudent and reasonable. Management believes that the allowance for doubtful accounts at June 30, 2019 is adequate to absorb any uncollectible pledges as of that date.
Pledges receivable at June 30, 2019 and 2018 had the following restrictions:
2019 2018
Department programs and activities $ 50,594 $ 44,748
Endowments for scholarships and
department programs and activities 62,282 39,946
Building construction 51,380 62,107
TOTAL PLEDGES RECEIVABLE, NET $ 164,256 $ 146,801
Uncollectible pledges totaling $5,203 (2019) and $6,141 (2018) were written off against the allowance for uncollectible pledges. The University had conditional pledge commitments totaling $17,616 (2019) and $19,321 (2018).
cash in excess of daily requirements in various short-term investment instruments.
Under the University’s cash management policies, cash received from endowment spending related to either funds functioning as endowment or donor-restricted
endowments is available for general expenditure. Endowment spending distributed from donor-restricted endowments is reflected in the University’s net assets with donor restrictions until the expenditures actually are incurred; such expenditures are funded by available liquidity resources at the time they are paid.

CASE WESTERN RESERVE UNIVERSITY FY19 FINANCIAL REPORT | 21
5. LONG-TERM INVESTMENTS
The University holds long-term investments for endowment funds with donor restrictions, donor-restricted funds, annuity assets, Board-designated funds and excess operating assets that are able to be invested in longer term investments.
The University invests through traditional investments as well as operating an investment pool that works similar to a mutual fund (Note 6). The University’s long-term investments at June 30, 2019 and 2018 were as follows:
2019 2018
Equity securities $ 428,165 $ 508,910
Fixed-income securities 175,299 287,611
Derivatives 94,816
Limited partnerships and Other
Venture capital 30,432 115,416
Private equity 542,334 255,038
Real estate 39,040 69,090
Absolute return 480,811 335,300
Other 70,786 36,397
Equity real estate 81 81
TOTAL INVESTMENTS $ 1,766,948 $ 1,702,659
2019 2018
Operating investments $ 255,668 $ 238,988
Investments, held for long-term purposes 1,511,280 1,463,671
TOTAL INVESTMENTS $ 1,766,948 $ 1,702,659
6. ENDOWMENT AND SIMILAR FUNDS
Endowment Funds
The purpose of endowment funds is to generate in perpetuity revenue to support specific activities or for general institutional use. Endowments represent only those net assets that are under the control of the University. Gift annuities, interests in funds held in trust by others, and pledges designated for the endowment but not yet received are not considered components of the endowment.
The state of Ohio has enacted legislation that incorporates the provisions outlined in the Uniform Prudent Management of Institutional Funds Act (“UPMIFA”). UPMIFA stipulates that unless directed otherwise in the gift instrument, donor-restricted assets in an endowment fund are restricted assets until appropriated for expenditure by the institution. Accordingly, the following items are recorded as net assets with donor restrictions:
• The original value of initial gifts donated to the
permanent endowment
• The original value of subsequent gifts to the permanent endowment
• For those endowment funds with donor-specified reinvestment provisions, accumulations to the permanent endowment made in accordance with the gift instrument at the time the accumulation is added to the fund
Similar Funds
The Board has designated certain funds to function as endowments and has co-invested as such. Donor purpose-restricted funds were not given to the University with the understanding that the gift amount would be maintained in perpetuity; these funds are classified as net assets with donor restrictions. Even though the Board has elected to treat these funds in the same fashion as an endowment fund, at its option, the Board may elect to change that treatment and spend these

22 | NOTES TO THE FINANCIAL STATEMENTS - in thousands of dollars
funds in accordance with the intentions of the donor, if any, without the constraints of the University endowment spending formula. All other Board-designated funds are classified as net assets without donor restrictions and
include quasi-endowments and a liquidity reserve (Note 15).
The breakdown of these classifications are:
Investment Pool
The Board’s interpretation of its fiduciary responsibilities for endowment and similar funds is to preserve intergenerational equity to the extent possible. This principle holds that future beneficiaries should receive at least the same level of economic support that the current generation enjoys. To that end, investment goals are formulated to earn returns over the long term that equal or exceed the Board-approved distribution rates plus the impacts of inflation. The University’s endowment and similar funds are invested in a broadly diversified portfolio designed to produce long-term rates of return that sustain or increase the real spending contribution from endowed and similar assets and to mitigate downturns in a single sector.
Unless otherwise directed in the gift instrument, both endowment and similar funds are pooled for efficient investment purposes.
The pool is accounted for on a dollarized method of accounting similar to a money market fund and accounted for on an account basis. The total investment return for the pooled investments, net of external manager fees, approximated 6.04% (2019) and 9.15% (2018).
Spending Policy The Board has approved an endowment spending policy for pooled investments based on a rolling ten-year average methodology. This approach takes into
consideration the long-term effect of total return, spending, university support and inflation. The objective of this approach is to provide support for operations, preserve intergenerational equity, and insulate programming supported by endowment and similar funds from short-term fluctuations in the investment markets.
Specific appropriation for expenditure of funds under the policy occurs each spring when the Board approves the operating budget for the following year. The fiscal year 2019 and 2018 pooled endowment and similar funds spending allocation approved by the Investment Committee of the Board were $61,900 and $58,900, respectively. The approved spending rate for fiscal year 2019 and 2018 were 4.60% and 4.75% of beginning market value, respectively. The total amount allocated was $62,732 and $59,422, respectively.
While the policy provides guidance for the level of spending permitted (allocation), the actual spending will vary from the spending allocation based on the timing of actual expenditures. Funds are transferred from the investment pool to the University’s operating account after they have been spent in accordance with the endowment and similar funds requirements. The actual movement of cash and investments between the investment pool and operating accounts occurs on a periodic basis as determined by the University and its processes to maintain the proper balance between liquidity and the remaining invested.
For years where actual investment return exceeds
Without DonorRestrictions
With DonorRestrictions TotalJune 30, 2019
Endowments $ 1,198,275 $ 1,198,275 Purpose-restricted funds functioning as endowments 292,772 292,772Board-designated funds $ 77,264 77,264 TOTAL ENDOWMENT AND SIMILAR FUNDS $ 77,264 $ 1,491,047 $ 1,568,311
Without DonorRestrictions
With DonorRestrictions TotalJune 30, 2018
Endowments $ 1,173,633 $ 1,173,633 Purpose-restricted funds functioning as endowments 291,863 291,863 Board-designated funds $ 73,806 73,806 TOTAL ENDOWMENT AND SIMILAR FUNDS $ 73,806 $ 1,465,496 $ 1,539,302
CASE WESTERN RESERVE UNIVERSITY FY19 FINANCIAL REPORT | 23
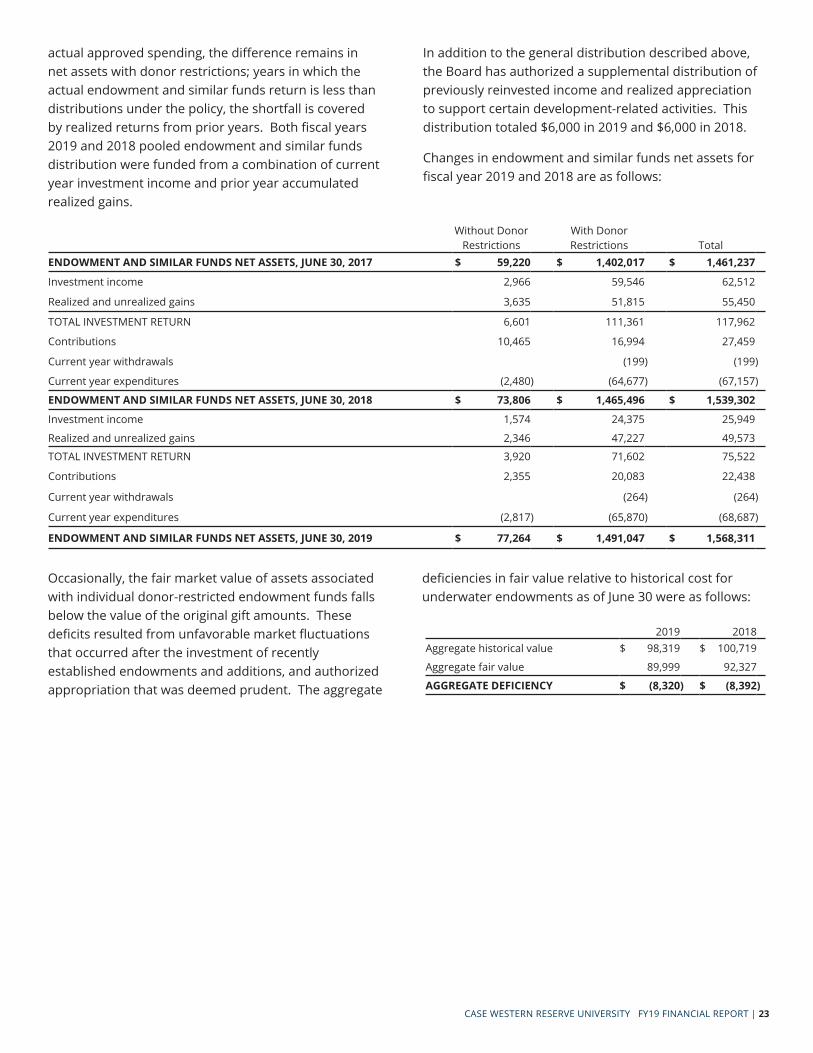
actual approved spending, the difference remains in net assets with donor restrictions; years in which the actual endowment and similar funds return is less than distributions under the policy, the shortfall is covered by realized returns from prior years. Both fiscal years 2019 and 2018 pooled endowment and similar funds distribution were funded from a combination of current year investment income and prior year accumulated realized gains.
In addition to the general distribution described above, the Board has authorized a supplemental distribution of previously reinvested income and realized appreciation to support certain development-related activities. This distribution totaled $6,000 in 2019 and $6,000 in 2018.
Changes in endowment and similar funds net assets for fiscal year 2019 and 2018 are as follows:
Occasionally, the fair market value of assets associated with individual donor-restricted endowment funds falls below the value of the original gift amounts. These deficits resulted from unfavorable market fluctuations that occurred after the investment of recently established endowments and additions, and authorized appropriation that was deemed prudent. The aggregate
deficiencies in fair value relative to historical cost for underwater endowments as of June 30 were as follows:
2019 2018Aggregate historical value $ 98,319 $ 100,719
Aggregate fair value 89,999 92,327
AGGREGATE DEFICIENCY $ (8,320 ) $ (8,392)
Without Donor Restrictions
With Donor Restrictions Total
ENDOWMENT AND SIMILAR FUNDS NET ASSETS, JUNE 30, 2017 $ 59,220 $ 1,402,017 $ 1,461,237
Investment income 2,966 59,546 62,512
Realized and unrealized gains 3,635 51,815 55,450
TOTAL INVESTMENT RETURN 6,601 111,361 117,962
Contributions 10,465 16,994 27,459
Current year withdrawals (199) (199)
Current year expenditures (2,480) (64,677) (67,157)
ENDOWMENT AND SIMILAR FUNDS NET ASSETS, JUNE 30, 2018 $ 73,806 $ 1,465,496 $ 1,539,302
Investment income 1,574 24,375 25,949
Realized and unrealized gains 2,346 47,227 49,573
TOTAL INVESTMENT RETURN 3,920 71,602 75,522
Contributions 2,355 20,083 22,438
Current year withdrawals (264) (264)
Current year expenditures (2,817) (65,870) (68,687)
ENDOWMENT AND SIMILAR FUNDS NET ASSETS, JUNE 30, 2019 $ 77,264 $ 1,491,047 $ 1,568,311

24 | NOTES TO THE FINANCIAL STATEMENTS - in thousands of dollars
7. FAIR VALUE MEASUREMENTS
Financial instruments carried at fair market value as of June 30, 2019 and 2018 by the ASC 820 valuation hierarchy are as follows:
June 30, 2019
Quoted Pricesin ActiveMarkets(Level 1)
SignificantOther
ObservableInputs
(Level 2)
SignificantUnobservable
Inputs(Level 3)
NetAssetValue Total
INVESTMENTS
Equity securities $ 157,924 $ 54 $ 270,187 $ 428,165
Fixed-income securities 44,066 131,233 175,299
Limited partnerships and Other
Venture capital 30,432 30,432
Private equity $ 34,439 507,895 542,334
Real estate 39,040 39,040
Absolute return 480,811 480,811
Other 37,161 33,625 70,786
Equity real estate 81 81
TOTAL INVESTMENTS $ 201,990 $ 131,287 $ 71,681 $ 1,361,990 $ 1,766,948
FUNDS HELD IN TRUST BY OTHERS $ - $ - $ 298,189 $ - $ 298,189
PENSION PLAN ASSETS
Cash and cash equivalents $ 6,161 $ 6,161
Equity securities 83,453 83,453
Fixed-income securities 34,130 $ 2,826 36,956
Limited partnerships and Other
Absolute return $ 32,827 32,827
Other 11,400 11,400
Equity real estate 9,506 9,506
TOTAL PENSION PLAN ASSETS (Note 10) $ 123,744 $ 2,826 $ - $ 53,733 $ 180,303
ASSETS AT FAIR VALUE $ 325,734 $ 134,113 $ 369,870 $ 1,415,723 $ 2,245,440
Interest rate swaps payable (Note 13) $ - $ 13,602 $ - $ - $ 13,602
LIABILITIES AT FAIR VALUE $ - $ 13,602 $ - $ - $ 13,602

CASE WESTERN RESERVE UNIVERSITY FY19 FINANCIAL REPORT | 25
June 30, 2018
Quoted Pricesin ActiveMarkets(Level 1)
SignificantOther
ObservableInputs
(Level 2)
SignificantUnobservable
Inputs(Level 3)
NetAssetValue Total
INVESTMENTS
Equity securities $ 43,323 $ 45,099 $ 420,488 $ 508,910
Fixed-income securities 159,933 127,678 287,611
Derivatives 94,816 94,816
Limited partnerships and Other
Venture capital $ 16,745 98,671 115,416
Private equity 4,332 250,706 255,038
Real estate 69,090 69,090
Absolute return 6,286 329,014 335,300
Other 42 36,355 36,397
Equity real estate 81 81
TOTAL INVESTMENTS $ 203,256 $ 273,921 $ 57,513 $ 1,167,969 $ 1,702,659
FUNDS HELD IN TRUST BY OTHERS $ - $ - $ 303,597 $ - $ 303,597
PENSION PLAN ASSETS
Cash and cash equivalents $ 4,394 $ 4,394
Equity securities 70,951 70,951
Fixed-income securities 23,525 $ 8,947 32,472
Limited partnerships and Other
Absolute Return $ 42,854 42,854
Other 8,540 8,540
Equity real estate 9,031 9,031
TOTAL PENSION PLAN ASSETS (Note 10) $ 98,870 $ 8,947 $ - $ 60,425 $ 168,242
ASSETS AT FAIR VALUE $ 302,126 $ 282,868 $ 361,110 $ 1,228,394 $ 2,174,498
Interest rate swaps payable (Note 13) $ - $ 10,671 $ - $ - $ 10,671
LIABILITIES AT FAIR VALUE $ - $ 10,671 $ - $ - $ 10,671

26 | NOTES TO THE FINANCIAL STATEMENTS - in thousands of dollars
Level 3 Investment Information
Investments included in Level 3 consist primarily of the University’s ownership in alternative investments (principally limited partnership interests in venture capital, private equity, equity real estate, real assets and other similar funds), and beneficial interests in funds held in trust by others. Level 3 investments are more difficult to value due to the following:
• The fair values of the securities held by limited partnerships that do not have readily determinable fair values are determined by the general partner based on appraisals or other estimates that require varying degrees of judgment.
• If no public market consideration exists, the fair value is determined by the general partner taking into consideration, among other things, the cost of
the securities, prices of recent significant placements of securities of the same issuer, subsequent developments concerning the companies to which the securities relate, or other estimates requiring varying degrees of judgment. The University regularly reviews, evaluates and performs significant due diligence around these investments to ensure that the values provided by the investment managers are appropriate measures of fair value. The University agrees with the valuations and assumptions used in determining the fair value of these investments.
A roll forward of the statements of financial position amounts for financial instruments classified by the University within Level 3 of the fair value hierarchy is as follows:
The net realized and unrealized gains and losses in the table above are included in the University’s statement of activities in one of two financial statement lines: Investment (loss) income or Net appreciation.
The pricing inputs and methods described above could produce a fair value calculation that may not be indicative of net realizable value or reflective of future fair values. Furthermore, while the University believes its valuation methods are appropriate and consistent with other market participants, the use of different methodologies or assumptions to determine the fair value of certain financial instruments could result in a different estimate of fair value at the reporting date.
The University is permitted under U.S. GAAP to estimate the fair value of an investment at the measurement
date using the reported net asset value (“NAV”) without further adjustment unless the entity expects to sell the investment at a value other than NAV or if the NAV is not calculated in accordance with U.S. GAAP. The University’s investments in equity securities, certain venture capital, certain private equity, real estate and certain hedge funds in the absolute return portfolio are fair value based on the most current NAV.
The University performs additional procedures including due diligence reviews on its investments in investment companies and other procedures with respect to the capital account or NAV provided to ensure conformity with U.S. GAAP. The University has assessed factors including, but not limited to, managers’ compliance with the Fair Value Measurement standard, price transparency at NAV at the measurement date, and existence of certain
VentureCapital
PrivateEquity
EquityReal Estate
Other &Funds Heldby Others Total
June 30, 2017 $ 15,952 $ 4,127 $ 81 $ 331,098 $ 351,258
Investment loss (3) (1) (12) (16)
Unrealized gains 1,524 395 9,219 11,138
Purchases 82 21 103
Settlements (810) (210) (353) (1,373)
June 30, 2018 $ 16,745 $ 4,332 $ 81 $ 339,952 $ 361,110 Investment income 621 621
Unrealized (losses) gains (22) 2,807 (5,522) (2,737)
Settlements (1,647) (869) (2,516)
Transfers (16,723) 28,947 1,168 13,392
June 30, 2019 $ - $ 34,439 $ 81 $ 335,350 $ 369,870

CASE WESTERN RESERVE UNIVERSITY FY19 FINANCIAL REPORT | 27
(a) Equity securities include funds invested in equity securities domiciled in the United States and countries outside of the United States including developed and emerging markets. Approximately 100% of the net asset value is accessible within one year.
(b) Venture capital includes several private equity funds that invest primarily in technology, health care or clean technology industries. While the portfolio is U.S. centric, there are small allocations to companies in foreign markets. The funds typically provide money and resources to entrepreneurs to finance a start-up company or product, with the hope that the company experiences exceptional growth and therefore would produce a successful investment. The funds invest at different stages of a company’s growth, some very early and others at a later stage where the company may already produce revenues. It is estimated that the underlying investments within the funds would be fully liquidated over the next 7-12 years.
(c) Private equity includes several private equity funds that invest across all industries. While the portfolio is U.S. centric, there has been an increasingly larger allocation to companies in foreign markets. The funds typically invest capital into more mature companies for a minority or majority of ownership and through operational and financial expertise, generate a return of capital greater than the original amount invested. It is estimated that the underlying investments within the funds would be fully liquidated over the next 7-12 years.
(d) Real estate includes private real estate funds that invest primarily in the United States. Some of these private partnerships also make investments internationally, primarily in Europe, India and Brazil.
redemption restrictions at the measurement date.
The guidance also requires additional disclosures to enable users of the financial statements to understand the nature and risk of the University’s investments.
The table below illustrates the fair value of the University’s investments measured at NAV and the commitments that have been made for future purchases:
The private funds make investments in various real estate types, such as office, industrial, retail and multi-family properties. It is estimated that the underlying investments within the funds would be fully liquidated over the next 5-7 years.
(e) Absolute return includes hedge fund investments across a multitude of strategies including long/short equity, long/short commodity, global macro, multi-strategy, event-driven, credit, fund of hedge funds, and emerging markets. The vast majority of these investments are U.S. based, but some may invest internationally. Investment managers may make investment decisions based on top down macro-economic analysis or bottom up company or theme specific analysis; managers may shift portfolios from net long to net short positioning but on balance tend to carry a net long exposure within their portfolios. The estimated fair values of the investments are received on a monthly basis from the fund administrators. Final valuations are typically received around mid-month for most funds, but in some instances funds will report final valuations on a quarterly basis in accordance with the reporting period specified in the fund legal documents. Fund liquidity varies across the absolute return category from monthly, quarterly, annually, and up to a maximum of three years for traditional hedge fund vehicles and 5-10 years for private credit vehicles. Approximately 92% of the net asset value in this asset class is accessible within one year or less and 94% within three years. Over the course of the last twelve months less liquid, private credit funds with 5-10 year hold periods have been added to the portfolio for diversification purposes. This has marginally reduced liquidity in the absolute return asset class but as the private credit funds begin to call more capital portfolio liquidity will be further reduced but still
Category Redemption FrequencyRedemption
Notice Period Fair ValueUnfunded
CommitmentsEquity securities (a) monthly, quarterly, annually 30 - 90 days $ 270,187 Limited partnerships and Other Venture capital (b) 30,432 $ 36,721 Private equity (c) 507,895 138,493 Real estate (d) 39,040 47,867 Absolute return (e) monthly, quarterly, annually 30 - 90 days 513,638 36,650 Other (f) 45,025Equity real estate (g) 9,506
TOTAL $ 1,415,723 $ 259,731

28 | NOTES TO THE FINANCIAL STATEMENTS - in thousands of dollars
maintained at manageable levels.
(f) Other includes various investments that do not fall within the other categories listed. Examples would include liquid multi-asset strategy investments.
(g) Equity real estate includes liquid real estate securities and indices domiciled in both the United States and countries outside of the United States including developed and emerging markets.
The valuations for the venture capital, private equity and real estate investments have been estimated using the managers’ fair market values, which have been vetted to make sure they meet the ASC 820 guidelines. These investments can never be redeemed with the funds. As these investments age in duration, distributions will be received from these funds as the underlying properties, and portfolio companies, are sold at the market.
Derivative Information
The use of financial derivative instruments is governed by the University’s Investment Policy Statement, which is approved and overseen by the Investment Committee of the Board. The University assumes many risks as a result of its investment decisions and investment holdings.
The University seeks to mitigate these risks by using derivative transactions. At the macro level of the investment portfolio, derivative transactions also create
cost-effective beta exposure that may replace a fund or investment manager, add alpha, support liquidity management, and reduce the impact of extreme negative market conditions. While the University’s portfolio did not include any derivative instruments as of June 30, 2019 in the comparative year ending June 30, 2018 the derivative instruments used included total return swaps and over-the-counter options.
Total Return Swaps (“TRS”): A TRS is a non-standardized agreement whereby one party makes periodic cash payments based on a set rate (e.g., London Interbank Offered Rate (“LIBOR”)) while another party makes periodic cash payments based on the total return of an underlying index.
Options: Options or Option Structures are non-standardized agreements whereby one party makes or receives one payment at the time of initial transaction to/from a counterparty and may make or receive a second payment to/from the counterparty at the expiration date of the agreement based on an individual option or a combination of individual options.
The following table provides detailed information on the derivatives included in the investment portfolio as of June 30, 2018 and where they are located in the statements of financial position:
2018
Location Derivative TypeNotionalAmount
Level 1 FairValue
Level 2 FairValue
Level 3 FairValue
Investments, held for long-term purposes
Total return swaps $ 100,721 $ 94,736
Options (over-the-counter) 80
TOTAL DERIVATIVES, 2018 $ - $ 94,816 $ -
The following table provides detailed information on the effect the derivatives had on the overall performance
of the investment portfolio which is reflected in the statement of activities:
Location Derivative Type 2019 2018.
Investment income
Total return swaps $ 13,227 $ 39,072.
$ 13,227 $ 39,072. Net appreciation
Total return swaps 2,596.
$ - $ 2,596. NET EFFECT OF DERIVATIVES $ 13,227 $ 41,668.

CASE WESTERN RESERVE UNIVERSITY FY19 FINANCIAL REPORT | 29
8. PROPERTY, PLANT, EQUIPMENT AND BOOKS
Property, plant, equipment and books are stated at cost, less accumulated depreciation. Depreciation is computed on the straight-line method over the estimated useful life of 10 to 30 years for land improvements, 10
to 50 years for building and building improvements, 5 to 15 years for equipment, and 10 years for books. Components of property, plant, equipment and books are as follows:
The above assets include $571,015 leased from the Ohio Higher Educational Facility Commission (“OHEFC”). The University may purchase each of the leased assets for a nominal amount at the end of the lease period. Therefore, these assets have been capitalized and are included in the above listing. The corresponding liability
is included in Notes and bonds payable on the statements of financial position.
The expected cost to complete construction-in-progress was $33,113.
Depreciation expense included in the statement of activities was $65,981 (2019) and $67,880 (2018).
2019 2018
Land and land improvements $ 73,750 $ 72,483
Building and building improvements 1,370,484 1,355,525
Equipment and software 316,242 304,173
Library books 47,575 46,645
Construction-in-progress 58,562 42,453
1,866,613 1,821,279
Less: Accumulated depreciation (1,133,603) (1,078,863)
TOTAL PROPERTY, PLANT, EQUIPMENT AND BOOKS, NET $ 733,010 $ 742,416
9. NOTES AND BONDS PAYABLE
Notes and bonds payable are as follows:
Interest Rate(s) Maturity 2019. 2018
OHEFC revenue notes and bonds1: . .
Fixed-rate bonds: Series 1990 6.50% 2019-2021 $ 4,365 $ 6,300
Series 1994 6.25% 2019 4,745
Series 2006 4.00 - 5.25% 2019-2027 40,340 40,525
Series 2012A 4.00 - 5.00% 2019-2024 15,670 18,880
Series 2013A 4.00 - 5.00% 2020-2024 20,435 20,435
Series 2015A 4.00 - 5.38% 2019-2035 45,375 47,095
Series 2016 3.00 - 5.00% 2019-2041 163,640 166,450
Series 2018 3.00 - 5.00% 2019-2031 88,780 88,780
Variable-rate bonds: Series 2014A 1.77 - 2.11%2 2019 67,500
Series 2019A 2.16 - 2.16%2 2022-2044 68,160
Compass Group USA, Inc. -n/a- 2019 . 263
TOTAL LIABILITY $ 446,765 $ 460,973
Line of credit 37,000 36,000
Unamortized bond premium 32,563 37,705
Unamortized bond issuance cost (3,678) (3,434)
TOTAL NOTES AND BONDS PAYABLE $ 512,650 $ 531,244 1Terms of the respective bonds are disclosed in the year of issuance.
2The OHEFC Series 2014A and 2019A beginning and ending rate - the weighted average is 1.65% and 2.17%, respectively.

30 | NOTES TO THE FINANCIAL STATEMENTS - in thousands of dollars
In May 2018, the OHEFC Series 2018 bonds were issued to refinance the balance of the OHEFC Series 2015B bonds in the amount of $72,630 and OHEFC tax-exempt Commercial Paper in the amount $30,000. Deferred financing fees of $724 were paid and the unamortized balance is a reduction to Notes and bonds payable. The total amount of the bond issue was $103,354.
In May 2018, we paid down the outstanding $30,000 of the OHEFC tax-exempt commercial paper program, which provided construction funds for several approved capital projects. The program was concurrently terminated.
In April 2019, the OHEFC Series 2019A bonds were issued to refinance the balance of the OHEFC Series 2014A bonds in the amount of $67,623. Deferred financing fees of $537 were paid and the unamortized balance is a reduction to Notes and bonds payable. The total amount of the bond issued was $68,160. The earliest optional redemption date for the bond is October 2021.
The University has revolving lines of credit with two financial institutions in the amount of $100,000 to finance working capital. The $25,000 line is subject to review and renewal in September 2019, and the $75,000 in March 2020. The amount outstanding was $37,000 (2019) and $36,000 (2018).
Principal payment requirements for bonds, notes, and capital lease obligations for the next five fiscal years and thereafter are as follows:
YearTotal Scheduled
Principal Payments
2020 $ 52,595
2021 15,375
2022 18,335
2023 45,925
2024 44,520
Thereafter 307,015
TOTAL $ 483,765
Amounts expected to be paid between 2025 and 2029 total $62,259. The University’s estimated employer contribution for the defined benefit plan in fiscal 2020 will depend on the results of the July 1, 2019 actuarial valuation and is estimated to be $14,724.
Weighted-average assumptions used to determine the benefit obligation and benefit plan costs are as follows:
Estimated benefits expected to be paid under the defined benefit plan for the next five fiscal years are as follows:
2020 $ 7,154
2021 7,636
2022 8,430
2023 9,022
2024 10,012
10. RETIREMENT PLANS
The University has both defined benefit and defined contribution pension plans for its employees. In accordance with provisions of the Employee Retirement Income Security Act of 1974, the University has established a trust to hold plan assets for its defined benefit plan. The funded status of the University’s defined benefit plan is as follows:
Benefit plan costs for the defined benefit plan are as follows:
2019 2018
Net periodic benefit cost $ 12,675 $ 14,321
Employer contributions 15,836 14,223
Benefits paid 6,575 6,998
2019 2018.Funded status at June 30 of prior fiscal year
$ (89,893) $ (101,817)
Service cost (9,192) (10,424)
Interest cost (11,370) (10,682)
Expected return on assets 13,169 12,868.
Actuarial (loss) gain (22,742) 5,939.
Employer contributions 15,836 14,223.
FUNDED STATUS AT JUNE 30 $ (104,192) $ (89,893)
Accumulated benefit obligation $ 283,289 $ 256,998.
2019 2018
BENEFIT OBLIGATION
Discount rate 3.90% 4.35%
Rate of compensation increase 2.25% 2.25%
Measurement date 6/30/19 6/30/18
Census date 7/1/18 7/1/17
NET PERIODIC BENEFIT COST
Discount rate 4.35% 4.10%
Expected return on plan assets 7.50% 7.50%
Rate of compensation increase 2.25% 2.25%

CASE WESTERN RESERVE UNIVERSITY FY19 FINANCIAL REPORT | 31
The expected long-term rate of return for the defined benefit plan was estimated using market benchmarks for equities and bonds applied to the plan’s target asset allocation. Management estimated the rate by which the plan assets would outperform the market in the future based on historical experience adjusted for changes in asset allocation and expectations compared to past periods.
The investment objective for the defined benefit plan is to maximize total return with tolerance for slightly above average risk, in order to meet the obligations that the University has to its plan beneficiaries. To accomplish this objective, the University has established a broadly-diversified asset allocation strategy that includes absolute return strategies (combination of fixed income and equity securities) (50%), equity investments (30%), bonds and cash (16%), and real estate (4%). The weightings of the investments relative to each other in the total portfolio fluctuate as market conditions vary; they are adjusted regularly to remain within acceptable ranges.
The weighted-average asset allocation for the defined benefit plan is as follows:
2019 2018
Equity securities 46% 42%
Fixed income securities 24% 22%
Real estate 5% 5%
Other 25% 31%
TOTAL ASSET ALLOCATION 100% 100%
The amounts recognized in the University’s statements of financial position and in net assets without donor restrictions related to the defined benefit plan are as follows:
2019 2018
Benefit obligation at June 30 $ 284,495 $ 258,135
Fair value of plan assets at June 30 180,303 168,242
NET LIABILITY $ (104,192) $ (89,893)
NET ASSETS WITHOUT DONOR RESTRICTIONS
Accumulated actuarial losses 110,136 92,676
AMOUNT RECOGNIZED AS REDUCTIONOF NET ASSETS WITHOUT DONOR RESTRICTIONS $ 110,136 $ 92,676
The estimated amortization of net loss expected in fiscal 2020 totals $6,704. Components of the net periodic benefit cost and other changes in plan assets that are recognized in the statement of activities are as follows:
2019 2018
Change in actuarial loss (gains) $ 17,460 $ (12,022)
TOTAL LOSS (GAIN) RECOGNIZED,
NET ASSETS WITHOUT DONOR RESTRICTIONS 17,460 (12,022)
Service cost 9,192 10,424
Interest cost 11,370 10,682
Expected return on assets (13,169) (12,868)
Net loss amortization 5,282 6,083
Net periodic benefit cost 12,675 14,321 TOTAL LOSS RECOGNIZED,STATEMENT OF ACTIVITIES $ 30,135 $ 2,299
Benefit plan costs for the defined contribution plan are $23,908 (2019) and $22,884 (2018).
11. COMMITMENTS AND CONTINGENCIES
In its normal operations, the University is subject to various claims and lawsuits. In management’s opinion, the resolution of these contingencies will not have a significant adverse effect on the University’s financial position, operations, or cash flows.
In May 2002, the University entered into an agreement with CCF to form a new medical education and research program, the Cleveland Clinic Lerner College of Medicine (“CCLCM”). Beginning in 2004, research grants from the National Institutes of Health to support work by CCF-based investigators were awarded to and administered through the University by CCLCM, which operates as an academic unit of the School of Medicine. Expenditures for research conducted under this joint agreement totaled $101,612 (2019) and $99,967 (2018).
In April 2006, the Boards of University Hospitals
Health System and the University approved an affiliation agreement between the School of Medicine and University Hospitals of Cleveland (“UHC”). This agreement created the Case Medical Center, a virtual entity that encompasses certain teaching, research, and clinical activities of the School of Medicine and UHC. In September 2016, the affiliation agreement was renewed with the exception of the Case Medical Center designation. Even though the virtual entity will be dissolved, there will be continued collaboration in education and research.
The University and CCF have entered into an agreement with a perpetual term to provide for the development, operation and joint use of the HEC, which includes an academic building and a separate dental clinic. The HEC provides a unified educational space for programs of the School of Medicine, including CCLCM, the School of

32 | NOTES TO THE FINANCIAL STATEMENTS - in thousands of dollars
12. RELATED PARTY TRANSACTIONS
In 1998, the University entered into a thirty-year agreement with the Medical Center Company (a cooperative utility company formed by and serving institutions in the University Circle area) to purchase steam, chilled water, and other utilities for several University buildings. The amounts purchased were $22,026 (2019) and $22,624 (2018). No obligation associated with this agreement is recorded in the accompanying financial statements.
In August 2015, the Medical Center Company approved an energy efficiency grant in the amount of $829, of
which $255 was used. The payback terms related to this project are 36 months beginning March 2016. The obligation related to this project recorded in Deferred income and other liabilities is $80 (2019) and $155 (2018).
In October 2017, the Medical Center Company approved an additional energy efficiency grant in the amount of $1,084. The project costs incurred totaled $0 (2019) and $1,084 (2018). The payback terms related to this project are 36 months beginning December 2018. The obligation related to this project recorded in Deferred income and other liabilities is $873 (2019) and $1,084 (2018).
13. DERIVATIVES
The University uses floating-to-fixed interest rate swap agreements of various durations to manage both its funding cost and the interest rate risk associated with variable rate debt. Under these swap agreements, the University pays a fixed rate and receives from its counterparty a variable rate payment, each calculated by reference to specified notional principal amounts during the agreement period. Operations are charged the variable rate interest on the corresponding bonds; the difference between the fixed and variable interest amounts under the swap agreements is recorded in non-operating revenues and expenses as Investment (loss) income.
The University follows accounting guidance that defines fair value, establishes a framework for measuring fair value, and expands disclosure requirements about fair value measurements, including derivatives. The University’s interest rate swaps are valued by an
independent swap consultant that uses the mid-market levels, as of the close of business, to value the agreements. The valuations provided are derived from proprietary models based upon well-recognized financial principles and reasonable estimates about relevant future market conditions and the University’s credit worthiness. The University’s interest rate swap arrangements have inputs that can generally be corroborated by market data and are classified as Level 2 in the fair value hierarchy. Under four agreements in effect at June 30, 2019, the counterparty pays a variable interest rate equal to a percentage of the one-month LIBOR.
The following table provides detailed information on the interest rate swaps at June 30, 2019, with comparative fair values for June 30, 2018. Information related to the interest rate swap agreements and the liability recognized in the statements of financial position in Deferred income and other liabilities are as follows:
Dental Medicine and the Frances Payne Bolton School of Nursing. Occupancy occurred in spring of 2019. CCF is providing interim funding of construction costs as needed, while the University and CCF are collaborating on fundraising to cover the capital costs of the HEC. In the event that amounts raised by 2020 do not cover the total costs of the HEC, the University has agreed to provide up to $50,000 over a five-year period beginning in 2021.
The University is self-insured for workers compensation and employee and student medical coverage. Property is commercially insured with an aggregate deductible of $700. The University also carries general liability insurance with a deductible of $100 per occurrence. The University believes its reserves for self-insured risks and the deductible portion of insured risks are sufficient.

CASE WESTERN RESERVE UNIVERSITY FY19 FINANCIAL REPORT | 33
Changes in the fair value of derivative instruments are recorded in non-operating revenues and expenses as Investment (loss) income. The provisions of the swap agreements require that on a weekly basis the University place into an escrow fund collateral sufficient to limit the counter-party’s financial exposure to the University to no
more than $20,000. The University had placed $0 (2019 and 2018) into such a fund.
Interest expense recorded for the swap agreements in the non-operating activities for the year ended June 30 was $1,700 (2019) and $2,157 (2018).
Notional Amount Interest Rate Commencement Termination Date Basis
2019 2018 Level 2 Fair Market Value
$ 7,510 4.34% Aug. 12, 2004 Oct. 1, 2022 LIBOR $ (543) $ (589)
15,000 4.43% Jun. 5, 2002 Jun. 5, 2022 LIBOR (1,437) (1,441)
15,000 3.60% Sept. 25, 2002 Sept. 25, 2022 LIBOR (1,180) (1,035)
35,000 3.81% Aug. 4, 2004 Aug. 1, 2034 LIBOR (10,442) (7,606)
TOTAL INTEREST RATE SWAP AGREEMENT LIABILITY $ (13,602) $ (10,671)
14. NATURAL AND FUNCTIONAL CLASSIFICATION OF EXPENSES
Expenses are reported in the statement of activities by functional categories and include allocations of depreciation expense, interest on indebtedness and plant operation and maintenance costs.
Operating expenses by nature and function are summarized as follows for the years ended June 30, 2019 and 2018:
June 30, 2019 InstructionalSponsored
projects LibrariesStudent services
University services Auxiliaries
Total operating expenses
Salaries and wages $ 189,624 $ 140,358 $ 6,259 $ 16,546 $ 51,912 $ 11,442 $ 416,141
Fringe benefits 57,877 36,742 1,863 5,109 16,687 3,586 121,864
Other operating expense 73,798 184,339 4,892 10,567 43,059 29,277 345,932
Allocations
Depreciation 10,639 15,970 7,277 1,397 7,309 23,388 65,980
Interest 1,670 4,303 371 163 1,878 11,113 19,498
Plant operations and maintenance 7,947 12,247 3,154 966 7,373 6,170 37,857
TOTAL $ 341,555 $ 393,959 $ 23,816 $ 34,748 $ 128,218 $ 84,976 $ 1,007,272
June 30, 2018 InstructionalSponsored
projects LibrariesStudent services
University services Auxiliaries
Total operating expenses
Salaries and wages $ 186,953 $ 139,719 $ 6,221 $ 14,736 $ 49,325 $ 11,642 $ 408,596
Fringe benefits 56,238 34,574 1,834 4,556 15,634 3,516 116,352
Other operating expense 69,893 177,941 4,222 11,183 42,487 30,379 336,105
Allocations
Depreciation 9,772 17,572 7,178 1,391 8,175 23,792 67,880
Interest 1,618 4,843 370 115 1,821 8,359 17,126
Plant operations and maintenance 7,404 11,422 2,990 1,139 7,191 5,682 35,828
TOTAL $ 331,878 $ 386,071 $ 22,815 $ 33,120 $ 124,633 $ 83,370 $ 981,887

34 | NOTES TO THE FINANCIAL STATEMENTS - in thousands of dollars
15. NET ASSETS
The University’s net assets as of June 30 were as follows:
2019 2018WITHOUT DONOR RESTRICTIONS
Board-designated:
Quasi-endowments $ 77,264 $ 73,806
Liquidity reserve 122,210 115,787
TOTAL BOARD-DESIGNATED 199,474 189,593
Unrestricted 59,009 52,075
TOTAL NET ASSETS WITHOUT DONOR RESTRICTIONS $ 258,483 $ 241,668
WITH DONOR RESTRICTIONS
Endowments $ 1,198,275 $ 1,173,633
Purpose-restricted funds functioning as endowments 292,772 291,863
Pledges receivable 114,819 135,412
Funds held in trust by others 300,947 306,164
Student loan funds 37,700 37,316
Split-interest agreements 15,596 12,132
Purpose-restricted gifts 179,988 155,252
TOTAL NET ASSETS WITH DONOR RESTRICTIONS $ 2,140,097 $ 2,111,772
16. SUBSEQUENT EVENTS
The University has performed an evaluation of subsequent events through October 19, 2019, the date
on which the financial statements were issued.