financial report 2016 - virginaustralia.com · annual financial report for the year ended 30 ......
TRANSCRIPT

ACN: 100 686 226
ANNUALFINANCIALREPORT
2016
Annual financial reportFor the year ended 30 June 2016
ContentsAnnual financial report
Directors’ report 1
Lead auditor’s independence declaration 38
Consolidated financial statements 39
Directors’ declaration 97
Independent auditor’s report 98
ASX additional information 100
Corporate directory 103
This financial report covers the Virgin Australia Holdings Limited Group, consisting of Virgin Australia Holdings Limited and its controlled entities. The financial report is presented in Australian dollars.
Virgin Australia Holdings Limited (VAH) is a company limited by shares, incorporated and domiciled in Australia. Details of its registered office and principal place of business are on page 103.
Through the use of the internet, we have ensured that our corporate reporting is timely, complete and available globally at minimum cost to the Company. All press releases, financial reports and other information are available at our Shareholder Information Centre on our website: www.virginaustralia.com.

A N N U A L F I N A N C I A L R E P O R T 2 0 1 6 1
Directors’ report
The directors present their report together with the consolidated financial statements of the Group comprising Virgin Australia Holdings Limited (VAH) (the Company) and its subsidiaries, and the Group’s interests in associates and joint ventures, for the financial year ended 30 June 2016 and the auditor’s report thereon.
DirectorsThe directors of the Company at any time during or since the end of the financial year are:
Ms Elizabeth Bryan AM (Chairman)Mr John BorghettiMr David BaxbyMs Samantha MostynMr Robert ThomasThe Hon. Mark Vaile AOMr Bruno MatheuMr John Patrick (JP) Moorhead (Alternate Director for Joshua Bayliss to 22 September 2015, appointed as a Director 22 September 2015)Mr Marvin Tan (Alternate Director for Mr Goh Choon Phong to 1 January 2016, appointed as a Director 1 January 2016)
Mr Ulf Huttmeyer (Alternate Director) Mr Pee Teck Tan (Alternate Director) (appointed 1 January 2016)
Mr Joshua Bayliss (ceased 22 September 2015)Mr Goh Choon Phong (ceased 1 January 2016)Mr Christopher Luxon (ceased 30 March 2016)Mr Robert McDonald (Alternate Director) (ceased 30 March 2016)
Details of directors and alternate directors, their qualifications and experience
Ms Elizabeth Bryan – AM, BA (Econ), MA (Econ), Chairman and Independent Non-Executive Director
Ms Elizabeth Bryan was appointed Company Chairman and to the VAH Board on 20 May 2015.
Elizabeth brings extensive leadership, strategic and financial expertise to the Board. She has over 32 years of experience in the financial services industry, government policy and administration, and on the boards of companies and statutory organisations.
Elizabeth is currently a Director of Westpac Banking Corporation and Chairman of Insurance Australia Group. Elizabeth has held a range of different board roles including Chairmanship of UniSuper Limited and Caltex Australia Limited, as well as Directorships of Ridley Corporation Limited and Australia Pacific Airports Corporation.
Mr John Borghetti – Managing Director and Chief Executive Officer
Mr John Borghetti was appointed to the VAH Board as a Director on 8 May 2010.
John has more than 40 years of experience in the aviation sector having previously held a number of senior positions at Qantas, leaving the company in May 2009. John is a Director of Coca-Cola Amatil Limited, the Australian Chamber Orchestra and the New South Wales Customer Advisory Board.
He was previously a Director of CARE Australia (2005-2011), The Australian Ballet (2009-2011), Piper Aircraft (USA) (2009-2010) and Energy Australia (2012-2015).
Mr David Baxby – B.Com (Acct), LLB (Hons), Independent Non-Executive Director
Mr David Baxby was appointed to the VAH Board as a Director on 30 September 2004.
David is the Chairman of Frontier Digital Ventures Limited and a Non-Executive Director of Unlockd Limited, Workpac Limited and Velocity Frequent Flyer Holdco Pty Ltd and its subsidiaries. David is also a Councillor of Bond University Limited. Previously David was the Global CEO and President of Global Blue and the Co-CEO of the Virgin Group, Richard Branson’s holding company. His past Directorships include Virgin Atlantic Ltd, Virgin Holidays Ltd, Virgin America Inc and Air Asia X. David was also an investment banker for nine years with Goldman Sachs.

V I R G I N A U S T R A L I A G R O U P2
Directors’ report (continued)
Directors (continued)Details of directors and alternate directors, their qualifications and experience (continued)
Ms Samantha Mostyn – B.A, LLB., Independent Non-Executive Director
Ms Samantha Mostyn was appointed to the VAH Board as a Director on 1 September 2010.
Samantha is a Non-Executive Director and corporate advisor and has previously held senior executive positions at IAG, Optus and Cable & Wireless Plc. Samantha became a Director of the Transurban Group in December 2010, Citibank Australia in July 2011, Cover-More Group Ltd in December 2013 and Mirvac Group in March 2015. Samantha is a board member of the Australia Council for the Arts, the Climate Council and Carriageworks. She is President of ACFID and Deputy Chair of the Diversity Council of Australia. Samantha served as an AFL Commissioner until March 2016 and has previously served as a Commissioner with the National Mental Health Commission and served on the Review into the Treatment of Women in the Australian Defence Force.
Mr Robert Thomas – B.Econ, MSAA, SF Fin, Independent Non-Executive Director
Mr Robert Thomas was appointed to the VAH Board as a Director on 8 September 2006.
Robert has more than 40 years of experience in the securities industry. He is the Chairman of Starpharma Holdings Ltd, Aus Bio Ltd and Grahger Retail Securities Pty Ltd. He is a Director of O’Connell Street Associates Pty Ltd, REVA Medical, Inc and Biotron Ltd. Robert was previously a Director of Heartware International, Inc.
The Hon. Mark Vaile AO – Independent Non-Executive Director
The Hon. Mark Vaile was appointed to the VAH Board as a Director on 22 September 2008.
Mark is Chairman of Whitehaven Coal Ltd, Palisade’s Regional Infrastructure Fund and Australia Korea Business Council and was previously Chairman of CBD Energy Ltd. Mark is a Director of Stamford Land Corporation Ltd, HostPlus Superfund Ltd, SmartTrans Holdings Ltd and Servcorp Ltd. In 2012 Mark was appointed an Officer in the Order of Australia in the Queen’s birthday honours list.
Mark was a Member of the Australian Parliament from 1993 to 2008. He was Deputy Prime Minister (2005-2007), Minister for Trade (1999-2006), Minister for Transport and Aviation (1997-1998, 2006-2007) and Minister for Agriculture (1998-1999).
Mr Bruno Matheu – Master of Science, Ecole Centrale Paris, Non-Executive Director
Mr Bruno Matheu was appointed to the VAH Board as a Director on 18 February 2015.
Bruno joined Etihad Airways in December 2014 as COO, Airline Equity Partners. In May 2016, he was appointed as CEO, Airline Equity Partners of Etihad Airways. He is responsible for strategic developments to optimise business performance, revenues and cost synergies between Etihad Airways and its equity partner airlines, and provide strategic leadership support for partners in which Etihad Airways has management responsibility.
Bruno brings to the Group almost 30 years of senior management experience in the global aviation industry.
He most recently served as Chief Long Haul Officer at Air France. Prior to that he held senior executive roles across Air France, and has been a member of Air France and Air France-KLM Executive Boards for 17 years.
He has also served on the Boards of Air France, Alitalia and the global distribution company Amadeus.
Mr John Patrick (JP) Moorhead – MA, MEng, Non-Executive Director
Mr JP Moorhead was appointed as Alternate Director for Mr Joshua Bayliss from 25 August 2014 to 22 September 2015 and appointed as a Director on 22 September 2015.
JP is the COO of Eight Roads, the proprietary investment arm of Fidelity International Limited.
JP was previously CFO of the Virgin Group and responsible for the Virgin Group’s overall financial and risk positions as well as accounting, financing, tax, treasury and certain portfolio matters. JP served as a Director of various Virgin Group operating companies including Virgin Atlantic and Virgin Rail as well as a number of Virgin Group holding companies.
Prior to joining the Virgin Group, JP spent eight years at Goldman Sachs in London and Sydney where he worked on a broad range of strategic advisory, M&A and capital markets transactions.
Mr Marvin Tan – B.A International Relations, Stanford University, Non-Executive Director
Mr Marvin Tan was appointed as Alternate Director to Mr Goh Choon Phong from 4 July 2014 to 1 January 2016 and appointed as a Director on 1 January 2016.
Marvin is the Senior Vice President Product and Services of Singapore Airlines. Marvin joined Singapore Airlines in 1996 and has held various appointments both in Singapore and overseas, most recently as Senior Vice President Cabin Crew and, prior to that, on secondment to SilkAir, Singapore Airlines’ regional subsidiary, as the airline’s Chief Executive.
Marvin holds a Bachelor of Arts degree in International Relations from Stanford University.
A N N U A L F I N A N C I A L R E P O R T 2 0 1 6 3
Directors (continued)Details of directors and alternate directors, their qualifications and experience (continued)
Mr Ulf Huttmeyer – Dipl. Kfm (FH), Alternate Director
Mr Ulf Huttmeyer was appointed as Alternate Director for Mr Bruno Matheu on 18 February 2015.
Ulf was formerly CFO of airberlin and joined Etihad Airways on 1 April 2015 as Senior Vice President Finance Equity Partners. Following studies in economics, concluding with a degree in business administration, Ulf began his career in 1996 as an analyst with Commerzbank in the credit and financing division followed by various assignments in Germany and overseas (Singapore). Thereafter, Ulf served as Group Manager for Corporate Client Services in Berlin and was promoted to Director at the beginning of 2005. Ulf was appointed CFO of airberlin in February 2006.
Mr Pee Teck Tan – B.B.A (Hons), National University of Singapore; MSc International Marketing, University of Strathclyde, Alternate Director
Mr Tan Pee Teck was appointed as Alternate Director to Mr Marvin Tan on 1 January 2016.
Pee Teck is the Senior Vice President Cabin Crew of Singapore Airlines. Mr Tan joined Singapore Airlines in 1994 and has held various appointments both in Singapore and overseas, most recently as Senior Vice President Product and Services. He holds a Bachelor of Business Administration degree (honours) from National University of Singapore and a Masters of Science in International Marketing from the University of Strathclyde.
Mr Joshua Bayliss – LLB (Hons), B.A, Non-Executive Director
Mr Joshua Bayliss was appointed to the VAH Board as a Director on 6 April 2011 and resigned on 22 September 2015.
Joshua is CEO of the Virgin Group, a role he has held since 2011. Virgin Group has investments in consumer and other businesses in 34 countries and licences the Virgin brand to almost 100 companies around the world. In his role as CEO he is responsible for managing the Virgin Group’s global investment portfolio, development and licensing of the Virgin brand and incubation of new businesses. He Chairs the Virgin Group’s investment committee.
Joshua has extensive experience as both an executive and non-executive director of a large number of companies across the Virgin Group globally in all of Virgin’s industry sectors including aviation, financial services, telecoms and media, health and wellness, and leisure and entertainment. Joshua has been with the Virgin Group since 2005, previously serving as the Virgin Group’s General Counsel.
Mr Goh Choon Phong – M.S.(Electrical Engineering and Computer Science), B.S.(Computer Science & Engineering), B.S.(Management Science), B.S.(Cognitive Science), Massachusetts Institute of Technology, Non-Executive Director
Mr Goh Choon Phong was appointed to the VAH Board as a Director on 4 July 2014 and resigned on 1 January 2016.
Choon Phong is a Director and CEO of Singapore Airlines. Prior to his appointment as CEO, Choon Phong held senior management positions in various divisions in Singapore Airlines, ranging from Marketing to Information Technology, Finance and Cargo. Choon Phong also served as President of Singapore Airlines Cargo Pte Ltd from 2006 to 2010. Choon Phong is a Director of SIA Engineering Company. He is also Chairman of Budget Aviation Holdings Pte Ltd, which owns and manages Scoot and Tigerair. He is also a member of the National University of Singapore Board of Trustees and a member of the Care and Share Committee of the Singapore50 Steering Committee of the National Council of Social Services.
Choon Phong is also a Member of the Board of Governors of the International Air Transport Association (IATA) on which he is a Member of the Strategy and Policy Committee, Chair Committee and Audit Committee. As IATA’s Chairman-elect, Choon Phong is due to assume the role of Board Chairman of the Association at the close of its 2017 Annual General Meeting.
Mr Robert McDonald – B.Com FCA, Alternate Director
Mr Robert McDonald was appointed as Alternate Director for Mr Christopher Luxon on 1 September 2014 and resigned on 30 March 2016.
Robert started his finance career as a commerce graduate with a large building products company in 1980. He worked overseas before joining Coopers and Lybrand in the corporate advisory and valuation practice in 1985.
Robert joined Air New Zealand in 1993 as Group Financial Planning Manager and was appointed Group Treasurer in 1995. In October 2004 Robert was appointed as CFO of Air New Zealand. Robert is a Director of Contact Energy Limited, a NZX listed company.
Robert has a Bachelor of Commerce from Auckland University and in 1999 completed the Program of Management Development at Harvard Business School. He is a Fellow of the Chartered Accountants Australia and New Zealand, a member of the Institute of Finance Professionals New Zealand Inc and from 2006 to 2015 was a member of the IATA Financial Committee, appointed as Vice Chairman from 2013 to 2015.
V I R G I N A U S T R A L I A G R O U P4
Directors’ report (continued)
Directors (continued)Details of directors and alternate directors, their qualifications and experience (continued)
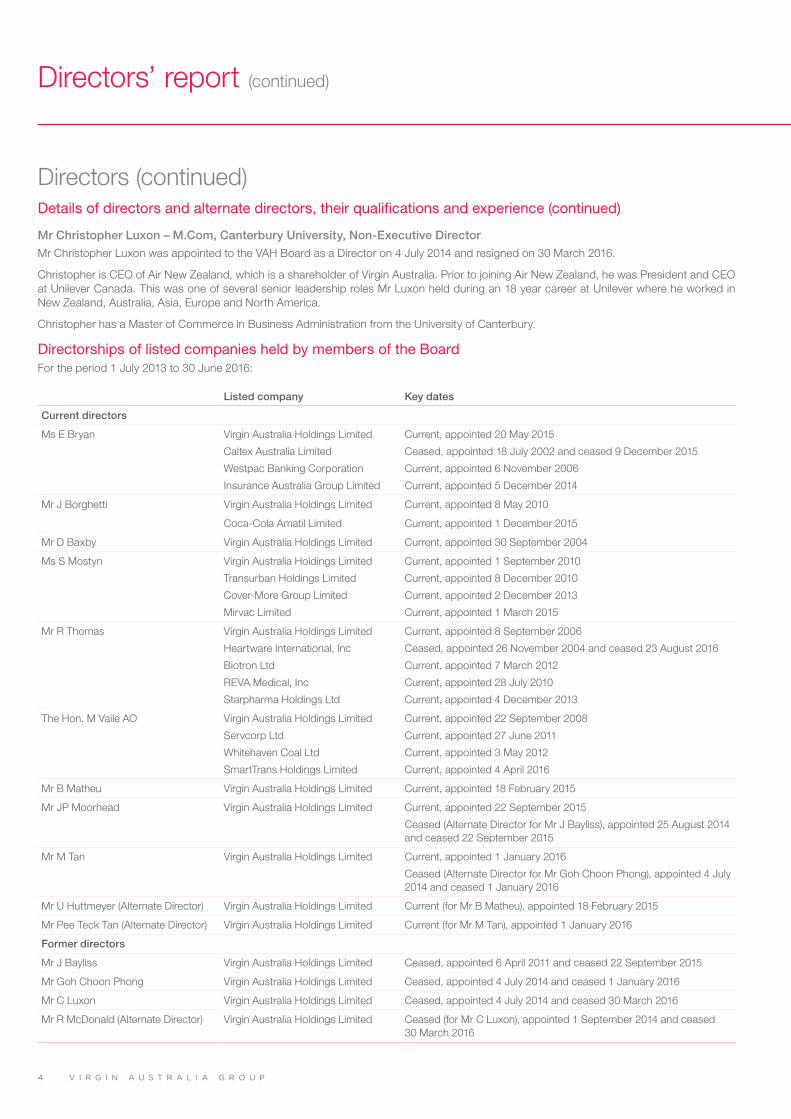
Mr Christopher Luxon – M.Com, Canterbury University, Non-Executive Director
Mr Christopher Luxon was appointed to the VAH Board as a Director on 4 July 2014 and resigned on 30 March 2016.
Christopher is CEO of Air New Zealand, which is a shareholder of Virgin Australia. Prior to joining Air New Zealand, he was President and CEO at Unilever Canada. This was one of several senior leadership roles Mr Luxon held during an 18 year career at Unilever where he worked in New Zealand, Australia, Asia, Europe and North America.
Christopher has a Master of Commerce in Business Administration from the University of Canterbury.
Directorships of listed companies held by members of the BoardFor the period 1 July 2013 to 30 June 2016:
Listed company Key dates
Current directors
Ms E Bryan Virgin Australia Holdings Limited
Caltex Australia Limited
Westpac Banking Corporation
Insurance Australia Group Limited
Current, appointed 20 May 2015
Ceased, appointed 18 July 2002 and ceased 9 December 2015
Current, appointed 6 November 2006
Current, appointed 5 December 2014
Mr J Borghetti Virgin Australia Holdings Limited Current, appointed 8 May 2010
Coca-Cola Amatil Limited Current, appointed 1 December 2015
Mr D Baxby Virgin Australia Holdings Limited Current, appointed 30 September 2004
Ms S Mostyn Virgin Australia Holdings Limited
Transurban Holdings Limited
Cover-More Group Limited
Mirvac Limited
Current, appointed 1 September 2010
Current, appointed 8 December 2010
Current, appointed 2 December 2013
Current, appointed 1 March 2015
Mr R Thomas Virgin Australia Holdings Limited
Heartware International, Inc
Biotron Ltd
REVA Medical, Inc
Starpharma Holdings Ltd
Current, appointed 8 September 2006
Ceased, appointed 26 November 2004 and ceased 23 August 2016
Current, appointed 7 March 2012
Current, appointed 28 July 2010
Current, appointed 4 December 2013
The Hon. M Vaile AO Virgin Australia Holdings Limited
Servcorp Ltd
Whitehaven Coal Ltd
SmartTrans Holdings Limited
Current, appointed 22 September 2008
Current, appointed 27 June 2011
Current, appointed 3 May 2012
Current, appointed 4 April 2016
Mr B Matheu Virgin Australia Holdings Limited Current, appointed 18 February 2015
Mr JP Moorhead Virgin Australia Holdings Limited Current, appointed 22 September 2015
Ceased (Alternate Director for Mr J Bayliss), appointed 25 August 2014 and ceased 22 September 2015
Mr M Tan Virgin Australia Holdings Limited Current, appointed 1 January 2016
Ceased (Alternate Director for Mr Goh Choon Phong), appointed 4 July 2014 and ceased 1 January 2016
Mr U Huttmeyer (Alternate Director) Virgin Australia Holdings Limited Current (for Mr B Matheu), appointed 18 February 2015
Mr Pee Teck Tan (Alternate Director) Virgin Australia Holdings Limited Current (for Mr M Tan), appointed 1 January 2016
Former directors
Mr J Bayliss Virgin Australia Holdings Limited Ceased, appointed 6 April 2011 and ceased 22 September 2015
Mr Goh Choon Phong Virgin Australia Holdings Limited Ceased, appointed 4 July 2014 and ceased 1 January 2016
Mr C Luxon Virgin Australia Holdings Limited Ceased, appointed 4 July 2014 and ceased 30 March 2016
Mr R McDonald (Alternate Director) Virgin Australia Holdings Limited Ceased (for Mr C Luxon), appointed 1 September 2014 and ceased 30 March 2016

A N N U A L F I N A N C I A L R E P O R T 2 0 1 6 5
Directors (continued)Directors’ meetings The number of directors’ meetings (including meetings of committees of directors(1)) and number of meetings attended by each of the directors of the Company during the financial year are:
Director
Board Meetings
Audit and Risk Management
Committee MeetingsRemuneration
Committee Meetings
Safety and Operational Risk Review
Committee MeetingsSpecial Purpose
Committee Meetings
Attended Held(2) Attended Held(2) Attended Held(2) Attended Held(2) Attended Held(2)
Ms E Bryan 14 15 8 8 4 4 4 4 1 1
Mr J Borghetti 15 15 - - - - 4 4 1 1
Mr D Baxby 12 15 - - 4 4 - - - -
Ms S Mostyn 15 15 - - 4 4 4 4 - -
Mr R Thomas 15 15 8 8 4 4 - - - -
The Hon. M Vaile AO 14 15 6 8 - - 4 4 - -
Mr B Matheu 10 15 - - - - - - - -
Mr JP Moorhead 13 13 - - - - - - - -
Mr M Tan 9 10 - - - - - - - -
Mr C Luxon 9 10 2 7 - - - - - -
Mr Goh Choon Phong
1 5 - - - - - - - -
Mr J Bayliss - 2 - - - - - - - -
Mr U Huttmeyer (Alternate Director for Mr B Matheu)
2 5 - - - - - - - -
Mr JP Moorhead (Alternate Director for Mr J Bayliss)
2 2 - - - - - - - -
Mr R McDonald (Alternate Director for Mr C Luxon)
1 1 4 5 - - - - - -
Mr M Tan (Alternate Director for Mr Goh Choon Phong)
4 4 - - - - - - - -
Mr Pee Teck Tan (Alternate Director for Mr M Tan)
1 1 - - - - - - - -
(1) There were no Nomination Committee Meetings held during the year.
(2) Number of meetings held during the time the director held office/alternate director was eligible to attend during the year.

V I R G I N A U S T R A L I A G R O U P6
Directors’ report (continued)
Directors (continued)Directors’ interestsThe relevant interest of each director in shares and options over such instruments issued by the companies within the Group and other related bodies corporate, as notified by the directors to the Australian Securities Exchange (ASX) in accordance with section 205G(1) of the Corporations Act 2001, at the date of this report is as follows:
DirectorNumber of
ordinary shares Options over
ordinary shares
Ms E Bryan 227,044 -
Mr J Borghetti 9,367,077 573,658
Mr D Baxby 108,572 -
Ms S Mostyn 250,000 -
Mr R Thomas 1,298,928 -
The Hon. M Vaile AO 60,000 -
Mr B Matheu - -
Mr JP Moorhead - -
Mr M Tan - -
Mr U Huttmeyer (Alternate Director) - -
Mr Pee Teck Tan (Alternate Director) - -
Company secretaryMs Sharyn Page BA LLB ACIS was appointed Company Secretary on 1 February 2016. Ms Page was previously Company Secretary and General Counsel of SKILLED Group Ltd (December 2012 – December 2015) and Head of Human Resources (July 2014 – December 2015). Prior to that, Ms Page was Company Secretary of Spotless Group (2010 – 2012), Deputy Company Secretary ANZ (2009), Company Secretary Arrium Limited (2008 – 2009), Board Executive and Company Secretary AMP Limited (2005 – 2008) and Assistant Company Secretary AMP Limited (2003 – 2005). Ms Page previously held a number of legal and compliance roles within the financial services industry.
Mr Adam Thatcher, B.Com LLB, was appointed as Company Secretary on 6 July 2011 and ceased to be Company Secretary on 1 February 2016. Adam is a corporate and commercial lawyer with over 29 years of experience and was a partner at one of Australia’s leading law firms, Allens, until the end of 2009. During his 20 years as a partner he specialised in finance, infrastructure and corporate recovery as well as general commercial law.
Corporate governance statement The Corporate Governance statement for Virgin Australia Holdings Limited is located at www.virginaustralia.com/corporategovernance.
A N N U A L F I N A N C I A L R E P O R T 2 0 1 6 7
Operating and financial reviewPrincipal activities and overview of the GroupThe principal activities of the Group during the year were the operation of a domestic and international airline business and the operation of a frequent flyer program. The Group offers a variety of aviation products and services to suit the corporate, government, leisure, low cost, regional and air cargo markets. There were no significant changes in the nature of the activities of the Group during the year.
The Group employs around 9,500 people in Australia, New Zealand, the United States of America and the United Kingdom. The Group has strategic alliances with four key airline partners: Air New Zealand Limited, Delta Air Lines Inc., Etihad Airways P.J.S.C. and Singapore Airlines Limited. Together with the Group’s international operations, the strategic alliances, codesharing and interline agreements provide a virtual global network of 495 destinations to Virgin Australia travellers. The Group’s domestic and international operations are complemented by Virgin Samoa Limited, an arrangement with the Government of Samoa.
The Group operates a modern fleet of aircraft that includes Boeing 737 and Boeing 777 aircraft, Airbus A320 and A330 aircraft, ATR aircraft, Embraer E190 aircraft and Fokker F100 aircraft.
The Group flies to over 40 city and regional destinations in Australia and a range of international destinations that support Trans-Pacific, Middle East, Trans-Tasman, Pacific Island and South East Asian routes.
Key developments On 1 July 2015, Virgin Australia Cargo was formally launched to offer cargo space on over 3,000 flights per week across the Group’s network, with access to specialist cargo handling terminals in all major Australian airports.
On 7 August 2015, the Group announced that Tiger Airways Australia Pty Limited (Tigerair Australia) would launch short-haul international flights to Denpasar (Bali). Tigerair Australia commenced these flights in March 2016.
During the year, the Australian Competition and Consumer Commission re-authorised the Group to continue its existing alliances with Delta Air Lines Inc. and Etihad Airways P.J.S.C. for a further five years each.
On 15 February 2016, the Group announced a proposed long term strategic partnership with Alliance Aviation Services Limited (Alliance). The partnership will see the airlines work together to grow their respective charter businesses and enter into agreements to provide and procure services for each other on a preferential basis. The proposed partnership is subject to competition law approval.
In March 2016, Virgin Australia Cargo signed an exclusive five year agreement with TNT Express, the second largest cargo customer in the Australian domestic market. The agreement, which came into effect on 1 July 2016, sees Virgin Australia Cargo as the exclusive provider of domestic air cargo services for TNT Express.
On 31 May 2016, the Group announced that it had entered into an agreement with HNA Aviation Group Co. Ltd (HNA) to form a strategic commercial alliance. Under the proposed alliance, the companies will look to introduce direct flights between Australia and China and co-operate on codesharing, frequent flyer programs, lounge access and promotion of tourism and business travel. The proposed strategic alliance is subject to regulatory approval. The Group also announced that it would make a $158.8 million placement of new shares in the Group to HNA. This placement was completed on 23 June 2016.
On 10 June 2016, Air New Zealand Limited announced that it had entered into an agreement with Nanshan Group to sell most of its shareholding in the Group. At the time of the sale of shares, Nanshan Group acquired an interest of 19.98 per cent in the Group. The sale was completed on 21 June 2016.
On 15 June 2016, the Group announced its intention to raise equity of $852.0 million through a fully underwritten one for one pro-rata non-renounceable entitlement offer of $852.0 million. This completed after the end of the financial year, in August 2016.
V I R G I N A U S T R A L I A G R O U P8
Directors’ report (continued)
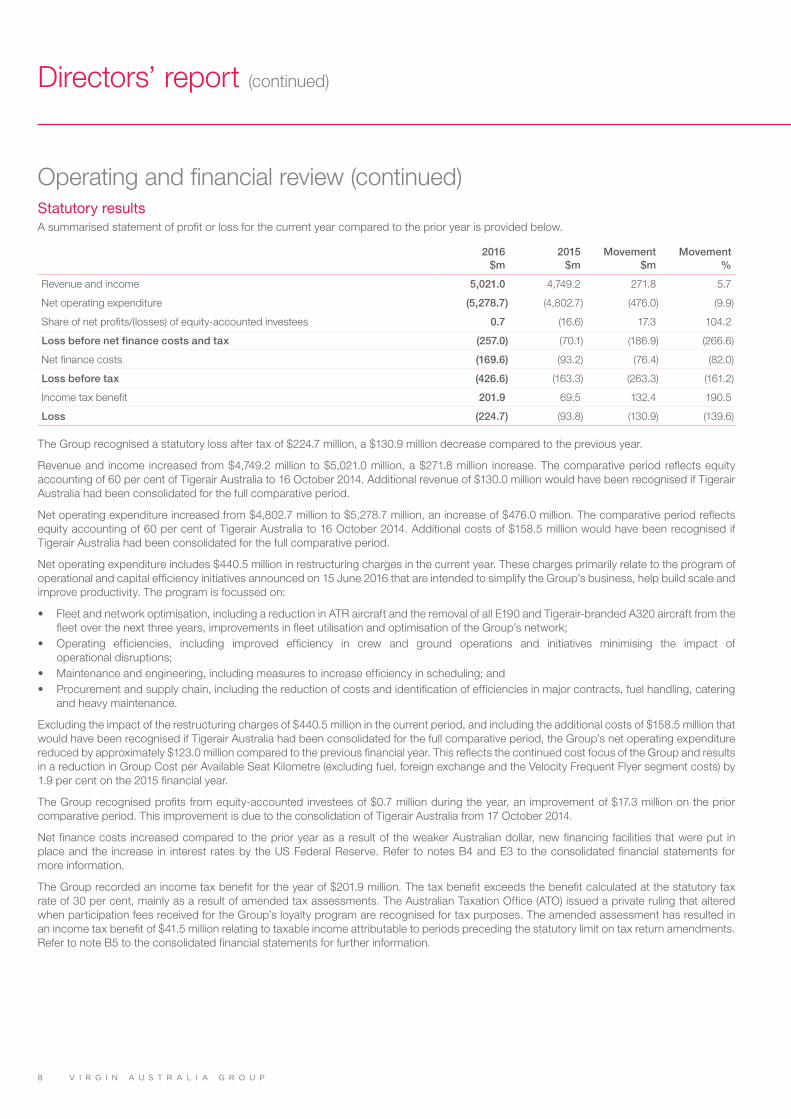
Operating and financial review (continued)Statutory resultsA summarised statement of profit or loss for the current year compared to the prior year is provided below.
2016 $m
2015 $m
Movement $m
Movement %
Revenue and income 5,021.0 4,749.2 271.8 5.7
Net operating expenditure (5,278.7) (4,802.7) (476.0) (9.9)
Share of net profits/(losses) of equity-accounted investees 0.7 (16.6) 17.3 104.2
Loss before net finance costs and tax (257.0) (70.1) (186.9) (266.6)
Net finance costs (169.6) (93.2) (76.4) (82.0)
Loss before tax (426.6) (163.3) (263.3) (161.2)
Income tax benefit 201.9 69.5 132.4 190.5
Loss (224.7) (93.8) (130.9) (139.6)
The Group recognised a statutory loss after tax of $224.7 million, a $130.9 million decrease compared to the previous year.
Revenue and income increased from $4,749.2 million to $5,021.0 million, a $271.8 million increase. The comparative period reflects equity accounting of 60 per cent of Tigerair Australia to 16 October 2014. Additional revenue of $130.0 million would have been recognised if Tigerair Australia had been consolidated for the full comparative period.
Net operating expenditure increased from $4,802.7 million to $5,278.7 million, an increase of $476.0 million. The comparative period reflects equity accounting of 60 per cent of Tigerair Australia to 16 October 2014. Additional costs of $158.5 million would have been recognised if Tigerair Australia had been consolidated for the full comparative period.
Net operating expenditure includes $440.5 million in restructuring charges in the current year. These charges primarily relate to the program of operational and capital efficiency initiatives announced on 15 June 2016 that are intended to simplify the Group’s business, help build scale and improve productivity. The program is focussed on:
• Fleet and network optimisation, including a reduction in ATR aircraft and the removal of all E190 and Tigerair-branded A320 aircraft from the fleet over the next three years, improvements in fleet utilisation and optimisation of the Group’s network;
• Operating efficiencies, including improved efficiency in crew and ground operations and initiatives minimising the impact of operational disruptions;
• Maintenance and engineering, including measures to increase efficiency in scheduling; and• Procurement and supply chain, including the reduction of costs and identification of efficiencies in major contracts, fuel handling, catering
and heavy maintenance.
Excluding the impact of the restructuring charges of $440.5 million in the current period, and including the additional costs of $158.5 million that would have been recognised if Tigerair Australia had been consolidated for the full comparative period, the Group’s net operating expenditure reduced by approximately $123.0 million compared to the previous financial year. This reflects the continued cost focus of the Group and results in a reduction in Group Cost per Available Seat Kilometre (excluding fuel, foreign exchange and the Velocity Frequent Flyer segment costs) by 1.9 per cent on the 2015 financial year.
The Group recognised profits from equity-accounted investees of $0.7 million during the year, an improvement of $17.3 million on the prior comparative period. This improvement is due to the consolidation of Tigerair Australia from 17 October 2014.
Net finance costs increased compared to the prior year as a result of the weaker Australian dollar, new financing facilities that were put in place and the increase in interest rates by the US Federal Reserve. Refer to notes B4 and E3 to the consolidated financial statements for more information.
The Group recorded an income tax benefit for the year of $201.9 million. The tax benefit exceeds the benefit calculated at the statutory tax rate of 30 per cent, mainly as a result of amended tax assessments. The Australian Taxation Office (ATO) issued a private ruling that altered when participation fees received for the Group’s loyalty program are recognised for tax purposes. The amended assessment has resulted in an income tax benefit of $41.5 million relating to taxable income attributable to periods preceding the statutory limit on tax return amendments. Refer to note B5 to the consolidated financial statements for further information.
A N N U A L F I N A N C I A L R E P O R T 2 0 1 6 9
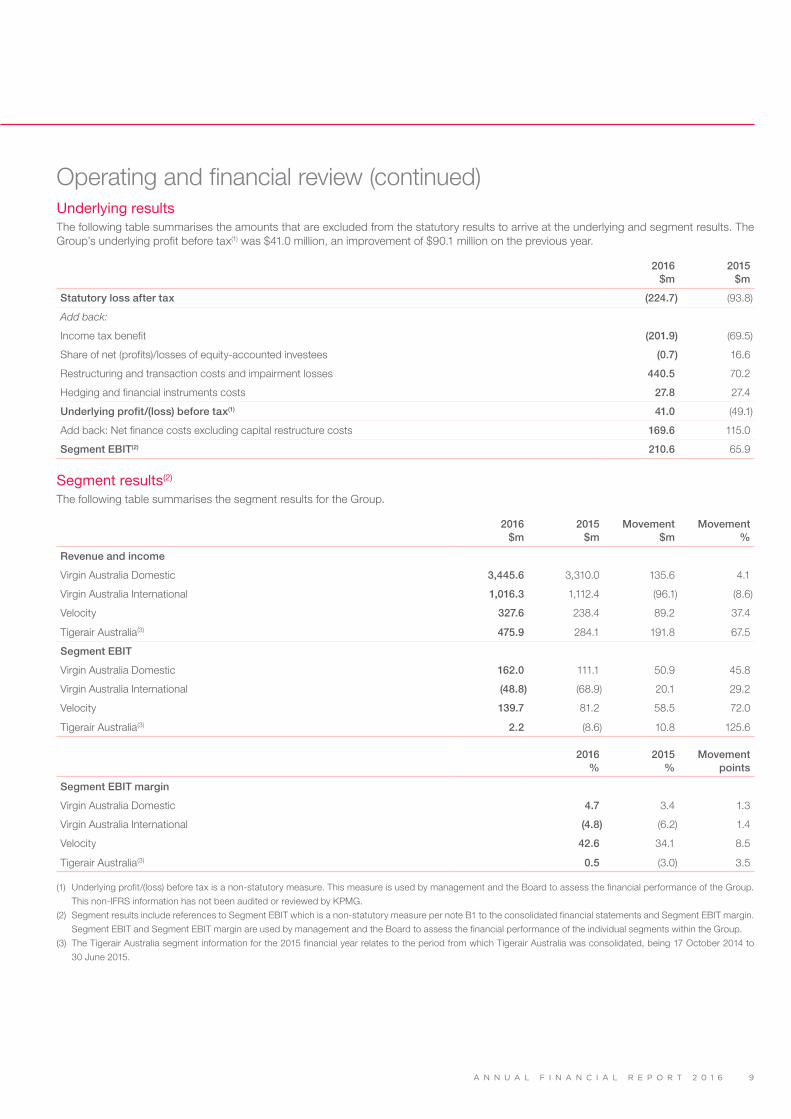
Operating and financial review (continued)Underlying resultsThe following table summarises the amounts that are excluded from the statutory results to arrive at the underlying and segment results. The Group’s underlying profit before tax(1) was $41.0 million, an improvement of $90.1 million on the previous year.
2016 $m
2015 $m
Statutory loss after tax (224.7) (93.8)
Add back:
Income tax benefit (201.9) (69.5)
Share of net (profits)/losses of equity-accounted investees (0.7) 16.6
Restructuring and transaction costs and impairment losses 440.5 70.2
Hedging and financial instruments costs 27.8 27.4
Underlying profit/(loss) before tax(1) 41.0 (49.1)
Add back: Net finance costs excluding capital restructure costs 169.6 115.0
Segment EBIT(2) 210.6 65.9
Segment results(2)
The following table summarises the segment results for the Group.
2016 $m
2015 $m
Movement $m
Movement %
Revenue and income
Virgin Australia Domestic 3,445.6 3,310.0 135.6 4.1
Virgin Australia International 1,016.3 1,112.4 (96.1) (8.6)
Velocity 327.6 238.4 89.2 37.4
Tigerair Australia(3) 475.9 284.1 191.8 67.5
Segment EBIT
Virgin Australia Domestic 162.0 111.1 50.9 45.8
Virgin Australia International (48.8) (68.9) 20.1 29.2
Velocity 139.7 81.2 58.5 72.0
Tigerair Australia(3) 2.2 (8.6) 10.8 125.6
2016 %
2015 %
Movement points
Segment EBIT margin
Virgin Australia Domestic 4.7 3.4 1.3
Virgin Australia International (4.8) (6.2) 1.4
Velocity 42.6 34.1 8.5
Tigerair Australia(3) 0.5 (3.0) 3.5
(1) Underlying profit/(loss) before tax is a non-statutory measure. This measure is used by management and the Board to assess the financial performance of the Group.
This non-IFRS information has not been audited or reviewed by KPMG.
(2) Segment results include references to Segment EBIT which is a non-statutory measure per note B1 to the consolidated financial statements and Segment EBIT margin.
Segment EBIT and Segment EBIT margin are used by management and the Board to assess the financial performance of the individual segments within the Group.
(3) The Tigerair Australia segment information for the 2015 financial year relates to the period from which Tigerair Australia was consolidated, being 17 October 2014 to
30 June 2015.

V I R G I N A U S T R A L I A G R O U P1 0
Directors’ report (continued)
Operating and financial review (continued)Segment results (continued)
Virgin Australia DomesticThe Virgin Australia Domestic segment demonstrated strong year on year improvement with an increase of 45.8 per cent in Segment EBIT and an increase of 1.3 points in Segment EBIT margin.
Revenue and earnings growth was driven by ongoing improvement in Yield(4), which increased by 3.4 per cent. Virgin Australia Domestic continued to grow its share of the high-yielding corporate and government sectors during the year. Revenue from these sectors is at its highest level ever, with revenue performance in the last quarter of the financial year exceeding the Group’s 2017 financial year target of 30 per cent of total domestic revenue.
These results were delivered in a challenging operating environment affected by subdued consumer demand, the downturn of the resources sector and uncertainty around the economy and political events. Strategic capacity reductions were made in line with reduced demand, particularly on regional routes.
During the year, Virgin Australia Domestic remained focussed on delivering an excellent and innovative customer experience. This included the introduction of new Business class suites for trans-continental flights on A330 aircraft , the launch of a new terminal and lounge at Perth Airport and an expanded lounge at Brisbane Airport. Guests have given these features high customer satisfaction scores. Virgin Australia Domestic led its major competitor in On Time Performance for the past two financial years(5).
During the year, Virgin Australia Regional Airlines (VARA) continued to simplify its business through actions including the decommissioning of the Fokker F50 fleet. VARA will continue to grow its charter business through its proposed strategic partnership with Alliance Aviation Services Limited.
Since its launch in July 2015, Virgin Australia Cargo has been on a strong customer growth trajectory, with over 100 accounts now trading directly with the Group. In March 2016, Virgin Australia Cargo entered into an exclusive five year contract with TNT, one of Australia’s largest cargo customers. The Group has rolled out an extensive cargo handling network across Australia and the Asia Pacific, including the launch of new cargo facilities at Sydney Airport. A dedicated freighter network has also been established to support the cargo business and future growth.
Virgin Australia InternationalThe Virgin Australia International segment reported a Segment EBIT loss of $48.8 million for the 2016 financial year, an improvement of almost 30 per cent on the 2015 financial year, notwithstanding the $19.0 million impact of Bali volcanic activity in the first half of the current financial year.
RASK(6) declined by 1.1 per cent and Yield declined by 3.3 per cent on the prior year. Revenue and Yield results were impacted by competitive pressure on capacity and pricing, particularly in the second half of the current year. Short term factors also affected Virgin Australia International’s comparative performance during the second half of the current financial year, including a one-off increase in revenue in the prior period from the Cricket World Cup and the removal of long-haul capacity due to the embodiment of Boeing 777’s with new premium seating in this financial year.
During the second half of the current financial year, the Group also executed significant components of its strategy to build yield, revenue and profit in the international business. The Group adjusted its international network to align with market dynamics by withdrawing flights between some capital cities and Bali and between Perth and Phuket, and launching Tigerair Australia flights to Bali to cater to the growing popularity of low cost travel to that destination. Strategic frequency additions were made on trans-Tasman routes.
Virgin Australia International also began to roll out new Business class suites and Premium Economy seats on its Boeing 777 fleet during the second half of the current financial year. The embodiment process is expected to be completed in the first quarter of the 2017 financial year.
With most of the improvement strategy implemented in the second half of the 2016 financial year, the Group will realise the full year benefits from this strategy in the 2017 financial year, in accordance with the Group’s target.
(4) Yield is a non-statutory measure derived from segment revenue divided by Revenue Passenger Kilometres of the Regular Passenger Transport business.
(5) Customer satisfaction scores were captured in the Virgin Australia Guest Satisfaction Tracker over the 2016 financial year. Information regarding customer satisfaction
scores for aspects of the overall domestic experience includes comparisons to scores collected during the 2015 financial year. Data has been collected and analysed
by Colmar Brunton, a leading external Australian market research company. In accordance with definitions from the Bureau of Infrastructure, Transport & Regional
Economics (BITRE), ‘On Time Performance’ refers to flights that depart within 15 minutes of the scheduled departure times shown in the carriers’ schedules. Reflects
BITRE data for the monthly on time performance for all Virgin Australia designated (Virgin Australia and Virgin Australia Regional Airlines) and all Qantas designated
services (Qantas and Qantas Link) flown in the 2015 and 2016 financial years.
(6) RASK is a non-statutory measure derived from segment revenue divided by Available Seat Kilometres of the Regular Passenger Transport business.

A N N U A L F I N A N C I A L R E P O R T 2 0 1 6 1 1
Operating and financial review (continued)Segment results (continued)
VelocityVelocity has reported strong results with revenue of $327.6 million, a 37.4 per cent improvement on the 2015 financial year. Segment EBIT grew by $58.5 million and Segment EBIT margin improved by 8.5 points.
Velocity’s membership base grew by 20 per cent on the prior year to more than 6.3 million members, with an average daily join rate of almost 3,000 members per day.
With the addition of major airline partners during the current year, members can earn and redeem points on travel to more than 600 destinations around the world. In an Australian first, Velocity has also introduced the ability to spend Velocity Frequent Flyer Points on eligible purchases at BP service stations. Over 1 million Velocity members have already earned points through the BP partnership since it began last year.
Through the delivery of a compelling loyalty proposition and consistent growth, Velocity is set to meet its earnings and membership targets for the 2017 financial year.
Tigerair Australia(7)
Tigerair Australia delivered its first full year Segment EBIT profit of $2.2 million, a year ahead of the Group’s target. This result was driven by RASK growth of 1.0 per cent and Yield growth of 1.4 per cent.
During the 2016 financial year, Tigerair Australia consolidated its position in the low cost carrier market. Tigerair Australia’s total revenue passengers increased by 11.6 per cent compared to the prior year and Revenue Passenger Kilometre growth was in line with capacity growth.
Tigerair Australia also led the low cost carrier market in On Time Performance and cancellations across the 2016 financial year and delivered a significantly improved customer experience for its customers. During the year, Tigerair Australia introduced a revamped website, mobile app and call centre, and a new booking and reservation platform. During the 2016 financial year, Tigerair Australia’s customer satisfaction scores increased across almost every aspect of the end-to-end Tigerair Australia travel experience(8).
Tigerair Australia also joined the world’s largest alliance of low cost airlines, which will give travellers access to a low cost network that covers one third of the world.
In March 2016, Tigerair Australia commenced international flights to Bali and is achieving strong load factors and positive forward booking profiles for these services.
Financial position
A summarised statement of financial position for the Group for the current year compared to the prior year is provided below:
2016 $m
2015 $m
Movement $m
Movement %
Current assets 1,713.7 1,586.0 127.7 8.1
Non-current assets 4,327.1 4,193.6 133.5 3.2
Total assets 6,040.8 5,779.6 261.2 4.5
Current liabilities 2,779.8 2,299.8 480.0 20.9
Non-current liabilities 2,362.2 2,459.0 (96.8) (3.9)
Total liabilities 5,142.0 4,758.8 383.2 8.1
Net assets 898.8 1,020.8 (122.0) (12.0)
Share capital 1,309.0 1,152.9 156.1 13.5
Reserves 117.2 177.3 (60.1) (33.9)
Retained earnings (514.5) (253.6) (260.9) (102.9)
Non-controlling interests (12.9) (55.8) 42.9 76.9
Total equity 898.8 1,020.8 (122.0) (12.0)
(7) The metrics in this section are non-statutory measures, and are prepared on a full year stand-alone basis and include 100 per cent of the results for the period from
1 July 2014 to 16 October 2014 prior to Tigerair Australia being consolidated into the Group.
(8) Customer satisfaction scores were captured in the Tigerair Guest Satisfaction Tracker over the 2016 financial year and comparisons are to scores collected in the 2016
financial year. Data has been collected and analysed by Colmar Brunton, a leading external Australian market research company. ‘Low cost carrier market’ means
Tigerair Australia and Jetstar. Reflects BITRE data for the monthly on time performance of all Tigerair Australia designated services and Jetstar designated services flown
in the 2016 financial year.

V I R G I N A U S T R A L I A G R O U P1 2
Directors’ report (continued)
Operating and financial review (continued)Financial position (continued)
AssetsNet cash and cash equivalents increased by $95.3 million to $1,123.8 million from $1,028.5 million in the prior period. Unrestricted cash increased from $718.9 million in the prior comparative period to $728.9 million in the current period. Positive operating cash flows of $198.5 million contributed to this increase.
Assets classified as held for sale increased by $76.2 million compared to the prior year. The assets classified as held for sale during the prior year of $95.4 million were sold during the year. The balance of $171.6 million at 30 June 2016 includes ten Embraer E190 and seven Fokker F50 aircraft held for sale as part of the fleet restructuring initiatives. Refer to note D1 to the consolidated financial statements for further information.
Non-current receivables increased by $72.4 million as a result of maintenance prepayments paid to third party maintenance providers.
Net deferred tax assets increased by $206.9 million as a result of the recognition of an additional deferred tax asset of $132.8 million in relation to unearned loyalty program revenue and additional tax losses of $71.3 million. The additional tax losses in relation to unearned loyalty program revenue increased as a result of a private ruling issued by the Australian Taxation Office that altered when participation fees received for the Group’s loyalty program are recognised for tax purposes. Refer to note B5 to the consolidated financial statements for further information.
Property, plant and equipment decreased by $209.1 million due to the following factors: – $335.6 million of net business combination acquisitions, additions and disposals; less – $22.8 million of impairment losses; less – $264.5 million of depreciation; less – $295.4 million net transfers to assets classified as held for sale; add – $38.0 million of foreign exchange movements as a result of the weakening Australian dollar.
Refer to note D2 to the consolidated financial statements for further information on the movements in property, plant and equipment.
Intangible assets increased by $26.4 million due to the following factors: – $3.5 million decrease as a result of business combination acquisition adjustments; add – $52.2 million of additions; less – $4.6 million of impairment losses; less – $17.7 million of amortisation.
Refer to note D3 to the consolidated financial statements for further information on movements in intangibles.
LiabilitiesCurrent and non-current provisions increased by $90.3 million as a result of the recognition of a provision of $100.2 million for onerous operating lease terms.
Current unearned revenue increased by $51.1 million as a result of the growth in the Group’s Velocity Frequent Flyer program.
Current and non-current interest-bearing liabilities increased by $237.8 million as a result of the Group establishing two new debt facilities and repaying several aircraft related financing facilities. During the year, the Group issued USD100.0 million of bonds to investors in the US Bond Market. The bonds have a four year term, maturing on 15 November 2019. In March 2016 the Group established a twelve month $425.0 million loan facility with its four major shareholders at the time: Air New Zealand Limited, Etihad Airways P.J.S.C., Singapore Airlines Limited and Virgin Investments Limited. The facility has been fully repaid subsequent to the reporting date as a result of the completion of the $852.0 million entitlement offer in August 2016. Refer to note E3 to the consolidated financial statements for further information on the Group’s interest-bearing liabilities.
EquityTotal equity reduced by $122.0 million during the period mainly as a result of the $224.7 million loss for the year which was partially offset by the issue of share capital of $154.0 million, net of tax and transaction costs.
Net current liability positionThe Group’s current liabilities exceeded its current assets as at 30 June 2016 by $1,066.1 million (2015: $713.8 million) including a current liability for unearned revenue of $990.4 million (2015: $939.3 million). Unearned revenue includes revenue received in advance which has been deferred in the statement of financial position until carriage is performed. The consolidated financial statements have been prepared on a going concern basis, based on the Group’s cash flows for the current year and estimated profits and cash flows for future years including the $852.0 million entitlement offer which completed in August 2016. The Group has a cash and cash equivalents balance at 30 June 2016 of $1,123.8 million (2015: $1,028.5 million) and has an unrestricted cash balance at 30 June 2016 of $728.9 million (2015: $718.9 million). This excludes the proceeds from the Group’s $852.0 million entitlement offer which competed after the end of the financial year, in August 2016. Capital management is detailed in note E1 to the consolidated financial statements. Management of liquidity risk is detailed in note E7 to the consolidated financial statements.

A N N U A L F I N A N C I A L R E P O R T 2 0 1 6 1 3
Operating and financial review (continued)Operating statistics(9)
Operating statistics (Group) 2016 2015 Change % Change
Group yield cents 11.64 11.60 0.04 0.3
Available seat kilometres (ASKs) billion 47.0 46.0 1.0 2.2
Passengers carried million 23.7 22.3 1.4 6.3
Revenue load factor % 79.4 77.8 1.6 2.1
DividendsNo dividends were declared or paid during the year ended 30 June 2016 or during the prior corresponding year.
Equity distributions of $41.9 million (2015: $17.8 million) were paid to non-controlling interests during the year.
Likely developmentsThe strategic priorities and targets of the Group are outlined below: • Capitalising on growth opportunities: The Group is targeting improved margins in its domestic business, improved margins and membership
growth for Velocity Frequent Flyer and the delivery of profitability in its international business and Tigerair Australia. The Group will continue to pursue revenue growth opportunities including the proposed strategic commercial alliance with HNA.
• Driving yield enhancement: The Group is targeting 30 per cent of domestic revenue from high-yielding corporate and government travellers.• Driving cost savings: The Group is targeting in excess of $1.2 billion in cumulative cost savings from ongoing efficiency activities, and
further cash flow savings from the Better Business program of capital and operational efficiency initiatives that commenced during the year. Planned initiatives under the Better Business program include improvements to the Group’s operations, organisational structure and maintenance, engineering, procurement and supply chain programs. The Group is targeting net free cash flow savings increasing to $300 million per annum (annualised run rate) by the end of the 2019 financial year through the Better Business program. The Group will continue to simplify its fleet, including the removal of all Embraer E190 and Tigerair Australia-branded Airbus A320 aircraft and a reduction in ATR aircraft by the end of the 2019 financial year.
• Optimisation of the balance sheet: The Group is targeting improvements in financial leverage and return on invested capital. • Setting a new standard in the customer experience.• Continuing to develop our people.
Significant risks and uncertaintiesThe Virgin Australia Group is exposed to a range of risks associated with operating in the domestic and international aviation industry. These include: • Fuel price and foreign exchange trends, which can significantly affect costs, including fuel, aircraft and funding costs; • Increases in airport, transit and landing fees, and the costs of ensuring air traffic security;• Competition from other airlines and from alternative means of transportation;• Government policy changes or decisions which could have an adverse impact on its business, operations and financial performance; • Industrial action by unionised employees, which can adversely impact operations, financial performance and staff engagement;• Stability of critical systems, including technology and communication services, which can disrupt operations; • Global economic and geopolitical conditions, as well as pandemics, terrorism, severe weather conditions, natural disasters or other Acts of
God, which can materially adversely affect operations and demand for air travel; • Losses associated with major safety or security incidents; • Ability to obtain sufficient funds on acceptable terms, or at all, to provide adequate liquidity and to finance necessary operating and capital
expenditures; • Liquidity risk, inability to meet financial obligations as they fall due; and • Credit risk, failure of counterparties and dependency on third party service and facility providers.
The Group’s exposure to these risks has the potential to affect financial performance, operations, liquidity, and/or result in impairment of the Group’s cash-generating units (CGUs). Impairment testing is performed on an annual basis, or more frequently if required, to determine if the impact of key risks has generated impairment losses during the financial year and considers the potential impacts, through sensitivity testing, for future financial years. Refer to note D4 to the consolidated financial statements.
(9) This non-IFRS information has not been audited or reviewed by KPMG. The operating statistics include 100% of Tigerair Australia from 1 November 2014.

V I R G I N A U S T R A L I A G R O U P1 4
Directors’ report (continued)
Operating and financial review (continued)Significant risks and uncertainties (continued)The Virgin Australia Group aims to ensure that all activities are undertaken within the Board of Directors (the Board) approved risk appetite and management guidelines and with sufficient independent oversight to protect the safe operations, profitability, financial position and reputation of the Group.
The identification and proactive management of risk reduces uncertainty associated with the execution of the Group’s business strategies and allows the Group to maximise opportunities as they arise. All personnel are accountable for identifying, assessing and managing risks in a proactive manner. The Group has established the Audit and Risk Management Committee which is responsible for the internal controls, policies and procedures that the Group uses to identify and manage business risks. The risk management system implemented by the committee is described in further detail on the Company’s website www.virginaustralia.com/corporategovernance.
The Virgin Australia Group is committed to managing risks in a proactive and effective manner. This commitment is supported by the Group’s philosophy and approach to effective risk management and is in line with the principles outlined in the Mission Statement, Safety Policy, Just Culture Policy and Risk Management Policy of the Group.
Significant events after the balance dateThe Group completed a one for one pro-rata non-renounceable entitlement offer of $852.0 million in August 2016. A portion of the proceeds from the entitlement offer were used to repay the $425.0 million shareholder loan facility.
After the issue of shares under the entitlement offer, the Group made an additional placement to HNA Innovation Ventures (Hong Kong) Co. Limited (HNA) of $89.2 million at a price of $0.26 per share which completed on 20 September 2016.
A N N U A L F I N A N C I A L R E P O R T 2 0 1 6 1 5
Remuneration report – auditedDear Shareholder
I am pleased to present our remuneration report for the 2016 financial year.
The Remuneration Committee continues to be committed to delivering remuneration outcomes that engage high quality executives to enable the long term, sustainable success of the Group and the delivery of value to its shareholders.
To achieve this, Virgin Australia’s remuneration framework is underpinned by three key principles:
• Externally competitive in order to attract, motivate and retain high quality people from Australian and international talent pools, allowing for the globalised nature of the aviation industry.
• Alignment with the best interests of shareholders by rewarding performance that delivers long term, sustainable success for the Group and value to shareholders.
• Pay for performance by seeking to deliver appropriate and fair rewards for performance that fulfils and exceeds expectations.
The following table provides a summary of the remuneration outcomes for the 2016 financial year.
Fixed Remuneration In the first major review of fixed remuneration since 2013, the Board undertook benchmarking of CEO and senior executive remuneration against similarly-sized ASX-listed companies. This followed two years of no fixed remuneration increases for the CEO and no fixed remuneration increases for senior executives other than for significant changes in accountability. This process resulted in increases in fixed remuneration for the CEO and selected senior executives for the 2016 financial year to ensure that fixed remuneration for those positions was more competitively positioned against the median of the benchmark.
The Board has not approved any remuneration increases for the CEO and senior executives for the 2017 financial year.
Short Term Incentives (STI)
For the 2016 financial year, the Board set the CEO and Corporate Scorecard objectives based on financial and nonfinancial measures including safety, people and customer measures. The Board increased the weighting of financial measures to 75% in the CEO Scorecard and to 55% in the Corporate Scorecard for the senior executives.
STI remuneration awarded to the CEO and senior executives for the 2016 financial year reflects performance against the outcomes of the CEO and Corporate Scorecard objectives. Whilst financial targets were not met, certain non-financial targets were achieved in both the CEO and Corporate Scorecard.
The CEO Scorecard outcome was 17.5%, resulting in a payment of 17.5% of the CEO’s STI target.
The senior executives (excluding the CEO Velocity Frequent Flyer) have two scorecards, the Corporate Scorecard constitutes 50% of the STI target and business unit Key Performance Indicators constitute the other 50%. The average payout based on both these scorecards for senior executives was 40% of their STI target.
Long Term Incentives (LTI)
The Group had three LTI plans which were tested on 30 June 2016: the CEO’s Senior Executive Option Plan (SEOP 20), the senior executive’s LTI Plan and the CEO Tigerair Australia’s LTI Plan which was set prior to the full acquisition of Tigerair Australia by the Group in October 2014.
50% of the CEO’s SEOP 20 successfully passed testing on corporate measures, which included the financial performance of Tigerair Australia and Velocity Frequent Flyer. 50% of SEOP 20 lapsed due to Total Shareholder Return hurdles not being met. In accordance with the Plan rules, 60% vested and was transferred immediately, with the remaining 40% to vest for transfer in July 2017 based on the continued employment of the CEO.
The LTI Plan for senior executives did not vest due to Total Shareholder Return hurdles not being met.
42.5% of the CEO Tigerair Australia LTI plan successfully vested based on the financial performance of Tigerair Australia in the 2015 and 2016 financial years.
From the 2016 financial year the Board has aligned the LTI plans for the CEO, senior executives and Tigerair Australia to the measure of Group Return On Invested Capital. The CEO Velocity Frequent Flyer participates in a separate Velocity Frequent Flyer LTI plan governed by the Velocity Frequent Flyer Board.
The Group is pleased to present its executive remuneration philosophy and outcomes in this Remuneration Report in a manner that is clear, concise and compliant with the Corporations Act 2001. In addition to the fulfilment of the Group’s statutory reporting obligations, the Group has voluntarily disclosed the actual remuneration received by the CEO and senior executives in this report.
The Remuneration Committee remains focused on maturing the Group’s remuneration framework in line with the transformation of the Group to ensure alignment between executive remuneration and the delivery of value to shareholders.
Sam MostynChair, Remuneration Committee

V I R G I N A U S T R A L I A G R O U P1 6
Directors’ report (continued)
Remuneration report – audited (continued)The report is structured as follows:
Key management personnel page 16
Remuneration governance page 17
Executive remuneration overview page 18
FY16 outcomes page 26
Non-executive director remuneration page 28
Statutory tables page 29
Equity and deferred cash tables Page 31
Additional information Page 35
Key management personnelThis report covers the key management personnel (KMP) of the Group.
KMP are those people who, directly or indirectly, have authority and responsibility for planning, directing and controlling the activities of the entity and Group.
For the Group, the KMP are defined to be:• Group Chief Executive Officer (CEO);• Senior executives in Group Management Committee positions; and• Non-executive directors.
This report has been audited in accordance with section 300A of the Corporations Act 2001.
For the year ended 30 June 2016, Group Board of Directors were:
Name Position Term as KMP
Elizabeth Bryan Chairman(1) Full Year
John Borghetti Group Chief Executive Officer and Executive Director Full Year
David Baxby Independent Director(1) Full Year
Bruno Matheu Director Full Year
John Patrick Moorhead Director Commenced 22 September 2015
Samantha Mostyn Independent Director(1) Full Year
Marvin Tan Director Commenced 1 January 2016
Robert Thomas Independent Director(1) Full Year
Mark Vaile Independent Director Full Year
Josh Bayliss Director Ceased 22 September 2015
Christopher Luxon Director Ceased 30 March 2016
Goh Choon Phong Director Ceased 1 January 2016
(1) Members of the Remuneration Committee.
For the year ended 30 June 2016, Group Management Committee members were:
Name Position Term as KMP
John Borghetti Group Chief Executive Officer and Executive Director Full Year
Merren McArthur Group Executive, Virgin Australia Regional Airlines and Group Cargo
Full Year
Robert Sharp Chief Executive Officer, Tigerair Australia Full Year
Mark Hassell Chief Customer Officer Full Year
Judith Crompton Chief Commercial Officer Full Year
Gary Hammes Chief Operating Officer Full Year
A N N U A L F I N A N C I A L R E P O R T 2 0 1 6 1 7
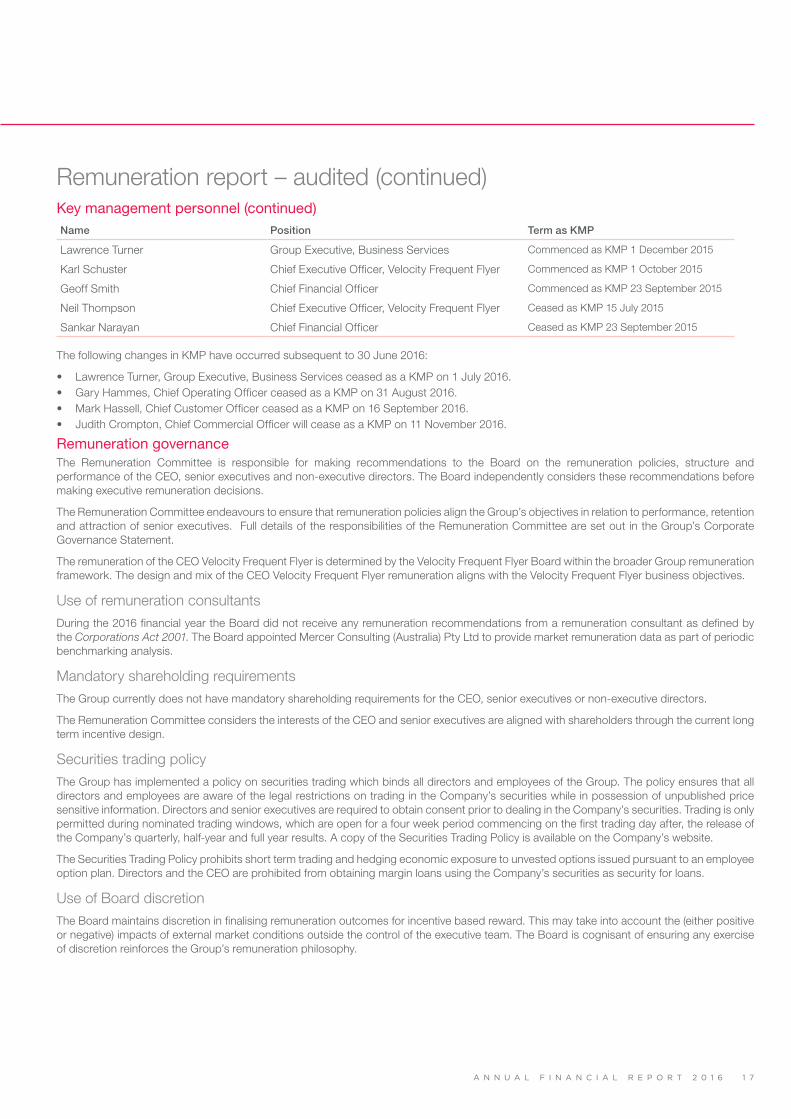
Remuneration report – audited (continued)Key management personnel (continued)Name Position Term as KMP
Lawrence Turner Group Executive, Business Services Commenced as KMP 1 December 2015
Karl Schuster Chief Executive Officer, Velocity Frequent Flyer Commenced as KMP 1 October 2015
Geoff Smith Chief Financial Officer Commenced as KMP 23 September 2015
Neil Thompson Chief Executive Officer, Velocity Frequent Flyer Ceased as KMP 15 July 2015
Sankar Narayan Chief Financial Officer Ceased as KMP 23 September 2015
The following changes in KMP have occurred subsequent to 30 June 2016:
• Lawrence Turner, Group Executive, Business Services ceased as a KMP on 1 July 2016. • Gary Hammes, Chief Operating Officer ceased as a KMP on 31 August 2016.• Mark Hassell, Chief Customer Officer ceased as a KMP on 16 September 2016.• Judith Crompton, Chief Commercial Officer will cease as a KMP on 11 November 2016.
Remuneration governanceThe Remuneration Committee is responsible for making recommendations to the Board on the remuneration policies, structure and performance of the CEO, senior executives and non-executive directors. The Board independently considers these recommendations before making executive remuneration decisions.
The Remuneration Committee endeavours to ensure that remuneration policies align the Group’s objectives in relation to performance, retention and attraction of senior executives. Full details of the responsibilities of the Remuneration Committee are set out in the Group’s Corporate Governance Statement.
The remuneration of the CEO Velocity Frequent Flyer is determined by the Velocity Frequent Flyer Board within the broader Group remuneration framework. The design and mix of the CEO Velocity Frequent Flyer remuneration aligns with the Velocity Frequent Flyer business objectives.
Use of remuneration consultantsDuring the 2016 financial year the Board did not receive any remuneration recommendations from a remuneration consultant as defined by the Corporations Act 2001. The Board appointed Mercer Consulting (Australia) Pty Ltd to provide market remuneration data as part of periodic benchmarking analysis.
Mandatory shareholding requirementsThe Group currently does not have mandatory shareholding requirements for the CEO, senior executives or non-executive directors.
The Remuneration Committee considers the interests of the CEO and senior executives are aligned with shareholders through the current long term incentive design.
Securities trading policy The Group has implemented a policy on securities trading which binds all directors and employees of the Group. The policy ensures that all directors and employees are aware of the legal restrictions on trading in the Company’s securities while in possession of unpublished price sensitive information. Directors and senior executives are required to obtain consent prior to dealing in the Company’s securities. Trading is only permitted during nominated trading windows, which are open for a four week period commencing on the first trading day after, the release of the Company’s quarterly, half-year and full year results. A copy of the Securities Trading Policy is available on the Company’s website.
The Securities Trading Policy prohibits short term trading and hedging economic exposure to unvested options issued pursuant to an employee option plan. Directors and the CEO are prohibited from obtaining margin loans using the Company’s securities as security for loans.
Use of Board discretionThe Board maintains discretion in finalising remuneration outcomes for incentive based reward. This may take into account the (either positive or negative) impacts of external market conditions outside the control of the executive team. The Board is cognisant of ensuring any exercise of discretion reinforces the Group’s remuneration philosophy.

V I R G I N A U S T R A L I A G R O U P1 8
Directors’ report (continued)
Remuneration report – audited (continued)Executive remuneration overview
Remuneration philosophyThe continued growth, development and success of the Group requires the alignment of executive remuneration to the Group’s business performance and delivery of shareholder returns.
Virgin Vision StrategyCapitalise on
growth opportunitiesDrive yield
enhancementDrive cost savings
including through the Better Business
program
Optimise capital structure to drive
sustainable growth
Set a new standard in customer experience
Develop our people to their full potential
Remuneration StrategyA framework that attracts and retains high quality people and aligns their performance to the Group’s business performance and delivery of
shareholder returns over the short, medium and long term.
Remuneration PhilosophyExternally competitive
The Board believes that the delivery of the Group’s strategy requires the recruitment
and retention of talented executives at a competitive market rate, based on a
comparator group of organisations.
Pay for performanceRemuneration outcomes aim to deliver
appropriate and fair rewards to the CEO and senior executives consistent with short and
long term performance objectives.
Alignment with shareholdersDelivering shareholder return over the
medium and long term is paramount to the success of the Group and the remuneration policy aligns the CEO and senior executives
to the delivery of profitable growth over a multi-year period.
Summary of remuneration components
Remuneration Component Link to Philosophy
Fixed Remuneration Base salary, superannuation and benefits. Externally competitive to attract and retain high quality people.
At-risk Remuneration:
Short Term Incentive (STI)
CEO 67% in cash and 33% deferred for 1 year in cash at maximum STI opportunity.
Senior executives 70% paid in cash and 30% deferred for 1 year in cash.
Pay for performance to motivate and reward performance within a financial year.
At-risk Remuneration:Long Term Incentive (LTI)
Cash and share based incentives with measures over a multi-year period.
CEO and senior executive plans granted in the 2016 financial year are based on the measure of Group Return On Invested Capital.
The CEO Velocity Frequent Flyer participates in a separate Velocity Frequent Flyer LTI plan governed by the Velocity Frequent Flyer Board.
Alignment of reward to shareholder interests and longer term financial performance.

A N N U A L F I N A N C I A L R E P O R T 2 0 1 6 1 9
Remuneration report – audited (continued)Executive remuneration overview (continued)
Remuneration mixThe remuneration mix has been structured to align the objectives of the CEO and senior executives with the long term strategic goals of the business. The following graphs outline the remuneration mix for the CEO and senior executives at maximum opportunity.
CEO Remuneration Mix Senior Executive Remuneration Mix(1)
20%
20%
10%
50%
25%
27%11%
37%
Fixed Remuneration STI Cash STI Deferred LTI
(1) Senior executive remuneration mix does not include CEO Velocity Frequent Flyer: 47% Fixed, 37% STI Cash, 16% STI Deferred based on total annual remuneration at
maximum. LTI mix is not reported due to the nature of the CEO Velocity Frequent Flyer LTI program.
Fixed annual remuneration The Group takes the following factors into account when setting fixed annual remuneration levels:
• The CEO and senior executives’ skills, experience and ability to deliver Group strategy; and• Remuneration levels in comparison to peer companies.
During the 2016 financial year the Board conducted a review of CEO and senior executive remuneration. This was the first major review of remuneration since 2013 (other than for significant changes in accountability). External human resources firm Mercer Consulting (Australia) Pty Ltd assisted with the review.
The Remuneration Committee benchmarked remuneration against similarly-sized ASX-listed companies. The existing fixed annual remuneration of the CEO and selected senior executives was found to be positioned well below the benchmark. Based on careful consideration of the benchmarking outcomes, increases were approved for the CEO and selected senior executives to more competitively position fixed annual remuneration against the benchmark.
Senior executives whose remuneration was found to be positioned competitively relative to the peer group received an increase in line with the Wage Price Index (WPI).
V I R G I N A U S T R A L I A G R O U P2 0
Directors’ report (continued)
Remuneration report – audited (continued)Executive remuneration overview (continued)
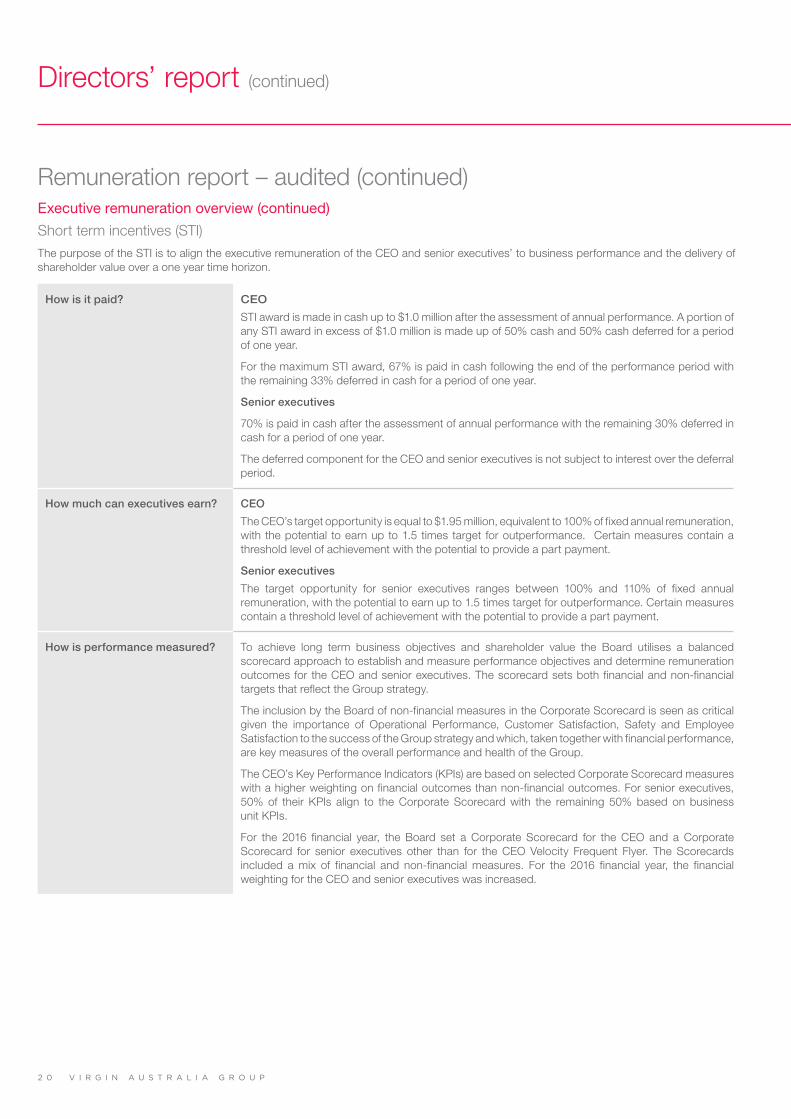
Short term incentives (STI)The purpose of the STI is to align the executive remuneration of the CEO and senior executives’ to business performance and the delivery of shareholder value over a one year time horizon.
How is it paid? CEO
STI award is made in cash up to $1.0 million after the assessment of annual performance. A portion of any STI award in excess of $1.0 million is made up of 50% cash and 50% cash deferred for a period of one year.
For the maximum STI award, 67% is paid in cash following the end of the performance period with the remaining 33% deferred in cash for a period of one year.
Senior executives
70% is paid in cash after the assessment of annual performance with the remaining 30% deferred in cash for a period of one year.
The deferred component for the CEO and senior executives is not subject to interest over the deferral period.
How much can executives earn? CEO
The CEO’s target opportunity is equal to $1.95 million, equivalent to 100% of fixed annual remuneration, with the potential to earn up to 1.5 times target for outperformance. Certain measures contain a threshold level of achievement with the potential to provide a part payment.
Senior executives
The target opportunity for senior executives ranges between 100% and 110% of fixed annual remuneration, with the potential to earn up to 1.5 times target for outperformance. Certain measures contain a threshold level of achievement with the potential to provide a part payment.
How is performance measured? To achieve long term business objectives and shareholder value the Board utilises a balanced scorecard approach to establish and measure performance objectives and determine remuneration outcomes for the CEO and senior executives. The scorecard sets both financial and non-financial targets that reflect the Group strategy.
The inclusion by the Board of non-financial measures in the Corporate Scorecard is seen as critical given the importance of Operational Performance, Customer Satisfaction, Safety and Employee Satisfaction to the success of the Group strategy and which, taken together with financial performance, are key measures of the overall performance and health of the Group.
The CEO’s Key Performance Indicators (KPIs) are based on selected Corporate Scorecard measures with a higher weighting on financial outcomes than non-financial outcomes. For senior executives, 50% of their KPIs align to the Corporate Scorecard with the remaining 50% based on business unit KPIs.
For the 2016 financial year, the Board set a Corporate Scorecard for the CEO and a Corporate Scorecard for senior executives other than for the CEO Velocity Frequent Flyer. The Scorecards included a mix of financial and non-financial measures. For the 2016 financial year, the financial weighting for the CEO and senior executives was increased.

A N N U A L F I N A N C I A L R E P O R T 2 0 1 6 2 1
How is performance measured? (continued)
CEO Scorecard
Category Weighting
Financial Profit
Underlying profit before tax(1)
50%
Return on Invested Capital
Group ROIC(2)
25%
Non-Financial Employee Satisfaction
Employee engagement
7.5%
Guest Satisfaction
Guest satisfaction
7.5%
Safety
Injury rate by risk
5%
Safety
% lost-time injury per million hours worked
5%
Senior executive Scorecard
Category Weighting
Financial Profit
Underlying profit before tax(1)
30%
Return on Invested Capital
Group ROIC(2)
25%
Non-Financial Operational
On Time Performance (OTP) relative to market
10%
Employee Satisfaction
Employee engagement
10%
Guest Satisfaction
Guest satisfaction
7.5%
Corporate and Government revenue mix
Corporate and Government revenue mix
7.5%
Safety
Injury rate by risk
5%
Safety
% lost-time injury per million hours worked
5%
(1) Underlying profit before tax is a non-statutory measure that represents statutory profit/(loss) before tax excluding the impact
of share of net profits/(losses) of equity-accounted investees, net loss on disposal of assets, impairment losses on assets
classified as held for sale, impairment losses on other assets, onerous contract expenses, business and capital restructure
and transaction costs, time value movement on cash flow hedges and unrealised ineffectiveness on cash flow hedges and
non-designated derivatives.
(2) ROIC is a non-statutory measure and is defined as ROIC EBIT as a percentage of Invested Capital. ROIC EBIT is a non-statutory
measure and is the sum of Underlying EBIT (as defined on page 9); adding back aircraft operating lease rentals and adjusting
for a notional depreciation on the capitalised value of aircraft operating lease rentals (7 times annual aircraft operating lease
rentals expense), or approximately 4% pa. Invested Capital is a non-statutory measure and is the average of Net Debt (as
defined in note E1 to the consolidated financial statements); plus seven times annual aircraft operating lease rentals; plus total
equity reported in the consolidated statement of financial position.
Remuneration report – audited (continued)Executive remuneration overview (continued)
Short term incentives (STI) (continued)
V I R G I N A U S T R A L I A G R O U P2 2
Directors’ report (continued)
Remuneration report – audited (continued)Executive remuneration overview (continued)
Short term incentives (STI) (continued)
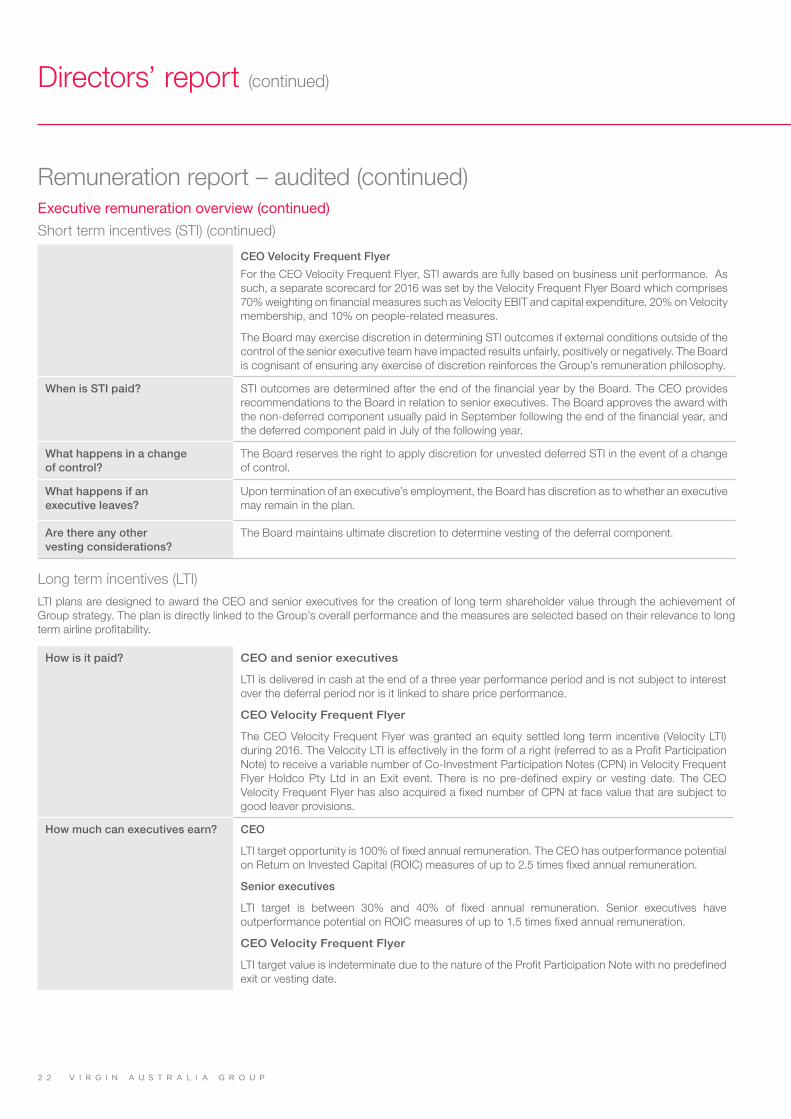
CEO Velocity Frequent Flyer
For the CEO Velocity Frequent Flyer, STI awards are fully based on business unit performance. As such, a separate scorecard for 2016 was set by the Velocity Frequent Flyer Board which comprises 70% weighting on financial measures such as Velocity EBIT and capital expenditure, 20% on Velocity membership, and 10% on people-related measures.
The Board may exercise discretion in determining STI outcomes if external conditions outside of the control of the senior executive team have impacted results unfairly, positively or negatively. The Board is cognisant of ensuring any exercise of discretion reinforces the Group’s remuneration philosophy.
When is STI paid? STI outcomes are determined after the end of the financial year by the Board. The CEO provides recommendations to the Board in relation to senior executives. The Board approves the award with the non-deferred component usually paid in September following the end of the financial year, and the deferred component paid in July of the following year.
What happens in a change of control?
The Board reserves the right to apply discretion for unvested deferred STI in the event of a change of control.
What happens if an executive leaves?
Upon termination of an executive’s employment, the Board has discretion as to whether an executive may remain in the plan.
Are there any other vesting considerations?
The Board maintains ultimate discretion to determine vesting of the deferral component.
Long term incentives (LTI)LTI plans are designed to award the CEO and senior executives for the creation of long term shareholder value through the achievement of Group strategy. The plan is directly linked to the Group’s overall performance and the measures are selected based on their relevance to long term airline profitability.
How is it paid? CEO and senior executives
LTI is delivered in cash at the end of a three year performance period and is not subject to interest over the deferral period nor is it linked to share price performance.
CEO Velocity Frequent Flyer
The CEO Velocity Frequent Flyer was granted an equity settled long term incentive (Velocity LTI) during 2016. The Velocity LTI is effectively in the form of a right (referred to as a Profit Participation Note) to receive a variable number of Co-Investment Participation Notes (CPN) in Velocity Frequent Flyer Holdco Pty Ltd in an Exit event. There is no pre-defined expiry or vesting date. The CEO Velocity Frequent Flyer has also acquired a fixed number of CPN at face value that are subject to good leaver provisions.
How much can executives earn? CEO
LTI target opportunity is 100% of fixed annual remuneration. The CEO has outperformance potential on Return on Invested Capital (ROIC) measures of up to 2.5 times fixed annual remuneration.
Senior executives
LTI target is between 30% and 40% of fixed annual remuneration. Senior executives have outperformance potential on ROIC measures of up to 1.5 times fixed annual remuneration.
CEO Velocity Frequent Flyer
LTI target value is indeterminate due to the nature of the Profit Participation Note with no predefined exit or vesting date.

A N N U A L F I N A N C I A L R E P O R T 2 0 1 6 2 3
Remuneration report – audited (continued)Executive remuneration overview (continued)
Long term incentives (LTI) (continued)How is performance measured? CEO and senior executives
ROIC is measured over a three year period. The vesting schedule is linear from Threshold to Target and from Target to Maximum.
The Board acknowledges that whilst relative Total Shareholder Return (TSR) is widely utilised, ROIC is seen as a more appropriate measure for the Group given the shareholder structure and low free float of the company. ROIC is viewed by the Board as an important indicator of long term sustainability and profitability for an airline, and is closely aligned to Group performance. ROIC links explicitly to the Group’s strategy of driving future earnings growth for long term shareholder return.
The Board may exercise discretion in determining LTI vesting if external conditions outside of the control of the senior executive team have impacted results unfairly, positively or negatively. The Board is cognisant of ensuring any exercise of discretion reinforces the Group’s remuneration philosophy.
No LTI plans have an additional testing date.
CEO Velocity Frequent Flyer
The Velocity LTI entitles the recipient to participate in the upside value of the business that may be generated in the future and is subject to continuing employment and good leaver provisions. The entitlement will only vest on the occurrence of a pre-defined exit event where the investors (Virgin Australia Group or Affinity Equity Partners (Affinity)) dispose of their interest in Velocity. The amount that may be earned is variable depending on agreed hurdle rates in the disposal value earned by the investors.
The Velocity Frequent Flyer LTI is in the form of a right (referred to as a Profit Participation Note) to receive a variable number of Co-Investment Participation Notes in Velocity Frequent Flyer Holdco Pty Ltd in an Exit event.
What happens if an executive leaves?
Upon termination of a participant’s employment, all awards under the LTI plan are no longer payable. In certain circumstances and at the discretion of the Board, a participant may retain their awards under the LTI plan after termination of employment on the same terms under which they were originally issued. Any payment amount is pro-rated based on length of service.
What happens in a change of control?
The Board may resolve that all LTI cash-settled performance plans will immediately become payable.
Are there any forfeiture conditions?
The Board maintains ultimate discretion to determine vesting.

V I R G I N A U S T R A L I A G R O U P2 4
Directors’ report (continued)
Cash-settled performance plans granted in prior financial yearsOperational and design aspects of the cash-settled performance plans in the table below are outlined in the section above with the exception of the performance hurdles for LTI grant 1 and 3.
For LTI grant 1, the TSR performance hurdle is measurable in accordance with the description provided later within this section.
Grant Grant Date Participants Performance Hurdle Test Date
LTI 1 30 Jun 2014 Senior executives(1)(2) TSR 30 Jun 2016
LTI 2 2 Oct 2014 Senior executives(1)(2) ROIC 30 Jun 2017
LTI 3 15 Oct 2014 CEO 50% ROIC
50% Corporate Performance Measures
30 Jun 2017
LTI 4 1 Jul 2014 CEO Tigerair Australia Outperformance of Financial Measures
30 Jun 2016
LTI 5 18 Sep 2015(3) Senior executives(2) ROIC 30 Jun 2018
LTI 6 11 Sep 2015 CEO ROIC 30 Jun 2018
(1) Excludes CEO Tigerair Australia(2) Excludes CEO Velocity Frequent Flyer
(3) Grant date for CEO Tigerair Australia was 25 November 2015
For LTI grant 3, the CEO’s corporate measures are determined by the Board. The Board has concluded that certain strategic and operational initiatives, if delivered, will provide a long term sustainable operating platform for the Company and will ultimately result in strong alignment with shareholder value creation. Such initiatives are generally implemented over a period in excess of one year and therefore results are achieved over time.
These initiatives are fundamental to the success of the Group. The performance measures include specific targets in relation to the growth of Corporate and Government revenue targets, performance of Tigerair Australia, performance of the Velocity Frequent Flyer program and Group safety outcomes.
LTI option plans granted in prior financial years Operational and design aspects of the senior executive option plan (SEOP) are detailed below.
Plan Name Grant Date Participants Performance Hurdle Test Date
SEOP 17 1 May 2013 Senior executives and senior management
TSR 30 June 2015
SEOP 19 1 May 2013 CEO 50% TSR50% Corporate Performance Measures
30 June 2015
SEOP 20 20 Dec 2013 CEO 50% TSR50% Corporate Performance Measures
30 June 2016
Remuneration report – audited (continued)Executive remuneration overview (continued)

A N N U A L F I N A N C I A L R E P O R T 2 0 1 6 2 5
Remuneration report – audited (continued)Executive remuneration overview (continued)
LTI option plans granted in prior financial years (continued)
How is it paid? Zero exercise price options. Each zero exercise price option provides a right to acquire one fully paid ordinary share in the Company provided the specific performance measures are met.
How is performance measured? TSR
TSR is relative to the S&P/ASX 200 Index (excluding financial services and resource companies) over three years. TSR includes share price growth, dividends and other capital adjustments.
The TSR performance hurdles are set out in the following table:
Group Relative TSR % of options that vest
Below 50th percentile 0%
50th percentile 50%
Between 51st and 74th percentile 2% increase for each percentile ranking above 50th
75th percentile 100%
TSR is calculated using a 30 day volume weighted average price (VWAP) for VAH shares at the start and end date of the performance period. No LTI options plans have an additional testing date.
Corporate measures
Corporate measures include specific targets in relation to the growth of Corporate and Government related business, performance of the Velocity Frequent Flyer program and Group safety outcomes and productivity enhancements (for SEOP 19 only).
When is performance measured? Performance is measured at the conclusion of the three year performance period. 60% of options will vest immediately at the end of the performance period with the remaining 40% vesting 1 year later.
How is it paid? Exercised entitlements will be satisfied by an allotment of new securities or securities held in the KEPP trust. Any vested options are exercisable during the period commencing on the date of each year’s annual results and the period concluding 30 June in the following year.
What happens if an executive leaves?
Upon termination of a participant’s employment, all zero exercise price options issued to that participant will lapse. In certain circumstances and at the discretion of the Board, a participant may retain their options after termination of employment, on the same terms under which they were originally issued.
What happens in a change of control?
Upon a change of control of the Group, the Board may resolve that all options will immediately become exercisable.
Are there any forfeiture conditions? The Board maintains ultimate discretion to determine vesting.
Service agreementsEach executive has a formal contract, or “service agreement” that is of a continuing nature (subject to termination conditions). The terms of the service agreements for the CEO and senior executives are summarised below.
Position Notice Period Employer(1) Notice Period Employee
CEO 12 months 6 months(2)
Senior executive 6 months 6 months
(1) The Group may terminate without notice in the event of any act which detrimentally affects the Group (such as dishonesty, fraud or serious or wilful misconduct in the discharge of his / her duties or unremedied, persistent, wilful or material breaches of the terms of his / her service agreement).
(2) The CEO may terminate his employment by giving the Group 30 days’ notice in writing on occurrence of a fundamental change (if the CEO ceases to be the most senior executive in the Company, there is substantial diminution in his role and responsibilities or the Company ceases to be listed on a recognised stock exchange), and receives payment equal to 12 months’ fixed remuneration.
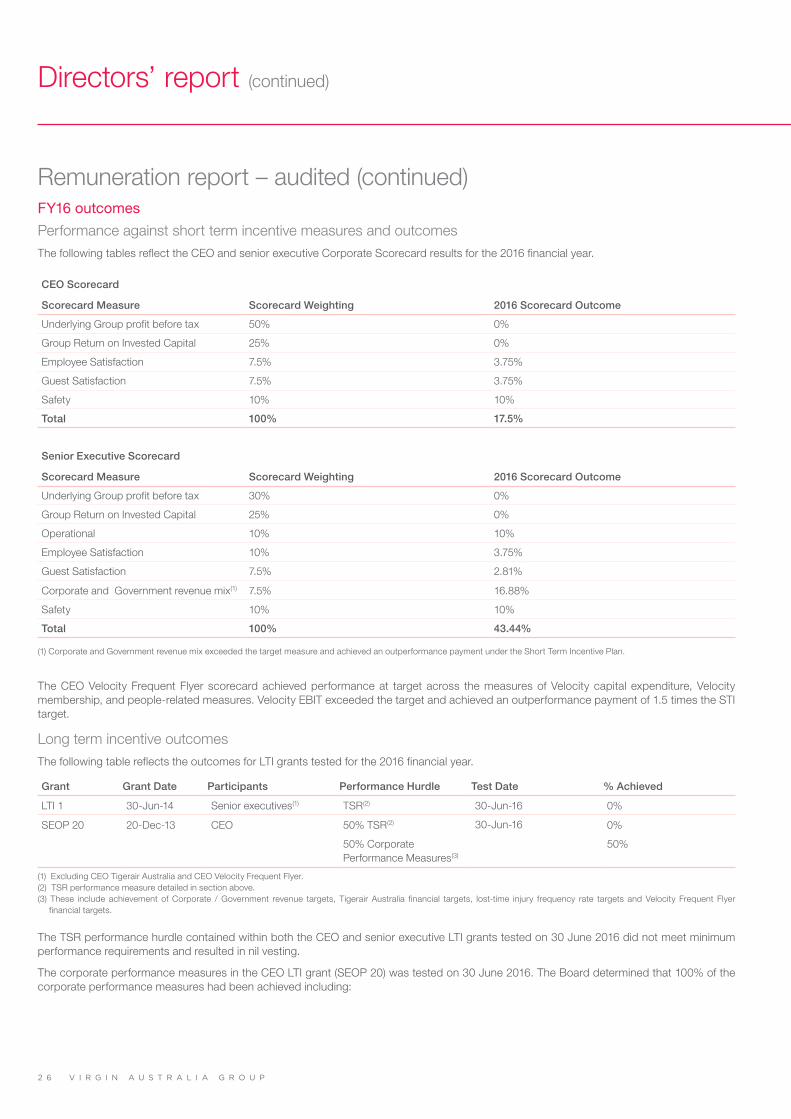
V I R G I N A U S T R A L I A G R O U P2 6
Directors’ report (continued)
Remuneration report – audited (continued)FY16 outcomes
Performance against short term incentive measures and outcomesThe following tables reflect the CEO and senior executive Corporate Scorecard results for the 2016 financial year.
CEO Scorecard
Scorecard Measure Scorecard Weighting 2016 Scorecard Outcome
Underlying Group profit before tax 50% 0%
Group Return on Invested Capital 25% 0%
Employee Satisfaction 7.5% 3.75%
Guest Satisfaction 7.5% 3.75%
Safety 10% 10%
Total 100% 17.5%
Senior Executive Scorecard
Scorecard Measure Scorecard Weighting 2016 Scorecard Outcome
Underlying Group profit before tax 30% 0%
Group Return on Invested Capital 25% 0%
Operational 10% 10%
Employee Satisfaction 10% 3.75%
Guest Satisfaction 7.5% 2.81%
Corporate and Government revenue mix(1) 7.5% 16.88%
Safety 10% 10%
Total 100% 43.44%
(1) Corporate and Government revenue mix exceeded the target measure and achieved an outperformance payment under the Short Term Incentive Plan.
The CEO Velocity Frequent Flyer scorecard achieved performance at target across the measures of Velocity capital expenditure, Velocity membership, and people-related measures. Velocity EBIT exceeded the target and achieved an outperformance payment of 1.5 times the STI target.
Long term incentive outcomes The following table reflects the outcomes for LTI grants tested for the 2016 financial year.
Grant Grant Date Participants Performance Hurdle Test Date % Achieved
LTI 1 30-Jun-14 Senior executives(1) TSR(2) 30-Jun-16 0%
SEOP 20 20-Dec-13 CEO 50% TSR(2) 30-Jun-16 0%
50% Corporate Performance Measures(3)
50%
(1) Excluding CEO Tigerair Australia and CEO Velocity Frequent Flyer.(2) TSR performance measure detailed in section above.(3) These include achievement of Corporate / Government revenue targets, Tigerair Australia financial targets, lost-time injury frequency rate targets and Velocity Frequent Flyer
financial targets.
The TSR performance hurdle contained within both the CEO and senior executive LTI grants tested on 30 June 2016 did not meet minimum performance requirements and resulted in nil vesting.
The corporate performance measures in the CEO LTI grant (SEOP 20) was tested on 30 June 2016. The Board determined that 100% of the corporate performance measures had been achieved including:

A N N U A L F I N A N C I A L R E P O R T 2 0 1 6 2 7
Remuneration report – audited (continued)FY16 outcomes (continued)
Long term incentive outcomes (continued)• Achievement of Corporate / Government revenue targets;• Achievement of Tigerair Australia financial performance;• Achievement of Velocity Frequent Flyer financial performance; and• Achievement of lost-time injury frequency rate targets.The CEO Tigerair Australia participated in a long term incentive plan (LTI 4) which was tested on 30 June 2016, which included performance over the period 1 July 2014 to 30 June 2016. LTI 4 was determined by the Tigerair Australia Board prior to the assumption of full ownership by the Group in February 2015. The LTI 4 plan achieved a partial vesting against the financial measures over the performance period and the CEO Tigerair Australia was awarded $153,000 of a possible $360,000.
Overview of company performanceThe table below provides summary information on the Group’s financial performance and the effect on shareholder wealth for the five years to 30 June 2016.
Financial year 2016 2015 2014 2013 2012
Segment EBIT ($m) 210.6 65.9 (126.0) 6.0 116.7
Underlying group profit / (loss) before tax ($m) 41.0 (49.1) (211.7) (93.8) (82.5)
Net (loss)/profit attributable to owners ($m) (260.9) (110.8) (353.8) (98.1) 22.8
Share price ($) 0.21 0.43 0.43 0.43 0.39
Change in share price ($) (0.22) – – 0.04 0.11
Dividends paid ($m) – – – – –
TSR (%) (51.8) – – 10.3 39.3
EPS (cents) (7.4) (3.2) (11.4) (4.1) 1.0
ROIC (%) 8.9 6.1 1.7 3.5 9.2
Actual remuneration outcome for executives in FY16The actual remuneration paid to the CEO and senior executives in FY16 is set out below. This provides shareholders with a view of the remuneration actually paid to executives for performance in FY16, and the value of deferred STI and LTI that vested during the period. This differs from the remuneration details prepared in accordance with statutory obligation and accounting standards, as those details include the value of equity that have been awarded which may or may not vest.
NameFixed Annual Remuneration (FAR) STI Cash STI Deferred(1)
Other Long Term benefits(2) LTI Vested(3)
Total Actual Remuneration
John Borghetti $1,950,000 $341,250 $242,000 $0 $324,497 $2,857,747
Merren McArthur $565,000 $220,128 $256,129 $0 $0 $1,041,257
Robert Sharp $615,000 $179,599 $113,160 $0 $153,000 $1,060,759
Mark Hassell $526,401 $132,838 $211,922 $0 $0 $871,161
Judith Crompton $580,000 $133,219 $187,548 $0 $0 $900,767
Gary Hammes $644,046 $177,073 $203,855 $0 $0 $1,024,974
Lawrence Turner(4) $291,985 $130,082 $10,291(5) $0 $0 $432,358
Karl Schuster(6) $412,500 $324,844 $0 $200,000 $0 $937,344
Geoff Smith(7) $511,471 $190,887 $40,292(8) $0 $0 $742,650
(1) The STI deferred reflects the value of 2013 and 2014 performance rights and 2015 deferred cash that have vested.(2) Other long term benefits includes a one off commencement bonus of $200,000 which was paid following Mr K Schuster’s commencement as CEO Velocity Frequent Flyer. The
commencement bonus may be clawed back should the CEO Velocity Frequent Flyer be deemed a bad leaver or resign his position within two years of commencement.(3) The intrinsic value of LTI (cash, options) that vested during the financial year based on the share price on the date of vesting. It includes a one-off cash payment of $49,834 to
compensate for the impact that the Entitlement Offer launched on 6 July 2016 had on SEOP 20 as an unvested employee option plan. This amount reflects 60% of the total payment. The remaining 40% ($33,223) will be paid in July 2017 in line with the vesting schedule of SEOP 20.
(4) Mr L Turner commenced as KMP on 1 December 2015. This reflects actual fixed annual remuneration received and has not been annualised.(5) This reflects the value of deferred STI earned by Mr L Turner prior to commencing as KMP.(6) Mr K Schuster commenced as KMP on 1 October 2015. This reflects actual fixed annual remuneration received and has not been annualised. (7) Mr G Smith commenced as KMP on 23 September 2015 in the role of Acting Chief Financial Officer. He was appointed Chief Financial Officer effective 13 November 2015. This reflects
an actual figure, based on the fixed remuneration for each role.(8) This reflects the value of deferred STI earned by Mr G Smith prior to commencing as KMP.

V I R G I N A U S T R A L I A G R O U P2 8
Directors’ report (continued)
Remuneration report – audited (continued)Non-executive director remuneration
Virgin Australia Holdings LimitedNon-executive directors receive a base fee. Where non-executive directors participate in a Board committee, an additional fee is payable in recognition of the increased workload and additional responsibilities. The committee chair receives a premium over committee member fees reflecting the relative role responsibilities and expected time commitment. The Chairman of the Board receives no extra remuneration for participating in or chairing committees.
Non-executive directors do not receive bonuses or any other incentive payments and are not eligible to participate in any of the executive or employee share acquisition plans established by the Group. Non-executive directors are not entitled to any termination benefits.
The maximum aggregate fee pool available to non-executive directors is $1.2 million per annum (excluding industry standard travel entitlements received), as approved by shareholders at the Group’s Annual General Meeting in November 2011.
Director fees were last reviewed and increased in March 2010. The fees paid to non-executive directors are set out in the table below. Fees are annual fees unless otherwise stated and are inclusive of superannuation.
BoardAudit and Risk Management Committee
Remuneration Committee
Nomination Committee
Safety and Operational Risk Committee
Chair $175,000 $25,000 $25,000 Nil $25,000
Members $85,000 $10,000 $10,000 Nil $10,000
Virgin Australia International Holdings Pty LtdMembers of the Board of Directors of Virgin Australia International Holdings Pty Ltd (VAIH), which under Accounting Standards is a controlled entity of the Company, receive an annual fee of $75,000, while the Chairman receives an annual fee of $140,000.
Mr J Borghetti, in his capacity as a director of this Board, has elected to receive 50 per cent of the annual director fee, $37,500, and has elected to donate this annual director fee to charity.
Travel entitlementsAll non-executive directors and their eligible beneficiaries receive travel entitlements. Flights are not cumulative and lapse if they are not used during the financial year in which the entitlement exists. The entitlement will remain in place for the remainder of the financial year in which the participant ceases to be a non-executive director of the Group and will then cease. The accounting value of the travel benefit is captured in the remuneration table (as a non-monetary benefit) for travel during the relevant financial year.

A N N U A L F I N A N C I A L R E P O R T 2 0 1 6 2 9
Remuneration report – audited (continued)Statutory tables
Non-executive directorsDetails of the remuneration of non-executive directors for the financial years ended 30 June 2016 and 30 June 2015 are set out in this section.
Cash salary and Fees
Non-monetary benefits(1)
Superannuation benefits
Total compensation
Year $’000 $’000 $’000 $’000
Non-Executive Directors
Ms E Bryan(2) 2016 228 – 22 250
2015 26 – 3 29
Ms S Mostyn 2016 108 – 10 118
2015 100 45 10 155
Mr R Thomas 2016 110 13 10 133
2015 110 7 10 127
The Hon. M Vaile AO 2016 110 4 10 124
2015 110 3 10 123
Mr D Baxby 2016 87 78 8 173
2015 87 9 8 104
Mr B Matheu(3) 2016 – – – –
2015 – – – –
Mr JP Moorhead 2016 59 – 6 65
(appointed 22 September 2015) 2015 – – – –
Mr M Tan 2016 38 – 4 42
(appointed 1 January 2016) 2015 – – – –
Mr J Bayliss 2016 17 – 2 19
(ceased 22 September 2015) 2015 77 – 8 85
Mr G C Phong 2016 39 – 4 43
(ceased 1 January 2016) 2015 76 – 8 84
Mr C Luxon 2016 64 – 7 71
(ceased 30 March 2016) 2015 85 – 9 94
Mr N Chatfield 2016 – – – –
(ceased 20 May 2015) 2015 173 50 16 239
Alternate Directors
Mr U Huttmeyer 2016 – – – –
2015 – – – –
Mr T P Teck 2016 – – – –
(appointed 1 January 2016) 2015 – – – –
Mr R McDonald 2016 – – – –
(ceased 30 March 2016) 2015 – – – –
Mr JP Moorhead 2016 – – – –
(ceased 22 September 2015) 2015 – – – –
Mr M Tan 2016 – – – –
(ceased 1 January 2016) 2015 – – – –
(1) Non-monetary benefits include travel entitlements and expatriate benefits such as relocation.
(2) Ms E Bryan’s compensation includes directors fees of $68,493 (2015: 7,882) and superannuation of $6,507 (2015: 1,747) relating to her services provided to VAIH in her
capacity as director.
(3) Etihad Airways has opted not to receive fees on Mr B Matheu’s behalf.

V I R G I N A U S T R A L I A G R O U P3 0
Directors’ report (continued)
Remuneration report – audited (continued)Statutory tables (continued)Key management personnelDetails of the remuneration of KMP for the financial years ended 30 June 2016 and 30 June 2015 in line with the AASB 2 requirements are set out in this section.
Short term benefits
Total compen-
sation (excluding unvested
LTI)
Equity settled share-based
payments
Perfor- mance related remun- eration
Short term benefitsLong term benefits Other
Cash salary
and fees
Cash settled
STI
Other short term
benefits Total
Deferred cash
settled STI
Non- monetary
(1)
Equity-settled
STI share-based
payments
Other long term
benefits (2)
Superan-nuation
benefits
Termi-nation
benefitsUnvested
LTI(3)
Year $’000 $’000 $’000 $’000 $’000 $’000 $’000 $’000 $’000 $’000 $’000 $’000% of total
Executive Director
Mr J Borghetti(4)(5)2016 1,931 341 50 2,322 121 16 – 238 19 – 2,716 375 29
2015 1,531 1,000 – 2,531 280 10 – – 19 – 2,840 796 57
Other key management personnel of the group
Mr M Hassell 2016 497 133 – 630 113 153 5 – 19 – 920 – 27
2015 470 393 – 863 135 91 26 – 19 – 1,134 38 48
Ms J Crompton 2016 550 133 – 683 110 22 4 – 19 – 838 – 29
2015 464 382 – 846 145 26 17 – 19 – 1,053 38 52
Ms M McArthur 2016 555 220 – 775 138 48 6 – 19 – 986 – 36
2015 444 424 – 868 152 115 39 – 19 – 1,193 43 50
Mr G Hammes 2016 620 177 – 797 140 181 – – 19 – 1,137 – 28
2015 577 476 – 1,053 125 285 – – 19 – 1,482 – 41
Mr R Sharp(6)2016 597 180 – 777 95 – – – 35 – 907 – 30
2015 413 198 – 611 57 – – – 25 – 693 – 37
Mr G Smith2016 496 191 – 687 41 1 3 25 16 – 773 – 30
(commenced 23 September 2015) 2015 – – – – – – – – – – – – n/a
Mr K Schuster 2016 396 325 – 721 70 102 – 75 14 – 982 261 53
(commenced 1 October 2015) 2015 – – – – – – – – – – – – n/a
Mr L Turner 2016 275 130 – 405 28 8 2 – 11 – 454 – 35
(commenced 1 December 2015) 2015 – – – – – – – – – – – – n/a
Mr S Narayan 2016 171 142 – 313 – 17 – – 9 – 339 – 42
(ceased 23 September 2015) 2015 745 636 – 1,381 210 13 46 – 19 – 1,669 216 56
Mr N Thompson(7) 2016 32 99 – 131 – 2 5 – 1 511 650 – 15
(ceased 15 July 2015) 2015 483 462 – 945 159 29 22 – 19 – 1,174 51 55
(1) Non-monetary benefits include travel entitlements and expatriate benefits such as relocation.(2) Other Long term Benefits include movement in annual leave. The accounting value of other long term benefits may be negative. for example where an Executive‘s annual leave
balances decreases as a result of taking more than 20 days annual leave they accrue during the year. Long term benefits for Mr K Schuster includes a one off commencement bonus of $200,000 which was paid following his commencement as CEO Velocity Frequent Flyer. The commencement bonus may be clawed back should the CEO Velocity Frequent Flyer be deemed a bad leaver or resign his position within two years of commencement.
(3) Unvested LTI includes compensation awarded to certain performance and retention conditions and is payable in future financial years to the extent that these conditions are achieved.(4) Cash salary and fees for Mr J Borghetti includes Directors fees of $37,500 (2015: $37,500) relating to his services provided to VAIH in his capacity as director, which he has elected
to donate to charity. (5) Short term benefits include a one-off cash payment of $49,834 to compensate for the impact that the Entitlement Offer launched on 6 July 2016 had on SEOP 20 as an unvested
employee option plan. This amount reflects 60% of the total payment. The remaining 40% ($33,223) will be paid in July 2017 in line with the vesting schedule of SEOP 20.(6) Prior year figure for ‘Deferred cash-settled STI’ have been restated to record the deferred component of FY15 STI over two years in accordance with accrual basis.(7) The relevant Accounting Standard requires that certain payments be treated as termination benefits, although not so regarded for the purposes of Division 2 Part 2D.2 of the
Corporations Act.
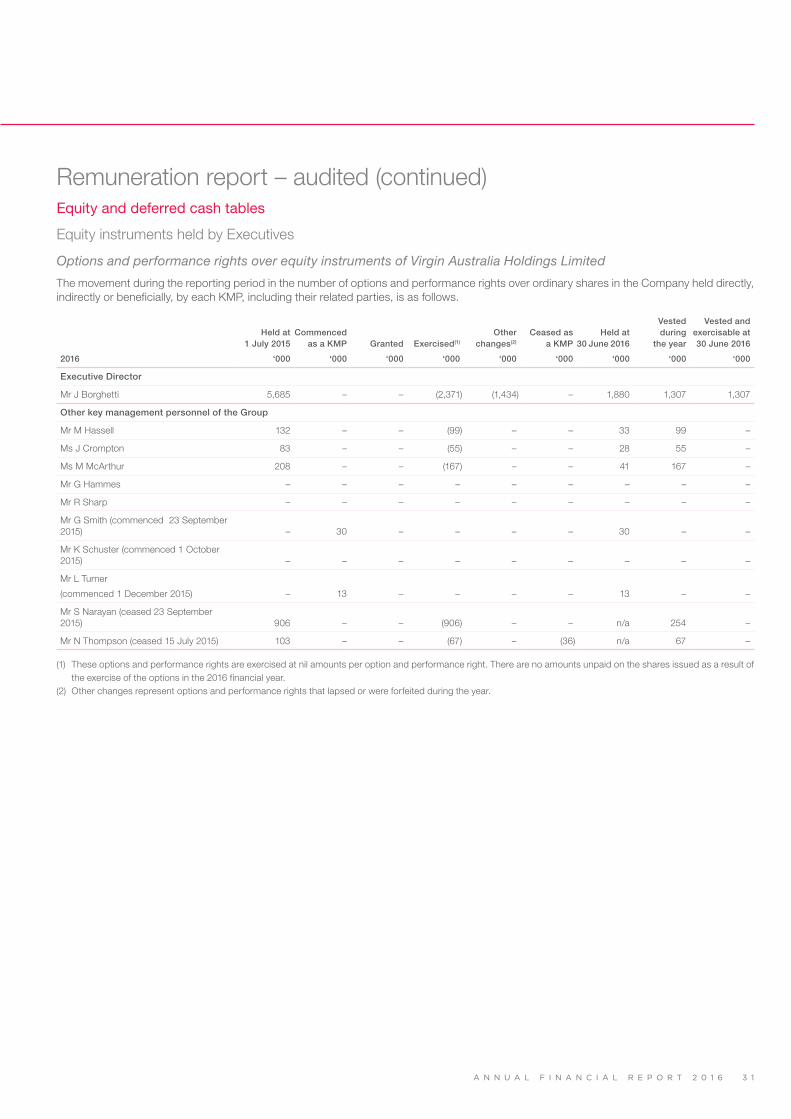
A N N U A L F I N A N C I A L R E P O R T 2 0 1 6 3 1
Remuneration report – audited (continued)Equity and deferred cash tables
Equity instruments held by Executives
Options and performance rights over equity instruments of Virgin Australia Holdings Limited
The movement during the reporting period in the number of options and performance rights over ordinary shares in the Company held directly, indirectly or beneficially, by each KMP, including their related parties, is as follows.
2016
Held at 1 July 2015
‘000
Commenced as a KMP
‘000
Granted
‘000
Exercised(1)
‘000
Other changes(2)
‘000
Ceased as a KMP
‘000
Held at 30 June 2016
‘000
Vested during
the year
‘000
Vested and exercisable at 30 June 2016
‘000
Executive Director
Mr J Borghetti 5,685 – – (2,371) (1,434) – 1,880 1,307 1,307
Other key management personnel of the Group
Mr M Hassell 132 – – (99) – – 33 99 –
Ms J Crompton 83 – – (55) – – 28 55 –
Ms M McArthur 208 – – (167) – – 41 167 –
Mr G Hammes – – – – – – – – –
Mr R Sharp – – – – – – – – –
Mr G Smith (commenced 23 September 2015) – 30 – – – – 30 – –
Mr K Schuster (commenced 1 October 2015) – – – – – – – – –
Mr L Turner
(commenced 1 December 2015) – 13 – – – – 13 – –
Mr S Narayan (ceased 23 September 2015) 906 – – (906) – – n/a 254 –
Mr N Thompson (ceased 15 July 2015) 103 – – (67) – (36) n/a 67 –
(1) These options and performance rights are exercised at nil amounts per option and performance right. There are no amounts unpaid on the shares issued as a result of the exercise of the options in the 2016 financial year.
(2) Other changes represent options and performance rights that lapsed or were forfeited during the year.

V I R G I N A U S T R A L I A G R O U P3 2
Directors’ report (continued)
Remuneration report – audited (continued)Equity and deferred cash tables (continued)
LTI – Cash-settled performance plan compensation granted during the 2016 financial year and previous plansGrants under the cash-settled performance plan granted during the 2016 financial year and previous on foot cash grants are detailed below.
During the reporting period, $153,000 (2015: $nil) awards were paid as compensation. Details of awards provided as LTI compensation, exercised and lapsed, including vesting profiles, during the period in which each individual was considered to be KMP, are detailed in the table below. Nil awards were forfeited during the financial year. No further compensation has been awarded since the end of the financial year.
Value of cash-settled performance rights
Rem
ain
ing
po
ssib
le
valu
e in
fu
ture
fi
nan
cial
yea
rs
Min
imu
m p
oss
ible
to
tal v
alu
e in
fu
ture
fi
nan
cial
yea
rs
2016 Dat
e g
ran
ted
Per
form
ance
pla
n
Bal
ance
at
beg
inn
ing
of
year
Gra
nte
d in
yea
r
Ves
ted
in
yea
r
Lap
sed
in y
ear
Bal
ance
at
end
of
year
Ves
ted
in y
ear
Lap
sed
in y
ear
Fin
anci
al y
ears
in
wh
ich
gra
nt
vest
s
Exp
iry
Dat
e
$’000 $’000 $’000 $’000 $’000 % % $’000 $’000
Executive Director
Mr J Borghetti 15-Oct-14 LTI3 417 417 – – 834 0 0 30-Jun-17 30-Jun-18 416 –
11-Sep-15 LTI6 – 650 – – 650 0 0 30-Jun-18 30-Jun-19 1,300 –
Current Executives
Mr M Hassell 30-Jun-14 LTI1 100 50 – (150) – 0 100 30-Jun-16 30-Jun-17 – –
2-Oct-14 LTI2 52 52 – – 104 0 0 30-Jun-17 30-Jun-18 51 –
18-Sep-15 LTI5 – 52 – – 52 0 0 30-Jun-18 30-Jun-19 103 –
Ms J Crompton 30-Jun-14 LTI1 126 64 – (190) – 0 100 30-Jun-16 30-Jun-17 – –
2-Oct-14 LTI2 63 63 – – 126 0 0 30-Jun-17 30-Jun-18 64 –
18-Sep-15 LTI5 – 68 – – 68 0 0 30-Jun-18 30-Jun-19 137 –
Ms M McArthur 30-Jun-14 LTI1 114 56 – (170) – 0 100 30-Jun-16 30-Jun-17 – –
2-Oct-14 LTI2 57 57 – – 114 0 0 30-Jun-17 30-Jun-18 56 –
18-Sep-15 LTI5 – 63 – – 63 0 0 30-Jun-18 30-Jun-19 127 –
Mr G Hammes 30-Jun-14 LTI1 87 63 – (150) – 0 100 30-Jun-16 30-Jun-17 – –
2-Oct-14 LTI2 63 63 – – 126 0 0 30-Jun-17 30-Jun-18 63 –
18-Sep-15 LTI5 – 63 – – 63 0 0 30-Jun-18 30-Jun-19 127 –
Mr R Sharp 1-Jul-14 LTI4 180 180 (153) (207) – 43 57 30-Jun-16 30-Jun-17 – –
25-Nov-15 LTI5 – 62 – – 62 0 0 30-Jun-18 30-Jun-19 123 –
Mr G Smith 30-Jun-14 (1) LTI1 59 29 – (88) – 0 100 30-Jun-16 30-Jun-17 – –
(commenced 23 September 2015)
2-Oct-14 (1) LTI2 35 35 – – 70 0 0 30-Jun-17 30-Jun-18 35 –
13-Nov-15 LTI5 – 70 – – 70 0 0 30-Jun-18 30-Jun-19 140 –
Mr L Turner 30-Jun-14 (2) LTI1 84 42 (126) – 0 100 30-Jun-16 30-Jun-17 – –
(commenced
1 December 2015)
2-Oct-14 (2) LTI2 42 42 – – 84 0 0 30-Jun-17 30-Jun-18 42 –
1-Dec-15 LTI5 – 50 – – 50 0 0 30-Jun-18 30-Jun-19 100 –
Former Executives
Mr S Narayan 30-Jun-14 LTI1 206 105 – (311) – 0 100 30-Jun-16 30-Jun-17 – –
(ceased 23 September 2015) 2-Oct-14 LTI2 103 103 – (206) – 0 100 30-Jun-17 30-Jun-18 – –
Mr N Thompson 30-Jun-14 LTI1 134 66 – (200) – 0 100 30-Jun-16 30-Jun-17 – –
(ceased 15 July 2015) 2-Oct-14 LTI2 67 67 – – 134 0 0 30-Jun-17 30-Jun-18 66 –
(1) Relates to performance rights granted to Mr G Smith when he held a non-KMP position. Balance at the beginning of year is reflected as at date of commencement
as KMP.
(2) Relates to performance rights granted to Mr L Turner when he held a non-KMP position. Balance at the beginning of year is reflected as at date of commencement
as KMP.
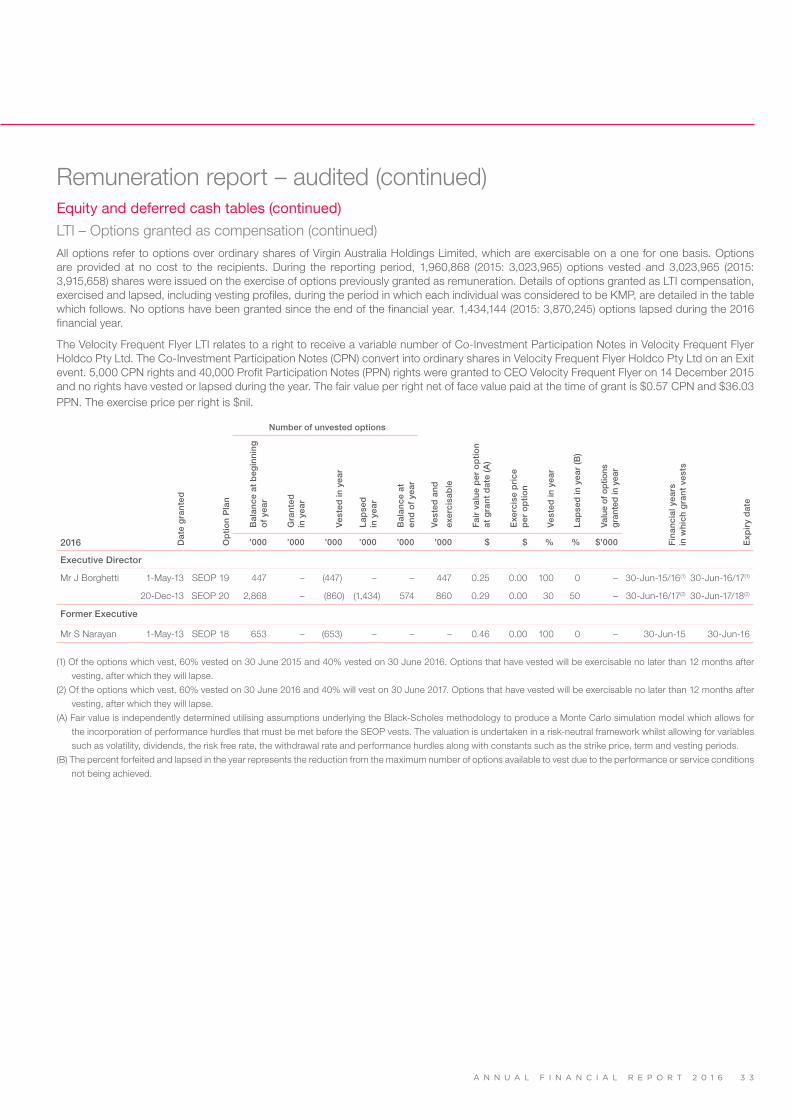
A N N U A L F I N A N C I A L R E P O R T 2 0 1 6 3 3
Remuneration report – audited (continued)Equity and deferred cash tables (continued)
LTI – Options granted as compensation (continued)All options refer to options over ordinary shares of Virgin Australia Holdings Limited, which are exercisable on a one for one basis. Options are provided at no cost to the recipients. During the reporting period, 1,960,868 (2015: 3,023,965) options vested and 3,023,965 (2015: 3,915,658) shares were issued on the exercise of options previously granted as remuneration. Details of options granted as LTI compensation, exercised and lapsed, including vesting profiles, during the period in which each individual was considered to be KMP, are detailed in the table which follows. No options have been granted since the end of the financial year. 1,434,144 (2015: 3,870,245) options lapsed during the 2016 financial year.
The Velocity Frequent Flyer LTI relates to a right to receive a variable number of Co-Investment Participation Notes in Velocity Frequent Flyer Holdco Pty Ltd. The Co-Investment Participation Notes (CPN) convert into ordinary shares in Velocity Frequent Flyer Holdco Pty Ltd on an Exit event. 5,000 CPN rights and 40,000 Profit Participation Notes (PPN) rights were granted to CEO Velocity Frequent Flyer on 14 December 2015 and no rights have vested or lapsed during the year. The fair value per right net of face value paid at the time of grant is $0.57 CPN and $36.03 PPN. The exercise price per right is $nil.
Number of unvested options
2016 Dat
e g
ran
ted
Op
tio
n P
lan
Bal
ance
at
beg
inn
ing
o
f ye
ar
Gra
nte
d
in y
ear
Ves
ted
in y
ear
Lap
sed
in
yea
r
Bal
ance
at
end
of
year
Ves
ted
an
d
exer
cisa
ble
Fai
r va
lue
per
op
tio
n at
gra
nt
dat
e (A
)
Exe
rcis
e p
rice
p
er o
pti
on
Ves
ted
in y
ear
Lap
sed
in y
ear
(B)
Valu
e of
op
tions
g
rant
ed in
yea
r
Fin
anci
al y
ears
in
wh
ich
gra
nt
vest
s
Exp
iry
dat
e
’000 ’000 ’000 ’000 ’000 ’000 $ $ % % $’000
Executive Director
Mr J Borghetti 1-May-13 SEOP 19 447 – (447) – – 447 0.25 0.00 100 0 – 30-Jun-15/16(1) 30-Jun-16/17(1)
20-Dec-13 SEOP 20 2,868 – (860) (1,434) 574 860 0.29 0.00 30 50 – 30-Jun-16/17(2) 30-Jun-17/18(2)
Former Executive
Mr S Narayan 1-May-13 SEOP 18 653 – (653) – – – 0.46 0.00 100 0 – 30-Jun-15 30-Jun-16
(1) Of the options which vest, 60% vested on 30 June 2015 and 40% vested on 30 June 2016. Options that have vested will be exercisable no later than 12 months after
vesting, after which they will lapse.
(2) Of the options which vest, 60% vested on 30 June 2016 and 40% will vest on 30 June 2017. Options that have vested will be exercisable no later than 12 months after
vesting, after which they will lapse.
(A) Fair value is independently determined utilising assumptions underlying the Black-Scholes methodology to produce a Monte Carlo simulation model which allows for
the incorporation of performance hurdles that must be met before the SEOP vests. The valuation is undertaken in a risk-neutral framework whilst allowing for variables
such as volatility, dividends, the risk free rate, the withdrawal rate and performance hurdles along with constants such as the strike price, term and vesting periods.
(B) The percent forfeited and lapsed in the year represents the reduction from the maximum number of options available to vest due to the performance or service conditions
not being achieved.
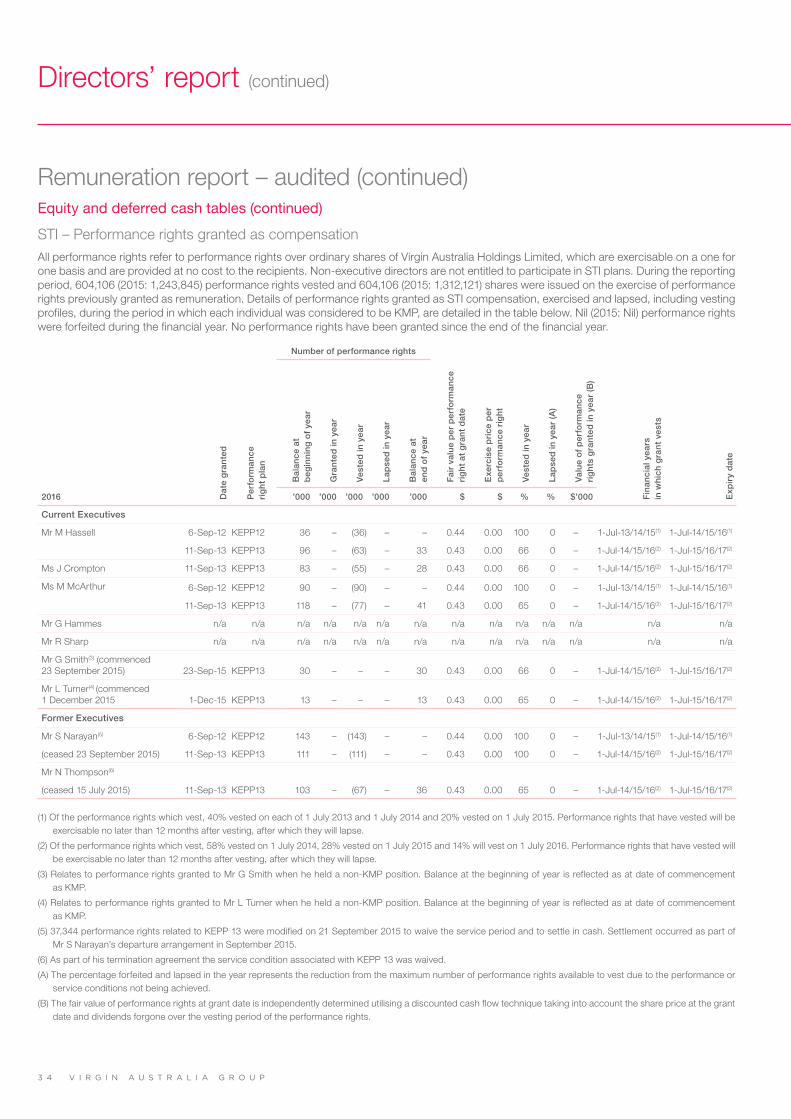
V I R G I N A U S T R A L I A G R O U P3 4
Directors’ report (continued)
Remuneration report – audited (continued)Equity and deferred cash tables (continued)
STI – Performance rights granted as compensation All performance rights refer to performance rights over ordinary shares of Virgin Australia Holdings Limited, which are exercisable on a one for one basis and are provided at no cost to the recipients. Non-executive directors are not entitled to participate in STI plans. During the reporting period, 604,106 (2015: 1,243,845) performance rights vested and 604,106 (2015: 1,312,121) shares were issued on the exercise of performance rights previously granted as remuneration. Details of performance rights granted as STI compensation, exercised and lapsed, including vesting profiles, during the period in which each individual was considered to be KMP, are detailed in the table below. Nil (2015: Nil) performance rights were forfeited during the financial year. No performance rights have been granted since the end of the financial year.
Number of performance rights
2016 Dat
e g
ran
ted
Per
form
ance
ri
gh
t p
lan
Bal
ance
at
beg
inn
ing
of
year
Gra
nte
d in
yea
r
Ves
ted
in y
ear
Lap
sed
in y
ear
Bal
ance
at
end
of
year
Fai
r va
lue
per
per
form
ance
ri
gh
t at
gra
nt
dat
e
Exe
rcis
e p
rice
per
p
erfo
rman
ce r
igh
t
Ves
ted
in y
ear
Lap
sed
in y
ear
(A)
Val
ue
of
per
form
ance
ri
gh
ts g
ran
ted
in y
ear
(B)
Fin
anci
al y
ears
in
wh
ich
gra
nt
vest
s
Exp
iry
dat
e
’000 ’000 ’000 ’000 ’000 $ $ % % $’000
Current Executives
Mr M Hassell 6-Sep-12 KEPP12 36 – (36) – – 0.44 0.00 100 0 – 1-Jul-13/14/15(1) 1-Jul-14/15/16(1)
11-Sep-13 KEPP13 96 – (63) – 33 0.43 0.00 66 0 – 1-Jul-14/15/16(2) 1-Jul-15/16/17(2)
Ms J Crompton 11-Sep-13 KEPP13 83 – (55) – 28 0.43 0.00 66 0 – 1-Jul-14/15/16(2) 1-Jul-15/16/17(2)
Ms M McArthur 6-Sep-12 KEPP12 90 – (90) – – 0.44 0.00 100 0 – 1-Jul-13/14/15(1) 1-Jul-14/15/16(1)
11-Sep-13 KEPP13 118 – (77) – 41 0.43 0.00 65 0 – 1-Jul-14/15/16(2) 1-Jul-15/16/17(2)
Mr G Hammes n/a n/a n/a n/a n/a n/a n/a n/a n/a n/a n/a n/a n/a n/a
Mr R Sharp n/a n/a n/a n/a n/a n/a n/a n/a n/a n/a n/a n/a n/a n/a
Mr G Smith(3) (commenced 23 September 2015) 23-Sep-15 KEPP13 30 – – – 30 0.43 0.00 66 0 – 1-Jul-14/15/16(2) 1-Jul-15/16/17(2)
Mr L Turner(4) (commenced 1 December 2015 1-Dec-15 KEPP13 13 – – – 13 0.43 0.00 65 0 – 1-Jul-14/15/16(2) 1-Jul-15/16/17(2)
Former Executives
Mr S Narayan(5) 6-Sep-12 KEPP12 143 – (143) – – 0.44 0.00 100 0 – 1-Jul-13/14/15(1) 1-Jul-14/15/16(1)
(ceased 23 September 2015) 11-Sep-13 KEPP13 111 – (111) – – 0.43 0.00 100 0 – 1-Jul-14/15/16(2) 1-Jul-15/16/17(2)
Mr N Thompson(6)
(ceased 15 July 2015) 11-Sep-13 KEPP13 103 – (67) – 36 0.43 0.00 65 0 – 1-Jul-14/15/16(2) 1-Jul-15/16/17(2)
(1) Of the performance rights which vest, 40% vested on each of 1 July 2013 and 1 July 2014 and 20% vested on 1 July 2015. Performance rights that have vested will be exercisable no later than 12 months after vesting, after which they will lapse.
(2) Of the performance rights which vest, 58% vested on 1 July 2014, 28% vested on 1 July 2015 and 14% will vest on 1 July 2016. Performance rights that have vested will be exercisable no later than 12 months after vesting, after which they will lapse.
(3) Relates to performance rights granted to Mr G Smith when he held a non-KMP position. Balance at the beginning of year is reflected as at date of commencement as KMP.
(4) Relates to performance rights granted to Mr L Turner when he held a non-KMP position. Balance at the beginning of year is reflected as at date of commencement as KMP.
(5) 37,344 performance rights related to KEPP 13 were modified on 21 September 2015 to waive the service period and to settle in cash. Settlement occurred as part of Mr S Narayan’s departure arrangement in September 2015.
(6) As part of his termination agreement the service condition associated with KEPP 13 was waived.
(A) The percentage forfeited and lapsed in the year represents the reduction from the maximum number of performance rights available to vest due to the performance or service conditions not being achieved.
(B) The fair value of performance rights at grant date is independently determined utilising a discounted cash flow technique taking into account the share price at the grant date and dividends forgone over the vesting period of the performance rights.

A N N U A L F I N A N C I A L R E P O R T 2 0 1 6 3 5
Remuneration report – audited (continued)Additional information
Movements in sharesThe movement during the year in the number of ordinary shares in the Company held directly, indirectly or beneficially, by each KMP who held shares in the Company, including their related parties, is as follows:
2016
Balance at 1 July 2015
’000
Commenced as a KMP
‘000
Granted
‘000
Purchases
‘000
Sales
‘000
Ceased as a KMP
‘000
Balance at 30 June 2016(1)
‘000
Directors of Virgin Australia Holdings Limited
Ms E Bryan – – – 114 – – 114
Ms S Mostyn 125 – – – – – 125
Mr R Thomas 659 – – – – – 659
The Hon. M Vaile AO 30 – – – – – 30
Mr D Baxby 54 – – – – – 54
Mr J Borghetti 5,218 – 2,371 – – – 7,589
Other key management personnel of the Group
Mr M Hassell 455 – 98 – – – 553
Ms J Crompton 126 – 55 – – – 181
Ms M McArthur 3 – 168 – – – 171
Mr G Smith (commenced 23 September 2015) – 91 – – – – 91
Mr L Turner (commenced 1 December 2015) – 23 – – – – 23
Mr S Narayan (ceased 23 September 2015) 1,519 – 869 – – (2,388) n/a
Mr N Thompson (ceased 15 July 2015) 156 – 67 – – (223) n/a
(1) Australian directors all participated in the Entitlement Offer launched on 6 July 2016 and increased their shareholdings in the Group. The number of shares held by each
Australian director following 30 June 2016 is reflected in on page 6 of the Annual Financial Report under Directors’ interests.
Insurance of officersDuring the financial year, the Group paid premiums in respect of directors’ and officers’ liability insurance contracts which cover former directors and officers, including executive officers of the entity and directors, executive officers and secretaries of its controlled entities. The directors have not included the amount of the premium paid in respect of the directors’ and officers’ liability insurance contracts as such disclosure is prohibited under the terms of the insurance contract.
Loans to KMP and their related partiesFor the 2016 financial year, there were no loans made, guaranteed, secured or outstanding in relation to KMP or their related parties (2015: nil).
Other transactions with KMP A number of KMP hold positions in other subsidiaries of the parent entity that result in them having control or significant influence over the financial and operating policies of those entities. A number of these entities transacted with the Group in the reporting period. The terms and conditions of those transactions were no more favourable than those available, or which might reasonably be expected to be available, on similar transactions to non-KMP related entities on an arm’s-length basis. Refer to note G4 to the consolidated financial statements.

V I R G I N A U S T R A L I A G R O U P3 6
Directors’ report (continued)
Share optionsUnissued shares under optionAt the date of this report, unissued ordinary shares of the Company under option are:
Option plan Number of shares Exercise price Expiry date
Senior Executive Option Plan (SEOP)
– Issue 20 573,658 $0.00 30 June 2017/2018(1)
(1) Of the options which vest, 60% vested on 30 June 2016 and 40% will vest on 30 June 2017. Options that have vested will be exercisable no later than 12 months after
vesting, after which they will lapse.
Shares issued as a result of the exercise of optionsDuring or since the end of the 2016 financial year 4.33 million options were issued resulting in an increase in share capital of $1.61 million.
Indemnification and insurance of officers and auditorsThe Company has agreed to indemnify the directors and officers of the Company against all liabilities to another person (other than the Company or a related body corporate) that may arise from their position as a director or an officer of the Company and its controlled entities, except where the liability arises out of conduct involving a lack of good faith.
The Company has directors’ and officers’ liability insurance contracts in place, for all current and former officers of the Company (including directors and the company secretary). The directors have not included the details of the nature of the liabilities covered or the amount of the premium paid in respect of the directors’ and officers’ liability insurance contracts, as such disclosure is prohibited under the terms of the insurance contract.
Non-audit servicesDuring the year KPMG, the Group’s auditor, has performed certain other services in addition to its statutory duties as auditor.
The Board has considered the non-audit services provided during the year and is satisfied that the provision of those non-audit services is compatible with, and did not compromise, the auditor’s independence requirements of the Corporations Act 2001 for the following reasons:
• All non-audit services were subject to the corporate governance procedures adopted by the Company and have been reviewed by the Audit and Risk Management Committee to ensure they do not impact the impartiality and objectivity of the auditor; and
• The non-audit services provided do not undermine the general principles relating to auditor independence as set out in APES 110 Code of Ethics for Professional Accountants, as they did not involve reviewing or auditing the auditor’s own work, acting in a management or decision making capacity for the Company, acting as an advocate for the Company or jointly sharing risks and rewards.
Details of the amounts paid to KPMG and its related practices for audit and non-audit services are set out in note G5 to the consolidated financial statements.
The lead auditor’s independence declaration, as required under section 307C of the Corporations Act 2001 is set out on page 38 and forms part of the directors’ report.

A N N U A L F I N A N C I A L R E P O R T 2 0 1 6 3 7
RoundingThe Group is of a kind referred to in ASIC Corporations (Rounding in Financial/Directors’ Reports) Instrument 2016/191 dated 24 March 2016 and in accordance with that instrument, amounts in the consolidated financial statements and directors’ report have been rounded to the nearest one hundred thousand dollars, unless otherwise stated.
This report is made in accordance with a resolution of the directors:
Elizabeth BryanDirector
John BorghettiDirector
Dated at Sydney, 21 September 2016

V I R G I N A U S T R A L I A G R O U P3 8
Lead Auditor’s Independence Declaration under Section 307C of the Corporations Act 2001
To: The directors of Virgin Australia Holdings Limited
I declare that, to the best of my knowledge and belief, in relation to the audit for the financial year ended 30 June 2016 there have been:(i) no contraventions of the auditor independence requirements as set out in the Corporations Act 2001 in relation to the audit; and
(ii) no contraventions of any applicable code of professional conduct in relation to the audit.
KPMG
John Wigglesworth
Partner
Sydney, 21 September 2016
KPMG, an Australian partnership and a member firm of the KPMG network of independent member firms affiliated with KPMG International Cooperative (“KPMG International”), a Swiss entity.
Liability limited by a scheme approved under Professional Standards Legislation.

A N N U A L F I N A N C I A L R E P O R T 2 0 1 6 3 9A N N U A L F I N A N C I A L R E P O R T 2 0 1 6 3 9
Consolidated financial statementsFor the year ended 30 June 2016
ContentsConsolidated statement of profit or loss 41
Consolidated statement of profit or loss and other comprehensive income 42
Consolidated statement of financial position 43
Consolidated statement of changes in equity 44
Consolidated statement of cash flows 46
Notes to the consolidated financial statements
A. Basis of preparation 47
B. Results 49
B1. Operating segments 49
B2. Earnings per share 52
B3. Revenue 53
B4. Expenses 54
B5. Taxation 55
B6. Reconciliation of net loss to net cash from operating activities 57
C. Working capital and other assets and liabilities 58
C1. Receivables 58
C2. Inventories 58
C3. Other financial assets 59
C4. Other assets 59
C5. Payables 60
C6. Provisions 60
C7. Unearned revenue 62
D. Tangible and intangible assets 62
D1. Assets classified as held for sale 62
D2. Property, plant and equipment 63
D3. Intangible assets 65
D4. Impairment testing 66
E. Capital structure and financial risks 68
E1. Capital management 68
E2. Cash and cash equivalents 68
E3. Interest-bearing liabilities 69
E4. Share capital 70
E5. Dividends 71
E6. Reserves 71
E7. Financial risk management 72
E8. Fair value measurements 78
E9. Offsetting financial assets and liabilities 79

V I R G I N A U S T R A L I A G R O U P4 0 V I R G I N A U S T R A L I A G R O U P4 0
Consolidated financial statements (continued)For the year ended 30 June 2016
Contents (continued)F. Group structure 80
F1. Business combinations 80
F2. Investments accounted for using the equity method 82
F3. Controlled entities 83
F4. Investments in unconsolidated structured entities 85
F5. Non-controlling interests 85
F6. Deed of Cross Guarantee 86
F7. Parent entity disclosures 88
G. Other items 88
G1. Commitments 88
G2. Contingent liabilities 90
G3. Share-based payments 90
G4. Related parties 94
G5. Auditor’s remuneration 96
G6. Events subsequent to reporting date 96
Directors’ declaration 97
Independent auditor’s report 98

A N N U A L F I N A N C I A L R E P O R T 2 0 1 6 4 1
Consolidated statement of profit or lossFor the year ended 30 June 2016
Note2016
$m2015
$m
Revenue and income
Airline passenger revenue B3 4,194.8 3,999.0
Other ancillary revenue B3 790.9 707.0
Other income 18.2 17.4
Net foreign exchange gains 17.1 25.8
Revenue and income 5,021.0 4,749.2
Operating expenditure
Aircraft operating lease expenses B4 (360.6) (290.0)
Airport charges, navigation and station operations (984.1) (917.0)
Contract and other maintenance expenses (182.0) (155.2)
Commissions and other marketing and reservations expenses (408.2) (363.1)
Fuel and oil (1,018.8) (1,191.6)
Labour and staff related expenses (1,157.8) (1,118.8)
Impairment losses on assets classified as held for sale D1 (107.3) –
Impairment losses on other assets C6 (118.1) –
Onerous contract expenses C6 (100.2) –
Other expenses from ordinary activities B4 (531.6) (464.2)
Depreciation and amortisation (282.2) (275.4)
Ineffective cash flow hedges and non-designated derivatives losses (27.8) (27.4)
Net operating expenditure (5,278.7) (4,802.7)
Share of net profits/(losses) of equity-accounted investees F2 0.7 (16.6)
Loss before net finance costs and tax (257.0) (70.1)
Finance income 11.4 39.7
Finance costs B4 (181.0) (132.9)
Net finance costs (169.6) (93.2)
Loss before tax (426.6) (163.3)
Income tax benefit B5 201.9 69.5
Loss (224.7) (93.8)
Attributable to:
Owners of the Company (260.9) (110.8)
Non-controlling interests F5 36.2 17.0
(224.7) (93.8)
Earnings per share Cents Cents
Basic earnings per share B2 (7.4) (3.2)
Diluted earnings per share B2 (7.4) (3.2)
The consolidated statement of profit or loss should be read in conjunction with the accompanying notes.

V I R G I N A U S T R A L I A G R O U P4 2
Consolidated statement of profit or loss and other comprehensive incomeFor the year ended 30 June 2016
Note2016
$m2015
$m
Loss (224.7) (93.8)
Other comprehensive income
Items that may be reclassified subsequently to profit or loss
Exchange differences on translation of foreign operations (nil related tax) (19.1) (170.5)
Share of exchange differences on translation of foreign equity-accounted investee (nil related tax) – 0.9
Effective portion of changes in fair value of cash flow hedges (115.0) (54.4)
Net change in fair value of cash flow hedges transferred to profit or loss 128.6 64.0
Effective portion of changes in fair value of cash flow hedges (time value of options) (40.1) (23.6)
Net change in fair value of cash flow hedges transferred to profit or loss (time value of options) 28.9 9.7
Net change in fair value of cash flow hedges transferred to initial carrying value of hedged item 2.0 0.6
Income tax benefit on other comprehensive income (1.4) 1.1
Other comprehensive loss, net of tax (16.1) (172.2)
Total comprehensive loss (240.8) (266.0)
Attributable to:
Owners of the Company (277.0) (283.0)
Non-controlling interests F5 36.2 17.0
(240.8) (266.0)
The consolidated statement of profit or loss and other comprehensive income should be read in conjunction with the accompanying notes.
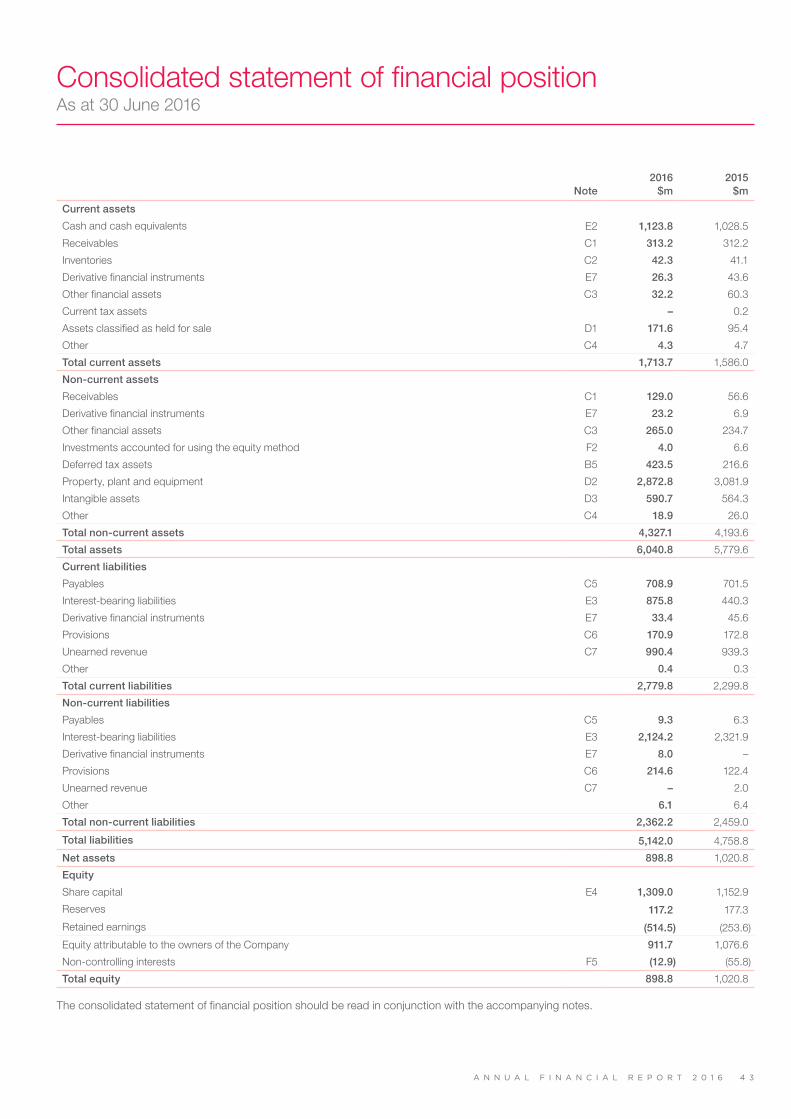
A N N U A L F I N A N C I A L R E P O R T 2 0 1 6 4 3
Consolidated statement of financial positionAs at 30 June 2016
Note2016
$m2015
$m
Current assets
Cash and cash equivalents E2 1,123.8 1,028.5
Receivables C1 313.2 312.2
Inventories C2 42.3 41.1
Derivative financial instruments E7 26.3 43.6
Other financial assets C3 32.2 60.3
Current tax assets – 0.2
Assets classified as held for sale D1 171.6 95.4
Other C4 4.3 4.7
Total current assets 1,713.7 1,586.0
Non-current assets
Receivables C1 129.0 56.6
Derivative financial instruments E7 23.2 6.9
Other financial assets C3 265.0 234.7
Investments accounted for using the equity method F2 4.0 6.6
Deferred tax assets B5 423.5 216.6
Property, plant and equipment D2 2,872.8 3,081.9
Intangible assets D3 590.7 564.3
Other C4 18.9 26.0
Total non-current assets 4,327.1 4,193.6
Total assets 6,040.8 5,779.6
Current liabilities
Payables C5 708.9 701.5
Interest-bearing liabilities E3 875.8 440.3
Derivative financial instruments E7 33.4 45.6
Provisions C6 170.9 172.8
Unearned revenue C7 990.4 939.3
Other 0.4 0.3
Total current liabilities 2,779.8 2,299.8
Non-current liabilities
Payables C5 9.3 6.3
Interest-bearing liabilities E3 2,124.2 2,321.9
Derivative financial instruments E7 8.0 –
Provisions C6 214.6 122.4
Unearned revenue C7 – 2.0
Other 6.1 6.4
Total non-current liabilities 2,362.2 2,459.0
Total liabilities 5,142.0 4,758.8
Net assets 898.8 1,020.8
Equity
Share capital E4 1,309.0 1,152.9
Reserves 117.2 177.3
Retained earnings (514.5) (253.6)
Equity attributable to the owners of the Company 911.7 1,076.6
Non-controlling interests F5 (12.9) (55.8)
Total equity 898.8 1,020.8
The consolidated statement of financial position should be read in conjunction with the accompanying notes.

V I R G I N A U S T R A L I A G R O U P4 4
Con
solid
ated
sta
tem
ent o
f cha
nges
in e
quity
For
the
year
end
ed 3
0 Ju
ne 2
016
No
te
Sha
re
cap
ital
$m
Fo
reig
n cu
rren
cy
tran
slat
ion
rese
rve
$m
Hed
ge
rese
rve
$m
Op
tio
n ti
me
valu
e re
serv
e $m
Sha
re-
bas
ed
pay
men
ts
rese
rve
$m
No
n-
cont
rolli
ng
inte
rest
s’
cont
rib
uti
on
rese
rve
$m
Ret
aine
d
earn
ing
s $m
Att
rib
uta
ble
to
ow
ners
o
f th
e C
om
pan
y $m
No
n-
cont
rolli
ng
inte
rest
s $m
Tota
l e
qui
ty
$m
Bal
ance
at
1 Ju
ly 2
015
1,15
2.9
(133
.0)
(4.7
)(1
0.4)
17.9
307.
5(2
53.6
)1,
076.
6(5
5.8)
1,02
0.8
(Los
s)/p
rofit
––
––
––
(260
.9)
(260
.9)
36.2
(224
.7)
Oth
er c
om
pre
hens
ive
inco
me,
net
of t
ax
Fore
ign
curr
ency
tran
slat
ion
–(1
9.1)
––
––
–(1
9.1)
–(1
9.1)
Effe
ctiv
e po
rtio
n of
cha
nges
in fa
ir va
lue
of c
ash
flow
hed
ges
––
(80.
5)(2
8.1)
––
–(1
08.6
)–
(108
.6)
Net
cha
nge
in fa
ir va
lue
of c
ash
flow
hed
ges
tran
sfer
red
to p
rofit
or l
oss
––
90.0
20.2
––
–11
0.2
–11
0.2
Net
cha
nge
in th
e fa
ir va
lue
of c
ash
flow
hed
ges
tran
sfer
red
to in
itial
car
ryin
g va
lue
of h
edge
d ite
m–
–1.
4–
––
–1.
4–
1.4
Tota
l oth
er c
om
pre
hens
ive
(loss
)/in
com
e, n
et
of t
ax
–(1
9.1)
10.9
(7.9
)–
––
(16.
1)–
(16.
1)
Tota
l co
mp
rehe
nsiv
e (lo
ss)/
inco
me
–(1
9.1)
10.9
(7.9
)–
–(2
60.9
)(2
77.0
)36
.2(2
40.8
)
Tran
sact
ions
wit
h o
wne
rs, r
eco
rded
dir
ectl
y in
eq
uity
, net
of t
ax
Issu
e of
ord
inar
y sh
ares
for c
ash
E415
4.0
––
––
––
154.
0–
154.
0
Dilu
tion
of o
wne
rshi
p in
tere
sts(1
)F5
––
––
–6.
3–
6.3
(0.4
)5.
9
Inco
me
tax
rese
rve(2
)–
––
––
(49.
0)–
(49.
0)49
.0–
Equi
ty d
istr
ibut
ions
F5–
––
––
––
–(4
1.9)
(41.
9)
Sha
re-b
ased
pay
men
t tra
nsac
tions
E42.
1–
––
(1.3
)–
–0.
8–
0.8
Tota
l tra
nsac
tio
ns w
ith
ow
ners
, net
of t
ax
156.
1–
––
(1.3
)(4
2.7)
–11
2.1
6.7
118.
8
Bal
ance
at
30 J
une
2016
1,30
9.0
(152
.1)
6.2
(18.
3)16
.626
4.8
(514
.5)
911.
7(1
2.9)
898.
8
(1)
Thes
e am
ount
s in
clud
e th
e is
sue
of c
onve
rtib
le n
otes
dur
ing
the
per
iod
by V
eloc
ity F
req
uent
Fly
er H
old
co P
ty L
td a
s pa
rtia
l con
sid
erat
ion
for t
he a
cqui
sitio
n of
Tor
que
Sol
utio
ns (A
ustr
alia
) Pty
Ltd
(ref
er to
not
e F1
to th
e co
nsol
idat
ed fi
nanc
ial
stat
emen
ts) a
s w
ell a
s th
ose
acq
uire
d by
man
agem
ent
as p
art
of a
man
agem
ent
ince
ntiv
e p
lan.
Thi
s re
duc
ed t
he o
wne
rshi
p in
tere
st o
f the
Gro
up in
Vel
ocity
Fre
que
nt F
lyer
Hol
dco
Pty
Ltd
fro
m 6
5.00
% t
o 64
.72%
. R
efer
to
note
F5
to t
he
cons
olid
ated
fina
ncia
l sta
tem
ents
.
(2)
This
incl
udes
the
non-
cont
rolli
ng in
tere
sts’
sha
re o
f non
-rec
ipro
cal c
ontr
ibut
ions
from
the
Gro
up in
rel
atio
n to
tax.
The
cons
olid
ated
sta
tem
ent o
f cha
nges
in e
quity
sho
uld
be r
ead
in c
onju
nctio
n w
ith th
e ac
com
pany
ing
note
s.

A N N U A L F I N A N C I A L R E P O R T 2 0 1 6 4 5
Con
solid
ated
sta
tem
ent o
f cha
nges
in e
quity
(co
ntin
ued)
For
the
year
end
ed 3
0 Ju
ne 2
016
No
te
Sha
re
cap
ital
$m
Fo
reig
n cu
rren
cy
tran
slat
ion
rese
rve
$m
Hed
ge
rese
rve
$m
Op
tio
n ti
me
valu
e re
serv
e $m
Sha
re-
bas
ed
pay
men
ts
rese
rve
$m
No
n-
cont
rolli
ng
inte
rest
s’
cont
rib
uti
on
rese
rve
$m
Ret
aine
d
earn
ing
s $m
Att
rib
uta
ble
to
ow
ners
o
f th
e C
om
pan
y $m
No
n-
cont
rolli
ng
inte
rest
s $m
Tota
l e
qui
ty
$m
Bal
ance
at
1 Ju
ly 2
014
1,14
7.3
36.6
(11.
8)(0
.7)
19.5
–(1
42.8
)1,
048.
1–
1,04
8.1
Loss
/(pro
fit)
––
––
––
(110
.8)
(110
.8)
17.0
(93.
8)
Oth
er c
om
pre
hens
ive
inco
me,
net
of t
ax
Fore
ign
curr
ency
tran
slat
ion
–(1
69.6
)–
––
––
(169
.6)
–(1
69.6
)
Effe
ctiv
e po
rtio
n of
cha
nges
in fa
ir va
lue
of c
ash
flow
hed
ges
––
(38.
1)(1
6.5)
––
–(5
4.6)
–(5
4.6)
Net
cha
nge
in fa
ir va
lue
of c
ash
flow
hed
ges
tran
sfer
red
to p
rofit
or l
oss
––
44.8
6.8
––
–51
.6–
51.6
Net
cha
nge
in fa
ir va
lue
of c
ash
flow
hed
ges
tran
sfer
red
to in
itial
car
ryin
g va
lue
of h
edge
d ite
m–
–0.
4–
––
–0.
4–
0.4
Tota
l oth
er c
om
pre
hens
ive
(loss
)/in
com
e, n
et
of t
ax
–(1
69.6
)7.
1(9
.7)
––
–(1
72.2
)–
(172
.2)
Tota
l co
mp
rehe
nsiv
e (lo
ss)/
inco
me
–(1
69.6
)7.
1(9
.7)
––
(110
.8)
(283
.0)
17.0
(266
.0)
Tran
sact
ions
wit
h o
wne
rs, r
eco
rded
dir
ectl
y in
eq
uity
, net
of t
ax
Sal
e of
inte
rest
in V
eloc
ity G
roup
F5–
––
––
307.
5–
307.
512
.331
9.8
Inco
me
tax
rese
rve
––
––
––
––
7.4
7.4
Red
empt
ion
of c
onve
rtib
le n
otes
––
––
––
––
(74.
7)(7
4.7)
Equi
ty d
istr
ibut
ions
F5–
––
––
––
–(1
7.8)
(17.
8)
Sha
re-b
ased
pay
men
t tra
nsac
tions
E45.
6–
––
(1.6
)–
–4.
0–
4.0
Tota
l tra
nsac
tio
ns w
ith
ow
ners
, net
of t
ax
5.6
––
–(1
.6)
307.
5–
311.
5(7
2.8)
238.
7
Bal
ance
at
30 J
une
2015
1,15
2.9
(133
.0)
(4.7
)(1
0.4)
17.9
307.
5(2
53.6
)1,
076.
6(5
5.8)
1,02
0.8
The
cons
olid
ated
sta
tem
ent o
f cha
nges
in e
quity
sho
uld
be r
ead
in c
onju
nctio
n w
ith th
e ac
com
pany
ing
note
s.

V I R G I N A U S T R A L I A G R O U P4 6
Consolidated statement of cash flowsFor the year ended 30 June 2016
Note2016
$m2015
$m
Cash flows from operating activities
Cash receipts from customers 5,567.4 5,176.7
Cash payments to suppliers and employees (5,118.6) (4,785.6)
Cash generated from operating activities 448.8 391.1
Cash payments for business transformation expenses (110.0) (82.5)
Finance income received 11.4 18.8
Finance costs paid (151.7) (109.3)
Net cash from operating activities B6 198.5 218.1
Cash flows from investing activities
Acquisition of property, plant and equipment (713.4) (577.3)
Proceeds on disposal of property, plant and equipment 418.4 147.4
Acquisition of intangible assets (46.8) (60.3)
Acquisition of subsidiary, net of cash acquired F1 (2.3) 3.2
Advances of loans to joint venture – (23.8)
Proceeds from loans to joint venture – 8.2
Payments for other deposits (49.1) (72.9)
Proceeds from other deposits 4.2 2.6
Net cash used in investing activities (389.0) (572.9)
Cash flows from financing activities
Proceeds from borrowings 875.8 910.7
Repayment of borrowings (713.6) (525.4)
Payments of transaction costs related to borrowings (10.1) (34.9)
Redemption of convertible notes – (74.7)
Net proceeds from share issue 151.9 –
Equity distributions paid to non-controlling interests F5 (41.9) (17.8)
Repayments of loans from associate – (4.2)
Proceeds from non-controlling interests F5 1.1 336.0
Payments of transaction costs relating to non-controlling interests – (8.8)
Net cash from financing activities 263.2 580.9
Net increase in cash and cash equivalents 72.7 226.1
Cash and cash equivalents at 1 July 1,028.5 783.8
Effect of exchange rate fluctuations on cash and cash equivalents 22.6 18.6
Cash and cash equivalents at 30 June E2 1,123.8 1,028.5
The consolidated statement of cash flows should be read in conjunction with the accompanying notes.

A N N U A L F I N A N C I A L R E P O R T 2 0 1 6 4 7
Notes to the consolidated financial statementsFor the year ended 30 June 2016
A. Basis of preparationThis section sets out the basis upon which the consolidated financial statements have been prepared as a whole.
The consolidated financial statements were authorised for issue by the Board of Directors (Board) on 21 September 2016.
(a) Reporting entity
Virgin Australia Holdings Limited (VAH) (the Company) is a for-profit company incorporated and domiciled in Australia. It is primarily involved in the airline industry, both domestic and international. The consolidated financial statements of the Company as at and for the year ended 30 June 2016 comprise the Company and its subsidiaries (the Group), and the Group’s interests in associates and joint ventures.
(b) Basis of accounting and statement of complianceThe consolidated financial statements are general purpose financial statements which have been prepared in accordance with Australian Accounting Standards (AASBs) adopted by the Australian Accounting Standards Board (AASB) and the Corporations Act 2001. The consolidated financial statements comply with International Financial Reporting Standards (IFRS) as issued by the International Accounting Standards Board.
The consolidated financial statements are presented in Australian dollars, which is the functional currency of the Company. The consolidated financial statements have been prepared on the basis of historical costs, except where assets and liabilities are stated at fair value in accordance with relevant accounting policies.
The Group is of a kind referred to in ASIC Corporations (Rounding in Financial/Directors’ Reports) Instrument 2016/191 dated 24 March 2016 and in accordance with that instrument, amounts in the consolidated financial statements have been rounded to the nearest one hundred thousand dollars, unless otherwise stated.
(c) Net current liability positionThe Group’s current liabilities exceeded its current assets as at 30 June 2016 by $1,066.1 million (2015: $713.8 million) including a current liability for unearned revenue of $990.4 million (2015: $939.3 million). Unearned revenue includes revenue received in advance which has been deferred in the statement of financial position until carriage is performed. The consolidated financial statements have been prepared on a going concern basis, based on the Group’s cash flows for the current year and estimated profits and cash flows for future years including the $852.0 million entitlement offer which completed in August 2016. The Group has a cash and cash equivalents balance at 30 June 2016 of $1,123.8 million (2015: $1,028.5 million) and has an unrestricted cash balance at 30 June 2016 of $728.9 million (2015: $718.9 million). Capital management is detailed in note E1. Management of liquidity risk is detailed in note E7.
(d) Accounting policies
Accounting policies have been applied consistently by all of the Group’s entities and to all periods presented in the consolidated financial statements. The following accounting policies apply to the consolidated financial statements as a whole. Specific significant accounting policies are described in the note to which they relate.
Foreign currency transactions and balancesForeign currency transactions are initially recorded in the functional currency at the spot rate at the date the transaction first qualifies for recognition. Subsequently, foreign currency monetary balances are translated to the functional currency at the spot rates of exchange on the reporting date and the resultant exchange differences are recognised in profit or loss. Non-monetary balances that are measured in terms of historical cost are not re-translated. Non-monetary balances that are measured at fair value are translated at the date the fair value was determined with the gain or loss treated in line with the gain or loss recognised on changes to the fair value of the item.
Foreign operationsThe Group has a number of foreign operations which operate in an economic environment in which the predominant currency is not Australian dollars and which apply a functional currency other than Australian dollars. The assets and liabilities of these operations are translated from their functional currency to Australian dollars at the exchange rates at the reporting dates. The income and expenses are translated to Australian dollars at the exchange rate at the date of the transaction or the average exchange rate for the month if that is a reasonable approximation of the exchange rates on the transaction dates for that month. All resulting exchange differences are recognised in other comprehensive income and accumulated in the foreign currency translation reserve. When an operation is disposed of, the cumulative amount in the foreign currency translation reserve relating to that operation is reclassified to profit or loss as part of the gain or loss on disposal. Exchange differences on monetary items receivable from or payable to a foreign operation for which settlement is neither planned nor likely to occur are reclassified to other comprehensive income in the consolidated financial statements. These exchange differences are reclassified to profit or loss on disposal of the foreign operation.

V I R G I N A U S T R A L I A G R O U P4 8
Notes to the consolidated financial statements (continued)For the year ended 30 June 2016
A. Basis of preparation (continued)(e) Impact of new standards issued but not yet effectiveThe Group adopted AASB 9 Financial Instruments (2013, 2010 and 2009) (AASB 9) from 1 July 2014. AASB 9 introduced a more principle-based approach which allowed more risk management activities to qualify for hedge accounting and therefore better matched the timing of the profit or loss on the hedge instruments with the profit or loss on the underlying exposures.
The following accounting standards have been issued but are not yet effective and may impact the Group in the period of initial application. They are available for early adoption in the current reporting period but have not yet been applied in preparing the consolidated financial statements.
AASB 15 Revenue from Contracts with Customers (AASB 15)AASB 15 replaces existing revenue recognition guidance, including AASB 118 Revenue, AASB 111 Construction Contracts and Interpretation 13 Customer Loyalty Programmes. It requires an entity to recognise revenue as performance obligations within each revenue contract are satisfied, based on the amount of consideration the entity expects to be entitled to in exchange for those goods or services.
AASB 15 is effective for annual reporting periods beginning on or after 1 January 2018. The impact of the standard is not yet known or reasonably estimable and the Group does not plan to adopt the standard early.
AASB 16 Leases (AASB 16)AASB 16 replaces AASB 117 Leases and Interpretation 4 Determining whether an Arrangement contains a Lease. AASB 16 removes the lease classification test for lessees and requires all leases (including those classified as operating leases) to be brought onto the balance sheet. There is new guidance on when an arrangement would meet the definition of a lease.
AASB 16 is effective for annual reporting periods beginning on or after 1 January 2019. Early application is only permitted if AASB 15 has been applied or is applied at the same time. The impact of the standard is not yet known or reasonably estimable and the Group has not reached a conclusion on whether the standard will be adopted early.
(f) Critical accounting estimates and judgementsThe preparation of the consolidated financial statements requires management to make judgements, estimates and assumptions that affect the application of accounting policies and the reported amounts of assets, liabilities, income and expenses. Actual results may differ from these estimates. Estimates are reviewed on an ongoing basis and any revisions to estimates are recognised prospectively.
Key judgements, estimates and assumptions that have a significant risk of causing a material adjustment to the carrying amount of assets and liabilities within the next financial year are described in the following notes:
B3 - Revenue – loyalty program revenue, non-attendance rates and credit vouchersB5 - Taxation – deferred tax amountsC3 - Other financial assets – impairment of maintenance reserve depositsC4 - Other assets – sale and leaseback transactionsC6 - Provisions – maintenance provisions and onerous contractsC7 - Unearned revenue – unearned passenger and loyalty program revenueD1 - Assets classified as held for sale – fair value of assets classified as held for saleD2 - Property, plant and equipment – residual values and estimated useful livesD3 - Intangible assets – residual values and estimated useful livesD4 - Impairment testing – determination of cash-generating unit and estimation of recoverable amountE7 - Financial risk management – impairment of financial assetsE8 - Fair value measurements – estimation of fair valueF3 - Controlled entities – basis of controlF4 - Investments in unconsolidated structured entities – basis of control

A N N U A L F I N A N C I A L R E P O R T 2 0 1 6 4 9
B. ResultsThis section sets out the results and performance of the Group.
B1. Operating segmentsManagement and the Board use the segment results to assess the financial performance of the individual segments within the Group.
The following summary describes the operations in each of the Group’s reportable segments which are determined based on the key business activities of the Group:• Virgin Australia Domestic: operations using the fleet of Boeing B737 aircraft, Airbus A320 and A330 aircraft, ATR aircraft, Embraer E190
aircraft, and Fokker F50 and F100 aircraft. This comprises Australian domestic flying, including regional network and cargo operations. • Virgin Australia International: operations using a mix of Airbus A330, Boeing B777 and B737 aircraft. This comprises Trans-Pacific, Abu
Dhabi, Trans-Tasman, Pacific Island and South East Asia flying, including international cargo operations.• Velocity: operations of the Group’s loyalty program.• Tigerair Australia: operations using a narrow body fleet of Airbus A320 and Boeing B737 aircraft. This comprises Australian domestic flying
targeting the budget leisure market and international flying to Denpasar.
Information regarding the results of each operating segment is detailed in the tables which follow. Performance is measured based on Segment EBIT (earnings before impairment losses on assets classified as held for sale; impairment losses on other assets; net loss on disposal of assets; onerous contract expenses; business and capital restructure and transaction costs; share of net profits/(losses) of equity-accounted investees; time value movement on cash flow hedges; unrealised ineffectiveness on cash flow hedges and non-designated derivatives; net finance costs; and income tax benefit) as included in the internal management reports that are reviewed by the chief operating decision maker, being the Board.
Segment EBITDAR is defined as Segment EBIT excluding costs associated with aircraft rentals and depreciation and amortisation.
Inter-segment pricing is determined on an arm’s length basis or a cost plus margin basis, depending on the nature of the revenue or expense and the financial impact on the segment of recognising the revenue or expense.

V I R G I N A U S T R A L I A G R O U P5 0
Notes to the consolidated financial statements (continued)For the year ended 30 June 2016
B1. Operating segments (continued)(a) Reportable segments
2016
Virgin Australia
Domestic $m
Virgin Australia
International $m
Velocity $m
Tigerair Australia
$m
Corporate and
Eliminations $m
Consolidated $m
Revenue and income
External revenue and income 3,201.2 1,016.3 327.6 475.9 – 5,021.0
Inter-segment revenue 244.4 – – – (244.4) –
Segment revenue and income 3,445.6 1,016.3 327.6 475.9 (244.4) 5,021.0
Segment EBITDAR 516.9 175.4 141.3 60.5 (44.5) 849.6
Aircraft rentals (125.4) (182.5) – (52.7) – (360.6)
Segment EBITDA 391.5 (7.1) 141.3 7.8 (44.5) 489.0
Depreciation and amortisation (229.5) (41.7) (1.6) (5.6) – (278.4)
Segment EBIT 162.0 (48.8) 139.7 2.2 (44.5) 210.6
Impairment losses on assets classified as held for sale (107.3)
Impairment losses on other assets (118.1)
Onerous contract expenses (100.2)
Business and capital restructure and transaction costs (114.9)
Share of net profits/(losses) of equity-accounted investees:
– Virgin Samoa 0.7
Time value movement on cash flow hedges(1)(2) (28.5)
Unrealised ineffectiveness on cash flow hedges and non-designated derivatives(1) 0.7
(257.0)
Net finance costs (169.6)
Loss before tax (426.6)
Income tax benefit 201.9
Loss (224.7)
(1) The addition of these two items reconciles to total ineffective cash flow hedges and non-designated derivatives losses included within operating expenditure as
disclosed in the consolidated statement of profit or loss.
(2) Time value represents the risk premium payable on a purchased option over and above its current exercise value (intrinsic value) based on the probability it will increase
in value before expiry.

A N N U A L F I N A N C I A L R E P O R T 2 0 1 6 5 1
B1. Operating segments (continued)(a) Reportable segments (continued)
2015
Virgin Australia
Domestic $m
Virgin Australia
International $m
Velocity(1) $m
Tigerair Australia(2)
$m
Corporate and
Eliminations $m
Consolidated $m
Revenue and income
External revenue and income 3,114.3 1,112.4 238.4 284.1 – 4,749.2
Inter-segment revenue 195.7 – – – (195.7) –
Segment revenue and income 3,310.0 1,112.4 238.4 284.1 (195.7) 4,749.2
Segment EBITDAR 404.5 154.1 82.3 26.4 (48.9) 618.4
Aircraft rentals (68.1) (180.4) – (28.6) – (277.1)
Segment EBITDA 336.4 (26.3) 82.3 (2.2) (48.9) 341.3
Depreciation and amortisation (225.3) (42.6) (1.1) (6.4) – (275.4)
Segment EBIT 111.1 (68.9) 81.2 (8.6) (48.9) 65.9
Net loss on disposal of assets (7.6)
Business and capital restructure and transaction costs (84.4)
Share of net profits/(losses) of equity-accounted investees:
– Tigerair Australia (17.1)
– Virgin Samoa 0.5
Time value movement on cash flow hedges(3)(4) (10.0)
Unrealised ineffectiveness on cash flow hedges and non-designated derivatives(3) (17.4)
(70.1)
Net finance costs:
– Net income resulting from Tigerair Australia acquisition 21.8
– Net finance costs excluding capital restructure costs (115.0)
Loss before tax (163.3)
Income tax benefit 69.5
Net loss (93.8)
(1) The Velocity Frequent Flyer Group (VFF Group) was established on 22 October 2014. Prior to establishing the VFF Group, various agreements were entered into by
controlled entities to confirm the terms and conditions of the arm’s length arrangements. The Velocity segment information includes adjustments to reflect these restated
agreements on a full year basis.
(2) The Tigerair Australia segment information relates to the period from which Tigerair Australia was consolidated, being 17 October 2014 to 30 June 2015.
(3) The addition of these two items reconciles to total ineffective cash flow hedges and non-designated derivatives losses included within operating expenditure as
disclosed in the consolidated statement of profit or loss.
(4) Time value represents the risk premium payable on a purchased option over and above its current exercise value (intrinsic value) based on the probability it will increase
in value before expiry.

V I R G I N A U S T R A L I A G R O U P5 2
Notes to the consolidated financial statements (continued)For the year ended 30 June 2016
B1. Operating segments (continued)(b) Geographical segmentsTicket sales revenue from domestic services within Australia is attributed to the Australia geographic region. Passenger and other services revenue from inbound and outbound services between Australia and overseas is allocated proportionately to the area in which point of sale occurs. Certain other revenue amounts are not allocated to a geographical region as it is impractical to do so.
Australia
$m
New Zealand
$m
United States
$m
Europe
$m
Other
$m
Unallocated
$m
Consolidated
$m
External revenue and income
2016 4,195.2 154.7 204.8 163.9 168.2 134.2 5,021.0
2015 3,935.7 218.2 180.4 153.0 174.5 87.4 4,749.2
For the financial years ended 30 June 2016 and 30 June 2015, the principal assets of the Group comprised the aircraft fleet. These assets are used flexibly across the Group’s worldwide route network. Accordingly, there is no suitable basis for allocating such assets and the related liabilities between geographic areas.
B2. Earnings per shareBasic earnings per share (EPS) is calculated by dividing the profit or loss attributable to ordinary equity holders of the Company by the weighted average number of ordinary shares outstanding during the period.
Diluted EPS adjusts the basic EPS for the effects of any instruments that could potentially be converted into ordinary shares. Potential ordinary shares shall be treated as dilutive when, and only when, their conversion to ordinary shares would decrease earnings per share or increase loss per share from continuing operations. The average market value of the Company’s shares for the purpose of calculating the dilutive effect of share options and performance rights is based on quoted market prices for the period that the options and performance rights were outstanding. At 30 June 2016, 2.4 million options and performance rights (2015: 9.5 million) were excluded from the diluted weighted average number of ordinary shares calculation due to their anti-dilutive effect.
2016 $m
2015 $m
Loss attributable to ordinary shareholders (260.9) (110.8)
Basic earnings (260.9) (110.8)
Diluted earnings (260.9) (110.8)
2016 Number (m)
2015 Number (m)
Weighted average number of ordinary shares - basic 3,530.8 3,515.2
Effect of share options and performance rights on issue – –
Weighted average number of ordinary shares and potential ordinary shares - diluted 3,530.8 3,515.2
Subsequent to the reporting date, the Group completed a one for one non-renounceable entitlement offer and as a result of this offer, issued 4,057,573,937 new fully paid ordinary shares. These shares commenced trading on 5 August 2016. In addition, the Group completed an additional placement of 342,971,441 fully paid ordinary shares to HNA Innovation Ventures (Hong Kong) Co. Limited (HNA) on 20 September 2016].

A N N U A L F I N A N C I A L R E P O R T 2 0 1 6 5 3
B3. RevenueRevenue is recognised to the extent it is probable that the economic benefits will flow to the Group and the revenue can be reliably measured. Revenue is measured at the fair value of the consideration received or receivable.
(a) Airline passenger revenue
Airline passenger revenueAirline passenger revenue comprises revenue from passenger ticket sales. Revenue is recognised in profit or loss when carriage is performed. Airline passenger revenue received in advance is carried forward in the consolidated statement of financial position as unearned revenue based on expected future carriage.
The calculation of unearned passenger revenue requires the use of estimates and judgements including an assessment of historical trends of passenger non-attendance rates which are reviewed at each reporting date. The reassessment of historical trends of non-attendance rates on unearned passenger revenue obligations resulted in no changes to revenue in the current year (2015: increase of $3.0 million).
In addition, the Group is a party to various alliance arrangements. Revenue under these arrangements is recognised in profit or loss when the Group performs the carriage or otherwise fulfils all relevant contractual commitments.
Loyalty program revenueThe Group receives participation fee revenue from third parties for the rights to have loyalty points allocated to members of the Velocity Frequent Flyer program. Members of the Velocity Frequent Flyer program also accumulate loyalty points by travelling on qualifying Group airline services. The obligation to provide awards to members is accounted for by deferring the participation fee revenue and a portion of the flight ticket sales revenue. The amount deferred is the fair value, which is the amount for which the points could be sold separately (taking into account non-performance risk) and includes an estimate based on historical trends of breakage. The receipt of cash from third parties in excess of the fair value of the redemption is recognised immediately in profit or loss. For airline redemptions, revenue is recognised in profit or loss in accordance with the accounting policy for airline passenger revenue above. For non-airline redemptions relating to third parties, revenue is recognised in profit or loss as ancillary revenue when points are redeemed.
The calculation of unearned revenue in the consolidated statement of financial position requires the use of estimates and judgements based on assumptions regarding the fair value of reward points. The fair value of the reward points is reduced to reflect points that are expected to lapse under the rules of the Velocity Frequent Flyer program. Assumptions are based on historical trends experienced within the program. The reassessment of the unused points liability in regards to the Velocity Frequent Flyer program resulted in an increase in program revenue of $17.2 million in the current year (2015: decrease of $6.4 million).
(b) Other ancillary revenue
Credit vouchersRevenue from the redemption of credit vouchers is recognised in profit or loss as other ancillary revenue when carriage is complete, or when the credit voucher is no longer expected to be redeemed by the passenger based on an analysis of historical non-redemption rates, or upon expiry.
The calculation of credit vouchers that are no longer expected to be redeemed requires the use of estimates and judgements including an assessment of expected redemption rates based on historical issued and expired credit vouchers which are reviewed at each reporting date. The reassessment of expected redemption rates resulted in no changes to revenue in the current year (2015: decrease of $4.5 million).
OtherOther ancillary revenue comprises revenue earned from the provision of other airline related services (including charter revenue, freight revenue, on-board sales and other product revenue) and revenue from unutilised carriage. Other ancillary revenue is recognised in profit or loss at the time the service is provided or when carriage is performed.

V I R G I N A U S T R A L I A G R O U P5 4
Notes to the consolidated financial statements (continued)For the year ended 30 June 2016
B4. ExpensesThis section sets out certain specific expenses included within the following profit or loss line items.
(a) Aircraft operating lease expenses and other expenses from ordinary activities2016
$m2015
$m
Aircraft operating lease rentals 360.6 290.0
Other operating lease rentals 99.3 80.2
Total operating lease rentals 459.9 370.2
(b) Labour and staff related expensesThe Group contributes to several defined contribution superannuation plans. A defined contribution plan is a post-employment benefit plan under which an entity pays fixed contributions into a separate entity and will have no legal or constructive obligation to pay further amounts. Such contributions are charged to profit or loss in the periods during which services are rendered by employees. Prepaid contributions are recognised as an asset to the extent that a cash refund or reduction in future payments is available. The amount recognised as an expense for the year ended 30 June 2016 was $71.7 million (2015: $69.4 million).
(c) Net finance costsFinance income is recognised in profit or loss as it accrues, using the effective interest rate method.
Finance costs comprise interest paid or payable on borrowings calculated using the effective interest rate method, amortisation of borrowing costs and unwinding of the discount on provisions and other liabilities.
Finance costs that relate to qualifying assets are capitalised to the cost of the assets. If funds are borrowed specifically for the acquisition, construction or production of a qualifying asset, the finance costs capitalised are those incurred in relation to that borrowing, net of any interest earned on those borrowings. If funds are borrowed generally, finance costs are capitalised using a weighted average capitalisation rate and amortised over the terms of the agreement. Finance costs were capitalised at a weighted average rate of 3.07% (2015: 2.72%).
2016 $m
Restated(1)
2015 $m
Interest and finance charges 174.4 124.8
Unwinding of discount on provisions and other liabilities 9.2 9.4
Less: interest paid and capitalised on qualifying assets (2.6) (1.3)
Finance costs expensed 181.0 132.9
(1) These amounts have been restated to reflect the amount capitalised on qualifying assets and to disclose the amounts relating to the unwinding of discounted provisions
and liabilities.

A N N U A L F I N A N C I A L R E P O R T 2 0 1 6 5 5
B5. TaxationIncome tax expense or benefitIncome tax expense or benefit comprises current and deferred tax. It is recognised in profit or loss except to the extent that it relates to a business combination or items recognised directly in equity or other comprehensive income.
Current taxCurrent tax comprises the expected tax payable or receivable on the taxable income or loss for the year and any adjustment to the tax payable or receivable in respect of previous years. It is measured using tax rates and tax laws enacted or substantively enacted at the reporting date.
Deferred taxDeferred tax is recognised for all taxable temporary differences arising from the difference between the carrying amount of assets and liabilities and their corresponding tax base. It is measured using tax rates and tax laws that are expected to apply when the assets are recovered or liabilities are settled, based on those tax rates which are enacted or substantively enacted at the reporting date.
Deferred tax is not recognised for temporary differences:• on the initial recognition of assets or liabilities in a transaction that is not a business combination and that affects neither accounting nor
taxable profit or loss;• relating to investments in subsidiaries and associates, and interests in joint arrangements, where the Group is able to control the timing of
the reversal of the temporary differences and it is probable that the differences will not reverse in the foreseeable future; or• arising on initial recognition of goodwill.
Deferred tax assets and liabilities are offset if there is a legally enforceable right to offset current tax liabilities and assets, and they relate to income taxes levied by the same tax authority on the same taxable entity, or on different taxable entities but they intend to settle current tax liabilities and assets on a net basis or their tax assets and liabilities will be realised simultaneously.
Deferred tax assets are recognised for deductible temporary differences and unused tax losses to the extent that it is probable that taxable profit will be available against which they can be utilised. Estimates and judgements are required to determine the amount of deferred tax assets that can be recognised at each reporting date, based upon the likely timing and level of future taxable profits. At 30 June 2016, the Group had $2,067.7 million (2015: $1,829.9 million) of tax losses carried forward which have no expiry date. A deferred tax asset of $620.3 million (2015: $549.0 million) has been recognised in respect of these losses. This asset is recognised based on detailed financial modelling of future taxable profits based on Group operating initiatives, recent industry trends and long term industry analysis. These models have been approved by Senior Management and the Board.
Deferred tax assets include unused tax losses in relation to Tiger Airways Australia Pty Limited and its subsidiary Tiger Airways Australia SPV Pty Ltd (collectively referred to as Tigerair Australia) recognised subsequent to the acquisition date of 16 October 2014. The facts and circumstances at the time of the acquisition did not support the recognition of any of the tax losses acquired in the business combination as it was not probable that the tax losses were recoverable. As a result of the significant turnaround in the performance of Tigerair Australia since the acquisition date and the turnaround in the aviation industry resulting from an elongated period of lower jet fuel prices and a moderation in capacity growth in the domestic market, a deferred tax asset of $14.0 million was recognised during the comparative period and subsequent to the acquisition. As at 30 June 2016, deferred tax assets have not been recognised in respect of $317.7 million (2015: $288.8 million) of net tax losses relating to Tigerair Australia because it is not considered probable that future taxable profit will be available against which these tax losses can be realised. These losses have no expiry date.
Tax consolidationVAH and its Australian controlled entities are part of a tax consolidated group (TCG) under Australian tax law. Tigerair Australia is a separate TCG. Entities within each TCG have entered into tax funding and tax sharing arrangements with the head entity in each TCG. Under the terms of the agreements, the head entity and the other entities within each TCG have agreed to pay (or receive) an amount to (or from) the head entity, based on the current tax liability or current tax asset of the relevant entity.
Each entity in each TCG measures its current and deferred taxes as if it continues to be a separate taxable entity in its own right. In addition to its own current and deferred tax amounts, the head entity in each tax consolidated group recognises the current tax liabilities (or assets) and the deferred tax assets arising from unused tax losses and unused tax credits assumed from controlled entities in the TCG to the extent that it is probable that future taxable profit will be available against which the unused tax losses and unused tax credits can be utilised.

V I R G I N A U S T R A L I A G R O U P5 6
Notes to the consolidated financial statements (continued)For the year ended 30 June 2016
B5. Taxation (continued)(a) Reconciliation of income tax benefit
2016 $m
2015 $m
Loss before tax (426.6) (163.3)
Tax benefit at the Australian tax rate of 30% (2015: 30%) 128.0 49.0
Tax effect of amounts which are not included in taxable income:
Tax loss recognition (losses not previously brought to account) – 14.0
Amended tax assessments(1) 41.5 –
Foreign currency movements on debt and securitised assets 25.4 8.9
Other non-deductible or non-assessable amounts 7.0 (2.4)
Income tax benefit 201.9 69.5
Represented by:
Deferred tax benefit 201.9 68.6
Under/(over) provision in prior years – 0.9
Income tax benefit 201.9 69.5
(1) The Australian Taxation Office (ATO) issued a private ruling that altered when participation fees received for the Group’s loyalty program are recognised for tax purposes.
The amended assessments have resulted in an income tax benefit of $41.5 million relating to taxable income attributable to periods preceding the statutory limit on tax
return amendments. The change in timing of the tax recognition of participation fees resulted in the reduction of deferred tax assets associated with tax losses carried
forward as well as the recognition of a deferred tax asset associated with unearned loyalty program revenue.
(b) Deferred taxThe composition of the Group’s net deferred tax asset recognised in the consolidated statement of financial position and the net deferred tax benefit/(expense) recognised in the consolidated statement of profit or loss and consolidated statement of profit or loss and other comprehensive income is as follows:
Consolidated statement of financial position
Consolidated statement of profit or loss
Consolidated statement of profit or loss and other
comprehensive income
2016 $m
2015 $m
2016 $m
2015 $m
2016 $m
2015 $m
Deferred tax assets
Provisions 101.7 77.6 24.1 36.9 – –
Payables 17.5 13.3 4.2 (34.9) – –
Unearned loyalty program revenue 96.6 – 96.6 - – –
Other liabilities 13.0 13.5 (0.5) 1.0 – –
Equity-raising costs (recognised in equity) 3.6 0.7 – – – –
Cash flow hedges (recognised in other comprehensive income) 5.2 6.6 – – (1.4) 1.1
Total deferred tax assets excluding tax losses 237.6 111.7 124.4 3.0 (1.4) 1.1
Tax losses carried forward 620.3 549.0 71.3 152.4 - –
Total deferred tax assets 857.9 660.7 195.7 155.4 (1.4) 1.1
Deferred tax liabilities
Property, plant and equipment (310.2) (283.7) (30.0) (72.5) – –
Maintenance assets (102.8) (101.6) (1.2) (31.7) – –
Unearned loyalty program revenue – (36.2) 36.2 – – –
Other assets (21.4) (22.6) 1.2 17.4 – –
Total deferred tax liabilities (434.4) (444.1) 6.2 (86.8) – –
Net deferred tax assets 423.5 216.6 201.9 68.6 (1.4) 1.1

A N N U A L F I N A N C I A L R E P O R T 2 0 1 6 5 7
B6. Reconciliation of net loss to net cash from operating activities
2016 $m
2015 $m
Loss (224.7) (93.8)
Adjustments for non-cash items included in profit or loss:
Depreciation 264.5 256.5
Amortisation 17.7 18.9
Share of net profits/(losses) of equity-accounted investees (0.7) 16.6
Loss on disposal of property, plant and equipment – 7.6
Amortisation of deferred borrowing costs 21.8 14.4
Equity-settled share-based payment expenses 0.8 4.0
Net change in fair value of cash flow hedges transferred to profit or loss 110.2 51.6
Unrealised foreign exchange movements – non-operating activities (15.0) (15.3)
Net finance income from Tigerair Australia acquisition – (21.8)
Amortisation of deferred loss/(gain) on sale and leaseback assets 0.4 3.6
Impairment losses on assets classified as held for sale 107.3 –
Impairment losses on other assets 118.1 –
400.4 242.3
Changes in assets and liabilities:
(Increase)/decrease in receivables (2.9) (18.6)
(Increase)/decrease in inventories (1.2) (4.5)
(Increase)/decrease in other assets 27.5 (35.7)
(Increase)/decrease in deferred and current tax assets (201.9) (69.9)
(Increase)/decrease in derivative financial instruments (110.2) (61.7)
(Decrease)/increase in payables (25.8) 50.3
(Decrease)/increase in provisions 70.6 26.8
(Decrease)/increase in unearned revenue 42.0 89.1
Net cash from operating activities 198.5 218.1

V I R G I N A U S T R A L I A G R O U P5 8
Notes to the consolidated financial statements (continued)For the year ended 30 June 2016
C. Working capital and other assets and liabilitiesThis section sets out information relating to the working capital and other assets and liabilities of the Group. Working capital includes the assets and liabilities that are used in the day-to-day trading operations of the Group.
C1. ReceivablesReceivables are initially recognised at fair value on the date the Group becomes a party to the contract. Subsequent to initial recognition, they are measured at amortised cost using the effective interest method, less an allowance for impairment. Impairment is calculated as the difference between the asset’s carrying amount and the present value of its estimated future cash flows, discounted at the asset’s original effective interest rate. No interest is charged on trade receivables. Maintenance prepayments include amounts prepaid to third party maintenance providers on a usage basis for the labour component of heavy maintenance and other major components of aircraft.
2016 $m
Restated
2015 $m
Current
Trade receivables 173.0 174.0
Less: provision for doubtful receivables (1.9) (0.8)
171.1 173.2
Other receivables 60.6 59.4
Maintenance prepayments(1) – 7.4
Prepayments 81.5 72.2
313.2 312.2
Non-current
Maintenance prepayments(1) 129.0 56.6
(1) These amounts have been reclassified from other financial assets for presentation purposes.
The Group’s exposure to foreign exchange risk, credit risk and impairment losses related to receivables is disclosed in note E7.
C2. InventoriesInventories are measured at the lower of cost and net realisable value. The costs of engineering consumables and uniforms are assigned to the individual items of inventory on the basis of weighted average costs. Cost of catering inventory is determined using the first-in, first-out (FIFO) cost method. Net realisable value is the estimated selling price in the ordinary course of business, less selling expenses. Inventories expensed during the 2016 financial year totalled $122.6 million (2015: $113.2 million).
2016 $m
2015 $m
Engineering expendables – at cost 31.7 29.3
Consumables stores – at cost 10.2 10.8
Other – at cost 0.4 1.0
42.3 41.1

A N N U A L F I N A N C I A L R E P O R T 2 0 1 6 5 9
C3. Other financial assetsDeposits include aircraft and other security deposits. Maintenance reserve deposits are payments made to lessors under operating lease agreements and are assessed for recoverability at the date the payment is made. Recoverability is determined based on historical trends.
Subsequent to recognition, all financial assets are assessed for impairment at each reporting date. A financial asset is impaired if objective evidence indicates that a loss event has occurred that has had a negative effect on the estimated future cash flows of that asset. An impairment in relation to maintenance reserve deposits of $28.5 million (2015: $7.4 million) has been recognised in other expenses in the consolidated statement of profit or loss. An impairment loss of $30.6 million in relation to maintenance reserve deposits associated with onerous leases has been recognised in impairment losses on other assets in the consolidated statement of profit or loss.
2016 $m
Restated(1)
2015 $m
Current
Deposits 2.5 26.3
Maintenance reserve deposits 29.7 34.0
32.2 60.3
Non-current
Deposits 39.7 31.0
Maintenance reserve deposits 225.2 203.5
Other 0.1 0.2
265.0 234.7
(1) Maintenance prepayments have been reclassified to receivables for presentation purposes.
C4. Other assetsA sale and leaseback transaction involves the sale of an asset and the leasing back of the same asset. If a sale and leaseback transaction results in an operating lease, and the transaction is established at fair value, any profit or loss is recognised immediately. If the sale price is below fair value, any profit or loss is recognised immediately except that, if the loss is compensated for by future lease payments at below market price, it is deferred as future lease payments in other assets and amortised in proportion to the lease payments over the period for which the asset is expected to be used. If the sale price is above the fair value, the excess over fair value is deferred as future lease payments in other liabilities and amortised over the period for which the asset is expected to be used. If the fair value at the time of a sale and leaseback transaction is less than the carrying amount, a loss equal to the amount of the difference between the carrying amount and the fair value is recognised immediately in the consolidated statement of profit or loss.
2016 $m
2015 $m
Current
Future lease payments 3.9 4.4
Other 0.4 0.3
4.3 4.7
Non-current
Future lease payments 16.5 23.4
Other 2.4 2.6
18.9 26.0

V I R G I N A U S T R A L I A G R O U P6 0
Notes to the consolidated financial statements (continued)For the year ended 30 June 2016
C5. PayablesPayables are recognised on the date the Group becomes a party to the contractual provisions of the instrument. They are non-interest-bearing.
2016 $m
2015 $m
Current
Trade payables and accruals 696.8 688.3
Other payables 12.1 13.2
708.9 701.5
Non-current
Other payables 9.3 6.3
The Group’s exposure to currency and liquidity risk related to payables is disclosed in note E7.
C6. ProvisionsA provision is a liability of uncertain timing or amount. A provision is recognised when there is a present legal or constructive obligation as a result of a past event, it is probable that an outflow of economic benefits will be required to settle the obligation, and the amount can be estimated reliably. If the effect of the time value of money is material, provisions are discounted using a pre-tax rate that reflects risks specific to the liability. The unwinding of the discount is recognised as a finance cost.
Employee benefits – annual leave and sick leaveLiabilities for annual leave expected to be settled within twelve months of the reporting date are measured at their nominal amounts and represent the amounts expected to be paid when liabilities are settled. Liabilities for non-vesting sick leave are recognised when the leave is taken and measured at the rates paid or payable.
Employee benefits – long term employee benefitsThe provision for long term employee benefits, such as long service leave, represents the present value of the estimated future cash outflows to be made resulting from employees’ services provided to the reporting date. It is calculated using expected future wage and salary levels, experience of employee departures and periods of service. Expected future payments are discounted using high quality corporate bond rates at the reporting date which most closely match the terms of maturity of the related liabilities.
Employee benefits – employee bonus plansA liability for employee benefits in the form of bonus plans is recognised in the provision for employee entitlements when there is no realistic alternative but to settle the liability and at least one of the following conditions is met:• There are formal terms in the plan for determining the amount of the benefit;• The amounts to be paid are determined before the time of completion of the annual consolidated financial statements; or• Past practice gives clear evidence of the amount of the obligation.
Liabilities for bonus plans are expected to be settled within 12 months and are measured at the amounts expected to be paid when they are settled.
Employee benefits – termination benefitsTermination benefits are expensed at the earlier of when the Group can no longer withdraw the offer of those benefits and when the Group recognises costs for a restructuring.
Maintenance – operating leased aircraftIf the Group is obligated under its operating leases to pay an amount upon return of the aircraft based on either use or condition of the aircraft, a provision is recognised at inception of the lease for the present value of the expected payment, with a corresponding asset, reflecting the maintenance components within the lease payments. The provision is accreted to the expected payment at the end of the lease with a finance cost recognised in profit or loss.
The calculation of the maintenance provision requires the use of estimates and judgements. These include the expected use of the aircraft during the lease term, forecast maintenance obligation dates and forecast contractual maintenance rates. CPI has been applied to certain current labour and market costs. The provisions are discounted based on a nominal discount rate applied of 9.0% (2015: 9.0%).

A N N U A L F I N A N C I A L R E P O R T 2 0 1 6 6 1
C6. Provisions (continued) Onerous and unfavourable contractsAn onerous contract is a contract in which the unavoidable cost of meeting the obligations under the contract exceed the economic benefits expected to be received under it. The unavoidable costs are measured at the lower of the cost of fulfilling the contract and any compensation or penalties from failure to fulfil it. Before a provision is recognised, the Group recognises any impairment loss on assets dedicated to that contract.
As part of restructuring the fleet in a prior year, the Group recognised a provision for onerous aircraft lease terms. These lease agreements expire between March and April 2017. The prospective unfavourable portion of the rental payments associated with these lease agreements has been valued on an incremental cash flow basis.
As part of the acquisition of the remainder of Tigerair Australia in the prior year, the Group recognised a provision for unfavourable aircraft lease terms of $23.5 million. The final lease agreement expires in October 2021. The Group also recognised a provision during the current year of $18.6 million for an engine maintenance contract which has hourly rates which are unfavourable compared to current market rates. This change is recognised as an adjustment to the fair value of liabilities assumed as part of the acquisition of Tigerair Australia. The contract expires in June 2023.
On 15 June 2016, the Group announced the outcomes of its capital structure review which included fleet and network optimisation initiatives. These initiatives included a planned reduction in the ATR and E190 fleet by way of the sub-leasing of operating leased aircraft. As a result of these initiatives, the Group recognised an onerous contract provision of $100.2 million for onerous operating lease terms. The provision has been measured based on the Group’s best estimate of the net cash outflow that will be required to settle the Group’s obligations. This takes into consideration the unavoidable costs of meeting the Group’s obligations under the current lease arrangements and the expected economic benefits from sub-leasing the aircraft. In addition, the Group has recognised impairment losses of $118.1 million on assets associated with these contracts, including maintenance prepayments and reserves and leasehold improvements.
Other provisionsOther provisions includes restructure costs, legal provisions and provisions for property make-good clauses contained in operating leases of premises. The property make-good provisions were recognised during the 2013 financial year as part of the acquisition of Skywest and will all expire by 2022.
(a) Provision balances2016
$m2015
$m
Current
Employee benefits 114.6 114.4
Maintenance 27.2 43.7
Onerous and unfavourable contracts 28.7 10.1
Other 0.4 4.6
170.9 172.8
Non-current
Employee benefits 15.6 16.5
Maintenance 100.9 73.6
Onerous and unfavourable contracts 94.1 24.9
Other 4.0 7.4
214.6 122.4
(b) Provision movements
2016Maintenance
$m
Onerous and unfavourable
contracts $m
Other $m
Total $m
Balance at 1 July 117.3 35.0 12.0 164.3
Provisions made 38.6 100.2 4.9 143.7
Provisions utilised (34.9) (12.6) (4.8) (52.3)
Provisions reversed – – (7.7) (7.7)
Unwinding of discount 7.1 0.2 – 7.3
Balance at 30 June 128.1 122.8 4.4 255.3
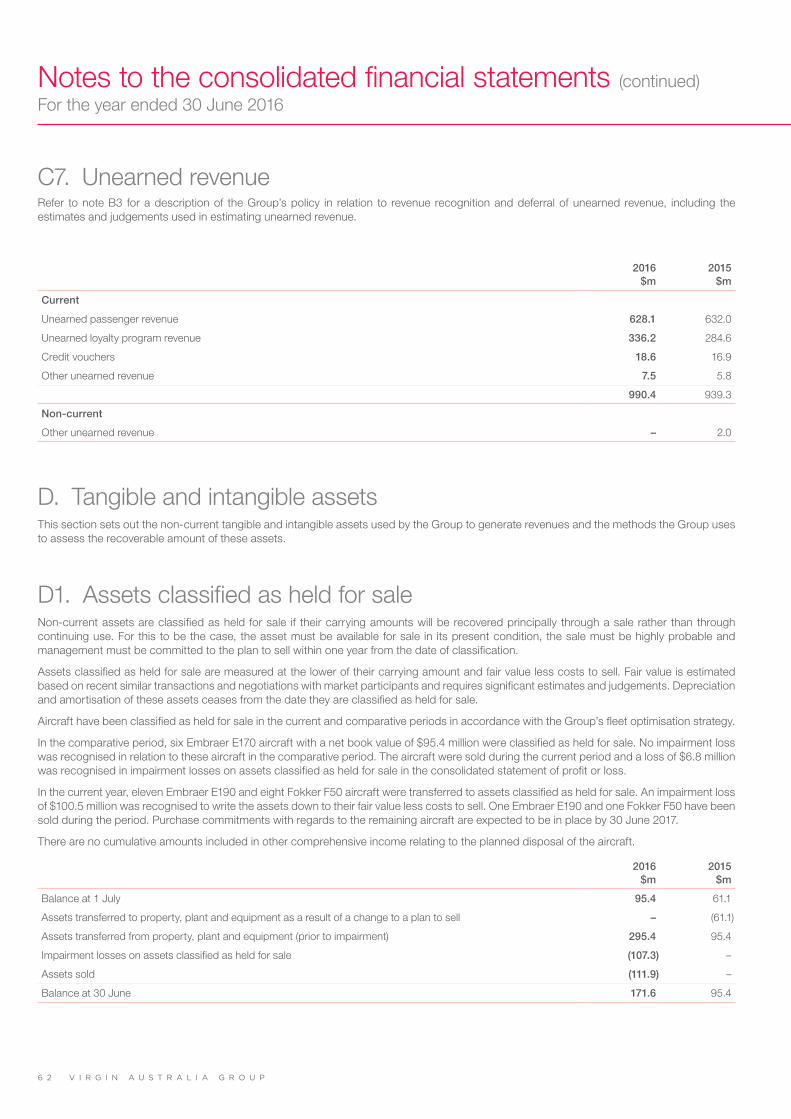
V I R G I N A U S T R A L I A G R O U P6 2
Notes to the consolidated financial statements (continued)For the year ended 30 June 2016
C7. Unearned revenueRefer to note B3 for a description of the Group’s policy in relation to revenue recognition and deferral of unearned revenue, including the estimates and judgements used in estimating unearned revenue.
2016 $m
2015 $m
Current
Unearned passenger revenue 628.1 632.0
Unearned loyalty program revenue 336.2 284.6
Credit vouchers 18.6 16.9
Other unearned revenue 7.5 5.8
990.4 939.3
Non-current
Other unearned revenue – 2.0
D. Tangible and intangible assetsThis section sets out the non-current tangible and intangible assets used by the Group to generate revenues and the methods the Group uses to assess the recoverable amount of these assets.
D1. Assets classified as held for saleNon-current assets are classified as held for sale if their carrying amounts will be recovered principally through a sale rather than through continuing use. For this to be the case, the asset must be available for sale in its present condition, the sale must be highly probable and management must be committed to the plan to sell within one year from the date of classification.
Assets classified as held for sale are measured at the lower of their carrying amount and fair value less costs to sell. Fair value is estimated based on recent similar transactions and negotiations with market participants and requires significant estimates and judgements. Depreciation and amortisation of these assets ceases from the date they are classified as held for sale.
Aircraft have been classified as held for sale in the current and comparative periods in accordance with the Group’s fleet optimisation strategy.
In the comparative period, six Embraer E170 aircraft with a net book value of $95.4 million were classified as held for sale. No impairment loss was recognised in relation to these aircraft in the comparative period. The aircraft were sold during the current period and a loss of $6.8 million was recognised in impairment losses on assets classified as held for sale in the consolidated statement of profit or loss.
In the current year, eleven Embraer E190 and eight Fokker F50 aircraft were transferred to assets classified as held for sale. An impairment loss of $100.5 million was recognised to write the assets down to their fair value less costs to sell. One Embraer E190 and one Fokker F50 have been sold during the period. Purchase commitments with regards to the remaining aircraft are expected to be in place by 30 June 2017.
There are no cumulative amounts included in other comprehensive income relating to the planned disposal of the aircraft.
2016 $m
2015 $m
Balance at 1 July 95.4 61.1
Assets transferred to property, plant and equipment as a result of a change to a plan to sell – (61.1)
Assets transferred from property, plant and equipment (prior to impairment) 295.4 95.4
Impairment losses on assets classified as held for sale (107.3) –
Assets sold (111.9) –
Balance at 30 June 171.6 95.4

A N N U A L F I N A N C I A L R E P O R T 2 0 1 6 6 3
D2. Property, plant and equipmentProperty, plant and equipment is stated at cost less accumulated depreciation and impairment losses.
Cost comprises the purchase price plus any costs directly attributable to the acquisition. This may include transfers from other comprehensive income of any gains or losses on qualifying cash flow hedges of foreign currency purchases of property, plant and equipment. Subsequent costs are capitalised only when it is probable that future economic benefits associated with the item will flow to the Group and the cost of the item can be measured reliably.
Costs of day-to-day servicing of owned and leased aircraft, including minor airframe checks are recognised in profit or loss as incurred.
The cost of major cyclical maintenance on owned aircraft is capitalised to the carrying value of the aircraft as incurred and depreciated over the period to the next scheduled heavy maintenance. Any remaining carrying amount of the cost of the previous inspection is derecognised.
If the Group is obligated under its operating leases to pay an amount upon return of the aircraft based on either use or condition of the aircraft, a provision is recognised at inception of the lease for the present value of the expected payment, with a corresponding asset, reflecting the maintenance components within the lease payments. The asset is depreciated on a straight line basis over the life of the lease. The cost of major cyclical maintenance and modifications to operating leased aircraft are capitalised as leasehold improvements and depreciated over the shorter of the remaining lease term, the estimated life of the improvement or the time to the next major maintenance event.
Depreciation is recognised on a straight-line basis over the estimated useful life, taking into account estimated residual values. Assets are depreciated from the date they are installed and are ready for use, or, in respect of internally constructed assets, from the time an asset is completed and held ready for use. Where parts of an item of property, plant and equipment have different useful lives, they are accounted for as separate items (major components) of property, plant and equipment.
Finance leased assets are depreciated over the shorter of the lease term and their useful lives unless it is reasonably certain that the Group will obtain ownership by the end of the lease term in which case they are depreciated over their useful lives.
Depreciation methods, useful lives and residual values are reviewed at each reporting date. The estimation of useful lives and residual values requires significant judgement. Australian dollar residual value estimates are based on US dollar market estimates of future aircraft values and estimates of future use of the aircraft including maintenance profiles.
There have been no changes to the useful lives of property, plant and equipment during the current year. During the year ended 30 June 2015 the useful lives of certain leasehold improvements and aircraft and aeronautic related assets changed based on the intended use of these items resulting in a $6.6 million decrease to depreciation expense for the year ended 30 June 2015.
The estimated useful lives in years of each class of asset are as follows:
2016 2015
Buildings 10-40 10-40
Aircraft and aeronautic related assets
– Modifications to leased aircraft 6-13 6-13
– Rotables and maintenance parts 9-33 9-33
– Airframe, engines and landing gear 4-20 4-20
– Major cyclical maintenance 1-10 1-10
Plant and equipment
– Leasehold improvements 1-15 1-15
– Other 5-33 5-33
Computer equipment 3-5 3-5
Finance leased assets
– Buildings 34 34
– Aeronautic related assets 4-5 4-5
The Group recognised no net losses on disposal of property, plant and equipment during the year ended 30 June 2016 (2015: $7.6 million). In the comparative period, this loss was included in other expenses from ordinary activities in the consolidated statement of profit or loss.

V I R G I N A U S T R A L I A G R O U P6 4
Notes to the consolidated financial statements (continued)For the year ended 30 June 2016
D2. Property, plant and equipment (continued)(a) Reconciliations
2016Buildings
$m
Aircraft and aeronautic(1)
$m
Plant and equipment
$m
Computer equipment
$m
Finance leased assets
$m
Work in progress
$mTotal
$m
Balance at 1 July 6.5 2,740.3 99.1 16.7 23.1 196.2 3,081.9
Business combination acquisitions – – 0.1 – – – 0.1
Other additions – 208.2 – 0.2 – 433.6 642.0
Impairment losses – (22.8) – – – – (22.8)
Disposals – (106.7) (1.5) – – (198.3) (306.5)
Depreciation (0.3) (236.9) (18.7) (7.9) (0.7) – (264.5)
Transfers from work in progress – 117.0 61.8 3.8 – (182.6) –
Net transfers to assets classified as held for sale (refer note D1) – (295.4) – – – – (295.4)
Foreign exchange movements – 37.4 – – – 0.6 38.0
Balance at 30 June 6.2 2,441.1 140.8 12.8 22.4 249.5 2,872.8
At cost 19.8 3,644.6 318.0 72.0 24.6 249.5 4,328.5
Accumulated depreciation and impairment (13.6) (1,203.5) (177.2) (59.2) (2.2) - (1,455.7)
6.2 2,441.1 140.8 12.8 22.4 249.5 2,872.8
Total pledged as security in relation to interest-bearing liabilities 5.9 2,244.0 15.0 – – – 2,264.9
2015Buildings
$m
Aircraft and aeronautic(1)
$m
Plant and equipment
$m
Computer equipment
$m
Finance leased assets
$m
Work in progress
$mTotal
$m
Balance at 1 July 6.9 2,491.9 112.4 13.8 23.8 53.6 2,702.4
Business combination acquisitions – 5.0 – – – 75.0 80.0
Other additions – 441.0 2.5 0.4 – 171.1 615.0
Disposals – (92.5) (1.1) (1.1) – (72.4) (167.1)
Depreciation (0.4) (229.4) (17.5) (8.5) (0.7) – (256.5)
Transfers from work in progress – 18.7 2.6 12.1 – (33.4) –
Net transfers to assets classified as held for sale (refer note D1) – (34.3) – – – – (34.3)
Foreign exchange movements – 139.9 0.2 – – 2.3 142.4
Balance at 30 June 6.5 2,740.3 99.1 16.7 23.1 196.2 3,081.9
At cost(1) 19.8 4,060.0 258.0 68.0 24.6 196.2 4,626.6
Accumulated depreciation and impairment (13.3) (1,319.7) (158.9) (51.3) (1.5) – (1,544.7)
6.5 2,740.3 99.1 16.7 23.1 196.2 3,081.9
Total pledged as security in relation to interest-bearing liabilities 6.2 2,575.6 15.7 – – – 2,597.5
(1) Includes deposits and other costs incurred in respect of aircraft which have not yet been delivered of $107.6 million (2015: $145.8 million). These amounts are not
being depreciated.
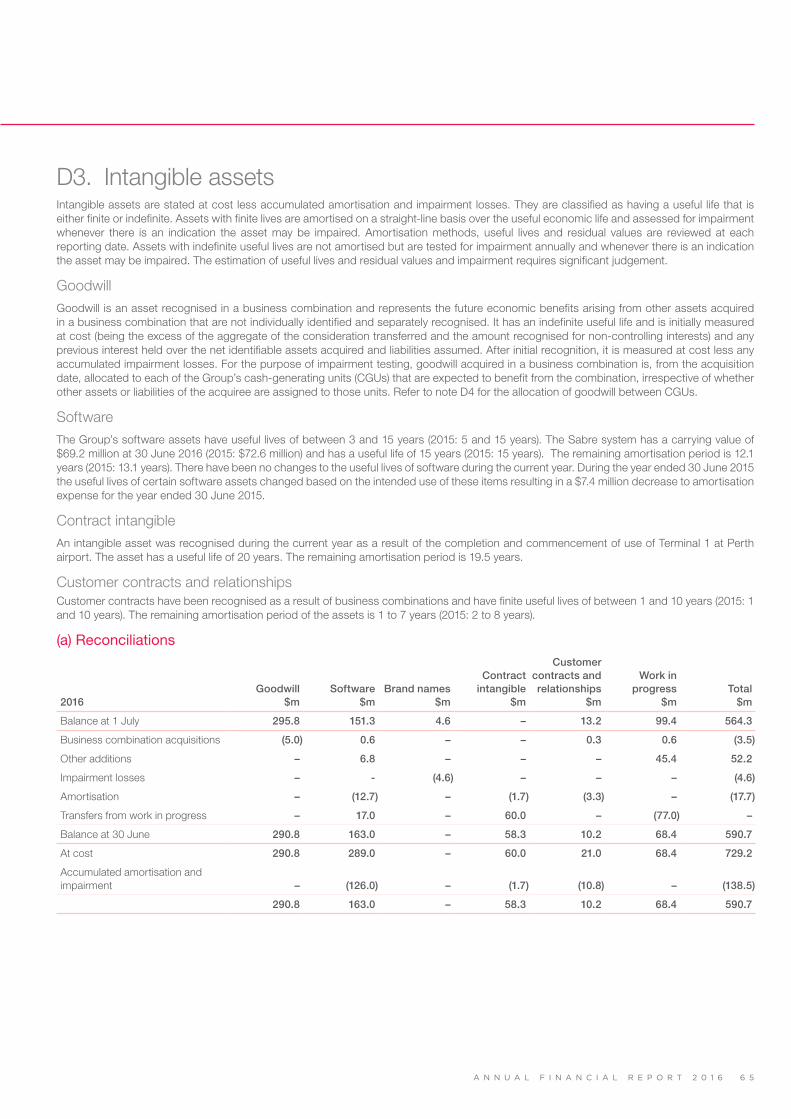
A N N U A L F I N A N C I A L R E P O R T 2 0 1 6 6 5
D3. Intangible assetsIntangible assets are stated at cost less accumulated amortisation and impairment losses. They are classified as having a useful life that is either finite or indefinite. Assets with finite lives are amortised on a straight-line basis over the useful economic life and assessed for impairment whenever there is an indication the asset may be impaired. Amortisation methods, useful lives and residual values are reviewed at each reporting date. Assets with indefinite useful lives are not amortised but are tested for impairment annually and whenever there is an indication the asset may be impaired. The estimation of useful lives and residual values and impairment requires significant judgement.
GoodwillGoodwill is an asset recognised in a business combination and represents the future economic benefits arising from other assets acquired in a business combination that are not individually identified and separately recognised. It has an indefinite useful life and is initially measured at cost (being the excess of the aggregate of the consideration transferred and the amount recognised for non-controlling interests) and any previous interest held over the net identifiable assets acquired and liabilities assumed. After initial recognition, it is measured at cost less any accumulated impairment losses. For the purpose of impairment testing, goodwill acquired in a business combination is, from the acquisition date, allocated to each of the Group’s cash-generating units (CGUs) that are expected to benefit from the combination, irrespective of whether other assets or liabilities of the acquiree are assigned to those units. Refer to note D4 for the allocation of goodwill between CGUs.
SoftwareThe Group’s software assets have useful lives of between 3 and 15 years (2015: 5 and 15 years). The Sabre system has a carrying value of $69.2 million at 30 June 2016 (2015: $72.6 million) and has a useful life of 15 years (2015: 15 years). The remaining amortisation period is 12.1 years (2015: 13.1 years). There have been no changes to the useful lives of software during the current year. During the year ended 30 June 2015 the useful lives of certain software assets changed based on the intended use of these items resulting in a $7.4 million decrease to amortisation expense for the year ended 30 June 2015.
Contract intangibleAn intangible asset was recognised during the current year as a result of the completion and commencement of use of Terminal 1 at Perth airport. The asset has a useful life of 20 years. The remaining amortisation period is 19.5 years.
Customer contracts and relationshipsCustomer contracts have been recognised as a result of business combinations and have finite useful lives of between 1 and 10 years (2015: 1 and 10 years). The remaining amortisation period of the assets is 1 to 7 years (2015: 2 to 8 years).
(a) Reconciliations
2016Goodwill
$mSoftware
$mBrand names
$m
Contract intangible
$m
Customer contracts and relationships
$m
Work in progress
$mTotal
$m
Balance at 1 July 295.8 151.3 4.6 – 13.2 99.4 564.3
Business combination acquisitions (5.0) 0.6 – – 0.3 0.6 (3.5)
Other additions – 6.8 – – – 45.4 52.2
Impairment losses – - (4.6) – – – (4.6)
Amortisation – (12.7) – (1.7) (3.3) – (17.7)
Transfers from work in progress – 17.0 – 60.0 – (77.0) –
Balance at 30 June 290.8 163.0 – 58.3 10.2 68.4 590.7
At cost 290.8 289.0 – 60.0 21.0 68.4 729.2
Accumulated amortisation and impairment – (126.0) – (1.7) (10.8) – (138.5)
290.8 163.0 – 58.3 10.2 68.4 590.7
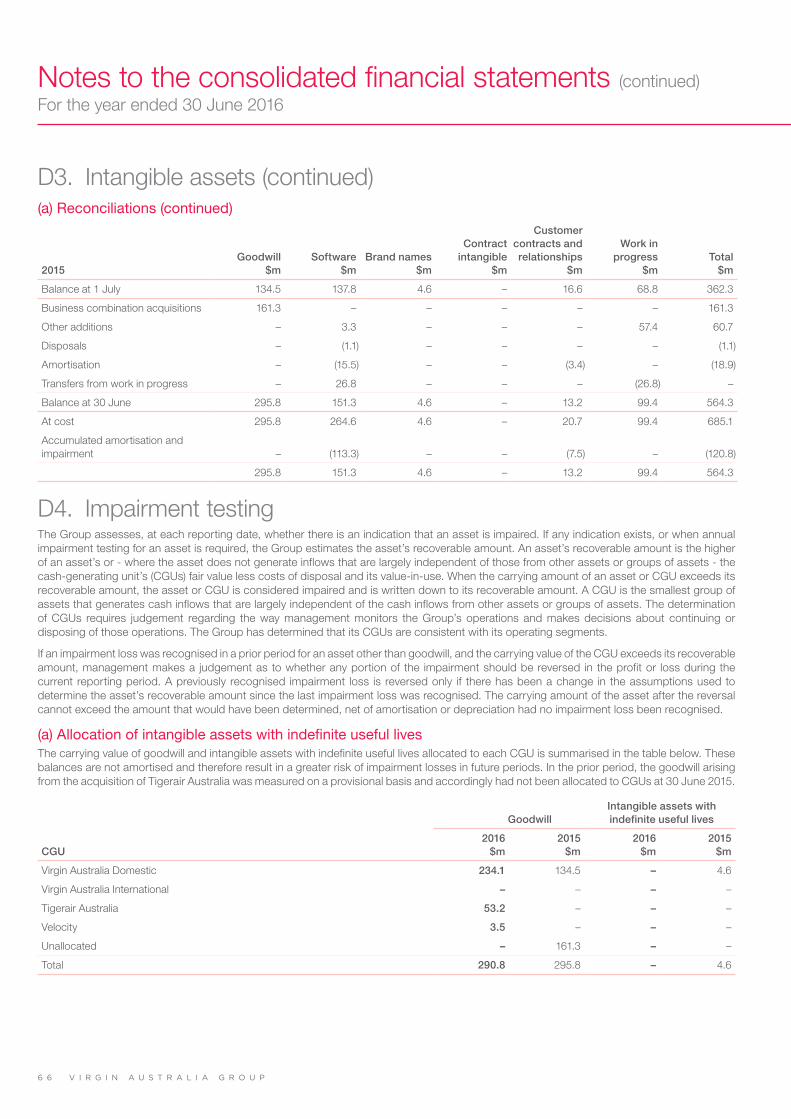
V I R G I N A U S T R A L I A G R O U P6 6
Notes to the consolidated financial statements (continued)For the year ended 30 June 2016
D3. Intangible assets (continued)(a) Reconciliations (continued)
2015Goodwill
$mSoftware
$mBrand names
$m
Contract intangible
$m
Customer contracts and relationships
$m
Work in progress
$mTotal
$m
Balance at 1 July 134.5 137.8 4.6 – 16.6 68.8 362.3
Business combination acquisitions 161.3 – – – – – 161.3
Other additions – 3.3 – – – 57.4 60.7
Disposals – (1.1) – – – – (1.1)
Amortisation – (15.5) – – (3.4) – (18.9)
Transfers from work in progress – 26.8 – – – (26.8) –
Balance at 30 June 295.8 151.3 4.6 – 13.2 99.4 564.3
At cost 295.8 264.6 4.6 – 20.7 99.4 685.1
Accumulated amortisation and impairment – (113.3) – – (7.5) – (120.8)
295.8 151.3 4.6 – 13.2 99.4 564.3
D4. Impairment testingThe Group assesses, at each reporting date, whether there is an indication that an asset is impaired. If any indication exists, or when annual impairment testing for an asset is required, the Group estimates the asset’s recoverable amount. An asset’s recoverable amount is the higher of an asset’s or - where the asset does not generate inflows that are largely independent of those from other assets or groups of assets - the cash-generating unit’s (CGUs) fair value less costs of disposal and its value-in-use. When the carrying amount of an asset or CGU exceeds its recoverable amount, the asset or CGU is considered impaired and is written down to its recoverable amount. A CGU is the smallest group of assets that generates cash inflows that are largely independent of the cash inflows from other assets or groups of assets. The determination of CGUs requires judgement regarding the way management monitors the Group’s operations and makes decisions about continuing or disposing of those operations. The Group has determined that its CGUs are consistent with its operating segments.
If an impairment loss was recognised in a prior period for an asset other than goodwill, and the carrying value of the CGU exceeds its recoverable amount, management makes a judgement as to whether any portion of the impairment should be reversed in the profit or loss during the current reporting period. A previously recognised impairment loss is reversed only if there has been a change in the assumptions used to determine the asset’s recoverable amount since the last impairment loss was recognised. The carrying amount of the asset after the reversal cannot exceed the amount that would have been determined, net of amortisation or depreciation had no impairment loss been recognised.
(a) Allocation of intangible assets with indefinite useful livesThe carrying value of goodwill and intangible assets with indefinite useful lives allocated to each CGU is summarised in the table below. These balances are not amortised and therefore result in a greater risk of impairment losses in future periods. In the prior period, the goodwill arising from the acquisition of Tigerair Australia was measured on a provisional basis and accordingly had not been allocated to CGUs at 30 June 2015.
GoodwillIntangible assets with indefinite useful lives
CGU2016
$m2015
$m2016
$m2015
$m
Virgin Australia Domestic 234.1 134.5 – 4.6
Virgin Australia International – – – –
Tigerair Australia 53.2 – – –
Velocity 3.5 – – –
Unallocated – 161.3 – –
Total 290.8 295.8 – 4.6

A N N U A L F I N A N C I A L R E P O R T 2 0 1 6 6 7
D4. Impairment testing (continued)(b) Recoverable amountThe recoverable amounts of CGUs have been determined based on value-in-use calculations. Estimated future cash flows are based on financial budgets covering a five year period and approved by senior management. The key assumptions underlying the cash flow projections are as follows:
• Management’s expectation regarding the market, including passenger numbers, revenue yield and operating costs;• The fuel price is set with regard to the Brent forward curve adjusted for refining margins and hedge positions;• The AUD/USD exchange rate is set with regard to the prevailing spot rate;• Load factors and average net fares are set having regard to historical experience and market conditions, fleet plans and competitor
behaviour; and• Projected cash flows beyond the five year period are based on industry forecasts of estimated growth rates.
Estimated future cash flows are discounted to their present value using a post-tax discount rate that reflects the weighted average cost of capital based on the risk-free rate for ten year Australian government bonds adjusted for a risk premium to reflect the risk of the specific CGU.
The growth rates, post-tax discount rates (and equivalent pre-tax discount rates) used in determining value-in-use are included in the table below.
Growth rate Post-tax rate Pre-tax rate
CGU2016
%2015
%2016
%2015
%2016
%2015
%
Virgin Australia Domestic 3.00 3.00 8.53 8.53 10.82 10.73
Virgin Australia International 3.00 3.00 9.13 9.13 10.67 10.81
Tigerair Australia 3.00 3.50 8.93 8.93 10.23 10.55
Velocity(1) 3.00 N/A 8.53 N/A 10.85 N/A
(1) In the comparative period, the Group determined that impairment testing was not required as no impairment triggers had occurred and no goodwill was recognised.
(c) Sensitivity analysisThe recoverable amount of the Virgin Australia International CGU exceeds its carrying amount by $111.0 million (2015: $78.0 million). Management has identified that a reasonably possible change in the following assumptions would cause the carrying amount to exceed the recoverable amount. The following table shows the assumptions used and the percentage by which these assumptions would need to change individually for the estimated recoverable amount to be equal to the carrying amount, assuming all other variables remain constant.
2016 Assumption
2016 %
2015 Assumption
2015
%
Revenue growth rate (% per annum) 1.7 (15.0) 2.9 (4.0)
Australian dollar (AUD/USD) 0.73 (2.7) 0.75 (0.9)
Jet fuel price (AUD/bbl including fuel handling costs) 97.50 3.9 130.59 1.5
The Group has considered all reasonably possible changes in key assumptions relating to the remaining CGUs and concluded that no impairment would result from these changes.

V I R G I N A U S T R A L I A G R O U P6 8
Notes to the consolidated financial statements (continued)For the year ended 30 June 2016
E. Capital structure and financial risksThis section sets out the capital structure of the Group and its exposure to financial risks. The capital structure consists of debt and equity. The Group has a strong focus on optimising the capital structure to obtain a balance between reducing finance costs and managing risks. This section also sets out the financial risks to which the Group is exposed as a result of its operating, investing and financing activities.
E1. Capital managementCapital management is a key focus of the Board and senior management and it is the Group’s policy to maintain a strong capital base that will ensure continuing investor, creditor and market support for the future development of the business.
The Board monitors:
• The liquidity of the Group including unrestricted and total cash balances;• Future financing requirements including those relating to aircraft purchases, with determination of financing being based on competitively
priced financing alternatives available at the time of the financing transaction; and • Compliance with debt covenants.
During the 2016 financial year, the Group undertook a capital structure review in order to strengthen its balance sheet, improve liquidity, reduce debt and build a lower, sustainable cost base to improve earnings and cash flow. As a result of this review, the Group issued shares of $158.8 million to a new strategic alliance partner, HNA Aviation Group Co. Ltd. In addition, the Group announced a one for one pro-rata non-renounceable entitlement offer of $852.0 million which completed in August 2016.
The following table summarises the Group’s net debt position.
2016 $m
2015 $m
Current interest-bearing liabilities (875.8) (440.3)
Cash and cash equivalents (including restricted cash) 1,123.8 1,028.5
Net current debt 248.0 588.2
Non-current interest-bearing liabilities (2,124.2) (2,321.9)
Net debt (non-IFRS measure) (1,876.2) (1,733.7)
E2. Cash and cash equivalentsCash and cash equivalents comprise cash on hand, on-demand deposits and short-term highly liquid investments that are readily convertible to known amounts of cash and are subject to insignificant changes in value.
2016 $m
2015 $m
Cash at bank and on hand 306.9 328.8
Deposits 816.9 699.7
1,123.8 1,028.5
Certain merchant acquiring relationships require restricted cash to be held to cover total forward sales for some forms of payment. Cash is also required to secure standby letters of credit and bank guarantees. Cash held in entities with non-controlling interests are subject to restrictions relating to distributions. The amount of restricted cash included in cash and cash equivalents but not available for use is $394.9 million (2015: $309.6 million).
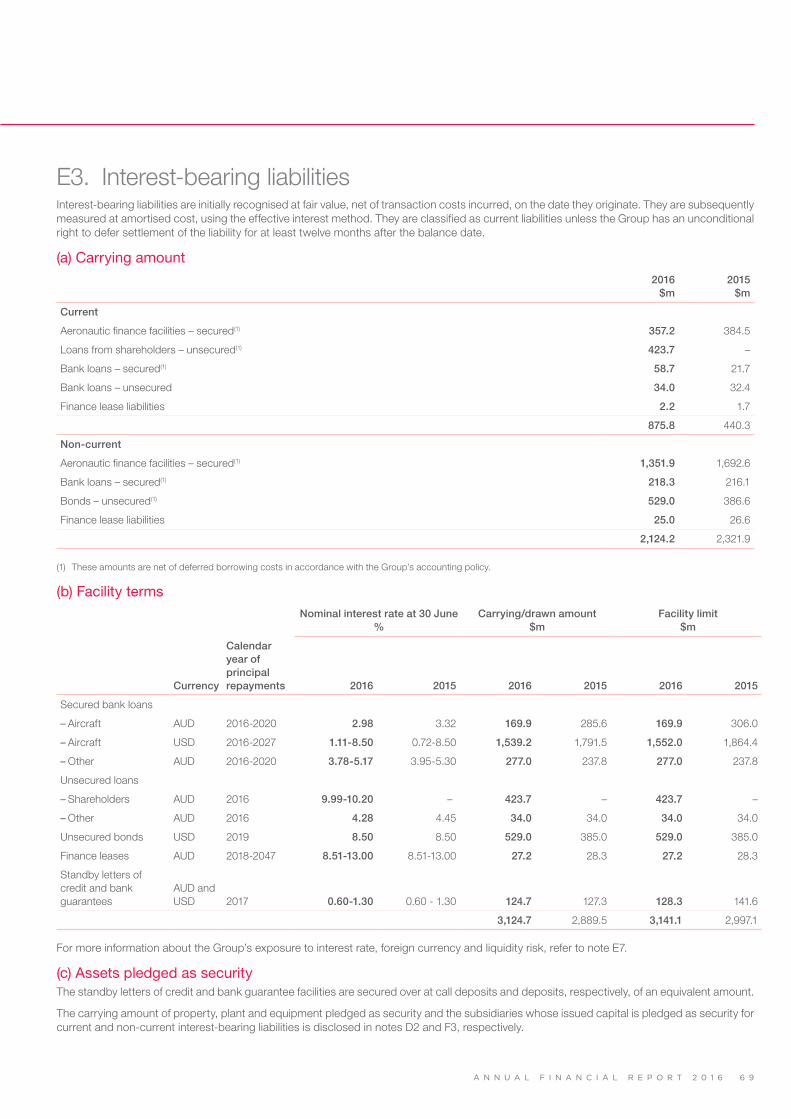
A N N U A L F I N A N C I A L R E P O R T 2 0 1 6 6 9
E3. Interest-bearing liabilitiesInterest-bearing liabilities are initially recognised at fair value, net of transaction costs incurred, on the date they originate. They are subsequently measured at amortised cost, using the effective interest method. They are classified as current liabilities unless the Group has an unconditional right to defer settlement of the liability for at least twelve months after the balance date.
(a) Carrying amount2016
$m2015
$m
Current
Aeronautic finance facilities – secured(1) 357.2 384.5
Loans from shareholders – unsecured(1) 423.7 –
Bank loans – secured(1) 58.7 21.7
Bank loans – unsecured 34.0 32.4
Finance lease liabilities 2.2 1.7
875.8 440.3
Non-current
Aeronautic finance facilities – secured(1) 1,351.9 1,692.6
Bank loans – secured(1) 218.3 216.1
Bonds – unsecured(1) 529.0 386.6
Finance lease liabilities 25.0 26.6
2,124.2 2,321.9
(1) These amounts are net of deferred borrowing costs in accordance with the Group’s accounting policy.
(b) Facility termsNominal interest rate at 30 June
%Carrying/drawn amount
$mFacility limit
$m
Currency
Calendar year of principal repayments 2016 2015 2016 2015 2016 2015
Secured bank loans
– Aircraft AUD 2016-2020 2.98 3.32 169.9 285.6 169.9 306.0
– Aircraft USD 2016-2027 1.11-8.50 0.72-8.50 1,539.2 1,791.5 1,552.0 1,864.4
– Other AUD 2016-2020 3.78-5.17 3.95-5.30 277.0 237.8 277.0 237.8
Unsecured loans
– Shareholders AUD 2016 9.99-10.20 – 423.7 – 423.7 –
– Other AUD 2016 4.28 4.45 34.0 34.0 34.0 34.0
Unsecured bonds USD 2019 8.50 8.50 529.0 385.0 529.0 385.0
Finance leases AUD 2018-2047 8.51-13.00 8.51-13.00 27.2 28.3 27.2 28.3
Standby letters of credit and bank guarantees
AUD and USD 2017 0.60-1.30 0.60 - 1.30 124.7 127.3 128.3 141.6
3,124.7 2,889.5 3,141.1 2,997.1
For more information about the Group’s exposure to interest rate, foreign currency and liquidity risk, refer to note E7.
(c) Assets pledged as securityThe standby letters of credit and bank guarantee facilities are secured over at call deposits and deposits, respectively, of an equivalent amount.
The carrying amount of property, plant and equipment pledged as security and the subsidiaries whose issued capital is pledged as security for current and non-current interest-bearing liabilities is disclosed in notes D2 and F3, respectively.

V I R G I N A U S T R A L I A G R O U P7 0
Notes to the consolidated financial statements (continued)For the year ended 30 June 2016
E4. Share capitalOrdinary share capitalOrdinary shares carry one vote per share and carry the right to dividends. In the event of winding up of the Company, ordinary shareholders rank after all other shareholders and creditors and are fully entitled to any proceeds of liquidation. All authorised shares have been issued and fully paid and have no par value.
When vesting conditions associated with the Senior Executive Option Plans (SEOP) are met, additional ordinary shares may be issued or shares may be purchased on-market.
On 23 June 2016, 529.2 million shares were issued to HNA Innovation Ventures (Hong Kong) Co. Limited at a price of $0.30 per share resulting in an increase in share capital, before transaction costs, of $158.8 million.
Treasury shares The trustee for the Key Employee Performance Plan (KEPP) holds shares in VAH which may be transferred to employees of the Group in accordance with the rules of the Plan. The trust acts as the Company’s agent and accordingly, KEPP transactions are treated as being directly executed by the Company. These shares are represented as treasury shares and offset against share capital in the table below. The Group has recognised the cost of the KEPP shares in profit or loss and has recognised the carrying value of the shares in the share-based payments reserve.
Treasury shares carry no voting or dividend rights until the shares are transferred to the employees, following satisfaction of any vesting conditions. When the shares vest, the carrying value of the vested shares is transferred from the share-based payments reserve to share capital. Refer to note G3 for further information on share-based payments.
(a) Reconciliations2016 2015
Number
(m)
Value
$m
Number
(m)
Value
$m
Ordinary share capital (issued and fully paid)
Balance at 1 July 3,524.9 1,170.6 3,514.8 1,166.8
Issue of shares for cash, net of transaction costs 529.2 154.0 – –
Increase in share capital - SEOP Issue 15 – – 7.5 2.9
Increase in share capital - SEOP Issue 16 1.7 0.7 2.6 0.9
Increase in share capital - SEOP Issue 18 0.6 0.3 – –
Increase in share capital - SEOP Issue 19 0.7 0.3 – –
Balance at 30 June 4,057.1 1,325.9 3,524.9 1,170.6
Less: Treasury shares
Balance at 1 July (7.2) (17.7) (11.5) (19.5)
Increase in share capital - KEPP 12 0.7 0.3 1.5 0.6
Increase in share capital - KEPP 13 1.1 0.5 2.8 1.2
Balance at 30 June (5.4) (16.9) (7.2) (17.7)
Net ordinary share capital
Balance at 1 July 3,517.7 1,152.9 3,503.3 1,147.3
Issue of shares for cash, net of transaction costs 529.2 154.0 – –
Increase in share capital - SEOP 3.0 1.3 10.1 3.8
Increase in share capital - KEPP 1.8 0.8 4.3 1.8
Balance at 30 June 4,051.7 1,309.0 3,517.7 1,152.9

A N N U A L F I N A N C I A L R E P O R T 2 0 1 6 7 1
E5. DividendsNo dividends were declared or paid during the year ended 30 June 2016 or during the prior corresponding year. The following imputation credits are available for use in a subsequent reporting period. The ability to use franking credits is dependent on the ability to declare dividends.
Currency 2016 2015
Dividend franking account balances
Virgin Australia Holdings Limited based on tax rate of 30% (2015: 30%) AUD m 50.9 68.8
Exempting franking credits from acquisition of Skywest Group based on tax rate of 30% (2015: 30%) AUD m 4.2 4.2
Virgin Australia Airlines (NZ) Ltd based on tax rate of 28% (2015: 28%) NZD m – 7.6
E6. ReservesForeign currency translation reserveExchange differences arising on translation of foreign operations are recognised in the foreign currency translation reserve, as described in note A(d).
Hedge reserve and option time value reserveThe hedge reserve and option time value reserve are used to recognise the effective portion of changes in the fair value of cash flow hedging instruments. If the hedging instrument no longer meets the criteria for hedge accounting, is expired or sold, terminated or exercised, then hedge accounting is discontinued prospectively. The cumulative gain or loss previously recognised in the hedge reserve or option time value reserve remains there until the forecast transaction is recognised in profit or loss, or recognised as part of the acquisition price of property, plant and equipment.
Share-based payments reserveThe Group operates a number of employee option plans and share plans. The share-based payments reserve is used to recognise the grant date fair value of equity-settled share-based payments provided to employees with a corresponding entry in profit or loss. When the underlying shares vest and are transferred to the employee, the reserve balance is reversed and recognised in share capital. Refer to note G3 for further information on share-based payments.
Non-controlling interests’ contribution reserveThe non-controlling interests’ contribution reserve represents the excess of consideration received over and above the carrying value of net assets attributable to equity instruments when acquired by non-controlling interests and non-reciprocal capital contributions by the Company.

V I R G I N A U S T R A L I A G R O U P7 2
Notes to the consolidated financial statements (continued)For the year ended 30 June 2016
E7. Financial risk managementThe Group has exposure to a variety of financial risks, including market risk, credit risk and liquidity risk. The Group’s overall risk management program focuses on the unpredictability of financial markets and seeks to minimise potential adverse effects on the financial performance of the Group. There have been no significant changes in the Group’s risk management strategy from the previous period.
The Group manages these risk exposures using various financial instruments. The Board has determined hedging limits for financial risks and these are documented in the Treasury Risk Management Policy. Transactions entered into are to be carried out within these guidelines. Implementation of this policy is delegated to management, who have flexibility to act within the bounds of the authorised policy limits. Group policy is to not enter, issue or hold derivative financial instruments for speculative trading purposes. Compliance with the policy is monitored on an ongoing basis through regular reporting to the Board.
(a) Market risk
Market risk is the risk that changes in market prices, such as fuel prices, foreign exchange rates and interest rates, will affect the Group’s cash flows and profits. The objective of market risk management is to manage and control market exposures, within tolerances.
The Group enters into derivatives in order to manage market risks relating to fuel prices, foreign exchange rates and specific asset purchases denominated in foreign currencies. Derivatives are recognised at fair value, both initially and on an ongoing basis. On initial designation of the hedge, the Group formally documents the relationship between the hedging instruments and hedged items, including the risk management objectives and strategy in undertaking the hedge transaction, together with the methods that will be used to assess the effectiveness of the hedging relationship. The Group assesses, both at the inception of the hedge relationship as well as on an ongoing basis, whether the hedging instruments are expected to be “highly effective”.
Hedges of highly probable forecast transactions which are exposed to variations in cash flows that could ultimately affect profit or loss are called cash flow hedges. Changes in the fair value of derivatives designated as cash flow hedges are recognised directly in other comprehensive income to the extent that the hedge is effective. To the extent that the hedge is ineffective, changes in fair value are recognised in profit or loss. Cumulative gains and losses in other comprehensive income, including those relating to discontinued hedges, are recognised in profit or loss in the periods in which the hedged item will affect profit or loss. If the hedged item is capital in nature, the cumulative gain or loss is transferred to the carrying value of the hedged item when it is recognised.
Changes in the fair value of derivative financial instruments that are not designated in a hedge relationship are recognised immediately in profit or loss.
The following table summarises the fair value of the Group’s forward foreign exchange and fuel hedging contracts as at reporting date.
2016 $m
2015 $m
Current assets
Forward foreign exchange contracts - cash flow hedges 3.7 34.0
Fuel hedging contracts - cash flow hedges 22.6 9.6
26.3 43.6
Non-current assets
Forward foreign exchange contracts - cash flow hedges 2.4 2.9
Fuel hedging contracts - cash flow hedges 20.8 4.0
23.2 6.9
Current liabilities
Forward foreign exchange contracts - cash flow hedges 25.4 0.1
Fuel hedging contracts - cash flow hedges 8.0 45.5
33.4 45.6
Non-current liabilities
Forward foreign exchange contracts - cash flow hedges 7.7 –
Fuel hedging contracts - cash flow hedges 0.3 –
8.0 –

A N N U A L F I N A N C I A L R E P O R T 2 0 1 6 7 3
E7. Financial risk management (continued)(b) Market risk - fuel price riskFuel price risk arises on the Group’s exposure to jet fuel prices.
Fuel price risk managementThe Group’s fuel price risk management strategy aims to provide the airline with protection against sudden and significant increases in fuel prices while ensuring that the airline is not competitively disadvantaged in the event of a substantial decrease in the price of fuel.
The Group’s risk management policy is to hedge anticipated jet fuel consumption subject to limits determined by the Board. This exposure is managed by using Singapore kerosene and Brent crude commodity swaps, option contracts and other fuel related derivatives. These contracts are designated as hedges of price risk on specific volumes of future jet fuel consumption. The Group considers Brent crude to be a separately identifiable and measurable component of Singapore kerosene. The price of Brent crude is highly correlated with the price of Singapore kerosene. The Group primarily operates in a geographical area in which jet fuel is priced in reference to Singapore kerosene as opposed to other jet fuels (i.e. MOPAG, LA PIPE).
Ineffectiveness on fuel derivatives can arise from timing differences on the notional amount between the hedged instrument and hedged item, or changes in market dynamics which may cause the Group to reassess the component inputs into jet fuel. At 30 June 2016, the Group has no ineffectiveness (2015: no ineffectiveness) on derivative positions.
Realised gains or losses on fuel hedging contracts arises due to differences between the actual fuel prices on settlement, the forward rates of derivative contracts and the cost of option premiums paid.
2016 $m
2015 $m
Fuel hedging losses recognised in profit or loss
Realised losses recognised in fuel and oil expense (183.6) (106.7)
Unrealised losses, change in option time value and realised option premium recognised in ineffective cash flow hedges and non-designated derivatives losses (25.4) (22.8)
Net loss from fuel hedging recognised in profit or loss (209.0) (129.5)
The following table sets out the timing of the notional amount and the hedged price range (minimum and maximum strike/contract rates) of the Group’s fuel hedging instruments.
Hedged price $/bbl
Notional amount
bbl/m
Less than 1 year
bbl/m1 to 5 years
bbl/m
AUD fuel costs
2016 55-100 12.5 9.1 3.4
2015 70-132 9.3 8.2 1.1
Sensitivity to fuel priceThe following table summarises the sensitivity of the Group’s financial assets and liabilities to a reasonably possible change in fuel prices. An AUD 30 (2015: AUD 30) per barrel (bbl) increase or decrease in the price of fuel (with no change in refining margin) would have increased/(decreased) equity and the profit or loss (before tax) by the amounts shown below. This assumes all other variables remain constant and is based on the designated hedge relationship at the reporting dates.
AUD 30/bbl increase AUD 30/bbl decrease
Carrying amount
$mProfit or loss
$mEquity
$mProfit or loss
$mEquity
$m
2016
Net derivative financial asset 35.1 – 309.9 – (243.4)
2015
Net derivative financial liability (31.9) (0.7) 140.0 – (126.9)

V I R G I N A U S T R A L I A G R O U P7 4
Notes to the consolidated financial statements (continued)For the year ended 30 June 2016
E7. Financial risk management (continued)(c) Market risk - foreign exchange riskForeign exchange risk is the risk that the fair value or future cash flows of a financial instrument will fluctuate because of changes in foreign currency rates. The Group undertakes transactions in US dollars, including the cost of purchasing fuel, aircraft, aircraft lease payments, the sale of airline passenger tickets and the repayment of USD debt. The Group also undertakes transactions in New Zealand dollars. The following significant exchange rates applied during the year:
Average rate Reporting date spot rate
AUD 2016 2015 2016 2015
USD 0.7307 0.8501 0.7446 0.7652
NZD 1.0949 1.0731 1.0443 1.1222
Exposure to foreign exchange riskThe Group’s exposure to foreign exchange risk at the reporting date was as follows, based on notional amounts (presented in AUD):
2016 2015
AUD $m
USD $m
NZD $m
AUD $m
USD $m
NZD $m
Cash and cash equivalents 0.8 456.1 15.2 2.6 453.9 12.9
Receivables – 40.9 1.9 – 53.8 2.2
Other financial assets – 122.9 0.1 – 131.6 –
Payables (4.0) (147.9) (15.1) (5.4) (120.9) (17.7)
Interest-bearing liabilities – (537.2) – – (392.1) –
Gross statement of financial position exposure (3.2) (65.2) 2.1 (2.8) 126.3 (2.6)
Foreign exchange risk managementIn order to protect against exchange rate movements, the Group uses forward exchange contracts and option contracts to purchase US dollars to hedge highly probable forecasted purchases for the ensuing financial periods. The contracts are timed to mature when the operating expenses or capital expenditure are expected to be settled. Realised gains or losses on these contracts arise due to differences between the actual spot rates on settlement, the forward rates of the derivative contracts and the cost of option premiums paid.
Ineffectiveness on foreign exchange derivatives can arise from timing differences on the notional amount between the hedged instrument and hedged item. At 30 June 2016, the Group has no ineffectiveness (2015: no ineffectiveness) on derivative positions.
2016 $m
2015 $m
Foreign exchange hedging gains/(losses) recognised in profit or loss
Realised gains recognised in aircraft operating lease expenses 52.8 61.3
Unrealised losses, including those relating to non-designated derivatives, change in option time value and realised option premium recognised in ineffective cash flow hedges and non-designated derivatives losses (2.4) (4.6)
Net gain from foreign exchange hedging recognised in profit or loss 50.4 56.7
The following table sets out the timing of the notional amount and the hedged rate range (minimum and maximum strike/contract rates) of the Group’s foreign exchange hedging instruments.
Hedged rate AUD/USD
Notional amount
$m
Less than 1 year
$m1 to 5 years
$m
USD operating and capital costs
2016 0.68-0.79 1,567.3 1,180.0 387.3
2015 0.75-0.91 529.7 412.9 116.8

A N N U A L F I N A N C I A L R E P O R T 2 0 1 6 7 5
E7. Financial risk management (continued)(c) Market risk - foreign exchange risk (continued)
Sensitivity to foreign exchange ratesThe following table summarises the sensitivity of the Group’s foreign currency denominated financial assets and liabilities to a reasonably possible change in the exchange rate to the US dollar. This includes monetary assets and liabilities denominated in a foreign currency which are held by controlled entities with a US dollar functional currency for which changes in exchange rates are recognised within the foreign currency translation reserve. A 10% (2015: 10%) appreciation or depreciation of the AUD against the USD would have increased/(decreased) equity and profit or loss (before tax) by the amounts shown below. This assumes all other variables remain constant.
10% appreciation in AUD 10% depreciation in AUD
Carrying amount $m
Profit or loss $m
Equity $m
Profit or loss $m
Equity $m
2016
Non-derivative financial assets 790.8 (56.4) (15.5) 68.9 19.0
Net derivative financial liability (2.2) (31.8) (134.3) 38.8 167.0
Non-derivative financial liabilities (2,256.1) 62.3 142.8 (76.1) (174.6)
(25.9) (7.0) 31.6 11.4
2015
Non-derivative financial assets 801.5 (58.1) (14.7) 71.0 18.0
Net derivative financial asset 36.9 – (54.6) – 67.1
Non-derivative financial liabilities (2,329.8) 46.6 165.2 (57.0) (201.9)
(11.5) 95.9 14.0 (116.8)
(d) Market risk - interest rate riskInterest rate risk is the risk that the fair value or future cash flows of a financial instrument will fluctuate because of changes in market interest rates. The Group’s interest rate risk arises from cash and cash equivalents and interest-bearing liabilities. The carrying value of these financial instruments is set out in the table below. Borrowings issued at variable rates expose the Group to cash flow interest rate risk. Borrowings issued at fixed rates expose the Group to fair value interest rate risk.
Interest rate risk managementThe Group manages its cash flow interest rate risk by entering into fixed and floating rate debt and leasing arrangements. The residual exposure to variable interest rates is managed by holding floating rate assets to create a natural hedge and may include entering into floating-to-fixed interest rate swaps to hedge part of this exposure. The Group accounts for variable rate financial assets and financial liabilities at amortised cost using the effective interest rate method. There were no gains or losses on interest rate hedging activities for the Group during the current or prior year.
Exposure to interest rate risk and sensitivity to interest ratesThe fixed and variable components of the Group’s cash and cash equivalents and interest-bearing liabilities are set out in the table below. Non-interest-bearing amounts are not included in the table. The impact on profit or loss (before tax) of a 100 basis point increase or decrease in interest rates, assuming all other variables remain constant, is also set out below. There are no impacts on equity.
Interest rate profile Profit or loss sensitivity
Carrying amount
$m
Fixed rate instruments
$m
Variable rate instruments
$m
100 bp increase
$m
100 bp decrease
$m
2016
Cash and cash equivalents 1,123.8 523.9 574.3 5.7 (5.7)
Interest-bearing liabilities (3,000.0) (1,780.2) (1,219.8) (12.2) 12.2
(1,876.2) (1,256.3) (645.5) (6.5) 6.5
2015
Cash and cash equivalents 1,028.5 574.9 442.0 4.4 (4.4)
Interest-bearing liabilities (2,762.2) (1,849.4) (912.8) (9.1) 9.1
(1,733.7) (1,274.5) (470.8) (4.7) 4.7

V I R G I N A U S T R A L I A G R O U P7 6
Notes to the consolidated financial statements (continued)For the year ended 30 June 2016
E7. Financial risk management (continued)(e) Credit riskCredit risk is the risk of financial loss to the Group if a customer or counterparty to a financial asset fails to meet its contractual obligations. Financial assets include cash and cash equivalents, receivables, derivative financial instruments and other financial assets.
Cash and cash equivalents, derivative financial instruments and other financial assetsExposure to credit risk in relation to cash and cash equivalents, derivative financial instruments and other financial assets arises principally from financial institution and aircraft lessor counterparties. The Group limits its exposure to credit risk by only investing in liquid securities with counterparties and entering into derivative contracts with counterparties that have an investment grade rating. The Group also limits exposure by transacting with multiple aircraft lessors in various countries.
ReceivablesExposure to credit risk in relation to receivables arises principally from trade debtor and other counterparties (travel agents, industry settlement organisations and credit provided direct to customers).
The Group’s exposure to credit risk is influenced mainly by the individual characteristics of each customer or counterparty and is assessed based on trading performance of the counterparty. The Group has credit policies in place under which each new trade debtor is analysed individually for creditworthiness before the Group’s standard payment terms are offered. Purchase limits are established for each counterparty and reviewed on a regular basis to ensure that sales made on credit terms are made to counterparties with an appropriate credit history. The Group continuously monitors counterparty credit limits on defaults, incorporating this information into credit risk controls.
The demographics of the Group’s customer base, including default risk of the industry, have less of an influence on credit risk. A significant proportion of the Group’s revenue is received through credit cards, however there are no significant concentrations of credit risk.
Of the trade receivables as at 30 June 2016, deemed neither past due nor impaired, there are no customers who represent more than 5% (2015: 5%) of the total balance of trade receivables. The average credit period on revenue is 17 days (2015: 19 days). Upon default, the credit of customers immediately ceases. A provision for doubtful receivables account in respect of trade receivables is used to record impairment losses related to specific receivables that are considered doubtful. If the Group is satisfied that no recovery of the amount owing is possible the amount is written off against the financial asset directly. An ageing analysis of receivables is included in the table below:
Gross 2016
$m
Impairment 2016
$m
Gross 2015
$m
Impairment 2015
$m
Not past due 219.0 – 218.9 –
Past due 1-30 days 5.4 – 7.2 –
Past due 31-60 days 2.4 – 2.3 –
61+ days 6.8 (1.9) 5.0 (0.8)
233.6 (1.9) 233.4 (0.8)
Exposure to credit riskThe Group’s maximum exposure to credit risk at the reporting date equates to the carrying amount of its financial assets and is set out in the table below.
Carrying amount
Note2016
$m2015
$m
Cash and cash equivalents E2 1,123.8 1,028.5
Receivables C1 231.7 232.6
Derivative financial instruments 49.5 50.5
Other financial assets C3 297.2 295.0
1,702.2 1,606.6

A N N U A L F I N A N C I A L R E P O R T 2 0 1 6 7 7
E7. Financial risk management (continued)(f) Liquidity riskLiquidity risk is the risk that the Group will not be able to meet its financial obligations as they fall due.
Exposure to liquidity riskThe following summarises the periods in which the cash flows associated with derivatives are expected to occur, as well as the contractual maturities of financial liabilities, including estimated interest payments and the impact of netting agreements. The carrying amount of derivative financial instruments that are cash flow hedges is based on the valuation at reporting date and therefore the settled gain or loss may be more or less than this amount. The net inflows/(outflows) relating to derivatives that are net cash settled represent the contractual undiscounted cash flows relating to derivatives held for risk management purposes as at 30 June. Derivative financial instruments may be closed out prior to their contracted maturity date in accordance with the Group’s hedging policy. The cash flows relating to derivatives are expected to impact profit or loss in the same periods in which the cash flows are expected to occur.
The interest-bearing liabilities are denominated in AUD and USD (refer to note E3) and the contractual cash flows noted in the table below may differ as a result of the foreign exchange rate that applies at the date the USD denominated instrument is settled. Any breach in financial covenants relating to financing arrangements may result in a requirement for the Group to repay the relevant loans earlier than indicated by the contractual cash flows. At reporting date, the Group was in compliance with all of its covenants.
It is not expected that the cash flows below could occur significantly earlier or at significantly different amounts.
Carrying amount
$m
Contractual cash flows
$m
Less than 1 year
$m1-5 years
$m
More than 5 years
$m
2016
Derivative financial assets 49.5 49.5 26.3 23.2 –
Derivative financial liabilities (41.4) (41.4) (33.4) (8.0) –
Non-derivative financial liabilities
Secured loans (1,986.1) (2,300.8) (497.7) (1,469.5) (333.6)
Unsecured loans and bonds (986.7) (1,101.8) (450.4) (651.4) –
Finance lease liabilities (27.2) (82.0) (4.9) (12.2) (64.9)
Payables (718.2) (718.2) (708.9) (6.0) (3.3)
(3,710.1) (4,194.7) (1,669.0) (2,123.9) (401.8)
2015
Derivative financial assets 50.5 50.5 43.6 6.9 –
Derivative financial liabilities (45.6) (45.6) (45.6) – –
Non-derivative financial liabilities
Secured loans (2,314.9) (2,734.7) (442.9) (1,778.0) (513.8)
Unsecured loans and bonds (419.0) (577.4) (68.7) (508.7) –
Finance lease liabilities (28.3) (86.3) (4.7) (14.5) (67.1)
Payables (707.8) (707.8) (701.5) (4.0) (2.3)
(3,465.1) (4,101.3) (1,219.8) (2,298.3) (583.2)
The Group also has contractual commitments for the acquisition of property, plant and equipment and intangible assets, which are detailed in note G1.
Liquidity risk management The Group aims to ensure that it has sufficient cash on demand to meet expected operational expenses and contractual commitments, including the servicing of financial obligations. This excludes the potential impact of extreme circumstances that cannot be predicted, such as natural disasters. Due to the dynamic nature of the underlying businesses, Group Treasury aims at maintaining flexibility in funding by keeping adequate liquidity available. The Group also maintains various lines of credit, which are detailed in note E3. The Group’s capital management policies are detailed in note E1.

V I R G I N A U S T R A L I A G R O U P7 8
Notes to the consolidated financial statements (continued)For the year ended 30 June 2016
E8. Fair value measurementsFinancial assets and liabilities are measured at either fair value or amortised cost. Fair value is the price that would be received to sell an asset or paid to transfer a liability in an orderly transaction between market participants at the measurement date. All assets and liabilities for which fair value is measured or disclosed in the consolidated financial statements are categorised within the following fair value hierarchy:
– Level 1 - Quoted prices in active markets for identical assets or liabilities – Level 2 - Inputs other than quoted prices that are directly or indirectly observable – Level 3 - Inputs are not observable based on market data
There have been no transfers between levels of the fair value hierarchy during the financial year.
The determination of fair values requires the use of estimates and judgements. The different valuation methods used by the Group to measure fair value include:
Derivative financial instrumentsThe fair value of financial instruments traded in active markets (such as publicly traded derivatives) is based on Level 1 inputs at each reporting date. The fair value of financial instruments that are not traded in an active market (for example, over-the-counter derivatives) is based on Level 2 inputs. These financial instruments relate to forward foreign exchange and fuel hedging contracts and are principally with counterparties with investment grade credit ratings. The fair value of these instruments is determined using estimated discounted cash flows based on forward exchange market rates and fuel prices at the reporting date.
Interest-bearing liabilitiesThe fair value of the Enhanced Equipment Notes facility is measured based on Level 1 inputs. The fair value of the remaining interest-bearing liabilities are determined based on Level 2 inputs by discounting the remaining contractual cash flows at the relevant credit adjusted market interest rates at the reporting date.
Other financial assets and liabilities carried at amortised costThe fair value of cash and cash equivalents, receivables and payables approximate their carrying amounts largely due to the short term nature of these instruments. The fair value of other financial assets and variable rate liabilities that are not recognised net of transaction costs approximate their carrying amounts.
(a) Estimated fair values
Note
Carrying amount
$mFair value
$m
Quoted market price
(Level 1) $m
Observable inputs
(Level 2) $m
2016
Financial assets carried at fair value
Derivative financial instruments 49.5 49.5 – 49.5
Financial liabilities carried at fair value
Derivative financial instruments 41.4 41.4 – 41.4
Financial liabilities carried at amortised cost
Aeronautic finance facilities - secured E3 1,709.1 1,793.4 677.5 1,115.9
Unsecured facilities E3 952.7 981.1 – 981.1
Secured syndicate facility E3 216.0 225.0 – 225.0
Finance lease liabilities E3 27.2 27.2 – 27.2
2015
Financial assets carried at fair value
Derivative financial instruments 50.5 50.5 – 50.5
Financial liabilities carried at fair value
Derivative financial instruments 45.6 45.6 – 45.6
Financial liabilities carried at amortised cost
Aeronautic finance facilities - secured E3 2,077.1 2,166.6 850.8 1,315.8
Unsecured facilities E3 385.0 407.1 – 407.1
Secured syndicate facility E3 213.7 225.0 – 225.0
Finance lease liabilities E3 28.3 28.3 – 28.3

A N N U A L F I N A N C I A L R E P O R T 2 0 1 6 7 9
E9. Offsetting financial assets and liabilitiesThe Group enters into contractual arrangements such as the International Air Transport Association (IATA) and International Swaps and Derivatives Association (ISDA) Master Agreements where, upon the occurrence of a credit event (such as default), a termination value is calculated and only a single net amount is payable in settlement of all transactions that are capable of offset under the contractual terms.
Balances relating to the Group’s IATA agreements do not meet the criteria for offsetting in the consolidated statement of financial position. This is because the Group does not have any currently legally enforceable right to offset recognised amounts, as the right to offset is enforceable only on the occurrence of a credit event.
Offsetting is applied to derivatives balances in the consolidated statement of financial position where the Group has a legally enforceable right to set off and there is an intention to settle on a net basis.
The following table sets out the carrying amounts of recognised financial assets and liabilities that are subject to the above agreements.
2016 Note
Gross financial
assets and liabilities
recognised $m
Amounts offset
$m
Net amounts presented(1)
$m
Amounts not offset
$mNet amount
$m
Financial assets
Cash and cash equivalents E2 201.3 – 201.3 (37.7) 163.6
Receivables C1 13.6 – 13.6 (13.6) –
Derivative financial assets 65.1 (15.6) 49.5 (29.2) 20.3
280.0 (15.6) 264.4 (80.5) 183.9
Financial liabilities
Payables C5 (18.3) – (18.3) 14.2 (4.1)
Derivative financial liabilities (57.0) 15.6 (41.4) 32.3 (9.1)
Interest-bearing liabilities E3 (34.0) – (34.0) 34.0 –
(109.3) 15.6 (93.7) 80.5 (13.2)
2015 Note
Gross financial
assets and liabilities
recognised $m
Amounts offset
$m
Net amounts presented(1)
$m
Amounts not offset
$mNet amount
$m
Financial assets
Cash and cash equivalents E2 380.1 – 380.1 (47.3) 332.8
Receivables C1 22.2 – 22.2 (18.7) 3.5
Derivative financial assets 78.8 (28.3) 50.5 (27.1) 23.4
481.1 (28.3) 452.8 (93.1) 359.7
Financial liabilities
Payables C5 (34.3) – (34.3) 27.7 (6.6)
Derivative financial liabilities (73.9) 28.3 (45.6) 31.4 (14.2)
Interest-bearing liabilities E3 (34.0) – (34.0) 34.0 –
(142.2) 28.3 (113.9) 93.1 (20.8)
(1) Balances may not equate to the corresponding line item presented on the face of the consolidated statement of financial position or in the supporting notes. The
difference relates to financial assets and financial liabilities that are not subject to master netting arrangements and is therefore not in scope for offsetting disclosures.
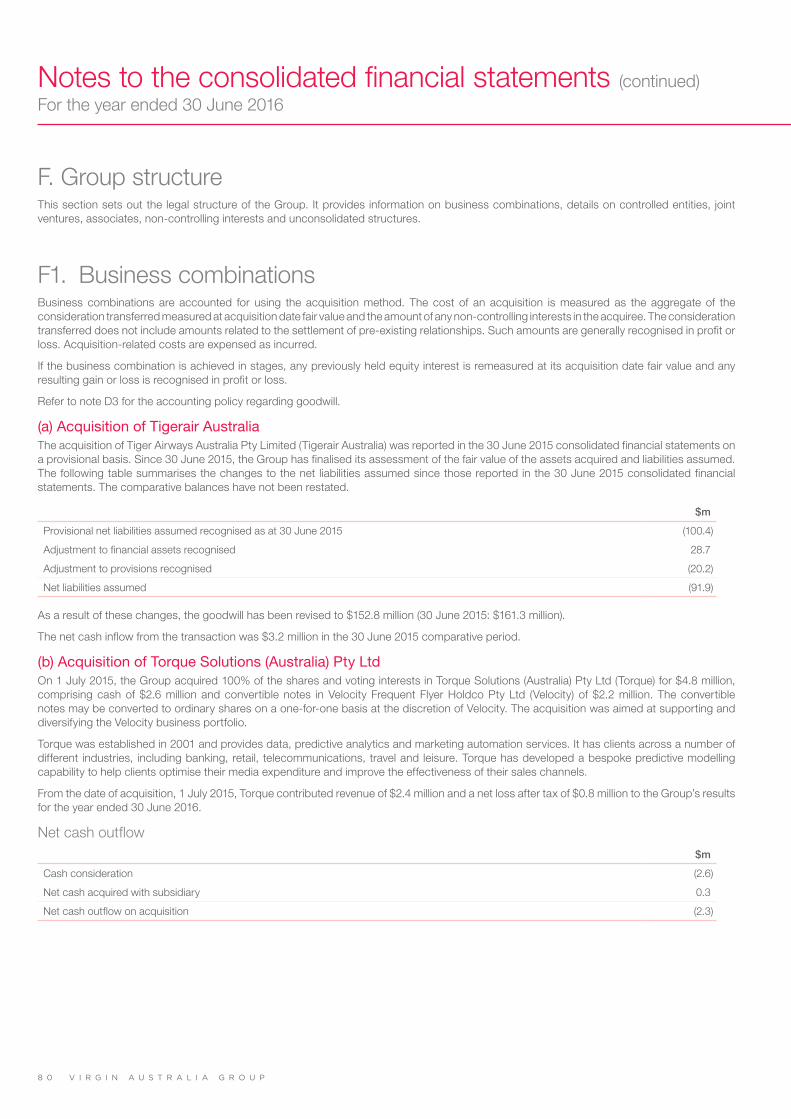
V I R G I N A U S T R A L I A G R O U P8 0
Notes to the consolidated financial statements (continued)For the year ended 30 June 2016
F. Group structureThis section sets out the legal structure of the Group. It provides information on business combinations, details on controlled entities, joint ventures, associates, non-controlling interests and unconsolidated structures.
F1. Business combinationsBusiness combinations are accounted for using the acquisition method. The cost of an acquisition is measured as the aggregate of the consideration transferred measured at acquisition date fair value and the amount of any non-controlling interests in the acquiree. The consideration transferred does not include amounts related to the settlement of pre-existing relationships. Such amounts are generally recognised in profit or loss. Acquisition-related costs are expensed as incurred.
If the business combination is achieved in stages, any previously held equity interest is remeasured at its acquisition date fair value and any resulting gain or loss is recognised in profit or loss.
Refer to note D3 for the accounting policy regarding goodwill.
(a) Acquisition of Tigerair AustraliaThe acquisition of Tiger Airways Australia Pty Limited (Tigerair Australia) was reported in the 30 June 2015 consolidated financial statements on a provisional basis. Since 30 June 2015, the Group has finalised its assessment of the fair value of the assets acquired and liabilities assumed. The following table summarises the changes to the net liabilities assumed since those reported in the 30 June 2015 consolidated financial statements. The comparative balances have not been restated.
$m
Provisional net liabilities assumed recognised as at 30 June 2015 (100.4)
Adjustment to financial assets recognised 28.7
Adjustment to provisions recognised (20.2)
Net liabilities assumed (91.9)
As a result of these changes, the goodwill has been revised to $152.8 million (30 June 2015: $161.3 million).
The net cash inflow from the transaction was $3.2 million in the 30 June 2015 comparative period.
(b) Acquisition of Torque Solutions (Australia) Pty LtdOn 1 July 2015, the Group acquired 100% of the shares and voting interests in Torque Solutions (Australia) Pty Ltd (Torque) for $4.8 million, comprising cash of $2.6 million and convertible notes in Velocity Frequent Flyer Holdco Pty Ltd (Velocity) of $2.2 million. The convertible notes may be converted to ordinary shares on a one-for-one basis at the discretion of Velocity. The acquisition was aimed at supporting and diversifying the Velocity business portfolio.
Torque was established in 2001 and provides data, predictive analytics and marketing automation services. It has clients across a number of different industries, including banking, retail, telecommunications, travel and leisure. Torque has developed a bespoke predictive modelling capability to help clients optimise their media expenditure and improve the effectiveness of their sales channels.
From the date of acquisition, 1 July 2015, Torque contributed revenue of $2.4 million and a net loss after tax of $0.8 million to the Group’s results for the year ended 30 June 2016.
Net cash outflow$m
Cash consideration (2.6)
Net cash acquired with subsidiary 0.3
Net cash outflow on acquisition (2.3)

A N N U A L F I N A N C I A L R E P O R T 2 0 1 6 8 1
F1. Business combinations (continued)(b) Acquisition of Torque Solutions (Australia) Pty Ltd (continued)
Identifiable assets acquired and liabilities assumedThe following table summarises the assets acquired and liabilities assumed at the acquisition date.
$m
Current assets
Cash and cash equivalents 0.3
Receivables 0.5
Total current assets 0.8
Non-current assets
Deferred tax assets 0.1
Property, plant and equipment 0.1
Intangible assets 1.5
Total non-current assets 1.7
Total assets 2.5
Current liabilities
Payables 0.4
Provisions 0.2
Unearned revenue 0.2
Other 0.3
Total current liabilities 1.1
Non-current liabilities
Provisions 0.1
Total non-current liabilities 0.1
Total liabilities 1.2
Net assets 1.3
Receivables comprise gross contractual amounts of $0.5 million, all of which were expected to be collected at acquisition date.
No contingent liabilities were recognised as part of the acquisition. No contingent liabilities were identified which could not be measured reliably.
GoodwillGoodwill arising from the acquisition has been recognised as follows:
$m
Consideration transferred 4.8
Fair value of identifiable net assets 1.3
Goodwill 3.5
The goodwill is attributable to synergies that resulted from the transaction, including reductions in administrative costs and leveraging the advice provided by Velocity external consultants and advisors. These benefits are not recognised separately from goodwill because they do not meet the recognition criteria for identifiable intangible assets. The goodwill will not be deductible for tax purposes.
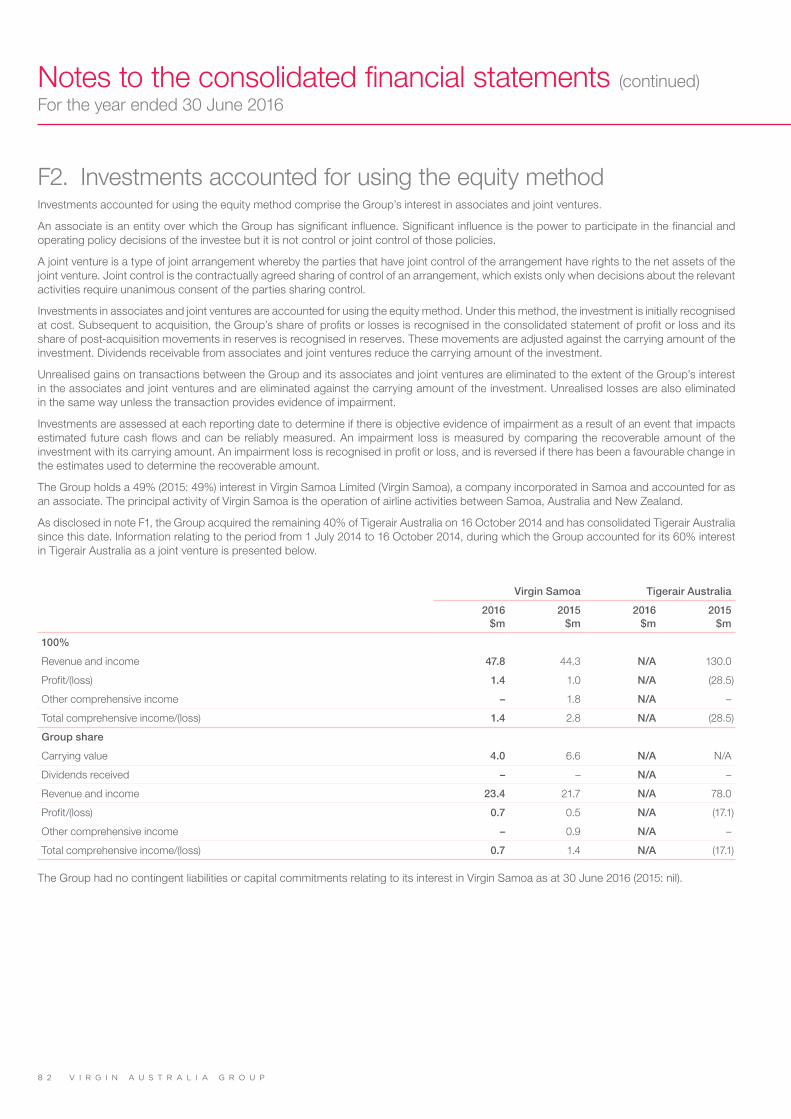
V I R G I N A U S T R A L I A G R O U P8 2
Notes to the consolidated financial statements (continued)For the year ended 30 June 2016
F2. Investments accounted for using the equity methodInvestments accounted for using the equity method comprise the Group’s interest in associates and joint ventures.
An associate is an entity over which the Group has significant influence. Significant influence is the power to participate in the financial and operating policy decisions of the investee but it is not control or joint control of those policies.
A joint venture is a type of joint arrangement whereby the parties that have joint control of the arrangement have rights to the net assets of the joint venture. Joint control is the contractually agreed sharing of control of an arrangement, which exists only when decisions about the relevant activities require unanimous consent of the parties sharing control.
Investments in associates and joint ventures are accounted for using the equity method. Under this method, the investment is initially recognised at cost. Subsequent to acquisition, the Group’s share of profits or losses is recognised in the consolidated statement of profit or loss and its share of post-acquisition movements in reserves is recognised in reserves. These movements are adjusted against the carrying amount of the investment. Dividends receivable from associates and joint ventures reduce the carrying amount of the investment.
Unrealised gains on transactions between the Group and its associates and joint ventures are eliminated to the extent of the Group’s interest in the associates and joint ventures and are eliminated against the carrying amount of the investment. Unrealised losses are also eliminated in the same way unless the transaction provides evidence of impairment.
Investments are assessed at each reporting date to determine if there is objective evidence of impairment as a result of an event that impacts estimated future cash flows and can be reliably measured. An impairment loss is measured by comparing the recoverable amount of the investment with its carrying amount. An impairment loss is recognised in profit or loss, and is reversed if there has been a favourable change in the estimates used to determine the recoverable amount.
The Group holds a 49% (2015: 49%) interest in Virgin Samoa Limited (Virgin Samoa), a company incorporated in Samoa and accounted for as an associate. The principal activity of Virgin Samoa is the operation of airline activities between Samoa, Australia and New Zealand.
As disclosed in note F1, the Group acquired the remaining 40% of Tigerair Australia on 16 October 2014 and has consolidated Tigerair Australia since this date. Information relating to the period from 1 July 2014 to 16 October 2014, during which the Group accounted for its 60% interest in Tigerair Australia as a joint venture is presented below.
Virgin Samoa Tigerair Australia
2016 $m
2015 $m
2016 $m
2015 $m
100%
Revenue and income 47.8 44.3 N/A 130.0
Profit/(loss) 1.4 1.0 N/A (28.5)
Other comprehensive income – 1.8 N/A –
Total comprehensive income/(loss) 1.4 2.8 N/A (28.5)
Group share
Carrying value 4.0 6.6 N/A N/A
Dividends received – – N/A –
Revenue and income 23.4 21.7 N/A 78.0
Profit/(loss) 0.7 0.5 N/A (17.1)
Other comprehensive income – 0.9 N/A –
Total comprehensive income/(loss) 0.7 1.4 N/A (17.1)
The Group had no contingent liabilities or capital commitments relating to its interest in Virgin Samoa as at 30 June 2016 (2015: nil).
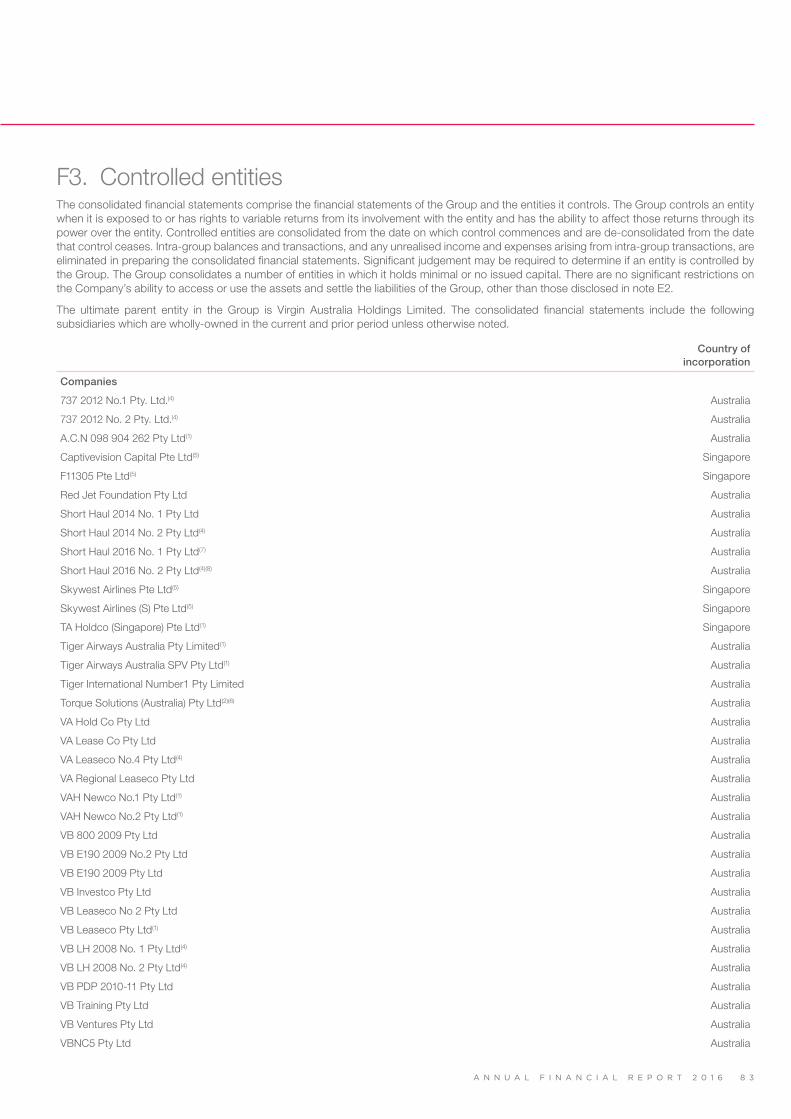
A N N U A L F I N A N C I A L R E P O R T 2 0 1 6 8 3
F3. Controlled entitiesThe consolidated financial statements comprise the financial statements of the Group and the entities it controls. The Group controls an entity when it is exposed to or has rights to variable returns from its involvement with the entity and has the ability to affect those returns through its power over the entity. Controlled entities are consolidated from the date on which control commences and are de-consolidated from the date that control ceases. Intra-group balances and transactions, and any unrealised income and expenses arising from intra-group transactions, are eliminated in preparing the consolidated financial statements. Significant judgement may be required to determine if an entity is controlled by the Group. The Group consolidates a number of entities in which it holds minimal or no issued capital. There are no significant restrictions on the Company’s ability to access or use the assets and settle the liabilities of the Group, other than those disclosed in note E2.
The ultimate parent entity in the Group is Virgin Australia Holdings Limited. The consolidated financial statements include the following subsidiaries which are wholly-owned in the current and prior period unless otherwise noted.
Country of incorporation
Companies
737 2012 No.1 Pty. Ltd.(4) Australia
737 2012 No. 2 Pty. Ltd.(4) Australia
A.C.N 098 904 262 Pty Ltd(1) Australia
Captivevision Capital Pte Ltd(5) Singapore
F11305 Pte Ltd(5) Singapore
Red Jet Foundation Pty Ltd Australia
Short Haul 2014 No. 1 Pty Ltd Australia
Short Haul 2014 No. 2 Pty Ltd(4) Australia
Short Haul 2016 No. 1 Pty Ltd(7) Australia
Short Haul 2016 No. 2 Pty Ltd(4)(8) Australia
Skywest Airlines Pte Ltd(5) Singapore
Skywest Airlines (S) Pte Ltd(5) Singapore
TA Holdco (Singapore) Pte Ltd(1) Singapore
Tiger Airways Australia Pty Limited(1) Australia
Tiger Airways Australia SPV Pty Ltd(1) Australia
Tiger International Number1 Pty Limited Australia
Torque Solutions (Australia) Pty Ltd(2)(6) Australia
VA Hold Co Pty Ltd Australia
VA Lease Co Pty Ltd Australia
VA Leaseco No.4 Pty Ltd(4) Australia
VA Regional Leaseco Pty Ltd Australia
VAH Newco No.1 Pty Ltd(1) Australia
VAH Newco No.2 Pty Ltd(1) Australia
VB 800 2009 Pty Ltd Australia
VB E190 2009 No.2 Pty Ltd Australia
VB E190 2009 Pty Ltd Australia
VB Investco Pty Ltd Australia
VB Leaseco No 2 Pty Ltd Australia
VB Leaseco Pty Ltd(1) Australia
VB LH 2008 No. 1 Pty Ltd(4) Australia
VB LH 2008 No. 2 Pty Ltd(4) Australia
VB PDP 2010-11 Pty Ltd Australia
VB Training Pty Ltd Australia
VB Ventures Pty Ltd Australia
VBNC5 Pty Ltd Australia
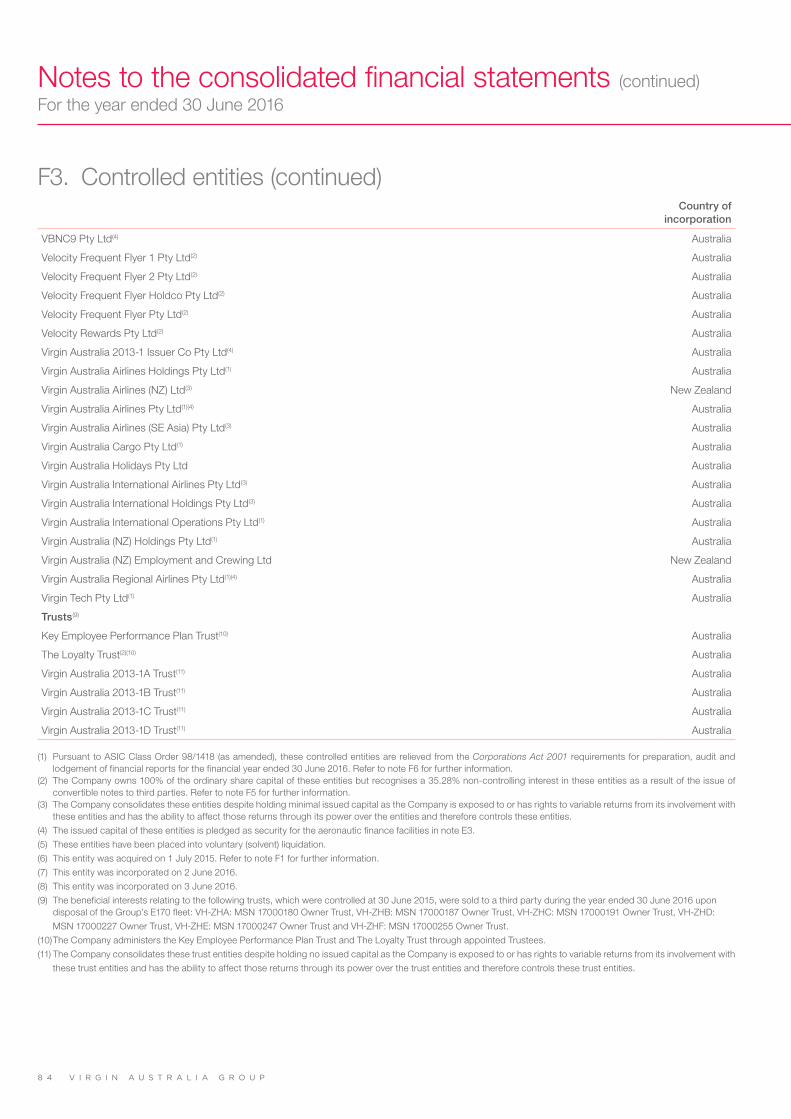
V I R G I N A U S T R A L I A G R O U P8 4
Notes to the consolidated financial statements (continued)For the year ended 30 June 2016
Country of incorporation
VBNC9 Pty Ltd(4) Australia
Velocity Frequent Flyer 1 Pty Ltd(2) Australia
Velocity Frequent Flyer 2 Pty Ltd(2) Australia
Velocity Frequent Flyer Holdco Pty Ltd(2) Australia
Velocity Frequent Flyer Pty Ltd(2) Australia
Velocity Rewards Pty Ltd(2) Australia
Virgin Australia 2013-1 Issuer Co Pty Ltd (4) Australia
Virgin Australia Airlines Holdings Pty Ltd(1) Australia
Virgin Australia Airlines (NZ) Ltd(3) New Zealand
Virgin Australia Airlines Pty Ltd(1)(4) Australia
Virgin Australia Airlines (SE Asia) Pty Ltd(3) Australia
Virgin Australia Cargo Pty Ltd(1) Australia
Virgin Australia Holidays Pty Ltd Australia
Virgin Australia International Airlines Pty Ltd(3) Australia
Virgin Australia International Holdings Pty Ltd(3) Australia
Virgin Australia International Operations Pty Ltd(1) Australia
Virgin Australia (NZ) Holdings Pty Ltd(1) Australia
Virgin Australia (NZ) Employment and Crewing Ltd New Zealand
Virgin Australia Regional Airlines Pty Ltd(1)(4) Australia
Virgin Tech Pty Ltd(1) Australia
Trusts(9)
Key Employee Performance Plan Trust(10) Australia
The Loyalty Trust(2)(10) Australia
Virgin Australia 2013-1A Trust(11) Australia
Virgin Australia 2013-1B Trust(11) Australia
Virgin Australia 2013-1C Trust(11) Australia
Virgin Australia 2013-1D Trust(11) Australia
(1) Pursuant to ASIC Class Order 98/1418 (as amended), these controlled entities are relieved from the Corporations Act 2001 requirements for preparation, audit and lodgement of financial reports for the financial year ended 30 June 2016. Refer to note F6 for further information.
(2) The Company owns 100% of the ordinary share capital of these entities but recognises a 35.28% non-controlling interest in these entities as a result of the issue of convertible notes to third parties. Refer to note F5 for further information.
(3) The Company consolidates these entities despite holding minimal issued capital as the Company is exposed to or has rights to variable returns from its involvement with these entities and has the ability to affect those returns through its power over the entities and therefore controls these entities.
(4) The issued capital of these entities is pledged as security for the aeronautic finance facilities in note E3.
(5) These entities have been placed into voluntary (solvent) liquidation.
(6) This entity was acquired on 1 July 2015. Refer to note F1 for further information.
(7) This entity was incorporated on 2 June 2016.
(8) This entity was incorporated on 3 June 2016.
(9) The beneficial interests relating to the following trusts, which were controlled at 30 June 2015, were sold to a third party during the year ended 30 June 2016 upon disposal of the Group’s E170 fleet: VH-ZHA: MSN 17000180 Owner Trust, VH-ZHB: MSN 17000187 Owner Trust, VH-ZHC: MSN 17000191 Owner Trust, VH-ZHD:
MSN 17000227 Owner Trust, VH-ZHE: MSN 17000247 Owner Trust and VH-ZHF: MSN 17000255 Owner Trust.
(10) The Company administers the Key Employee Performance Plan Trust and The Loyalty Trust through appointed Trustees.
(11) The Company consolidates these trust entities despite holding no issued capital as the Company is exposed to or has rights to variable returns from its involvement with
these trust entities and has the ability to affect those returns through its power over the trust entities and therefore controls these trust entities.
F3. Controlled entities (continued)

A N N U A L F I N A N C I A L R E P O R T 2 0 1 6 8 5
F4. Investments in unconsolidated structured entitiesThe Group has established Special Purpose Entities (SPEs) for certain asset-backed financing arrangements relating to the purchase of aircraft. The Group does not have any direct or indirect shareholding in these SPEs and does not control these entities in accordance with the definition of control set out in note F3. Therefore, the Group does not consolidate these entities. The Group sponsors these entities on the basis that it is a majority user of these entities. On aircraft delivery, the arrangements are such that the Group takes title to the aircraft. During the year, the Group did not provide financial support to the SPE and has no intention of providing financial or other support. The Group does meet the administrative expenses of the SPE.
In 2013, one of the Group’s subsidiaries, VA Leaseco No.4 Pty Ltd (VA Leaseco No.4) formed a relationship with one such SPE. In October 2015, the final obligations relating to this SPE were met, resulting in the formal cessation of that SPE’s relationship with the Group in December 2015.
Concurrently, VA Leaseco No.4 established a similar relationship with a new SPE during the current financial year. This relationship is expected to remain in place for a number of years.
F5. Non-controlling interestsProfit or loss and each component of other comprehensive income are attributed to equity holders of the Group and to non-controlling interests, even if this results in the non-controlling interests having a deficit balance. Changes in the Group’s interest in a subsidiary that do not result in a loss of control are accounted for as equity transactions.
On 22 October 2014, the Group announced the execution of documents for the sale of a 35% interest in the Velocity Frequent Flyer Group (VFF Group) to Affinity Equity Partners (Affinity) for total consideration of $336.0 million, by way of the VFF Group issuing convertible notes to Affinity. On 1 July 2015, the VFF Group issued convertible notes as partial consideration for the Group’s acquisition of Torque Solutions (Australia) Pty Ltd (refer note F1) which increased the ownership interest of non-controlling interests to 35.19%. During the current year the VFF Group issued convertible notes as part of a management incentive plan which increased the ownership interest of non-controlling interests to 35.28%. These transactions resulted in a $12.3 million decrease, $0.3 million increase and $0.1 million increase in equity attributable to the owners of the Company due to the dilution of the Group’s ownership interest of 35%, 0.19% and 0.09%, respectively.
The VFF Group consists of the following entities, all with a principal place of business in Australia: – Velocity Frequent Flyer Holdco Pty Ltd – Velocity Frequent Flyer 1 Pty Ltd – Velocity Frequent Flyer 2 Pty Ltd – Velocity Frequent Flyer Pty Ltd – Velocity Rewards Pty Ltd (as Trustee for the Loyalty Trust) – The Loyalty Trust – Torque Solutions (Australia) Pty Ltd
The following table summarises the financial information of the VFF Group, before intra-group eliminations. The comparative information relates to the period from 22 October 2014 to 30 June 2015.
2016 $m
2015 $m
Revenue and income 327.6 167.2
Net profit 102.9 48.7
Other comprehensive income – –
Total comprehensive income 102.9 48.7
Profit allocated to non-controlling interest (2016: 35 - 35.28%) (2015: 35%) 36.2 17.0
Other comprehensive income allocated to non-controlling interest (2016: 35 - 35.28%) (2015: 35%) – –
Current assets 388.3 325.0
Non-current assets 127.6 13.6
Current liabilities (336.5) (284.2)
Non-current liabilities (216.0) (213.8)
Net liabilities (36.6) (159.4)
Net liabilities attributable to non-controlling interest (2016: 35.28%) (2015: 35%) (12.9) (55.8)
Net increase in cash and cash equivalents 41.9 19.6
Equity distributions paid to non-controlling interests 41.9 17.8
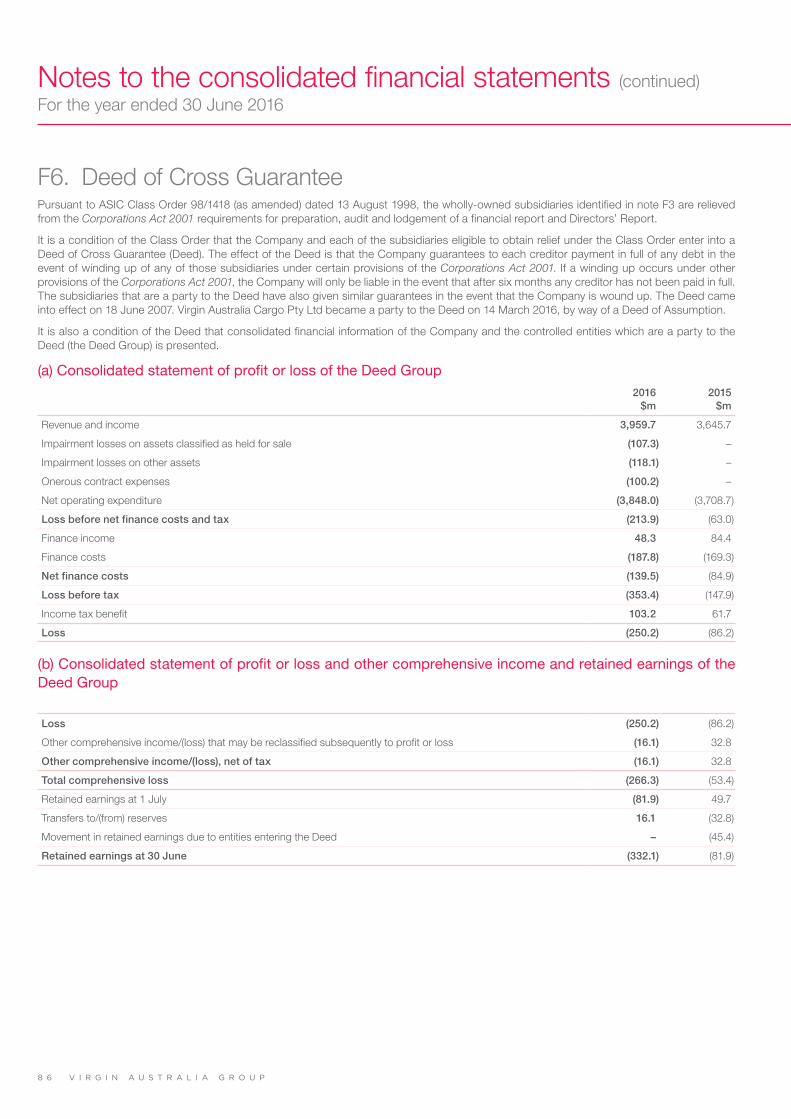
V I R G I N A U S T R A L I A G R O U P8 6
Notes to the consolidated financial statements (continued)For the year ended 30 June 2016
F6. Deed of Cross GuaranteePursuant to ASIC Class Order 98/1418 (as amended) dated 13 August 1998, the wholly-owned subsidiaries identified in note F3 are relieved from the Corporations Act 2001 requirements for preparation, audit and lodgement of a financial report and Directors’ Report.
It is a condition of the Class Order that the Company and each of the subsidiaries eligible to obtain relief under the Class Order enter into a Deed of Cross Guarantee (Deed). The effect of the Deed is that the Company guarantees to each creditor payment in full of any debt in the event of winding up of any of those subsidiaries under certain provisions of the Corporations Act 2001. If a winding up occurs under other provisions of the Corporations Act 2001, the Company will only be liable in the event that after six months any creditor has not been paid in full. The subsidiaries that are a party to the Deed have also given similar guarantees in the event that the Company is wound up. The Deed came into effect on 18 June 2007. Virgin Australia Cargo Pty Ltd became a party to the Deed on 14 March 2016, by way of a Deed of Assumption.
It is also a condition of the Deed that consolidated financial information of the Company and the controlled entities which are a party to the Deed (the Deed Group) is presented.
(a) Consolidated statement of profit or loss of the Deed Group2016
$m2015
$m
Revenue and income 3,959.7 3,645.7
Impairment losses on assets classified as held for sale (107.3) –
Impairment losses on other assets (118.1) –
Onerous contract expenses (100.2) –
Net operating expenditure (3,848.0) (3,708.7)
Loss before net finance costs and tax (213.9) (63.0)
Finance income 48.3 84.4
Finance costs (187.8) (169.3)
Net finance costs (139.5) (84.9)
Loss before tax (353.4) (147.9)
Income tax benefit 103.2 61.7
Loss (250.2) (86.2)
(b) Consolidated statement of profit or loss and other comprehensive income and retained earnings of the Deed Group
Loss (250.2) (86.2)
Other comprehensive income/(loss) that may be reclassified subsequently to profit or loss (16.1) 32.8
Other comprehensive income/(loss), net of tax (16.1) 32.8
Total comprehensive loss (266.3) (53.4)
Retained earnings at 1 July (81.9) 49.7
Transfers to/(from) reserves 16.1 (32.8)
Movement in retained earnings due to entities entering the Deed – (45.4)
Retained earnings at 30 June (332.1) (81.9)
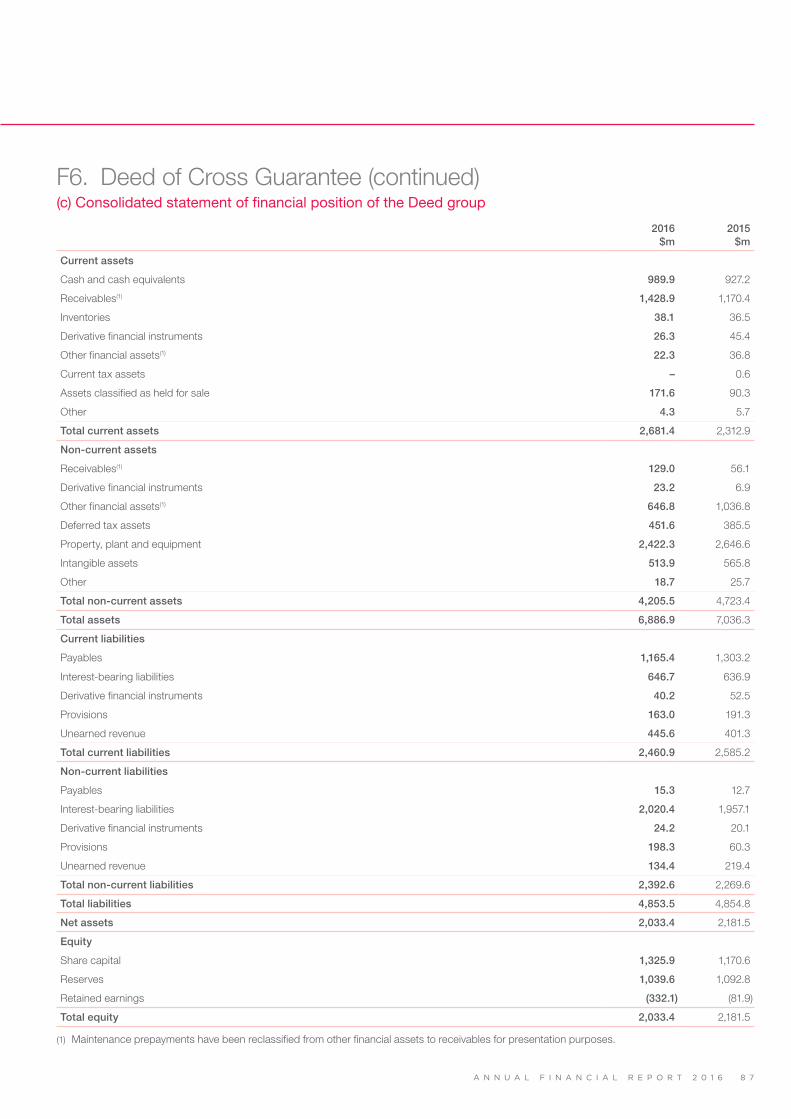
A N N U A L F I N A N C I A L R E P O R T 2 0 1 6 8 7
F6. Deed of Cross Guarantee (continued)(c) Consolidated statement of financial position of the Deed group
2016 $m
2015 $m
Current assets
Cash and cash equivalents 989.9 927.2
Receivables(1) 1,428.9 1,170.4
Inventories 38.1 36.5
Derivative financial instruments 26.3 45.4
Other financial assets(1) 22.3 36.8
Current tax assets – 0.6
Assets classified as held for sale 171.6 90.3
Other 4.3 5.7
Total current assets 2,681.4 2,312.9
Non-current assets
Receivables(1) 129.0 56.1
Derivative financial instruments 23.2 6.9
Other financial assets(1) 646.8 1,036.8
Deferred tax assets 451.6 385.5
Property, plant and equipment 2,422.3 2,646.6
Intangible assets 513.9 565.8
Other 18.7 25.7
Total non-current assets 4,205.5 4,723.4
Total assets 6,886.9 7,036.3
Current liabilities
Payables 1,165.4 1,303.2
Interest-bearing liabilities 646.7 636.9
Derivative financial instruments 40.2 52.5
Provisions 163.0 191.3
Unearned revenue 445.6 401.3
Total current liabilities 2,460.9 2,585.2
Non-current liabilities
Payables 15.3 12.7
Interest-bearing liabilities 2,020.4 1,957.1
Derivative financial instruments 24.2 20.1
Provisions 198.3 60.3
Unearned revenue 134.4 219.4
Total non-current liabilities 2,392.6 2,269.6
Total liabilities 4,853.5 4,854.8
Net assets 2,033.4 2,181.5
Equity
Share capital 1,325.9 1,170.6
Reserves 1,039.6 1,092.8
Retained earnings (332.1) (81.9)
Total equity 2,033.4 2,181.5
(1) Maintenance prepayments have been reclassified from other financial assets to receivables for presentation purposes.

V I R G I N A U S T R A L I A G R O U P8 8
Notes to the consolidated financial statements (continued)For the year ended 30 June 2016
F7. Parent entity disclosuresAs at, and throughout the financial year ended 30 June 2016, the parent entity of the Group was Virgin Australia Holdings Limited. Information relating to the parent entity is set out below.
2016 $m
2015 $m
Results of the parent entity
Loss (0.6) (9.4)
Total comprehensive loss (0.6) (9.4)
Financial position of the parent entity
Current assets 1,373.6 1,142.2
Total assets 2,804.2 2,466.4
Current liabilities 738.6 700.3
Total liabilities 1,275.8 1,092.4
Net assets 1,528.4 1,374.0
Share capital 1,325.9 1,170.6
Reserves 16.6 16.9
Retained earnings 185.9 186.5
Total equity 1,528.4 1,374.0
The Company has entered into a Deed of Cross Guarantee with the effect that the Company guarantees debts in respect of a number of its subsidiaries. Further details of the Deed of Cross Guarantee and the subsidiaries subject to the deed, are disclosed in note F6.
The Company does not have any contingent assets or contingent liabilities at 30 June 2016 (2015: nil).
The Company does not have any contractual commitments for the acquisition of property, plant and equipment at 30 June 2016 (2015: nil).
G. Other itemsThis section sets out other disclosures that may be relevant to understanding the financial position and performance of the Group.
G1. Commitments(a) CommitmentsThe Group has capital expenditure commitments to purchase property, plant and equipment and intangibles contracted at the reporting date but not recognised as liabilities. These commitments are predominantly in US dollars. US dollar amounts are translated to Australian dollars at the 30 June 2016 closing exchange rate of 0.7446 (2015: 0.7652). The Group’s capital expenditure commitments as at 30 June 2016 are $3,973.8 million (2015: $4,333.4 million).

A N N U A L F I N A N C I A L R E P O R T 2 0 1 6 8 9
G1. Commitments (continued)(b) Finance leases – as lesseeLeases under which the Group assumes substantially all the risks and rewards of ownership are classified as finance leases. Other leases are classified as operating leases.
Assets held under finance leases are initially recognised at an amount equal to the lower of their fair value and the present value of the minimum lease payments. Subsequently, the assets are depreciated over the term of the relevant lease, or where it is likely the Group will obtain ownership of the asset, the life of the asset. Minimum lease payments made under finance leases are apportioned between finance expense and the reduction of the outstanding liability. The finance expense is allocated to each period during the lease term so as to produce a constant periodic rate of interest on the remaining balance of the liability.
The Group leases buildings, telecommunications and aircraft and aeronautical related assets under finance leases.
During a previous financial year the Group entered into a finance lease for telecommunications infrastructure. The lease term is until 2018 with three additional one year options to extend the lease until 2021. This finance lease contains an option to purchase the assets at the end of the term of the lease.
During a previous financial year the Group entered into a finance lease agreement for the sale and leaseback of the Brisbane Hangar. The lease term is to 2047 and there is an additional 15 year option to extend the lease to 2062. This finance lease does not contain an option to purchase the asset at the end of the term of the lease.
Future minimum lease payments Interest
Present value of minimum lease payments
2016 $m
2015 $m
2016 $m
2015 $m
2016 $m
2015 $m
Less than one year 4.9 4.7 2.7 3.0 2.2 1.7
Between one and five years 12.2 14.5 9.5 10.0 2.7 4.5
More than five years 64.9 67.1 42.6 45.0 22.3 22.1
82.0 86.3 54.8 58.0 27.2 28.3
(c) Operating leases – as lesseePayments made under operating leases are recognised in profit or loss on a straight-line basis over the term of the lease, except where an alternative basis is more representative of the pattern of benefits to be derived from the leased property. Lease incentives received are recognised as an integral part of the total lease expense, over the term of the lease.
The Group leases property, plant and equipment, principally aircraft, under non-cancellable operating leases with terms of one to twelve years from 30 June 2016 (2015: one to twelve years). Aircraft lease payments are payable in US dollars. There are options on some leases to renew the leases at the end of the original lease period. Some leases provide for additional rent payments that are based on changes in a local price index. There are no restrictions imposed by the leases in relation to additional debt raising or entering into further leases. In accordance with normal industry practice, the Group is responsible for maintenance costs of operating leased aircraft for the term of the lease.
2016 $m
2015 $m
Future minimum rentals under non-cancellable operating leases:
Less than one year 533.1 516.0
Between one and five years 1,778.3 1,816.9
More than five years 1,142.4 1,326.0
3,453.8 3,658.9
(d) Operating leases – as lessorLease income from operating leases is recognised in other income on a straight-line basis over the lease term, unless another systematic basis is considered more representative of the time pattern in which benefit is derived from the leased asset.
The Group leased certain aircraft to other parties during the current and comparative periods These aircraft were sold during 2016 and as a consequence, no further minimum lease payments are receivable as at 30 June 2016. At 30 June 2015, future lease payments receivable were $21.1 million, of which $17.6 million was due within less than one year and the remainder between one and five years.

V I R G I N A U S T R A L I A G R O U P9 0
Notes to the consolidated financial statements (continued)For the year ended 30 June 2016
G2. Contingent liabilitiesA contingent liability is a possible obligation arising from past events which will only be confirmed by the occurrence or non-occurrence of future events not wholly within the control of the Group or a present obligation arising from past events that is not probable or cannot be measured reliably. Contingent liabilities are not recognised.
The Group has provided bank guarantees and standby letters of credit to third parties as guarantees of payment for fuel, aircraft lease security deposits and maintenance reserve deposits, non-aircraft operating lease commitments and other arrangements entered into with third parties.
As at 30 June 2016, there were $124.7 million (2015: $127.3 million) of bank guarantees and letters of credit outstanding. Refer to note E3 for further information on facility limits.
G3. Share-based paymentsThe Group operates a number of senior executive option plans and share plans. The fair value of options and performance rights granted are recognised as an employee benefit expense with a corresponding increase in equity. The fair value is measured at grant date and recognised over the period during which the employees become unconditionally entitled to the options and performance rights. The measurement of the fair value requires the use of estimates and judgements.
The fair value of senior executive option plans at grant date is determined using a Black-Scholes, Binomial or Monte Carlo option pricing model depending on the terms and conditions of each option, that takes into account the exercise price, the term of the option, the vesting and performance criteria, the impact of dilution, the non-tradeable nature of the option, the share price at grant date and expected price volatility of the underlying share, the expected dividend yield and the risk-free interest rate for the term of the option. The fair value of employee share plan performance rights at the grant date is independently determined using a discounted cash flow technique taking into account the share price at the grant date and dividends forgone over the vesting period of the performance rights.
The fair value of the option granted excludes the impact of any service and non-market vesting conditions (for example, profitability and sales growth targets). Service and non-market vesting conditions are included in assumptions about the number of options and performance rights that are expected to become exercisable. At each reporting date, the entity revises its estimate of the number of options and performance rights that are expected to become exercisable. The employee benefit expense recognised each period takes into account the most recent estimates, such that the amount ultimately recognised as an expense is based on the number of options and performance rights that meet the related service and non-market performance conditions at the vesting date.
Upon exercise of options and performance rights, the balance of the share-based payments reserve relating to those options and performance rights is transferred to share capital. The market value of shares issued to employees for no cash consideration under the employee share scheme is recognised as an employee benefits expense with a corresponding increase in equity when the shares vest.
(a) Share-based payments expense
2016 $’000
2015 $’000
Rights issued under senior executive plan 456 –
Options issued under senior executive option plans 1,494 3,160
Shares issued under employee share plans 203 312
Shares issued under employee short term incentive remuneration plans 69 962
2,222 4,434

A N N U A L F I N A N C I A L R E P O R T 2 0 1 6 9 1
G3. Share-based payments (continued)(b) Senior executive option plansThe Group has established a number of senior executive option plans (SEOP). Under each plan, senior executives are granted zero exercise price options. Each option is convertible into one ordinary share. Options vested are exercisable no later than 12 months after vesting, after which time they will lapse. The key conditions of the options, with the exception of SEOP 18, relate to the growth in the Company’s Total Shareholder Return (TSR) over a three year period (measured at the conclusion of the vesting period) and meeting corporate performance measures determined by the Board, as specific to each plan.
The following table sets out the percentages of the options that will vest depending on the growth in the Company’s TSR over a three year period relative to the median of the S&P/ASX 200 Index (excluding financial services and resource companies) as at the testing date. TSR on the testing date is determined using the Volume Weighted Average Price (VWAP) for VAH shares traded on the ASX on each of the 30 trading days up to and including the relevant date.
The Group’s relative TSR growth % of options that vest
Below 50th percentile 0%
50th percentile 50%
Between 51st and 74th percentile 2% (for each percentile ranking above 50%)
75th percentile 100%
Details of the options granted are set out below:
Option plan SEOP 15 SEOP 16 SEOP 17 SEOP 18 SEOP 19 SEOP 20 Total
Grant and issue date 29-Feb-12 29-Feb-12 1-May-13 1-May-13 1-May-13 20-Dec-13
Expiry dates 30-Jun-15 30-Jun-15(1) 30-Jun-16(2) 30-Jun-16(2) 30-Jun-16(1) 30-Jun-17(1)
30-Jun-16(3) 30-Jun-17(3) 30-Jun-18(3)
2016 ’000 ’000 ’000 ’000 ’000 ’000 ’000
Number of options at 1 July – 1,699 – 653 1,118 2,868 6,338
Options granted – – – – - – –
Options forfeited – – – – – – –
Options lapsed – – – – – (1,434) (1,434)
Options exercised – (1,699) – (653) (671) – (3,023)
Number of options on issue at 30 June – – – - 447 1,434 1,881
Number of options vested and exercisable at 30 June – – – - 447 860 1,307
Weighted average exercise price ($) 0.00 0.00 0.00 0.00 0.00 0.00 0.00
Weighted average share price at date of exercise ($) N/A 0.43 N/A 0.43 0.48 N/A
2015
Number of options at 1 July 7,537 4,250 5,325 653 2,796 2,868 23,429
Options granted – – – – – – –
Options forfeited – – – – – – –
Options lapsed – – (5,325) – (1,678) – (7,003)
Options exercised (7,537) (2,551) – – – – (10,088)
Number of options at 30 June – 1,699 – 653 1,118 2,868 6,338
Number of options vested and exercisable at 30 June – 1,699 – 653 671 – 3,023
Weighted average exercise price ($) 0.00 0.00 0.00 0.00 0.00 0.00 0.00
Weighted average share price at date of exercise ($) 0.39 0.39 N/A N/A N/A N/A
(1) Of the options that vest, 60% vest 12 months before this date.
(2) Options that vest, 100% vest 12 months before this date.
(3) Of the options that vest, 40% vest 12 months before this date.
The weighted average remaining contractual life of share options outstanding at the end of the financial year was one year (2015: two years).
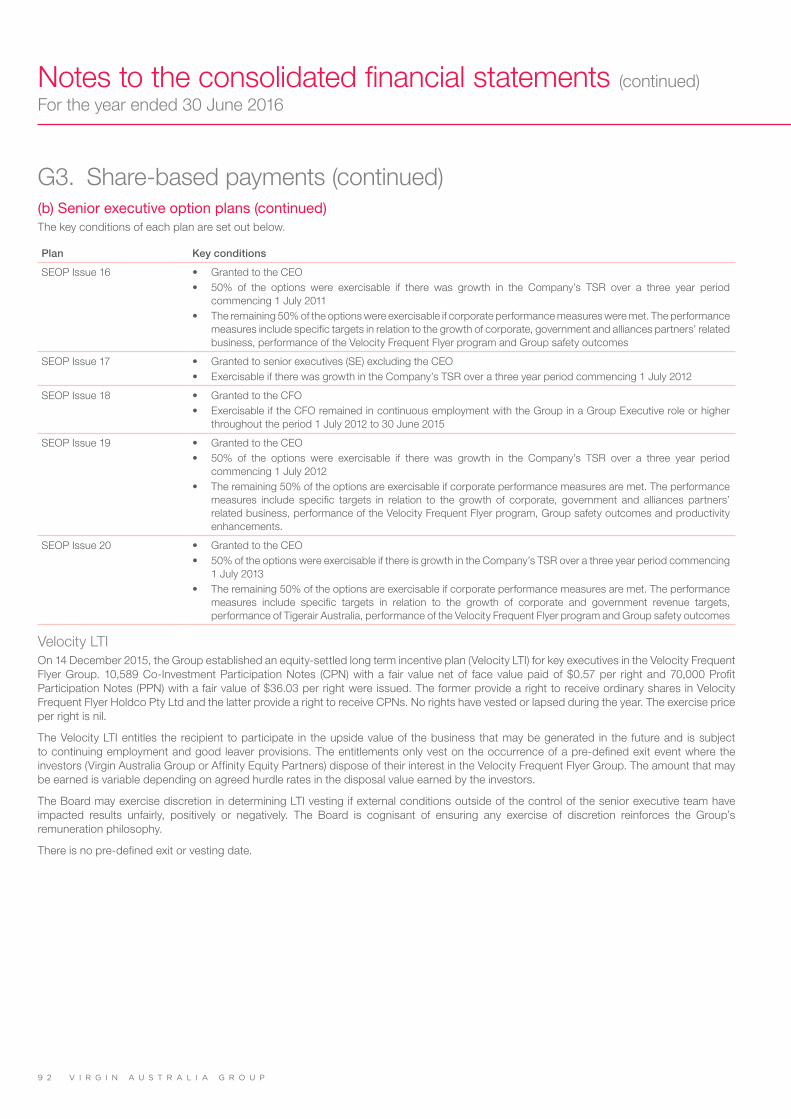
V I R G I N A U S T R A L I A G R O U P9 2
Notes to the consolidated financial statements (continued)For the year ended 30 June 2016
G3. Share-based payments (continued)(b) Senior executive option plans (continued)The key conditions of each plan are set out below.
Plan Key conditions
SEOP Issue 16 • Granted to the CEO• 50% of the options were exercisable if there was growth in the Company’s TSR over a three year period
commencing 1 July 2011• The remaining 50% of the options were exercisable if corporate performance measures were met. The performance
measures include specific targets in relation to the growth of corporate, government and alliances partners’ related business, performance of the Velocity Frequent Flyer program and Group safety outcomes
SEOP Issue 17 • Granted to senior executives (SE) excluding the CEO• Exercisable if there was growth in the Company’s TSR over a three year period commencing 1 July 2012
SEOP Issue 18 • Granted to the CFO• Exercisable if the CFO remained in continuous employment with the Group in a Group Executive role or higher
throughout the period 1 July 2012 to 30 June 2015
SEOP Issue 19 • Granted to the CEO• 50% of the options were exercisable if there was growth in the Company’s TSR over a three year period
commencing 1 July 2012• The remaining 50% of the options are exercisable if corporate performance measures are met. The performance
measures include specific targets in relation to the growth of corporate, government and alliances partners’ related business, performance of the Velocity Frequent Flyer program, Group safety outcomes and productivity enhancements.
SEOP Issue 20 • Granted to the CEO• 50% of the options were exercisable if there is growth in the Company’s TSR over a three year period commencing
1 July 2013• The remaining 50% of the options are exercisable if corporate performance measures are met. The performance
measures include specific targets in relation to the growth of corporate and government revenue targets, performance of Tigerair Australia, performance of the Velocity Frequent Flyer program and Group safety outcomes
Velocity LTIOn 14 December 2015, the Group established an equity-settled long term incentive plan (Velocity LTI) for key executives in the Velocity Frequent Flyer Group. 10,589 Co-Investment Participation Notes (CPN) with a fair value net of face value paid of $0.57 per right and 70,000 Profit Participation Notes (PPN) with a fair value of $36.03 per right were issued. The former provide a right to receive ordinary shares in Velocity Frequent Flyer Holdco Pty Ltd and the latter provide a right to receive CPNs. No rights have vested or lapsed during the year. The exercise price per right is nil.
The Velocity LTI entitles the recipient to participate in the upside value of the business that may be generated in the future and is subject to continuing employment and good leaver provisions. The entitlements only vest on the occurrence of a pre-defined exit event where the investors (Virgin Australia Group or Affinity Equity Partners) dispose of their interest in the Velocity Frequent Flyer Group. The amount that may be earned is variable depending on agreed hurdle rates in the disposal value earned by the investors.
The Board may exercise discretion in determining LTI vesting if external conditions outside of the control of the senior executive team have impacted results unfairly, positively or negatively. The Board is cognisant of ensuring any exercise of discretion reinforces the Group’s remuneration philosophy.
There is no pre-defined exit or vesting date.

A N N U A L F I N A N C I A L R E P O R T 2 0 1 6 9 3
G3. Share-based payments (continued)(c) Employee share plansThe Group currently has two key employee performance plans (KEPP) titled KEPP 12 and KEPP 13. The Company has appointed CPU Share Plans Pty Limited as Trustee to acquire and hold shares under these plans. The Trustee will transfer shares held by it to participating full-time or permanent part-time employees (other than non-executive directors of a member of the Group) when the vesting conditions in relation to a performance right have been satisfied or have been waived by the Board. The Company provides all monies required by the Trustee to acquire shares for the purposes of the plan, including costs and duties. Participating employees are not entitled to any income or other rights (including voting rights) derived from any shares acquired by the Trustee unless and until the shares are transferred to the employee, following satisfaction of any vesting conditions. The vesting conditions require employees to hold and not sell any of their initial purchase of shares and to remain an employee throughout the period.
KEPP 13 was established on 11 September 2013, with performance rights being issued on the same date with a grant date of 11 September 2013. 4,379,721 performance rights were issued in three tranches. 58% were eligible to vest on 1 July 2014, a further 28% were eligible to vest on 1 July 2015 and the remaining 14% were eligible to vest on 1 July 2016.
KEPP 12 was established on 6 September 2012. Performance rights were issued on 1 May 2013 with a grant date of 6 September 2012. 5,409,856 performance rights were issued in three tranches. 40% were eligible to vest on 1 July 2013, a further 40% were eligible to vest on 1 July 2014 and the remaining 20% were eligible to vest on 1 July 2015.
The performance rights for both plans are exercisable during the period commencing on the date on which the respective year’s annual results are announced and concluding on 30 June of the subsequent year, upon which the rights will lapse if unexercised.
The fair value of shares granted and distributed was based on the market price of the shares of the Company on the Australian Securities Exchange as at close of trading on each of the issue dates.
Set out below are summaries of performance rights granted by the Group under the Key Employee Performance Plan (KEPP):
KEPP 12 ’000
KEPP 13 ’000
Total ’000
2016
Number of performance rights at 1 July 742 1,592 2,334
Granted – – –
Vested and exercised (700) (1,102) (1,802)
Forfeited (42) – (42)
Number of performance rights at 30 June – 490 490
Number of performance vested and exercisable at 30 June – – –
Weighted average share price at date of exercise ($) 0.43 0.43
2015
Number of performance rights at 1 July 2,227 4,380 6,607
Granted – – –
Vested and exercised (1,485) (2,788) (4,273)
Forfeited – – –
Number of performance rights at 30 June 742 1,592 2,334
Number of performance vested and exercisable at 30 June – – –
Weighted average share price at date of exercise ($) 0.43 0.43
(d) Short term incentive remuneration plansOn 19 November 2013, a short term incentive remuneration plan (CEO 13) was established which granted 814 thousand zero exercise price options to the CEO in respect of a portion of his short term incentive remuneration for the financial year ended 30 June 2013 which was deferred in shares. The share price at grant date was $0.380 and the assessed fair value of the options was $0.361. The shares were exercisable if the CEO remained in continuous employment as the CEO of the Group throughout the period from 1 July 2013 to 30 June 2014. Vested options were exercisable during the period 1 July 2014 to 30 June 2015. During the 2015 financial year, 744 thousand options were vested and exercised and 70 thousand options lapsed. No options under this plan remain.

V I R G I N A U S T R A L I A G R O U P9 4
Notes to the consolidated financial statements (continued)For the year ended 30 June 2016
G4. Related parties(a) Key management personnel disclosuresKey management personnel (KMP) are those persons having responsibility and authority for planning, directing and controlling the activities of the entity, directly or indirectly, including any director. The total remuneration of KMP of the Group is set out below.
2016 $’000
2015 $’000
Short term employee benefits 10,627 12,094
Long term benefits 338 –
Termination benefits 511 –
Post-employment benefits 264 240
Share-based payments 636 1,182
12,376 13,516
For the 2016 financial year, there were no loans made, guaranteed, secured or outstanding in relation to KMP or their related parties (2015: nil).
Personal travel by KMP and their related parties is undertaken on terms no more favourable than those of employees, as per Group policy.
(b) Other related party transactions and balancesThe Group has a related party relationship with its associate, Virgin Samoa Limited (Virgin Samoa). The Group provides certain airline services and wet leases aircraft to Virgin Samoa.
On 4 July 2014, the Group appointed three Non-Executive Directors to the Board of Virgin Australia Holdings Limited (‘the Board”) from its major airline shareholders, Air New Zealand Limited (Air New Zealand), Etihad Airways P.J.S.C. (Etihad) and Singapore Airlines Limited (Singapore). As a result of these Board appointments, these shareholders became related parties of the Group.
On 30 March 2016, the Non-Executive Director representing Air New Zealand resigned from the Board. As a result, Air New Zealand ceased to be a related party from this date. The tables on the following pages include related party transactions with Air New Zealand up to this date.
The Group has codesharing arrangements with its related party shareholders and also purchases and sells airline goods and services from these entities. In addition, these shareholders participate in the Group’s Velocity Frequent Flyer program and pay a participation fee in relation to this.
During March 2016, Air New Zealand, Etihad and Singapore provided funding to the Group in proportion to their ownership interests. The funding was provided by way of twelve month variable rate unsecured loans totalling $374.5 million. The weighted average interest rate applicable at 30 June 2016 is 10.02%. As noted above, Air New Zealand ceased to be a related party on 30 March 2016.
Prior to the Group’s acquisition of Tigerair Australia on 16 October 2014, the Group accounted for its interest in Tigerair Australia as a joint venture (refer to note F2) and recognised transactions with the joint venture as related party transactions. During the period 1 July 2014 to 16 October 2014, the Group provided airline and other services and funding to Tigerair Australia. As a result of Tigerair Australia being consolidated into the Group from 17 October 2014, Tiger Airways Holdings Limited (Tiger Holdings) became a related party of the Group, through the Group’s relationships with Singapore. Singapore accounts for Tiger Holdings as a joint venture and accounts for the Group as an associate, therefore Tiger Holdings is a related party of the Group. Tiger Holdings provided services to the Group relating to leasing of aircraft and other support services. The Group also pays Tiger Holdings a brand name royalty. In the prior period and part of the current period, Tiger Holdings also provided services to the Group in relation to revenue collection.
Related party transactions are made on terms equivalent to those that prevail in arm’s length transactions.

A N N U A L F I N A N C I A L R E P O R T 2 0 1 6 9 5
G4. Related parties (continued)(b) Other related party transactions and balances (continued)
Transactions with related parties
2016 $’000
2015 $’000
Sale of goods and services
Revenue for airline and other services to joint venture – 109
Revenue for wet lease to associate 22,472 21,148
Revenue for airline services to associate 12,326 15,291
Sale of goods and services to Tiger Holdings – 81
Revenue for ticket sales collected by related party shareholders 188,536 213,769
Participation fee revenue for Velocity Frequent Flyer program from related party shareholders 30,732 25,745
Purchase of goods and services
“Tigerair” brand name royalty paid to Tiger Holdings 1,790 1,394
Purchase of goods and services from Tiger Holdings 15,019 22,560
Purchase of goods and services from related party shareholders 54,820 74,448
Finance income/(costs)
Finance income for unsecured loans advanced to joint venture – 764
Finance costs for unsecured loan from associate – (23)
Finance costs for loans from related party shareholders 9,128 –
Outstanding balances at reporting date2016
$’0002015
$’000
Current receivables
Related party shareholders (sales of goods and services) 1 –
Virgin Samoa (sales of goods and services) 5,392 4,457
Tiger Holdings (sales of goods and services) – 81
Current payables
Related party shareholders (purchases of goods and services) 5,193 9,344
Tiger Holdings (purchases of goods and services) 882 3,052
Virgin Samoa (purchases of goods and services) 12,225 11,916
Current interest-bearing liabilities
Loans from related party shareholders 244,208 –
No provision for doubtful receivables has been raised in relation to any outstanding balances and no expense has been recognised in respect of bad or doubtful debts due from related parties.
The Group are committed to aircraft and engine operating lease payments to Tiger Airways Singapore Pte Ltd totalling $51,617 thousand. As at 30 June 2016, the remaining lease commitment periods ranged from 21 to 63 months.

V I R G I N A U S T R A L I A G R O U P9 6
Notes to the consolidated financial statements (continued)For the year ended 30 June 2016
G5. Auditor’s remunerationDetails of amounts paid to the auditor of the Company, KPMG, and its related practices for audit and non-audit services are set out below:
2016 $’000
Restated(1)
2015 $’000
Audit and review services
Audit and review of financial statements 1,790 1,948
Other services
Other assurance services(2) 392 687
Taxation services 21 358
Other(3) 427 653
840 1,698
(1) 2015 comparatives have been restated to reflect the final total 2015 remuneration for audit related services agreed after the year ended 30 June 2015.
(2) Comprises assurance services rendered in relation to sustainability, debt raising transactions, compliance with service level agreements and other non-financial
statement assurance procedures.
(3) Mainly comprises due diligence and other services in connection with the capital restructure, divestments, advice on accounting matters and other agreed
upon procedures.
G6. Events subsequent to reporting dateThe Group completed a one for one pro-rata non-renounceable entitlement offer of $852.0 million in August 2016. A portion of the proceeds from the entitlement offer were used to repay the $425.0 million shareholder loan facility.
After the issue of shares under the entitlement offer, the Group made an additional placement to HNA Innovation Ventures (Hong Kong) Co. Limited (HNA) of $89.2 million at a price of $0.26 per share which completed on 20 September 2016.
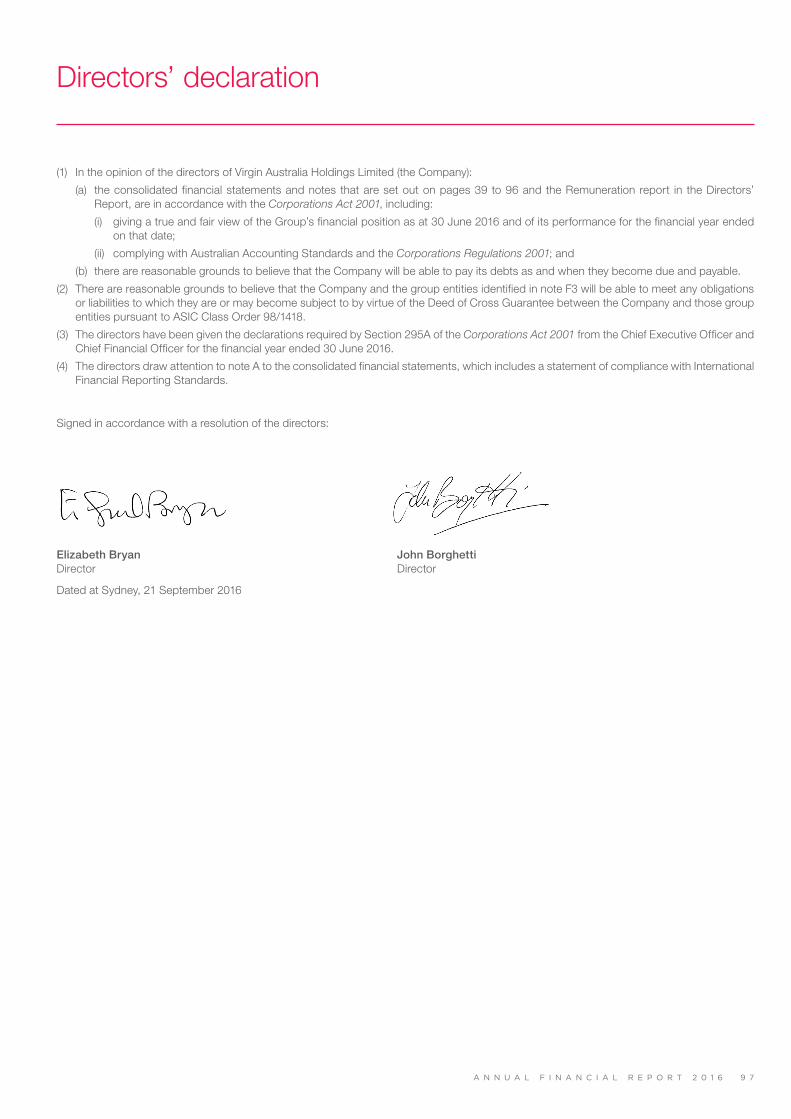
A N N U A L F I N A N C I A L R E P O R T 2 0 1 6 9 7
Directors’ declaration
(1) In the opinion of the directors of Virgin Australia Holdings Limited (the Company):
(a) the consolidated financial statements and notes that are set out on pages 39 to 96 and the Remuneration report in the Directors’ Report, are in accordance with the Corporations Act 2001, including:
(i) giving a true and fair view of the Group’s financial position as at 30 June 2016 and of its performance for the financial year ended on that date;
(ii) complying with Australian Accounting Standards and the Corporations Regulations 2001; and
(b) there are reasonable grounds to believe that the Company will be able to pay its debts as and when they become due and payable.
(2) There are reasonable grounds to believe that the Company and the group entities identified in note F3 will be able to meet any obligations or liabilities to which they are or may become subject to by virtue of the Deed of Cross Guarantee between the Company and those group entities pursuant to ASIC Class Order 98/1418.
(3) The directors have been given the declarations required by Section 295A of the Corporations Act 2001 from the Chief Executive Officer and Chief Financial Officer for the financial year ended 30 June 2016.
(4) The directors draw attention to note A to the consolidated financial statements, which includes a statement of compliance with International Financial Reporting Standards.
Signed in accordance with a resolution of the directors:
Elizabeth Bryan John Borghetti Director Director
Dated at Sydney, 21 September 2016

V I R G I N A U S T R A L I A G R O U P9 8
Independent auditor’s report to the members of Virgin Australia Holdings LimitedReport on the financial reportWe have audited the accompanying financial report of Virgin Australia Holdings Limited (the company), which comprises the consolidated statement of financial position as at 30 June 2016, and consolidated statement of profit or loss, consolidated statement of profit or loss and other comprehensive income, consolidated statement of changes in equity and consolidated statement of cash flows for the year ended on that date, notes A to G comprising a summary of significant accounting policies and other explanatory information and the directors’ declaration of the Group comprising the company and the entities it controlled at the year’s end or from time to time during the financial year.
Directors’ responsibility for the financial reportThe directors of the company are responsible for the preparation of the financial report that gives a true and fair view in accordance with Australian Accounting Standards and the Corporations Act 2001 and for such internal control as the directors determine is necessary to enable the preparation of the financial report that is free from material misstatement whether due to fraud or error. In note A, the directors also state, in accordance with Australian Accounting Standard AASB 101 Presentation of Financial Statements, that the financial statements of the Group comply with International Financial Reporting Standards.
Auditor’s responsibilityOur responsibility is to express an opinion on the financial report based on our audit. We conducted our audit in accordance with Australian Auditing Standards. These Auditing Standards require that we comply with relevant ethical requirements relating to audit engagements and plan and perform the audit to obtain reasonable assurance whether the financial report is free from material misstatement.
An audit involves performing procedures to obtain audit evidence about the amounts and disclosures in the financial report. The procedures selected depend on the auditor’s judgement, including the assessment of the risks of material misstatement of the financial report, whether due to fraud or error. In making those risk assessments, the auditor considers internal control relevant to the entity’s preparation of the financial report that gives a true and fair view in order to design audit procedures that are appropriate in the circumstances, but not for the purpose of expressing an opinion on the effectiveness of the entity’s internal control. An audit also includes evaluating the appropriateness of accounting policies used and the reasonableness of accounting estimates made by the directors, as well as evaluating the overall presentation of the financial report.
We performed the procedures to assess whether in all material respects the financial report presents fairly, in accordance with the Corporations Act 2001 and Australian Accounting Standards, a true and fair view which is consistent with our understanding of the Group’s financial position and of its performance.
We believe that the audit evidence we have obtained is sufficient and appropriate to provide a basis for our audit opinion.
IndependenceIn conducting our audit, we have complied with the independence requirements of the Corporations Act 2001.
Auditor’s opinionIn our opinion:
(a) the financial report of the Group is in accordance with the Corporations Act 2001, including:
(i) giving a true and fair view of the Group’s financial position as at 30 June 2016 and of its performance for the year ended on that date; and
(ii) complying with Australian Accounting Standards and the Corporations Regulations 2001.
(b) the financial report also complies with International Financial Reporting Standards as disclosed in note A.
KPMG, an Australian partnership and a member firm of the KPMG network of independent member firms affiliated with KPMG International Cooperative (“KPMG International”), a Swiss entity.
Liability limited by a scheme approved under Professional Standards Legislation.

A N N U A L F I N A N C I A L R E P O R T 2 0 1 6 9 9
Independent auditor’s report to the members of Virgin Australia Holdings Limited (continued)Report on the Remuneration reportWe have audited the Remuneration report included in pages 15 to 35 of the Directors’ report for the year ended 30 June 2016. The directors of the company are responsible for the preparation and presentation of the Remuneration report in accordance with Section 300A of the Corporations Act 2001. Our responsibility is to express an opinion on the Remuneration report, based on our audit conducted in accordance with auditing standards.
Auditor’s opinionIn our opinion, the remuneration report of Virgin Australia Holdings Limited for the year ended 30 June 2016, complies with Section 300A of the Corporations Act 2001.
KPMG
John Wigglesworth
Partner
Sydney, 21 September 2016

V I R G I N A U S T R A L I A G R O U P1 0 0
ASX additional information
Additional information required by the Australian Securities Exchange Limited Listing Rules and not disclosed elsewhere in this report is set out below. The information is current at 20 September 2016.
Substantial shareholdersThe following shareholders have confirmed they are substantial shareholders.
Shareholder Number of ordinary shares
Etihad Airways P.J.S.C. 1,771,023,928
Singapore Airlines Limited 1,691,623,863
HNA Innovation Ventures (Hong Kong) Co Limited 1,621,536,791
Nanshan Capital Holdings Limited 1,621,227,756
Corvina Holdings Limited 845,811,931
Refer to note E4 to the consolidated financial statements for voting rights attached to ordinary shares and note G3 to the consolidated financial statements for voting rights attached to options and rights.
Distribution of equity security holdersNumber of equity security holders
Category Ordinary shares
1 – 1,000 18,109
1,001 – 5,000 13,345
5,001 – 10,000 3,531
10,001 – 100,000 4,733
100,001 and over 586
40,304
24,205 shareholders hold less than a marketable parcel of ordinary shares as at 20 September 2016.
On-market share buy-backThere is no current on-market buy-back.
No securities were purchased on-market during the financial year for the purpose of employee share schemes.

A N N U A L F I N A N C I A L R E P O R T 2 0 1 6 1 0 1
Twenty largest shareholders
NameNumber of ordinary
shares held
Capital held
%
Etihad Airways P.J.S.C. 1,771,023,928 20.94
Singapore Airlines Limited 1,691,623,863 20.00
HNA Innovation Ventures (Hong Kong) Co Limited 1,621,536,791 19.17
Nanshan Capital Holdings Limited 1,621,227,756 19.17
Corvina Holdings Limited 845,811,931 10.00
Air New Zealand Associated Companies Limited 205,778,660 2.43
Citicorp Nominees Pty Limited 104,560,916 1.24
HSBC Custody Nominees (Australia) Limited 56,070,136 0.66
J P Morgan Nominees Australia Limited 36,621,779 0.43
Chesters Nominees Pty Limited 25,000,000 0.30
Kilby Pty Ltd, D & A Lazzaro Family A/C 13,653,838 0.16
National Nominees Limited 9,289,381 0.11
Massimo John Borghetti 8,794,266 0.10
Henleaze Investments Pty Limited 7,000,000 0.08
UBS Nominees Pty Limited 5,783,253 0.07
Just Super Co Pty Limited, Super Fund A/C 4,930,580 0.06
Taxola Pty Limited 4,750,000 0.06
Mr Albert Morris 4,484,371 0.05
CPU Share Plans Pty Limited, Virgin Blue KEPP A/C 4,061,637 0.05
Mr Don Lazzaro + Mrs Ann Lazarro, Super Fund A/C 4,000,000 0.05

V I R G I N A U S T R A L I A G R O U P1 0 2
This page is intentionally left blank

Corporate directory
Company secretarySharyn Page
Principal administrative and registered office
Virgin Australia Holdings Limited 56 Edmondstone Road Bowen Hills QLD 4006Australia Telephone: (07) 3295 3000 (within Australia) or +61 7 3295 3000 (outside Australia)
Share registryComputershare Investor Services Pty Limited 117 Victoria Street West End QLD 4101Australia Telephone: 1300 850 505 (within Australia) or +61 3 9415 4000 (outside Australia)
Securities exchangeThe Company is listed on the Australian Securities Exchange. The Home Exchange is Brisbane.
Other informationVirgin Australia Holdings Limited, incorporated and domiciled in Australia, is a publicly listed company limited by shares.
This book is printed on Precision paper stock. Precision is PEFCTM Certified and made from elemental chlorine free bleached pulp sourced from sustainably managed forests and non controversial sources. It is manufactured by an ISO 14001 certified mill using renewable energy sources.
A N N U A L F I N A N C I A L R E P O R T 2 0 1 6 1 0 3
