financial report 2011
DESCRIPTION
hTRANSCRIPT

P r o f i l e o f t h e I n t e r r o l l G r o u p
The Interroll Group is acknowledged as one of the world’s leading specialists
within the field of internal logistics. Headquartered in Sant’Antonino, Switzer-
land, the exchange-listed company employs around 1,500 people at 28 enter-
prises around the globe. Among the company’s 23,000 customers world-
wide are plant manufacturers, system integrators, multinational corporations
and end-users. Designed as space-saving and energy-efficient solutions,
Interroll products perform key functions in material handling systems from pro-
duction through to distribution: Drum Motors for belt conveyors, Rollers and
RollerDrives for conveyor units, flow storage modules for pallet and container
racking systems at distribution centres, Crossbelt Sorters, Belt Curves and
other conveyor modules. The main fields of application include the food indus-
try, airport logistics, courier/express/postal services, distribution centres and
industrial manufacturers operating in various segments of the market.
www.interroll.com
IN
TE
RR
OL
L
AN
NU
AL
R
EP
OR
T
20
11
A N N U A L R E P O R T
2 0 1 1
Geschaeftsbericht_2011_Titel_en_Druck 27.02.2012 27.02.12 10:02 Seite 1

– 31 %
– 54 %
– 77 %
– 8 %
15 %
38 %
61 %
300
200
100
400
500
600
700
2008 2009 2010 20112007
© Swissquote
Impressum
Concept and coordination:
Interroll Holding Ltd., Investor Relations
Layout/DTP:
Victor Hotz AG, Corporate Publishing & Print, Steinhausen
This annual report is also available in German.
The German version is binding.
Interroll Holding Ltd.
Via Gorelle 3
6592 Sant’Antonino, Switzerland
Tel. +41 91 850 25 25
Fax +41 91 850 25 05
www.interroll.com
www.interroll.com/ir (Investor Relations)
Contact
Paul Zumbühl
CEO
Tel. +41 91 850 25 25
K e y f I G u r e s o f T h e I n T e r r o L L G r o u P
in CHF million, if not noted differently 2011 2010 2009 2008 2007
Incoming orders/net sales
Total incoming orders 288.7 285.2 238.9 347.8 375.9
Drives 95.1 97.9 82.9 114.7 124.1
Rollers 83.2 79.1 73.3 104.0 108.7
Conveyors & Sorters 42.8 52.1 33.6 61.5 64.8
Pallet- & Carton Flow 50.8 53.9 44.3 77.7 73.2
Total net sales 271.9 283.1 234.0 357.9 370.9
Profitability
EBITDA 36.2 35.8 18.8 58.2 67.5
in % of net sales 13.3 12.6 8.0 16.3 18.2
EBITA 25.7 24.8 8.0 48.0 56.6
in % of net sales 9.5 8.8 3.4 13.4 15.3
EBIT 20.4 20.4 3.1 43.4 45.2
in % of net sales 7.5 7.2 1.3 12.1 12.2
Result 18.2 14.4 5.7 33.8 31.9
in % of net sales 6.7 5.1 2.4 9.5 8.6
Cash Flow
Operating cash flow 14.5 18.7 20.4 41.9 68.5
in % of net sales 5.3 6.6 8.7 11.7 18.5
Free cash flow –5.6 –8.5 –6.0 18.6 42.7
in % of net sales –2.1 –3.0 –2.6 5.2 11.5
Total investments/capital expenditures 19.6 26.4 22.9 22.4 24.0
Balance sheet
Total assets 239.2 211.3 215.7 236.8 255.1
Goodwill in % of equity 6.3 7.3 8.3 7.9 9.2
Net financial assets (debts) –17.6 –12.9 –4.2 4.4 –6.1
Gearing (net debts/equity) 0.12 0.10 0.03 – 0.05
Indebtedness factor (net debts/cash flow) 1.21 0.69 0.20 – 0.09
Equity 143.3 127.5 133.0 130.7 124.9
Equity ratio (equity in % of assets) 59.9 60.3 61.7 55.2 49.0
Return on equity (in %) 13.4 11.1 4.3 26.5 26.7
Other key figures
RONA (Return on net assets, in %) 9.9 10.4 1.6 22.3 22.6
Average number of employees 1 340 1 255 1 206 1 315 1 275
Net sales per employee (in thousands CHF) 203 226 194 272 291
Productivity (Added value/total personnel expenses) 1.77 1.98 1.66 2.21 2.14
I n f o r m aT I o n f o r I n v e s T o r s
The shares of Interroll Holding AG have been listed at the Swiss Exchange SIX since June 5th, 1997 (Investdata: INRN;
Reuters; INRN.S; Security number: 637,289).
Interroll Share Price (yellow curve) compared to SPI/SXGE (black curve)
2011 2010 2009 2008 2007
Information on the Interroll share
Number of registered shares 854 000 854 000 854 000 854 000 854 000
Number of average outstanding shares 791 452 775 724 771 475 762 323 780 715
Number of outstanding shares per (31.12.) 793 901 779 600 771 775 768 958 762 112
Market price: highest CHF 450 371 320 581 632
Market price: lowest CHF 271 267 173 215 420
Market price: per year end CHF 279 368 307 256 581
Market capitalization per 31.12. Mio. CHF 221.50 286.89 236.55 196.85 442.79
P/E Ratio Ratio 12.25 19.79 41.37 5.82 13.15
2011 2010 2009 2008 2007
Values per share (in CHF)
Par value as per year end 10.00 10.00 15.00 20.00 30.50
Reduction of par value 5.00 5.00 10.50
Distribution out of reserves from capital contributions* 7.00 5.00
Pay out ratio 30.45 26.89 67.48 11.36 23.77
Earnings per average share outstanding 22.99 18.59 7.41 44.00 44.17
Cash flow per average share outstanding (CHF 1) 18.34 24.09 26.43 54.94 87.77
Equity per share outstanding as per year end 180.48 163.49 172.36 170.01 163.89
* The distribution out of reserves from capital contributions in the year under review is proposed by the board of directors
for the annual general assembly of May 11th, 2012.
1
c o n t e n t s
c o n t e n t s
Highlights 2011 3
Report by the Board of Directors and Group Management 5
Review of the Financial Year 9
Review of Regional Performance 16
employees 18
Growth drivers 19
Customer benefits 26
The strategy: “Inspired by efficiency” 31
Innovation in manufacturing 32
Product innovations 34
What our customers say 39
corporate Governance 45
Financial report of Interroll Group 65
Financial statements of Interroll Holding Ltd. 129

Vorschaltseiten GB 2011_27.02.12 27.02.12 10:05 Seite 5

Vorschaltseiten GB 2011_27.02.12 27.02.12 10:05 Seite 5
3
H i g H l i g H t s 2 0 1 1
H i g H l i g H t s 2 0 1 1
January to strengthen its presence within the Australian market, Interroll acquires the business
operations of its long-term local licensee partner.
February Interroll’s new easy-to-install cartridge solution for check-out counter motors is
showcased to a large international trade audience at the euroshop supermarket fair
in Düsseldorf.
March Interroll reports on an encouraging performance in the 2010 financial year, with
significant increases in sales and higher profitability.
April As part of a large-scale order for Procter & Gamble, Interroll is commissioned to
supply dynamic storage technology for 19,500 pallet spaces.
May At the ceMAt international trade fair for internal logistics, the Interroll RollerDrive
EC310 wins the “MM Logistik” award from Vogel Business Media.
June Interroll expands its market presence in Turkey by opening its own sales office
in Istanbul.
July As part of the sAP project, 13 Interroll companies in europe go live on the new
eRP system.
August Mid-year report 2011: Interroll substantially increases profitability and margins in
the first half of 2011.
september In suzhou, west of shanghai (china), Interroll celebrates the opening of its new
regional Centre of Excellence for the Asia/Pacific region.
October Interroll China receives the “MM Maschinenmarkt” magazine award in recognition of
its leading role in the materials handling industry in china.
november At europe’s leading trade show for electrical automation, the sPs IPc Drives
in nuremberg, Interroll launches its new frequency inverter for drum motors for
enhanced performance of conveyor belt systems.
December As the year draws to a close: Interroll’s synchronous Drum Motor wins the 2012
International Foodtec Award in gold from the German Agricultural society (Deutsche
Landwirtschafts-Gesellschaft e. V.).

Vorschaltseiten GB 2011_27.02.12 27.02.12 09:47 Seite 3

Vorschaltseiten GB 2011_27.02.12 27.02.12 09:47 Seite 3
5
R e p o R t b y t H e b o a R d o f d i R e c t o R s a n d g R o u p M a n a g e M e n t
R e p o R t b y t H e b o a R d o f d i R e c t o R s a n d g R o u p M a n a g e M e n t
Dear shareholders and Business Associates,
Interroll performed well during the 2011 financial year and was able to enhance its market
position worldwide. In terms of local currency, sales revenue rose by 7.5 % compared with 2010.
the adverse impact of foreign currency translation, particularly
with regard to the Us dollar and the euro, resulted in sales reve-
nue of cHF 271.9 million (2010: cHF 283.1 million) expressed
in the currency of consolidation. Net profit was up significantly
by 26.1 % year on year from cHF 14.4 million to cHF 18.2 million.
Benefiting from major investment over the past five years, Interroll
gained additional market share worldwide in the period under
review. All product groups contributed to this favourable develop-
ment. Individual products recorded significant
gains in market share, including the next-generation
24 V motorised rollers.
new corporate structure established successfully
the new corporate structure introduced at the start
of 2011 proved to be highly successful early on
in the year under review. As a result of restructuring,
we were able to increase market penetration
and provide our customers with an extended range of efficient
key products in the field of internal logistics. The new struc-
ture makes Interroll more accessible and systematically aligns all
sales activities towards the requirements of different customer
groups: system integrators, equipment manufacturers and users.
Interroll also intends to leverage the new structure in order
to unlock potential for future growth and take advantage of the
structural changes witnessed within the market.
the new structure makes the internal organisation more transparent, standardises processes
of innovation and pools production technologies. this ensures that the product range is available
globally at a consistently high quality. Interroll centres of excellence in europe, the United states
and Asia, together with installation and service operations in various countries worldwide, enhance
the benefits to customers by cutting delivery times, as well as through applications engineering
and servicing.
Paul Zumbühl Chief Executive Officer
In brief
Interroll performed well during the
2011 financial year and was able to
enhance its market position world-
wide. In terms of local currency, sales
revenue rose by 7.5 % compared
with 2010. Net profit was up 26.1 %
year on year from cHF 14.4 million
to cHF 18.2 million.
Kurt Rudolf chairman of the Board of Directors

6
R e p o R t b y t H e b o a R d o f d i R e c t o R s a n d g R o u p M a n a g e M e n t
growing brand awareness
Our customers’ client base is recognising the benefits of Interroll products to an increasing extent.
these clients include multinational corporations like Red Bull, Procter & Gamble, Amazon,
coca-cola, UPs and Frito Lay. Positive experience of working with Interroll on a project in 2009
prompted Red Bull in thailand to order dynamic storage solutions from Interroll again in 2011
for a new distribution centre. In Germany, Interroll won a major contract for dynamic storage tech-
nology in the year under review for use in a distribution hub for Procter & Gamble. the chinese
postal service opted for the Interroll crossbelt sorter due to its high level of energy efficiency and
minimal maintenance requirements.
In addition to distribution centres and providers of postal, courier and express delivery services,
Interroll products are primarily deployed in growth markets such as the food industry, airport
logistics and various industrial sectors. Customers benefit from easy-to-integrate, plug-and-play
products for all primary interfaces within the area of internal logistics. These energy-efficient
solutions are provided under the single Interroll umbrella brand.
As various awards in the year under review demonstrate, Interroll is increasingly regarded as
an innovation partner when it comes to materials handling solutions. Interroll was presented with
the iF Product Design Award 2011 for its new control modules that are designed to enhance
the energy efficiency of container conveyor systems. In May 2011, the new RollerDrive motorised
rollers were awarded an MM Logistik Award by Vogel Business Media at CeMAT in Hanover
(Germany), the world’s no. 1 trade show for internal logistics. In late 2011, the German Agricultural
society (DLG) announced that the Interroll synchronous Drum Motor was a winner of the Interna-
tional Foodtec Award 2012 in Gold.
In conjunction with Leibniz Universität Hannover (Germany) and southeast University nanjing
(China), Interroll – as competence partner – launched a scientific study in the year under review into
the sustainable building and operation of distribution centres. the aim of the study is to create a
simulation tool that calculates benchmark data for distribution centres. the program is designed to
identify possible long-term improvements for new-build and upgrade projects and support in-
vestment decisions in a professional, practical way. By simulating projects, Interroll aims to offer
its customers and operators of distribution centres worldwide real added value. the program
is scheduled for completion in the current financial year. The project also serves to raise market
awareness of Interroll dynamic storage technology and its benefits with regard to handling fast-
moving merchandise, and to promote sales.
7
R e p o R t b y t H e b o a R d o f d i R e c t o R s a n d g R o u p M a n a g e M e n t
strategic projects implemented
Alongside innovation, Interroll pressed ahead with its planned strategic projects and activities in
the year under review, which as well as the organisational realignment included further expansion
of the global network and the introduction of sAP. the latter proved to be a demanding project,
with Interroll now having attained the first intermediate target when the system successfully went
live at 13 companies in 10 european countries. Preparations for the next stage of the sAP roll-
out were speedily initiated. this major project is highly resource-intensive and requires a high level
of commitment from employees worldwide. The follow-on project is meticulously utilising findings
from the first phase of implementation to enable the tool – which is very important to the company’s
future – to be rolled out effectively across the entire Group.
In the period under review, Interroll continued to apply Kaizen methodology at its centres of excel-
lence for products. the principle of continual improvement has been introduced at the regional
centre of excellence for Asia and at the centre of excellence for subsystems and conveyor Mod-
ules in sinsheim (Germany), where crossbelt sorters, Belt curves, Roller and Belt conveyor
Modules are produced. The Kaizen concept forms part of ongoing efforts to boost productivity and
lower costs.
a stronger geographic network
In September 2011, Interroll officially opened the new regional Centre of Excellence for Asia/
Pacific in China. The new facility in Suzhou (west of Shanghai) has four times more production space
than before to enhance Interroll’s customer service offering in China, other Asian markets and
Australia. With its own production and assembly facility covering the entire product range, as well
as the expertise to provide applications engineering, the company is able to extend its customer
services, streamline delivery periods and guarantee on-time delivery even with regard to large-scale
projects. employing more than 150 people, the company has a production area of 10,000 square
metres across two factory buildings. over 160 customers, partners, representatives of the authorities
and associations, guests of honour and journalists from china, Japan, Korea and thailand attend-
ed the opening ceremony.
In order to improve market penetration in Australia, Interroll took over the business activities of a
long-standing local partner at the beginning of 2011, consolidating two existing sites into one. In
Turkey, Interroll established its own local sales office in the year under review. A branch of Interroll
was also opened in Jakarta (Indonesia).
distribution of reserves from capital contributions
In view of the financial stability of the company and the encouraging results achieved during
the financial year now ended, the Board of Directors will propose to the Annual General Meeting
of shareholders on 11 May 2012 a distribution of cHF 7.00 per registered Interroll share (2011:
cHF 5.00 per registered Interroll share) out of reserves from capital contributions. this distribution
of reserves from capital contributions (in place of a dividend) is usually tax-exempt for shareholders.

8
R e p o R t b y t H e b o a R d o f d i R e c t o R s a n d g R o u p M a n a g e M e n t
thanks to our employees
The Board of Directors and Group Management would like to thank all members of staff for their
above-average commitment in the year under review. It is a testament to the efforts of each one of
them that the new structure was rolled out successfully. In addition to performing their day-to-day
duties, the European operations also had to take on the strategic SAP project. Every staff member
contributed to the encouraging results.
outlook
Despite a good start to the new year, with economic conditions remaining volatile Interroll is adopt-
ing a watchful approach to the immediate future. We do not expect the situation to fundamentally
improve during the current financial year: foreign exchange fluctuations are likely to continue along
with rising commodity prices in some areas and the prospect of political upheaval. our newly
reorganised corporate structure accords with our long-term growth strategy, helping further streng-
then our market position and increase market share, as well as allowing us to leverage market
opportunities more effectively. We will continue to expand our global network in a targeted manner
and to forge ahead with our activities in the United states and Asia. tight cost management,
ongoing increases in productivity and a solid financial base are other priorities. We will proceed
with strategic projects as planned. Other investment in innovative products offering real added
value for customers is also envisaged and is aimed at securing the future of the business.
Kurt Rudolf Paul Zumbühl
Chairman of the Board of Directors Chief Executive Officer

9
R e v i e w o f t H e f i n a n c i a l y e a R
R e v i e w o f t H e f i n a n c i a l y e a R
sales and order intake
Interroll can look back on an encouraging financial year, having captured additional market share
around the globe and having strengthened its position in the business arena. expressed in local
currency, net sales rose by 7.5 % compared to the previous year. As a result of unfavourable foreign
exchange effects, attributable primarily to the US dollar and euro, net sales in the currency of
consolidation totalled CHF 271.9 million (2010: CHF 283.1 million). The negative effects associated
with foreign exchange movements vis-à-vis the swiss franc can be lessened slightly by the fact
that the company manufactures and markets its products in various currency areas.
order intake rose from cHF 285.2 million in 2010 to cHF 288.7 million at the end of 2011.
expressed in local currency, this corresponds to growth of 13 %.
Having spiralled during the first half of 2011, commodity prices stabilised over the course of the
second six months. To some extent, Interroll managed to offset this trend by adjusting its own
market prices. Above all, however, additional productivity improvements proved decisive within this
area. At Interroll’s centres of excellence, Kaizen methods are a major contributor to ongoing
productivity gains. Kaizen is aimed at significantly improving a company’s efficiency levels. The
emphasis is on continuous optimisation in small steps and with small-scale capital investments
in order to reach the specified goals.
Result
earnings before interest, taxes, depreciation and amortisation (eBItDA) edged up by 1.3 % year
on year, reaching cHF 36.2 million at the end of 2011 (2010: cHF 35.8 million); the eBItDA margin
rose from 12.6 % to 13.3 %. earnings before interest and taxes (eBIt) remained at cHF 20.4 mil-
lion, while the EBIT margin rose from 7.2 % to 7.5 %. For the first time, the EBIT figure included am-
ortisation relating to SAP, amounting to CHF 1.2 million for the second half of 2011. Profit for the
year increased by a considerable 26.1 %, up from cHF 14.4 million to cHF 18.2 million.

10
eBIt in % of net sales
0 5 10 15 20 2008 12.1
2009 1.3
2010 7.2
2011 7.5
eBItDA in cHF million
0 20 40 60 80 2008 58.2
2009 18.8
2010 35.8
2011 36.2
eBItDA in % of net sales
0 5 10 15 20 2008 16.3
2009 8.0
2010 12.6
2011 13.3
eBIt in cHF million
0 12 24 36 48 2008 43.4
2009 3.1
2010 20.4
2011 20.4
net sales Interroll Group in cHF million
0 100 200 300 400 2008 357.9
2009 234.0
2010 283.1
2011 271.9
R e v i e w o f t H e f i n a n c i a l y e a R

11
ordinary capital expenditure in cHF million
0 10 20 30 40 2008 22.4
2009 22.9
2010 27.4
2011 19.6
Return on equity in %
0 10 20 30 40 2008 26.5
2009 4.3
2010 11.1
2011 13.4
Operating cash flow in CHF million
0 20 40 60 80 2008 41.9
2009 20.4
2010 18.7
2011 14.5
Result in cHF million
0 10 20 30 40 2008 33.8
2009 5.7
2010 14.4
2011 18.2
R e v i e w o f t H e f i n a n c i a l y e a R
Average number of employees
0 500 1000 1500 2000 2008 1315
2009 1206
2010 1255
2011 1340

12
R e v i e w o f t H e f i n a n c i a l y e a R
financial position
The financial position of the Interroll Group remains solid, as illustrated by the balance sheet
figures for the year under review. At the end of 2011, equity amounted to CHF 143.3 million (end
of 2010: cHF 127.5 million); the equity ratio stood at 59.9 % (end of 2010: 60.3 %). Investments
in non-current assets totalled cHF 19.6 million in the reporting year. they included, primarily, the
continued roll-out of an sAP project that is of particular strategic importance to the company,
as well as final extension work on the Centre of Excellence for Conveyor Rollers in Wermelskirchen
(D) and the replacement of production systems.
Current assets increased on the back of revenue growth and as a result of the significant level of
order backlog and was one of the reasons for the rise in net debt (from cHF 12.9 to cHF 17.6 mil-
lion). Cash flow from operating activities totalled CHF 14.5 million (2010: CHF 18.7 million).
overview according to product groups
As part of the newly introduced Group structure, which came into effect at the beginning of 2011,
Interroll discontinued the use of business units and made appropriate adjustments to Group
management. this decision had been announced by the company as early as 22 october 2010
(cf. Interroll Annual Report 2010, corporate Governance section). Instead of business units, the
Group now focuses on its revenue-generating product groups. Investment funds and HR resources
are allocated to these strategic product groups solely on the basis of their market potential.
product group “drives”
the Drives product group (motors and drives for conveyor systems) generated sales of cHF 95.1
million in the year under review (2010: cHF 97.9 million). expressed in local currency, sales
rose by 8.4 %. order intake stood at cHF 98.0 million, compared to cHF 100.7 million in the
previous year. the company’s RollerDrive ec310 and synchronous Drum Motor, both of which are
new products featuring recently developed intelligent control units, continued to capture market
share over the course of the reporting period. As sales volumes have shown, Interroll’s RollerDrive
EC310 meets the full range of market requirements. Designed for energy-efficient conveyor
systems, the RollerDrive was even honoured with the MM-Logistik Award at the world’s leading
Product group “Drives” (left) and product group “Rollers”.

13
R e v i e w o f t H e f i n a n c i a l y e a R
logistics trade fair ceMAt in Germany. What is more, the new control units used in conjunction
with this product received the coveted iF Product Design Award 2011. the professional solution for
24 V drive technology represents an end-to-end concept and has the potential to emerge as
a benchmark within the industry. At the same time, the new synchronous Drum Motor is gradually
establishing itself within the market, particularly in the area of food production, in automated
industrial applications and in the field of logistics. The new generation of Drum Motor has been en-
gineered to handle a wide range of conveyor movements and is thus tailored to the requirements
of fully managed throughput performance.
In the United States, Interroll continued to press ahead with its efforts to penetrate the food
production market and secured new accounts for Drum Motors.
The solution developed specifically for checkout systems – including Drum Motors that are
pre-assembled in ready-to-install cartridges – was one of the highlights of the global euroshop trade
fair. The cartridge-based solution generated encouraging sales in Europe and partially offset the
contraction in the company’s Us business within the area of conventional Drum Motors for check-
out systems. the centre of excellence for checkout counter Motors, based in Denmark, devel-
oped very well in the period under review and shows encouraging business potential for the future.
product group “Rollers”
sales generated by the Rollers product group grew from cHF 79.2 million in 2010 to cHF 83.2
in 2011. Expressed in local currency, sales significantly rose by 16 %. In parallel, order intake
expanded year on year, from cHF 81.8 million to cHF 86.7 million. In europe, Interroll saw Roller
sales rise by 7 %, while the Asian market generated growth of 12.7 %. In the United states,
meanwhile, the Group managed to secure a new contract as an outsourcing partner for the pro-
duction of conveyor rollers. Interroll produces approx. 10 million conveyor rollers each year
and is acknowledged as the world’s leading manufacturer of specialist rollers. this is a tribute to
Group investments of more than cHF 10 million at the centre of excellence in Wermelskirchen (D)
over the last three years as well as the considerable market success of Interroll-engineered rollers.
the rollers are manufactured on a just-in-time basis and can be delivered worldwide within
24 hours – even in the case of small batch sizes of just two to three conveyor rollers. Delivering
higher speeds and enhanced running smoothness, the new conveyor roller generation has
established itself well within the marketplace.
product group “conveyors & sorters”
sales within the conveyors & sorters product group stood at cHF 42.8 million at the end of the
year under review (2010: cHF 52.1 million). At cHF 51.2 million, order intake was slightly up on the
previous year’s figure (2010: CHF 51.0 million); expressed in local currency, it grew by 12.4 %.
Online trading has been identified as one of the key growth drivers for Sorters, as this area of busi-
ness is dependent on efficient distribution centres for dispatch and returns handling. The newly
established regional centre of excellence in china celebrated a major milestone in 2011. the very
first Sorter assembled at the site is destined for the Chinese postal service. The subsidiaries in
Korea and Brazil secured initial contracts for sorters. Meanwhile, singapore Post took delivery of
an Interroll sorter.

14
R e v i e w o f t H e f i n a n c i a l y e a R
Within the area of airport security, Interroll companies based in the Us secured large-scale
contracts for Intelliveyor conveyor modules designed to increase passenger throughput within the
security zones. Interroll also acquired another conveyor system project within the security segment
for newly established Berlin-Brandenburg Airport.
product group “pallet & carton flow”
The Pallet & Carton Flow product group generated sales of CHF 50.8 million in the financial year
under review (2010: cHF 53.9 million). expressed in local currency, sales rose by 4.3 %. order
intake totalled cHF 52.8 million, which corresponds to an increase of 13.2 % expressed in local
currency.
In europe, business relating to carton Flow products was close to the level recorded in 2008.
Within this area, the company’s new roller tracks for improved throughput of totes in picking racks
captured a significant share of the market. Manufactured in Canada, Pallet Flow and Carton
Flow products supplied to the Us came under increased pressure as a result of the unfavourable
exchange rate. In response, Interroll is currently assessing the possibility of relocating central
production from canada to the United states and retaining a production site in canada to serve
the local market.
the dynamic storage contracts secured by Interroll in connection with projects at Red Bull
and Procter & Gamble are to be seen as a solid foundation for future business development. With
references such as these, the company looks set to benefit from growing demand for Interroll-
engineered material handling solutions among customers served by system integrators and plant
manufacturers.
Interroll again attended the world’s leading trade fair for internal logistics, ceMAt, where it show-
cased a range of new products tailored to the needs of high-performance distribution logistics
of the next generation. these include new dynamic storage modules, safety separators and speed
controllers for large-scale volumes in pallet flow storage systems. Working in close cooperation
with universities in Germany and china, Interroll launched an academic research project relating
to distribution centres. As part of this project, those involved will develop a special evaluation
program that is capable of calculating various scenarios for the optimisation of new facilities and
refurbished centres, as well as providing relevant data in support of investment decisions and
outlining the benefits of Interroll flow storage solutions.
Product group «Pallet & Carton Flow» for flow storage and commissioning (left) and product group “Conveyors & Sorters” with crossbelt sorters, belt curves (picture on the right) and other conveying units.

15
R e v i e w o f t H e f i n a n c i a l y e a R
product management and innovation
As part of the company’s new organisational structure, the area of global product management,
which is of particular strategic importance, was brought together as a team and assigned
to Dietmar Hager as Head of Global Product Management. Having covered various product
segments within the company and having held a number of managerial posts, Dietmar Hager
possesses demonstrable experience relating to Interroll. the Head of Global Product Management
reports directly to the Head of Global Products & technology at Group Management level.
Based in Wassenberg, to the west of Düsseldorf, the Interroll Research centre (IRc) launched a
research study into the development of 24 V RollerDrives of the next generation. The IRC also
completed its new concept for a new roller curve for light-duty applications, which is to be imple-
mented at production level by the centre of excellence for convey Rollers over the course of
the year. the IRc is focused entirely on innovation and is responsible for developing new products,
methods and technology in close cooperation with the Interroll centres of excellence, the Global
Product Management team and sales.
Its R&D efforts are governed by issues such as energy efficiency, hygiene standards, the use of
new materials, system intelligence and noise levels, the aim being to develop solutions that deliver
tangible benefits in key areas within the field of internal logistics. The IRC underwent restructuring
in the period under review, with the express purpose of streamlining its research activities.
Innovation from the Interroll Research centre located in Wassenberg (Germany). Hygiene: High-pressure washdown in the food processing industry.
16
R e v i e w o f R e g i o n a l p e R f o R M a n c e
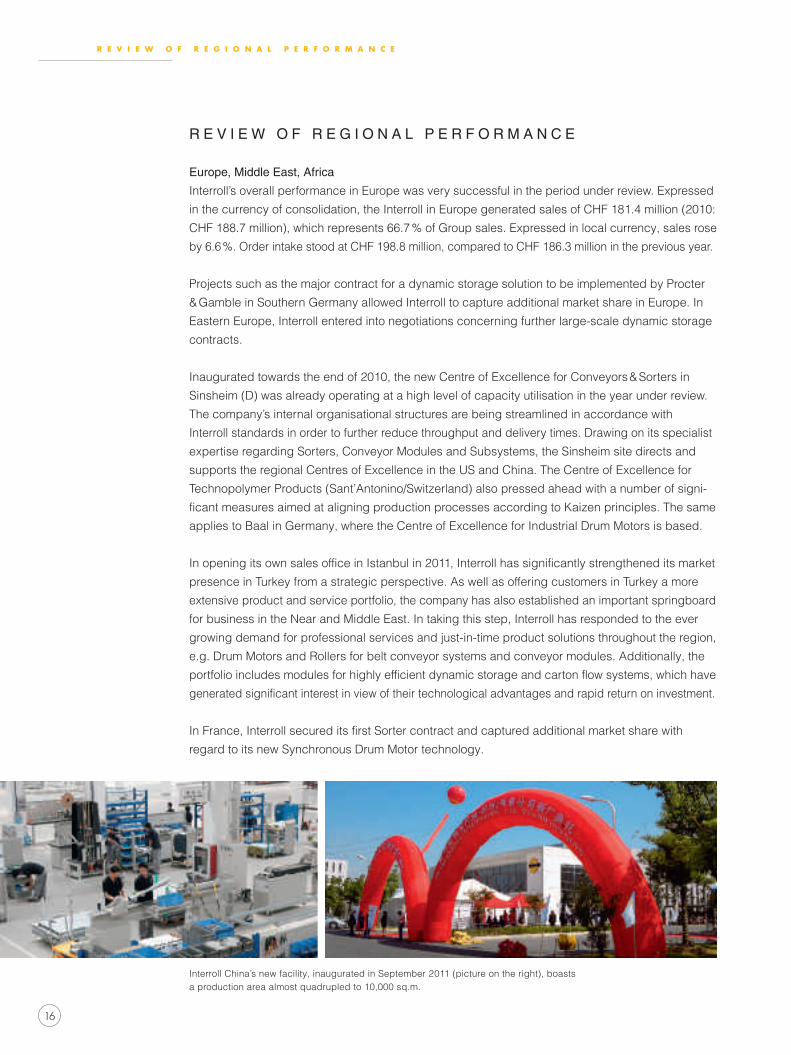
Interroll china’s new facility, inaugurated in september 2011 (picture on the right), boasts a production area almost quadrupled to 10,000 sq.m.
R e v i e w o f R e g i o n a l p e R f o R M a n c e
europe, Middle east, africa
Interroll’s overall performance in europe was very successful in the period under review. expressed
in the currency of consolidation, the Interroll in europe generated sales of cHF 181.4 million (2010:
cHF 188.7 million), which represents 66.7 % of Group sales. expressed in local currency, sales rose
by 6.6 %. order intake stood at cHF 198.8 million, compared to cHF 186.3 million in the previous year.
Projects such as the major contract for a dynamic storage solution to be implemented by Procter
& Gamble in southern Germany allowed Interroll to capture additional market share in europe. In
eastern europe, Interroll entered into negotiations concerning further large-scale dynamic storage
contracts.
Inaugurated towards the end of 2010, the new centre of excellence for conveyors & sorters in
sinsheim (D) was already operating at a high level of capacity utilisation in the year under review.
the company’s internal organisational structures are being streamlined in accordance with
Interroll standards in order to further reduce throughput and delivery times. Drawing on its specialist
expertise regarding sorters, conveyor Modules and subsystems, the sinsheim site directs and
supports the regional centres of excellence in the Us and china. the centre of excellence for
technopolymer Products (sant’Antonino/switzerland) also pressed ahead with a number of signi-
ficant measures aimed at aligning production processes according to Kaizen principles. The same
applies to Baal in Germany, where the centre of excellence for Industrial Drum Motors is based.
In opening its own sales office in Istanbul in 2011, Interroll has significantly strengthened its market
presence in Turkey from a strategic perspective. As well as offering customers in Turkey a more
extensive product and service portfolio, the company has also established an important springboard
for business in the near and Middle east. In taking this step, Interroll has responded to the ever
growing demand for professional services and just-in-time product solutions throughout the region,
e.g. Drum Motors and Rollers for belt conveyor systems and conveyor modules. Additionally, the
portfolio includes modules for highly efficient dynamic storage and carton flow systems, which have
generated significant interest in view of their technological advantages and rapid return on investment.
In France, Interroll secured its first Sorter contract and captured additional market share with
regard to its new synchronous Drum Motor technology.
17
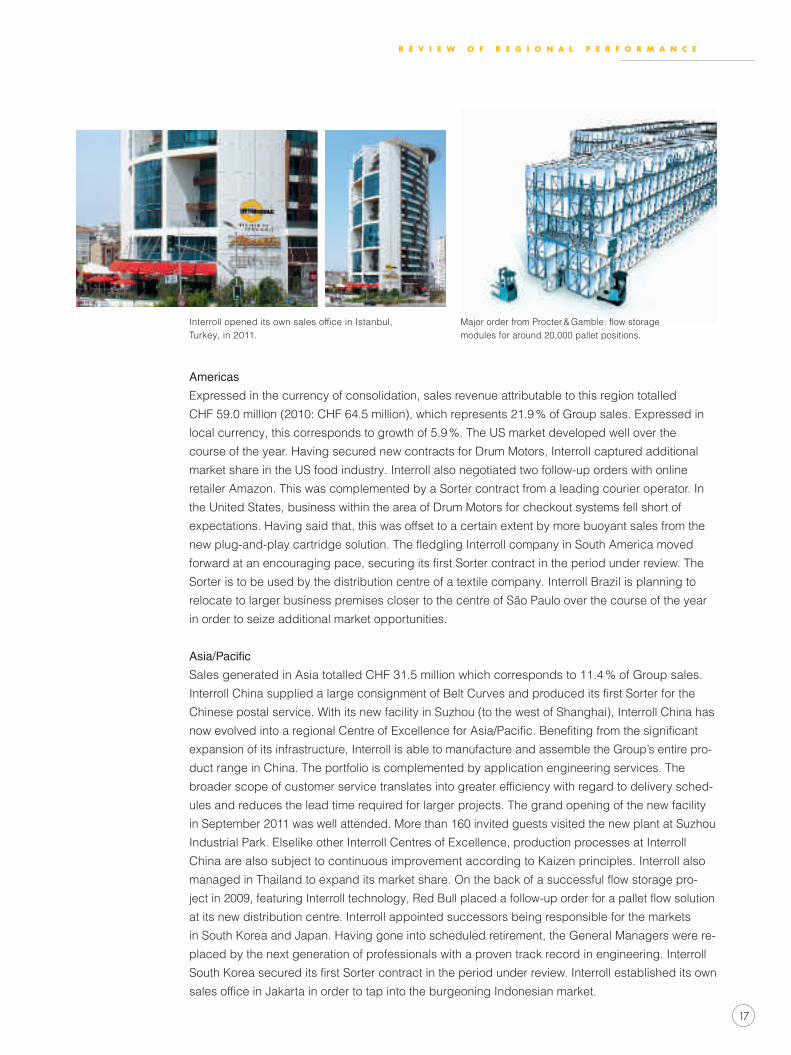
R e v i e w o f R e g i o n a l p e R f o R M a n c e
americas
expressed in the currency of consolidation, sales revenue attributable to this region totalled
cHF 59.0 million (2010: cHF 64.5 million), which represents 21.9 % of Group sales. expressed in
local currency, this corresponds to growth of 5.9 %. the Us market developed well over the
course of the year. Having secured new contracts for Drum Motors, Interroll captured additional
market share in the Us food industry. Interroll also negotiated two follow-up orders with online
retailer Amazon. this was complemented by a sorter contract from a leading courier operator. In
the United states, business within the area of Drum Motors for checkout systems fell short of
expectations. Having said that, this was offset to a certain extent by more buoyant sales from the
new plug-and-play cartridge solution. The fledgling Interroll company in South America moved
forward at an encouraging pace, securing its first Sorter contract in the period under review. The
sorter is to be used by the distribution centre of a textile company. Interroll Brazil is planning to
relocate to larger business premises closer to the centre of são Paulo over the course of the year
in order to seize additional market opportunities.
Asia/Pacific
sales generated in Asia totalled cHF 31.5 million which corresponds to 11.4 % of Group sales.
Interroll China supplied a large consignment of Belt Curves and produced its first Sorter for the
chinese postal service. With its new facility in suzhou (to the west of shanghai), Interroll china has
now evolved into a regional Centre of Excellence for Asia/Pacific. Benefiting from the significant
expansion of its infrastructure, Interroll is able to manufacture and assemble the Group’s entire pro-
duct range in china. the portfolio is complemented by application engineering services. the
broader scope of customer service translates into greater efficiency with regard to delivery sched-
ules and reduces the lead time required for larger projects. the grand opening of the new facility
in september 2011 was well attended. More than 160 invited guests visited the new plant at suzhou
Industrial Park. elselike other Interroll centres of excellence, production processes at Interroll
china are also subject to continuous improvement according to Kaizen principles. Interroll also
managed in Thailand to expand its market share. On the back of a successful flow storage pro-
ject in 2009, featuring Interroll technology, Red Bull placed a follow-up order for a pallet flow solution
at its new distribution centre. Interroll appointed successors being responsible for the markets
in south Korea and Japan. Having gone into scheduled retirement, the General Managers were re-
placed by the next generation of professionals with a proven track record in engineering. Interroll
South Korea secured its first Sorter contract in the period under review. Interroll established its own
sales office in Jakarta in order to tap into the burgeoning Indonesian market.
Interroll opened its own sales office in Istanbul, turkey, in 2011.
Major order from Procter & Gamble: flow storage modules for around 20,000 pallet positions.
18
e M p l o y e e s
At a corporate level, the year under review was dominated by the introduction of the Group’s
new organisational structure. It is a testament to the exceptional, hands-on commitment of our em-
ployees around the globe that we were so successful in achieving this strategic objective. the
measures to be implemented proved particularly challenging to our sales teams, who had to fami-
liarise themselves with the company’s new marketing approach within the shortest of time frames.
The company’s product portfolio is marketed to specific customer groups in accordance with their
principal requirements: system integrators, plant manufacturers and operators of internal logis-
tics systems. In order to ensure the swift and effective execution of this “paradigm shift”, a number
of workshops were also organised at the Interroll Group headquarters in sant’Antonino.
In Europe, the SAP project called for a committed contribution by all those involved. The first mile-
stone was achieved at the beginning of July 2011: in line with the schedule set out for the project,
some 500 members of staff from 13 Interroll companies in ten European countries were able to use
SAP for the first time. An international team of SAP experts based at Interroll’s headquarters in
sant’Antonino, switzerland, provide dedicated support for all matters relating to the new eRP system.
education and training
In addition to providing training courses in Europe, the Interroll Academy significantly extended its
portfolio in Asia in the year under review. Among the new additions to the programme were seminars
focusing on the recently launched Synchronous Drum Motor. Staff in Europe thus have extensive
access to training courses relating to products within the “Drives” and “Rollers” product groups and
the associated intelligent control units. In Asia, meanwhile, the company’s training programme
on Drum Motors was complemented by courses (in chinese and english) focusing on conveyor
rollers. In total, the Interroll Academy conducted 19 training courses, which corresponds to 82 days
of training in total. At the end of 2011, the Academy was serving more than 700 registered users
via its distance-learning platform. the online courses cover a range of subjects, from technical is-
sues to the use of Microsoft Office applications, language skills and a “video of the week”. At the
beginning of the year under review a monthly e-newsletter was added to the list of services provid-
ed for employees within the Group.
e M p l o y e e s
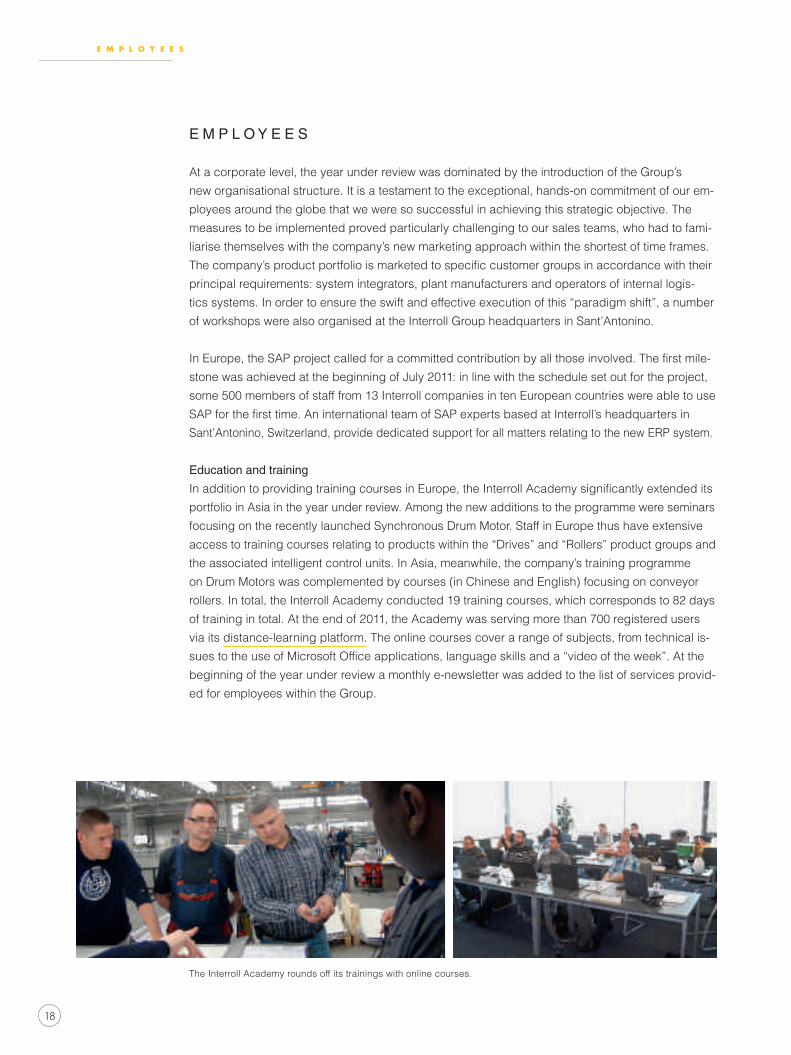
The Interroll Academy rounds off its trainings with online courses.
19
g R o w t H d R i v e R s
g R o w t H d R i v e R s
Interroll’s markets offer attractive prospects for growth. In the medium and long term, a whole
series of global megatrends should generate greater potential demand for Interroll solutions.
population growth
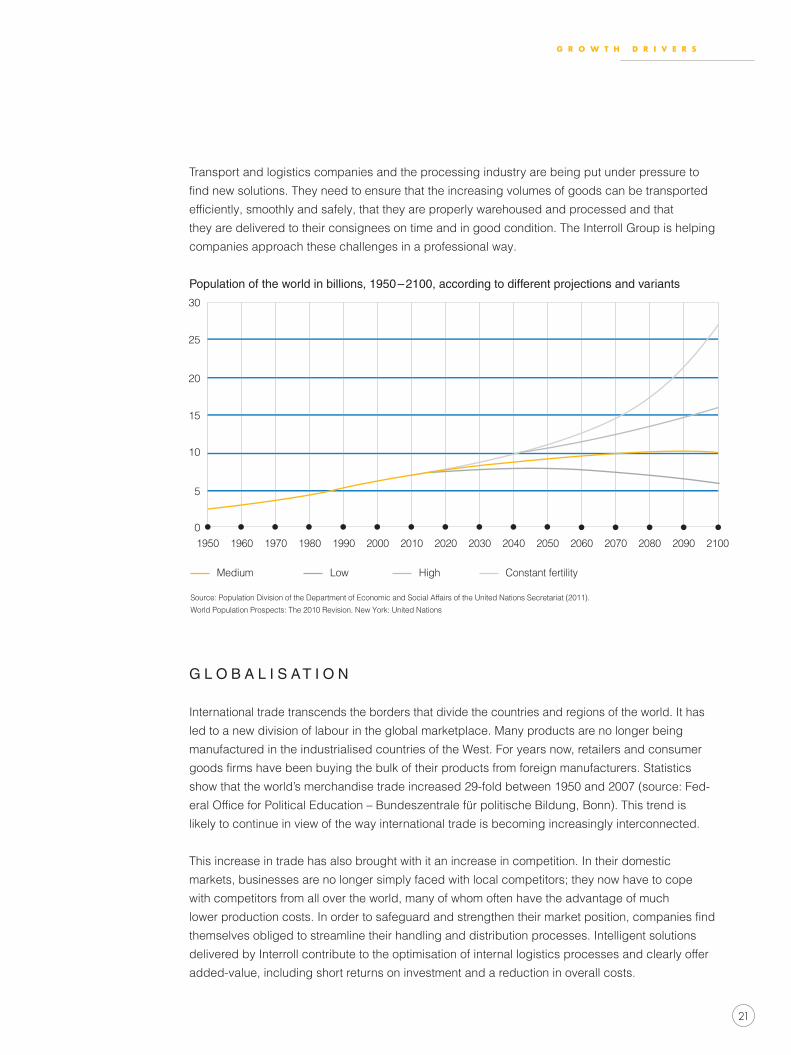
the global population continues to expand and is set to reach eight billion by the year 2025. All
these people need to be supplied with food and other goods, and this in turn creates the need for
a functioning infrastructure in their countries. Above all, population growth in major conurbations
places great demands on the distribution of goods and not just in the food industry. the demand
for innovative baggage/freight conveyor solutions and safety technology rises every time a
new airport is built, and in India alone there are plans to build or expand five hundred airports
by the year 2020.
globalization
With regard to global trade, there will be a further move towards differentiation in the division of
labour. this trend will not only boost trade but also intensify competition. In order to safeguard and
expand their market position, companies will have to make ongoing improvements to their produc-
tion, processing and logistics systems. crucially, achieving this will require intelligent intralogistics.
According to expert assessments, emerging countries are set to play a bigger role as sales mar-
kets for the established industrialised states and not simply remain a source of goods and materials.
Functioning logistical structures will play a vital role as the backbone of future eRP systems.
sustainability
sustainability, resource scarcity and climate change are some of the biggest issues we face today.
More and more companies are taking steps to protect the environment by using resources more
efficiently and reducing their energy profile. They are also demanding similar action from their sup-
pliers. In our globalised world, the challenge is to organise the movement of goods and people
on an ever-bigger scale in a way that is compatible with our resources. co2 emissions can be re-
duced significantly using energy-saving technology. As a leader in the field of innovation and
technology, the Interroll Group is well placed to take advantage of this market context.
internet shopping
the expansion of broadband networks in the industrialised world and in the major cities of the
developing world allows more and more people to order the products they need online. this boom
in online trading not only generates more revenue; it also provides a challenge to manufacturers,
retailers and the logistics industry in terms of procurement, storage, sorting, shipping and returns
management. Efficient warehouse logistics are crucial if companies are to deal with increasing
product diversity and faster throughput.
> Read more about these trends in the following chapters.

20
g R o w t H d R i v e R s
p o p u l at i o n g R o w t H
the earth’s population is currently growing by 80 million people every year, and, in october 2011,
the UN officially welcomed the birth of the world’s seven billionth baby. Within the next ten years,
India (current population 1.2 billion) is set to overtake china (current population 1.3 billion) as the
most populous country in the world. the Un estimates that, by 2025, the earth’s population will
have increased to 8 billion, with the 9 billion mark being hit by 2050.
this growth is mainly being driven by the high birth rates in Asia and Africa, where the major cities
are experiencing massive population explosions. soaring population numbers are also fuelling
demand for everyday commodities. one of these is food, which needs to be distributed with greater
speed and efficiency. In the industrialised nations, there is a growing trend towards convenien-
ce products and portion packaging for food, whereas the emerging countries are more focused on
improving standards of hygiene. this opens up a large market for modern conveyor systems that
will help to meet these needs.
growing consumerism in emerging countries
While the industrialized nations are battling with their debt crises, the emerging countries, with
their huge populations, are booming. Millions of people are working their way up the social ladder
and beginning to reap the rewards associated with a higher disposable income. In Brazil, around
half of the population can now be described as middle or upper-class, and their consumer needs
and desires are growing accordingly. A well-developed logistics infrastructure is essential for the
efficient distribution of these goods.
International air travel keeps on growing: Beijing International Airport underwent huge expansion
in 2008, but with 74 million passengers passing through its doors in 2010, it is already close to
reaching its capacity of 76 million. By 2015, the chinese government is planning to build 45 new
airports, extend a further 88 and relocate another 20. In its “Vision 2020”, the Indian government
is aiming to build or expand around 500 airports, at an estimated cost of 50 billion Us dollars. this
will increase international demand for freight and baggage handling systems. Freight security
requirements are also increasing, which also serves to intensify demand for freight handling systems.
21
g R o w t H d R i v e R s
transport and logistics companies and the processing industry are being put under pressure to
find new solutions. They need to ensure that the increasing volumes of goods can be transported
efficiently, smoothly and safely, that they are properly warehoused and processed and that
they are delivered to their consignees on time and in good condition. the Interroll Group is helping
companies approach these challenges in a professional way.
population of the world in billions, 1950 – 2100, according to different projections and variants
g l o b a l i s at i o n
International trade transcends the borders that divide the countries and regions of the world. It has
led to a new division of labour in the global marketplace. Many products are no longer being
manufactured in the industrialised countries of the West. For years now, retailers and consumer
goods firms have been buying the bulk of their products from foreign manufacturers. Statistics
show that the world’s merchandise trade increased 29-fold between 1950 and 2007 (source: Fed-
eral Office for Political Education – Bundeszentrale für politische Bildung, Bonn). This trend is
likely to continue in view of the way international trade is becoming increasingly interconnected.
this increase in trade has also brought with it an increase in competition. In their domestic
markets, businesses are no longer simply faced with local competitors; they now have to cope
with competitors from all over the world, many of whom often have the advantage of much
lower production costs. In order to safeguard and strengthen their market position, companies find
themselves obliged to streamline their handling and distribution processes. Intelligent solutions
delivered by Interroll contribute to the optimisation of internal logistics processes and clearly offer
added-value, including short returns on investment and a reduction in overall costs.
Source: Population Division of the Department of Economic and Social Affairs of the United Nations Secretariat (2011).
World Population Prospects: The 2010 Revision. New York: United Nations

22
g R o w t H d R i v e R s
logistics infrastructure for fast-growing cities
experts believe that, in future, the newly industrialised countries will not only supply goods
to the Western industrialized nations but will themselves become sales markets. there is already a
growing middle class in china. these people have money in their pockets, and they are keen to
spend it on Western brands. the chinese government is also trying to boost domestic consump-
tion. According to a 2011 study carried out by Pricewaterhousecoopers International Limited
(PwCIL) entitled “Logistics in China: An All-Inclusive Market?”, logistics will be the catalyst for this
expansion. Industry experts are working on the assumption that, by 2015, china will have over-
taken the UsA as the world’s largest food market. In china, it has taken just ten years for new retail
formats such as supermarkets, hypermarkets and convenience stores to establish themselves
alongside more traditional types of stores, particularly in the major cities. Retailers are now starting
to roll out these formats into the country’s more remote provinces.
this kind of rapid expansion in the newly industrialised countries has one primary requirement:
functioning logistics structures and processes that form the basis of inventory management
systems. Interroll is systematically pursuing a globalisation strategy in order to tap into this potential
for growth. since 2000, it has set up ten local production and service facilities in its key markets
around the world, including Japan, Korea, India, Brazil, china and turkey.
s u s ta i n a b i l i t y
Protection of the environment, the scarcity of resources and climate change are some of the most
pressing issues facing our society today. sustainable development means preserving an intact
ecological, social and economic system so that it is possible to meet the needs of the present
without compromising the ability of future generations to meet their own needs. this has now be-
come a global challenge.
the need for action in the logistics sector
In the EU alone, around one-fifth of carbon dioxide (CO2) emissions are currently produced by the
logistics sector, and the trend is upward. Globalisation, the boom in e-commerce and rapid po-
pulation growth in the emerging countries mean that there are more and more goods in circulation.
Interroll flow storage in Shanghai, China (left), and Seoul, South Korea.

23
g R o w t H d R i v e R s
According to forecasts by the Research Institute for Innovative technology for the earth, over
the next few decades, emerging nations such as china, India and Brazil will produce more green-
house gases than the industrialised nations as a result of their booming economies (see chart).
sustainability is a major social trend. In future, we can expect to see a plethora of rules and regu-
lations being imposed on businesses and consumers alike. But many companies are already taking
steps to protect the environment, use resources more efficiently, save energy and avoid waste,
and they are increasingly expecting their suppliers and business partners to do the same. Intro-
ducing such measures to improve sustainability and save resources not only helps them reduce
costs, but also helps to increase their competitiveness and improve their lending profiles.
forecast of energy-generated co2 emissions worldwide
source: Research Institute of Innovative technology for the earth, RIte
In an Interroll flow storage application pallets roll from the loading to the unloading side – safely and using gravity force. Interroll RollerDrives ec310 recover brake energy.
30 %
40 %
50 %
60 %
10 %
20 %
1990 1995 2000 2005 2010 2015 2020 2025 2030 2035 2040 2045 2050
Other
BrazilIndia
China
USA
Countries obliged to reduce

24
g R o w t H d R i v e R s
new materials-handling technologies help to save energy
sustainability in logistics will play a key role in the future. In a globalised world, the challenge
is how to move growing numbers of goods from A to B in an efficient and energy-saving way. In
terms of transportation, co2 emissions can be lowered by increasing efficiency and reducing
volumes. According to research carried out by the Fraunhofer Institute for Material Flow and Logis-
tics (IML) in Dortmund, energy savings of up to one-third can be made by improving drivetrain
technologies. With its overall focus on the efficient use of resources, the Interroll Group is perfectly
placed to profit from this trend towards sustainability.
Anteil der Personen, die über das Internetgekauft haben (in %), 20101
Norwegen
Dänemark
Niederlande
Vereinigtes Königreich
Schweden
Luxemburg
Deutschland
Finnland
Frankreich
Österreich
EU 27
Belgien
Malta
Irland
Slowakei
Polen
Tschechische Republik
Prozentanteil der Personen, die im letzten Jahr Waren
oder Dienstleistungen für den privaten Gebrauch über
das Internet bestellt haben bzw. erworben haben.
Befragt wurden Personen zwischen 16 und 74 Jahren.
> chart refers to the following chapter “Internet shopping”

25
g R o w t H d R i v e R s
i n t e R n e t s H o p p i n g
Fast data transfer is the digital lifeline of international business. companies are connected to their
subsidiaries, partners and customers and can increasingly run their businesses digitally – around
the globe. the internet is growing in importance as a sales channel. there is a huge selection
of goods on offer; the products can be presented in multimedia fashion using a range of formats,
colours and forms, including photos, videos and additional information. the online shop is
open 24/7 and the goods are generally dispatched within one or two days. According to surveys
conducted by the technology association BItKoM, the norwegians are the most active online
shoppers, at 71 %, followed by the Danes, with 68 % of the population shopping online (see chart).
online shops need professional logistics solutions
More and more people are now able to shop online for goods and services, thanks to the spread
of the broadband network in industrialised nations and the major cities of the developing world.
According to the china Internet network Information center (cnnIc), over the last year the number
of internet users in china hit 513 million, an increase of 12 %. this places it well ahead of the
UsA, which has around 250 million users. However, when it comes to e-commerce, with 145
million customers, China is lagging slightly behind the USA’s figure of 170 million. A study by
Boston consulting suggests that this will change over the next few years. It claims that by 2015,
china will have 329 million online shoppers – more than any other nation in the world. the inter-
net offers access to products that are not available in local shops, and brick-and-mortar businesses
are often not in a position to adequately cover larger areas.
the rapid spread of the internet is leading to a boom in the global e-commerce market, thanks to
the worldwide penetration of mobile technology which allows people to shop while they are on
the move. It has also been boosted by social shopping services such as Groupon, which offers its
members discounts on specific goods. The US-based financial services firm JP Morgan has pre-
dicted that, this year, global e-commerce revenue will reach 963 billion Us dollars.
the boom in online shopping is not only increasing revenues but it is also presenting manufactur-
ers, retailers and the logistics sector with new challenges when it comes to procurement, ware-
housing, sortation, dispatch and returns management. The number of products on offer is growing,
while warehouse space at the point of sale is shrinking. this means it is absolutely essential to
find efficient warehousing and distribution solutions.
online orders need quick and accurate sortation processes for fast-moving food and non-food goods.
26
c u s t o M e R b e n e f i t s
R e t u R n s M a n a g e M e n t a s s u M e s g R o w i n g s i g n i f i c a n c e
E-commerce is one of the economy’s driving forces. The US-based financial services firm JP Morgan
has predicted that, this year, global e-commerce revenue will reach nearly one billion Us dollars.
But online shopping brings with it a high volume of returns, which vary depending on the specific
sector and the particular laws of each country. textiles have a particularly high returns rate. Almost
half of all textile goods ordered are returned by the customer. By contrast, the rate for electronic
goods and computers is between 10 and 15 %. Professional returns management, involving the
creation of an additional goods inward procedure, presents a major challenge for online retailers.
the challenge of high returns rates
Internal logistics plays a key role in this respect and is an important factor when competing for
customers. Industrialised countries and emerging nations alike need to make considerable invest-
ment in expanding and improving their warehousing solutions. According to a study carried out
by Boston consulting, by 2015, china will have 329 million online shoppers – more than any other
country in the world. The internet offers access to products that are not available in local shops,
and brick-and-mortar businesses are often not in a position to adequately cover larger areas. But
china’s boom in online shopping will also inevitably lead to high volumes of returns.
online shopping boosts the business of delivery companies, whether they are handling orders or
returns. Many countries have privatized their state-owned postal services, which now have to
compete for business with up-and-coming private delivery companies. They both find themselves
having to consolidate their market positions through increased automation of their sortation and
distribution processes.
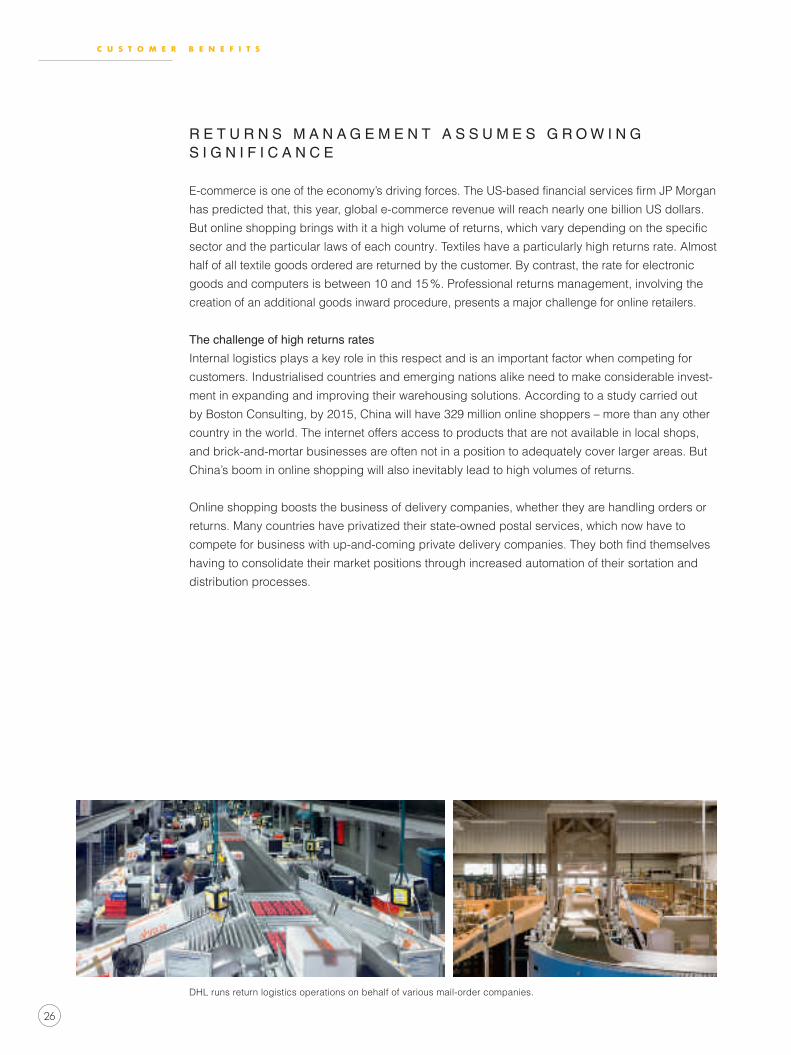
DHL runs return logistics operations on behalf of various mail-order companies.

27
c u s t o M e R b e n e f i t s
around the globe, systems integrators, parcel services and mail-order companies such as amazon
place their trust in interroll solutions
these companies can optimise their processes using modular systems with intelligent sortation
technology that is capable of handling both incoming and outgoing goods. Interroll is able to sup-
ply a complete modular system to provide online shops with an efficient and cost-effective solution
to their logistics and returns management challenges. Large global systems integrators, parcel
services and mail-order companies such as UPs and Amazon rely on Interroll’s sortation solutions.
They find that Interroll can supply the right sorters to meet all their needs and help them to man-
age their returns more effectively. Interroll provides cost-effective sortation and recovery solutions
that speed up the goods inward process. the same equipment can be used for sorting outgoing
goods and can also be used for picking, if required. Moreover, the mechanically-driven sorters
require low levels of investment, are inexpensive to operate and maintain, and benefit from low
energy consumption.
28
c u s t o M e R b e n e f i t s
u s i n g R e s o u R c e s e f f i c i e n t ly H e l p s c o M pa n i e s R e M a i n c o M p e t i t i v e
the latest market trends are having a positive impact on Interroll’s business, as demonstrated not
only by the favourable knock-on effects of returns management in e-commerce. Indeed, there is
currently strong pressure to modernise across virtually all sectors – a fact that compels operators
of logistics centres to take action. As well as needing to meet increasingly stringent technical
requirements in relation to improving working conditions and protecting the environment, for exam-
ple, the pressure of competition in general makes it necessary to put effective measures in place
to save energy, time and space.
Helping companies tackle this challenge is Interroll’s core mission – expressed in the slogan
“Inspired by Efficiency”. Products and solutions provided by Interroll enable companies to do busi-
ness more profitably, reduce their environmental footprint and generate sustainable growth.
A modular platform for maximum efficiency
Based on its modular platform strategy, Interroll provides tailored solutions which excel in terms
of efficiency and cost-effectiveness. An investment in an Interroll solution will typically pay for itself
in a maximum of two to three years. Interroll’s approximately 23,000 customers worldwide also
benefit from an ongoing continual process of innovation. With operations worldwide, the Interroll
Group continuously feeds expertise and applications knowledge acquired on countless reference
projects into ongoing product development.
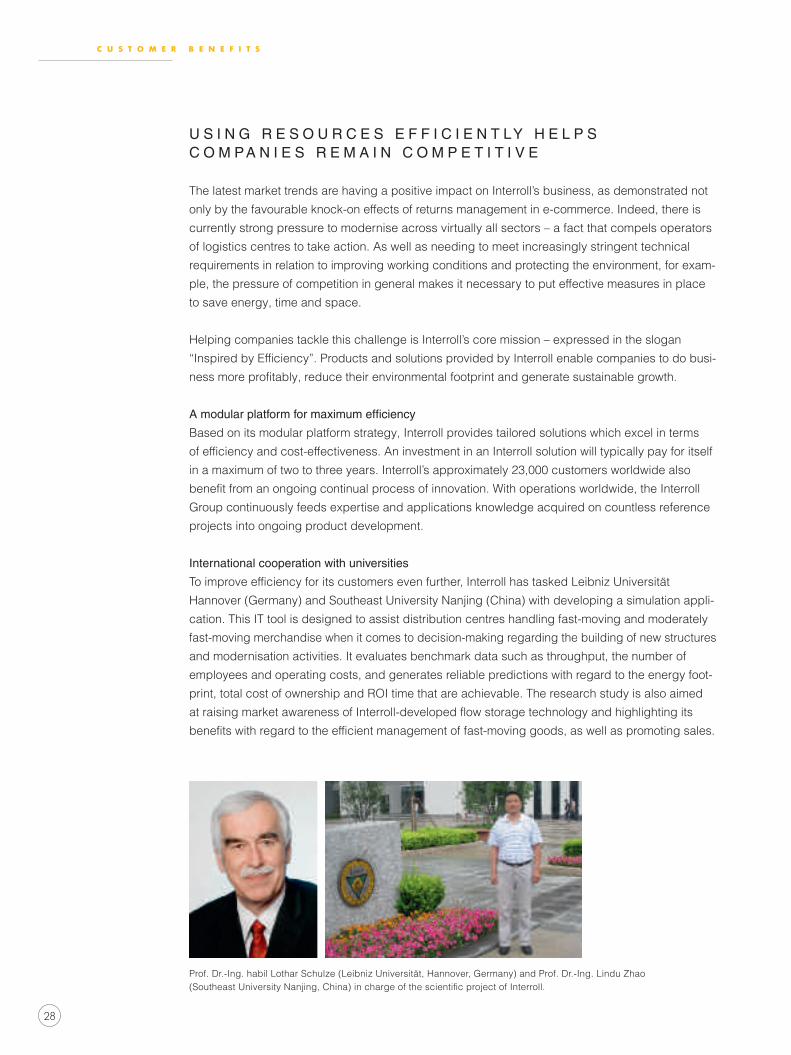
international cooperation with universities
To improve efficiency for its customers even further, Interroll has tasked Leibniz Universität
Hannover (Germany) and southeast University nanjing (china) with developing a simulation appli-
cation. this It tool is designed to assist distribution centres handling fast-moving and moderately
fast-moving merchandise when it comes to decision-making regarding the building of new structures
and modernisation activities. It evaluates benchmark data such as throughput, the number of
employees and operating costs, and generates reliable predictions with regard to the energy foot-
print, total cost of ownership and RoI time that are achievable. the research study is also aimed
at raising market awareness of Interroll-developed flow storage technology and highlighting its
benefits with regard to the efficient management of fast-moving goods, as well as promoting sales.
Prof. Dr.-Ing. habil Lothar schulze (Leibniz Universität, Hannover, Germany) and Prof. Dr.-Ing. Lindu Zhao (Southeast University Nanjing, China) in charge of the scientific project of Interroll.

29
c u s t o M e R b e n e f i t s
e x pa n d i n g e f f i c i e n t ly : R e t R o f i t t i n g i n t e R R o l l s o l u t i o n s
the right choice made in the past may not necessarily be the best option today. Keeping pace
with the competition means recognising the need to regularly review your company’s intralogistics
solution. In addition to changes associated with technological progress, there are many reasons
for adapting existing solutions. over time, business processes will change, product structures will
evolve and increased orders in smaller batch sizes, for example, may call for a completely differ-
ent way of working.
Modernisation rather than building new structures
As a rough guide – and depending on the industry – warehouses often become outdated in just
seven to ten years. Factors here include changing requirements, the fact that technical compo-
nents are no longer considered state-of-the-art solutions and general wear and tear as a result of
operations. Operating and process costs subsequently rise, while flexibility and competitiveness
decline. In many countries, there is added pressure to take action to improve the energy efficiency
of existing facilities based on new legislation.
Responding to these requirements appropriately does not always involve having to completely
redesign and build distributing systems. Updating, extending or retrofitting equipment in a timely
manner represents a cost-effective alternative to constructing expensive new facilities. Moder-
nisation activities allow potential for optimisation of up to 30 % to be exploited. this relates not just
to improvements in stock availability and a reduction in labour costs – with smart retrofit concepts
designed to meet future challenges it is possible to achieve significant gains in efficiency and flexi-
bility, as well as substantial energy savings.
Making better use of the available space
One example is Interroll’s involvement in installing a flow storage system for pallets as part of a
retrofit project for the US conglomerate Procter & Gamble at the logistics centre of its production
site in Crailsheim near Stuttgart (Germany). In order to speed up the flow of goods and signi-
ficantly increase warehouse occupancy, the existing pallets and drive-in racks were replaced with
rack technology and dynamic storage solutions provided by Mecalux/Interroll. the compact,
space- and energy-saving storage blocks store merchandise on unmixed pallets and on a first in,
first out basis in gravity roller lanes that are six Euro pallets deep. To optimise the flow of goods,
pallets are stored dynamically even as the goods are being received and when being prepared for
loading in the dispatch area. With a 4 % channel incline, Interroll dynamic storage modules make
use of gravity, allowing pallets to roll from the loading point to the unloading side with high precision
and in an energy-neutral way. this also enables merchandise to be stored in transit between
racks, thereby increasing storage capacity to 170 %.
Another example highlights the benefits of retrofitting a high-tech Sorter solution. At its logistics
centre in Pforzheim (Germany), mail-order company Klingel replaced its old system with a high-
tech crossbelt sorter solution while continuing to run its business throughout the process. As
a consequence, the home shopping retailer was able to achieve the increase in throughput that it
wanted by installing a space-saving, compact sorter configuration at its existing site. Every hour,
the system sorts up to 8,000 bags and parcels weighing between 0.2 and 10 kg. these kinds of
scalable conveyor sorter solutions can be integrated into existing facilities with ease and can be

30
c u s t o M e R b e n e f i t s
tailored precisely to the user’s range of merchandise and business processes as regards the
features to be incorporated. Their integration into retrofit projects boosts system availability and
reduces maintenance costs and downtime.
When retrofitting, the use of efficiency-optimised drives, lightweight components and combinations
of materials with low rolling resistance makes it easily possible to achieve double-digit percen-
tage reductions in energy consumption. optimisations made to the control hardware alone and to
the drives and sensors in materials handling components result in considerable improvements. on
older systems, these components have sometimes not been state-of-the-art for some time whereas
the mechanical transport components often remain in good condition.
improved performance, lower operating costs
By deploying Interroll RollerDrives, an intelligently managed conveyor system divided into zones
can be set up without needing to alter the basic system structure to any great extent. With average
throughputs of 600 to 1,000 containers per hour, a system modernised in this way will consume
up to 50 % less power than a conventional version where the drive motor runs continuously irrespec-
tive of throughput. the positive impact on operating costs and system service life yields a return
on investment in 12 to 36 months, depending on the specific operational situation.
Intelligently planned retrofit projects open up a number of options which allow optimal use to be
made of time, space, labour, energy and materials within even a short period. As a one-stop shop,
Interroll provides a complete portfolio of services ranging from assisting with project planning,
offering consulting advice on strategic issues and plant design through to support on rapidly fitting
key products for intralogistics.
Compared to building an entirely new storage and distributing system, the costs of retrofit projects
are significantly lower. A further benefit over new installations is that retrofit projects can be carried
out much more quickly, usually with minimal disruption to regular business operations.
Before (left) and after: cumbersome external drive station1) replaced by space-saving built-in Interroll Drum Motor 2).
1) 2)

31
i n s p i R e d b y e f f i c i e n c y
t H e s t R at e g y : “ i n s p i R e d b y e f f i c i e n c y ”
The motto ‘Inspired by Efficiency’ refers not only to the benefits customers can expect from Interroll
solutions; the company also places a strong emphasis on its own resource efficiency. For Interroll,
the efficient use of resources is the main precondition for maintaining and consolidating its techno-
logical and innovative pre-eminence – and that benefits customers and investors alike. Thanks
in no small part to this strategy, Interroll has been generating double-digit annual growth in per cent
in profit for the past decade, with the exception of 2009, the year of the financial crisis.
continual improvements to productivity
In order to utilise resources more effectively and ensure ongoing rises in productivity, Interroll has
implemented Kaizen – a principle based on the continual perfecting of established solutions – at a
number of its production facilities and centres of excellence. According to the Kaizen principle,
managers and staff play an equal part in relevant improvement processes. At Interroll, the Kaizen
approach is also applied extensively to the areas of sustainability and energy efficiency. The
concept of sustainability needs to be widely understood and applied across many fields, rather
than just affecting specific areas. At the same time, the focus must be on simple solutions.
shift-based delivery reliability exceeds 98 %
Processes have been systematically reviewed and safety standards raised enormously; shift-based
delivery reliability has risen to over 98 % in the conveyor rollers area. Moreover, a thoroughly
rehearsed process extending from the supply chain to production and delivery is significantly
reducing cost-intensive stock levels, which would otherwise amount to nothing more than
dormant capital. Interroll is now gradually extending the kaizen approach from production level
to the area of office administration.
strategic investment in training
Interroll also founded the Interroll Academy with a view to optimising resources over the long term.
By promoting the advancement of staff members, the internal training centre, which was set up
in 2008, is helping the Interroll Group to implement its long-term growth strategy – and its success
proves the concept is the right one. to a very high degree, Interroll has optimised and profession-
alised its internal know-how, thereby ensuring the needs of a wide range of customers can be met.

32
i n n o v a t i o n i n M a n u f a c t u R i n g
“ t H e e n d u R a n c e o f t H e l o n g - d i s ta n c e R u n n e R ”
Kaizen, an established principle in the Japanese culture of management and quality, also forms
the basis of the Interroll Production system (IPs). Armin Lindholm (Managing Director of Interroll’s
centre of excellence for RollerDrives and conveyor Rollers), Ralf Dorok (Head of Production,
Process Planning and Health & safety) and Peter trapkowski (tPM Manager and Head of Main-
tenance) explained how the principle of Kaizen works in practice.
what is the principle behind Kaizen?
Armin Lindholm: Kaizen is a principle of management introduced by the Japanese automobile in-
dustry in the first half of the 20th century. the term is derived from the Japanese words kai (meaning
“change”) and zen (“for the better”). The basic idea is that small steps can lead to big changes.
How does that approach actually improve processes in a company?
Peter trapkowski: First of all, Kaizen is a strategy of improvement through small steps. this makes
the process of change simpler while also raising acceptance and motivation amongst employees.
secondly, the integrated approach of Kaizen draws together the whole workforce and every
aspect of a company that impacts on the bottom line – logistics, safety, quality, costs, technology
and the environment. It also takes account of partners, suppliers and customers. thirdly, Kaizen
is not static. It is a dynamic concept that embraces profitability as part of the process.
so a company should be regarded from the viewpoint of its processes?
Armin Lindholm: Actually it’s our employees who advance the processes – they come up with
ideas for improvements and find new ways of working, and they consider themselves responsible
for the outcomes. this means higher levels of motivation and discipline, which in turn enhances
the general working environment and makes a company like Interroll a highly attractive employer
as well as a very reliable business partner.
How was Kaizen implemented at interroll?
Peter trapkowski: As we know, companies often meet with internal resistance when they introduce
new working practices. In many cases, opposition is based on ignorance or mistaken percep-
tions. that’s why from the outset, we brought the machine operators and production engineers into
the process along with the managers. After all, the employees are pivotal to the creation of value
within the company.
what were the actual steps that you took?
Armin Lindholm: The first step was to tidy up the production areas properly and give the processes
a clear and neat structure. this revealed the waste that had been in the system. We then carried
on simplifying the processes while introducing solution platforms, thereby cutting set-up times sig-
nificantly and making our purchasing procedure more efficient. We have implemented Kaizen
methods in the office area too in much the same way.
so once a process has been set in motion, it can be left to its own devices?
Ralf Dorok: It’s not quite that easy. In a lot of areas, improvements to productivity and a more effi-
cient use of resources came about pretty much automatically, that’s true. However, to maintain the

33
i n n o v a t i o n i n M a n u f a c t u R i n g
standards of quality we have achieved, Interroll is still working with the Kaizen Institute and offering
ongoing training to the various teams. We also carry out regular audits and workshops, both
scheduled and unscheduled.
How are customers responding to the changes?
Armin Lindholm: thanks to the improve ments we’ve made, Interroll customers can count on
top-notch quality as well as reliable deliveries and exact quantities across all batch sizes – and
customers are well aware of this. A number of companies have outsourced their production
to us, and we are currently manufacturing Rollers for clients in europe and the UsA as an out-
sourcing partner.
How do you see future developments?
Armin Lindholm: Kaizen has enabled us to introduce just-in-time production. Moreover, our
production processes and the entire supply chain are very well coordinated. this means we are in
a position to meet the needs of customers at all times, achieve maximum efficiency and even
enhance the supply chains of our clients for the long term. there’s still a long way to go – we intend
to carry on finding things to optimise and realising improvements. The concept is all about
corporate growth over the long term. Achieving our goals is not a sprint – we are going to need
the endurance of a marathon runner.
Kaizen at Interroll: Ralf Dorok (left), Armin Lindholm (centre), Peter trapkowski (right) never get tired of improving processes.

34
p R o d u c t i n n o v a t i o n s
R o l l e R d R i v e e c 3 1 0 : e f f i c i e n t, f l e x i b l e a n d R e l i a b l e
Particularly in e-commerce and just-in-time production processes, the time needed to process
an order is a crucial parameter. Optimisations of this process call for efficient, reliable and
flexible conveying technologies. The more stringent the throughput and “track and trace” require-
ments a system has to meet, the more accurately the installed technology has to work. Significant
improvements can be realised in this area by splitting up a roller conveyor system into different
zones. And this is precisely the underlying principle behind Interroll’s innovative 24 V RollerDrive
ec 310.
demand-driven use of conveyor output
Instead of relying on one central motor to drive the entire conveyor, it is divided up into separately
driven segments in lengths that vary according to requirements. the individual conveying zones
are either interlinked with distributed control or activated as required via a higher-order controller.
this means that the drive operates with reference to throughput. the system does not use any
energy in those sections not conveying any containers. Rather, the drive is only in operation within
those sections where conveying is currently required. not only does this reduce energy con-
sumption, it also decreases noise and wear.
Another benefit of Interroll’s RollerDrive solution is that the absence of mechanical elements for
power transmission to the roller conveyor segments reduces maintenance, while at the same
time the service life of the system is extended. Depending on the mechanical components used,
the RollerDrive concept can offer a service life three to four times higher than conventional solu-
tions – a key variable for the total cost. to further improve the energy balance, the RollerDrive solu-
tion uses regenerative braking. the braking energy recovered from cyclical operation is passed
on to other segments of the overall system. this substantially reduces the primary connected load
of the accumulator conveyor and at the same time decreases the thermal load on the RollerDrive’s
brushless motor.
Decentralised intelligence in roller conveyors helps save energy.
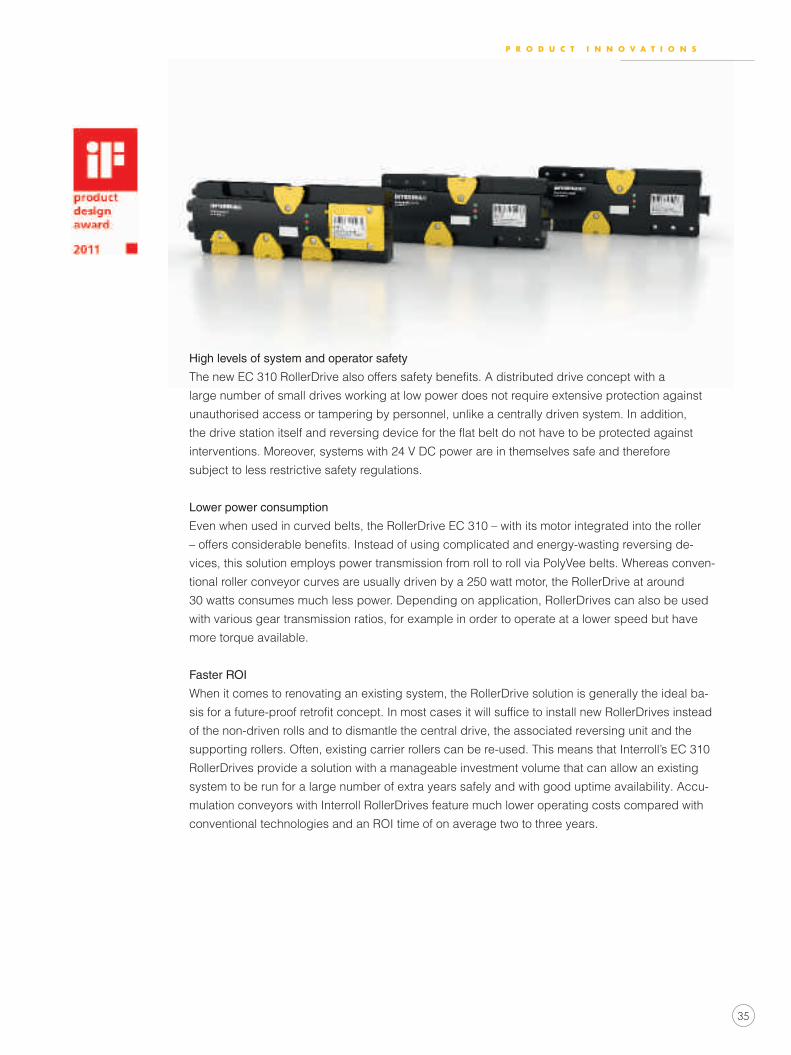
35
p R o d u c t i n n o v a t i o n s
High levels of system and operator safety
The new EC 310 RollerDrive also offers safety benefits. A distributed drive concept with a
large number of small drives working at low power does not require extensive protection against
unauthorised access or tampering by personnel, unlike a centrally driven system. In addition,
the drive station itself and reversing device for the flat belt do not have to be protected against
interventions. Moreover, systems with 24 V DC power are in themselves safe and therefore
subject to less restrictive safety regulations.
lower power consumption
even when used in curved belts, the RollerDrive ec 310 – with its motor integrated into the roller
– offers considerable benefits. Instead of using complicated and energy-wasting reversing de-
vices, this solution employs power transmission from roll to roll via PolyVee belts. Whereas conven-
tional roller conveyor curves are usually driven by a 250 watt motor, the RollerDrive at around
30 watts consumes much less power. Depending on application, RollerDrives can also be used
with various gear transmission ratios, for example in order to operate at a lower speed but have
more torque available.
faster Roi
When it comes to renovating an existing system, the RollerDrive solution is generally the ideal ba-
sis for a future-proof retrofit concept. In most cases it will suffice to install new RollerDrives instead
of the non-driven rolls and to dismantle the central drive, the associated reversing unit and the
supporting rollers. often, existing carrier rollers can be re-used. this means that Interroll’s ec 310
RollerDrives provide a solution with a manageable investment volume that can allow an existing
system to be run for a large number of extra years safely and with good uptime availability. Accu-
mulation conveyors with Interroll RollerDrives feature much lower operating costs compared with
conventional technologies and an RoI time of on average two to three years.

36
p R o d u c t i n n o v a t i o n s
Interroll synchronous Drum Motors require little space only.
s y n c H R o n o u s d R u M M o t o R s f o R M a x i M u M e n e R g y e f f i c i e n c y
Around 70 % of industrial energy consumption is caused by electric motors. Due to rising
power costs, improving the energy efficiency of such drives is one of the most promising ways
to reduce production costs. the German environment Ministry, for instance, estimates that,
in Germany alone, electricity consumption could be reduced by about 27 billion kilowatt hours
by the year 2020 through the use of more efficient electric motors.
thanks to their design, Interroll drum motors stand out for their extremely low power loss. the
new Synchronous Drum Motors are the epitome of high performance, boasting an efficiency rate of
well over 90 % (motor). Due to their comparatively low power consumption of less than 0.75 kW,
these motors do not need to be tested for compliance with Iec 60034-30 standards relating to the
efficiency of low-voltage three-phase motors. However, this is merely academic, as they fulfil the
aforementioned requirements with ease, achieving the IE3 efficiency class (premium efficiency) or
the even stricter Ie4 class.
According to an independent study by the technical University Aalborg (Denmark), an asynchro-
nous drum motor driving a conveyor belt with a 50 kg load (maximum load) consumes around
32 per cent less primary energy than a geared motor with identical capacity. When used to move
an empty conveyor belt, the potential savings are as high as 47 %. this gives rise to further
potential savings. As there is significantly less power being lost and converted into heat, less
energy also has to be consumed for cooling purposes – by for instance air conditioning
systems in the foodstuffs industry.
the fact that such aspects are more than worthy of consideration is evident from a comparison of
the various drive concepts. For instance, the synchronous Drum Motor under full load at an
ambient temperature of 20 °c reaches a maximum surface temperature of 45 °c at the most, while
classic geared motors can reach up to 70 °c. savings can also be made with the synchronous
Drum Motor under normal operating conditions. the completely enclosed casing, for instance, and
the compact design of the drum motors means the need for cleaning is reduced by about 30 %.
this leads to significant savings in cleaning time and the related cost of hot water or steam.

37
p R o d u c t i n n o v a t i o n s
As far as technical performance is concerned, the new synchronous Drum Motors stand out for
their consistently high torque across almost the entire speed range, right through to the maximum
rpm, which corresponds to the nominal rating. they make it easier to develop dynamic applica-
tions such as pick-and-place, inward transfers or merges, as side mounting is no longer required.
When used with a corresponding sensor system, like an integrated encoder, a very high degree
of precision can also be achieved. The benefits of the Synchronous Drum Motor also include spin-
off savings in the overall operating costs of applications requiring servo technology. this inclu-
des packaging lines with the need for precisely timed intervals between conveyed goods – so-called
smart belts – or lines with dynamic positioning.
this new addition to the Interroll product range of a synchronous Drum Motor is one of the most
powerful and energy-efficient conveyor-belt drives ever developed. It combines the benefits
of the drum motor with the superior efficiency of the synchronous servo motor. The end result is an
extremely compact and dynamic drive with outstanding energy efficiency of around 85 %
(motor and gears). the fail-safe record and long service life of drum motor technology also speak
for the concept. this is a complete, all-in-one design, with all mechanical components of the
motor incorporated inside the drum. As well as an electric motor, this includes the gears and an
optional feedback system for closed-loop operation and brakes or mechanical backstops. the
fully encased design also ensures excellent protection from any outside influences.


39
W h a t o u r c u s t o m e r s s a y
ANDRADE DISTRIBUIDORApplication Conveyed goods Objective Integrated
Interroll products User benefits
Distribution centre Household items, foodstuffs, merchandise in cartons
Improve utilisation of existing distribution centre
Carton Flow combined with Intelliveyor tote conveyors
Energy-efficient, space-saving solution
H O U S E H O L D G O O D S
Andrade Distribuidor in Arapiraca markets perfumery products, toiletries, household goods
and foodstuffs, general merchandise and stationery items. To increase its distribution
rates, the Brazilian company modernised its distribution centre at its headquarters in Arapiraca,
without having to incorporate any additional storage space.
Interroll built a maintenance-free, zero-energy Carton Flow rack into the existing pallet
rack system.
The picked cartons reach the palletising zone on roller conveyors fitted with Interroll RollerDrives.
The maintenance-free, low-noise, space-saving design and superior safety features made it
preferable to a solution with 380 V geared motors.
“ This Interroll solution is extremely energy efficient, remarkably compact and quiet. With Interroll Carton Flow we have achieved a significant improvement in our picking rates.”
Celso Pessoa, Owner of Andrade Distribuidor, Brazil


41
W h a t o u r c u s t o m e r s s a y
RED BULLApplication Conveyed goods Objective Integrated
Interroll productsUser benefits
Beverage distribution
Beverage pallets Successful completion of a new project with a tried and tested partner
FIFO and LIFO dynamic storage modules
Space-saving, compact pallet storage within a readily available system
B E V E R A G E S
Positive experience with Interroll dynamic storage technology installed in a distribution centre
in 2009 inspired Red Bull to commission Interroll again in 2011 to supply a dynamic pallet system
for a new warehouse.
The new distribution centre in Bangkok offers a total of 12,670 pallet spaces for flow storage
based on the FIFO principle (first in - first out) and top-up storage with Interroll Cart Pushback
based on the LIFO principle (last in - first out).
The flow storage channels in the FIFO area can take 16 pallets each, while the Cart Pushback
top-up units have channels capable of taking 4 to 5 pallets. This allows for optimal space utilisation
in this area of the warehouse, with only two aisles required to load or unload the three rows of
top-up units.
“ From its starting point, we have supported the project with our know how and expertise from many other applications.”
Grisorn Nakapong, Managing Director Interroll (Thailand) Co. Ltd., Thailand
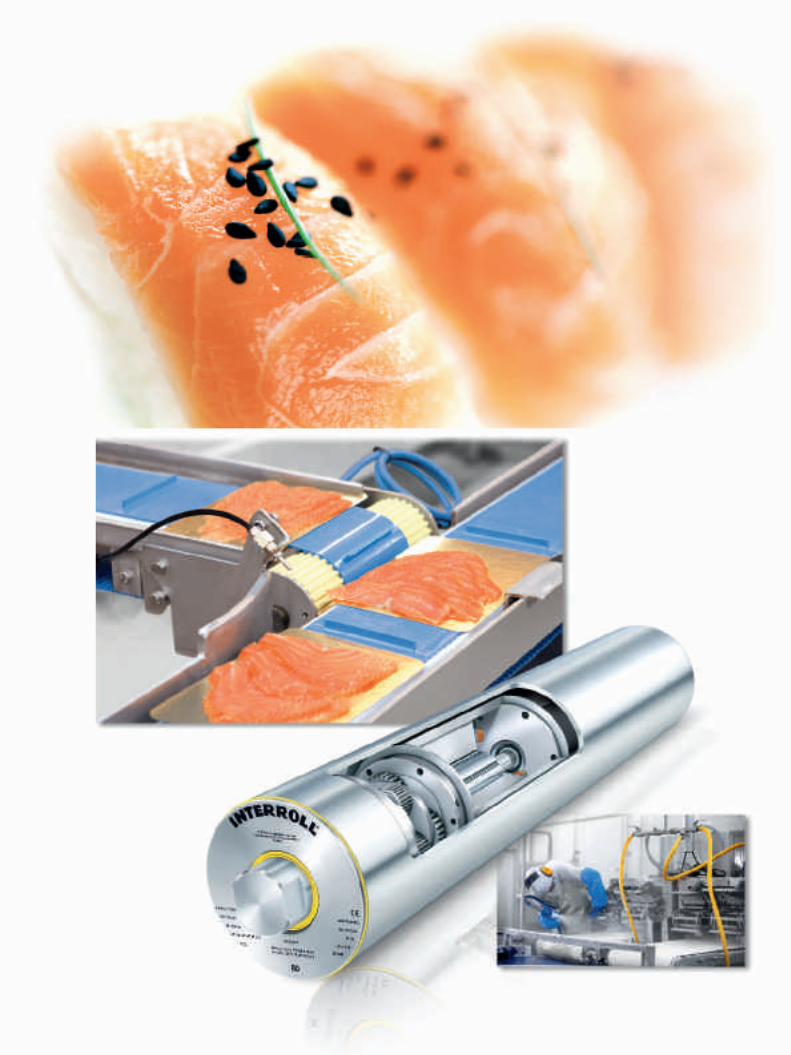

43
W h a t o u r c u s t o m e r s s a y
MerAlliance/ArmoricApplication Conveyed goods Objective Integrated
Interroll productsUser benefits
Food processing Sliced salmon on carton carriers
Install high-frequency stop-and-go belt conveyors in an area with limited space
Interroll Synchronous Drum Motors as belt drives
Space-saving, hygienic belt drives
S A L M O N
MerAlliance, France’s number one supplier of salmon specialities, has leveraged the benefits of
the new Interroll Synchronous Drum Motor. Its production unit uses the belt conveyor drive in
a new processing line for smoked salmon slices. The processing plant combines slicing machinery
with PU belt conveyors that are driven by the Synchronous Drum Motors in a precise and quiet
start-stop sequence. This ensures the carton carriers are pulsed in a perfectly timed sequence and
the salmon slices never slip off the carriers.
“ Our new processing line has significantly increased its productivity despite the limited space it has to work with and the strict cleaning procedures. The Interroll Synchronous Drum Motors are ideal for such an appli-cation. They make the conveyor movements com- pletely controllable in a precisely positioned, stop-and-go operation and they work quietly and reliably too.”
Antoine Aveline, industrial engineer with MerAlliance, France

45
C o r p o r a t e G o v e r n a n C eC o n t e n t s
Corporate Governance
C o n t e n t s
1 Introduction 46
2 Group structure and shareholders 46
3 Capital structure 47
4 operational management structure 48
5 Board of Directors 51
6 Internal organisation 54
7 Competence regulations 55
8 Information and control instruments 55
9 Group management 56
10 Compensation, shareholdings and loans 59
11 shareholders’ participation rights 61
12 Changes of control and defence measures 62
13 Auditor 62
14 Information policy 63

46
C o r p o r a t e G o v e r n a n C eI n t r o d u C t I o n / G r o u p s t r u C t u r e a n d s h a r e h o l d e r s
1 I n t r o d u c t I o n
The corporate governance report 2011 of the Interroll Group refers to the official guideline of
the sIX swiss exchange on Corporate Governance as well as to the regulations of the “swiss code
of best practice for corporate governance”. In order to minimise repeated comments, certain
sections cross refer to other sections, especially to the financial report.
The compensation report is part of the financial statements of INTERROLL HOLDING LTD.
2 G r o u p s t r u c t u r e a n d s h a r e h o l d e r s
Group structure
the operational management structure is disclosed in chapter 4 of this report.
The mother company of the Group, INTERROLL HOLDING LTD., is domiciled in Sant’Antonino/TI,
switzerland. Its registered shares are traded in the main segment of the sIX swiss exchange
under the security number 637 289. Further notes to the listing can be found in the inside cover
of the annual report (“Information for investors”).
subsidiaries belonging to the consolidation range of the Interroll Group are disclosed in note 8.4
of the Group’s financial statements. There are no other equity instruments publicly traded expect
those of INTERROLL HOLDING LTD.
Significant shareholders
All significant shareholders holding a reportable participation are disclosed in note 3.7
(“Significant shareholders”) of the financial statements of INTERROLL HOLDING LTD.
Cross shareholdings
the Interroll Group does neither maintain capital nor voting rights with other entities.

47
C o r p o r a t e G o v e r n a n C eC a p I t a l s t r u C t u r e
3 c a p I ta l s t r u c t u r e
Capital and authorised/conditional capital
The share capital of Interroll Holding Ltd. amounts to CHF 8.5 million and is made up of 854,000
fully paid registered shares with a par value of CHF 10 each. Each share has one voting right.
There is no authorised or conditional capital. Furthermore, the are no other equity-like instruments
such as profit sharing rights or participation certificates. Additional information to the equity is
disclosed in the financial statements of the Group (see 1.5 – “Consolidated statement of changes
in equity”) and in the respective notes.
Changes in capital
In the year under review, the share capital remained unchanged at CHF 8.5 million.
Limitations on transferability and nominee rights
Information about limitations on transferability and other nominee rights of the shareholders is dis
closed in chapter 8 (“shareholders’ participation rights”) of the report on the corporate gover-
nance of the Interroll Group.
Convertible bonds and options
there are no convertible bonds outstanding. In 2006, the board of directors approved a management
share option plan. Further information on this plan is disclosed in 7.1 of the Notes to the financial
statements of the Interroll Group.

48
4 o p e r at I o n a l m a n a G e m e n t s t r u c t u r e
the Interroll Group consists of one single business unit. the complete product range is sold in all
markets through local sales organisations. Interroll caters to the needs of its customers (system
integrators, plant manufacturers, end users) by offering a tailor-made product portfolio and expert
consultancy. The Interroll manufacturing units focus on the production of specific product ranges.
Assembly units receive semi-finished products from the manufacturing units and assemble a wide
product range for their local markets. The Interroll Research Center, which is centrally located,
develops new application technologies and new products. the manufacturing units continue to ex-
plore new opportunities to develop further the product ranges they focus on.
the Group Management and the Interroll management structure are organized by functions (over-
all management, Products & Technology, Global Sales & Service, marketing, finance and IT). The
financial management of the Group by the Board of Directors is, on the one hand, based on turn-
over of the product groups and geographical markets and, on the other hand, on the reporting of
the consolidated financial statements. In addition, Group Management assesses the achievement
of financial and qualitative targets and other key performance indicators of all subsidiaries.
Chairman
Kurt Rudolf
Audit Committee
Philippe Dubois
Paolo Bottini
Compensation Committee
Kurt Rudolf
Prof. Dr. Horst Wildemann
other members
Marco Ghisalberti
Ingo Specht
Vice chairman
Urs Tanner
Chief Executive Officer
Paul Zumbühl
Corporate Marketing
Jens Karolyi
Products & technology
Dr. Ralf Garlichs
Chief Financial Officer
Jürg Häusermann
Corporate It
Christian Hähni
Global sales & service
Dr. Christoph Reinkemeier
Regions
Operational Head Americas Tim McGill
Operational Head Asia Kwang-Heng Seng
BOARD OF DIRECTORS
GROuP MANAGEMENT
C o r p o r a t e G o v e r n a n C eo p e r a t I o n a l M a n a G e M e n t s t r u C t u r e
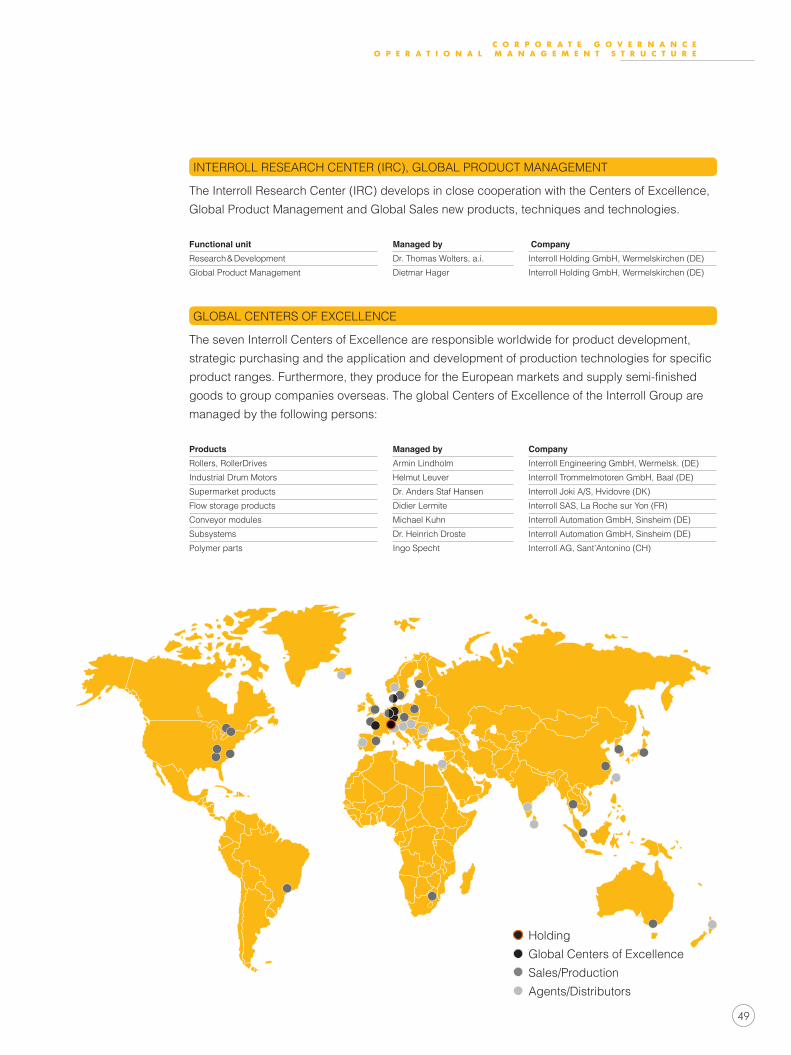
49
The Interroll Research Center (IRC) develops in close cooperation with the Centers of Excellence,
Global Product Management and Global Sales new products, techniques and technologies.
Functional unit Managed by Company
Research & Development Dr. thomas Wolters, a.i. Interroll Holding GmbH, Wermelskirchen (DE)
Global Product Management Dietmar Hager Interroll Holding GmbH, Wermelskirchen (DE)
the seven Interroll Centers of excellence are responsible worldwide for product development,
strategic purchasing and the application and development of production technologies for specific
product ranges. Furthermore, they produce for the European markets and supply semi-finished
goods to group companies overseas. the global Centers of excellence of the Interroll Group are
managed by the following persons:
Products Managed by Company
Rollers, RollerDrives Armin Lindholm Interroll Engineering GmbH, Wermelsk. (DE)
Industrial Drum Motors Helmut Leuver Interroll Trommelmotoren GmbH, Baal (DE)
Supermarket products Dr. Anders Staf Hansen Interroll Joki A/S, Hvidovre (DK)
Flow storage products Didier Lermite Interroll SAS, La Roche sur Yon (FR)
Conveyor modules Michael Kuhn Interroll Automation GmbH, Sinsheim (DE)
subsystems Dr. Heinrich Droste Interroll Automation GmbH, Sinsheim (DE)
Polymer parts Ingo specht Interroll AG, Sant’Antonino (CH)
INTERROLL RESEARCH CENTER (IRC), GLOBAL PRODuCT MANAGEMENT
GLOBAL CENTERS OF ExCELLENCE
C o r p o r a t e G o v e r n a n C eo p e r a t I o n a l M a n a G e M e n t s t r u C t u r e
Holding
Global Centers of excellence
Sales/Production
Agents/Distributors

50
Sales and service subsidiaries
Interroll sales companies concentrate on specific market and customer segments offering the full
range of Interroll products and 24-hour repair service.
Production companies
Guided by the Interroll Centers of excellence, production companies manufacture and assemble
products for regional markets. They concentrate on specific product groups within the full product
range.
the sales and service subsidiaries and the sales regions are managed by the following persons:
WORLDWIDE SALES AND PRODuCTION COMPANIES
C o r p o r a t e G o v e r n a n C eo p e r a t I o n a l M a n a G e M e n t s t r u C t u r e
Function Region/country Managed by Company
sales and service Central europe o. schopp Interroll Fördertechnik GmbH, Wermelskirchen (DE)
Europe Middle East Africa
sales and service France G. Calvez Interroll SAS, Saint-Pol-de-Léon (FR)
sales and service northern europe E. Kaiser Interroll Nordic A/S, Hvidovre (DK)
sales and service Great Britain/Ireland Ch. Middleton Interroll Ltd., Corby (GB)
sales and service Iberic peninsula R. Rovira Interroll españa sA, Cerdanyola del Vallès (es)
sales Czech Rep., Balcany, Hungary F. Ratschiller Interroll CZ s.r.o., Breclav (CZ)
sales and service Poland, Russia, ukraine F. Ratschiller Interroll Polska sp.z.o.o., Warsaw (PL)
sales Turkey, Middle East F. Ratschiller Interroll Lojistik Sistemleri Ticaret Limited, Istanbul (TR)
sales and Assembly Africa R. Mey Interroll SA (Proprietary) Ltd., Johannesburg (ZA)
sales and Production Special projects H. Leuver Transtechnik GmbH, Wassenberg (DE)
sales and Production north America R. Keely Interroll Corporation, Jeffersonville (uS)
Americas sales and Production north America S. Cwiak Interroll Automation LLC, Jeffersonville (uS)
Production north America C. Brown Interroll Dynamic Storage, Inc., Hiram/Atlanta (uS)
sales and Production Canada s. Gravelle Interroll Canada Ltd,. Newmarket/Toronto (CA)
sales and Production America s. Gravelle Interroll Components Canada Ltd,. Concord/Toronto (CA)
sales and Assembly Brazil, Argentina D. Hahn Interroll Logística Ltda., Pindamonhangaba/São Paulo (BR)
sales and Production China s. Foong Interroll (Suzhou) Co. Ltd., Suzhou (CN)
Asia Pacific
sales and service South Korea N. Kim Interroll Korea Corp. Seoul (KR)
sales and service Japan Y. Kawakubo Interroll Japan Co. Ltd., Tokyo (JP)
sales and Assembly thailand n. Grisorn Interroll (Thailand) Co. Ltd., Panthong (TH)
sales and service singapore, south east Asia G. W. seng Interroll (Asia) Pte. Ltd, Singapore (SG)
sales and Assembly Australia P. Cieri Interroll Australia Pty. Ltd,. Melbourne (Au)
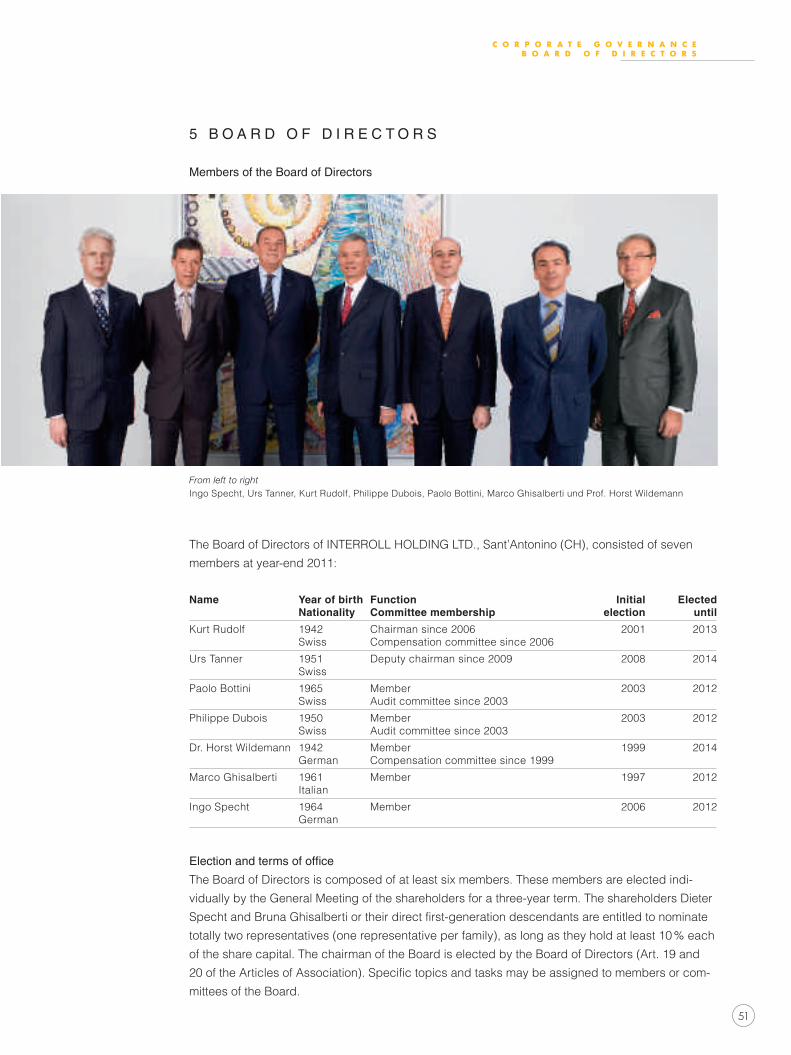
51
5 B o a r d o f d I r e c t o r s
Members of the Board of Directors
From left to right Ingo Specht, urs Tanner, Kurt Rudolf, Philippe Dubois, Paolo Bottini, Marco Ghisalberti und Prof. Horst Wildemann
The Board of Directors of INTERROLL HOLDING LTD., Sant’Antonino (CH), consisted of seven
members at year-end 2011:
Name Year of birthNationality
FunctionCommittee membership
Initial election
Elected until
Kurt Rudolf 1942 swiss
Chairman since 2006 Compensation committee since 2006
2001 2013
urs Tanner 1951 swiss
Deputy chairman since 2009 2008 2014
Paolo Bottini 1965 swiss
Member Audit committee since 2003
2003 2012
Philippe Dubois 1950 swiss
Member Audit committee since 2003
2003 2012
Dr. Horst Wildemann 1942 German
Member Compensation committee since 1999
1999 2014
Marco Ghisalberti 1961 Italian
Member 1997 2012
Ingo specht 1964 German
Member 2006 2012
Election and terms of office
The Board of Directors is composed of at least six members. These members are elected indi-
vidually by the General Meeting of the shareholders for a three-year term. The shareholders Dieter
Specht and Bruna Ghisalberti or their direct first-generation descendants are entitled to nominate
totally two representatives (one representative per family), as long as they hold at least 10 % each
of the share capital. the chairman of the Board is elected by the Board of Directors (Art. 19 and
20 of the Articles of Association). Specific topics and tasks may be assigned to members or com-
mittees of the Board.
C o r p o r a t e G o v e r n a n C eB o a r d o f d I r e C t o r s

52
Professional background and vested interests of the Board of Directors
KuRT RuDOLF
Dipl.-Ing. ETH
Current activities
Since 2005: Member of the Board of Directors of Belimed Ltd., Zug (CH)
Since 1996: Member of the Board of Directors of Medela Group, Zug (CH/uS)
Professional background
1986 – 1990: CEO Portescap Group, La Chaux-de-Fonds (CH)
1982 – 1985: Managing Director of LGZ Landis & Gyr Zug Ltd., Zug (CH)
uRS TANNER
Executive MBA, university St. Gallen (CH)
AMP, Harvard (uS)
Current activities
Since 2011: Member of the Board of Directors of Koras Ltd., Hasle-Rüegsau (CH)
Since 2011: Member of the Board of Directors of Belimed Ltd., Zug (CH)
Since 2011: Member of the Board of Directors of Plaston Ltd., Widnau (CH)
Since 1995: Member and delegate of the Board of Directors of Medela Group, Zug (CH)
Professional background
1995 – 2007: CEO of Medela Group, Baar (CH)
1983 – 1994: Managing Director of Tool & Plastics, Mikron Group, Biel (CH)
1967 – 1983: Management positions at Styner + Bienz (Adval Tech), Niederwangen (CH)
PAOLO BOTTINI
Lic. iur., lawyer
tax specialist (eidg. dipl.)
Current activities
Since 2011: Managing Partner of Bär & Karrer, Zurich (CH)
Since 1996: Guest lecturer for law and tax at the Centro di Studi Bancari, Vezia (CH)
Professional background
2002– 2010: Partner and Director of Bär & Karrer, Lugano (CH)
2000 – 2001: Partner of Bär & Karrer, Lugano (CH)
1996 – 2000: Associate of Bär & Karrer, Lugano (CH)
PHILIPPE DuBOIS
Lic. iur. and lic. oec.
Current activity
Since 2002: Independent management and financial consultant for M&A, corporate finance
and management coaching
Professional background
1999 – 2001: Senior Investment Banking positions at Bank Julius Bär
1982 – 1999: uBS Warburg (also responsible for the IPO of Interroll)
C o r p o r a t e G o v e r n a n C eB o a r d o f d I r e C t o r s

53
PROF. DR. HORST WILDEMANN
Prof. of university Dr. Dr. h. c. mult.
Honorary professor at the universities of Klagenfurth and Passau (DE)
Award of the first class cross merit of the Federal Republic of Germany
Award of the order of merit of Bavaria
Dipl.-Ing. in mechanical engineering and Dipl.-Kfm. in business administration at the universities of
Aachen and Cologne (DE) and also of the universities of Southern California and Indianapolis (uS)
Member of the Logistic Hall of Fame (since 2004)
Current activities
Since 2007: Member of the Board of Directors of Sick AG, Waldkirch (DE)
Since 1996: Member of the Board of Directors of Zeppelin GmbH, Friedrichshafen (DE)
since 1988: Professor ordinarius for management, production and logistics at the technische
universität München, Munich (DE)
Since 1980: Managing Director of TCW Consulting GmbH, Munich (DE)
MARCO GHISALBERTI
Laurea, Economia e Commercio, Istituto universitario di Bergamo (IT)
MBA, Boston university, Boston (uS)
Current activities
Since 2006: Managing Director of Rulli Rulmeca S.p.A., Bergamo (IT)
Since 1996: Member of the Board of Directors of Rulli Rulmeca S.p.A. and Rulmeca S.p.A. (IT)
Professional background
2000 – 2003: Senior managing positions within the Rulmeca Group
1995 – 1999: Regional sales manager Rulli Rulmeca S.p.A., Bergamo (IT)
INGO SPECHT (ExECuTIVE MEMBER)
Professional qualifications as Industrial Business Manager of the Chamber of Commerce
and Industry Cologne (De)
Current activity
Since 2007: Managing Director of Interroll Ltd., Sant’Antonino (CH)
Professional background
2003 – 2007: Head of Corporate IT, Interroll Management LTD., Sant’Antonino (CH)
1998 – 2002: Vice President Corporate Development, Interroll (Schweiz) AG, Sant’Antonino (CH)
1993 – 1997: Owner and managing director of Luxis AG, Locarno (CH)
1986 – 1993: Deputy Managing Director of Interroll LTD., Sant’Antonino (CH)
C o r p o r a t e G o v e r n a n C eB o a r d o f d I r e C t o r s

54
6 I n t e r n a l o r G a n I s at I o n
The Board of Directors is responsible for strategic issues and performs high-ranking duties as
regards the management, supervision and control of the executive members of the Interroll Group.
the Board of Directors consists of the Chairman, the Deputy Chairman and the other Members.
the Board of Directors is assisted by two permanent committees within the areas of auditing (Audit
Committee) and remuneration policy (Compensation Committee).
the Audit Committee receives the audit reports prepared by the external auditors and Group audi-
tors, subsequently reporting on them to the Board of Directors. In particular, it satisfies itself that
the Group companies are also audited on a regular basis. At least once a year, the Audit Commit-
tee also commissions a report on audits undertaken and planned as well as on any proposals to
improve the auditing function. the Audit Committee submits its proposals to the Board of Directors
for decision.
the Compensation Committee submits its proposals for the salary and bonus of the Ceo, the
Members of Group Management, and the compensation of the Board of Directors to the Board of
Directors for decision. At the beginning of the year, it defines the targets to be attained for bonus
payments to become applicable. In addition, the Compensation Committee is responsible for esta-
blishing the terms of the share ownership scheme.
Both committees meet as necessary. Any member is entitled to convene committee meetings. the
members of the two committees are listed in the report on the Corporate Governance of the Inter-
roll Group (see 5 “Board of Directors” – “Members of the Board of Directors”).
The Board of Directors is deemed quorate if an absolute majority of its members is present in per-
son. Resolutions are adopted on the basis of an absolute majority of votes present. In the event
of an equal division of votes, the Chairman casts the deciding vote. All resolutions are recorded in
the minutes. The Board of Directors meets as often as business requires, but at least four times
per year.
the meetings are convened by the Chairman of the Board of Directors. each member of the Board
of Directors may demand that a meeting be convened, specifying the item on the agenda to
be discussed. In the business year 2011, the Board of Directors met on five occasions, the Audit
Committee three times and the Compensation Committee twice for regular scheduled meetings.
the Managing Directors of the respective functional units and of the Corporate Functions are invi-
ted to attend meetings when necessary.
C o r p o r a t e G o v e r n a n C eI n t e r n a l o r G a n I s a t I o n

55
7 c o m p e t e n c e r e G u l at I o n s
Competences and controls are specified within a set of organisational regulations.
the Board of Directors has exercised its statutory authority to delegate management to third
parties who need not be shareholders (Group Management), reserving those duties which may
not be delegated or withdrawn.
In the provisions of the organisational regulations, the Board of Directors has delegated the
management of ongoing business to a Chief Executive Officer (CEO). The CEO is responsible for
the overall management of the Interroll Group and for all matters not falling under the purview
of another governing body, as specified by law, the Articles of Association or the organisational
regulations. In particular, the Ceo is responsible for the operational management of the Company
as a whole.
Group Management consists of the Ceo and the Managing Directors of the functional units and
of the Corporate Functions, who report directly to him at the Company’s headquarters.
8 I n f o r m at I o n a n d c o n t r o l I n s t r u m e n t s
At each meeting, the Ceo informs the Board of Directors of the course of business, the principal
events within the Group and the discharge of duties delegated to the Group Management.
the Management Information system (MIs) of the Interroll Group consolidates the balance sheet,
income statement and cash flow statement, as well as financial data pertaining to the subsidiary
companies, on a monthly basis and compares the current figures with those of the previous year
and the budget. On the basis of the quarterly financial statements, the budget is assessed in
the form of a forecast as to whether it is attainable with regard to each entity and also for the con-
solidated group. The financial reports (MIS) are discussed with the CEO at meetings of the
Board of Directors.
on behalf of the Audit Committee, internal audits are performed annually at selected subsidiary
companies. The focal points of the audit are defined according to the risk profile of the respective
entity. the reports of the Audit Committee are discussed with the local management.
Extraordinary occurrences and decisions of material importance, as specified in the organisational
regulations, are immediately brought to the attention of all members of the Board of Directors in
writing.
C o r p o r a t e G o v e r n a n C eC o M p e t e n C e r e G u l a t I o n s / I n f o r M a t I o n I n s t r u M e n t s

56
9 G r o u p m a n a G e m e n t
Members of the Group Management
Name Year of birthNationality
Function Member since
Paul Zumbühl 1957 switzerland
Chief Executive Officer (CEO) January 2000
Jürg Häusermann 1961 switzerland
Chief Financial Officer (CFO) november 2000
Dr. Ralf Garlichs 1962 Germany
Head of Products & Technology July 2006
Dr. Ch. Reinkemeier 1966 Germany
Head of Global Sales & Service January 2011
Jens Karolyi 1970 Germany
Head of Corporate Marketing January 2011
Christian Hähni 1958 switzerland
Head of Corporate IT July 2007
tim McGill 1955 Great Britain
Head of operations Americas January 2011
Kwang-Heng Seng 1951 singapore
Head of operations Asia April 1988
Professional background and vested interests of the Group Management
PAuL ZuMBüHL
Dipl.-Ing., Lucerne university of applied sciences, Lucerne (CH)
MBA, Joint university Program of the univ. in Boston, Berne, Shanghai
AMP, Kellogg Business School of Northwestern university, Chicago (uS)
Marketing Management Diploma (Eidg. Dipl.)
Current activity
since 2000: Ceo, Interroll Group
Further activities
Since 2009: Member of the Board of Directors, Looser Holding, Arbon (CH)
Since 2007: Member of the Board of Directors, Schlatter Holding, Zurich
Professional background
1994 – 1999: CEO of Mikron Plastics Technology and member of the Exe-
cutive Management Board, Mikron Group, Biel (CH)
1988 – 1994: Managing Director and further management positions at the
Sarna Group, Sarnen (CH)
1984 – 1987: Sales Manager/Engineer at SYMALIT AG, Lenzburg (CH)
C o r p o r a t e G o v e r n a n C eG r o u p M a n a G e M e n t

57
JüRG HäuSERMANN
Diploma in Economics and Business Administration, HWV
(majoring in Finance and Marketing)
Current activity
since 2000: CFo, Interroll Group
Professional background
1997 – 2000: Division Controller, Segment Kitchen Technology,
FRANKE Group, Aarburg (CH)
DR. RALF GARLICHS
Dr. Ing. (Mech. engineering, focus production eng.), univ. Hannover (DE)
Current activity
Since 2011: Head of Products & Technology, Interroll Group
Professional background
2006 – 2010: Managing Director of “Interroll Drives & Rollers”,
Interroll Group
1999 – 2006: Managing Director of Reflex Winkelmann and further
managing positions at Winkelmann, Ahlen/Westfalen (DE)
1994 – 1999: Head Production, Logistics, Festo Tooltechnic, Esslingen/DE
DR. CHRISTOPH REINKEMEIER
Dr. (System technologies), university of Münster (DE)
Current activity
Since 2011: Head of Gobal Sales & Service, Interroll Group
Professional background
2007 – 2010: CEO for North and South America at Deckel Maho
Gildemeister (DMG) America Inc., Chicago (uS)
2000– 2006: Several management positions at Ista International GmbH,
essen (De)
1998– 2000: Project manager of corporate development E.On AG,
Düsseldorf (DE)
JENS KAROLYI
Dipl. in Business Administration, university of Bamberg and Giessen (DE)
Current activity
Since 2011: Head of Corporate Marketing, Interroll Group
Professional background
2007 – 2010: Vice President Marketing and Communications Northern
Europe, Ericsson, Düsseldorf (DE)
2000 – 2007: Management positions in Marketing, Branding and Commu-
nications at Ericsson Northern Europe, Düsseldorf (DE)
C o r p o r a t e G o v e r n a n C eG r o u p M a n a G e M e n t
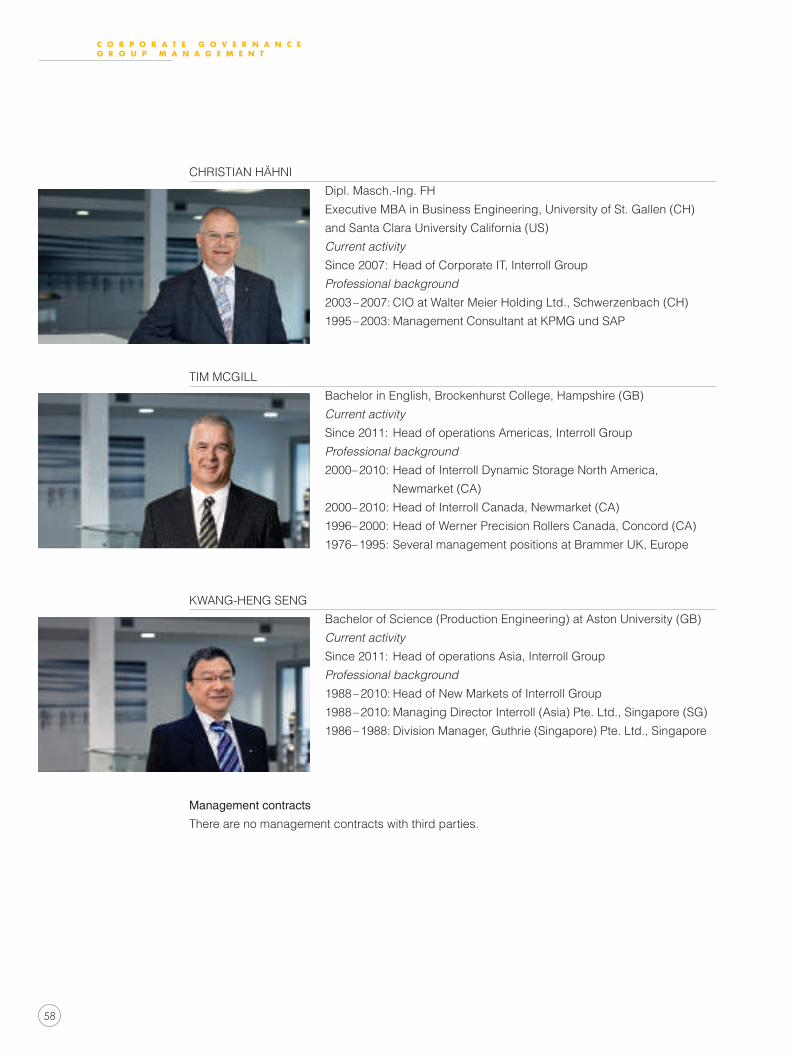
58
CHRISTIAN HäHNI
Dipl. Masch.-Ing. FH
Executive MBA in Business Engineering, university of St. Gallen (CH)
and Santa Clara university California (uS)
Current activity
Since 2007: Head of Corporate IT, Interroll Group
Professional background
2003 – 2007: CIO at Walter Meier Holding Ltd., Schwerzenbach (CH)
1995 – 2003: Management Consultant at KPMG und SAP
TIM MCGILL
Bachelor in English, Brockenhurst College, Hampshire (GB)
Current activity
Since 2011: Head of operations Americas, Interroll Group
Professional background
2000– 2010: Head of Interroll Dynamic Storage North America,
Newmarket (CA)
2000– 2010: Head of Interroll Canada, Newmarket (CA)
1996– 2000: Head of Werner Precision Rollers Canada, Concord (CA)
1976– 1995: Several management positions at Brammer uK, Europe
KWANG-HENG SENG
Bachelor of Science (Production Engineering) at Aston university (GB)
Current activity
Since 2011: Head of operations Asia, Interroll Group
Professional background
1988 – 2010: Head of New Markets of Interroll Group
1988 – 2010: Managing Director Interroll (Asia) Pte. Ltd., Singapore (SG)
1986 – 1988: Division Manager, Guthrie (Singapore) Pte. Ltd., Singapore
Management contracts
there are no management contracts with third parties.
C o r p o r a t e G o v e r n a n C eG r o u p M a n a G e M e n t

59
1 0 c o m p e n s at I o n , s h a r e h o l d I n G s a n d l o a n s
Content and method of determining the compensation of the Board of Directors
the Board of Directors determines on a yearly basis the level of compensation payable to its
members in accordance with their activities and responsibilities. the membership in committees is
not remunerated separatly. extraordinary activities exceeding the normal activities of a member
of the Board of Directors may be compensated separately. the members of the Board of Directors
receive the total remuneration in cash. no variable portion is included in the total compensation.
no member of the Board of Directors participates in the existing share option plan. Any social costs
are borne by the employer.
Content and method of determining the compensation of the Group Management
Based on the proposal of the Compensation Committee, the Board of Directors annually determi-
nes the compensation of the Group Management. the total compensation for the Ceo is proposed
by the Compensation Committee. the total compensation for the other members of the Group
Management is proposed by the Ceo and presented annually to the Compensation Committee for
authorisation.
the compensation is determined in accordance with the global responsibility, the individual and
concrete contribution that adds value to the long term strategic development of the Group and
on the complexity of the area of responsibility. there are individual remuneration agreements with
each member of Group Management. the target remuneration of each member of the Group
Management consists of a fixed and of a variable component.
the variable component ranges between 10 % and 60 % of total compensation, depending on the
function and the general business performance. There are two key criteria for defining the variable
compensation component of each member of Group Management: the total Group result or the
result for which the member is responsible, and the achievement of individually defined objectives
such as the launch of new products, increase of market share, successful development of strate-
gic projects, the development of new markets, etc. The individual objectives range from 20% to 70%
of the variable remuneration component. the percentage depends on the function (operational
management or central function) and on the strategic position of the company or operational unit.
The basic key performance indicators for the Group are the revenue development, the increase
in productivity and the EBIT. If a member does not achieve the agreed objectives due to external
facts beyond his influence, the Compensation Committee may, as an exception, deviate from
the compensation agreement in favour of the member of Group Management.
Adjustments to the fixed remuneration component can only be agreed upon after a term of three to
four years and are subject to individual performance assessments and changes in the scope of
responsibility. The fixed compensation component is paid in cash. The variable component is either
fully paid in cash or partly or even fully paid in shares. the payment method is individually deter-
mined with each member of Group Management. A part of the shares assigned may be blocked
over a period of three to five years.
C o r p o r a t e G o v e r n a n C eC o M p e n s a t I o n , s h a r h o l d I n G s a n d l o a n s

60
In March 2006, Group Management and forty senior employees holding a management
position at that date were offered to participate in a share option scheme. The option life ends
on september 30th, 2013. the option cannot be executed before April 1st, 2012. each option
entitles to subscribe for one Interroll share. The strike price is CHF 323 per share. The compen-
sation of the difference between the market value at the exercise date and the strike price is
impossible. the number of allocated shares was individually agreed with each Group Management
member, whereby the specific function within the Group Management was taken into account.
there are special pension fund regulations for some members of Group Management. A member
of Group Management pays a fourth or a third of the saving portion. the rest is paid by the employer.
In addition, each member of Group Management has a company car at his disposal or, alterna-
tively, an equivalent monthly allowance is paid. Beyond that no other significant compensation is
made.
Compared with the previous year, the total compensation of Group Management did not change
significantly based on the new organisational structure and new composition of this body intro-
duced on 1.1.2011. The fixed remuneration components of the existing members of Group Manage-
ment remained unchanged, year on year, and adjustments within the variable components were
insignificant.
Whenever deemed appropriate, external support and/or international compensation benchmark
studies will be referred to for the definition of the pay and benefits scheme.
Loans to governing bodies
INTERROLL HOLDING LTD. and its subsidiaries have not granted any loans, advances or credits
to members of the Board of Directors or of the Group Management in both years under review.
C o r p o r a t e G o v e r n a n C eC o M p e n s a t I o n , s h a r h o l d I n G s a n d l o a n s
61
1 1 s h a r e h o l d e r s ’ pa r t I c I pat I o n r I G h t s
Representation and restriction of voting rights
Rights governing shareholder participation are in accordance with the requirements specified within
the swiss Code of obligations. each share issued has one vote. A shareholder’s voting rights are
restricted to a maximum of 5 % of the total number of votes. Individual nominees, however, are
entitled to exercise more than 5 % of the total votes if they disclose the identity of the beneficiaries
they represent and if the respective beneficiaries as a whole do not exercise more than 5 % of
the voting rights. this restriction of voting rights does not apply to the founding families, insofar as
the individual families hold at least 10 % of the share capital.
Registered shares of nominees that exceed 2 % of the shares outstanding are only listed in the
Register as shares furnished with voting rights if the nominee has provided written consent to the
possible disclosure of names, addresses and shareholdings of those persons for whom the said
nominee holds 0.5 % or more of the shares outstanding.
there is a statutory group clause.
Statutory quorum
Subject to contrary statutory or legal provisions, the General Meeting of shareholders is quorate
irrespective of the number of shareholders present and the shares represented by proxy.
Convocation of General Meeting of Shareholders
the invitation to the General Meeting of shareholders is issued at least twenty days prior to the
Meeting and is legally effective upon inclusion in the Company’s chosen vehicle of communication
(“Schweizerisches Handelsamtsblatt”). In addition, the Board of Directors sends a written invitation
to those registered shareholders listed in the share register.
Agenda and inscriptions in to the share register
the invitation to the General Meeting of shareholders shall include all items on the agenda as
well as all motions put forward by the Board of Directors and, if applicable, by the shareholders
who have called for a General Meeting or the inclusion of an item on the agenda. no resolutions
shall be passed on motions relating to items which have not been announced in the requisite
manner, with the exception of those motions relating to the convocation of an extraordinary Mee-
ting of shareholders or the execution of a special audit. no entries are made into the share
register less than ten days prior to a General Meeting of Shareholders up to the day subsequent
to the General Meeting of shareholders.
C o r p o r a t e G o v e r n a n C es h a r e h o l d e r s ’ p a r t I C I p a t I o n r I G h t s
62
1 2 c h a n G e s o f c o n t r o l , d e f e n c e m e a s u r e s
there are no statutory rules in relation to “opting up” and “opting out”. Furthermore, there are no
severance compensations agreed or any other agreements and plans in place that would apply in
the case of a change in control.
1 3 a u d I t o r
Duration of the mandate and term of office of the lead auditor
With decision of the general assembly of May13th, 2011, INTERROLL HOLDING LTD. has appoin-
ted PricewaterhouseCoopers (PwC) to be its new auditing company. PwC was elected to a term
of one year. Also a new auditor in charge assumed the responsibility for the Group audit in 2011.
Audit fees
The audit fees paid by the Interroll Group to PwC for the business year 2011 amounted to CHF
0.35 million in 2011 (audit fees paid to KPMG in 2010: CHF 0.47 million).
Additional fees
In 2011, PwC branch offices received a total of CHF 0.06 million for tax and other consulting ser-
vices (fees for such services paid to KPMG in 2010: CHF 0.2 million).
Supervisory and control instruments pertaining to the audit
the Audit Committee is responsible for evaluating the external audit. the external auditors prepare
an audit report to be submitted to the Board of Directors. At least two consultations are held
each year between the external auditors and the Audit Committee. Material findings for each entity
(Management Letters) as well as for the consolidated accounts are presented in the “Comprehen-
sive Auditor’s Report to the Board of Directors” which is discussed in detail.
C o r p o r a t e G o v e r n a n C eC h a n G e s o f C o n t r o l , d e f e n C e M e a s u r e s / a u d I t o r

63
C o r p o r a t e G o v e r n a n C eI n f o r M a t I o n p o l I C y
1 4 I n f o r m at I o n p o l I c y
Interroll is committed to providing swift, transparent and simultaneous information for all stakehol-
ders. to ensure that, the Ceo is available as a direct contact person.
The Interroll Group publishes comprehensive financial results twice a year: for the first half and for
the financial year as a whole. In addition to the financial results that are carried out in accordance
with IAS/IFRS, shareholders and financial markets are regularly kept informed of significant chan-
ges and developments.
Further relevant information and financial reports are available from www.interroll.com/ir.
Financial reports can be downloaded as PDF documents from www.interroll.com/en/investor_relations/
The half-yearly and annual reports are also sent in print to all shareholders on the publication date.


65
F i n a n c i a l R e p o R t i n t e R R o l l G R o u p
Financial Report of Interroll Group
T o T h e s h a r e h o l d e r s ’ m e e T i n g o f i n T e r r o l l h o l d i n g l T d .
B u s i n e s s y e a r 2 0 1 1
m a r c h 5 t h , 2 0 1 2
C o n t e n t s
Financial statements of Interroll Group 66
Notes to the financial statement of Interroll Group 72
Financial report of InteRRoLL HoLDInG LtD. 130


67
Financial ReportC o n t e n t s
1 Consolidated financial statements of Interroll Group 68
1.1 Consolidated statement of financial position 68
1.2 Consolidated income statement 69
1.3 Consolidated statement of comprehensive income 69
1.4 Consolidated statement of cash flows 70
1.5 Consolidated statement of changes in equity 71
2 General information to the financial statements 72
2.1 Convention of preparation 72
2.2 Critical accounting estimates and judgments 74
2.3 Principles of consolidation and valuation 75
3 Risk management 87
3.1 operational and strategic risk management 87
3.2 Financial risk management 87
3.3 Capital risk management 90
4 Changes to the scope of consolidation 91
5 segment information 92
6 Notes to the consolidated statement of financial position 93
6.1 Movements of property, plant and euipment 93
6.2 Movements of goodwill and intangible assets 94
6.3 Assets pledged or assigned 95
6.4 Inventories 96
6.5 Trade and other accounts receivable 96
6.6 Cash and cash equivalents 98
6.7 Financial instruments 99
6.8 Financial risks 100
6.9 Information on shareholder's equity 105
6.10 earnings per share 105
6.11 Financial liabilities 106
6.12 Leasing liabilities 109
6.13 Provisions 109
6.14 Pension obligations and pension costs 110
6.15 Trade and other accounts payable 113
7 Notes to the consolidated income statement 114
7.1 Personnel expenses 114
7.2 Research and development expenditures 115
7.3 Other operating expenses 116
7.4 Other operating income 116
7.5 Financial result 117
7.6 Income tax expense 118
8 Other disclosures to the financial statements 122
8.1 Contingent liabilities and other commitments 122
8.2 Related party transactions 122
8.3 Subsequent events 124
8.4 Scope of consolidation 124
9 Report of the Group auditor 126
F i n a n c i a l R e p o R t : c o n t e n t si n t e R R o l l G R o u p

68
F i n a n c i a l R e p o R t : s t a t e m e n t o F F i n a n c i a l p o s i t i o ni n t e R R o l l G R o u p
1 . 1 B sT 2 0 : Z 6 4
1 C o n s o l i d aT e d f i n a n C i a l s TaT e m e n T s o f i n T e r r o l l
1 . 1 C o n s o l i d a t e d s t a t e m e n t o f f i n a n c i a l p o s i t i o n
in thousands CHFsee
notes* 31.12.2011 in % 31.12.2010 in %
a s s e T s
Property, plant and equipment 6.1 82 107 82 945
Intangible assets 6.2 40 687 37 988
Financial assets 932 912
Deferred tax assets 7.6 715 821
Total non-current assets 124 441 52.0 122 666 58.1
non-current assets held for sale 6.1 950 1 088
Inventories 6.4 45 100 31 510
Current tax assets 528 650
Trade and other accounts receivable 6.5 57 654 45 239
Cash and cash equivalents 6.6 10 522 10 110
Total current assets 114 754 48.0 88 597 41.9
Total assets 239 195 100.0 211 263 100.0
e Q u i T y a n d l i a B i l i T i e s
share capital 8 540 8 540
Group reserves 178 601 158 918
translation reserve – 43 856 – 40 001
Total equity 6.9 – 6.10 143 285 59.9 127 457 60.3
Non-current financial liabilities 6.11 5 271 5 600
Deferred tax liabilities 7.6 2 441 3 130
Provisions 6.13 6 211 7 298
Total non-current liabilities 13 923 5.8 16 028 7.6
Current financial liabilities 6.11 22 850 17 388
Current tax liabilities 7.6 9 264 13 255
Trade and other accounts payable 6.15 49 873 37 135
Total current liabilities 81 987 34.3 67 778 32.1
Total liabilities 95 910 40.1 83 806 39.7
Total liability and shareholder’s equity 239 195 100.0 211 263 100.0
* See notes to the consolidated financial statements.
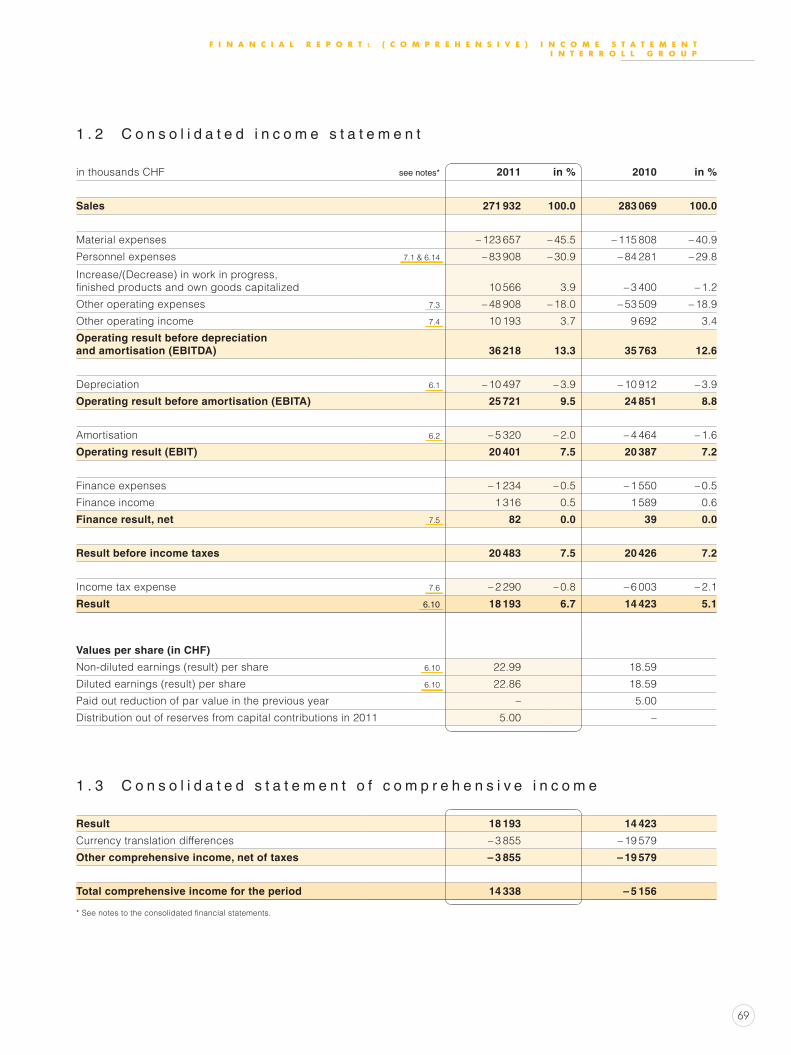
69
1 . 2 P lT 2 0 : Z 4 6
1 . 2 C o n s o l i d a t e d i n c o m e s t a t e m e n t
in thousands CHF see notes* 2011 in % 2010 in %
Sales 271 932 100.0 283 069 100.0
Material expenses – 123 657 – 45.5 – 115 808 – 40.9
Personnel expenses 7.1 & 6.14 – 83 908 – 30.9 – 84 281 – 29.8
Increase/(Decrease) in work in progress, finished products and own goods capitalized 10 566 3.9 – 3 400 – 1.2
Other operating expenses 7.3 – 48 908 – 18.0 – 53 509 – 18.9
other operating income 7.4 10 193 3.7 9 692 3.4
Operating result before depreciation and amortisation (EBITDA) 36 218 13.3 35 763 12.6
Depreciation 6.1 – 10 497 – 3.9 – 10 912 – 3.9
Operating result before amortisation (EBITA) 25 721 9.5 24 851 8.8
Amortisation 6.2 – 5 320 – 2.0 – 4 464 – 1.6
Operating result (EBIT) 20 401 7.5 20 387 7.2
Finance expenses – 1 234 – 0.5 – 1 550 – 0.5
Finance income 1 316 0.5 1 589 0.6
Finance result, net 7.5 82 0.0 39 0.0
Result before income taxes 20 483 7.5 20 426 7.2
Income tax expense 7.6 – 2 290 – 0.8 – 6 003 – 2.1
Result 6.10 18 193 6.7 14 423 5.1
1 . 2 P lT 4 8 : y 5 2
Values per share (in CHF)
non-diluted earnings (result) per share 6.10 22.99 18.59
Diluted earnings (result) per share 6.10 22.86 18.59
Paid out reduction of par value in the previous year – 5.00
Distribution out of reserves from capital contributions in 2011 5.00 –
1 . 2 P lT 5 4 : Z 6 3
1 . 3 C o n s o l i d a t e d s t a t e m e n t o f c o m p r e h e n s i v e i n c o m e
Result 18 193 14 423
Currency translation differences – 3 855 – 19 579
Other comprehensive income, net of taxes – 3 855 – 19 579
Total comprehensive income for the period 14 338 – 5 156
* See notes to the consolidated financial statements.
F i n a n c i a l R e p o R t : ( c o m p R e h e n s i v e ) i n c o m e s t a t e m e n ti n t e R R o l l G R o u p
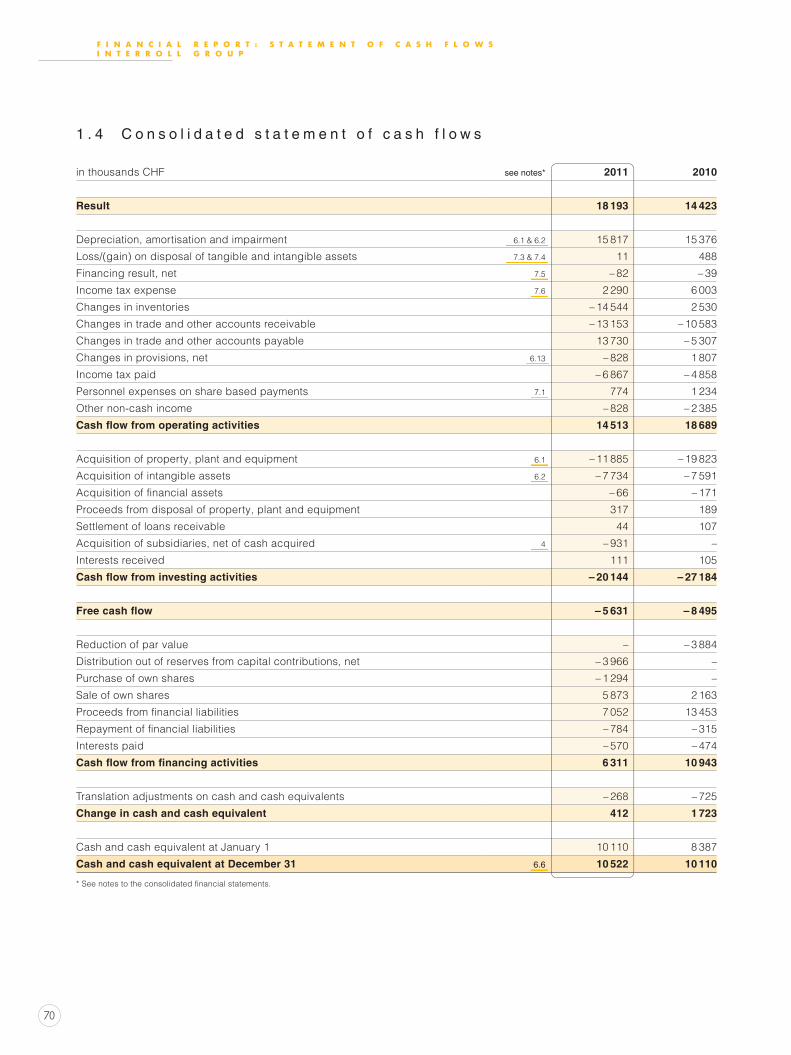
70
F i n a n c i a l R e p o R t : s t a t e m e n t o F c a s h F l o w si n t e R R o l l G R o u p
1 . 4 C f lT 2 0 : X 6 4
1 . 4 C o n s o l i d a t e d s t a t e m e n t o f c a s h f l o w s
in thousands CHF see notes* 2011 2010
Result 18 193 14 423
Depreciation, amortisation and impairment 6.1 & 6.2 15 817 15 376
Loss/(gain) on disposal of tangible and intangible assets 7.3 & 7.4 11 488
Financing result, net 7.5 – 82 – 39
Income tax expense 7.6 2 290 6 003
Changes in inventories – 14 544 2 530
Changes in trade and other accounts receivable – 13 153 – 10 583
Changes in trade and other accounts payable 13 730 – 5 307
Changes in provisions, net 6.13 – 828 1 807
Income tax paid – 6 867 – 4 858
Personnel expenses on share based payments 7.1 774 1 234
other non-cash income – 828 – 2 385
Cash flow from operating activities 14 513 18 689
Acquisition of property, plant and equipment 6.1 – 11 885 – 19 823
Acquisition of intangible assets 6.2 – 7 734 – 7 591
Acquisition of financial assets – 66 – 171
Proceeds from disposal of property, plant and equipment 317 189
Settlement of loans receivable 44 107
Acquisition of subsidiaries, net of cash acquired 4 – 931 –
Interests received 111 105
Cash flow from investing activities – 20 144 – 27 184
Free cash flow – 5 631 – 8 495
Reduction of par value – – 3 884
Distribution out of reserves from capital contributions, net – 3 966 –
Purchase of own shares – 1 294 –
Sale of own shares 5 873 2 163
Proceeds from financial liabilities 7 052 13 453
Repayment of financial liabilities – 784 – 315
Interests paid – 570 – 474
Cash flow from financing activities 6 311 10 943
Translation adjustments on cash and cash equivalents – 268 – 725
Change in cash and cash equivalent 412 1 723
Cash and cash equivalent at January 1 10 110 8 387
Cash and cash equivalent at December 31 6.6 10 522 10 110
* See notes to the consolidated financial statements.

71
F i n a n c i a l R e p o R t : s t a t e m e n t o F c h a n G e s i n e q u i t yi n t e R R o l l G R o u p
1 , 5 e Q u i T yT 2 0 : a a 4 9
1 . 5 C o n s o l i d a t e d s t a t e m e n t o f c h a n g e s i n e q u i t y
in thousands CHF see notes*sHARe
CAPITALsHARe
PReMIuM
ReseRve FoR own
sHARestRAnsLAtIon
ReseRveRetAIneD
eARnInGs TOTAl EquITy
Balance at January 1, 2010 12 810 28 145 – 32 386 – 20 422 144 877 133 024
Result 14 423 14 423
Translation adjustments – 19 579 – 19 579
Other comprehensive income, net of taxes – – – – 19 579 – – 19 579
Total comprehensive income – – – – 19 579 14 423 – 5 156
Reduction of par value – 4 270 386 – 3 884
Share based payments 7.1 & 7.6 325 909 1 234
Sale of own shares incl. tax effects 6.9 – 893 3 132 2 239
Balance at December 31, 2010 8 540 27 577 – 27 959 – 40 001 159 300 127 457
Result 18 193 18 193
Translation adjustments – 3 855 – 3 855
Other comprehensive income, net of taxes – – – – 3 855 – – 3 855
Total comprehensive income – – – – 3 855 18 193 14 338
Appropriation to reserves from capital contributions 4 504 – 4 504 –
Distribution from reserves from capital contributions, net – 3 966 – 3 966
Share based payments 7.1 & 7.6 – 276 1 050 774
Sale of own shares incl. tax effects 6.9 – 1 209 7 185 5 976
Purchase of own shares incl. tax effects 6.9 – 1 294 – 1 294
Balance at December 31, 2011 8 540 26 630 – 21 018 – 43 856 172 989 143 285
* See notes to the consolidated financial statements.

72
G e n e R a l i n F o R m a t i o n t o t h e F i n a n c i a l s t a t e m e n t si n t e R R o l l G R o u p
2 g e n e r a l i n f o r m aT i o n T o T h e f i n a n C i a l s TaT e m e n T s
2 . 1 C o n v e n t i o n o f p r e p a r a t i o n
general notes to the convention of preparation
The 2011 consolidated financial statements of Interroll Group are based on the annual financial
statements of INTeRROLL HOLDING LTD., Sant’Antonino and its subsidiaries as of December 31,
2011, drawn up according to uniform Group accounting principles. The consolidated financial
statements present a true and fair view of the financial position, results of operations and cash
flows in accordance with the International Financial Reporting Standards (IFRS) and comply
with Swiss law.
The consolidated financial statements are based on historical cost except for marketable
securities, investments not involving significant influence and derivative financial instruments,
which are stated at fair value.
The preparation of financial statements in conformity with IFRS requires management to make
judgments, estimates and assumptions that affect the application of policies and reported
amounts of assets and liabilities, income and expenses. These judgments, estimates and assump-
tions are based on historical experience and other factors that are believed to be reasonable
under the given circumstances. Actual results may differ from these estimates.
The estimates and underlying assumptions are reviewed on an ongoing basis. Revisions to
accounting estimates are recognized in the period in which the estimate is revised if the revision
affects only that period or in the period of the revision and future periods if the revision affects
both current and future periods.
Judgments made by management in the application of IFRS that have a significant effect on
the consolidated financial statements and estimates with a significant risk of material adjustment in
the next years are disclosed under “2.2 – Critical accounting estimates and judgments”.

73
G e n e R a l i n F o R m a t i o n t o t h e F i n a n c i a l s t a t e m e n t si n t e R R o l l G R o u p
revised ias/ifrs standards and interpretations
The Group’s results are in line with IAS/IFRS standards and interpretations. Thus, the Group
regularly monitors the amendments and new standards published by the International Accounting
Standards Boards (IASB). In the course of the business year 2011, the following amendments
resp. new standards and interpretations were enacted. None of them and neither the improvement
project 2010 had a major impact on the financial statements of the Interroll Group:
• Amendment of IAS 24 (effectove as per 1.1.2011, disclosures on related party transactions)
• Amendment of IAS 32 (effective as per 1.2.2010, presentation of financial instruments)
• Amendment of IFRS 1 (effective as per 1.7.2010, first time adoption of IAS/IFRS)
• Amendment of IFRIC 14 (effective as per 1.1.2011, interpretation to IAS 19)
• New: IFRIC 19 (effective as per 1.7.2010, extinguishing financial liabilities with equity
instruments)
future new or revised ias/ifrs standards and interpretations
The following new or revised standards and interpretations were enacted before the balance sheet
date but will come into force later. Interroll does not early adopt these standards and interpreta-
tions in its consolidated financial statements:
• New: IFRS 9 (effective as per 1.1.2015, financial instruments)
• New: IFRS 10 (effective as per 1.1.2013, consolidated financial statements)
• New: IFRS 11 (effective as per 1.1.2013, joint arrangements)
• New: IFRS 12 (effective as per 1.1.2013, disclosure of interests in other entitites)
• New: IFRS 13 (effective as per 1.1.2013, fair value measurement)
• Amdendment of IAS 1 (effective as per 1.7.2012, presentation of other comprehensive result)
• Amdendment of IAS 12 (effective as per 1.1.2012, deferred income tax)
• Amdendment of IAS 19 (effective as per 1.1.2013, pension costs)
• Amdendment of IAS 27 (effective as per 1.1.2013, separate financial statements)
• Amdendment of IAS 28 (effective as per 1.1.2013, investments in associates and joint ventures)
• Amdendment of IFRS 7 (effective as per 1.7.2011, financial instruments)
As per amendment of IAS19, actuarial gains or lossses from pension liabilities/assets must be
debited or credited to the other comprehensive income at the date of their origine. This will have
an impact on the Group’s equity in the same dimension as actuarial gains or losses from pension
liabilities/assets incurred over the past years. It will not change the value of the equity at a material
amount.
The Group Management currently analysis potential impacts on the other new or amended
standards and interpretations. the amendments may result in additional disclosures.

74
G e n e R a l i n F o R m a t i o n t o t h e F i n a n c i a l s t a t e m e n t si n t e R R o l l G R o u p
2 . 2 C r i t i c a l a c c o u n t i n g e s t i m a t e s a n d j u d g m e n t s
the Group makes estimates and assumptions concerning the future. the resulting accounting
estimates can, by definition, deviate from the actual outcome. The estimates and assumptions that
have a significant risk of causing a material adjustment to the carrying amount of assets and
liabilities within the next financial years are discussed below.
a) Income tax expense
The Holding company and its subsidiaries are subject to income taxes. Significant judgment is
required in determining the required worldwide provision for current and deferred income taxes
and the realization of tax losses carried forward. There are many transactions and calculations
made for which the final tax determination is uncertain in the year under review. Where final tax
assessments or tax audits of such matters are different from the amounts that were initially
recorded, such differences may materially impact assets, liabilities, income tax and deferred tax
provisions in the period in which such determination is made. The relevant figures are outlined
in note 7.6.
b) Recoverable amount of goodwill, patents and licenses
The assessment of the recoverable amount of goodwill and other intangible assets is, by
definition, subject to uncertainties regarding expected future cash flows. It requires making
assumptions and calculating parameters, whose adequacy will only turn out in the future.
We refer to comments made under note 6.2 that also include the relevant carrying amounts.
c) Personnel related provisions
The assessment of provisions and pension liabilities is, by definition, subject to uncertainties
regarding future cash flows. It requires making assumptions and determining parameters, whose
adequacy will only become clear in the future. We refer to comments made under notes 6.14
and 6.15, which also include the relevant carrying amounts.

75
G e n e R a l i n F o R m a t i o n t o t h e F i n a n c i a l s t a t e m e n t si n t e R R o l l G R o u p
2 . 3 P r i n c i p l e s o f c o n s o l i d a t i o n a n d v a l u a t i o n
general notes to the principles of consolidation
The consolidated financial statements of INTeRROLL HOLDING LTD. include the parent company’s
financial statements and the financial statements of all directly or indirectly held Swiss and foreign
subsidiaries where the parent company holds more than 50 % of the voting rights or effectively
exercises control through other means.
The full consolidation method is applied, whereby the assets, liabilities, income and expenses
are fully incorporated. The proportion of the net assets and net income attributable to minority
shareholders is presented separately as minority interest in the consolidated statement of financial
position, the consolidated income statement and the consolidated statement of comprehensive
income.
Accounts payable to, accounts receivable from, income and expenses between the companies
included in the scope of consolidation are eliminated. Intercompany profits included in inventories
of goods produced are also eliminated.
Subsidiaries acquired during the year are included in the consolidated financial statements from
the date on which control is obtained, while subsidiaries sold are excluded from the consoli-
dated financial statements from the date on which control is given up. The capital consolidation
at acquisition date is effected on the purchase method. The acquisition price for a business
combination is defined by the sum of assets and liabilities acquired or incurred, measured at fair
value, and of the sum of equity instruments issued. Transactions costs related to a business com-
bination are expensed. The goodwill resulting from such business combination is to be recognized
as an intangible asset. It corresponds to the excess of the sum of the acquisition price, the
amount of non-controlled interests of the entity acquired, the fair value of equity instruments held
already held before over the balance of assets, liabilities and contingent liabilities at fair value.
For the valuation of non-controlled interests there are options per transaction. either the non-con-
trolled interests is valued at fair value or based on the proportion of the net assets acquired
at fair value related to the non-controlled interests. An eventual negative goodwill is immediately
recognized in the income statement after review of the fair value of the net assets acquired
and eliminated against the purchase price. The goodwill is subject to a yearly impairment test or
even before if indications for an early impairment test exist.
Changes in the amount of holding which do not result in a loss of control are considered to be
transactions with equity holders. Any difference between the acquisition price paid resp. the
consideration received and the amount, by which the non-controlled interests value is adjusted, is
recognized in the equity.

76
G e n e R a l i n F o R m a t i o n t o t h e F i n a n c i a l s t a t e m e n t si n t e R R o l l G R o u p
Investments in associates are investments where the parent company is either (directly or indirect-
ly) entitled to 20 % to 50 % of the voting rights or has considerable influence through other means.
Investments in associates are accounted for by applying the equity Method. under this method, the
investment is initially recorded at the purchase price and subsequently increased or decreased
by the share of the associate’s profits or losses incurred after the acquisition, adjusted for any impair-
ment losses. the Group’s share of results of associates is recognised in the income statement
and in the statement of comprehensive income under share of profit and loss of associates. Goodwill
included in the purchase price, representing any excess of consideration over the Group’s share
in net assets of the associate, is recognised as part of the investment’s carrying amount. Dividends
received during the year reduce the carrying amount of such investments.
Investments of which the Group does not hold a significant position of voting rights or of which
the Group holds less than 20 %, are not consolidated but stated at their estimated fair value. Such
investments are presented under financial assets at their estimated fair value. Any fair value
adjustments are recognized in retained earnings. Fair value adjustments are recycled through the
income statement at the date of disposal.
foreign currency translation
The consolidated financial statements are presented in Swiss Francs (CHF). All assets and liabilities
of the consolidated foreign subsidiaries are translated using the exchange rates prevailing at
the closing date. Income, expenses and cash flows are translated at the average exchange rates
for the year under review. The foreign currency translation differences resulting from applying
different translation rates to the statement of financial position, the income statement and the state-
ment of comprehensive income are added to or deducted from the line translation reserve of
the equity. The same principle is applied for those resulting from the translation of the subsidiaries’
opening net asset values at year end rates and those arising from long term intercompany loans
(net investment approach).
Transactions in consolidated entities where the transaction currency is different from the functional
currency of the entity are recorded using exchange rates prevailing at the time of the transaction.
Gains or losses arising on settlement of these transactions are included in the income statement.
Monetary assets and liabilities denominated in foreign currencies are translated using the exchange
rates prevailing at year end (closing date). Any gains or losses resulting from this translation are
also recognized in the income statement.

77
G e n e R a l i n F o R m a t i o n t o t h e F i n a n c i a l s t a t e m e n t si n t e R R o l l G R o u p
The following most important exchange rates were used for the translation of financial statements
denominated in foreign currencies:
Current/non-current distinction
Current assets are assets expected to be realised within one year or consumed in the normal
course of the Group’s operating cycle or assets held for trading purposes. All other assets are
classified as non-current assets.
Current liabilities are liabilities expected to be settled by use of cash generated in the normal
course of the Group’s operating cycle or liabilities due within one year from the reporting
date. These also include short term borrowings made as part of credit limits granted for an
indefinite period, but subject to a termination period of less than one year from reporting
date. All other liabilities are classified as non-current liabilities.
2 , 2 f X - r aT e sT 2 0 : a a 3 3
InCoMe stAteMent
(AveRAGe RAtes)
BALAnCe sHeet
(YeAR enD RAtes)
2011 2010Change
in % 31.12.2011 31.12.2010Change
in %
1 euR 1.233 1.373 – 10.2 1.216 1.252 – 2.9
1 uSD 0.882 1.040 – 15.2 0.940 0.934 0.6
1 CAD 0.893 1.007 – 11.3 0.920 0.939 – 2.0
1 GBP 1.418 1.602 – 11.5 1.455 1.458 – 0.2
1 sGD 0.703 0.765 – 8.1 0.723 0.728 – 0.7
1 CnY 0.136 0.154 – 11.3 0.149 0.142 5.2
1 JPY 0.011 0.012 – 6.7 0.012 0.012 5.2
1 PLZ 0.299 0.343 – 12.9 0.273 0.316 – 13.8
100 KRw 0.080 0.090 – 11.0 0.081 0.083 – 2.8
1 tHB 0.029 0.033 – 12.2 0.030 0.031 – 4.5
1 ZAR 0.122 0.142 – 14.2 0.116 0.142 – 18.2

78
G e n e R a l i n F o R m a t i o n t o t h e F i n a n c i a l s t a t e m e n t si n t e R R o l l G R o u p
Cash and cash equivalents
Cash and cash equivalents include cash on hand, postal and bank accounts, as well as credit
balances payable on demand and deposits with a residual maturity of not more than 90 days at
acquisition date. These balances are stated at nominal value.
Statement of cash flows
The statement of cash flows presents, net of any foreign exchange rate effects, cash flows
during the year classified by operating, investing and financing activities, thereby providing infor-
mation about the changes of cash and cash equivalents during the reporting period. Cash
equivalents are held for the purpose of meeting the Group’s short term cash commitments rather
than for investment or any other purposes.
Net cash from operating activities is determined using the indirect method, whereby the net result
for the year is adjusted for:
a) effects of transactions of non-cash nature;
b) deferrals or accruals of past or future operating cash receipts or payments;
c) items of income or expense associated with investing or financing cash flows.
The effect of foreign exchange rate changes on cash and cash equivalents in foreign currencies is
disclosed separately.
Trade and other accounts receivable
Trade and other accounts receivable are stated at amortised cost, generally equalling nominal
value. The amount of valuation adjustments corresponds to the difference between the carrying
amount and the net present value of the future estimated cash flow. The valuation adjustments
include individual impairment for specifically identified positions, where indication exists that the
outstanding amount might not be fully recovered.
Lump sum impairment covers expected losses that cannot be excluded based on historical data
and payment statistics. As soon as sufficient evidence is available that the receivable will
definitively not be recovered, the related amount is directly written off and offset with the specific
individual impairment respectively.
marketable securities
Marketable securities are stated at their fair value through the income statement as of balance
sheet date. unrealised gains and losses are included in the financial result.

79
G e n e R a l i n F o R m a t i o n t o t h e F i n a n c i a l s t a t e m e n t si n t e R R o l l G R o u p
inventories
Inventories are stated at the lower of cost (purchase price or Group production cost) and net
realisable value. The cost of inventories is calculated using the weighted average method.
Production overheads are allocated to inventories on a proportional basis. Slow moving goods
and obsolete stocks are impaired. Intercompany profits included in inventories are eliminated
by affecting net result.
Property, plant and equipment
Property, plant and equipment are stated at cost less accumulated depreciation and any impairment
losses. Non-current assets acquired by way of finance leases are recognised at the lower of the
present value of future minimum lease payments and fair value, and depreciated accordingly. the
related leasing liabilities are presented at their present value.
Depreciation is recognised on a straight-line basis over the estimated useful life and considering
a potential residual value. The following useful economic life terms apply to the Group's main asset
categories:
Buildings 25 years
Machinery 10 years
vehicles 5 years
Office machines and furniture 5 years
tools and moulds 5 years
It infrastructure 3 years
Components of major investments in fixed assets with different estimated useful lives are recog-
nised separately and depreciated accordingly. estimated useful lives and estimated residual
values are revised on a yearly basis as per reporting date and resulting adjustments are recorded
in the income statement.
Assets under construction which completion has not yet been concluded or which cannot be
used yet are capitalised based on incurred costs as per closing date. Respective depreciation is
recognised when the construction can be used.
Interests directly related to the acquisition or construction of property, plant and equipment is
capitalised and allocated to the related asset.
80
G e n e R a l i n F o R m a t i o n t o t h e F i n a n c i a l s t a t e m e n t si n t e R R o l l G R o u p
intangible assets
Intangible assets include goodwill, intangible assets purchased in the course of business
combinations (patented and unpatented technology, customer relationship), licenses and patents
and similar rights acquired from third parties as well as software acquired from third parties.
These assets are stated at cost value and are are amortised on a straight-line basis over the
following, expected useful life time:
Standard software 3 years
eRP – Software 8 years
Customer relationship 5 – 10 years
Patents, technology and licenses 6 years
Acquired customer relationship are customer values identified within the scope of IFRS 3. They
are amortised based on their estimated melt off being a period of 5 – 10 years. In markets in
which Interroll holds a solid market position, customer value is amortised over 10 years. A shorter
amortization period is defined in markets with stiff competition.
Patents and technical know-how are amortised over their expected useful life. In view of the
innovative market- and competition environment the amortization period has been determined to
be 6 years.
Furthermore intangible values acquired within business combination may be identified. Such result
from individual contractual agreements. These values are amortized over the period deviated from
the contractual agreement.
Goodwill and intangible assets with an indefinite useful life are allocated to specific cash generating
units in order to allow the identification of possible impairment. Such impairment tests are carried
out on a yearly basis and any impairment is recognised in the income statement. Goodwill arising
from the acquisition of a foreign entity is attributed to that entity’s net assets and reported in the
functional currency of that entity being translated to the Group’s reporting currency at the year end
rate.
financial assets
Financial assets mainly comprise loans receivable that are stated at amortised cost less any valua-
tion allowance. The recognition of interest income is based on the effective interest rate method.
Moreover this item includes investments of less than 20 %. They are stated at their estimated fair
value. Any fair value adjustments are recognised in the equity and are recycled in the income
statement only at the date of disposal or when impairment arises.

81
G e n e R a l i n F o R m a t i o n t o t h e F i n a n c i a l s t a t e m e n t si n t e R R o l l G R o u p
impairments
The carrying value of long term non-financial assets except assets from retirement benefits
and assets from deferred taxes are assessed at least once a year. If indications for an impairment
exist, a calculation of the recoverable amount is performed (impairment test). Goodwill, other
intangible assets with an indefinite useful lifetime and intangible assets which are not yet available
for use, the recoverable amount is calculated regardless of the existence of indications. If the
carrying value of such an asset or the cash generating unit to which such an asset belongs to
exceeds the recoverable amount an adjustment is recognized through the income statement.
Impairments on a cash generating unit or a group of cash generating units are first adopted on the
goodwill and are thereafter proportionally split onto the other assets of the unit (or the Group).
The recoverable amount is the higher value of fair value less selling costs and value in use.
The estimated future discounted cash flows are evaluated to determine the value in use.
The discounting rate applied corresponds to a pre-tax rate which reflects the risk related the
assets. If an asset does not largely generate independent cash flows the recoverable amount
of the cash generating unit is calculated to which the asset concerned belongs to.
Impairments on the remaining assets are reversed if the estimations made in the calculation of the
recoverable amount have changed and either has resulted in a reduction of the impairment
amount or no impairment is required anymore. An appreciation in value of the goodwill may not
be performed.
non-current assets held for sale
Tangible assets or a group of assets are classified as “non-current assets held for sale” if their
carrying value will most probably be realised in a divestment transaction rather than by being used
in the normal course of business. Such assets are brought actively onto market and should be
sold within one year. Non-current assets held for sale are presented at the recoverable amount,
which is the lower of book value or fair value less costs to sell.
Trade accounts payable
Trade accounts payable are stated at amortised cost, generally equalling nominal value.
82
G e n e R a l i n F o R m a t i o n t o t h e F i n a n c i a l s t a t e m e n t si n t e R R o l l G R o u p
financial liabilities
Loans payable and overdrafts are stated at amortised cost. The recognition of interest expenses is
based on the effective interest rate method.
Provisions
Provisions relate to product warranties and impending losses whose amount and timing is uncer-
tain. They are recognised if the Group has an obligation based on past occurrences at balance
sheet date or a cash drain is probable and can be reliably determined. The amounts recognised
represent management’s best estimate of the expenditure that will be required to settle the
obligation. Providing the effect is material, long term provisions are discounted.
shareholders’ equity
Shareholders’ equity is categorised as following:
a) share capital
the share capital contains the fully paid in registered shares.
b) Share premium
Share premium comprises payments from shareholders that exceed the par value as well as
realised gains/losses including tax on transactions with own shares.
c) Reserve for own shares
The acquisition price of own shares is disclosed as a reduction of shareholders’ equity. Realised
gains and losses on transactions with own shares are recognised in share premium. Com-
pensation and cash inflows resulting from the issue and subsequent possible exercise of share
options are credited to share premium.
d) translation reserve
Translation reserve consists of accumulated translation differences resulting from translation of
group subsidiaries’ financial statements with a functional currency other than Swiss Franc
and of equity-alike intercompany loans. The changes in currency differences is presented in the
consolidated statement of comprehensive income.
e) Retained earnings
Retained earnings contains not distributed profits.

83
G e n e R a l i n F o R m a t i o n t o t h e F i n a n c i a l s t a t e m e n t si n t e R R o l l G R o u p
revenue recognition, income from services
Revenue is generally recognised upon delivery (transfer of risk and use), depending on the size
and the complexity of the order, when technically approved by the customer. The Group esta-
blishes appropriate warranty provisions relating to rendered services in order to cover expected
claims. Services which the Interroll Group performs in direct relation to its core products sold
are recognised upon delivery in net sales. the Group performs services to third parties in connec-
tion with administrative tasks and freight. Furthermore, the Group grants distribution licenses
to selected franchisees. Revenue resulting from these services are disclosed as other operating
income in the income statement.
material expenses
Material expenses include all costs of raw materials and consumables used, goods purchased
and third-party manufacturing, processing or conversion of the Group’s products (services pur-
chased).
Product development
expenditure on research and development is only capitalised when the cumulative recognition
criteria of IAS 38 are met. expenses for product development include wages and salaries, material
costs, depreciation of technical equipment and machinery dedicated to research and develop-
ment, as well as proportional overhead costs. Such expenses are included in the respective line
item of the income statement.
Retirement benefits
The Group sponsors pension plans according to the national regulations of the countries in which
it operates. All significant pension plans are operated through pension funds that are legally
independent from the Group. Generally, they are funded by employees’ and employers’ contri-
butions. The foreign pension schemes are normally defined contribution plans whereby the
pension expense for a period equals the companies’ contributions during that period. The Swiss
and French pension schemes have certain characteristics of a defined benefit plan; the financial
impact of this plan on the consolidated financial statements is determined based on the Projected
unit Credit Method.
Actuarial gains and losses arising from the periodical reassessments of defined benefit plans are
recognised to the extent that they exceed 10 % of the higher of the present value of the defined
benefit obligation and the fair value of plan assets. The amount exceeding this “corridor” is amor-
tised over the expected average remaining duration of employment of the employees participating
in the plan.

84
G e n e R a l i n F o R m a t i o n t o t h e F i n a n c i a l s t a t e m e n t si n t e R R o l l G R o u p
employee participation plans
Certain employees participate in equity based compensation plans of INTeRROLL HOLDING LTD.
All equity based compensation granted to these employees is valued at fair value at grant date
and recognised as personnel expense over the period until vesting date. The fair value is calculated
on the basis of the Binomial method. Discounts granted to beneficiaries on the unconditional
purchase of Interroll shares are recognised in the income statement at grant date. Cash inflows
resulting from equity based participation plans are recognised as an increase of equity. Cash
compensated participation plans are recognised as other liabilities and are valued at fair value at
balance sheet date.
operating lease expenses
Property, plant and equipment that are held under operating leases are not recognised on the
statement of financial position. The operating lease expense is recognised in the income statement
on a straight-line basis over the lease contract period. Operating lease obligations depending on
revenues are estimated and accrued as they become due.
financial result
Interest expenses on loans and finance lease liabilities are recognised as financial expenses,
whereas interest income on financial assets is recognised in financial income, both on an accrual
basis. Moreover the financial result includes foreign exchange gains and losses arising from the
translation of items of the statement of financial position and transactions in foreign currencies as
well as changes in fair value of financial instruments.
income tax expense
Current income taxes are calculated on the statutory results of the Group companies at the
enacted or substantively enacted tax rate. They also include adjustment charges and credit notes
issued on previous years’ results.
Changes in deferred taxes are generally recognized in the income tax position, unless the underly-
ing transaction has been directly recognised in the other comprehensive income. In such case
the related income tax is also directly recognized in the statement of comprehensive income or in
equity. Temporary differences resulting from initial recognition of assets and liabilities are not
recognised in the income statement. Temporary differences on the participation value of subsidiar-
ies are not recognised if it is probable that the temporary differences will not go into reverse in
the foreseeable future.
Deferred taxes are calculated using local enacted or substantively enacted tax rates. The future
benefits of tax loss carry-forwards are recognised as an asset if it is probable that future taxable
profits will be available to realise such benefits.

85
G e n e R a l i n F o R m a t i o n t o t h e F i n a n c i a l s t a t e m e n t si n t e R R o l l G R o u p
Derivative financial instruments
Derivatives financial instruments are stated at fair value. The method of recognizing gains or
losses depends on the type of the underlying transaction. the Group designates certain transac-
tions with derivatives as either hedges of the fair value of recognised assets or liabilities (fair
value hedges); or hedges of highly probable forecasted financial transactions (cash flow hedges).
The Group documents at the inception of the transaction the relationship between hedging
instruments and hedged items within the context of its risk management objective and strategy.
The Group also documents its assessment of the effectiveness of the derivatives at acquisition
and during its term in relation to both, the values hedged or also in view of future cash flows.
Changes in fair value are recognised as follows:
a) Fair value hedges
Changes in the fair value of derivatives designated and qualified as fair value hedges are
recorded in the income statement, together with any changes in the fair value of the hedged
assets or liabilities.
b) Cash flow hedges
Changes in fair value of derivatives designated and qualified as cash flow hedges are recog-
nised in equity. Amounts accumulated in equity are recycled to the statement of comprehensive
income in the periods when the hedged item will affect profit or loss. When a hedging instru-
ment expires or is sold, or when a hedge no longer meets the criteria for hedge accounting, any
cumulative gain or loss existing in equity at that time remains in equity and is recognised
when the initial transaction is ultimately recognized in the income statement. When a forecast
transaction is no longer expected to occur, the cumulative gain or loss that was reported in
equity is immediately transferred to the income statement.
c) Other securities or financial instruments
Certain derivatives do not qualify for hedge accounting. Changes in the fair value of such
hedging instruments are recognised immediately in the income statement. the fair value of
derivatives traded in public markets is based on quoted market prices at the balance sheet
date. The quoted market price used for financial assets is the current bid price; the appropriate
quoted market price for financial liabilities is the current ask price. The fair value of derivatives
which are not traded publicly (for example, “over-the-counter” derivatives) is determined by
a valuation provided by the financial institution from whom the derivative has been acquired.

86
G e n e R a l i n F o R m a t i o n t o t h e F i n a n c i a l s t a t e m e n t si n t e R R o l l G R o u p
segment reporting
As per 1st January 2011 the Interroll Group has simplified its operational management structure
and has given up its former divisional structure. With the new operational structure, previous
segments were suspended and the Group Management was realigned.
The Interroll Group consists now of one single business unit. The complete product range is sold
in all markets through the respective local sales organisation. The customer groups being OeM’s
(original equipment manufacturers), system integrators and endusers are taken care by tailor-made
product offerings and differentiated consulting levels. The Interroll manufacturing units focus on
the production of specific product ranges. Assembly units receive semi-finished products from the
manufacturing units and assemble a wide product range for their local markets. The Interroll
Research Center, which is centrally located, develops new application technologies and new
products for all product groups. the manufacturing units continuously develop further the
current product ranges they are focused on.
The Group Management and the Interroll management structure are organized by functions (over-
all management, Products & Technology, Global Sales & Services, marketing, finance and IT). The
financial management of the Group by the Board of Directors is effected on one hand by turnover
of the product groups and geographical markets and on the other hand by the reporting of the
consolidated financial statements. The Group Management additionally assesses the achievement
of financial and qualitative targets of all legal entities.
Based on the new management structure, financial reporting to the chief operating decision
makers is carried out in one reportable segment since January 1st, 2011. The previous period was
adjusted accordingly.

87
R i s k m a n a G e m e n ti n t e R R o l l G R o u p
3 r i s k m a n a g e m e n T
3 . 1 o p e r a t i o n a l a n d s t r a t e g i c r i s k m a n a g e m e n t
Risk management on group level supports strategic decision making. operational and strategic
risk management coordinates and monitors risks arising from the economic activities of the Group.
A systematic operational and strategic risk analysis is performed annually by the group manage-
ment. In an annual strategy meeting, Group Management discusses and analysis such risks.
The board of directors is regularly informed in a uniform manner with the nature, scope, assessment
and counteractive measures of the risks.
3 . 2 f i n a n c i a l r i s k m a n a g e m e n t
General information to the financial risk management of the Interroll Group
The Group’s activities expose it to a variety of financial risks: market risk (currency risk, interest
rate risk and price risk), credit risk, liquidity risk and cash flow risk. The Group’s risk management
program focuses on the unpredictability of financial markets and seeks to minimize potential
adverse effects on Group’s financial performance.
The Board of Directors has the supreme responsibility for risk management. The Board of Directors
appoints thereto the Audit Committee, who is responsible for the development and the supervision
of the risk management principles. the Audit Committee reports regularly to the Board of Directors.
The principles established for risk management are geared to identify and analyze those risks that
may impact the Group, to define adequate limits and to perform controls over the risks and their
adherence to. The risk management principles and the related procedures are regularly verified in
order to consider changing market conditions and operations of the Group. the target is to
develop management regulations and management processes and a disciplined and constructive
control environment through existing training and guidelines ensuring a disciplined and conscious
handling of risks.
The Audit Committee supervises management in the control of compliance with principles and
processes. Their adequacy is permanently verified in respect of the risks that the Group is
exposed to. The Audit Committee is supported in this respect by the internal audit department.
88
R i s k m a n a G e m e n ti n t e R R o l l G R o u p
Financial risk management is carried out by the central treasury department. Group Treasury
identifies, evaluates and reduces financial risks in close co-operation with the Group’s operating
units and reports at regular intervals to the Audit Committee.
The following sections provide a summary of the scope of individual risks and on the targets,
principles and processes implemented for measuring, monitoring and hedging financial risks.
Additional information on the financial risks is included in the notes to the consolidated financial
statements (see note “6.8 – Financial risks”).
market risk
Market risks to which the Interroll Group is exposed to can be summarised into the following three
main risk categories:
a) Currency risk exposure
The Group operates internationally and is exposed to foreign exchange risks arising from
various currencies. Foreign exchange risks arise from future commercial transactions and from
recognised assets and liabilities. To manage its foreign exchange risk arising from future
commercial transactions and recognised assets and liabilities, the Group operates an internal
monthly “Netting” process. Net exposure resulting from assets and liabilities recognised is
partially reduced using forward currency contracts. Such contracts are entered into only with
high-credit-quality financial institutions. Furthermore the decentralised structure of the Group
contributes to a substantial reduction of foreign currency exchange risks.
b) Interest rate risk
Financial assets and liabilities contain interest bearing loans at either a fixed or a variable rate.
Relating interest risks are disclosed in 6.8.
c) Price risk
The Group is exposed to raw material price changes as well as to price changes on financial
liabilities and assets. Raw material price risks are not hedged while risks from financial assets
and liabilities may partially or fully reduced using derivative financial instruments (as described
in 2.3 – Principles of consolidation and valuation, section “derivative financial instruments”).

89
R i s k m a n a G e m e n ti n t e R R o l l G R o u p
Credit risk
The risk of default is the risk to incur a financial loss when a customer or a counterparty to a
financial instrument does not fulfill its legal obligation. The default risk at Interroll exists on trade
and other accounts receivable and on cash and cash equivalents.
Customers exceeding euR 5 000 credit limit are verified for their creditworthiness before the order
is executed. The creditworthiness verification is also based on the credit information database
provided by an international service provider leading in this sector. Their software allows determining
a credit limit per single customer, based on specifically determined calculation formulas. The
calculation formulas have been defined by the Interroll Group.
Accumulation of credit risks in trade and other accounts receivable is limited due to numerous
customers and their worldwide location. The extent of credit risks is mainly determined by the
individual characteristics of each single customer. the risk evaluation includes an assessment of
the creditworthiness by considering the customer’s financial situation, its credit history and other
factors. Sales and revenue from services are performed only with customers whose credit worthiness
is proved through the above process. A credit limit is defined for each customer. These limits are
verified at least once a year.
Interroll invests its funds in short term deposits at a multitude of banks with whom long standing
relationships exist. Such deposits have a maturity date shorter than twelve months. Likewise
transactions with derivative financial instruments are entered into only with major financial institutions.
Interroll does not hold material open positions with these institutions.
The maximum credit risk from financial instruments corresponds to the balance sheet amount
of each single financial asset. There are no guarantees or other liabilities that could increase the
risk over the corresponding amount in the statement of financial position.
liquidity risk
Liquidity risk is the risk that the Group cannot fulfil its financial obligations on time.
Prudent liquidity risk management implies maintaining sufficient cash and marketable securities,
the availability of funding through an adequate amount of committed credit facilities and the
ability to close market positions at any time. Due to the dynamic nature of the underlying business,
Group Treasury aims to ensure funding by keeping committed credit limits available.
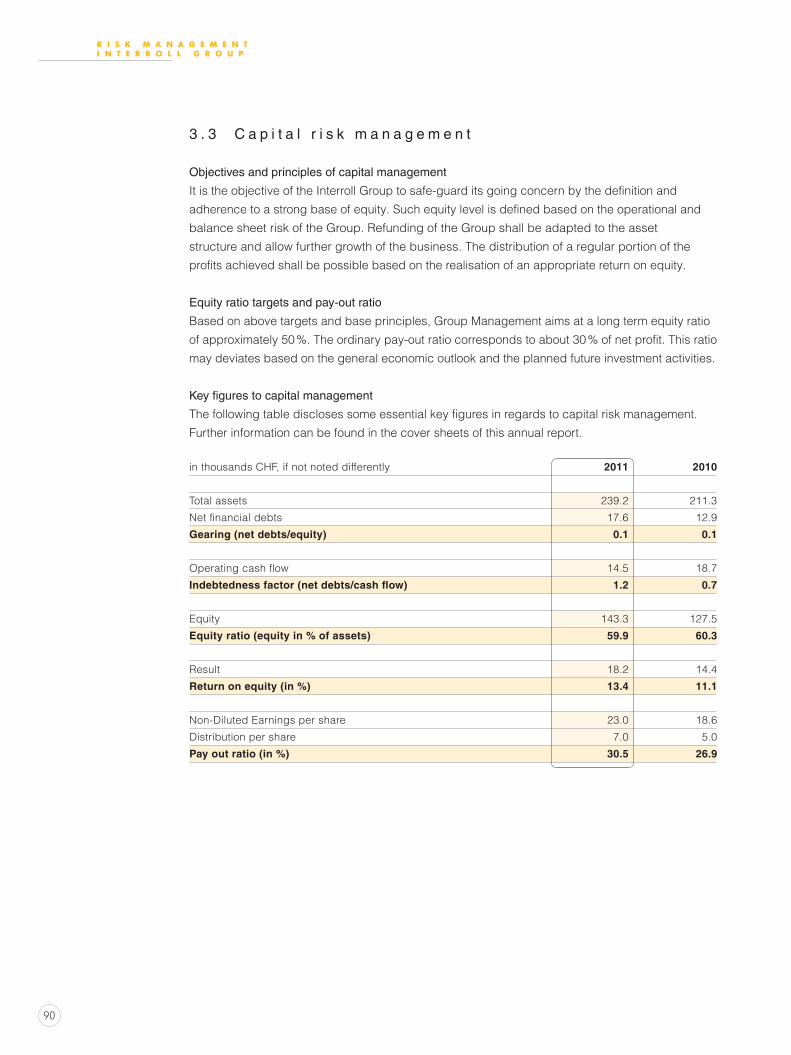
90
R i s k m a n a G e m e n ti n t e R R o l l G R o u p
3 . 3 C a p i t a l r i s k m a n a g e m e n t
objectives and principles of capital management
It is the objective of the Interroll Group to safe-guard its going concern by the definition and
adherence to a strong base of equity. Such equity level is defined based on the operational and
balance sheet risk of the Group. Refunding of the Group shall be adapted to the asset
structure and allow further growth of the business. The distribution of a regular portion of the
profits achieved shall be possible based on the realisation of an appropriate return on equity.
equity ratio targets and pay-out ratio
Based on above targets and base principles, Group Management aims at a long term equity ratio
of approximately 50 %. The ordinary pay-out ratio corresponds to about 30 % of net profit. This ratio
may deviates based on the general economic outlook and the planned future investment activities.
Key figures to capital management
k e y f i g u r e sT 2 0 : V 3 9
The following table discloses some essential key figures in regards to capital risk management.
Further information can be found in the cover sheets of this annual report.
in thousands CHF, if not noted differently 2011 2010
total assets 239.2 211.3
Net financial debts 17.6 12.9
Gearing (net debts/equity) 0.1 0.1
Operating cash flow 14.5 18.7
Indebtedness factor (net debts/cash flow) 1.2 0.7
equity 143.3 127.5
Equity ratio (equity in % of assets) 59.9 60.3
Result 18.2 14.4
Return on equity (in %) 13.4 11.1
non-Diluted earnings per share 23.0 18.6
Distribution per share 7.0 5.0
Pay out ratio (in %) 30.5 26.9

91
4 C h a n g e r a n g eT 2 0 : T 2 6
4 C h a n g e s T o T h e s C o P e o f C o n s o l i d aT i o n
Changes in the business year 2011
As per 1 January 2011 the business activities of the former licensing partner in Australia (CSA
Conveyors) were acquired by the existing Interroll entity in Australia. Intangible and tangible
assets at fair value amounted to CHF 1.1 million whereof half was paid in November 2010 and
the other half in January 2011.
Changes in the business year 2010
In the previous year, there was no acquisition of subsidiaries or business activities respectively.
There were also no payments due from previous acquisitions.
4 C h a n g e r a n g eT 2 9 : V 4 6
allocation of net assets acquired
2011 2010
in thousands CHF Fair value Fair value
Property, plant and equipment 170 –
Intangible assets 875 –
Total non-current assets 1 045 –
Inventory 331 –
Total current assets 331 –
Total assets 1 376 –
Deferred tax liabilities 262 –
Total liabilities 262 –
Total net assets acquired 1 114 –
Goodwill acquired – –
Total acquisition costs 1 114 –
The full amount is in relation to the acquisition of CSA Conveyors and was settled in cash.
Cash flow from acquisitions
in thousands CHF 2011 2010
settled in cash for the acquisition of CsA Conveyor – 1 114 –
thereof already settled in the previous year 570 –
settlement of outstanding acquisition price from previous years – 387 –
Net cash used in acquisitions – 931 –
4 C h a n g e r a n g eT 5 8 : T 6 1
4 C h a n g e r a n g eT 4 8 : V 5 6
The settlement of an outstanding acquisition price was the last installment related to the acquisi-
tion of BDL France dated back in year 2006.
further notes to acquisitions
Intangible assets taken over from the former licence partner in Australia mainly consists of
customer relations. Business activities from the acquired business contribute to CHF 2.8 million to
the current year’s Group's sales. Its effect onto the Group’s result is immaterial.
c h a n G e s t o t h e s c o p e o F c o n s o l i d a t i o ni n t e R R o l l G R o u p
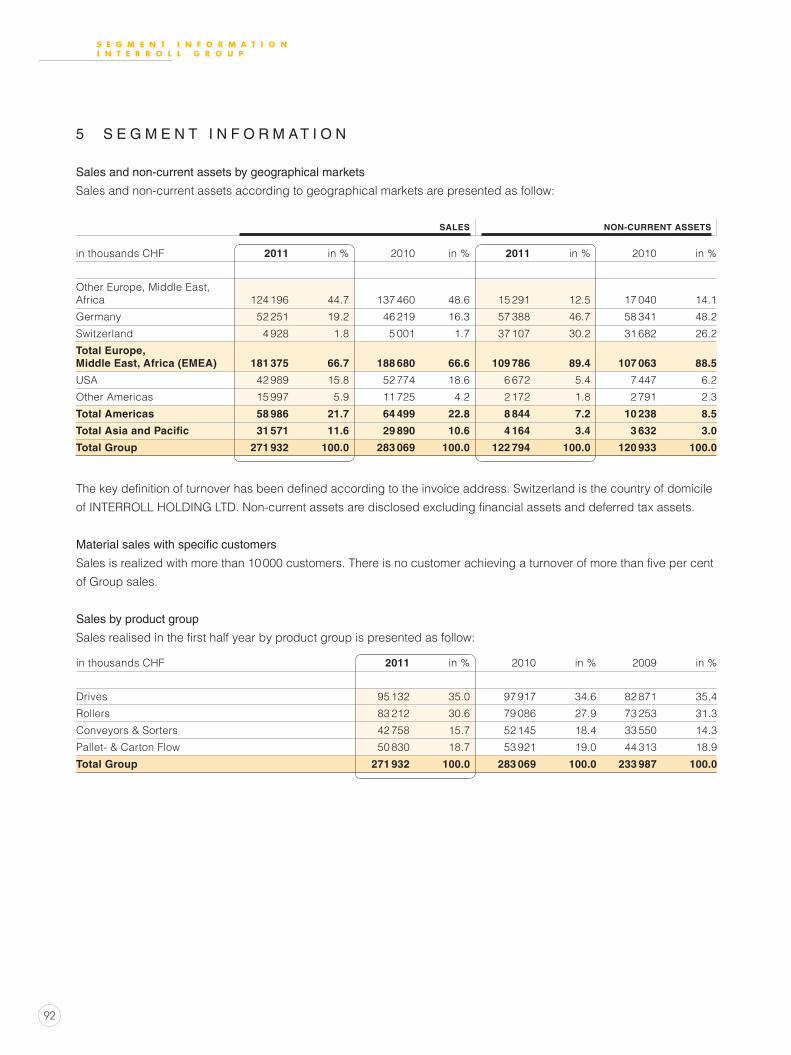
92
s e G m e n t i n F o R m a t i o ni n t e R R o l l G R o u p
5 s e g m e n T sT 2 0 : a B 3 9
5 s e g m e n T i n f o r m aT i o n
sales and non-current assets by geographical markets
Sales and non-current assets according to geographical markets are presented as follow:
SAlES NON-CuRRENT ASSETS
in thousands CHF 2011 in % 2010 in % 2011 in % 2010 in %
other europe, Middle east, Africa 124 196 44.7 137 460 48.6 15 291 12.5 17 040 14.1
Germany 52 251 19.2 46 219 16.3 57 388 46.7 58 341 48.2
Switzerland 4 928 1.8 5 001 1.7 37 107 30.2 31 682 26.2
Total Europe, Middle East, Africa (EMEA) 181 375 66.7 188 680 66.6 109 786 89.4 107 063 88.5
uSA 42 989 15.8 52 774 18.6 6 672 5.4 7 447 6.2
other Americas 15 997 5.9 11 725 4.2 2 172 1.8 2 791 2.3
Total Americas 58 986 21.7 64 499 22.8 8 844 7.2 10 238 8.5
Total Asia and Pacific 31 571 11.6 29 890 10.6 4 164 3.4 3 632 3.0
Total Group 271 932 100.0 283 069 100.0 122 794 100.0 120 933 100.0
The key definition of turnover has been defined according to the invoice address. Switzerland is the country of domicile
of INTeRROLL HOLDING LTD. Non-current assets are disclosed excluding financial assets and deferred tax assets.
5 s e g m e n T sT 4 1 : Z 5 4
Material sales with specific customers
Sales is realized with more than 10 000 customers. There is no customer achieving a turnover of more than five per cent
of Group sales.
sales by product group
Sales realised in the first half year by product group is presented as follow:
in thousands CHF 2011 in % 2010 in % 2009 in %
Drives 95 132 35.0 97 917 34.6 82 871 35.4
Rollers 83 212 30.6 79 086 27.9 73 253 31.3
Conveyors & Sorters 42 758 15.7 52 145 18.4 33 550 14.3
Pallet- & Carton Flow 50 830 18.7 53 921 19.0 44 313 18.9
Total Group 271 932 100.0 283 069 100.0 233 987 100.0

93
� N O T E S � T O � T H E � C O N S O L I D A T E D � S T A T E M E N T � O F � F I N A N C I A L � P O S I T I O NI N T E r r O L L � G r O u P
6 N O T E S T O T H E C O N S O L I D AT E D S TAT E M E N T O F F I N A N C I A L P O S I T I O N
6 . 1 TA N G I B L E A S S E T ST 2 0 : A D 4 8
6 . 1 M o v e m e n t s o f p r o p e r t y , p l a n t a n d e q u i p m e n t
in thousands CHFLand &
BuiLding
ProduCtion equiPment &
maCHineryoFFiCe equiPment & motor veHiCLes
assets under ConstruCtion
ToTal properTy, planT
and equipmenT
2011 2010 2011 2010 2011 2010 2011 2010 2011 2010
Cost
at 1.1. 73 013 69 958 84 425 91 536 9 168 10 184 2 799 3 379 169 405 175 057
Currency translation adj. –1 720 –10 641 –1 138 –8 234 –177 –886 –71 –422 –3 106 –20 183
additions 4 248 11 831 5 093 4 716 1 320 1 200 1 224 2 076 11 885 19 823
disposals –71 –394 –1 495 –3 442 –1 529 –1 294 – 42 –3 095 –5 088
Reclassifications –688 2 259 1 144 –151 –19 –36 –1 953 –2 276 –1 516 –204
Changes in the scope of consolidation** – – 168 – 2 – – – 170 –
at 31.12. 74 782 73 013 88 197 84 425 8 765 9 168 1 999 2 799 173 743 169 405
accumulated depreciation & impairments
at 1.1. –22 404 –23 509 –57 123 –58 431 –6 933 –7 538 –86 460 –89 478
Currency translation adj. 470 3 420 700 5 200 136 576 1 306 9 196
depreciation –2 756 –2 700 –6 730 –7 125 –1 011 –1 087 –10 497 –10 912
impairment losses – – – – – – – –
disposals 18 368 1 413 3 082 1 363 1 080 2 794 4 530
Reclassifications 1 110 17 92 151 19 36 1 221 204
at 31.12. –23 562 –22 404 –61 648 –57 123 –6 426 –6 933 –91 636 –86 460
property, plant and equipment at 31.12. 51 220 50 609 26 549 27 302 2 339 2 235 1 999 2 799 82 107 82 945
Thereof finance leases* – – – 12 – – – 12
Capital commitments – 5 246 567 1 310 – 39 567 6 595
insurance value*** 91 638 91 701 120 296 116 638 – – 211 934 208 339
6 . 1 TA N G I B L E A S S E T ST 5 0 : U 5 2
* in the year under review as well as in the previous year there were no additions not involving the movement of cash and cash equivalents.** detailed information on the changes in the scope of consolidastion is disclosed in note 4.*** the insurance value of production equipment and machinery also covers other tangible assets.
6 . 1 TA N G I B L E A S S E T ST 5 4 : T 5 7
Reclassifications from/to non-current assets held for sale
The building put onto sale in Denmark was finally sold at a price of CHF 0.5 million. The property with a book value
of CHF 0.5 million was reclassified in 2009 from fixed assets to assets held for sale due to local restructuring. At year
end 2011, a letter of intent was signed to sell a part of the property in Wassenberg (de). thus, CHF 0.3 million were
reallocated from tangible assets to assets held for sale. the building for sale in spain is subject to current negotiations.
Further notes to the movevements of property plant and equipment
At the end of the period under review no risks exist in the opinon of Group Management which negatively impact the
book value of fixed assets.

94
�N O T E S � T O � T H E � C O N S O L I D A T E D � S T A T E M E N T � O F � F I N A N C I A L � P O S I T I O NI N T E r r O L L � G r O u P
6 . 2 I N TA N G I B L E A S S E T ST 2 0 : A D 4 6 T 4 7 : U 4 7T 5 1 : T 5 3
6 . 2 M o v e m e n t s o f g o o d w i l l a n d i n t a n g i b l e a s s e t s
in thousands CHF goodWiLL soFtWare
Patents, teCHnoLogy and
LiCenCesCustomer
reLationsHiP
ToTal inTangible
asseTs
2011 2010 2011 2010 2011 2010 2011 2010 2011 2010
Cost
at 1.1. 12 407 14 112 19 363 12 161 14 154 19 183 20 666 24 650 66 590 70 106
Currency translation adj. –233 –1 705 –37 –228 –362 –2 828 –553 –3 984 –1 185 –8 745
additions – – 7 734 7 591 – – – – 7 734 7 591
disposals – – –926 –146 –19 –2 201 – – –945 –2 347
Reclassifications – – –6 –15 – – – – –6 –15
Changes in the scope of consolidation* – – – – – – 875 – 875 –
at 31.12. 12 174 12 407 26 128 19 363 13 773 14 154 20 988 20 666 73 063 66 590
accumulated amortisation & impairments
at 1.1. –3 126 –3 126 –3 513 –3 362 –12 115 –14 860 –9 848 –9 233 –28 602 –30 581
Currency translation adj. – – 28 188 317 2 307 277 1 705 622 4 200
amortisation – – –1 516 –381 –1 553 –1 763 –2 251 –2 320 –5 320 –4 464
disposals – – 899 27 19 2 201 – – 918 2 228
Reclassifications – – 6 15 – – – – 6 15
at 31.12. –3 126 –3 126 –4 096 –3 513 –13 332 –12 115 –11 822 –9 848 –32 376 –28 602
Total intangible assets, net at 31.12. 9 048 9 281 22 032 15 850 441 2 039 9 166 10 818 40 687 37 988
Capital commitments – – 752 798 – – – – 752 798
* detailed information on the changes in scope of consolidastion is disclosed in note 4.
Goodwill: impairment test
The impairment tests are generally based on a three year plan and on the present value of future (pre-tax) cash flows
(value in use) determined using a discount rate of 10.7 % (previous year: 9.1 %). the growth rate and the discount
rate were defined as key assumptions. No further growth was assumed for the extrapolation of free cash flows. The sen-
sitivity analysis performed resulted in both years under review in the conclusion that the discounted value of future
free cash flows exceeds the value of the current goodwill also when assuming a change of the discount rate under normal
economical conditions. the growth rate was reviewed in regards to its sensitivity. this test lead to the conclusion that
the discounted value of future cash flows exceeds the value of the current goodwill position even if no growth is assumed.
Goodwill changed in both years under review only as an effect of currency fluctuation.

95
� N O T E S � T O � T H E � C O N S O L I D A T E D � S T A T E M E N T � O F � F I N A N C I A L � P O S I T I O NI N T E r r O L L � G r O u P
6 . 2 I N TA N G I B L E A S S E T ST 5 6 : T 6 2
Software
out of the accumulated acquisition costs, CHF 22.9 million (previous year: CHF 15.4 million) relate
to the set up, design and introduction of saP. in the year under review the additions to this
process management system amount to CHF 7.5 million (previous year: CHF 7.3 million). Capital
commitments for software are related to the investment and development of saP in both years.
SAP was launched mid 2011 for the two Centers of Excellence for Drum Motors and Rollers/
rollerdrive as well as for all european sales and service subsidiaries. development
costs incurred until that date in the amount fo CHF 19.5 million were capitalised mid 2011 and
are subject to amortisation over 8 years. the interroll group has already started further
developments to introduce this ERP in Asia, North America and in the center of Excellence
for supermarket Products. respective investments amount to CHF 3.4 million. no amortisation
has been recognised so far on this amount.
an impairment test with the same key assumptions as those used for the tests on the goodwill
was performed for the intangible assets disclosed as software. the sensitivity analysis performed
resulted in the conclusion that the discounted value of future free cash flows exceeds the value
of the current goodwill also when assuming a change of the discount rate under normal economical
conditions.
Customer relationship
Customer relationship is normally amortised on a straght line basis over 10 years. at year end
2011, an amortisation term of additional 4 years remains on the major portion of customer
relationship. A review if indicators exist that point towards an impairment of customer relationship
was performed. there are no signs that would indicate an impairment of this value.
6 . 3 A S S E T P L E D G E DT 2 0 : V 3 0
6 . 3 A s s e t s p l e d g e d o r a s s i g n e d
in thousands CHF 31.12.2011 31.12.2010
Land & buildings 1 308 1 343
Production equipment and machinery – 12
inventory – 939
trade receivables 157 2 182
Total assets pledged or assigned 1 465 4 476
these assets are pledged respectively assigned to local credit lines granted (see Liquidity risk
and credit facilities in note 6.8).

96
�N O T E S � T O � T H E � C O N S O L I D A T E D � S T A T E M E N T � O F � F I N A N C I A L � P O S I T I O NI N T E r r O L L � G r O u P
6 . 4 I N V E N T O R YT 2 0 : V 4 2
6 . 4 I n v e n t o r i e s
Detailed overview on the positions belonging to the inventory
in thousands CHF 31.12.2011 31.12.2010
raw materials 27 402 23 503
Work in progress 18 343 7 712
Finished products 1 241 2 154
valuation allowance –1 886 –1 859
Total inventory, net 45 100 31 510
Developement of valuation allowance on inventory
in thousands CHF 2011 2010
balance as per 1.1. –1 859 –2 386
Currency translation adjustment 70 253
additions –313 –343
reductions 216 617
Total valuation allowance on inventory as per 31.12. –1 886 –1 859
information on the carrying amount of pledged inventory is disclosed in note 6.3.
the addition of valuation allowances is due to slow or non-moving items within the inventory. the reduction of valuation
allowance on inventory is related to sale or scrap of items, as well as to a reassessment of the valuation allowance.
6 . 5 Tr a d e a n d o t h e r a c c o u n t s r e c e i v a b l e
Detailed overview of trade and other accounts receivable
trade accounts receivable arise from deliveries and services relating to the group’s operating activities.
in thousands CHF 31.12.2011 31.12.2010
trade accounts receivable from goods and services 53 739 43 862
valuation allowance –2 407 –3 019
Total trade accounts receivable, net 51 332 40 843
Foreign currency forward contracts* – 3
Prepaid expenses and accrued income 1 338 1 103
Prepayments for inventories 1 001 688
other accounts receivable 3 983 2 602
Total other accounts receivable, net 6 322 4 396
Total trade and other accounts receivable, net 57 654 45 239
6 . 5 T R A D E R E C E I V A B L ET 2 0 : X 3 7T 3 8 : U 3 8
* see note 6.8

97
� N O T E S � T O � T H E � C O N S O L I D A T E D � S T A T E M E N T � O F � F I N A N C I A L � P O S I T I O NI N T E r r O L L � G r O u P
6 . 5 T R A D E R E C E I V A B L ET 4 1 : A B 5 3
Ageing and valuation allowance of trade accounts receivable
Trade accounts receivables are due and specific/general valuation allowance have been evaluated as follows:
in thousands CHF 31.12.2011 31.12.2010
gross vaLuation aLLoWanCe neT gross vaLuation aLLoWanCe neT
individuaL CoLLeCtive individuaL CoLLeCtive
not past due 34 619 34 619 29 331 29 331
Past due 1–30 days 11 676 11 676 9 781 9 781
Past due 31–60 days 3 432 –2 3 430 2 116 –385 1 731
Past due 61–90 days 1 046 –94 952 556 –556 –
Past due > 90 days 2 966 –1 095 –1 216 655 2 078 –826 –1 252 –
Total trade accounts receivable 53 739 –1 191 –1 216 51 332 43 862 –1 767 –1 252 40 843
6 . 5 T R A D E R E C E I V A B L ET 5 6 : Z 7 1
Development of the individual and collective valuation allowance of trade accounts receivable
the valuation allowance on trade accounts receivable from third parties developed as follows:
in thousands CHF 2011 2010
valuation allowance valuation allowance
Total individual collective Total individual collective
at 1.1. –3 019 –1 767 –1 252 –2 578 –1 391 –1 187
Currency translation adjustment 120 84 36 442 233 209
additions –292 –292 –1 491 –1 217 –274
alllowance used 388 388 536 536
allowance reversed 396 396 72 72
at 31.12. –2 407 –1 191 –1 216 –3 019 –1 767 –1 252
during the year under review, an amount of CHF 0.4 million (previous year: CHF 0.5 million) relating to irrecoverable
trade receivables was written off. Currently, no other risks are identifiable in the net trade accounts receivables. Sales
are broadly diversified across geographical and industrial markets. Thus, the risk of unexpected losses from trade
receivables is assessed to be low.
6 . 5 T R A D E R E C E I V A B L ET 7 4 : X 8 5
Currencies in trade accounts receivable
trade accounts receivables reported in CHF are denominated from the following currencies:
in thousands CHF 31.12.2011 31.12.2010
in % in %
eur 28 805 53.6 18 060 41.2
usd 8 424 15.7 9 401 21.4
Cny 3 822 7.1 3 268 7.5
gBP 1 881 3.5 2 635 6.0
Zar 163 0.3 2 186 5.0
all other currencies 10 644 19.8 8 312 19.0
Total trade accounts receivables, gross 53 739 100.0 43 862 100.0
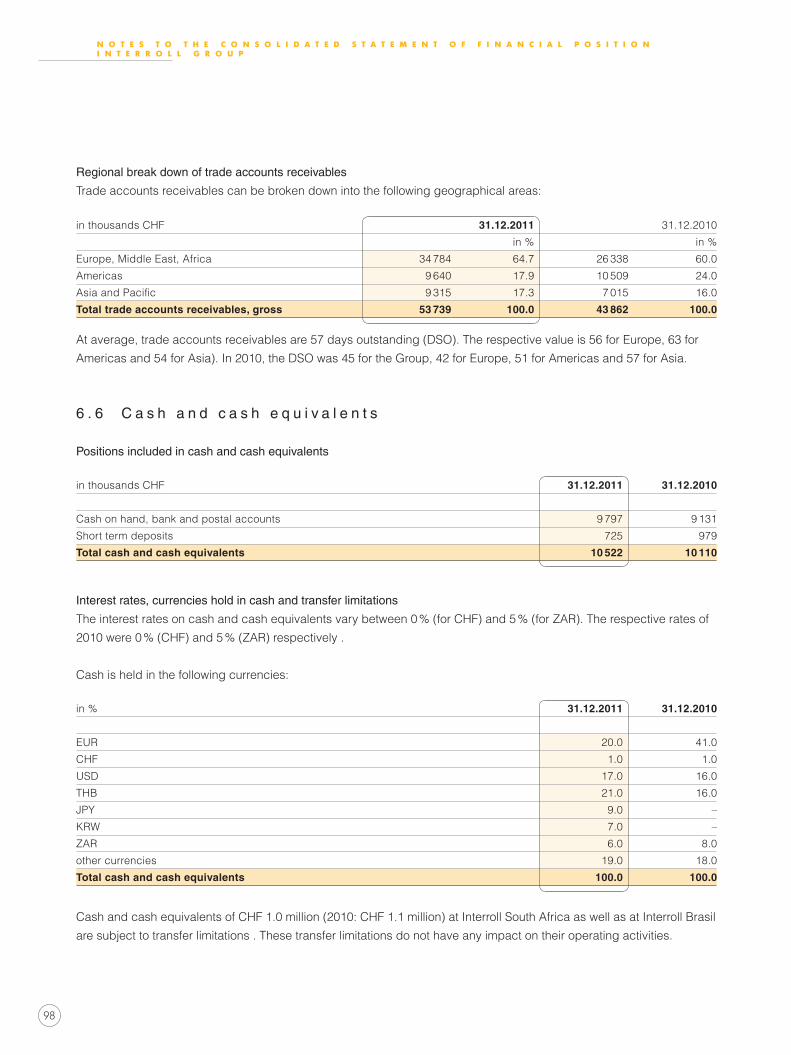
98
�N O T E S � T O � T H E � C O N S O L I D A T E D � S T A T E M E N T � O F � F I N A N C I A L � P O S I T I O NI N T E r r O L L � G r O u P
6 . 5 T R A D E R E C E I V A B L ET 8 8 : X 9 8
Regional break down of trade accounts receivables
trade accounts receivables can be broken down into the following geographical areas:
in thousands CHF 31.12.2011 31.12.2010
in % in %
europe, middle east, africa 34 784 64.7 26 338 60.0
americas 9 640 17.9 10 509 24.0
Asia and Pacific 9 315 17.3 7 015 16.0
Total trade accounts receivables, gross 53 739 100.0 43 862 100.0
at average, trade accounts receivables are 57 days outstanding (dso). the respective value is 56 for europe, 63 for
americas and 54 for asia). in 2010, the dso was 45 for the group, 42 for europe, 51 for americas and 57 for asia.
6 . 6 C A S HT 2 0 : V 4 7
6 . 6 C a s h a n d c a s h e q u i v a l e n t s
Positions included in cash and cash equivalents
in thousands CHF 31.12.2011 31.12.2010
Cash on hand, bank and postal accounts 9 797 9 131
short term deposits 725 979
Total cash and cash equivalents 10 522 10 110
Interest rates, currencies hold in cash and transfer limitations
the interest rates on cash and cash equivalents vary between 0 % (for CHF) and 5 % (for Zar). the respective rates of
2010 were 0 % (CHF) and 5 % (Zar) respectively .
Cash is held in the following currencies:
in % 31.12.2011 31.12.2010
eur 20.0 41.0
CHF 1.0 1.0
usd 17.0 16.0
tHB 21.0 16.0
JPy 9.0 –
KrW 7.0 –
Zar 6.0 8.0
other currencies 19.0 18.0
Total cash and cash equivalents 100.0 100.0
Cash and cash equivalents of CHF 1.0 million (2010: CHF 1.1 million) at interroll south africa as well as at interroll Brasil
are subject to transfer limitations . these transfer limitations do not have any impact on their operating activities.
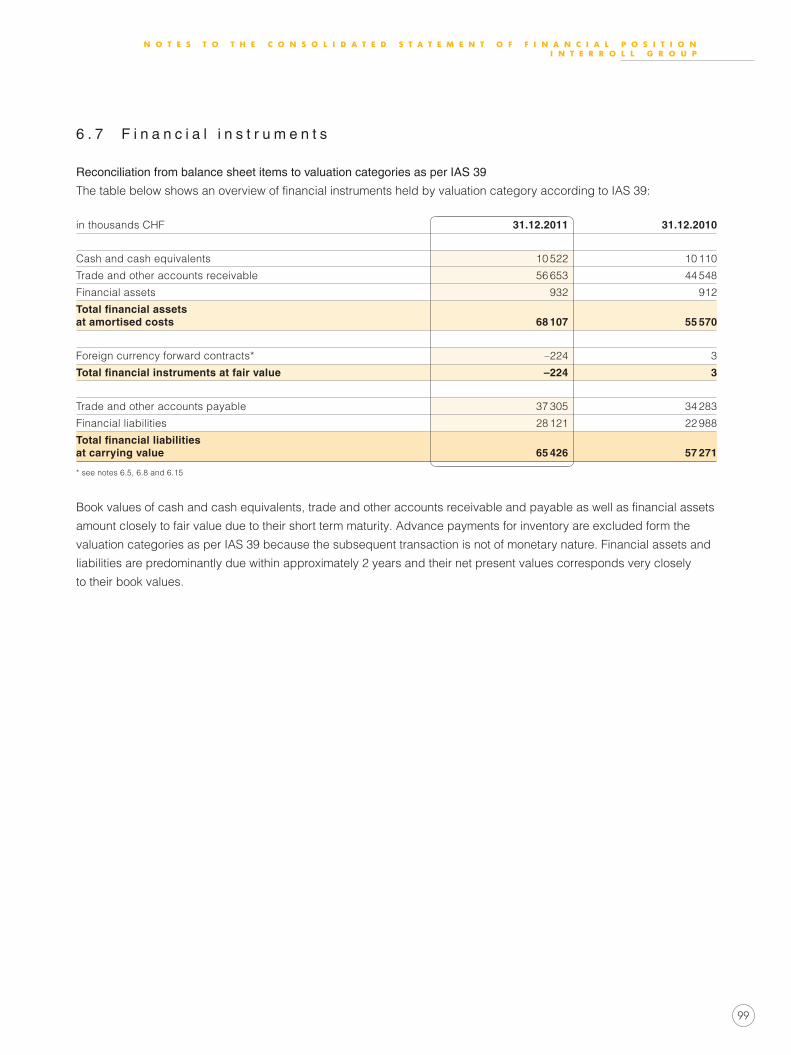
99
� N O T E S � T O � T H E � C O N S O L I D A T E D � S T A T E M E N T � O F � F I N A N C I A L � P O S I T I O NI N T E r r O L L � G r O u P
6 . 7 F i n a n c i a l i n s t r u m e n t s
Reconciliation from balance sheet items to valuation categories as per IAS 39
The table below shows an overview of financial instruments held by valuation category according to IAS 39:
in thousands CHF 31.12.2011 31.12.2010
Cash and cash equivalents 10 522 10 110
trade and other accounts receivable 56 653 44 548
Financial assets 932 912
Total financial assets at amortised costs 68 107 55 570
Foreign currency forward contracts* –224 3
Total financial instruments at fair value –224 3
trade and other accounts payable 37 305 34 283
Financial liabilities 28 121 22 988
Total financial liabilities at carrying value 65 426 57 271
* see notes 6.5, 6.8 and 6.15
Book values of cash and cash equivalents, trade and other accounts receivable and payable as well as financial assets
amount closely to fair value due to their short term maturity. Advance payments for inventory are excluded form the
valuation categories as per ias 39 because the subsequent transaction is not of monetary nature. Financial assets and
liabilities are predominantly due within approximately 2 years and their net present values corresponds very closely
to their book values.
6 . 7 F I N A N C I A L I N S T R U M E N T ST 2 0 : V 4 0
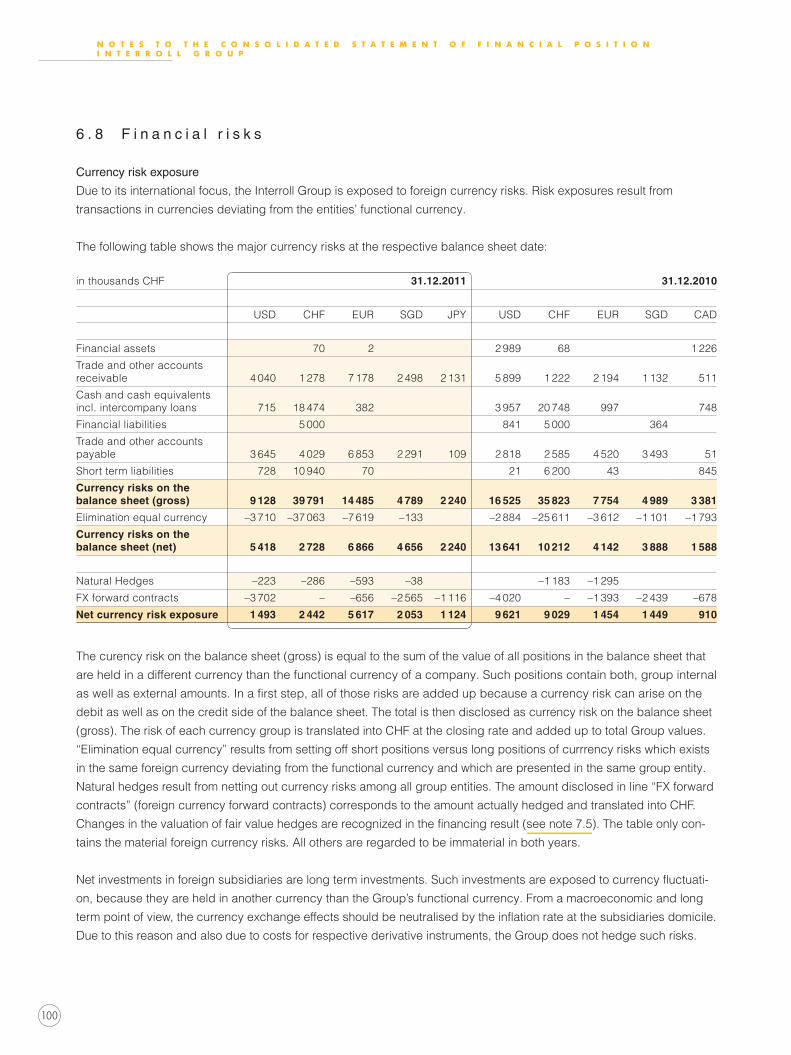
100
�N O T E S � T O � T H E � C O N S O L I D A T E D � S T A T E M E N T � O F � F I N A N C I A L � P O S I T I O NI N T E r r O L L � G r O u P
6 . 8 F I N A N C I A L R I S K ST 2 0 : A D 4 4
6 . 8 F i n a n c i a l r i s k s
Currency risk exposure
Due to its international focus, the Interroll Group is exposed to foreign currency risks. Risk exposures result from
transactions in currencies deviating from the entities’ functional currency.
the following table shows the major currency risks at the respective balance sheet date:
in thousands CHF 31.12.2011 31.12.2010
usd CHF eur sgd JPy usd CHF eur sgd Cad
Financial assets 70 2 2 989 68 1 226
trade and other accounts receivable 4 040 1 278 7 178 2 498 2 131 5 899 1 222 2 194 1 132 511
Cash and cash equivalents incl. intercompany loans 715 18 474 382 3 957 20 748 997 748
Financial liabilities 5 000 841 5 000 364
trade and other accounts payable 3 645 4 029 6 853 2 291 109 2 818 2 585 4 520 3 493 51
short term liabilities 728 10 940 70 21 6 200 43 845
Currency risks on the balance sheet (gross) 9 128 39 791 14 485 4 789 2 240 16 525 35 823 7 754 4 989 3 381
elimination equal currency –3 710 –37 063 –7 619 –133 –2 884 –25 611 –3 612 –1 101 –1 793
Currency risks on the balance sheet (net) 5 418 2 728 6 866 4 656 2 240 13 641 10 212 4 142 3 888 1 588
natural Hedges –223 –286 –593 –38 –1 183 –1 295
FX forward contracts –3 702 – –656 –2 565 –1 116 –4 020 – –1 393 –2 439 –678
net currency risk exposure 1 493 2 442 5 617 2 053 1 124 9 621 9 029 1 454 1 449 910
the curency risk on the balance sheet (gross) is equal to the sum of the value of all positions in the balance sheet that
are held in a different currency than the functional currency of a company. Such positions contain both, group internal
as well as external amounts. In a first step, all of those risks are added up because a currency risk can arise on the
debit as well as on the credit side of the balance sheet. the total is then disclosed as currency risk on the balance sheet
(gross). the risk of each currency group is translated into CHF at the closing rate and added up to total group values.
“Elimination equal currency” results from setting off short positions versus long positions of currrency risks which exists
in the same foreign currency deviating from the functional currency and which are presented in the same group entity.
natural hedges result from netting out currency risks among all group entities. the amount disclosed in line “FX forward
contracts” (foreign currency forward contracts) corresponds to the amount actually hedged and translated into CHF.
Changes in the valuation of fair value hedges are recognized in the financing result (see note 7.5). The table only con-
tains the material foreign currency risks. all others are regarded to be immaterial in both years.
Net investments in foreign subsidiaries are long term investments. Such investments are exposed to currency fluctuati-
on, because they are held in another currency than the group’s functional currency. From a macroeconomic and long
term point of view, the currency exchange effects should be neutralised by the inflation rate at the subsidiaries domicile.
due to this reason and also due to costs for respective derivative instruments, the group does not hedge such risks.

101
� N O T E S � T O � T H E � C O N S O L I D A T E D � S T A T E M E N T � O F � F I N A N C I A L � P O S I T I O NI N T E r r O L L � G r O u P
6 . 8 F I N A N C I A L R I S K ST 4 6 : A A 6 6
Foreign currency forward contracts
the following table shows the contractual and fair values the foreign currency forward contracts held by the group:
in thousands CHF 31.12.2011 31.12.2010
Hedged currency SEll/Buy maturity
notionaL amount in CHF Fair vaLue SEll/Buy
notionaL amount in CHF Fair vaLue
usd uSD/CAD 02–2012 2 467 – uSD/CAD 1 645 35
usd CAD/uSD 02–2012 1 235 1 uSD/CHF 2 375 53
sgd SGD/EuR 02–2012 1 363 –53 JPy/SGD 1 925 23
sgd JPy/SGD 02–2012 1 202 –26 KRW/SGD 514 8
eur EuR/CHF 02–2012 656 9 CNy/EuR 642 –23
eur – ZAR/EuR 751 –68
JPy JPy/EuR 02–2012 1 116 –66 –
Cny CNy/EuR 02–2012 571 –41 –
Cad – CAD/CHF 678 1
tHB THB/EuR 02–2012 985 –48 THB/EuR 626 –26
Total FX forward contracts –224 3
* see notes 6.5 resp. 6.15
The fair values of the derivative financial instruments are classified as hierarchy 2 in the sense of IFRS 7. The valuation
in hierarchy 2 is based on factors which cannot be tracked to actively listed prices on public markets. instead, they can
be monitored directly (as a price) or indirectly (as a derivative of the price).
The Group prepares regularly a rolling forecast of foreign currency cash flows. 0 – 50 % of such budgeted, future foreign
currency flows may be hedged through forward contracts. At the end of the year under review, there were no open
cash flow hedges held by the Group.
The notional amount corresponds to the hedged balance sheet risk, translated into CHF. With derivative financial
instruments, the group hedges normally 50 –100 % of its net currency risks on the balance sheet.

102
�N O T E S � T O � T H E � C O N S O L I D A T E D � S T A T E M E N T � O F � F I N A N C I A L � P O S I T I O NI N T E r r O L L � G r O u P
6 . 8 F I N A N C I A L R I S K ST 6 8 : Z 9 1
Sensitivity analysis to the currency risk exposure
As per year end, a sensitivity analysis was carried in respect to financial instruments. The sensitivity analyses calculates
the effect of FOREX – changes on the major currency pairs within the Group. These risks particularly result from differ-
ent currencies between costs for production and invoicing currency to the customers. Asummed currency fluctuations
would have the following effects on the foreign currency positions in the balance sheet:
in thousands CHF 31.12.2011 31.12.2010
CurrenCy Pair
eur
vs. CHF
CHF
vs. usd
Cad
vs. usd
eur
vs. CHF
CHF
vs. usd
Cad
vs. usd
Financial assets 71 4 416 – 68 2 989 –
trade and other receivables –2 092 196 2 663 –592 206 3 775
Cash and Cash equiv. incl. iC-Loans 18 459 3 666 611 20 083 3 449 467
Financial Liabilities 5 000 – – 5 000 – –
trade and other Payables 2 010 –174 713 644 –53 688
short term and Current Liabilities 10 940 657 5 6 200 – 21
gross exposure per currency pair 34 388 8 761 3 992 31 403 6 591 4 951
risks opposing each other –32 876 –967 –1 437 –23 688 106 –1 417
FX forward contracts –985 – –2 467 – –2 375 –1 645
net FX exposure per currency pair 527 7 794 88 7 715 4 322 1 889
Currency change in % 10 15 5 10 10 10
Effect on the result (+/-) 53 779 9 772 432 189
Income tax expense at 20.1 % –11 –157 –2 –155 –87 –38
Net FX exposure after income taxes 42 622 7 617 345 151
analogously to the currency risk analyis, the net risks of currency pairs are summed up. the position “risks opposing
each other” is a result of netting out those risks that are contrary to each other. the disclosed amount in line “FX
forward contracts” equals to the total of hedged currency risks of a currency pair. it is also deducted from the gross risk
as it deviates linearly with the fluctuation of the currency. The income taxes are calculated in line with the applicable
rate for an ordinary taxed entity in Switzerland (see note 7.6).
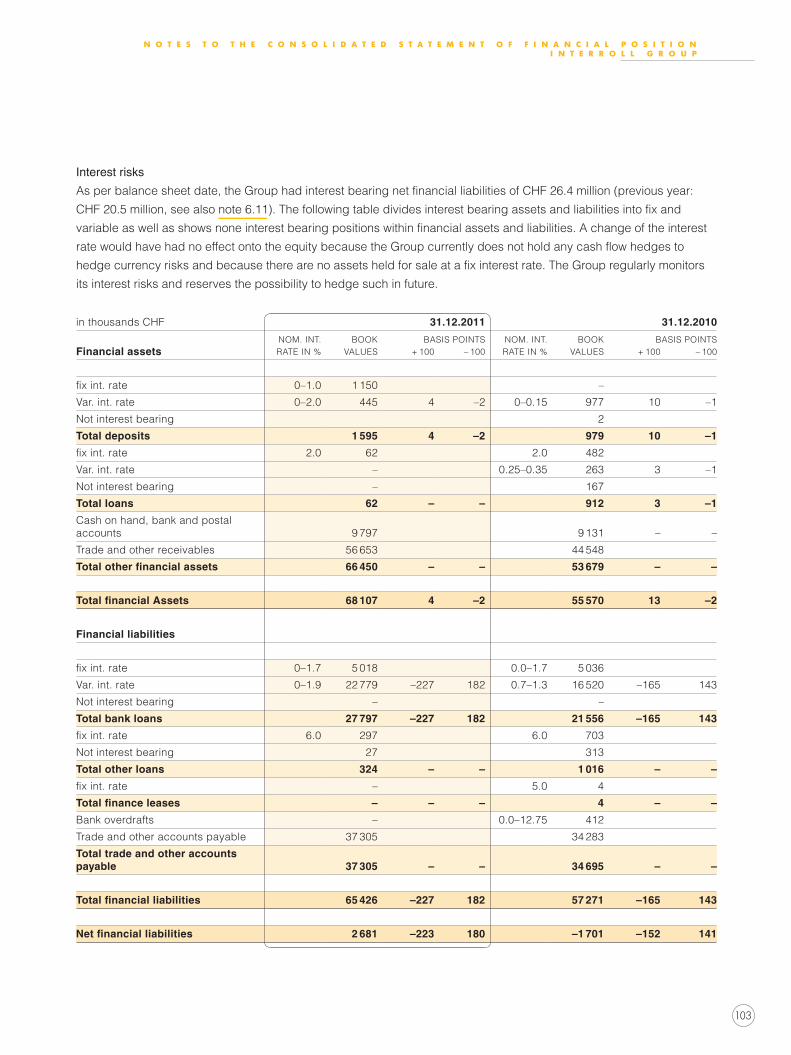
103
� N O T E S � T O � T H E � C O N S O L I D A T E D � S T A T E M E N T � O F � F I N A N C I A L � P O S I T I O NI N T E r r O L L � G r O u P
6 . 8 F I N A N C I A L R I S K ST 9 3 : T 9 4
Interest risks
As per balance sheet date, the Group had interest bearing net financial liabilities of CHF 26.4 million (previous year:
CHF 20.5 million, see also note 6.11). The following table divides interest bearing assets and liabilities into fix and
variable as well as shows none interest bearing positions within financial assets and liabilities. A change of the interest
rate would have had no effect onto the equity because the Group currently does not hold any cash flow hedges to
hedge currency risks and because there are no assets held for sale at a fix interest rate. The Group regularly monitors
its interest risks and reserves the possibility to hedge such in future.
6 . 8 F I N A N C I A L R I S K ST 9 6 : A B 1 3 1
in thousands CHF 31.12.2011 31.12.2010
nom. int. BooK Basis Points nom. int. BooK Basis PointsFinancial assets rate in % vaLues + 100 – 100 rate in % vaLues + 100 – 100
fix int. rate 0–1.0 1 150 –
var. int. rate 0–2.0 445 4 –2 0–0.15 977 10 –1
not interest bearing 2
Total deposits 1 595 4 –2 979 10 –1
fix int. rate 2.0 62 2.0 482
var. int. rate – 0.25–0.35 263 3 –1
not interest bearing – 167
Total loans 62 – – 912 3 –1
Cash on hand, bank and postal accounts 9 797 9 131 – –
trade and other receivables 56 653 44 548
Total other financial assets 66 450 – – 53 679 – –
Total financial Assets 68 107 4 –2 55 570 13 –2
Financial liabilities
fix int. rate 0–1.7 5 018 0.0–1.7 5 036
var. int. rate 0–1.9 22 779 –227 182 0.7–1.3 16 520 –165 143
not interest bearing – –
Total bank loans 27 797 –227 182 21 556 –165 143
fix int. rate 6.0 297 6.0 703
not interest bearing 27 313
Total other loans 324 – – 1 016 – –
fix int. rate – 5.0 4
Total finance leases – – – 4 – –
Bank overdrafts – 0.0–12.75 412
trade and other accounts payable 37 305 34 283
Total trade and other accounts payable 37 305 – – 34 695 – –
Total financial liabilities 65 426 –227 182 57 271 –165 143
Net financial liabilities 2 681 –223 180 –1 701 –152 141

104
�N O T E S � T O � T H E � C O N S O L I D A T E D � S T A T E M E N T � O F � F I N A N C I A L � P O S I T I O NI N T E r r O L L � G r O u P
6 . 8 F I N A N C I A L R I S K ST 1 3 3 : U 1 4 4
Sensitivity analysis to the interest risks
interest sensitivity is only calculated on interest bearing items of the balance sheet. Because items
that are interest bearing at a fixed rate, no effect is calculated on such due to an increase or
decrease of the interest rate. as per above analysis, the group’s annual result could worsen due
to an increase of the interest rate of one percentage point by CHF 0.22 million (previous year:
CHF 0.15 million). the result would improve with an interest reduction of one percentage point by
CHF 0.18 million (previous year: CHF 0.14 million). For certain interest bearing positions, the
interest reate is already lower than one percent. Therefore, the effect of the reduction was only
calculated up to the current interest rate being lower than 1.0 %.
Liquidity risk and credit facilities
the group carries out quarterly a complete liquidity planning on a consolidated basis. the group
holds liquidity reserves in form of committed and uncommitted credit lines in order to comply with
an unexpected and extraordinary liquidity demand.
the amount of unused credit facilities as per end of the reporting year amounted to CHF 57.3 milli-
on (previous year: CHF 64.7 million).
in 2009, new and committed credit lines for an amount of CHF 40.0 million with a duration of
3 years were agreed upon. in the previous year, an additional commited credit line in the amount
of CHF 15.0 million was settled. they ensure the funding of the future investment program and
serve generally for the business financing. The Group always complied with the agreed debt cove-
nants. debt covenants to be complied with are the following:
eBitda : net interest costs = min. 4.0
net debt : eBitda = max. 3.0
equity : total assets = min. 35 %
The ageing of the financial liabilities is disclosed in Note 6.11 (see “Ageing of financial liabilities”).

105
� N O T E S � T O � T H E � C O N S O L I D A T E D � S T A T E M E N T � O F � F I N A N C I A L � P O S I T I O NI N T E r r O L L � G r O u P
6 . 1 0 I N F O E Q U I T YT 2 0
6 . 9 I n f o r m a t i o n o n s h a r e h o l d e r ’ s e q u i t y
6 . 1 0 I N F O E Q U I T YT 2 2 : V 3 7
Reconciliation from total issued shares to the outstanding shares
2011 2010
issued shares par value CHF 10.00 each (previous year: CHF 10.00) 854 000 854 000
own shares held by the group as per 1.1. 74 400 82 225
Purchase of own shares 3 149 –
sale of own shares –12 713 –6 085
attribution of shares relating to bonus plan –2 084 –1 740
Attribution of shares related to options exercised –2 653 –
own shares held by the group as per 31.12. 60 099 74 400
thereof reserved for issuance under option program 45 965 52 965
thereof unreserved 14 134 21 435
shares outstanding at 31.12. 793 901 779 600
6 . 1 1 E P ST 2 0 : V 3 56 . 1 0 E a r n i n g s p e r s h a r e
Non-diluted earnings per share
the non-diluted earnings per share in 2011 amount to CHF 22.99 (2010: CHF 18.59). the calclulation is based on the
profit attributable to the equity holders of the parent company, divided by the weighted average of shares outstanding.
2011 2010
result attributable to the equity holders (in thousands CHF) 18 193 14 423
Shares outstanding as of 1.1. 779 600 771 775
Effect of the purchase of own shares –2 076 –
Effect of the sale/attribution of own shares 11 828 3 949
Effect of the issue of shares under option plans 2 100 –
Weighted average of shares outstanding 791 452 775 724
Non-diluted earnings per share (in CHF) 22.99 18.59

106
�N O T E S � T O � T H E � C O N S O L I D A T E D � S T A T E M E N T � O F � F I N A N C I A L � P O S I T I O NI N T E r r O L L � G r O u P
6 . 1 1 E P ST 3 7 : V 4 9
Diluted earnings per share
the diluted earnings per share in 2011 amount to CHF 22.86 (2010: CHF 18.59). they are
calculated by adjusting the weighted average number of ordinary shares outstanding to include all
dilutive potential ordinary shares.
the potential ordinary shares resulting from the issue of options under the employee stock
option plan (see note 7.1) had a dilutive effect due to the fact that the strike price (CHF 323) was
below the average share price (CHF 358) during the year under review. This effect is outlined
below. There was no dilutive effect in the previous year because the average price of CHF 317
was below the strike price.
2011 2010
result attributable to the equity holders (in thousands CHF) 18 193 14 423
Weighted average of shares outstanding 791 452 775 724
Dilutive effect of share options 4 521 –
Weighted average of shares outstanding (diluted) 795 973 775 724
diluted earnings per share (in CHF) 22.86 18.59
6 . 1 2 F I N A N C I A L L I A B I L I T I E ST 2 0 : V 3 5
6 . 1 1 F i n a n c i a l l i a b i l i t i e s
Details to current and non-current financial liabilities
in thousands CHF 31.12.2011 31.12.2010
Bank overdrafts – 412
Bank loans 22 850 16 501
Finance leases – 4
other loans – 471
Total current financial liabilities 22 850 17 388
Bank loans 5 035 5 055
other loans 236 545
Total non-current financial liabilities 5 271 5 600
Total financial liabilities 28 121 22 988

107
� N O T E S � T O � T H E � C O N S O L I D A T E D � S T A T E M E N T � O F � F I N A N C I A L � P O S I T I O NI N T E r r O L L � G r O u P
6 . 1 2 F I N A N C I A L L I A B I L I T I E ST 3 7 : V 4 7
Net financial liabilities to equity ratio
in thousands CHF 31.12.2011 31.12.2010
Total financial liabilities 28 121 22 988
./. Cash and cash equivalents –10 522 –10 110
Net financial liabilities 17 599 12 878
equity 143 285 127 457
Net financial debt in % to equity 12.28 10.10
6 . 1 2 F I N A N C I A L L I A B I L I T I E ST 5 2 : A B 6 9
Loan structure
in thousands CHF 31.12.2011 31.12.2010
Cur- renCy
eFFeCtive av. interest rate
interest due FIX/VARIABlE
year oF maturity
FaCe vaLue
Carrying amount
FaCe vaLue
Carrying amount
Fixed short term loan CHF 0.65 % v 2012 10 194 10 180 6 203 6 200
Fixed short term loan CHF 1.33 % v 2011 – 10 276 10 265
Fixed short term loan eur 0.70 % v 2012 12 617 12 571 –
Fixed long term loan CHF 1.70 % F 2013 5 151 5 000 5 234 5 000
other bank loans 134 134 93 91
Total bank loans 28 096 27 885 21 806 21 556
Finance Leases eur 5.00 % F 2010 4 4
Total finance leases 4 4
other loans eur 0 %–6.00 % F 2012 236 236 1 067 1 016
Total other loans 236 236 1 067 1 016
Total loans 28 332 28 121 22 877 22 576

108
�N O T E S � T O � T H E � C O N S O L I D A T E D � S T A T E M E N T � O F � F I N A N C I A L � P O S I T I O NI N T E r r O L L � G r O u P
6 . 1 2 F I N A N C I A L L I A B I L I T I E ST 7 3 : Z 9 2
Ageing of financial liabilities
The financial liabilities as per December 31, 2011 are due as follows:
in thousands CHF BooK vaLueFaCe vaLue
(undisCounted)WitHin
6 montHs
WitHin 6 –12
montHsWitHin
1 – 2 yearsWitHin
2 – 5 years
Bank loans 27 885 28 096 22 897 12 5 187
other loans 236 236 179 57
Trade/other accounts payable* 37 529 37 529 37 529
Total financial liabilities 65 650 65 861 60 426 12 5 366 57
* An ageing analysis is not readily available. Based on past experience, it can be reliably assumed that the full amount is due within less than 6 months.
The financial liabilities as per December 31, 2010 were due as follows:
in thousands CHF BooK vaLueFaCe vaLue
(undisCounted)WitHin
6 montHs
WitHin 6 – 12
montHsWitHin
1 – 2 yearsWitHin
2 – 5 years
Bank loans 21 556 21 806 16 494 26 63 5 223
Finance leases 4 4 4
other loans 1 016 1 067 479 337 251
Bank overdrafts 412 412 412
Trade/other accounts payable* 34 283 34 283 34 283
Total financial liabilities 57 271 57 572 51 672 26 400 5 474
* An ageing analysis is not readily available. Based on past experience, it can be reliably assumed that the full amount is due within less than 6 months.
Loans to finance the BDL acquisition
in the course of the acquisition of the BdL group in 2006, two unsecured loans of totally CHF 24.0 million were taken
up at an interest rate of 2.7 % with four years repayment term. the loans were to be settled through annually equal
instalments. the last instalment was settled end of February 2010.
Mortgage secured loans
in both years under review, there were no loans secured by a mortgage.

109
� N O T E S � T O � T H E � C O N S O L I D A T E D � S T A T E M E N T � O F � F I N A N C I A L � P O S I T I O NI N T E r r O L L � G r O u P
6 . 1 3 L E A S E ST 2 0 : T 2 3
6 . 1 2 L e a s i n g l i a b i l i t i e s
Finance leases
there was a remaining minor outstanding amount relating to Finance Lease which was fully due
and paid in 2011. There were no liabilities relating to finance lease outstanding at year end 2011.
6 . 1 3 L E A S E ST 2 7 : V 3 7
Operating leases
Liabilities from operating leases mainly relate to building rentals and will become due as follows:
in thousands CHF 31.12.2011 31.12.2010
within 1 year 3 010 2 753
between 1 and 5 years 7 631 7 300
over 5 years 2 540 1 424
Total operating leases 13 181 11 477
In both years under review, operating lease expense do not include material amounts for contin-
gent rent.
6 . 1 3 P r o v i s i o n s
WarrantiesotHer
Provisions ToTal provisions
in thousands CHF 2011 2010 2011 2010 2011 2010
at 1.1. 5 661 4 650 1 637 1 653 7 298 6 303
Currency translation adj. –232 –598 –27 –214 –259 –812
Provisions made 2 283 4 280 350 451 2 633 4 731
Provisions used –2 281 –1 890 –664 –207 –2 945 –2 097
Provisions reversed –514 –781 –2 –46 –516 –827
at 31.12. 4 917 5 661 1 294 1 637 6 211 7 298
6 . 1 4 P R O V I S I O N ST 2 0 : Z 3 0

110
�N O T E S � T O � T H E � C O N S O L I D A T E D � S T A T E M E N T � O F � F I N A N C I A L � P O S I T I O NI N T E r r O L L � G r O u P
6 . 1 4 P R O V I S I O N ST 3 2 : T 3 5
Warranty provisions
the group companies normally grant a 24-month warranty. the warranty provision is recognised
based on past experience as well as on specific projects. The warranty provision corresponds
to roughly 1.8 % (previous year: 2.0 %) of net sales. the absolute reduction of warranty provision is
based on the reduction of warranty cases for certain product groups. data from the past indicates
that between 30 % and 50 % of the warranty provision will be used in the subsequent year.
Other provisions
in 2007, an onerous contract provision in the amount of CHF 1.2 million was recognised that
relates to a long term building rental contract that will be terminated before its final term and that
was not used anymore as from late 2010. the impending loss corresponds to the rental amount
for the periods during which the building no longer was used. the other provisions include pension
liabilities according to ias 19 in the amount of CHF 1.0 million (previous year: CHF 0.7 million).
6 . 1 5 I A S 1 9T 2 0 : V 4 1 6 . 1 4 P e n s i o n o b l i g a t i o n s a n d p e n s i o n c o s t s
General information to the pension plans of the Group
the pension costs for 2011 amounted to CHF 1.6 million (2010: CHF 1.8 million). such costs con-
sist of employer contributions relating to the defined contribution plans and pension costs relating
to the defined benefit plans.
The pension plans in Switzerland and France are regarded as defined benefits plans in line with
IAS 19. In both years under review, approximately 190 employees participated in the defined
benefit plans. The Swiss plan is outsourced to a collective foundation whereas the plan of France
is outsourced to an insurance company. it can be assumed that the assets of both plans do not
include interroll shares.

111
� N O T E S � T O � T H E � C O N S O L I D A T E D � S T A T E M E N T � O F � F I N A N C I A L � P O S I T I O NI N T E r r O L L � G r O u P
6 . 1 5 I A S 1 9T 2 6 : V 4 1
Components of pension costs
in thousands CHF 2011 2010
Costs of the defined contribution plans –713 –927
Current service costs, gross –1 412 –1 005
employee contributions 706 326
interest costs –354 –375
amortisation of actuarial losses –76 –55
Expected return on plan assets 226 281
Costs of the defined benefit plans –910 –828
Total pension costs –1 623 –1 755
The expected future contributions of the employer will not change materially in future years provi-
ded the number of insured employees remains stable.
6 . 1 5 I A S 1 9T 4 3 : Y 5 6
Funded status for the defined benefit plans
in thousands CHF, as per year end 2011 2010 2009 2008 2007
Present value of defined benefit obligation –12 211 –12 151 –10 770 –9 478 –7 606
Fair value of plan assets 11 012 9 882 9 357 8 402 6 381
pension liability –1 199 –2 269 –1 413 –1 076 –1 225
unfunded fair value of benefit obligations –247 –239 –243 –205 –
unrecognised net actuarial losses/(gains) 428 1 788 1 174 923 1 038
unrecognised past service costs/(benefits) 64 68 – – –
Defined benefit obligation, net –954 –652 –482 –358 –187
Experience adjustments
– of plan liabilities 266 –102 –76 573 297
– of plan assets –378 35 68 14 8

112
6 . 1 5 I A S 1 9T 5 9 : V 7 3
Roll forward of the defined benefit obligation
in thousands CHF 2011 2010
Benefit obligation as per 1.1. –12 390 –11 013
Current service costs, net –706 –679
interest costs –354 –375
Contributions from plan participants –353 –326
Actuarial gains/(losses) 908 –628
Translation difference 8 –17
insurance premiums 265 284
Benefits funded/(paid), net 164 364
Benefit obligation as per 31.12. –12 458 –12 390
In order to shorten the presented statement of financial position, the net benefit obligation is disc-
losed within the other long term provisions.
6 . 1 5 I A S 1 9T 7 5 : V 8 7
Roll forward of the present value of plan assets
in thousands CHF 2011 2010
Fair value of plan assets as per 1.1. 9 882 9 357
Expected return on plan assets 226 281
Actuarial gains/(losses) 378 –35
Translation difference –2 –19
insurance premiums –265 –284
employer contributions 604 620
employee contributions 353 326
Benefits funded/(paid), net –164 –364
Fair value of plan assets as per 31.12. 11 012 9 882
6 . 1 5 I A S 1 9T 8 9 : V 9 7
Investment categories
in % 2011 2010
equity securities 2.3 1.9
debt securities 74.8 74.2
real estate 17.3 17.6
other investments 5.6 6.3
Total Investments in % 100.0 100.0
�N O T E S � T O � T H E � C O N S O L I D A T E D � S T A T E M E N T � O F � F I N A N C I A L � P O S I T I O NI N T E r r O L L � G r O u P

113
6 . 1 5 I A S 1 9T 9 9 : V 1 1 7
Roll forward of the unrecognised pension deficit
in thousands CHF 2011 2010
Unrecognised pension liabilities as of 1.1. –652 –482
Pension costs –910 –828
Contributions 604 620
Currency translation/plan expansion 4 38
Unrecognised pension liabilities as of 31.12. –954 –652
Actuarial assumptions
in % 2011 2010
discount rate 2.9 2.9
Expected return on plan assets 2.6 2.2
Expected benefit increases 0.0 0.5
average future salary increases 1.5 1.5
Average fluctuation rate 10.0 10.0
6 . 1 6 T R A D E PAYA B L ET 2 0 : V 3 46 . 1 5 Tr a d e a n d o t h e r a c c o u n t s p a y a b l e
in thousands CHF 31.12.2011 31.12.2010
trade accounts payable to third parties 14 123 14 717
advances received from customers 12 344 2 852
other liabilities 11 952 6 804
Accrued personnel expenses 6 861 6 440
accrued interest 18 22
Other accrued expenses 4 351 6 300
Foreign currency forward contracts* 224 –
Total trade and other accounts payable 49 873 37 135
* see note 6.8
advances received from customers mainly relate to larger projects within the subsystems
segment. other liabilities include vat and social security related liabilities. accrued personnel
expenses relate to accrued vacation and bonuses.
� N O T E S � T O � T H E � C O N S O L I D A T E D � S T A T E M E N T � O F � F I N A N C I A L � P O S I T I O NI N T E r r O L L � G r O u P

114
N O T E S � T O � T H E � C O N S O L I D A T E D � I N C O M E � S T A T E M E N TI N T E r r O L L � G r O u P
7 N O T E S T O T H E C O N S O L I D AT E D I N C O M E S TAT E M E N T
7 . 2 P E R S O N N E LT 2 0 : V 3 5
7 . 1 P e r s o n n e l e x p e n s e s
Details to personnel expenses and number of employees
in thousands CHF 2011 2010
Wages and salaries 68 183 68 381
social security costs 10 409 10 553
Pension costs (see note 6.14) 1 623 1 755
other personnel related costs 2 919 2 358
Equity based personnel expenses to management personnel 774 1 234
Total personnel expenses 83 908 84 281
Thereof production related personnel expenses 34 617 41 653
Average number of employees 1 340 1 255
in the period under review 2 084 own shares (previous year: 1 740) were attributed to management members as part
of their bonus scheme. in the year under review 1 200 shares (previous year: 1 550) have been blocked for sale for a
period of five years as of grant date. The shares were valuated at the market value of the attribution date.
7 . 2 P E R S O N N E LT 3 7 : U 4 6
Option plan
On March 3, 2006 the Board of Directors approved a management share option plan for the next five years. In the cour-
se of the first half year of 2010, the option life time and blocked period was extended by two years for plan participants
still being employed without notice as per 31. march 2010. respective increase in value of the option (CHF 0.7 million)
was debited to personnel expenses and credited to capital reserve in the year 2010.
the key data of the changed option plan is as follows:
option life: april 3, 2006 – september 30th, 2013 (previously until september 30th, 2011)
Blocked period: april 3, 2006 – april 2nd, 2012 (previously until april 2nd, 2010)
Exercise period: april 3, 2006 – september 30th, 2013 (previously until september 30th, 2011)
strike price: CHF 323.00 per registered share inrn
reference price: average inrn price from march 27th, 2006 – march 31st, 2006 less 4 %
Option/share: 1 option entitles to acquire 1 registered share inrn
option price: CHF 15 per option

115
N O T E S � T O � T H E � C O N S O L I D A T E D � I N C O M E � S T A T E M E N TI N T E r r O L L � G r O u P
7 . 2 P E R S O N N E LT 4 8 : A B 5 7
the following movements took place in the option plan in the years under review:
31.12.2011 attributed exercised expired 31.12.2010 attributed exercised 1.1.2010
outstanding options 45 965 –4 347 –2 653 52 965 52 965
option life until 30.09.2013 45 965 45 965 45 965
option life until 30.09.2011 – –4 347 –2 653 7 000 52 965
thereof not excercisable 45 965 45 965 52 965
thereof exercisable – –2 653 –4 347 7 000
7 . 2 P E R S O N N E LT 5 9 : T 6 6
all outstanding options have been attributed in 2006. the fair value at the grant date was CHF 4.7 million (CHF 88.64
per option). the employees contribution amounted to CHF 0.8 million (CHF 15 per option). the valuation of the option is
always calculated on the basis of the binomial method and is carried out by a specialised institute. Besides from above
data on the option plan, the following parameters were used for the valuation:
– risk free interest rate of 2.82 %
– volatility 25 %
– yearly unchanged profit distribution of CHF 6 per INRN
– average share price CHF 337
the options included in the plan are not subject to any vesting condition.
7 . 3 R DT 2 0 : V 2 7
7 . 2 R e s e a r c h a n d d e v e l o p m e n t e x p e n d i t u r e s
The Group incurred the following expenses for research and development during the years under review:
in thousands CHF 2011 2010
research and development expenditures 8 068 8 668
These expenses are mostly incurred to further develop and complete the product range of the segments. They are
included in personnel- and other operational expenses as well as in depreciation on fixed tangible assets. No expenses
have been capitalized as the preconditions stated in ias 38 are not met cumulatively.
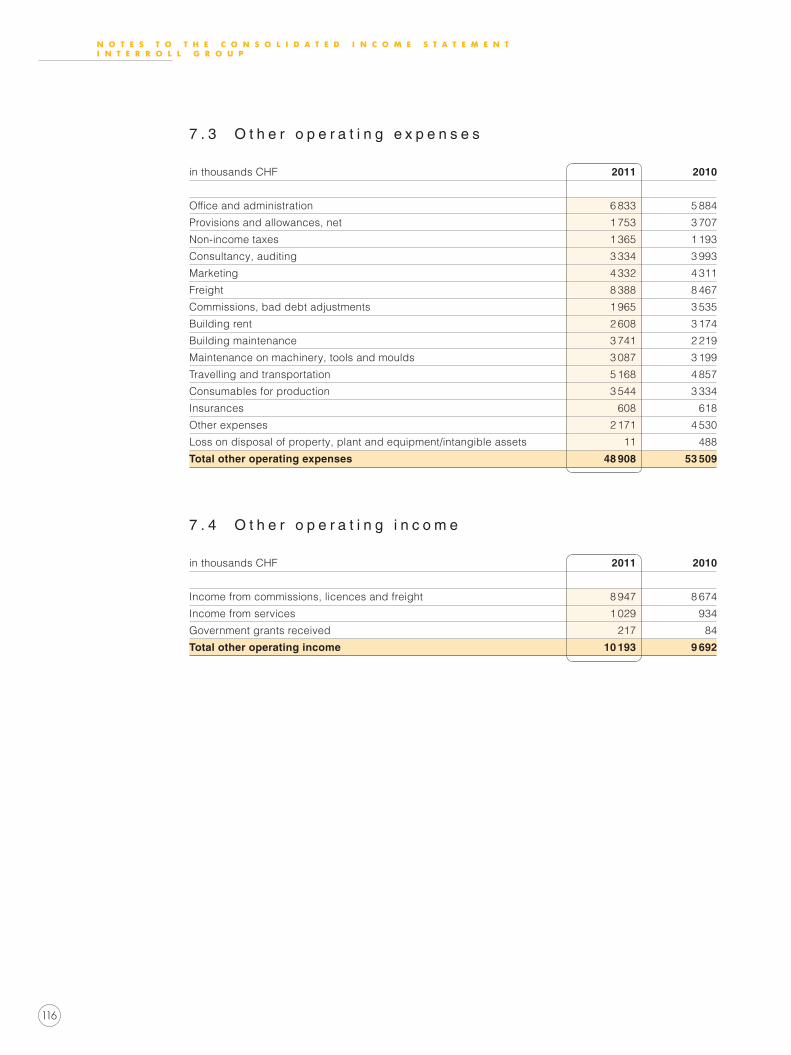
116
N O T E S � T O � T H E � C O N S O L I D A T E D � I N C O M E � S T A T E M E N TI N T E r r O L L � G r O u P
7 . 4 O T H E R E Y P E N S E ST 2 0 : V 3 9
7 . 3 O t h e r o p e r a t i n g e x p e n s e s
in thousands CHF 2011 2010
Office and administration 6 833 5 884
Provisions and allowances, net 1 753 3 707
Non-income taxes 1 365 1 193
Consultancy, auditing 3 334 3 993
marketing 4 332 4 311
Freight 8 388 8 467
Commissions, bad debt adjustments 1 965 3 535
Building rent 2 608 3 174
Building maintenance 3 741 2 219
maintenance on machinery, tools and moulds 3 087 3 199
travelling and transportation 5 168 4 857
Consumables for production 3 544 3 334
insurances 608 618
Other expenses 2 171 4 530
loss on disposal of property, plant and equipment/intangible assets 11 488
Total other operating expenses 48 908 53 509
7 . 5 O T H E R I N C O M ET 2 0 : V 2 7 7 . 4 O t h e r o p e r a t i n g i n c o m e
in thousands CHF 2011 2010
income from commissions, licences and freight 8 947 8 674
income from services 1 029 934
government grants received 217 84
Total other operating income 10 193 9 692
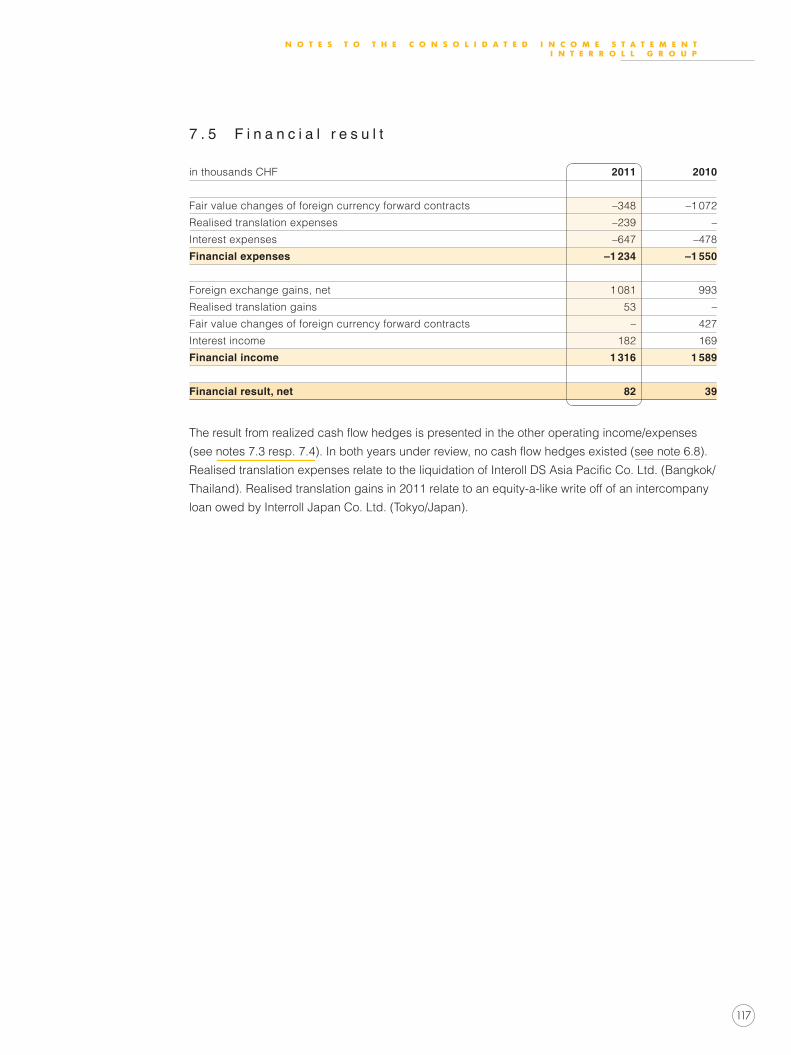
117
N O T E S � T O � T H E � C O N S O L I D A T E D � I N C O M E � S T A T E M E N TI N T E r r O L L � G r O u P
7 . 6 F I N A N C I A L R E S U LTT 2 0 : V 3 7
7 . 5 F i n a n c i a l r e s u l t
in thousands CHF 2011 2010
Fair value changes of foreign currency forward contracts –348 –1 072
Realised translation expenses –239 –
Interest expenses –647 –478
Financial expenses –1 234 –1 550
Foreign exchange gains, net 1 081 993
realised translation gains 53 –
Fair value changes of foreign currency forward contracts – 427
interest income 182 169
Financial income 1 316 1 589
Financial result, net 82 39
The result from realized cash flow hedges is presented in the other operating income/expenses
(see notes 7.3 resp. 7.4). In both years under review, no cash flow hedges existed (see note 6.8).
Realised translation expenses relate to the liquidation of Interoll DS Asia Pacific Co. ltd. (Bangkok/
Thailand). Realised translation gains in 2011 relate to an equity-a-like write off of an intercompany
loan owed by Interroll Japan Co. ltd. (Tokyo/Japan).
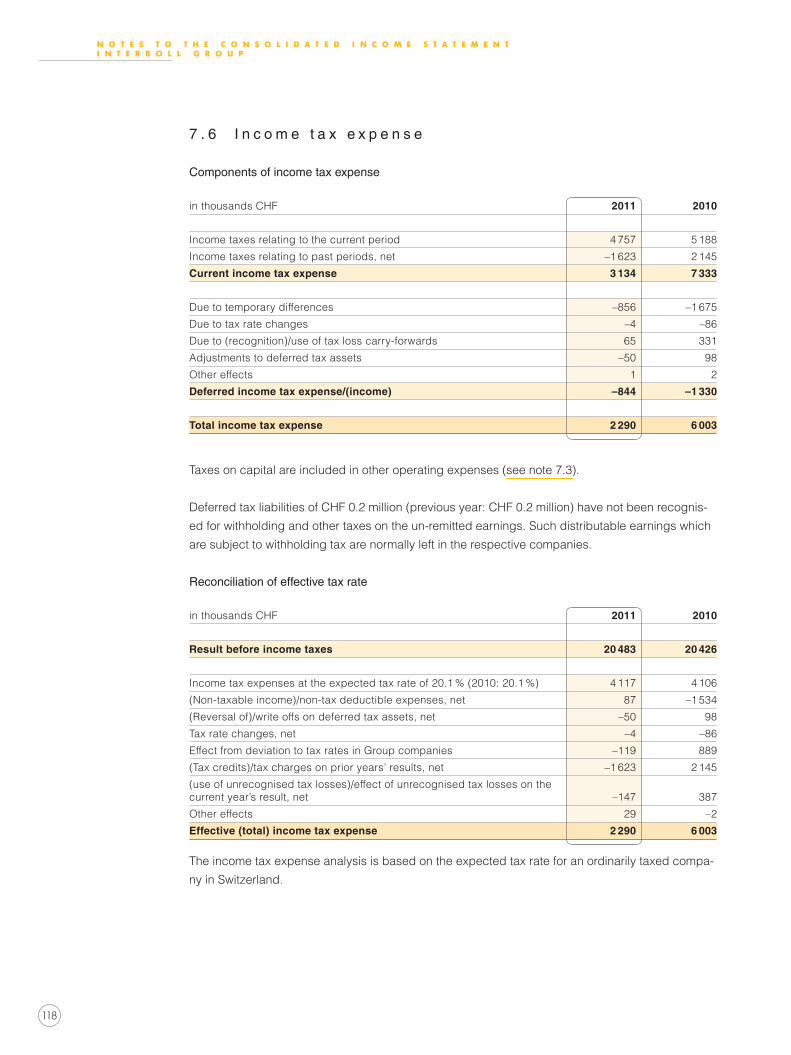
118
N O T E S � T O � T H E � C O N S O L I D A T E D � I N C O M E � S T A T E M E N TI N T E r r O L L � G r O u P
The income tax expense analysis is based on the expected tax rate for an ordinarily taxed compa-
ny in switzerland.
7 . 7 TA XT 2 0 : V 4 0
7 . 6 I n c o m e t a x e x p e n s e
Components of income tax expense
in thousands CHF 2011 2010
Income taxes relating to the current period 4 757 5 188
Income taxes relating to past periods, net –1 623 2 145
Current income tax expense 3 134 7 333
Due to temporary differences –856 –1 675
Due to tax rate changes –4 –86
Due to (recognition)/use of tax loss carry-forwards 65 331
Adjustments to deferred tax assets –50 98
Other effects 1 2
Deferred income tax expense/(income) –844 –1 330
Total income tax expense 2 290 6 003
Taxes on capital are included in other operating expenses (see note 7.3).
Deferred tax liabilities of CHF 0.2 million (previous year: CHF 0.2 million) have not been recognis-
ed for withholding and other taxes on the un-remitted earnings. Such distributable earnings which
are subject to withholding tax are normally left in the respective companies.
7 . 7 TA XT 4 3 : V 5 7
Reconciliation of effective tax rate
in thousands CHF 2011 2010
Result before income taxes 20 483 20 426
Income tax expenses at the expected tax rate of 20.1 % (2010: 20.1 %) 4 117 4 106
(Non-taxable income)/non-tax deductible expenses, net 87 –1 534
(Reversal of)/write offs on deferred tax assets, net –50 98
Tax rate changes, net –4 –86
Effect from deviation to tax rates in Group companies –119 889
(Tax credits)/tax charges on prior years’ results, net –1 623 2 145
(use of unrecognised tax losses)/effect of unrecognised tax losses on the current year’s result, net –147 387
Other effects 29 –2
Effective (total) income tax expense 2 290 6 003

119
N O T E S � T O � T H E � C O N S O L I D A T E D � I N C O M E � S T A T E M E N TI N T E r r O L L � G r O u P
7 . 7 TA XT 6 1 : X 8 1
Tax effects on recognised and unrecognised carried forward losses
in thousands CHF 31.12.2011 31.12.2010
not aCtivated aCtivated
not aCtivated aCtivated
Expiry:
2011 378 –
2012 90 – 394 –
2013 585 – 759 –
2014 561 – 597 –
2015 43 – 40 –
2016 and later 19 485 257 20 501 409
unlimited 5 572 2 567 3 631 2 490
Total 26 336 2 824 26 300 2 899
Tax benefit 9 278 699 9 433 777
thereof unrecognisable –9 278 –9 433
Deferred tax assets from carried forward losses 699 777
A tax effect of CHF 0.8 million resulted from new tax losses carried forward of CHF 2.8 million.
None of this effect was capitalized (previous year: new tax losses of 1.6 million with a tax effect of
CHF 0.6 million, whereof the full amount was activated).
Deferred tax assets on unused tax losses carried forward and based on temporary differencies are
capitalized in case it is probable that such assets can be set off against future taxable profits.
Due to the probability to set off current tax losses carried forward against future profits in various
subsidiaries, an amount of CHF 0.7 million has been capitalized in 2011 (2010: CHF 0.8 million).
Interroll considers the future set off probable based on approved business plans. The majority of
non-capitalized deferred tax assets on losses carried foward concern uS-based subsidiaries.
The applicable tax rate for both years under review is 39 %.

120
N O T E S � T O � T H E � C O N S O L I D A T E D � I N C O M E � S T A T E M E N TI N T E r r O L L � G r O u P
7 . 7 TA XT 8 5 : X 1 1 0
Attribution of defered tax assets/liabilities to items of the statement of financial position
in thousands CHF 31.12.2011 31.12.2010
deFerred taX deFerred taX
assets LiaBiLities assets LiaBiLities
intangible assets 334 755 2 279 3 202
Property, plant and equipment 200 2 716 248 3 162
Financial assets – 22 – 9
inventory 239 122 271 139
Benefits of loss carry forwards 699 – 777 –
receivables 88 302 144 210
Total assets 1 560 3 917 3 719 6 722
Long term debts – – – 127
Provisions 813 297 1 156 473
short term debts 118 36 218 84
other Liabilities 34 1 4 –
Total liabilities 965 334 1 378 684
Set-off –1 810 –1 810 –4 276 –4 276
Total net 715 2 441 821 3 130
Deferred tax assets and deferred tax liabilities are netted within and between companies belon-
ging to the same taxable unit.
The reduction of deferred tax assets and liabilities of net CHF 0.7 million (previous year: decrease
of CHF 1.1 million) corresponds to net deferred tax income recognised in the income statement
of CHF 0.8 million (previous year: deferred tax income of CHF 1.3 million) and currency translation
adjustements of CHF –0.1 million (previous year: CHF 0.2 million). in the year under review,
deferred tax liabilities were additionnally increased by CHF 0.3 million due to acquisition through
business combinations. there were no acquisitions in line with iFrs 3 in the previous year.
In both years under review, current income taxes of CHF 0.1 million were credited to equity.
No taxes were recognised in the other comprehensive income in both years under review.
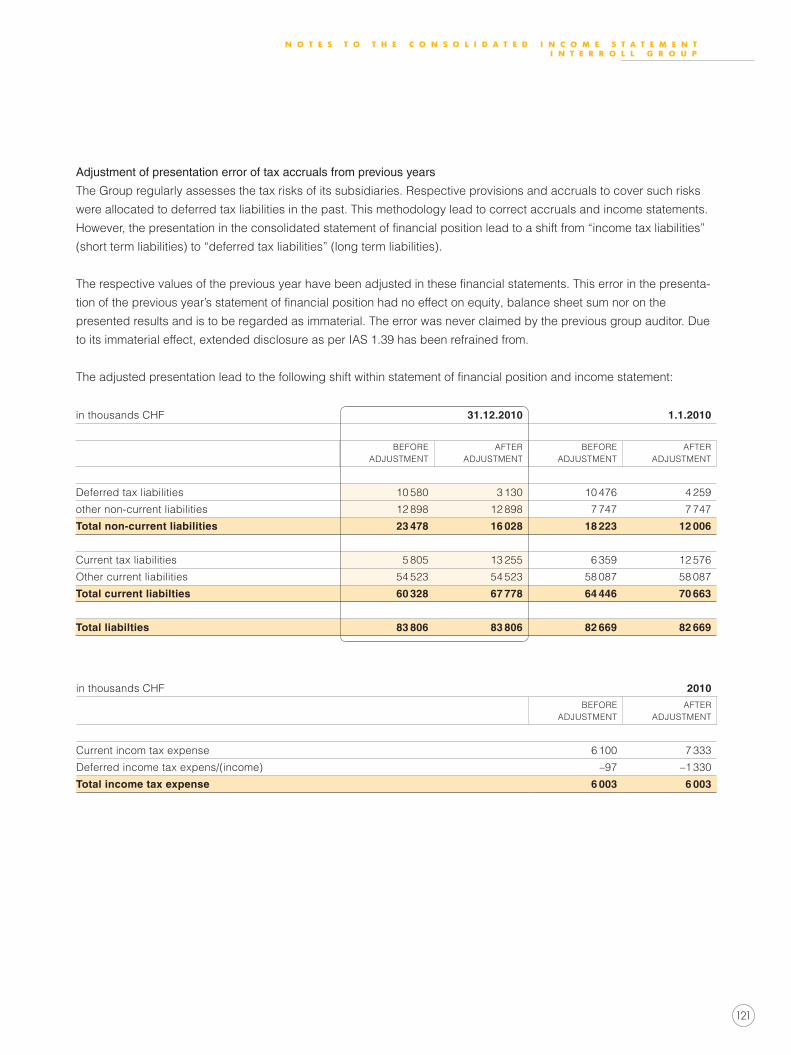
121
N O T E S � T O � T H E � C O N S O L I D A T E D � I N C O M E � S T A T E M E N TI N T E r r O L L � G r O u P
7 . 7 TA XT 1 1 3 : X 1 3 1
Adjustment of presentation error of tax accruals from previous years
The Group regularly assesses the tax risks of its subsidiaries. Respective provisions and accruals to cover such risks
were allocated to deferred tax liabilities in the past. This methodology lead to correct accruals and income statements.
However, the presentation in the consolidated statement of financial position lead to a shift from “income tax liabilities”
(short term liabilities) to “deferred tax liabilities” (long term liabilities).
The respective values of the previous year have been adjusted in these financial statements. This error in the presenta-
tion of the previous year’s statement of financial position had no effect on equity, balance sheet sum nor on the
presented results and is to be regarded as immaterial. the error was never claimed by the previous group auditor. due
to its immaterial effect, extended disclosure as per IAS 1.39 has been refrained from.
The adjusted presentation lead to the following shift within statement of financial position and income statement:
in thousands CHF 31.12.2010 1.1.2010
BeFore adJustment
aFter adJustment
BeFore adJustment
aFter adJustment
Deferred tax liabilities 10 580 3 130 10 476 4 259
other non-current liabilities 12 898 12 898 7 747 7 747
Total non-current liabilities 23 478 16 028 18 223 12 006
Current tax liabilities 5 805 13 255 6 359 12 576
other current liabilities 54 523 54 523 58 087 58 087
Total current liabilties 60 328 67 778 64 446 70 663
Total liabilties 83 806 83 806 82 669 82 669
7 . 7 TA XT 1 3 3 : V 1 3 8
in thousands CHF 2010BeFore
adJustmentaFter
adJustment
Current incom tax expense 6 100 7 333
Deferred income tax expens/(income) –97 –1 330
Total income tax expense 6 003 6 003

122
O T H E r � D I S C L O S u r E SI N T E r r O L L � G r O u P
8 O T H E R D I S C L O S U R E S T O T H E F I N A N C I A L S TAT E M E N T S
8 . 1 C O N T I N G E N T L I A B I L I T I E ST 2 0 : T 2 2
8 . 1 C o n t i n g e n t l i a b i l i t i e s a n d o t h e r c o m m i t m e n t s
the interroll group has committed to guarantees versus third party in the amount of CHF 0.5 million which are in relation
with a project settlement. there are no further contingent liabilities in both years under review.
8 . 2 T H I R D PA R T Y T R A N S AT I O N ST 2 0 : Y 3 7
8 . 2 R e l a t e d p a r t y t r a n s a c t i o n s
Transactions with related parties
voLume oPen PayaBLes
in thousands CHF Category 2011 2010 31.12.2011 31.12.2010
Purchase of materials a 2 311 3 326 349 605
IT Investments/IT Services a 614 820 16 46
other costs a+b 1 154 1 081 16 89
Total purchases 4 079 5 227 381 740
voLume oPen reCeivaBLes
in thousands CHF Category 2011 2010 31.12.2011 31.12.2010
sale of material a 6 675 6 604 1 232 1 054
other income b 377 446 114 97
Total services 7 052 7 050 1 346 1 151
8 . 2 T H I R D PA R T Y T R A N S AT I O N ST 3 9 : U 4 4
Definition of related parties
The Interroll Group defines and categorises its related parties as following:
a) shareholders of interroLL HoLding Ltd. holding more than 3 % of the shareholder capital.
b) members of the Board of directors of interroLL HoLding Ltd. and legal entities that are directly controlled by
them.
c) members of the group management of interroll group and legal entities that are directly controlled by them.
d) Local managing directors as well as people reporting to them (only for substantial transactions).

123
O T H E r � D I S C L O S u r E SI N T E r r O L L � G r O u P
8 . 2 T H I R D PA R T Y T R A N S AT I O N ST 4 6 : V 5 6
Total compensation to the Board of Directors
total compensation in the year 2011 to the Board of directors of interroLL HoLding Ltd. is CHF 0.48 million (2010:
0.48 million). the detailed disclosure on the compensation to and shares owned by the Board of directors required by
Swiss law are included in the notes to the financial statements of INTERROll HOlDING lTD.
Total compensation to the Group Management
in thousands CHF 2011 2010
salaries incl. bonus 3 965 3 910
Post-employment benefits 543 577
Other long term benefits – –
equity based compensation 676 473
Total compensation to the group management 5 184 4 960
8 . 2 T H I R D PA R T Y T R A N S AT I O N ST 5 8 : T 5 9
In the period under review as well as in the previous year no termination pay were executed and no loans were granted.
the detailed disclosure of the compensation and equities held by the group management in line with swiss law (or)
can be found in the notes to the financial statements of INTERROll HOlDING lTD.

124
O T H E r � D I S C L O S u r E SI N T E r r O L L � G r O u P
8 . 3 L AT E R E V E N T ST 2 0 : T 2 4
8 . 3 S u b s e q u e n t e v e n t s
The consolidated financial statements for the year 2011 were approved by the Board of Directors on March 5th, 2012
and are subject to further approval by the general meeting of the shareholders on may 11th, 2012.
no event has occurred between december 31st, 2011 and march 5th, 2012 which would reqiure adjustment to the carry-
ing amount of the group’s assets and liabilities as of december 31st, 2011, or would require disclosuere in accordance
with ias 10.
8 . 4 S C O P ET 2 0 : Z 5 1
8 . 4 S c o p e o f c o n s o l i d a t i o n
name location (country) Function owner share capital in 1 000ownership
in %
switzerland
interroll Holding ag sant’antonino (CH) F 0 CHF 8 540.0
interroll sa sant’antonino (CH) P Hd CHF 100.0 100 %
interroll (schweiz) ag sant’antonino (CH) s Hd CHF 5 000.0 100 %
interroll management ag sant’antonino (CH) F Hd CHF 100.0 100 %
Europe, Africa excl. Switzerland
interroll Fördertechnik gmbH Wermelskirchen (de) s dHo eur 25.6 100 %
interroll engineering gmbH Wermelskirchen (de) P dHo eur 1 662.2 100 %
interroll automation gmbH sinsheim (de) P/S dHo eur 2 000.0 100 %
interroll Holding gmbH Wermelskirchen (de) F Hd eur 500.0 100 %
interroll gmbH Wermelskirchen (de) d Hd eur 25.0 100 %
interroll trommelmotoren gmbH Wermelskirchen (de) P/S dHo eur 77.0 100 %
transtechnik gmbH Wassenberg (de) P/S dHo eur 25.6 100 %
interroll sas saint-Pol-de-Léon (Fr) F Hde eur 2 808.0 100 %
interroll sas La roche sur yon (Fr) P/S F eur 2 660.0 100 %
interroll sas saint-Pol-de-Léon (Fr) s F eur 61.0 100 %
interroll nordic as Hvidovre (dK) s dKP eur 67.1 100 %
interroll Joki as, Hvidovre Hvidovre (dK) P Hd eur 2 013.8 100 %
interroll Ltd. Corby (gB) s Hde gBP 0.0 100 %
interroll engineering Ltd. Corby (gB) d Hde gBP 0.1 100 %
interroll españa sa Barbera del valles (es) s HDE/TI eur 600.0 100 %
interroll CZ sro. Breclav (CZ) s Hde CZK 1 000.0 100 %
interroll europe Bv emmeloord (nL) F Hd eur 90.8 100 %
interroll Polska sp.z.o.o. Warszaw (PL) s Hd PLZ 100.0 100 %
interroll Lojistik sistemleri istanbul (tr) s Hd try 1 000.0 100 %
interroll sa (Proprietary) Ltd. Johannesburg (Za) P/S Hd Zar 1 500.0 100 %

125
O T H E r � D I S C L O S u r E SI N T E r r O L L � G r O u P
8 . 4 S C O P ET 2 2 : Z 2 2
name location (country) Function owner share capital in 1 000ownership
in %
8 . 4 S C O P ET 5 2 : Z 6 7
americas
interroll Corporation Wilmington/N.C. (uS) P/S Hd usd 65.0 100 %
interroll automation LLC Jeffersonville (uS) P/S Hd usd 0.1 100 %
interroll dynamic storage inc. Hiram/Atlanta (uS) P/S Hd usd 0.0 100 %
interroll Canada Ltd. aurora (Ca) P/S Hd Cad 1 720.0 100 %
interroll Components Canada Ltd. Concord (Ca) P/S Hd Cad 0.1 100 %
interroll Logistica Ltda Pindamonhangaba/S. Paolo (BR) P/S e BrL 1 000.0 100 %
Asia and Pacific
interroll (asia) Pte. Ltd. singapur (sg) P/S Hde sgd 18 625.0 100 %
interroll suzhou Co. Ltd. suzhou (Cn) P/S sgP Cny 42 490.2 100 %
interroll australia Pty. Ltd. victoria (au) s Hd aud 51.2 100 %
interroll (thailand) Co. Ltd. Bangkok (tH) P/S SGP/HD tHB 100 000.0 100 %
interroll Japan Co. Ltd. tokio (JP) s Hd JPy 10 000.0 100 %
interroll (Korea) Corporation seoul (Kr) P/S SGP/HD KrW1 500 000.0 100 %
8 . 4 S C O P ET 6 9 : Z 7 1
Function: P = Production, s = sales, F = Finance, d = dorming
owner: Hd = interroLL HoLding Ltd., Hde = interroll europe Bv, ti = interroll sa, dHo = interroll Holding gmbH, dKP = interroll Joki as,
F = interroll sas, saint-Pol-de-Léon, e = interroll españa sa, sgP = interroll (asia) Pte. Ltd., singapur
8 . 4 S C O P ET 7 3 : T 7 6
Movements within the scope of concolidation in 2011
mid 2011, interroll founded interroll Lojistik sistemleri tic. Ltd. sti. which has taken over sales activities for turkey and
the mid east. In December 2011 Interroll DS Asia Pacific Co. ltd in Bangkok/Thailand was definitely liquidated.
Movements within the scope of concolidation in 2010
assets and liabilities of inroll Ltd., British virgin islands, belonging to the scope of consolidation, were merged with in-
terroll (Schweiz) AG as per June 1, 2010. Inroll ltd. was thereafter liquidated. Furthermore Interroll Holding A/S has
been merged with its subsidiary Interroll Joki A/S as per end of May 2010. Also Interroll Financial Canada ltd. in Aurora/
Toronto has been merged with its subsidiary Interroll Components Canada ltd., Concord/Toronto as per January 1,
2010. Assets of Interroll DS Asia Pacific Co., Thailand were transferred to Interroll (Thailand) Co. Bangkok. Interroll
(malaysia sdn. BHd. has been liquidated in late 2010. Further notes to changes in the consolidation range are disclosed
in note 4.

126
r E P O r T � O F � T H E � G r O u P � A u D I T O rI N T E r r O L L � G r O u P
9 R E P O R T O F T H E G R O U P A U D I T O R
R e p o r t o f t h e S t a t u t o r y A u d i t o r o n t h e C o n s o l i d a t e d F i n a n c i a l S t a t e m e n t s t o t h e G e n e r a l M e e t i n g o f S h a r e h o l d e r s o f I N T E R R O L L H O L D I N G LT D . ,S a n t ’ A n t o n i n o
As statutory auditor, we have audited the consolidated financial statements of INTERROll
HoLding Ltd, which comprise the balance sheet, income statement, statement of comprehen-
sive income, statement of cash flows, statement of changes in equity and notes (pages 68 to 125),
for the year ended december 31, 2011.
Board of Directors’ Responsibility
the Board of directors is responsible for the preparation and fair presentation of the consolidated
financial statements in accordance with the International Financial Reporting Standards (IFRS)
and the requirements of swiss law. this responsibility includes designing, implementing and main-
taining an internal control system relevant to the preparation and fair presentation of consolidated
financial statements that are free from material misstatement, whether due to fraud or error.
the Board of directors is further responsible for selecting and applying appropriate accounting
policies and making accounting estimates that are reasonable in the circumstances.
Auditor’s Responsibility
Our responsibility is to express an opinion on these consolidated financial statements based
on our audit. We conducted our audit in accordance with swiss law and swiss auditing standards
as well as the international standards on auditing. those standards require that we plan and
perform the audit to obtain reasonable assurance whether the consolidated financial statements
are free from material misstatement.
an audit involves performing procedures to obtain audit evidence about the amounts and disclo-
sures in the consolidated financial statements. The procedures selected depend on the auditor’s
judgment, including the assessment of the risks of material misstatement of the consolidated
financial statements, whether due to fraud or error. In making those risk assessments, the auditor
considers the internal control system relevant to the entity’s preparation and fair presentation
of the consolidated financial statements in order to design audit procedures that are appropriate in
the circumstances, but not for the purpose of expressing an opinion on the effectiveness of the
entity’s internal control system. an audit also includes evaluating the appropriateness of the accoun-
ting policies used and the reasonableness of accounting estimates made, as well as evaluating
the overall presentation of the consolidated financial statements. We believe that the audit evidence
we have obtained is sufficient and appropriate to provide a basis for our audit opinion.

127
r E P O r T � O F � T H E � G r O u P � A u D I T O rI N T E r r O L L � G r O u P
Opinion
In our opinion, the consolidated financial statements for the year ended December 31, 2011 give
a true and fair view of the financial position, the results of operations and the cash flows in
accordance with the international Financial reporting standards (iFrs) and comply with swiss law.
Other Matter
The consolidated financial statements of INTERROll HOlDING lTD for the year ended December
31, 2010, were audited by another auditor who expressed an unmodified opinion on those state-
ments on march 3, 2011.
Report on other legal requirements
We confirm that we meet the legal requirements on licensing according to the Auditor Oversight
act (aoa) and independence (article 728 Co and article 11 aoa) and that there are no circum-
stances incompatible with our independence.
in accordance with article 728a paragraph 1 item 3 Co and swiss auditing standard 890, we
confirm that an internal control system exists which has been designed for the preparation of con-
solidated financial statements according to the instructions of the Board of Directors.
We recommend that the consolidated financial statements submitted to you be approved.
PricewaterhouseCoopers ag
urs Honegger martin graf
Audit expert Audit expert
auditor in charge
Zurich, 5th march 2012


129
F i n a n c i a l s t a t e m e n t s o F i n t e R R o l l H o l D i n G l t D . c o n t e n t s
Financial statements of INTERROLL HOLDING LTD.
C o n t e n t s
1 Financial statements of InteRRoLL HoLDInG LtD. 130
1.1 Balance sheet 130
1.2 Income statement 131
1.3 statement of changes in equity 131
2 Generalinformationtothefinancialstatements 132
2.1 Accounting policies 132
2.2 Principles of valuation 132
3 Notestothefinancialstatements 133
3.1 own shares and options 133
3.2 Investments 133
3.3 Loans due from Group companies 134
3.4 Loans due to Group companies 134
3.5 Provision for investment risks 135
3.6 shareholder equity 135
3.7 Contingent liabilities 136
4 other disclosures according to swiss law 137
4.1 Risk assessment 137
4.2 Internal control system 137
4.3 Compensation of and shares held by the Board of Directors 138
4.4 Compensation of and shares held by the Group Management 139
5 Proposed appropriation of available earnings 141
6 Report of the statutory auditor 142

130
F i n a n c i a l s t a t e m e n t si n t e R R o l l H o l D i n G l t D .
1 F i n a n c i a l S tat e m e n t S o F i n t e R R o l l H o l D i n G l t D .
1 . 1 B a l a n c e s h e e t
in thousands CHF see notes* 31.12.2011 31.12.2010
a S S e t S
Cash and cash equivalents 5 753
Accounts receivable from Group Companies 819 429
other receivables from third party 79 43
own shares 3.6 17 138 24 698
Total current assets 18 041 25 923
Investments 213 169 212 974
Loans due from Group Companies 3.3 11 930 9 505
Total non-current assets 225 099 222 479
Total assets 243 140 248 402
e Q U i t Y a n D l i a B i l i t i e S
trade and other accounts payable Group Companies 337 231
trade and other accounts payable from third party 109 79
Accrued expenses 1 205 864
Total current liabilities 1 651 1 174
Loans due to Group Companies 3.4 2 209 11 929
Provision for loan assets and investment risks 3.5 110 771 110 771
other provisions 804 804
Total non-current liabilities 113 784 123 504
share capital 3.6 8 540 8 540
share premium 3.6 19 616 19 078
General legal reserve 5 209 5 209
Reserve for own shares 3.6 21 018 27 959
Available earnings 73 322 62 938
Total shareholder’s equity 127 705 123 724
Total liabilities and equity 243 140 248 402
*Seenotestothefinancialstatements.
1.1-Bst20:W59

131
F i n a n c i a l s t a t e m e n t si n t e R R o l l H o l D i n G l t D .
1 . 2 i n c o m e s t a t e m e n t
in thousands CHF 2011 2010
Investment income 10 091 5 877
Royalty income 2 654 2 731
other operating income 728 4 923
Financial income 607 3 603
Total income 14 080 17 134
Investment expenses –212 –18 725
Administration expenses –385 –339
Personnel expenses –1 685 –1 325
other operating expenses –2 989 –2 638
Financial expenses –860 –416
Total Expenses –6 131 –23 443
Result before income taxes 7 949 –6 309
Income tax expenses –2 –6
Result 7 947 –6 315
1.2-PLt20:V40
1.3-eQUItYMoVt20:Z35
1 . 3 S t a t e m e n t o f c h a n g e s i n e q u i t y
in thousands CHF sHARe CAPItAL
* ReseRVes FRoM
CAPItAL ContRIB. LeGAL ReseRVe
ReseRVe FoR oWn sHARes
AVAILABLe eARnInGs TOTaL
as of 1.1.2010 12 810 19 078 5 209 32 386 64 826 134 309
Result 2010 –6 315 –6 315
Reduction of par value –4 270 –4 270
Change of reserve for own shares –4 427 4 427 –
at 31.12.2010 8 540 19 078 5 209 27 959 62 938 123 724
Result 2011 7 947 7 947
Distribution from approbration from capital contributions –3 966 –3 966
Appropriation to reserves from capital contributions* 4 504 –4 504 –
Change of reserve for own shares –6 941 6 941 –
at 31.12.2011 8 540 19 616 5 209 21 018 73 322 127 705
*TheamountofreservesfromcapitalcontributionshasnotyetbeenconfirmedbytheSwissFederalTaxAuthorities.

132
G e n e R a l i n F o R m a t i o n t o t H e F i n a n c i a l s t a t e m e n t si n t e R R o l l H o l D i n G l t D .
2 G e n e R a l i n F o R m at i o n t o t H e F i n a n c i a l S tat e m e n t S
2 . 1 a c c o u n t i n g P o l i c i e s
current/non-current distinction
Current assets are assets expected to be realised or consumed in the normal course of the
Company’soperatingcycleorassetsheldfortradingpurposes.Allotherassetsareclassifiedas
non-current assets.
Current liabilities are liabilities expected to be settled by use of cash generated in the normal
course of the Company’s operating cycle or liabilities due within one year from the reporting date.
Allotherliabilitiesareclassifiedasnon-currentliabilities.
Foreign currency translation
transactions in foreign currencies are recorded using exchange rates prevailing at the time of the
transaction. Gains or losses arising on settlement of these transactions are included in the current
year’sincomeunderfinancialincomeandfinancialexpensesrespectively.Monetaryassetsand
liabilities denominated in foreign currencies are translated using the exchange rates prevailing at
the balance sheet date. Any gains or losses resulting from this translation are also included in
the current year’s income, except for unrealised gains which are deferred.
2 . 2 P r i n c i p l e s o f v a l u a t i o n
cash and cash equivalents, accounts receivable and payable
Cash and cash equivalents are stated at nominal value. Accounts receivable are stated at nominal
value less any valuation adjustment for credit risks. Accounts payable are stated at nominal
value. Accounts receivable from Group companies arise from services provided by InteRRoLL
HoLDInG LtD. and related interest and royalties billed. these services are recognised on an
accrual basis.
own shares and options
own shares and options to buy own shares are stated at the lower of cost and fair value.
loans
non-current loans receivable are stated at nominal value less any valuation adjustments deemed
necessarytoreflectthecreditrisk.Non-currentloanspayablearestatedatnominalvalue.
investments
Investments are stated at cost less any valuation adjustments deemed necessary to recognise
a decline other than temporary in value (impairment). Additional provisions are recognised for ge-
neral investment risks.
accrued expenses
Accrued expenses primarily relate to interest due on loans payable stated at nominal value and to
accruals for the compensation of the Board of Directors.

133
n o t e s t o t H e F i n a n c i a l s t a t e m e n t si n t e R R o l l H o l D i n G l t D .
3 n o t e S t o t H e F i n a n c i a l S tat e m e n t S
3 . 1 o w n s h a r e s a n d o p t i o n s
In the year under review, the Company sold 12 713 own shares at an average price of CHF 395
(previous year: 6 085 shares at an average price of CHF 356). In the year under review, the
company acquired 3 149 Aktien (none in the previous year). At year end 2011, the company held
60 099 own shares with a carrying amount of CHF 21.0 million (2010: 74 400 own shares with a
carrying amount of CHF 24.7 million). there is a reserve for own shares equal to the original cost of
CHF 21.0 million (previous year: CHF 24.7 million). In the year under review, 45 965 own shares
are reserved to cover the management share option plan (at end of 2010, 52 965 were reserved
forsuchpurpose,seenote7.1oftheconsolidatedfinancialstatements).Intheyearunderreview
2 653 shares (2010: none) were sold at the strike price of CHF 323 out of the share option plan.
2 084 shares (previous year: 1 740) with a carrying value of CHF 0.7 million (previous year:
CHF 0.5 million) were attributed to employees.
3 . 2 i n v e s t m e n t sAn overview on the material either directly or indirectly held investments can be found in the notes
to the consolidated statements of the Interroll Group (see “8.4 – scope of consolidation”).
2.3oWnsHARest20:t28

134
n o t e s t o t H e F i n a n c i a l s t a t e m e n t si n t e R R o l l H o l D i n G l t D .
2.4LoAnst20:V27
3 . 3 l o a n s d u e f r o m G r o u p c o m p a n i e s
the interest rates used were the following: lowest highest
In the year 2011 0.00 % 6.00 %
In the year 2010 0.00 % 6.00 %
TheloansduefromGroupcompaniesarenormallyredeemablewithanotificationperiodofthree
months. As of year end, the total outstanding group loans amounted to CHF 11.9 million (2010:
CHF 9.5 million). For CHF 2.8 million (previous year: CHF 4.2 million) a valuation allowance has
been accounted for.
2.6-LoansV20:X26
3 . 4 l o a n s d u e t o G r o u p c o m p a n i e s
the following interest rates were used: lowest highest
In the year 2011 0.00 % 5.50 %
In the year 2010 0.00 % 5.00 %
TheloansduetoGroupcompaniesarenormallyredeemablewithanotificationperiodofthree
months. As of year end 2011, the total outstanding group loans amounted to CHF 2.2 million
(2010: CHF 11.9 million).
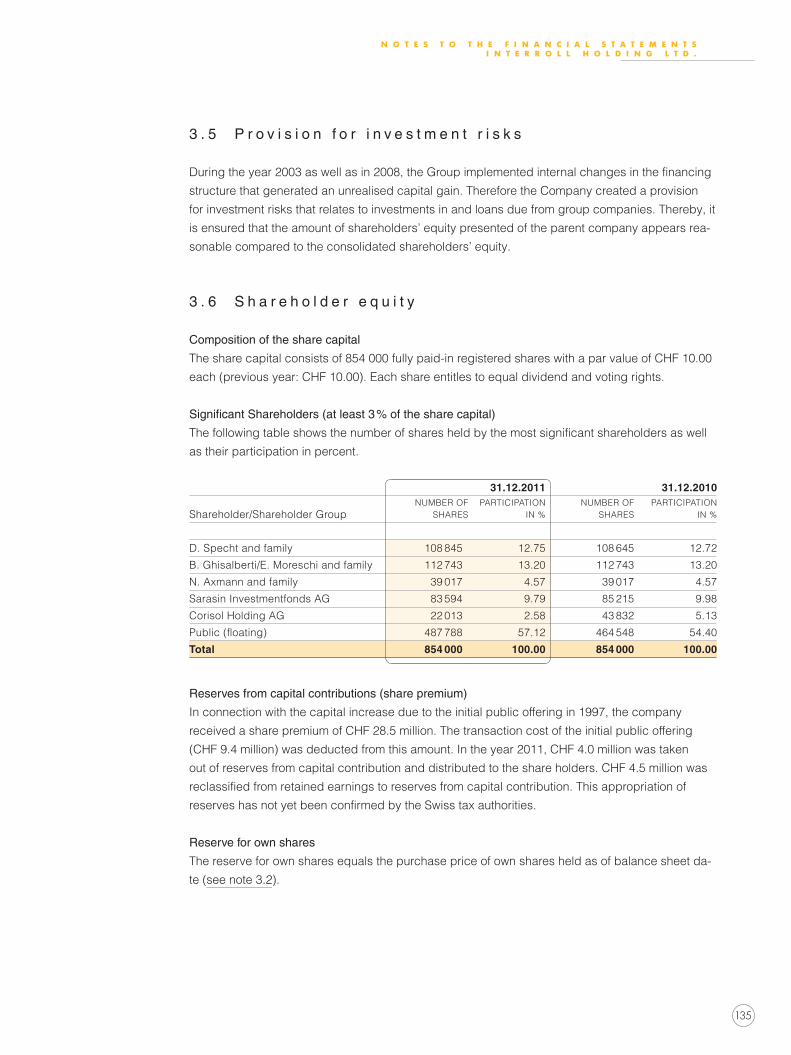
135
n o t e s t o t H e F i n a n c i a l s t a t e m e n t si n t e R R o l l H o l D i n G l t D .
3 . 5 P r o v i s i o n f o r i n v e s t m e n t r i s k s
Duringtheyear2003aswellasin2008,theGroupimplementedinternalchangesinthefinancing
structure that generated an unrealised capital gain. therefore the Company created a provision
for investment risks that relates to investments in and loans due from group companies. thereby, it
is ensured that the amount of shareholders’ equity presented of the parent company appears rea-
sonable compared to the consolidated shareholders’ equity.
3 . 6 S h a r e h o l d e r e q u i t y
composition of the share capital
the share capital consists of 854 000 fully paid-in registered shares with a par value of CHF 10.00
each (previous year: CHF 10.00). each share entitles to equal dividend and voting rights.
Significant Shareholders (at least 3 % of the share capital)
Thefollowingtableshowsthenumberofsharesheldbythemostsignificantshareholdersaswell
as their participation in percent.
31.12.2011 31.12.2010
shareholder/shareholder GroupnUMBeR oF
sHAResPARtICIPAtIon
In %nUMBeR oF
sHAResPARtICIPAtIon
In %
D. specht and family 108 845 12.75 108 645 12.72
B. Ghisalberti/e. Moreschi and family 112 743 13.20 112 743 13.20
n. Axmann and family 39 017 4.57 39 017 4.57
sarasin Investmentfonds AG 83 594 9.79 85 215 9.98
Corisol Holding AG 22 013 2.58 43 832 5.13
Public(floating) 487 788 57.12 464 548 54.40
Total 854 000 100.00 854 000 100.00
2.8-eQUItYt20:X36
2.8-eQUItYA41:A42
2.8-eQUItYA44:A45
Reserves from capital contributions (share premium)
Inconnectionwiththecapitalincreaseduetotheinitialpublicofferingin1997,thecompany
receivedasharepremiumofCHF28.5million.Thetransactioncostoftheinitialpublicoffering
(CHF 9.4 million) was deducted from this amount. In the year 2011, CHF 4.0 million was taken
out of reserves from capital contribution and distributed to the share holders. CHF 4.5 million was
reclassifiedfromretainedearningstoreservesfromcapitalcontribution.Thisappropriationof
reserveshasnotyetbeenconfirmedbytheSwisstaxauthorities.
Reserve for own shares
the reserve for own shares equals the purchase price of own shares held as of balance sheet da-
te (see note 3.2).

136
n o t e s t o t H e F i n a n c i a l s t a t e m e n t si n t e R R o l l H o l D i n G l t D .
3 . 7 c o n t i n g e n t l i a b i l i t i e s
InteRRoLL HoLDInG LtD. has issued a guarantee for an existing shared credit facility in the
amount of CHF 42 million in favour of Interroll (schweiz) AG.
Inaddition,INTERROLLHOLDINGLTD.issuedlettersofcontinuingfinancialsupportinfavourof
the following Group companies:
Country Company
Germany Interroll Automation GmbH, sinsheim (De)
France Interroll sas, La Roche sur Yon (FR)
switzerland Interroll (schweiz) AG, sant’Antonino (CH)
Canada Interroll Canada Ltd., Aurora (CA)
Interroll Components Canada Ltd., Concord (CA)
InteRRoLL HoLDInG LtD. carries joint liability in respect of the federal tax authorities for value
added tax debts of all swiss subsidiaries.
2.9ContLIABt20:U32

137
o t H e R D i s c l o s u R e s a c c o R D i n G t o s w i s s l a wi n t e R R o l l H o l D i n G l t D .
4 o t H e R D i S c l o S U R e S a c c o R D i n G t o S w i S S l a w
4 . 1 R i s k a s s e s s m e n t
the risk management coordinates and aligns the risk management processes and reports to
the Board of Directors on a regular basis on risk assessment and risk management. organizational
and process measures designed to identify and mitigate risks at an early stage have been as-
sessed to be satisfactory by the Board of Directors.
4 . 2 i n t e r n a l c o n t r o l s y s t e m
the Board of Directors and management of the Group are responsible for establishing and
maintainingadequateinternalcontroloverfinancialreporting.INTERROLLHOLDINGLTD.’sand
the Interroll Group’s internal control system was designed to provide reasonable assurance to
theInterrollGroup’smanagementandBoardofDirectorsregardingthereliabilityoffinancialrepor-
tingandthepreparationandfairpresentationofitspublishedconsolidatedfinancialstatements.
All internal control systems no matter how well designed have inherent limitations. therefore,
eventhosesystemsdeterminedtobeeffectivemaynotpreventordetectmisstatementsandcan
provideonlyreasonableassurancewithrespecttofinancialstatementpreparationandpresen-
tation.Also,projectionsofanyevaluationofeffectivenesstofutureperiodsaresubjecttotherisk
that controls may become inadequate because of changes in conditions or that the degree of
compliance with the policies or procedures may deteriorate.
InterrollGroupmanagementassessedtheeffectivenessoftheGroup’sinternalcontrolover
financialreportingasofDecember31,2011.Basedonitsassessment,managementhas
concludedthat,asofDecember31,2011,theInterrollGroup’sinternalcontroloverfinancial
reportingwaseffectivebasedonthosecriteria(seenotestotheconsolidatedfinancials
statements “3 – Risk Management”).
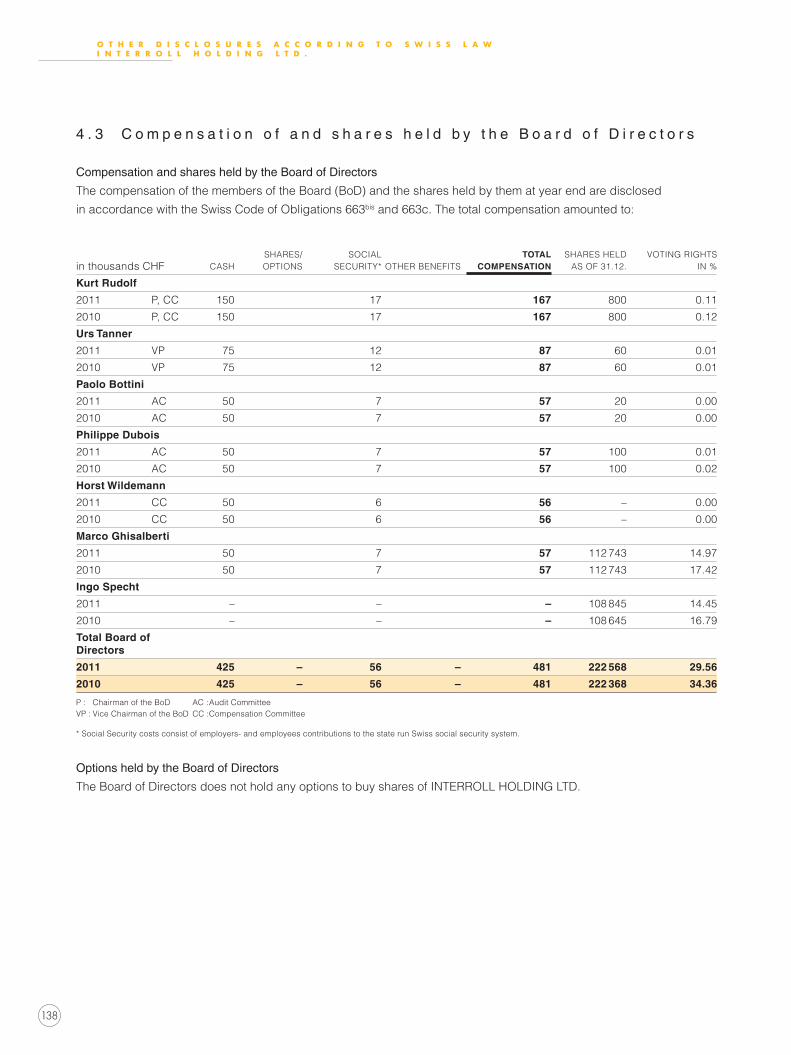
138
o t H e R D i s c l o s u R e s a c c o R D i n G t o s w i s s l a wi n t e R R o l l H o l D i n G l t D .
the compensation of the members of the Board (BoD) and the shares held by them at year end are disclosed
in accordance with the swiss Code of obligations 663bis and 663c. the total compensation amounted to:
4 . 3 c o m p e n s a t i o n o f a n d s h a r e s h e l d b y t h e B o a r d o f D i r e c t o r s
compensation and shares held by the Board of Directors
3.3CoMPBoDt20:t22
in thousands CHF CAsH sHARes/oPtIons
soCIAL seCURItY* otHeR BeneFIts
TOTaL COmpENsaTION
sHARes HeLD As oF 31.12.
VotInG RIGHts In %
Kurt Rudolf
2011 P, CC 150 17 167 800 0.11
2010 P, CC 150 17 167 800 0.12
Urs Tanner
2011 VP 75 12 87 60 0.01
2010 VP 75 12 87 60 0.01
paolo Bottini
2011 AC 50 7 57 20 0.00
2010 AC 50 7 57 20 0.00
philippe Dubois
2011 AC 50 7 57 100 0.01
2010 AC 50 7 57 100 0.02
Horst Wildemann
2011 CC 50 6 56 – 0.00
2010 CC 50 6 56 – 0.00
marco Ghisalberti
2011 50 7 57 112 743 14.97
2010 50 7 57 112 743 17.42
Ingo specht
2011 – – – 108 845 14.45
2010 – – – 108 645 16.79
Total Board of Directors
2011 425 – 56 – 481 222 568 29.56
2010 425 – 56 – 481 222 368 34.36
3.3CoMPBoDt24:AC48
P : Chairman of the BoD AC :Audit CommitteeVP : Vice Chairman of the BoD CC :Compensation Committee
* social security costs consist of employers- and employees contributions to the state run swiss social security system.
options held by the Board of Directors
the Board of Directors does not hold any options to buy shares of InteRRoLL HoLDInG LtD.
3.3CoMPBoDt49:X55

139
o t H e R D i s c l o s u R e s a c c o R D i n G t o s w i s s l a wi n t e R R o l l H o l D i n G l t D .
the compensation of the members of the Group Management and the shares held by them at year end are disclosed
in accordance with the swiss Code of obligations 663bis and 663c. the total compensation amounted to:
4 . 4 c o m p e n s a t i o n o f a n d s h a r e s h e l d b y t h e G r o u p m a n a g e m e n t
total compensation of the Group management
ReMUneRAtIon (net) eQUItY BAseD CoMPens.
FIX VARIABLe* sHARes** oPtIons soCIAL
seCURItY otHeR
BeneFIts TOTaL
COmpENsaTION
CEO (highest)
2011 595 867 315 – 456 41 2 274
2010 595 826 273 – 387 41 2 122
Other members
2011 1 468 624 234 – 337 71 2 734
2010 1 589 532 80 – 500 74 2 775
Total Group management
2011 2 063 1 491 549 – 793 112 5 008
2010 2 184 1 358 353 – 887 115 4 897
3.4CoMPMGtt20:t21t23:AB33t35:U36
* Thedifferencebetweenprovisionsmadeinthepreviousyearandtheactuallypaid-outbonusesisnettedwiththevariablecompensationplannedfortheyearunder
review.** Intheperiodunderreivew1550(previousyear:1550)ownshareswereattributed.1200oftheshares(previousyear:1550shares)maynotbesoldforaperiodoffive
yearsasofgrantdate(previousyear:fiveyears).Sharebasedpaymentscorrespondtotaxvalues.
DespitethenewGrouporganisationeffectiveasfrom1.1.2011andtherelatedchangesinGroupManagement,thetotal
compensationtotheGroupManagementhasnotmateriallychangedtothepreviousyear.Thefixedportionofthe
compensation of the existing members of the Group Management remained unchanged and the variable portion did
only change immaterially.
explanation to the calculation methods and further notes to the total compensation
the calculation method according to IFRs deviates in two points from the calculation method applied for the compen-
sation as per swiss law, oR 663bis and 663c:
a) the compensation for business cars results from all amounts recognized in the income statement including
depreciation/leasing instalments. According to swiss law, 0.8 % per month based on the acquistion value of the cars
has been considered.
b) According to IFRs share-based payments are based on their market value at grant date. Granted shares are
valuated at market value according to swiss law (oR). this value is reduced depending on the agreed blocking
period on these granted shares.
ThedifferenceoftotalcompensationbetweenthetwomethodsofCHF0.18million(previousyear:CHF0.16million)
is made up by business cars (CHF 0.05 million, previous year: CHF 0.04 million) and by share based payments
(CHF 0.13 million, previous year: CHF 0.12 million).
3.4CoMPMGtt37:U46

140
o t H e R D i s c l o s u R e s a c c o R D i n G t o s w i s s l a wi n t e R R o l l H o l D i n G l t D .
3.4CoMPMGtt49:Y66
Shares and options held by the Group management
shares and options owned by the members of Group management and their related parties were the following:
sHARes As oF 31.12. oPtIons As oF 31.12.
2011 2010 2011 2010
Paul Zumbühl 12 598 11 398 10 000 10 000
Jürg Häusermann 950 950 3 340 3 340
Dr. Ralf Garlichs – – 2 500 2 500
Dr. Christoph Reinkemeier – n/a – n/a
Jens Karolyi – n/a – n/a
tim McGill 2 036 n/a 1 800 n/a
Kwang-Heng seng 220 220 1 200 1 200
Dr. Heinrich Droste n/a 532 n/a 2 970
Didier Lermite n/a – n/a 2 970
Total 15 804 13 100 18 840 22 980
Dr. Heinrich Droste and Didier Lermite have left the Group Management with the introduction of the new organisational
structure of the Interroll Group.

141
P R o P o s e D a P P R o P R i a t i o n o F a v a i l a b l e e a R n i n G si n t e R R o l l H o l D i n G l t D .
3.4CoMPMGtt20:V44t45:U46
5 P R o P o S e D a P P R o P R i at i o n o F a v a i l a B l e e a R n i n G S
appropriation of available earnings
the Board of Directors proposes to the general assembly to appropriate the available earnings as
per end of the year under review as follows:
in thousands CHF 2011 2010
Result 7 947 –6 315
Available earnings carried over from previous year 62 938 64 826
Change of reserve for own shares 6 941 4 427
Appropriation to reserves from capital contributions –4 504 –
To be carried forward 73 322 62 938
Proposed distribution out of reserves from capital contributions
the Board of Directors proposes to the general assembly the distribution of reserves from capital
contributions of CHF 7.00 per share (previous year: CHF 5.00). If the distribution is approved, the
respective settlement will be processed in the subsequent week to the general assembly 2012.
in thousands CHF 2011 2010
Available capital contributions carried over from previous year 19 078 19 078
Appropriation from available earnings* 4 504 –
Distribution of CHF 5.00 in the year 2011 –3 966 –
Distributable reserves from capital contributions 19 616 19 078
Proposed distribution of CHF 7.00 per share in 2012** –5 558 –
Reserves from capital contributions to be carried forward 14 058 19 078
* TheappropriationtoreservesaswellasthetotalbalancefromcapitalcontributionshasnotyetbeenconfirmedbytheSwissTax
Authorities.** All shares held by Interroll Holding AG or by its subsidiaries neither have voting- nor dividend rights. the number of shares entitled
to dividends may increase or decrease due to the exercise of options or changes in the number of own shares held. the maximum number
of shares entitled to dividends is 854 000. Accordingly the maximum amount of distribution is CHF 5.98 million. Disclosed proposed
distribution is based on oustanding shares as per 5th March 2012.

142
R e P o R t o F t H e s t a t u t o R y a u D i t o Ri n t e R R o l l H o l D i n G l t D .
6 R e P o R t o F t H e S tat U t o R Y a U D i t o R
R e p o r t o f t h e S t a t u t o r y a u d i t o r o n t h e F i n a n c i a l S t a t e m e n t s t o t h e G e n e r a l m e e t i n g o f S h a r e h o l d e r s o f i n t e R R o l l H o l D i n G lt D , S a n t ’ a n t o n i n o
Report of the statutory auditor on the financial statements
Asstatutoryauditor,wehaveauditedthefinancialstatementsofINTERROLLHOLDINGLTD,
which comprise the balance sheet, income statement, statement of changes in equity and notes
(pages 130 to 141), for the year ended December 31, 2011.
Board of Directors’ Responsibility
TheBoardofDirectorsisresponsibleforthepreparationofthefinancialstatementsinaccordance
with the requirements of swiss law and the company’s articles of incorporation. this responsi-
bility includes designing, implementing and maintaining an internal control system relevant to the
preparationoffinancialstatementsthatarefreefrommaterialmisstatement,whetherdueto
fraud or error. the Board of Directors is further responsible for selecting and applying appropriate
accounting policies and making accounting estimates that are reasonable in the circumstances.
auditor’s Responsibility
Ourresponsibilityistoexpressanopiniononthesefinancialstatementsbasedonouraudit.We
conducted our audit in accordance with swiss law and swiss Auditing standards. those
standards require that we plan and perform the audit to obtain reasonable assurance whether
thefinancialstatementsarefreefrommaterialmisstatement.
An audit involves performing procedures to obtain audit evidence about the amounts and disclo-
suresinthefinancialstatements.Theproceduresselecteddependontheauditor’sjudgment,
includingtheassessmentoftherisksofmaterialmisstatementofthefinancialstatements,whether
due to fraud or error. In making those risk assessments, the auditor considers the internal control
systemrelevanttotheentity’spreparationofthefinancialstatementsinordertodesignauditproce-
dures that are appropriate in the circumstances, but not for the purpose of expressing an opinion
ontheeffectivenessoftheentity’sinternalcontrolsystem.Anauditalsoincludesevaluatingthe
appropriateness of the accounting policies used and the reasonableness of accounting estimates
made,aswellasevaluatingtheoverallpresentationofthefinancialstatements.Webelievethat
theauditevidencewehaveobtainedissufficientandappropriatetoprovideabasisforouraudit
opinion.

143
R e P o R t o F t H e s t a t u t o R y a u D i t o Ri n t e R R o l l H o l D i n G l t D .
opinion
Inouropinion,thefinancialstatementsfortheyearendedDecember31,2011complywith
swiss law and the company’s articles of incorporation.
other matter
ThefinancialstatementsofINTERROLLHOLDINGLTDfortheyearendedDecember31,2010,
wereauditedbyanotherauditorwhoexpressedanunmodifiedopiniononthosestatementson
March 3, 2011.
Report on other legal requirements
WeconfirmthatwemeetthelegalrequirementsonlicensingaccordingtotheAuditorOversight
Act (AoA) and independence (article 728 Co and article 11 AoA) and that there are no circum-
stances incompatible with our independence.
In accordance with article 728a paragraph 1 item 3 Co and swiss Auditing standard 890,
weconfirmthataninternalcontrolsystemexistswhichhasbeendesignedforthepreparationof
financialstatementsaccordingtotheinstructionsoftheBoardofDirectors.
WefurtherconfirmthattheproposedappropriationofavailableearningscomplieswithSwiss
lawandthecompany’sarticlesofincorporation.Werecommendthatthefinancialstatements
submitted to you be approved.
PricewaterhouseCoopers AG
Urs Honegger Martin Graf
Audit expert Audit expert
Auditor in charge
Zurich, 5th March 2012


– 31 %
– 54 %
– 77 %
– 8 %
15 %
38 %
61 %
300
200
100
400
500
600
700
2008 2009 2010 20112007
© Swissquote
Impressum
Concept and coordination:
Interroll Holding Ltd., Investor Relations
Layout/DTP:
Victor Hotz AG, Corporate Publishing & Print, Steinhausen
This annual report is also available in German.
The German version is binding.
Interroll Holding Ltd.
Via Gorelle 3
6592 Sant’Antonino, Switzerland
Tel. +41 91 850 25 25
Fax +41 91 850 25 05
www.interroll.com
www.interroll.com/ir (Investor Relations)
Contact
Paul Zumbühl
CEO
Tel. +41 91 850 25 25
K e y f I G u r e s o f T h e I n T e r r o L L G r o u P
in CHF million, if not noted differently 2011 2010 2009 2008 2007
Incoming orders/net sales
Total incoming orders 288.7 285.2 238.9 347.8 375.9
Drives 95.1 97.9 82.9 114.7 124.1
Rollers 83.2 79.1 73.3 104.0 108.7
Conveyors & Sorters 42.8 52.1 33.6 61.5 64.8
Pallet- & Carton Flow 50.8 53.9 44.3 77.7 73.2
Total net sales 271.9 283.1 234.0 357.9 370.9
Profitability
EBITDA 36.2 35.8 18.8 58.2 67.5
in % of net sales 13.3 12.6 8.0 16.3 18.2
EBITA 25.7 24.8 8.0 48.0 56.6
in % of net sales 9.5 8.8 3.4 13.4 15.3
EBIT 20.4 20.4 3.1 43.4 45.2
in % of net sales 7.5 7.2 1.3 12.1 12.2
Result 18.2 14.4 5.7 33.8 31.9
in % of net sales 6.7 5.1 2.4 9.5 8.6
Cash Flow
Operating cash flow 14.5 18.7 20.4 41.9 68.5
in % of net sales 5.3 6.6 8.7 11.7 18.5
Free cash flow –5.6 –8.5 –6.0 18.6 42.7
in % of net sales –2.1 –3.0 –2.6 5.2 11.5
Total investments/capital expenditures 19.6 26.4 22.9 22.4 24.0
Balance sheet
Total assets 239.2 211.3 215.7 236.8 255.1
Goodwill in % of equity 6.3 7.3 8.3 7.9 9.2
Net financial assets (debts) –17.6 –12.9 –4.2 4.4 –6.1
Gearing (net debts/equity) 0.12 0.10 0.03 – 0.05
Indebtedness factor (net debts/cash flow) 1.21 0.69 0.20 – 0.09
Equity 143.3 127.5 133.0 130.7 124.9
Equity ratio (equity in % of assets) 59.9 60.3 61.7 55.2 49.0
Return on equity (in %) 13.4 11.1 4.3 26.5 26.7
Other key figures
RONA (Return on net assets, in %) 9.9 10.4 1.6 22.3 22.6
Average number of employees 1 340 1 255 1 206 1 315 1 275
Net sales per employee (in thousands CHF) 203 226 194 272 291
Productivity (Added value/total personnel expenses) 1.77 1.98 1.66 2.21 2.14
I n f o r m aT I o n f o r I n v e s T o r s
The shares of Interroll Holding AG have been listed at the Swiss Exchange SIX since June 5th, 1997 (Investdata: INRN;
Reuters; INRN.S; Security number: 637,289).
Interroll Share Price (yellow curve) compared to SPI/SXGE (black curve)
2011 2010 2009 2008 2007
Information on the Interroll share
Number of registered shares 854 000 854 000 854 000 854 000 854 000
Number of average outstanding shares 791 452 775 724 771 475 762 323 780 715
Number of outstanding shares per (31.12.) 793 901 779 600 771 775 768 958 762 112
Market price: highest CHF 450 371 320 581 632
Market price: lowest CHF 271 267 173 215 420
Market price: per year end CHF 279 368 307 256 581
Market capitalization per 31.12. Mio. CHF 221.50 286.89 236.55 196.85 442.79
P/E Ratio Ratio 12.25 19.79 41.37 5.82 13.15
2011 2010 2009 2008 2007
Values per share (in CHF)
Par value as per year end 10.00 10.00 15.00 20.00 30.50
Reduction of par value 5.00 5.00 10.50
Distribution out of reserves from capital contributions* 7.00 5.00
Pay out ratio 30.45 26.89 67.48 11.36 23.77
Earnings per average share outstanding 22.99 18.59 7.41 44.00 44.17
Cash flow per average share outstanding (CHF 1) 18.34 24.09 26.43 54.94 87.77
Equity per share outstanding as per year end 180.48 163.49 172.36 170.01 163.89
* The distribution out of reserves from capital contributions in the year under review is proposed by the board of directors
for the annual general assembly of May 11th, 2012.

P r o f i l e o f t h e I n t e r r o l l G r o u p
The Interroll Group is acknowledged as one of the world’s leading specialists
within the field of internal logistics. Headquartered in Sant’Antonino, Switzer-
land, the exchange-listed company employs around 1,500 people at 28 enter-
prises around the globe. Among the company’s 23,000 customers world-
wide are plant manufacturers, system integrators, multinational corporations
and end-users. Designed as space-saving and energy-efficient solutions,
Interroll products perform key functions in material handling systems from pro-
duction through to distribution: Drum Motors for belt conveyors, Rollers and
RollerDrives for conveyor units, flow storage modules for pallet and container
racking systems at distribution centres, Crossbelt Sorters, Belt Curves and
other conveyor modules. The main fields of application include the food indus-
try, airport logistics, courier/express/postal services, distribution centres and
industrial manufacturers operating in various segments of the market.
www.interroll.com
IN
TE
RR
OL
L
AN
NU
AL
R
EP
OR
T
20
11
A N N U A L R E P O R T
2 0 1 1
Geschaeftsbericht_2011_Titel_en_Druck 27.02.2012 27.02.12 10:02 Seite 1