financial ratios - accountingcoach.com · balance sheet item without either one revealing the...
TRANSCRIPT
(Explanation)
Financial Ratios
Our materials are copyright © AccountingCoach, LLC and are for personal use by the original purchaser only. We do not allow our materials to be reproduced or distributed elsewhere.
For personal use by the original purchaser only. Copyright © AccountingCoach®.com. 2
Introduction to Financial Ratios
When computing financial ratios and when doing other financial statement analysis always keep in mind that the financial statements reflect the accounting principles. This means assets are generally not reported at their current value. It is also likely that many brand names and unique product lines will not be included among the assets reported on the balance sheet, even though they may be the most valuable of all the items owned by a company.
These examples are signals that financial ratios and financial statement analysis have limitations. It is also important to realize that an impressive financial ratio in one industry might be viewed as less than impressive in a different industry.
Our explanation of financial ratios and financial statement analysis is organized as follows:
• Balance Sheet• General discussion• Common-size balance sheet• Financial ratios based on the balance sheet
• Income Statement• General discussion• Common-size income statement• Financial ratios based on the income statement
• Statement of Cash Flows
General Discussion of Balance Sheet
The balance sheet reports a company’s assets, liabilities, and stockholders’ equity as of a specific date, such as December 31, 2019, March 31, 2019, etc.
The accountants’ cost principle and the monetary unit assumption will limit the assets reported on the balance sheet. Assets will be reported
(1) only if they were acquired in a transaction, and (2) generally at an amount that is not greater than the asset’s cost at the time of the transaction.
This means that a company’s creative and effective management team will not be listed as an asset. Similarly, a company’s outstanding reputation, its unique product lines, and brand names developed within the company will not be reported on the balance sheet. As you may surmise, these items are often the most valuable of all the things owned by the company. (Brand names purchased from another company will be recorded in the company’s accounting records at their cost.)
The accountants’ matching principle will result in assets such as buildings, equipment, furnishings, fixtures, vehicles, etc. being reported at amounts less than cost. The reason is these assets are depreciated. Depreciation reduces an asset’s book value each year and the amount of the reduction is reported as Depreciation Expense on the income statement.
While depreciation is reducing the book value of certain assets over their useful lives, the current value (or fair market value) of these assets may actually be increasing. (It is also possible that the current value of some assets–such as computers–may be decreasing faster than the book value.)
For personal use by the original purchaser only. Copyright © AccountingCoach®.com. 3
Current assets such as Cash, Accounts Receivable, Inventory, Supplies, Prepaid Insurance, etc. usually have current values that are close to the amounts reported on the balance sheet.
Current liabilities such as Notes Payable (due within one year), Accounts Payable, Wages Payable, Interest Payable, Unearned Revenues, etc. are also likely to have current values that are close to the amounts reported on the balance sheet.
Long-term liabilities such as Notes Payable (not due within one year) or Bonds Payable (not maturing within one year) will often have current values that differ from the amounts reported on the balance sheet.
Stockholders’ equity is the book value of the company. It is the difference between the reported amount of assets and the reported amount of liabilities. For the reasons mentioned above, the reported amount of stockholders’ equity will therefore be different from the current or market value of the company.
By definition the current assets and current liabilities are “turning over” at least once per year. As a result, the reported amounts are likely to be similar to their current value. The long-term assets and long-term liabilities are not “turning over” often. Therefore, the amounts reported for long-term assets and long-term liabilities will likely be different from the current value of those items.
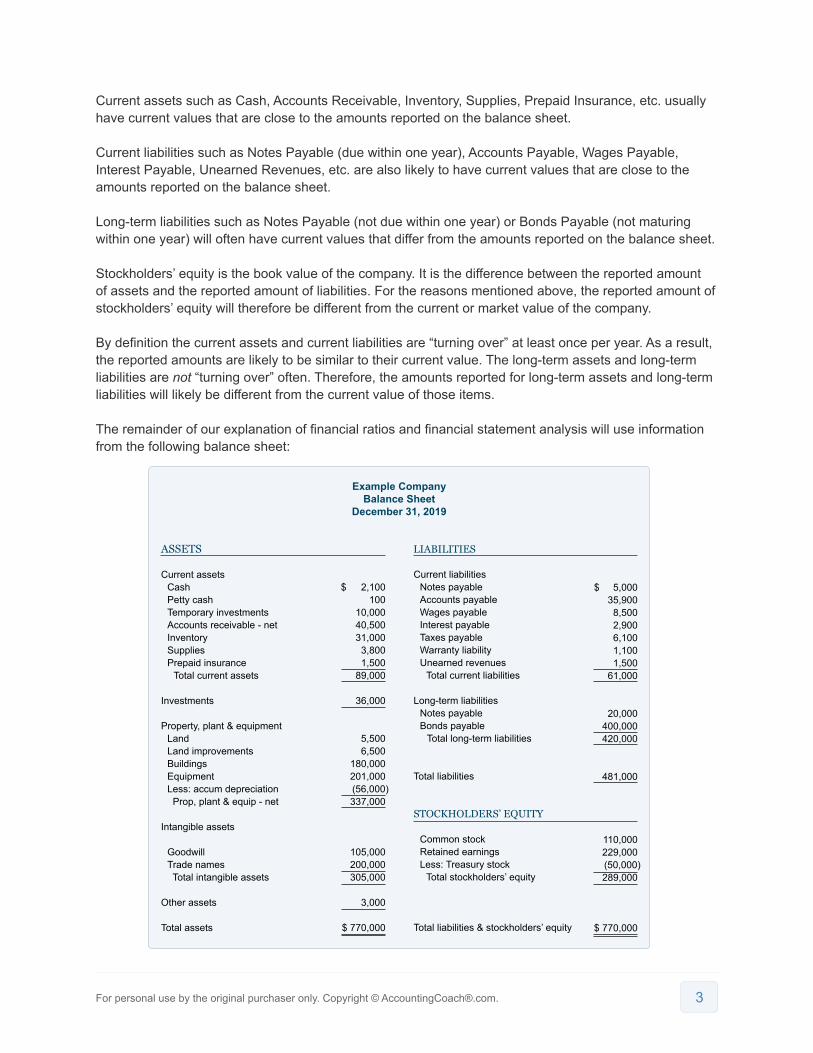
The remainder of our explanation of financial ratios and financial statement analysis will use information from the following balance sheet:
Example CompanyBalance Sheet
December 31, 2019
ASSETS LIABILITIES
Current assetsCashPetty cashTemporary investmentsAccounts receivable - netInventorySuppliesPrepaid insurance
Total current assets
Investments
Property, plant & equipmentLandLand improvementsBuildingsEquipmentLess: accum depreciation Prop, plant & equip - net
Intangible assets
GoodwillTrade names Total intangible assets
Other assets
Total assets
$ 2,100100
10,00040,50031,0003,8001,500
89,000
36,000
5,5006,500
180,000201,000(56,000)337,000
105,000200,000305,000
3,000
$ 770,000
Current liabilitiesNotes payableAccounts payableWages payableInterest payableTaxes payableWarranty liabilityUnearned revenues
Total current liabilities
Long-term liabilitiesNotes payableBonds payable
Total long-term liabilities
Total liabilities
STOCKHOLDERS’ EQUITY
Common stockRetained earningsLess: Treasury stock
Total stockholders’ equity
Total liabilities & stockholders’ equity
$ 5,00035,9008,5002,9006,1001,1001,500
61,000
20,000400,000420,000
481,000
110,000229,000(50,000)289,000
$ 770,000

For personal use by the original purchaser only. Copyright © AccountingCoach®.com. 4
To learn more about the balance sheet go to: Explanation of Balance Sheet.
Common-Size Balance Sheet
One technique in financial statement analysis is known as vertical analysis. Vertical analysis results in common-size financial statements. A common-size balance sheet is a balance sheet where every dollar amount has been restated to be a percentage of total assets. We will illustrate this by taking Example Company’s balance sheet (shown above) and divide each item by the total asset amount $770,000. The result is the following common-size balance sheet for Example Company:
Example CompanyCommon-Size Balance Sheet
December 31, 2019
ASSETS LIABILITIES
Current assetsCashPetty cashTemporary investmentsAccounts receivable - netInventorySuppliesPrepaid insurance
Total current assets
Investments
Property, plant & equipmentLandLand improvementsBuildingsEquipmentLess: accum depreciation Prop, plant & equip - net
Intangible assets
GoodwillTrade names Total intangible assets
Other assets
Total assets
0.3%0.0%1.3%5.3%4.0%0.5%0.2%
11.6%
4.7%
0.7%0.8%
23.4%26.1%(7.3%)43.7%
13.6%26.0%39.6%
0.4%
100.0%
Current liabilitiesNotes payableAccounts payableWages payableInterest payableTaxes payableWarranty liabilityUnearned revenues
Total current liabilities
Long-term liabilitiesNotes payableBonds payable
Total long-term liabilities
Total liabilities
STOCK HOLDERS’ EQUITY
Common stockRetained earningsLess: Treasury stock
Total stockholders’ equity
Total liabilities & stockholders’ equity
0.6%4.7%1.1%0.4%0.8%0.1%0.2%7.9%
2.6%52.0%54.6%
62.5%
14.3%29.7%(6.5%)37.5%
100.0%

For personal use by the original purchaser only. Copyright © AccountingCoach®.com. 5
The benefit of a common-size balance sheet is that an item can be compared to a similar item of another company regardless of the size of the companies. A company can also compare its percentages to the industry’s average percentages. For example, a company with Inventory at 4.0% of total assets can look to its industry statistics to see if its percentage is reasonable. (Industry percentages might be available from an industry association, library reference desks, and from bankers. Many banks have memberships in Risk Management Association (RMA), an organization that collects and distributes statistics by industry.) A common-size balance sheet also allows two businesspersons to compare the magnitude of a balance sheet item without either one revealing the actual dollar amounts.
Financial Ratios Based on the Balance Sheet
Financial statement analysis includes financial ratios. Here are three financial ratios that are based solely on current asset and current liability amounts appearing on a company’s balance sheet:
How to Calculate it What it Tells YouFinancial Ratio
Current Ratio
Quick Ratio(Acid Test Ratio)
WorkingCapital
= Current Assets - Current Lia-bilities
= $89,000 - $61,000
= $28,000
An indicator of whether the company will be able to meet its current obligations (pay its bills, meet its payroll, make a loan payment, etc.) If a company has current assets exactly equal to current liabilities, it has no working capital. The greater the amount of working capital the more likely it will be able to make its payments on time.
This tells you the relationship of current assets to current liabilities. A ratio of 3:1 is better than 2:1. A 1:1 ratio means there is no working capital.
This ratio is similar to the current ratio except that Inventory, Supplies, and Prepaid Expenses are excluded. This indicates the relationship between the amount of assets that can quickly be turned into cash versus the amount of current liabilities.
= Current Assets / Current Liabil-ities
= $89,000 / $61,000
= 1.46
= [(Cash + Temp. Investments + Accounts Receivable) / Current Liabilities] : 1 = [($2,100 + $100 + $10,000 + $40,500) / $61,000] : 1 = [$52,700 / $61,000] : 1
= 0.86 : 1

For personal use by the original purchaser only. Copyright © AccountingCoach®.com. 6
Four financial ratios relate balance sheet amounts for Accounts Receivable and Inventory to income statement amounts. To illustrate these financial ratios we will use the following income statement information:
To learn more about the income statement go to: Explanation of Income Statement.
Example Corporation Income Statement
For the year ended December 31, 2019
Sales (all on credit)Cost of goods sold Gross profit
Operating expenses Selling expenses Administrative expenses Total operating expenses
Operating income Interest expense
Income before taxes Income tax expense
Net income after taxes
$500,000380,000120,000
35,00045,00080,000
40,00012,000
28,0005,000
$ 23,000

For personal use by the original purchaser only. Copyright © AccountingCoach®.com. 7
How to Calculate it What it Tells YouFinancial Ratio
Days' Sales in Accounts Receivable
Inventory Turnover
Days' Sales in Inventory
Accounts Receivable Turnover
= Net Credit Sales for the Year / Average Accounts Receivable for the Year
= $500,000 / $42,000 (a computed average)
= 11.90
The number of times per year that the accounts receivables turn over. Keep in mind that the result is an average, since credit sales and accounts receivable are likely to fluctuate during the year. It is important to use the averagebalance of accounts receivable during the year.
The average number of days that it took to collect the averageamount of accounts receivable during the year. This statistic is only as good as the Accounts Receivable Turnover figure.
The average number of days that it took to sell the average inventory during the year. This statistic is only as good as the Inventory Turnover figure.
The number of times per year that Inventory turns over. Keep in mind that the result is an average, since sales and inventory levels are likely to fluctuate during the year. Since inventory is at cost (not sales value), it is important to use the Cost of Goods Sold. Also be sure to use the average balance of inventory during the year.
= 365 days in Year / Accounts Receivable Turnover in Year
= 365 days / 11.90
= 30.67 days
= Cost of Goods Sold for the Year / Average Inventory for the Year = $380,000 / $30,000 (a computed average)
= 12.67
= 365 days in Year / Inventory Turnover in Year
= 365 days / 12.67
= 28.81

For personal use by the original purchaser only. Copyright © AccountingCoach®.com. 8
The next financial ratio involves the relationship between two amounts from the balance sheet: total liabilities and total stockholders’ equity:
General Discussion of Income Statement
The income statement has some limitations since it reflects accounting principles. For example, a company’s depreciation expense is based on the cost of the assets it has acquired and is using in its business. The resulting depreciation expense may not be a good indicator of the economic value of the asset being used up. To illustrate this point let’s assume that a company’s buildings and equipment have been fully depreciated and therefore there will be no depreciation expense for those buildings and equipment on its income statement. Is zero expense a good indicator of the cost of using those buildings and equipment? Compare that situation to a company with new buildings and equipment where there will be large amounts of depreciation expense.
How to Calculate it What it Tells YouFinancial Ratio
Debt to Equity
= (Total liabilities / Total Stockholders' Equity) : 1
= ( $481,000 / $289,000) : 1
= 1.66 : 1
The proportion of a company's assets supplied by the company's creditors versus the amount supplied the owner or stockholders. In this example the creditors have supplied $1.66 for each $1.00 supplied by the stockholders.
For personal use by the original purchaser only. Copyright © AccountingCoach®.com. 9
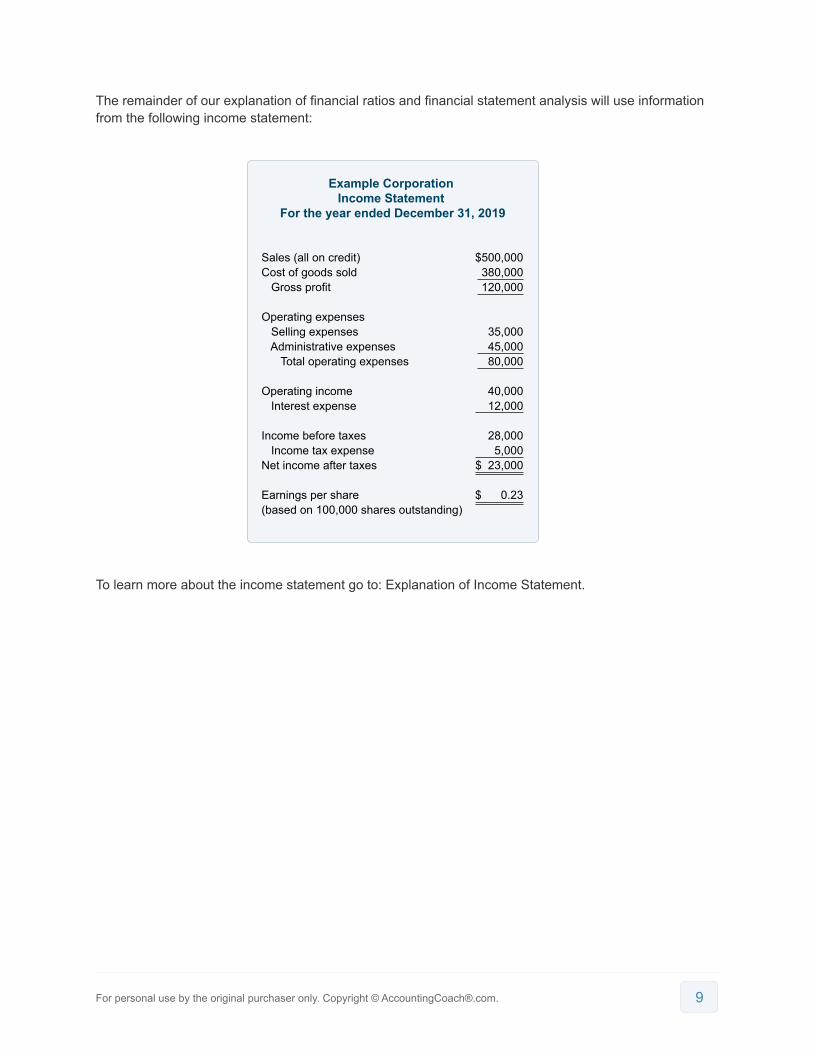
The remainder of our explanation of financial ratios and financial statement analysis will use information from the following income statement:
To learn more about the income statement go to: Explanation of Income Statement.
Example Corporation Income Statement
For the year ended December 31, 2019
Sales (all on credit)Cost of goods sold Gross profit
Operating expenses Selling expenses Administrative expenses Total operating expenses
Operating income Interest expense
Income before taxes Income tax expenseNet income after taxes
Earnings per share(based on 100,000 shares outstanding)
$500,000380,000120,000
35,00045,00080,000
40,00012,000
28,0005,000
$ 23,000
$ 0.23
For personal use by the original purchaser only. Copyright © AccountingCoach®.com. 10
Common-Size Income Statement
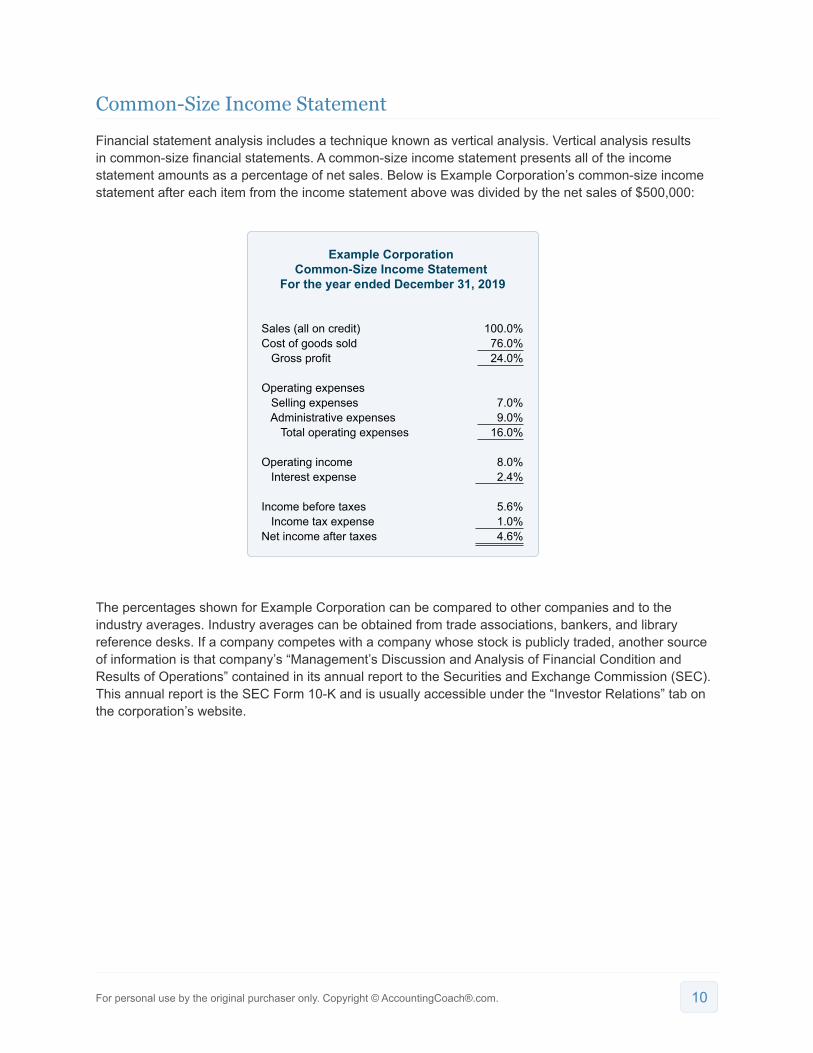
Financial statement analysis includes a technique known as vertical analysis. Vertical analysis results in common-size financial statements. A common-size income statement presents all of the income statement amounts as a percentage of net sales. Below is Example Corporation’s common-size income statement after each item from the income statement above was divided by the net sales of $500,000:
The percentages shown for Example Corporation can be compared to other companies and to the industry averages. Industry averages can be obtained from trade associations, bankers, and library reference desks. If a company competes with a company whose stock is publicly traded, another source of information is that company’s “Management’s Discussion and Analysis of Financial Condition and Results of Operations” contained in its annual report to the Securities and Exchange Commission (SEC). This annual report is the SEC Form 10-K and is usually accessible under the “Investor Relations” tab on the corporation’s website.
Example Corporation Common-Size Income Statement
For the year ended December 31, 2019
Sales (all on credit)Cost of goods sold Gross profit
Operating expenses Selling expenses Administrative expenses Total operating expenses
Operating income Interest expense
Income before taxes Income tax expenseNet income after taxes
100.0%76.0%24.0%
7.0%9.0%
16.0%
8.0%2.4%
5.6%1.0%4.6%
For personal use by the original purchaser only. Copyright © AccountingCoach®.com. 11
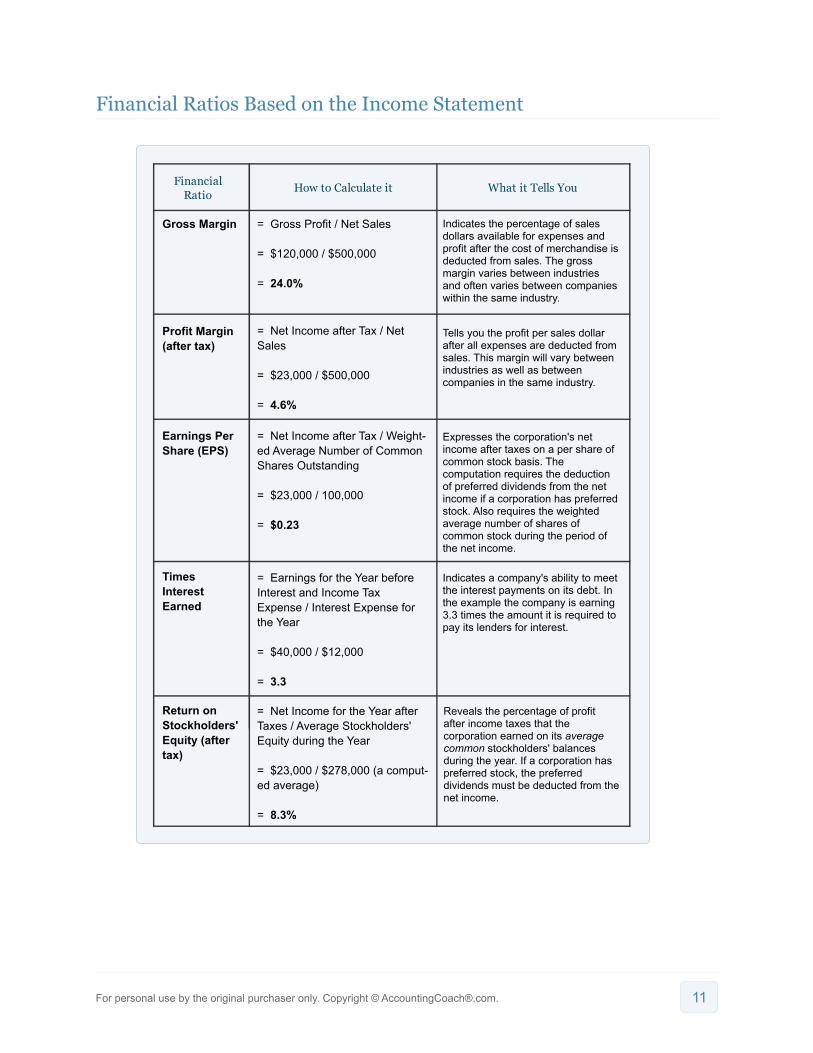
Financial Ratios Based on the Income Statement
How to Calculate it What it Tells YouFinancial Ratio
Profit Margin(after tax)
Earnings Per Share (EPS)
Times Interest Earned
Return on Stockholders' Equity (after tax)
Gross Margin = Gross Profit / Net Sales = $120,000 / $500,000
= 24.0%
Indicates the percentage of sales dollars available for expenses and profit after the cost of merchandise is deducted from sales. The gross margin varies between industries and often varies between companies within the same industry.
Tells you the profit per sales dollar after all expenses are deducted from sales. This margin will vary between industries as well as between companies in the same industry.
Indicates a company's ability to meet the interest payments on its debt. In the example the company is earning 3.3 times the amount it is required to pay its lenders for interest.
Expresses the corporation's net income after taxes on a per share of common stock basis. The computation requires the deduction of preferred dividends from the net income if a corporation has preferred stock. Also requires the weighted average number of shares of common stock during the period of the net income.
= Net Income after Tax / Net Sales
= $23,000 / $500,000
= 4.6%
= Net Income after Tax / Weight-ed Average Number of Common Shares Outstanding = $23,000 / 100,000 = $0.23
= Earnings for the Year before Interest and Income Tax Expense / Interest Expense for the Year
= $40,000 / $12,000
= 3.3
= Net Income for the Year after Taxes / Average Stockholders' Equity during the Year
= $23,000 / $278,000 (a comput-ed average)
= 8.3%
Reveals the percentage of profit after income taxes that the corporation earned on its average common stockholders' balances during the year. If a corporation has preferred stock, the preferred dividends must be deducted from the net income.

For personal use by the original purchaser only. Copyright © AccountingCoach®.com. 12
Statement of Cash Flows
The statement of cash flows is a relatively new financial statement in comparison to the income statement or the balance sheet. This may explain why there are not as many well-established financial ratios associated with the statement of cash flows.
We will use the following cash flow statement for Example Corporation to illustrate a limited financial statement analysis:
Example Corporation Statement of Cash Flows
For the Year Ended December 31, 2019
Cash Flow from Operating Activities Net income Add: depreciation expense Increase in accounts receivable Decrease in inventory Decrease in accounts payable
Cash provided (used) in operating activities Cash Flow from Investing Activities Capital expenditures Proceeds from sale of property
Cash provided (used) by investing activities Cash Flow from Financing Activities Borrowings of long-term debt Cash dividends Purchase of treasury stock
Cash provided (used) by financing activities Net increase in cashCash at the beginning of the year
Cash at the end of the year
$23,0004,000
(6,000)9,000
(5,000)25,000
(28,000)7,000
(21,000)
10,000(5,000)(8,000)(3,000)
1,0001,200
$ 2,200
How to Calculate it What it Tells YouFinancial Ratio
Free Cash Flow = Cash Flow Provided by Operating Activities – Capital Expenditures
= $25,000 – $28,000
= ($3,000)
This statistic tells you how much cash is left over from operations after a company pays for its capital expenditures (additions to property, plant and equipment). There can be variations of this calculation. For example, some would only deduct capital expenditures to keep the present level of capacity. Others would also deduct dividends that are paid to stockholders, since they are assumed to be a requirement.
For personal use by the original purchaser only. Copyright © AccountingCoach®.com. 13
The cash flow from operating activities section of the statement of cash flows is also used by some analysts to assess the quality of a company’s earnings. For a company’s earnings to be of “quality” the amount of cash flow from operating activities must be consistently greater than the company’s net income. The reason is that under accrual accounting, various estimates and assumptions are made regarding both revenues and expenses. When it comes to cash, however, the money is either in the bank or it isn’t.
To learn more about the statement of cash flows, go to:
• Explanation of Cash Flow Statement• Quiz for Cash Flow Statement• Crossword Puzzle for Cash Flow Statement
Conclusion
You should consider our materials to be an introduction to selected accounting and bookkeeping topics, and realize that some complexities (including differences between financial statement reporting and income tax reporting) are not presented. Therefore, always consult with accounting and tax professionals for assistance with your specific circumstances.