financial ratios
TRANSCRIPT
McGraw-Hill/Irwin Copyright © 2009 by The McGraw-Hill Companies, Inc. All rights reserved.
Financial Statement
Analysis
K R SubramanyamJohn J Wild

11-2
11CHAPTER
Equity Analysis and Valuation
11-3
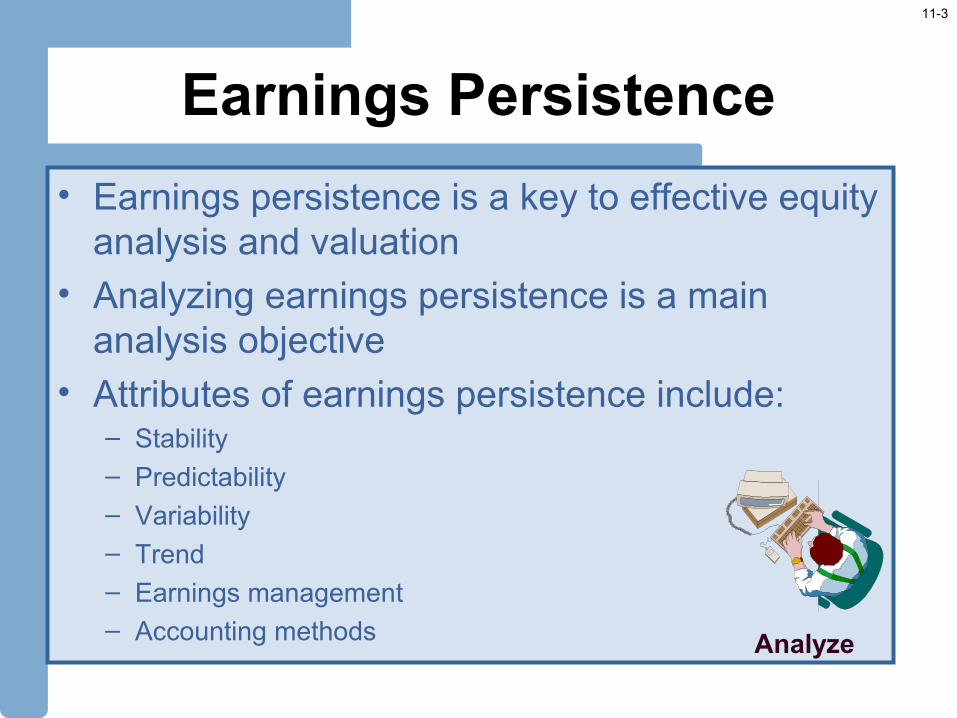
Earnings Persistence
• Earnings persistence is a key to effective equity analysis and valuation
• Analyzing earnings persistence is a main analysis objective
• Attributes of earnings persistence include:– Stability– Predictability– Variability– Trend– Earnings management– Accounting methods Analyze
11-4
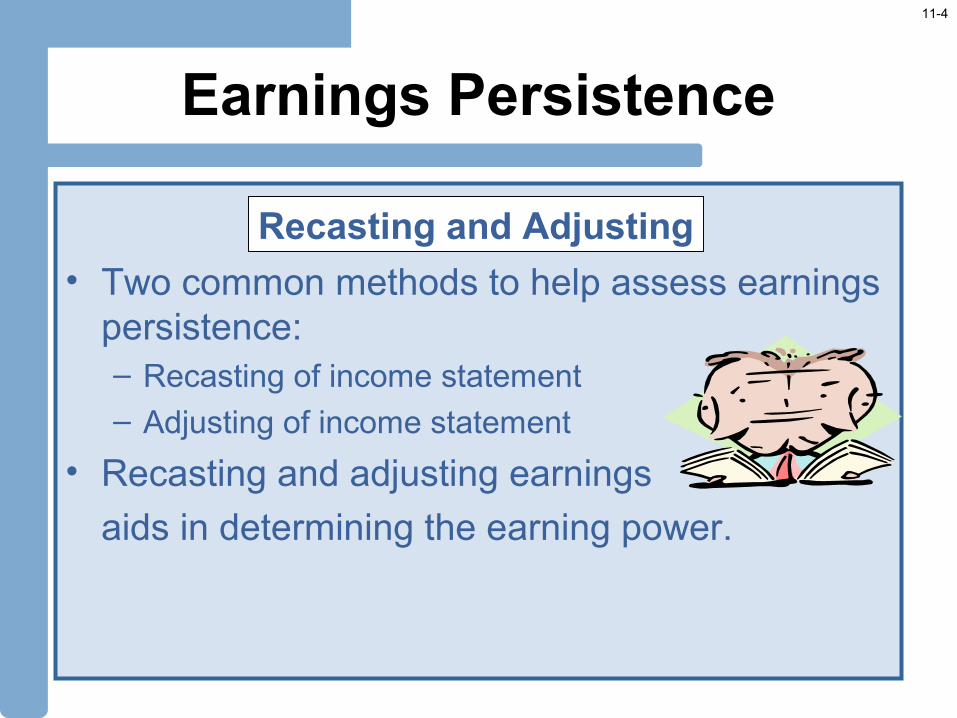
Earnings Persistence
• Two common methods to help assess earnings persistence:– Recasting of income statement– Adjusting of income statement
• Recasting and adjusting earnings
aids in determining the earning power.
Recasting and Adjusting
11-5
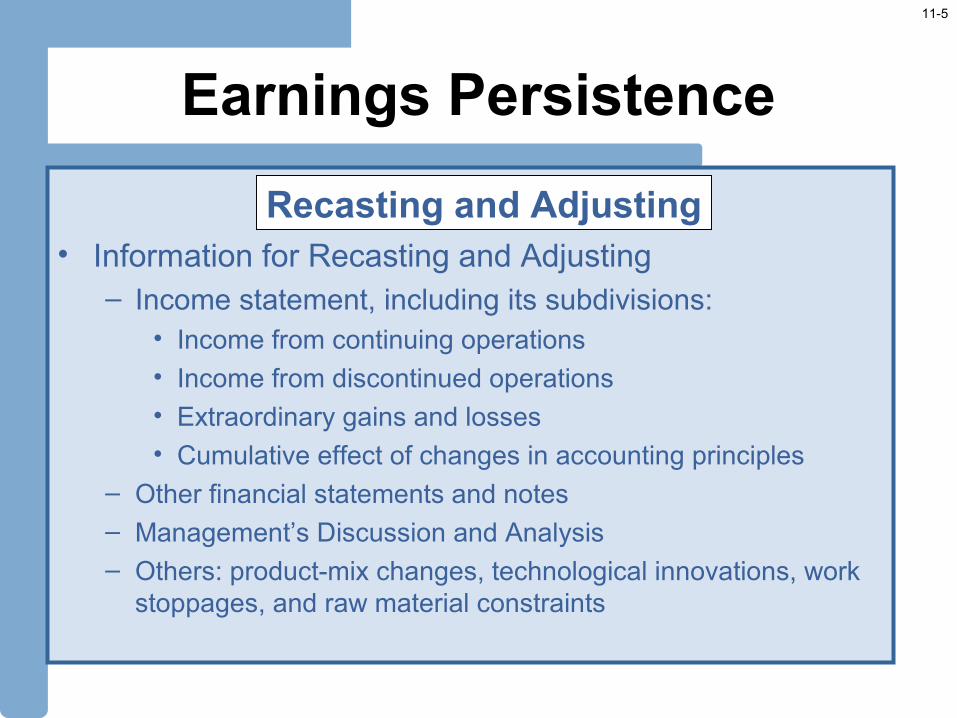
Earnings Persistence
• Information for Recasting and Adjusting– Income statement, including its subdivisions:
• Income from continuing operations
• Income from discontinued operations
• Extraordinary gains and losses
• Cumulative effect of changes in accounting principles– Other financial statements and notes– Management’s Discussion and Analysis– Others: product-mix changes, technological innovations, work
stoppages, and raw material constraints
Recasting and Adjusting
11-6
Earnings Persistence
• Aims at rearranging earnings components to provide a meaningful classification and relevant format for analysis.– Components can be rearranged, subdivided, or tax effected, but
the total must reconcile to net income of each period.
– Discretionary expenses, components like equity in income (loss) of unconsolidated subsidiaries or affiliates should be segregated.
– Components reported pretax must be removed along with their tax effects if reclassified apart from income from continuing operations.
Recasting Earnings and Earnings Components
11-7
Earnings Persistence
– Income tax disclosures enable one to separate factors that either reduce or increase taxes such as:
• Deductions—tax credits, capital gains rates, tax-free income, lower foreign tax rates
• Additions—additional foreign taxes, nontax-deductible expenses, and state and local taxes (net of federal tax benefit)
– Immaterial items can be considered in a lump sum labeled other.
Recasting Earnings and Earnings Components
11-8
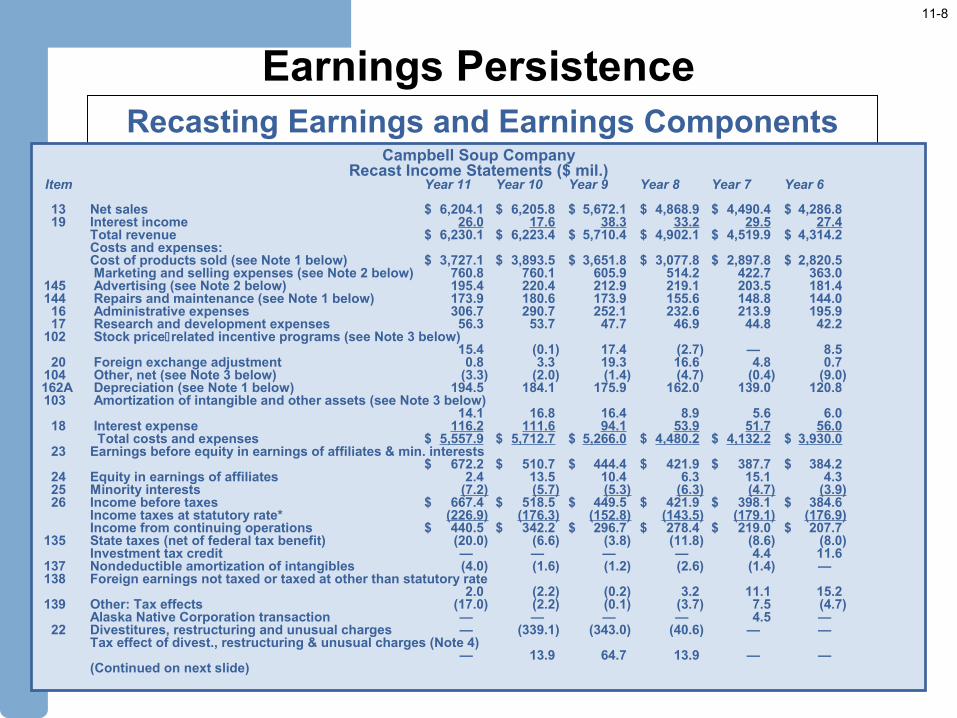
Earnings PersistenceRecasting Earnings and Earnings Components
Campbell Soup CompanyRecast Income Statements ($ mil.)
Item Year 11 Year 10 Year 9 Year 8 Year 7 Year 6
13 Net sales $ 6,204.1 $ 6,205.8 $ 5,672.1 $ 4,868.9 $ 4,490.4 $ 4,286.819 Interest income 26.0 17.6 38.3 33.2 29.5 27.4
Total revenue $ 6,230.1 $ 6,223.4 $ 5,710.4 $ 4,902.1 $ 4,519.9 $ 4,314.2Costs and expenses:Cost of products sold (see Note 1 below) $ 3,727.1 $ 3,893.5 $ 3,651.8 $ 3,077.8 $ 2,897.8 $ 2,820.5 Marketing and selling expenses (see Note 2 below) 760.8 760.1 605.9 514.2 422.7 363.0
145 Advertising (see Note 2 below) 195.4 220.4 212.9 219.1 203.5 181.4144 Repairs and maintenance (see Note 1 below) 173.9 180.6 173.9 155.6 148.8 144.016 Administrative expenses 306.7 290.7 252.1 232.6 213.9 195.917 Research and development expenses 56.3 53.7 47.7 46.9 44.8 42.2
102 Stock pricerelated incentive programs (see Note 3 below)15.4 (0.1) 17.4 (2.7) — 8.5
20 Foreign exchange adjustment 0.8 3.3 19.3 16.6 4.8 0.7104 Other, net (see Note 3 below) (3.3) (2.0) (1.4) (4.7) (0.4) (9.0)162A Depreciation (see Note 1 below) 194.5 184.1 175.9 162.0 139.0 120.8103 Amortization of intangible and other assets (see Note 3 below)
14.1 16.8 16.4 8.9 5.6 6.018 Interest expense 116.2 111.6 94.1 53.9 51.7 56.0
Total costs and expenses $ 5,557.9 $ 5,712.7 $ 5,266.0 $ 4,480.2 $ 4,132.2 $ 3,930.023 Earnings before equity in earnings of affiliates & min. interests
$ 672.2 $ 510.7 $ 444.4 $ 421.9 $ 387.7 $ 384.224 Equity in earnings of affiliates 2.4 13.5 10.4 6.3 15.1 4.325 Minority interests (7.2) (5.7) (5.3) (6.3) (4.7) (3.9)26 Income before taxes $ 667.4 $ 518.5 $ 449.5 $ 421.9 $ 398.1 $ 384.6
Income taxes at statutory rate* (226.9) (176.3) (152.8) (143.5) (179.1) (176.9)Income from continuing operations $ 440.5 $ 342.2 $ 296.7 $ 278.4 $ 219.0 $ 207.7
135 State taxes (net of federal tax benefit) (20.0) (6.6) (3.8) (11.8) (8.6) (8.0)Investment tax credit — — — — 4.4 11.6
137 Nondeductible amortization of intangibles (4.0) (1.6) (1.2) (2.6) (1.4) —138 Foreign earnings not taxed or taxed at other than statutory rate
2.0 (2.2) (0.2) 3.2 11.1 15.2139 Other: Tax effects (17.0) (2.2) (0.1) (3.7) 7.5 (4.7)
Alaska Native Corporation transaction — — — — 4.5 —22 Divestitures, restructuring and unusual charges — (339.1) (343.0) (40.6) — —
Tax effect of divest., restructuring & unusual charges (Note 4)— 13.9 64.7 13.9 — —
(Continued on next slide)
11-9
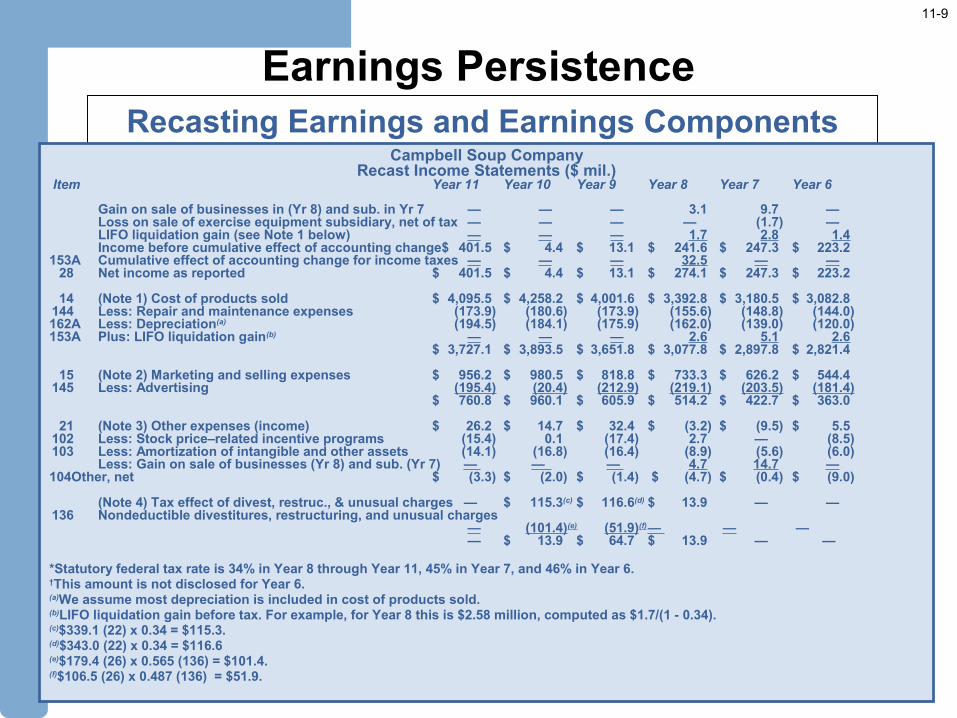
Earnings PersistenceRecasting Earnings and Earnings Components
Campbell Soup CompanyRecast Income Statements ($ mil.)
Item Year 11 Year 10 Year 9 Year 8 Year 7 Year 6
Gain on sale of businesses in (Yr 8) and sub. in Yr 7 — — — 3.1 9.7 —Loss on sale of exercise equipment subsidiary, net of tax — — — — (1.7) —LIFO liquidation gain (see Note 1 below) — — — 1.7 2.8 1.4Income before cumulative effect of accounting change$ 401.5 $ 4.4 $ 13.1 $ 241.6 $ 247.3 $ 223.2
153A Cumulative effect of accounting change for income taxes — — — 32.5 — —28 Net income as reported $ 401.5 $ 4.4 $ 13.1 $ 274.1 $ 247.3 $ 223.2
14 (Note 1) Cost of products sold $ 4,095.5 $ 4,258.2 $ 4,001.6 $ 3,392.8 $ 3,180.5 $ 3,082.8144 Less: Repair and maintenance expenses (173.9) (180.6) (173.9) (155.6) (148.8) (144.0)162A Less: Depreciation(a) (194.5) (184.1) (175.9) (162.0) (139.0) (120.0)153A Plus: LIFO liquidation gain(b) — — — 2.6 5.1 2.6
$ 3,727.1 $ 3,893.5 $ 3,651.8 $ 3,077.8 $ 2,897.8 $ 2,821.4
15 (Note 2) Marketing and selling expenses $ 956.2 $ 980.5 $ 818.8 $ 733.3 $ 626.2 $ 544.4145 Less: Advertising (195.4) (20.4) (212.9) (219.1) (203.5) (181.4)
$ 760.8 $ 960.1 $ 605.9 $ 514.2 $ 422.7 $ 363.0
21 (Note 3) Other expenses (income) $ 26.2 $ 14.7 $ 32.4 $ (3.2) $ (9.5) $ 5.5102 Less: Stock price–related incentive programs (15.4) 0.1 (17.4) 2.7 — (8.5)103 Less: Amortization of intangible and other assets (14.1) (16.8) (16.4) (8.9) (5.6) (6.0)
Less: Gain on sale of businesses (Yr 8) and sub. (Yr 7) — — — 4.7 14.7 —104Other, net $ (3.3) $ (2.0) $ (1.4) $ (4.7) $ (0.4) $ (9.0)
(Note 4) Tax effect of divest, restruc., & unusual charges — $ 115.3(c) $ 116.6(d) $ 13.9 — —136 Nondeductible divestitures, restructuring, and unusual charges
— (101.4)(e) (51.9)(f)— — — — $ 13.9 $ 64.7 $ 13.9 — —
*Statutory federal tax rate is 34% in Year 8 through Year 11, 45% in Year 7, and 46% in Year 6.†This amount is not disclosed for Year 6.(a)We assume most depreciation is included in cost of products sold.(b)LIFO liquidation gain before tax. For example, for Year 8 this is $2.58 million, computed as $1.7/(1 - 0.34).(c)$339.1 (22) x 0.34 = $115.3.(d)$343.0 (22) x 0.34 = $116.6(e)$179.4 (26) x 0.565 (136) = $101.4.(f)$106.5 (26) x 0.487 (136) = $51.9.
11-10
Earnings Persistence
• “Adjusting” aims to assign earnings components to the periods in which they best belong.
• Uses data from recast income statements and other available information.
Adjusting Earnings and Earnings Components
11-11
Earnings Persistence
• Specific (Typical) Adjusting Procedures– Assign extraordinary and unusual items (net of tax) to applicable
years
– Tax benefit of operating loss carryforwards normally moved to the loss year
– Costs or benefits from lawsuit settlements moved to relevant prior years
– Gains and losses from disposals of discontinued operations can relate to one or more prior years.
– Changes in accounting principles or estimates yield adjustments to all years under analysis to a comparable basis—redistribute “cumulative effect” to the relevant prior years
– Normally include items that increase or decrease equity
Adjusting Earnings and Earnings Components
11-12
Earnings Persistence
• Specific (Typical) Adjusting Procedures
– If a component should be excluded from the period it is reported:
• Shift it (net of tax) to the operating results of one or more prior periods or
• Spread (average) it over earnings for the period under analysis.
– Spread the component over prior periods’ earnings only when it cannot be identified with a specific period.
– While spreading helps in determining earning power, it is not helpful in determining earnings trends.
– Moving gains/ losses to other periods does not remedy the misstatements of prior years’ results.
Adjusting Earnings and Earnings Components

11-13
Earnings Persistence
11-14
Earnings Persistence
• Earnings persistence determined by many factors including:– Earnings trends
– Variability
– Earnings Management
– Management Incentives
• Note: assess earnings persistence
over both the business cycle and the long run.
Determinants of Earnings Persistence
11-15
Earnings Persistence
• Earnings trends can be assessed by:– Statistical methods – Trend statements
• Uses earnings numbers taken from the recasting and adjusting procedures
Determinants of Earnings Persistence
11-16
Earnings Persistence
• Earnings management– Changes in accounting methods or assumptions– Offsetting extraordinary or unusual gains and losses– Big baths
– Write-downs
– Timing revenue and
expense recognition
Determinants of Earnings Persistence
11-17
Earnings Persistence
• Management incentives affecting persistence include:– Personal objectives and interests– Companies in distress– Prosperous companies—preserving hard-earned
reputations
– Compensation plans
– Accounting-based incentives and constraints– Analysts’ targets
Determinants of Earnings Persistence
11-18
Earnings Persistence
• Recasting and adjusting earnings for equity valuation rely on separating stable, persistent earnings components from random, transitory components. – Assessing persistence is important in determining earning
power. – Earnings forecasting also relies on persistence.
• A crucial part is to assess the persistence of the gain and loss components of earnings.
Persistent and Transitory Items in Earnings
11-19
Earnings Persistence
• Purpose of analyzing and interpreting extraordinary items:
– Determine whether an item is transitory. • Assessing whether an item is unusual, nonoperating, or
nonrecurring.
– Determine adjustments that are necessary given assessment of persistence.
Analyzing and Interpreting Transitory Items
11-20
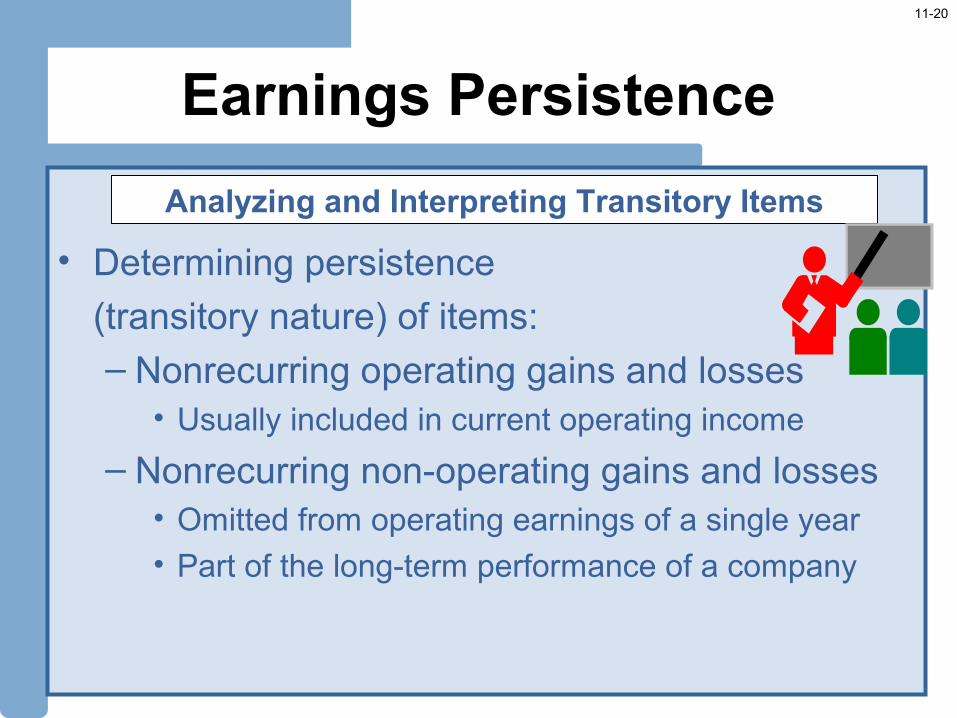
Earnings Persistence
• Determining persistence
(transitory nature) of items:
– Nonrecurring operating gains and losses• Usually included in current operating income
– Nonrecurring non-operating gains and losses• Omitted from operating earnings of a single year
• Part of the long-term performance of a company
Analyzing and Interpreting Transitory Items
11-21
Earnings Persistence
• Adjustments to Extraordinary Items Reflecting Persistence:– Effects of transitory items on company resources.
• Effects of recorded transitory items and the likelihood of future events causing transitory items.
– Effect of transitory items on evaluation of management.
Analyzing and Interpreting Transitory Items
11-22
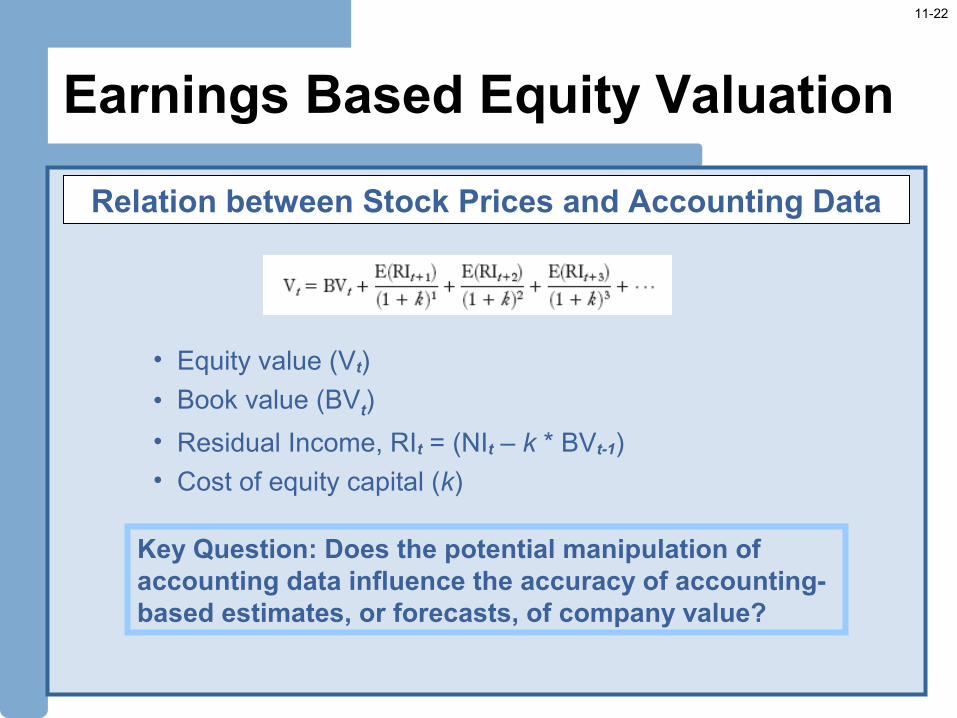
Earnings Based Equity Valuation
• Equity value (Vt)
• Book value (BVt)
• Residual Income, RIt = (NIt – k * BVt-1)
• Cost of equity capital (k)
Relation between Stock Prices and Accounting Data
Key Question: Does the potential manipulation of accounting data influence the accuracy of accounting-based estimates, or forecasts, of company value?
11-23
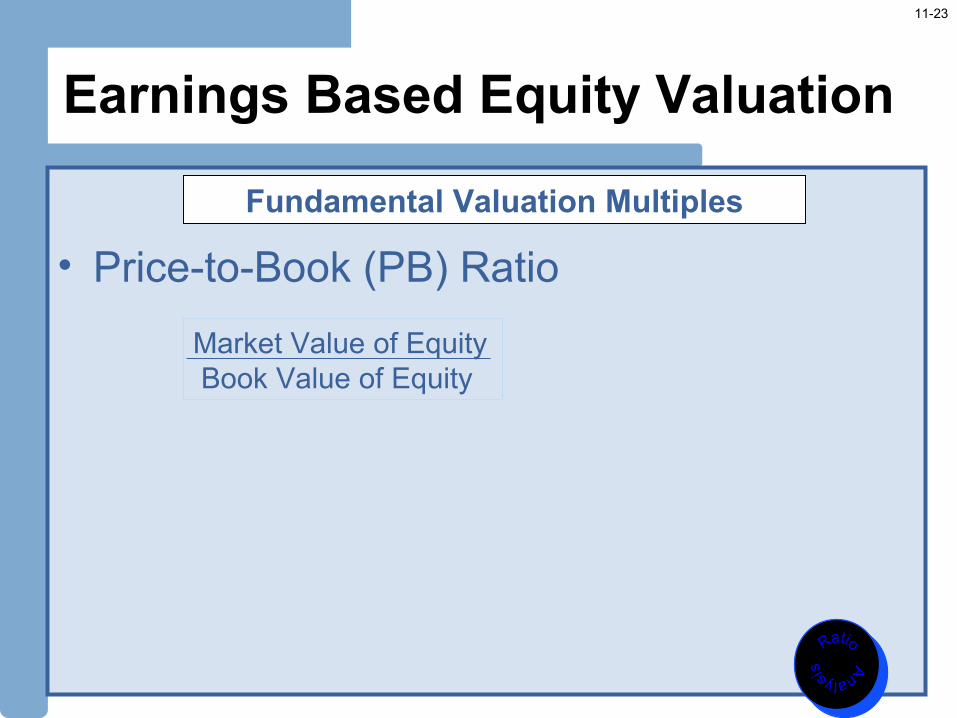
Earnings Based Equity Valuation
• Price-to-Book (PB) Ratio
Fundamental Valuation Multiples
Market Value of Equity Book Value of Equity
11-24
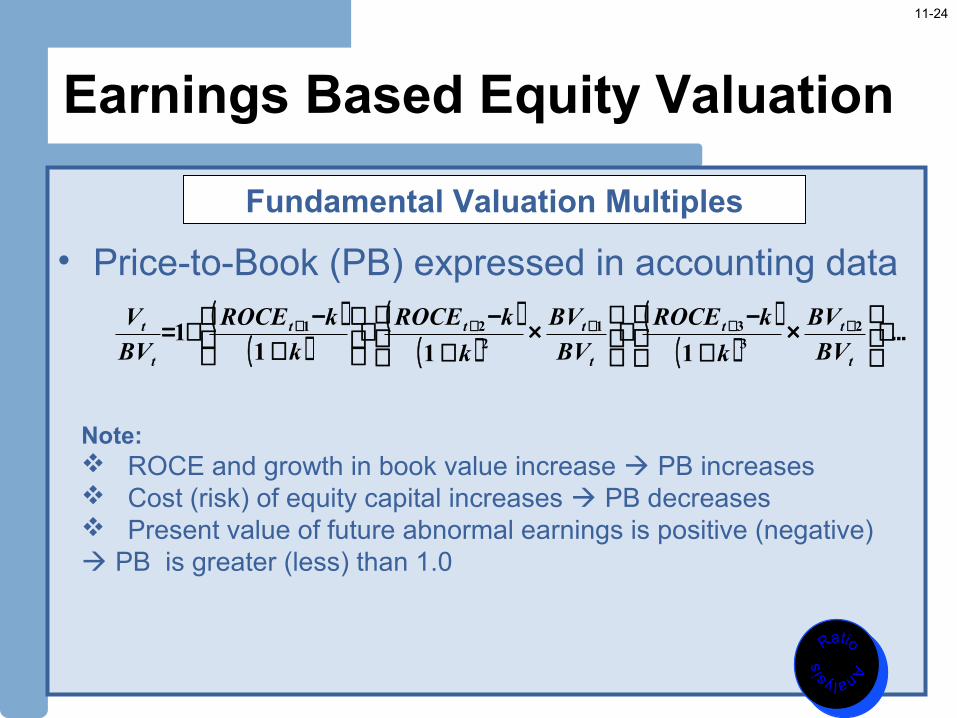
Earnings Based Equity Valuation
• Price-to-Book (PB) expressed in accounting data
Fundamental Valuation Multiples
( )( )
( )( )
( )( ) ...+
×
+−+
×
+−+
+
−+= +++++
t
tt
t
ttt
t
t
BV
BV
k
kROCE
BV
BV
k
kROCE
k
kROCE
BV
V 2331
221
1111
Note: ROCE and growth in book value increase PB increases Cost (risk) of equity capital increases PB decreases Present value of future abnormal earnings is positive (negative) PB is greater (less) than 1.0
11-25
Earnings Based Equity Valuation
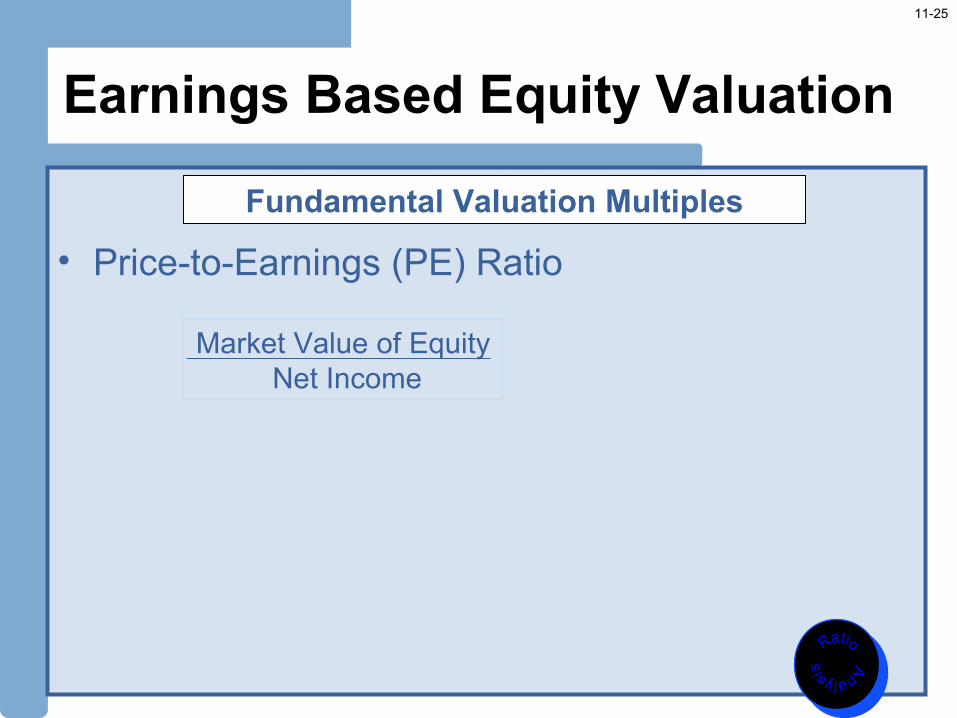
• Price-to-Earnings (PE) Ratio
Fundamental Valuation Multiples
Market Value of Equity Net Income
11-26
Earnings Based Equity Valuation
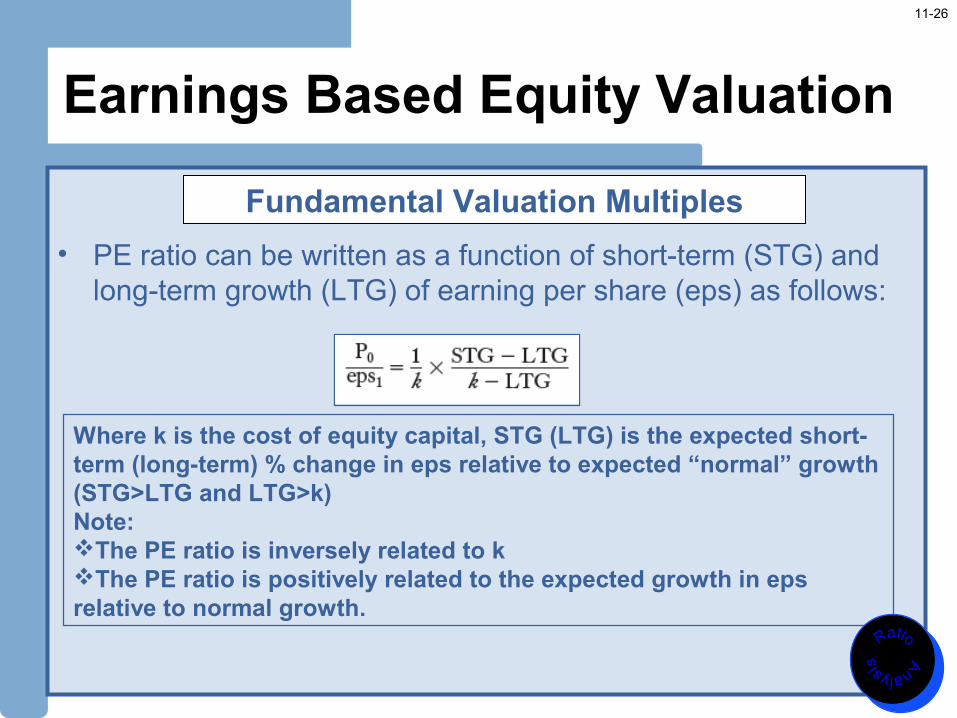
• PE ratio can be written as a function of short-term (STG) and long-term growth (LTG) of earning per share (eps) as follows:
Fundamental Valuation Multiples
Where k is the cost of equity capital, STG (LTG) is the expected short-term (long-term) % change in eps relative to expected “normal” growth (STG>LTG and LTG>k)Note:The PE ratio is inversely related to kThe PE ratio is positively related to the expected growth in eps relative to normal growth.
11-27
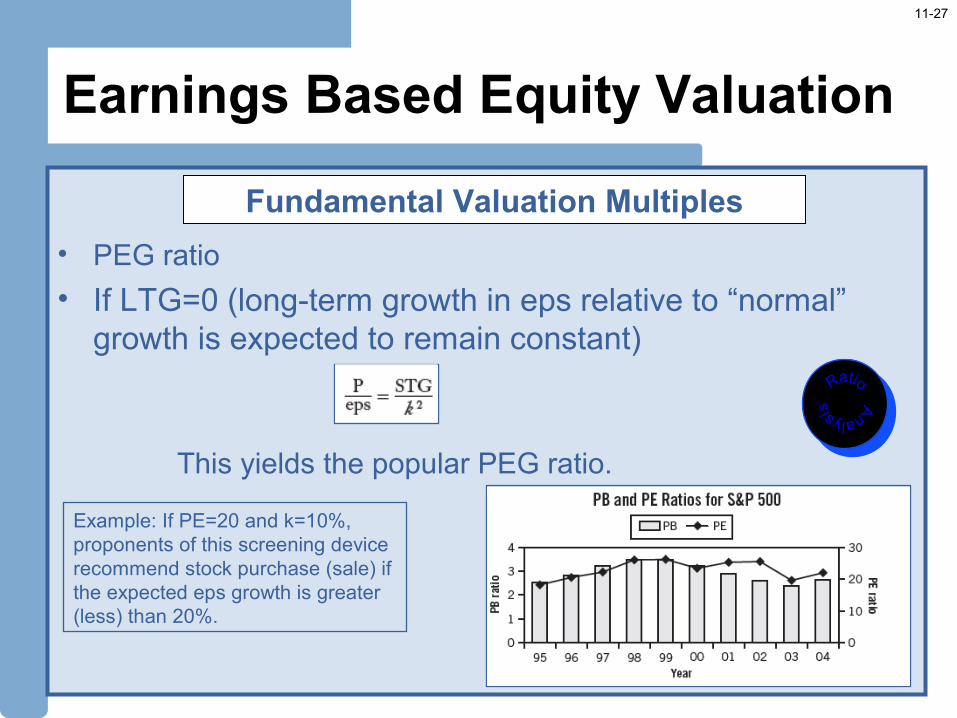
Earnings Based Equity Valuation
• PEG ratio
• If LTG=0 (long-term growth in eps relative to “normal” growth is expected to remain constant)
This yields the popular PEG ratio.
Fundamental Valuation Multiples
Example: If PE=20 and k=10%, proponents of this screening device recommend stock purchase (sale) if the expected eps growth is greater (less) than 20%.
11-28
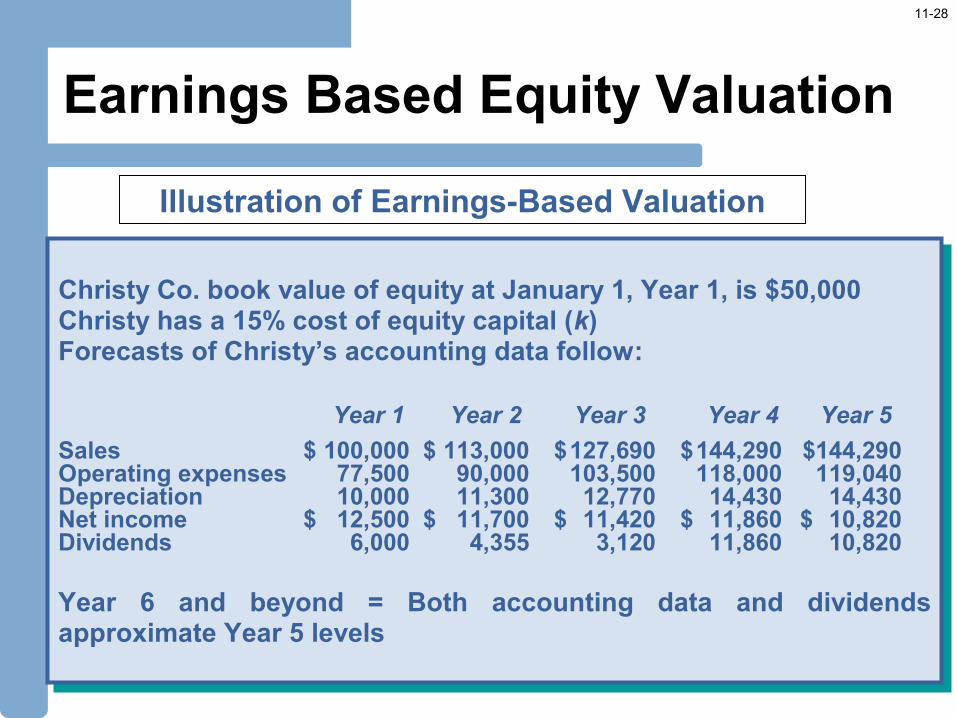
Earnings Based Equity Valuation
Illustration of Earnings-Based Valuation
Christy Co. book value of equity at January 1, Year 1, is $50,000Christy has a 15% cost of equity capital (k)Forecasts of Christy’s accounting data follow:
Year 1 Year 2 Year 3 Year 4 Year 5
Sales $ 100,000 $ 113,000 $127,690 $144,290 $144,290Operating expenses 77,500 90,000 103,500 118,000 119,040Depreciation 10,000 11,300 12,770 14,430 14,430Net income $ 12,500 $ 11,700 $ 11,420 $ 11,860 $ 10,820Dividends 6,000 4,355 3,120 11,860 10,820
Year 6 and beyond = Both accounting data and dividends approximate Year 5 levels
11-29
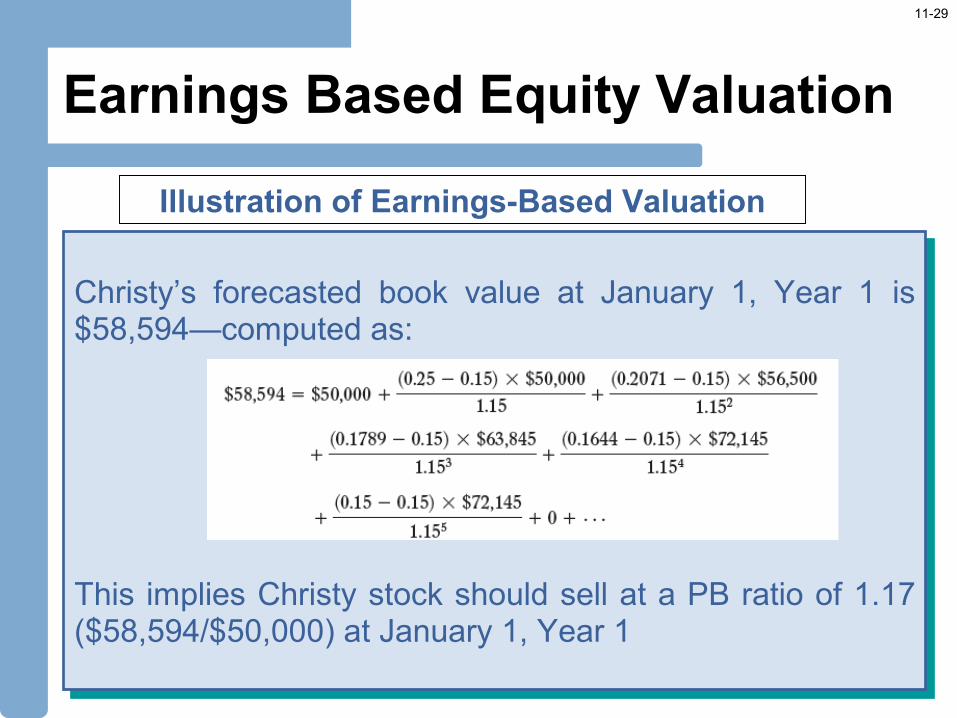
Earnings Based Equity Valuation
Illustration of Earnings-Based Valuation
Christy’s forecasted book value at January 1, Year 1 is $58,594—computed as:
This implies Christy stock should sell at a PB ratio of 1.17 ($58,594/$50,000) at January 1, Year 1
Christy’s forecasted book value at January 1, Year 1 is $58,594—computed as:
This implies Christy stock should sell at a PB ratio of 1.17 ($58,594/$50,000) at January 1, Year 1
11-30
Earnings Based Equity Valuation
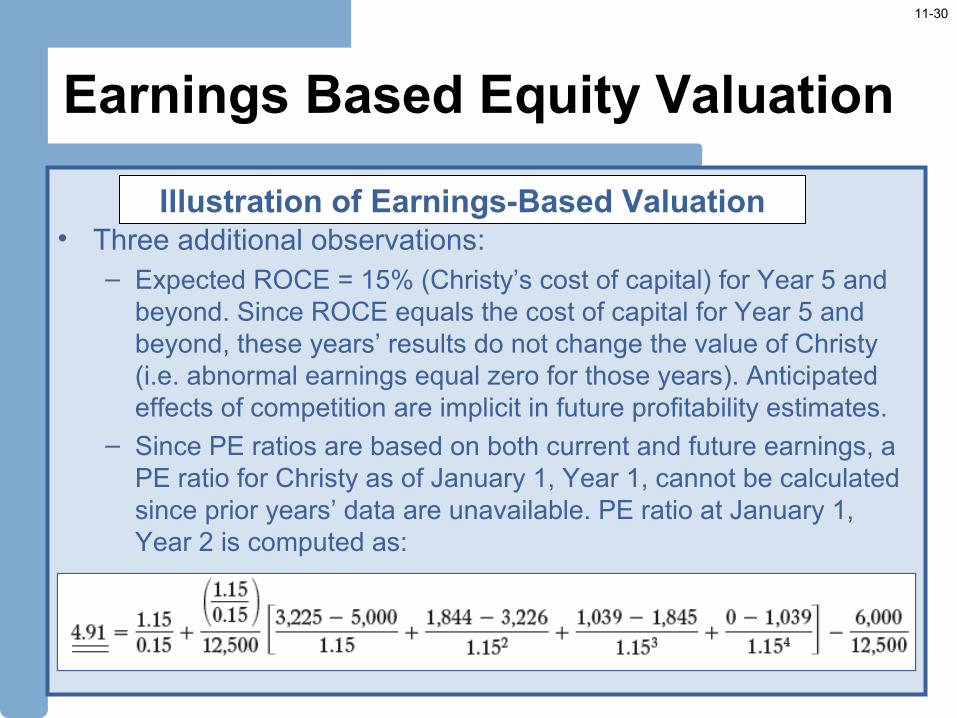
• Three additional observations:– Expected ROCE = 15% (Christy’s cost of capital) for Year 5 and
beyond. Since ROCE equals the cost of capital for Year 5 and beyond, these years’ results do not change the value of Christy (i.e. abnormal earnings equal zero for those years). Anticipated effects of competition are implicit in future profitability estimates.
– Since PE ratios are based on both current and future earnings, a PE ratio for Christy as of January 1, Year 1, cannot be calculated since prior years’ data are unavailable. PE ratio at January 1, Year 2 is computed as:
Illustration of Earnings-Based Valuation
11-31
Earnings Based Equity Valuation
– Valuation estimates assume dividend payments occur at the end of each year. A more realistic assumption is that, on average, these cash outflows occur midway through the year. To adjust valuation estimates for mid-year discounting, multiply the PV of future abnormal earnings by (1 + k/2). For Christy Company the adjusted valuation estimate equals $59,239. This is computed as $50,000 + (1 + [.15/2]) x $8,594.
Illustration of Earnings-Based Valuation
11-32
Earning Power and Forecasting for Valuation
• Earning power is the earnings level expected to persist into the foreseeable future– Accounting-based valuation models capitalize earning power– Many financial analyses directed at determining earning power
• Measurement of Earning Power reflects:– Earnings and all its components– Stability and persistence of earnings
and its components– Sustainable trends in earnings and its
components
Earning Power
11-33
Earning Power and Forecasting for Valuation
• Factors in selecting a time horizon for measuring earning power:– One-year is often too short to reliably measure earning power– Many investing and financing activities are long term– Better to measure earning power by using average (or
cumulative) earnings over several years– An extended period is less subject to distortions, irregularities,
and other transitory effects– Preferred time horizon in measuring earning
power is typically 4 to 7 years
Earning Power

11-34
Earning Power and Forecasting for Valuation
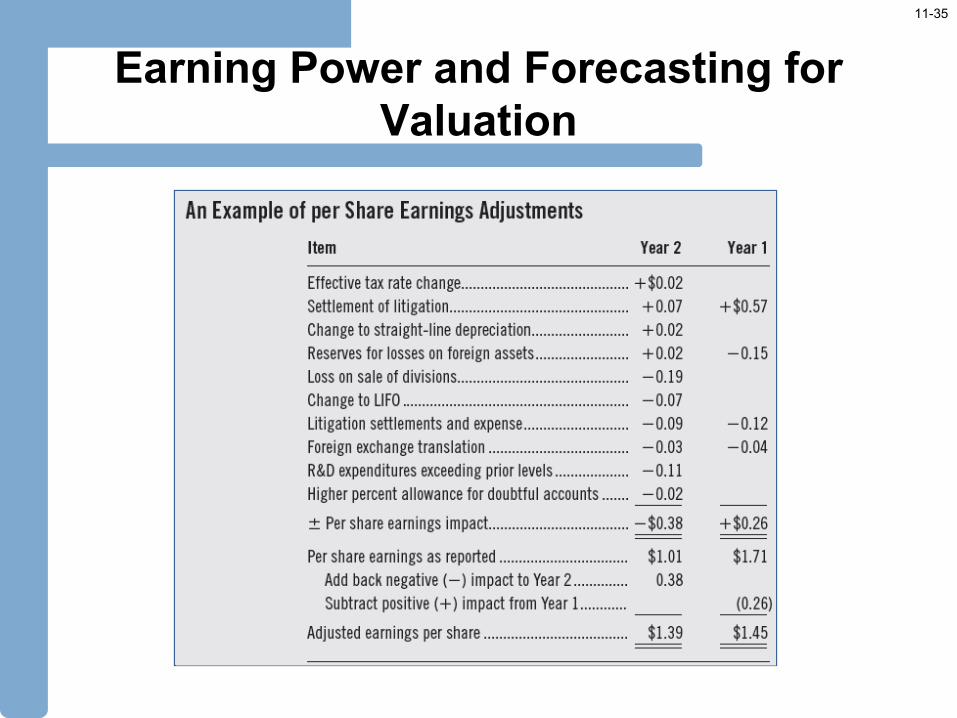
• Adjusting Earnings per Share– Earning power is measured using all earnings components. – The issue is to what year we assign these items when computing
earning power.
Earning Power
Our earnings analysis might be limited to a short time horizon. We adjust short time series of earnings for items that better relate to other periods. If this is done on a per share basis, every item must be adjusted for its tax effect using the company’s effective tax rate unless the applicable tax rate is specified. All items must also be divided by the number of shares used in computing EPS.
11-35
Earning Power and Forecasting for Valuation
11-36
Earning Power and Forecasting for Valuation
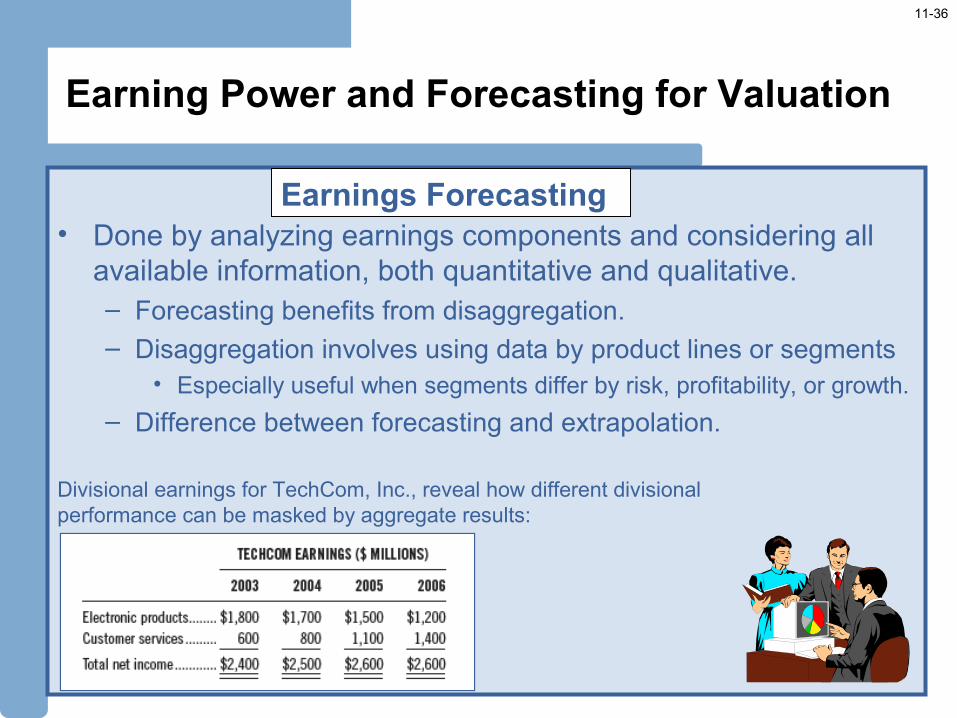
• Done by analyzing earnings components and considering all available information, both quantitative and qualitative.– Forecasting benefits from disaggregation. – Disaggregation involves using data by product lines or segments
• Especially useful when segments differ by risk, profitability, or growth.
– Difference between forecasting and extrapolation.
Earnings Forecasting
Divisional earnings for TechCom, Inc., reveal how different divisional performance can be masked by aggregate results:
11-37
Earning Power and Forecasting for Valuation
• Elements Impacting Earnings Forecasts– Current and past evidence
– Forecast’s reasonableness.
– Continuity and momentum of company performance
– Industry prospects
– Company's financial condition
– Management• Management quality—resourcefulness• Asset management—operating skills
– Economic and competitive factors– Key Indicators such as capital expenditures, order backlogs,
and demand trends
Earnings Forecasting
11-38
Earning Power and Forecasting for Valuation
• Limitations in interim reporting related to difficulties in assigning earnings components to periods of under one year in length:– Period-end accounting adjustments
– Seasonality in business activities
– Integral reporting method
– SEC interim reporting requirements
– Analysis implications of interim Reports
Interim Reports for Monitoring and Revising Earnings Estimates
11-39
Earning Power and Forecasting for Valuation
• Available Interim Reports– Quarterly reports (Form 10-Q)– Reports on current developments (Form 8-K)– Disclosure of separate fourth-quarter results– Details of year-end adjustments
• Interim reports filed with the SEC such as:– Comparative interim and year-to-date income statement– Comparative balance sheets– Year to date statement of cash flows‑ ‑– Pro forma information on business combinations– Disclosure of accounting changes– Management’s narrative analysis of operating results– Reports of a change in auditor
Interim Reports for Monitoring and Revising Earnings Estimates