financial performance evaluation of state …€¦ · · 2017-04-10iv. objectives of the studies...
TRANSCRIPT
LIST OF ABBREVIATIONS
NEKRTC : North East Karnataka Road Transport CorporationCPKM : Cost per KilometerEPKM : Earnings per KilometerMPKM : Margin per kilometerCIRT : Central Institute of Road TransportSTU : State Transport UndertakingBEP : Break Even PointAC : Air ConditionerAWATAR : Any Where Any Time Advance ReservationETMs : Electronic Ticketing MachinesMIS : Management Information SystemDCS : Depot Computerization SoftwareIT : Information TechnologyKMs : KilometersHSD : High Speed Diesel.
FINANCIAL PERFORMANCE EVALUATION OF STATE ROAD TRANSPORT CORPORATIONS – A STUDY WITH A FOCUS ON NEKRTC
Synopsis:I. IntroductionII. Review of LiteratureIII. Statement of the problemIV. Objectives of the studiesV. Pro�le of NEKRTC
VI. Financial indicators OF NEKRTCŸ CPKMŸ EPKMŸ MPKMŸ Gross Revenue
VII. Summary of Findings, Suggestions and Conclusions
I .INTRODUCTION: It is usual to judge the performance of private sector units by the yardstick of net pro�t or loss; hence in their case maximization of the pro�t is the sole aim. This yardstick fails in the case of public sector undertakings, since they give more preference to attain other priorities which in the public interest. Due to this the performance of the public sector should not be judged by what they earn in the form of pro�ts but by the total additions they make to the �ow of goods and services in the economy. Thus instead of pro�ts, the yardstick should be the total sales value of the enterprises.
Though there is no dispute regarding the role of the public sector undertaking in country's economic development, yet the feeling is widely prevalent that, the rate of pro�t in these undertakings is either too low or is negative. Accordingly their performance is not up to the expected standard.
However it is not so easy to decide about the ef�ciency of the public sector undertakings. As noted earlier the rate of pro�t might be a good criterion to judge the ef�ciency of a private sector enterprise but cannot be deemed so for public sector enterprise. It
Original Research Paper Commerce
FINANCIAL PERFORMANCE EVALUATION OF STATE ROAD TRANSPORT CORPORATIONS – A STUDY
WITH A FOCUS ON NEKRTC
SUNITA RAMESH KATKE
DEPARTMENT OF POST GRADUATE STUDIES & RESEARCH IN COMMERCE, GULBARGA UNIVERSITY KALABURAGI, KARNATAKA
Dr. RAJNALKAR LAXMAN
DEPARTMENT OF POST GRADUATE STUDIES & RESEARCH IN COMMERCE, GULBARGA UNIVERSITY KALABURAGI, KARNATAKA
ISSN - 2250-1991 | IF : 5.761 | IC Value : 79.96Volume : 6 | Issue : 3 | - 2017March
KEYWORDS
ABSTR
ACT
North East Road Transort Corporation. NEKRTC was established on 1.10.2000 having been separated from KSRTC for providing “adequate, ef�cient, economic and properly coordinated road transport services” in the North eastern part of the state of Karnataka. As on 31.03.2015 NEKRTC is operating 3970 schedules covering 12.46 lakhs kms carrying 12.00 lakhs passengers every day. NEKRTC is serving 92% of the villages in its area (3859 out of 4203) with transport facility. NEKRTC owns a wide Infrastructure consisting one corporate of�ce, 09-Divisional of�ces, 48 Depots, 134 bus stands and 4369 buses. NEKRTC provides the wide range of services to the commuters like AC sleeper , AC Semi Sleeper, AC Jumbo, AC Mofussil, Rajahansa and Suhas (Executive services) Karnatak Sarige ( Branded and Regular services), Mofussil (Express and ordinary city /sub urban services). The corporation is �nancially not depended on the state government as state road transport should operate the schedules and generate the revenue to meet its expenditures. Likewise NEKRTC is managing its expenditure by generating the revenue. Major components of the expenditure is fuel and staff salary, here fuel contributes around 40% of the total cost and staff salary around 15% -20 % of total cost. Being major cost components these two are playing a vital role in the �nance management. Public transport corporation is directly linked to the common man hence can't avoid any cost due to losses and lower earnings. Paper prepared on “Financial Performance Evaluation of State Road Transport Corporation-A case study with Focus on NEKRTC, �nancial parameters like CPKM, EPKM, Marginal revenue and Gross revenue are discussed in detail. A public transport organization like NEKRTC is giving equal importance to both �nancial and physical parameters for performance evaluation. Financial parameters are given importance here because all the expenditures incurred by the corporation are borne by the revenue earned by the corporation. The revenue may be traf�c revenue or commercial revenue here. Any organization can survive if it is �nancially sound. Meanwhile the public transportation like NEKRTC has to provide services to commuters without expecting the pro�ts. Due to various reasons NEKRTC operates vehicles in those routes which are loss making in most of the time and some time breakeven point. Very less routes generate pro�t for the schedule. CPKM of the corporation is increasing every year, EPKM is also increasing every year, but the ratio between these two parameters is not similar. Growth rate Cost of production is higher than the growth rate of earnings. Gross revenue of the corporation is showing a favorable growth rate. Margin per kilometer is always shown a negative �gure which affects the �nancial strength of the corporation in long run if the same continues for a longer period.
PARIPEX - INDIAN JOURNAL OF RESEARCH | 515
is preferred that to judge the ef�ciency of the public sector undertaking it is recommended the criterion of social marginal productivity and the utility of investment in any project should be judged by its impact on national income, balance of payments and distribution of income. Further the evolution of investment in the public sector should be done on the basis of marginal per capita investment quotient. According to this criterion, we must examine whether investment of capital in any project will lead to maximization of national income at any point in the future or not. Without entering into the controversy regarding determination of investment in the public sector at this juncture, we would like emphasize that evaluation of any state enterprise should be done on the basis of social bene�t and social cost and not on the basis of rate of pro�t.
The �elds of engineering and management associate ef�ciency with how well a relevant action is performed, i.e. ''doing things right'', and effectiveness with selecting the best action, i.e. ''doing the right thing''. Thus, a �rm is effective if identi�es appropriate strategic goals, and ef�cient if it achieves them with minimal resources. Operational ef�ciency or the ability to deliver products and services cost effectively without sacri�cing quality. Ef�ciency with both queuing models and productivity, and ef�ciency analysis methods that identify maximum productivity and measure ef�ciency as a ratio of observed productivity to maximum productivity. The maximum productivity levels serves as a benchmark for desired perform.
II .REVIEW OF LITERATURE:Performance analysis on any organization facilitates to know its functioning in key performance areas to suggest suitable steps, where ever necessary for its improvement in ef�ciency and successful performance. Lau, (1997) suggests that evaluation of public transport services can be divided into two aspects. The �rst one is to evaluate the public transport based on its ef�ciency. The second one is to evaluate the systems on its ability to meet the basic objective like service to the public.
Shambhag (1972) examined the peculiar desires of the commuters like “he (wants to) should get a bus within a reasonable period. He should be able to reach his destination by a direct bus; he should be able to travel to his destination by the shortest route”. He also observed the losses on transport due to city transport, because its very nature of operations is uneconomic, as a large number of �eet is required to be maintained and to take off peak hour traf�c, etc. He also discussed the facts of shortage of capital, absenteeism of staff. (Ef�cient network with adequate frequency)
Venkaji Rao (1974) analyzed the managerial problem of state transport undertaking with special reference to Mysore State. He identi�ed some administrative problem to improve the performance of a state transport undertaking. They are: (i) Balancing the transport requirements of the community as against other facilities, requirements of the community as against other facilities served, based on costs and income and �nance, (ii) Peak-load problems, (iii) the most ef�cient utilization of vehicles and staff on the basis of moving of given loads of passengers. (iv) Forecasting the picture of transport.(Optimal utilization of resources)
Jakaria (1975) explained the need for the establishment of adequate criteria for evaluating the performance of urban transport systems.
Pereira, W.(1975) suggested that overcrowding, foot board travel and indiscipline in the bus should be reduced. Special standee buses should be introduced during peak hours, and checking should be strengthened. Dishonesty and cheating should be severely punished.(Comfort and Safety approach)
Purushotham, P.W., (1992) examined the organization and management of the road transport corporation administered under public sector in Andhra Pradesh with a view to promote performance standards and organizational ef�ciency.
Prasad, Srinivas, and Khan (1996) conducted a case study on APSRTC and identi�ed the operations of city services, with negative margin and operation of obligatory services, concessional passes to various categories of commuters, provision for passenger amenities and operation of buses on bad roads with additional cost of operation are for the social bene�t and hence cannot be taken as wastage or ill utilization of funds.(Shouldering of Social obligations)
Gundam Rajeswari (1998) examined the performance of Andhra Pradesh Road Transport Corporation at the state and regional levels. Both �nancial and social performance were examined using indicators like cost per kilometer, earnings, load factor etc. and arrived at gross margins for the survey period. Pradeep Singh Karola (2004) in his study explained the economy of public transport system, factors affecting the cost of operation of bus system, the manpower related parameters, the mechanized parameters and the traf�c related parameters relating to public transport system. Bhaskar, G. and N.V. Ramana Murthy (2004) analyzed the dif�cult role played by Transport Undertakings in meeting the duel objectives i.e. social objectives on one side and the commercial objectives on the other side. (Social service with business principles)
III. STATEMENT OF THE PROBLEMAppraisal of operational performance of public transport service can be divided in two aspects. The �rst one is to evaluate the public transport based on its ef�ciency. The second one is to evaluate the systems on its ability to meet the basic objective like service to the public. The performance of the public transport can't be determined on the �nancial performance. performance of public transportation is assessed more on �nancial parameters rather than physical parameters. A public transport corporation like NEKRTC is giving equal importance to both �nancial and physical parameters for performance evaluation. The reason for giving importance to �nancial aspects here that all the expenditures are borne by the corporation, it has to manage with the revenue earned by the corporation (Self sustaining organization). Therefore the survival of the organization is depended on the revenue accumulated by way of traf�c revenue as well as other commercial revenue. It is a known fact that any organization may be private or public can survive only if it is �nancially sound in its business. In case of public sector it may generate revenue on its own business or government may give �nancial assistance. On the other hand performance of the public sector like NEKRTC is measured with operational parameters which also play an important role for the organization. People (public) and State Transport Undertakings both are very much depended on each other for their survival. The concept of the public sector is emerged only to facilitate people to travel from one place to other. In earlier days the performance of the public transport Undertakings is assessed depending on the extent of reach of its vehicles to the commuters. Later on the performance is assessed on the load factor, frequency, number of schedules etc., though these are the physical parameters for performance evaluation but considered as a major techniques to assess the quality of the services delivered and for performance improvements. State Transport Undertaking constitutes an important part of Indian public sector. CIRT, Pune regularly monitors the performance of these undertakings. The parameters used by this institute to evaluate the performance of these undertakings are i) Vehicle productivity ii) Manpower productivity iii) Fuel productivity iv) Pro�tability. Thus to evaluate the performance of State Transport Undertakings the CIRT uses both �nancial and physical performance indicators. Government of India, Planning commission also conducts performance evaluation of these undertakings from time to time. The Planning Commission also uses both �nancial and physical indicators for performance analysis.
ISSN - 2250-1991 | IF : 5.761 | IC Value : 79.96Volume : 6 | Issue : 3 | - 2017March
516 | PARIPEX - INDIAN JOURNAL OF RESEARCH
IV. OBJECTIVES OF THE STUDY:Ÿ To Study and analyze the Performance of NEKRTC, with
reference to the Financial ParametersŸ To study and analyze total cost and cost per kilometer behavior
for a period of 10 years.Ÿ To study and analyze total earnings and earnings per kilometer
for a period of 10 yearsŸ To Analyze the Gross revenueŸ To offer suggestions, alternative ways and means to improve
the operations of the organization in particular, Sector in general.
V. PROFILE OF NEKRTC
NEKRTC was established on 1.10.2000 having been separated from KSRTC for providing “adequate, ef�cient, economic and properly coordinated road transport services” in the North eastern part of the state of Karnataka. As on 31.03.2015 NEKRTC is operating 3970 schedules covering 12.46 lakhs kms carrying 12.00 lakhs passengers every day. NEKRTC is serving 92% of the villages in its area (3859 out of 4203) with transport facility. NEKRTC owns a wide Infrastructure consisting one corporate of�ce, 09-Divisional of�ces, 48 Depots, 134 bus stands and 4369 buses. NEKRTC provides the wide range of services to the commuters like AC sleeper , AC Semi Sleeper, AC Jumbo, AC Mofussil, Rajahansa and Suhas ( Executive services) Karnatak Sarige ( Branded and Regular services) , Mofussil ( Express and ordinary city /sub urban services).
The corporation is �nancially not depended on the state government as state road transport should operate the schedules and generate the revenue to meet its expenditures. Likewise NEKRTC is managing its expenditure by generating the revenue. Major components of the expenditure is fuel and staff salary, here fuel contributes around 40% of the total cost and staff salary around 15 % of total cost. Being major cost components these two are playing a vital role in the �nance management. Public transport corporation is directly linked to the common man hence can't avoid any cost due to losses and lower earnings.
FACILITIES PROVIDED BY THE NEKRTC ITS TO COMMUTERS:Ÿ Reservation of seats for lady passengers: Two seats have been
reserved in Rajahamsa and higher classes of services for lady passengers travelling single. In Mofussil buses, nine seats and fourteen seats in City/Suburban services are reserved for lady passengers.
Ÿ Reservation of seats for physically handicapped persons: Two seats (24 & 25) have been reserved in Mofussil and City/ Suburban services.
Ÿ Free / Concessional Passes: NEKRTC is extending free / concessional travel facility to students, physically Challenged persons, Visually Challenged persons, Freedom Fighters, SHOURYA' Awardees, National Award Winners (Kannada & Sanskrit Dept.), Freedom Fighters Wives/Widows, Free travel facility to the Dependents of Soldiers who died for Country and Journalists.
Ÿ Concession for senior citizens: NEKRTC provides Concession in passengers fare for senior citizens about 25% of the Bus fare, having the age 60 and above.
Ÿ Discount on Return Journey Tickets: A discount of 10% is offered on return journey tickets, if both onward and return journey tickets are booked simultaneously.
Ÿ Discount on Group bookings: A discount of 5% on the fare, if four or more passengers book a single ticket. Further, discount of 8% is given for a group of 10 or more passengers.
Ÿ Special services: Additional services to pilgrimage / tourist places are operated during festivals, summer vacation, other fairs/festivals, weekends and holidays.
Ÿ Casual Contract services: For special occasions like weddings, excursions, pilgrimage or study tour etc, NEKRTC is providing dedicated buses on hire basis at competitive rates.
Ÿ Monthly Season Tickets are available to the passengers travelling between two selected destinations daily. These passes are most suited for of�ce / industry employees, teachers, businessmen etc.
Ÿ Pass Issue counters are working at all bus stands for the convenience of the travelling public in obtaining student passes, Monthly Season Tickets and One Day Passes.
Ÿ Advance reservation booking network (AWATAR): NEKRTC has implemented on-line advance reservation network called AWATAR (Any Where Any Time Advance Reservation), wherein tickets can be booked through Internet. Presently, 16 NEKRTC counters and 46 Franchisees are working on this system. There are 03 on-line booking counters in Gulbarga, 13 Counters in Hospet, 4 Counters in Raichur,7 Counters in Koppal, 3 Counters in Bijapur, 13 counters in Bellary, 1 Counter at in Bidar and 2 Counters in Yadagiri, . Tickets can be booked 30 days in advance including return journey tickets from selected destinations.
Ÿ Electronic Ticketing Machines: To enhance the usage of IT in day-to-day operations ETMs have been deployed in all 48 Depots. ETMs are convenient, user-friendly, light in weight apart from other bene�ts like speedy issue of tickets, reduction in manual entry of waybills, generation of MIS reports on the no. of passengers travelled, distance of travel, integration with DCS etc.
Ÿ Passenger Amenities at bus stands: Refreshment rooms, drinking water facility, sitting arrangements, display of Time-Tables, Enquiry counters, Pass issue counters, Advance booking counters, Luggage booking counters, separate toilets / urinals for Gents/Ladies, cycle/ scooter/ car parking stands, CCTV, book stall, fruit stall. STD/local telephone booths etc are provided at bus stands. All the bus stands in NEKRTC jurisdiction are taken up for up gradation.
Ÿ Advertisement media: NEKRTC has an extensive media for advertisement like bus panels, hoardings, on the backside of bus tickets, advance reservation tickets, various types of passes which can be ut i l ized for display of commercia l advertisements.
Ÿ Environment friendly initiatives: NEKRTC has undertaken massive a forestation programmers in its premises in Depots, Divisions, and Workshop etc. Modern vehicle testing equipments are procured to adhere to vehicular emission norms. Diesel particulate �lters have been �tted to reduce particulate emission on trial basis. A forestation is taken up in large scale.
VI FINANCIAL PERFORMANCE INDICATORSFinancial management to rather like maintenance is to a vehicle. If we don't put in good quality fuel and oil and give it a regular service, the functioning of the vehicle suffers and it will not run ef�ciently. If neglected, the vehicle will eventually break down and fail to reach its intended destination. In practice, �nancial management is about taking action to look after the �nancial health of an organization, and not leaving things to chance. The concept purely applicable to those organizations which do not run to achieve pro�t, like public transport sector run by the state corporations like NEKRTC.
Financial performance is a subjective measure of how well a �rm can use assets from its primary mode of business and generate revenues. There are many different ways to measure �nancial performance, but all measures should be taken in aggregation. Line items such as revenue from operations, operating income or cash �ow from operations can be used, as well as total unit sales.
ISSN - 2250-1991 | IF : 5.761 | IC Value : 79.96Volume : 6 | Issue : 3 | - 2017March
PARIPEX - INDIAN JOURNAL OF RESEARCH | 517
Therefore �nancial performance refers to the act of performing �nancial activity. In broader sense, �nancial performance refers to the degree to which �nancial objectives being or has been accomplished. It is the process of measuring the results of a �rm's policies and operations in monetary terms. It is used to measure �rm's overall �nancial health over a given period of time and can also be used to compare similar �rms across the same industry or to compare industries or sectors in aggregation. However, �nancial indicators do not reveal all the information related to the �nancial operations of a �rm, but they furnish some extremely useful information, which highlights two important factors pro�tability and �nancial soundness. Thus analysis of �nancial indicators is an important aid to �nancial performance analysis. Financial performance analysis includes analysis and interpretation of �nancial statements in such a way that it undertakes full diagnosis of the pro�tability and �nancial soundness of the business.
An attempt is made in this paper to analyze the performance of NEKRTC based on the major �nancial indicators such as CPKM, EPKM, MPKM and Gross revenue.
(I) COST PER KILOMETERS (CPKM)For any Road Transport Corporation the main and utmost important �nancial performance indicator is cost per kilometer. Because it, together with EPKM, sets the base for �xing the fare. The pro�tability of an organization is a function of both costs and prices, which are equally valid in case of the State Transport Undertakings too. An organization incurs losses when the cost goes up and the price remains constant or a cost remaining the same the price/fare falls. The second phenomenon of fare coming down does not ordinarily arise in the case of passenger road transport industry for reasons of relative inelasticity of demand for the service, monopoly rights conferred on the service and state regulation of fares. The cost of operation in absolute terms does not by itself indicate measure of cost. Cost has to be worked out to compare the cost of providing the service with the rate of earnings. Cost per kilometer is one of such relative measure which is computed by selecting effective kilometer as a unit of measurement. In other words it is the Cost per Unit of the product which in this case is passenger kms.
The cost per kilometer or CPKM is computed by dividing the total cost of operation by the total effective kilometer. The CPKM is expressed in terms of paisa/Rupees. The CPKM can be worked out either in respect of the total cost of operation or in respect of each components of the cost separately. The direct or operational or variable cost reacts proportionately with the change in value of operations and the cost per unit, i.e., CPKM is constituted with value of operation. As indirect or total �xed cost does not change with volume of operation, the cost per unit, i.e., CPKM declines as value rises or increases as volume falls.
In NEKRTC two types of cost are considered for assessing the performance analysis, they are �xed and variable cost. Here �xed cost consists of staff salary, general administrative expenditures, interest and debt charges, welfare expenses, depreciation on other assets, etc. whereas variable cost is consists of depreciation on vehicle, HSD, lubricants, Tyres, Tubes, Flaps, spares and assembly, batteries and electrical items, motor vehicle tax, Reconditioning cost, Thus total cost comprises of �xed costs which is independent on vehicle utilization, but on its calculation on the basis of per kilometer operated, it continuously declines as the vehicle utilization increases, secondly , variable costs are dependent on vehicle utilization but are constant on per kilometer basis. The sum of these two costs per kilometers makes up the CPKM. Viewed from the different angle, Total cost divided by seats kilometer gives cost per kilometer. CPKM and cost per seat kilometer depends on vehicle utilization which is depended on the seasons.
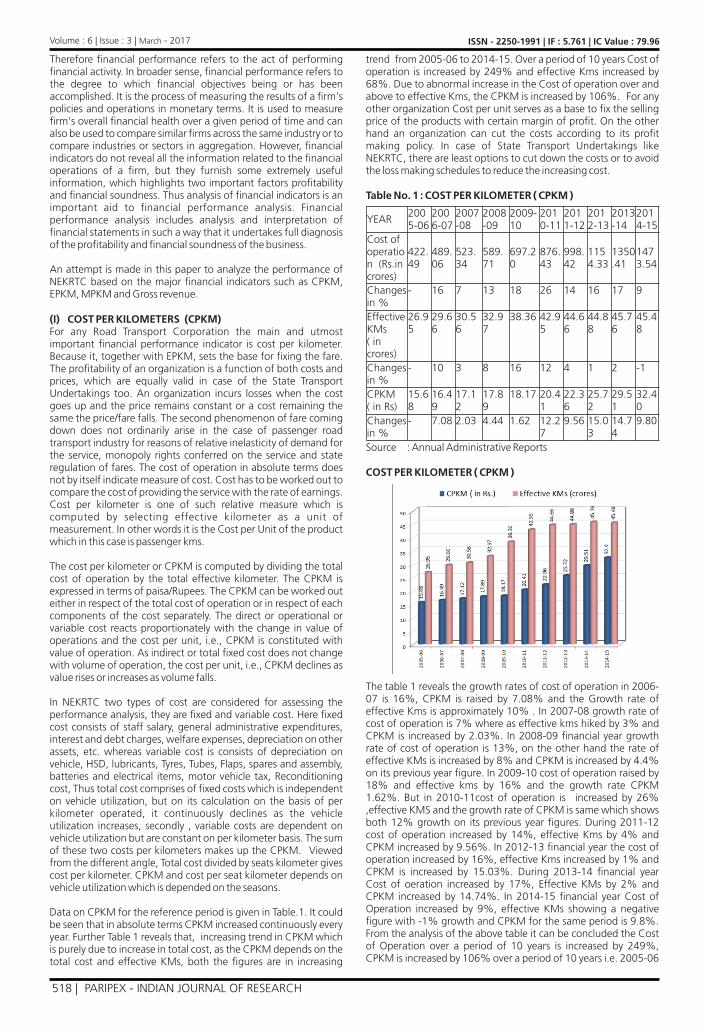
Data on CPKM for the reference period is given in Table.1. It could be seen that in absolute terms CPKM increased continuously every year. Further Table 1 reveals that, increasing trend in CPKM which is purely due to increase in total cost, as the CPKM depends on the total cost and effective KMs, both the �gures are in increasing
trend from 2005-06 to 2014-15. Over a period of 10 years Cost of operation is increased by 249% and effective Kms increased by 68%. Due to abnormal increase in the Cost of operation over and above to effective Kms, the CPKM is increased by 106%. For any other organization Cost per unit serves as a base to �x the selling price of the products with certain margin of pro�t. On the other hand an organization can cut the costs according to its pro�t making policy. In case of State Transport Undertakings like NEKRTC, there are least options to cut down the costs or to avoid the loss making schedules to reduce the increasing cost.
Table No. 1 : COST PER KILOMETER ( CPKM )
Source : Annual Administrative Reports
COST PER KILOMETER ( CPKM )
The table 1 reveals the growth rates of cost of operation in 2006-07 is 16%, CPKM is raised by 7.08% and the Growth rate of effective Kms is approximately 10% . In 2007-08 growth rate of cost of operation is 7% where as effective kms hiked by 3% and CPKM is increased by 2.03%. In 2008-09 �nancial year growth rate of cost of operation is 13%, on the other hand the rate of effective KMs is increased by 8% and CPKM is increased by 4.4% on its previous year �gure. In 2009-10 cost of operation raised by 18% and effective kms by 16% and the growth rate CPKM 1.62%. But in 2010-11cost of operation is increased by 26% ,effective KMS and the growth rate of CPKM is same which shows both 12% growth on its previous year �gures. During 2011-12 cost of operation increased by 14%, effective Kms by 4% and CPKM increased by 9.56%. In 2012-13 �nancial year the cost of operation increased by 16%, effective Kms increased by 1% and CPKM is increased by 15.03%. During 2013-14 �nancial year Cost of oeration increased by 17%, Effective KMs by 2% and CPKM increased by 14.74%. In 2014-15 �nancial year Cost of Operation increased by 9%, effective KMs showing a negative �gure with -1% growth and CPKM for the same period is 9.8%. From the analysis of the above table it can be concluded the Cost of Operation over a period of 10 years is increased by 249%, CPKM is increased by 106% over a period of 10 years i.e. 2005-06
YEAR 2005-06
2006-07
2007-08
2008-09
2009-10
2010-11
2011-12
2012-13
2013-14
2014-15
Cost of operation (Rs.in crores)
422.49
489.06
523.34
589.71
697.20
876.43
998.42
1154.33
1350.41
1473.54
Changes in %
- 16 7 13 18 26 14 16 17 9
Effective KMs ( in crores)
26.95
29.66
30.56
32.97
38.36 42.95
44.66
44.88
45.76
45.48
Changes in %
- 10 3 8 16 12 4 1 2 -1
CPKM ( in Rs)
15.68
16.49
17.12
17.89
18.17 20.41
22.36
25.72
29.51
32.40
Changes in %
- 7.08 2.03 4.44 1.62 12.27
9.56 15.03
14.74
9.80
ISSN - 2250-1991 | IF : 5.761 | IC Value : 79.96Volume : 6 | Issue : 3 | - 2017March
518 | PARIPEX - INDIAN JOURNAL OF RESEARCH

to 2014-15, and the effective kilometers increased only by 68% over the same period.
I) EARNINGS PER KILOMETER (EPKM)Revenue in absolute term without reference to kilometer, hence it does not correctly re�ect the Pro�tability of the operation. EPKM is one of the useful parameter to indicate the earning potential of a route/depot/division/organization. The EPKM is related to the carrying capacity of the buses, fare structure and the earning potential of routes. The EPKM is calculated by dividing total earnings by total effective kilometers. For any public transport sector it is desirable to earn higher the EPKM for better �nance management. Making to increasing the revenue is not the easy task for the corporation like NEKRTC, where revenue generation is not done on pro�tability factor. The organization has to operate the schedules in spite of lower earnings and losses some times. But the management can implement techniques to improve the earnings per kilometers by rationalizing the schedules and routes. The Earnings per kilometer is expressed in paisa per kilometer. The Table No.2 exhibits the earnings per kilometer in Rs.
From the table.2it is observed that from 2005-06 to 2014-15 over a period of 10 year EPKM increased from Rs.13.62 to Rs.28.49 which represents 109% increase. Traf�c revenue over a period of 10 years increased from Rs.424.80 crores to Rs.1296.22 crores which represents total growth rate of 205%, and effective kms increased by 68% during the same period of 10 years. In this stage of analysis it is dif�cult to analyze whether the % increase in EPKM is due to operational ef�ciency or due to fare hikes affected during this period to offset the increase in the cost of operation.
Table No. 2: EARNINGS PER KILOMETERS (EPKM)
Source : Annual Administrative Reports.
EARNINGS PER KILOMETERS (EPKM)
Table 2 reveals that EPKM of the corporation has increased every year. During the year 2006-2007 Total traf�c revenue increased by 15.64%, effective Kms increased by 10% and EPKM increased by 5.07% to its previous year EPKM. During 2007-08 traf�c revenue increased by 9.65%, effective kms by 3% and EPKM increased by 6.41% compares to its previous year EPKM. During 2008-09 and 2009-10 �nancial years growth rate traf�c revenue is 9.97% and 17.23% respectively, effective kms increased by 8% and 16%
respectively and of EPKM is 1.94% and 0.75% which are the least growth rate during the tenure of 10 years of study period of 2004-05 to 2014-15. In 2010-11 traf�c revenue increased by 27.89%, effective kms by 12 % and EPKM hiked by 14.23%. In 2011-12 the growth rate of traf�c revenue increased by 18.67%, effective km increased by 4 % and EPKM remains same almost 14%. During the �nancial year 2012-13 traf�c revenue increased by 11.90%, effective kms increased only by 1% and EPKM growth rate is 11.33%. In 2013-14 traf�c revenue is increased by 16.11%, effective kms are increased by 2% and EPKM is raised by 5.07% on its previous year �gure. During the �nancial year 2014-15 traf�c revenue increased by 9.47% and effective kms showing a negative �gure of 1% on its previous �gure and the highest growth rate of EPKM in 10 years is observed in this year is 19%. By seeing the above table it can be concluded that from 2005-06 to 2014-15 over a period of 10 year EPKM increased from Rs.13.62 to Rs.28.49 which represents 109% increase. Tra�ce revenue over a period of 10 years increased from 424.80 crores to 1296.22 crores which represents total growth rate of 205%, and effective kms increased by 68% during the same period of 10 years. In this stage it is dif�cult to analyze whether the % increase in EPKM is due to operational ef�ciency or due to fare hikes affected during this period to offset the increase in the cost of operation.
(I) Margin per kilometer (MPKM)Margin per kilometer refers to the difference between the EPKM and CPKM for a particular period. In simple words it the pro�t or loss margin after operating the shedues by the public transport corporation. It is also stated as the difference between the total earnings and total cost distributed by the total kilometers. It is one of the most powerful technique for analyzing the �nancial performance in public sector like NEKRTC, which easily exhibits the status of �nancial condition. It is desirable to have higher EPKM over to CPKM for better �nancial conditions of the organization. But being a state run public transportation it is dif�cult for NEKRTC to have higher EPKM over to CPKM. Hence various routes and schedules are operated in the interest of public to facilitate to travel one place to other place. NEKRTC is public transport corporation and it can't expect pro�t on every route/schedule. It is dif�cult but also possible to earn the pro�t in each route provided the routes are scienti�cally established. In few cases it may not be totally possible to get pro�t margin but lot of scope is there for improvisation in the traf�c management to get higher margin in EPKM over to CPKM.
Table No. 3: MARGIN PER KILOMETR (MPKM)
Source : Annual Administrative Reports.
MARGIN PER KILOMETER. (MPKM)
In Table No. 1 and Table No.2 detailed analysis is done on most important �nancial parameters of NEKRTC, CPKM and EPKM. It is necessary to understand the margin between these two factors which is important to analyze the �nancial sustainability in longer
YEAR 2005-06
2006-07
2007-08
2008-09
2009-10
2010-11
2011-12
2012-13
2013-14
2014-15
Traf�c Revenue (Rs. In crores)
367.35
424.80
465.80
512.25
600.49
767.95
911.33
1019.75
1184.04
1296.22
Changes in %
- 15.64
9.65 9.97 17.23
27.89
18.67
11.90
16.11
9.47
Effective Kms (in crores)
26.95
29.66
30.56
32.97
38.36
42.95
44.66
44.88
45.76
45.48
Changes in %
- 10 3 8 16 12 4 1 2 -1
EPKM ( in Rs.) 13.62
14.32
15.24
15.53
15.65
17.88
20.40
22.72
23.87
28.49
Changes in %
- 5.07 6.41 1.94 0.75 14.23
14.12
11.33
5.07 19.36 YEAR 2005
-062006-07
2007-08
2008-09
2009-10
2010-11
2011-12
2012-13
2013-14
2014-15
EPKM (in Rs.)
13.62
14.32
15.24
15.53
15.65
17.88
20.04
22.72
23.87
28.49
CPKM ( in Rs.)
15.68
16.49
17.12
17.89
18.17
20.41
22.36
25.72
29.51
32.40
MPKM ( in Rs.)
-2.06 -2.17
-1.88
-2.36
-2.52
-2.53
-1.96
-3 -5.64
-3.91
ISSN - 2250-1991 | IF : 5.761 | IC Value : 79.96Volume : 6 | Issue : 3 | - 2017March
PARIPEX - INDIAN JOURNAL OF RESEARCH | 519
period. In 2005-06 and 2006-07 margin per kilometer is -2.06 and -2.17 respectively. During the �nancial year 2007-08 MPKM is -1.88, which shows improved �gure compared to 2005-06 and 2006-07. In the �nancial year 2008-09 the gap between EPKM and CPKM is further increased which represents -2.36. During the �nancial year 2009-10 and 2010-11 MPKM represents -2.52 and -2.53 respectively. In the �nancial year 2011-12 and 2012-13 MPKM represents -1.96 and -3 respectively. Again in 2013-14 and 2014-15 also MPKM is showing negative �gures representing -5.64 and -3.91. During a period of 10 years margin per kilometer is showing negative �gures, from the table it can be analyzed that always cost per kilometer is higher than the earnings per kilometer, which indirectly leads to accumulate the loss every year.
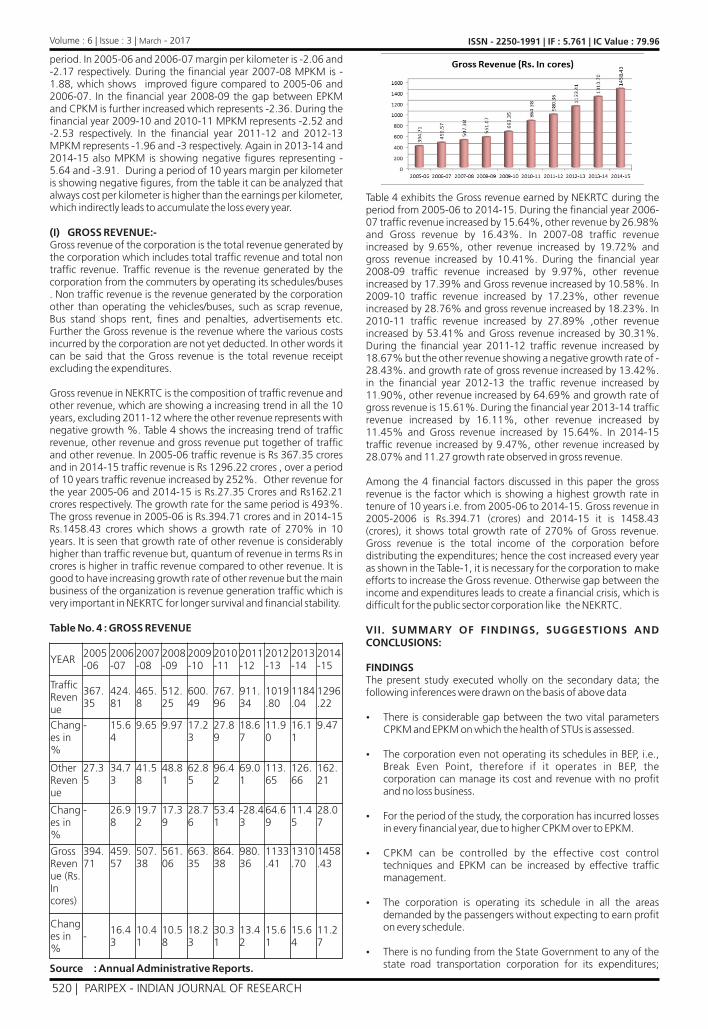
(I) GROSS REVENUE:-Gross revenue of the corporation is the total revenue generated by the corporation which includes total traf�c revenue and total non traf�c revenue. Traf�c revenue is the revenue generated by the corporation from the commuters by operating its schedules/buses . Non traf�c revenue is the revenue generated by the corporation other than operating the vehicles/buses, such as scrap revenue, Bus stand shops rent, �nes and penalties, advertisements etc. Further the Gross revenue is the revenue where the various costs incurred by the corporation are not yet deducted. In other words it can be said that the Gross revenue is the total revenue receipt excluding the expenditures. Gross revenue in NEKRTC is the composition of traf�c revenue and other revenue, which are showing a increasing trend in all the 10 years, excluding 2011-12 where the other revenue represents with negative growth %. Table 4 shows the increasing trend of traf�c revenue, other revenue and gross revenue put together of traf�c and other revenue. In 2005-06 traf�c revenue is Rs 367.35 crores and in 2014-15 traf�c revenue is Rs 1296.22 crores , over a period of 10 years traf�c revenue increased by 252%. Other revenue for the year 2005-06 and 2014-15 is Rs.27.35 Crores and Rs162.21 crores respectively. The growth rate for the same period is 493%. The gross revenue in 2005-06 is Rs.394.71 crores and in 2014-15 Rs.1458.43 crores which shows a growth rate of 270% in 10 years. It is seen that growth rate of other revenue is considerably higher than traf�c revenue but, quantum of revenue in terms Rs in crores is higher in traf�c revenue compared to other revenue. It is good to have increasing growth rate of other revenue but the main business of the organization is revenue generation traf�c which is very important in NEKRTC for longer survival and �nancial stability.
Table No. 4 : GROSS REVENUE
Source : Annual Administrative Reports.
Table 4 exhibits the Gross revenue earned by NEKRTC during the period from 2005-06 to 2014-15. During the �nancial year 2006-07 traf�c revenue increased by 15.64%, other revenue by 26.98% and Gross revenue by 16.43%. In 2007-08 traf�c revenue increased by 9.65%, other revenue increased by 19.72% and gross revenue increased by 10.41%. During the �nancial year 2008-09 traf�c revenue increased by 9.97%, other revenue increased by 17.39% and Gross revenue increased by 10.58%. In 2009-10 traf�c revenue increased by 17.23%, other revenue increased by 28.76% and gross revenue increased by 18.23%. In 2010-11 traf�c revenue increased by 27.89% ,other revenue increased by 53.41% and Gross revenue increased by 30.31%. During the �nancial year 2011-12 traf�c revenue increased by 18.67% but the other revenue showing a negative growth rate of -28.43%. and growth rate of gross revenue increased by 13.42%. in the �nancial year 2012-13 the traf�c revenue increased by 11.90%, other revenue increased by 64.69% and growth rate of gross revenue is 15.61%. During the �nancial year 2013-14 traf�c revenue increased by 16.11%, other revenue increased by 11.45% and Gross revenue increased by 15.64%. In 2014-15 traf�c revenue increased by 9.47%, other revenue increased by 28.07% and 11.27 growth rate observed in gross revenue.
Among the 4 �nancial factors discussed in this paper the gross revenue is the factor which is showing a highest growth rate in tenure of 10 years i.e. from 2005-06 to 2014-15. Gross revenue in 2005-2006 is Rs.394.71 (crores) and 2014-15 it is 1458.43 (crores), it shows total growth rate of 270% of Gross revenue. Gross revenue is the total income of the corporation before distributing the expenditures; hence the cost increased every year as shown in the Table-1, it is necessary for the corporation to make efforts to increase the Gross revenue. Otherwise gap between the income and expenditures leads to create a �nancial crisis, which is dif�cult for the public sector corporation like the NEKRTC.
VII. SUMMARY OF FINDINGS, SUGGESTIONS AND CONCLUSIONS:
FINDINGSThe present study executed wholly on the secondary data; the following inferences were drawn on the basis of above data
Ÿ There is considerable gap between the two vital parameters CPKM and EPKM on which the health of STUs is assessed.
Ÿ The corporation even not operating its schedules in BEP, i.e., Break Even Point, therefore if it operates in BEP, the corporation can manage its cost and revenue with no pro�t and no loss business.
Ÿ For the period of the study, the corporation has incurred losses in every �nancial year, due to higher CPKM over to EPKM.
Ÿ CPKM can be controlled by the effective cost control techniques and EPKM can be increased by effective traf�c management.
Ÿ The corporation is operating its schedule in all the areas demanded by the passengers without expecting to earn pro�t on every schedule.
Ÿ There is no funding from the State Government to any of the state road transportation corporation for its expenditures;
YEAR 2005-06
2006-07
2007-08
2008-09
2009-10
2010-11
2011-12
2012-13
2013-14
2014-15
Traf�c Revenue
367.35
424.81
465.8
512.25
600.49
767.96
911.34
1019.80
1184.04
1296.22
Changes in %
- 15.64
9.65 9.97 17.23
27.89
18.67
11.90
16.11
9.47
Other Revenue
27.35
34.73
41.58
48.81
62.85
96.42
69.01
113.65
126.66
162.21
Changes in %
- 26.98
19.72
17.39
28.76
53.41
-28.43
64.69
11.45
28.07
Gross Revenue (Rs. In cores)
394.71
459.57
507.38
561.06
663.35
864.38
980.36
1133.41
1310.70
1458.43
Changes in %
- 16.43
10.41
10.58
18.23
30.31
13.42
15.61
15.64
11.27
ISSN - 2250-1991 | IF : 5.761 | IC Value : 79.96Volume : 6 | Issue : 3 | - 2017March
520 | PARIPEX - INDIAN JOURNAL OF RESEARCH

therefore, the survival of the corporation is completely depended on the traf�c revenue and other miscellaneous revenue from its operations.
Ÿ Gross revenue of the corporation is showing an increasing trend, which has grown up by 5 times of its value in between 2005-06 to 2015-16.
SUGGETIONSAs already discussed above the North East Karnataka Road Transportation corporation is independent unit among the various Karnataka state public sectors. Public Transport Undertakings in Karnataka are �nancially independent and have to manage all its expenditures by way of traf�c revenue. Therefore for the longer survival and continuity of the corporation is completely depended on its management decision to increase the revenue to meet breakeven point. From the above analysis and �ndings the following are some of the major suggestions offered for betterment of the corporation.
Ÿ Cost cut down policy has to be implemented strictly , for those factors which contributes major part of CPKM, such as staff cost controlling by avoiding unnecessary overtime schedules, operating complete schedule without cancellation, rationalization of schedules, cost control technique in HSD management, Fuel Management and Tyres management etc to be implemented by the management.
Ÿ Identifying the potential market of the passengers and operating the schedules in a single goal to carry each needy passenger from one place to another place, avoiding overlapping of timings from bus stands,.
Ÿ The corporation need to convert the loss making schedules to break even schedules to avoid �nancial crises.
Ÿ Optimum utilization of vehicles makes the corporation to accumulate traf�c revenue.
CONCLUSION:From the above data the study, it can be concluded with the remarks that NEKRTC is making its efforts to generating traf�c revenue, further it has to emphasize more on route cancellation and cost control. It is seen in the history of the corporation that identi�cation of new routes is always pro�table if the same is done on the proper analysis and justi�cation. Political interference in recommending of implementation of routes/schedule is unavoidable in the state road public sector, but it is always better to be done with proper analysis of routes and passenger strength. Though the revenue generation is not the primary objective of the state transport unit, but the corporation like NEKRTC, it cannot be run only with the social objectives of service providing to the commuters, especially when the corporation has to meet its expenditures on its own business.
References:01. Prasad, Srinivas, T, and Khan, M.A.A., (1966), “Impact of Social Obligations on the
Financial Performance of SRTUS: A case study of APSRTC”, Indian Journal of Transport Management, 20(6), pp. 406-418
02. Shambhag, A.R., (1972), “Problems of B.E.S.T. Bus Service”, Transport, vol.22, pp.17-18.
03. Venkaji Rao, L.C., (1974), “Management of State Transport Undertakings” in D.M. Nanjundappa (Ed), Transport Planning and Finance, pp. 379-392.
04. Jakaria, (1975), “Analysis of Urban Transportation Criteria”, Transportation Engineering, Journal (17), pp.114-96
05. Pereira, W., (1975), “Leakage of Revenue in Metropolitan Transport Organization”, Mobile, pp. 7-9.
06. Sankaraiah, V.V., Subramanya Sarma, (1985), “Urban Transportation by Andhra Pradesh State Road Transport Corporation – A Depot level performance”. D. Panduranga Rao (Ed) Problems of Transport in India, Inter India Publications, New Delhi
07. . Govinda Rajan, (1988), “A study of Development and Performance of SLPES in Andhra Pradesh”, Institute Public Enterprise Journal, p.78.
08. Lau, Joseph Cho-yam, (1997), “The performance of Public Transport Operations, Land use and Urban Transport Plans in Hong Kong, Cities, Vol.14, No.3, pp.145-153
09. Gore, M.L., (1997), “Strategy for Minimizing Vehicle Breakdowns in Transport Undertakings” Indian Journal of Transport Management, volume 29, Number 9, p.545
10. Gunadam Rajeswari : “ Public Sector Performance of State Road Transport Corporation, A case study of Andrapradesh,1998
Cleaner Air and Better Transport in Cities - Making Informed Choices11. by Tata Energy Research Institute (TERI) (2000)12. Public Sector Bus Transport in India in the New Millennium A Historical Perspective
by M K Thomas, (2000) Design and Appraisal of Rural Transport Infrastructure - Ensuring Basic Access for
Rural Communities13. by Jerry Lebo & Dieter Schelling, for the WORLD BANK (2001)14. Kharola, P.S. : Reducing the cost of Revenue Collection: an option available to the
STUs.Indian Journal of Transport Management. 200115. Transport Concepts in European Cities by Tim Pharoah, Dieter Ape (2002)16. Kharola, P.S. : “Reforms in the public transport – a systems approach”, Proceedings
of CODATU X Conference, Lomé (Togo), 12-15 November 2002,17. . Pradeep Singh Kharola, (2004), “The High Capacity Urban Bus: Pre-requisites and
Advantages”, Indian Journal of Transport Management, Vol.28, p.206.Bhasker, G. & N. V Ramana Murthy, (2004), “Arti�cial Neural Net work: An Ef�cient to simulate the pro�tability of State Transport Undertakings. Indian Journal of Transport Management
18. The Best Transport System in the World by M.H Rose , B.E. Seely, P.F Barrett – The Ohio State University Press(2006)
19. Transit Villages in the 21st Century by Michael Bernick, Robert Cervero (2007)20. Kharola, P.S. : "Financing Urban Public Transport". Urban Transport Journal 200821. The Geography of Urban Transportation by Susan Hanson (2010)22. Towards Coordinated Urban Transport Planning In India By Om Praksh Agarwal and
Ishita Chauhan (2010)23. Prashant Kakade, (2010), “Impact Assessment of the withdrawal of the Daily Pass
System: A Case Study of Bangalore Metropolitan Corporation”, Indian Journal of Transport Management,
24. Transport Policy and the Environment by David Banister (2010)25. Prabhu D.B. & Satish Hegde, (2011), “Management Control System in Public
Transport: An Objective Study of Karnataka State Road Transport Corporation”, Indian Journal of Transport Management
26. Singh, S.K.(2012) Urbanization and Urban Transport in India: The sketch for a policy.
27. K.Kockelman, D.Chen, K Larsen, B Nichols – The University of Texas (2013)The Economics of Transportation System : A reference for practitioners .
28. Annual Financial Reports and Annual Administrative Reports of NEKRTC, for the period of 2004-05 to 2015-2016
ISSN - 2250-1991 | IF : 5.761 | IC Value : 79.96Volume : 6 | Issue : 3 | - 2017March
PARIPEX - INDIAN JOURNAL OF RESEARCH | 521