financial results/media/files/t/topaz/attachments/pdfs/... · financial results. for the period...
TRANSCRIPT

Financial ResultsFor the Period Ending 31 December 2017Investor Call, 26 March 2018

Page 2Page 2
Any information in this presentation that is not a historical fact is a “forward-looking statement”. Suchstatements may include opinions and expectations regarding Topaz Energy and Marine ( the ‘Company’)and its future business, Management’s confidence and strategies as well as details of Management’sexpectations of global economic and regulatory trends.
Such forward-looking statements involve known and unknown risks, uncertainties and other importantfactors beyond the Company's and/or its Management control that could cause the actual results,performance or achievements of the Company to be materially different from future results, performanceor achievements expressed or implied by such forward-looking statements. While the Company believesthat its assumptions concerning future events are reasonable, there are inherent difficulties in predictingcertain important factors that could impact the future performance or results of the Company’s business.Accordingly, such statements should not be regarded as representations as to whether such anticipatedevents will occur nor that expected objectives will be achieved. The Company expressly disclaims anyintention or obligation to revise or update any forward-looking statements, whether as a result of newinformation, future events, or otherwise.
In this presentation, the Company makes reference to EBITDA and EBITDA margin, neither of which isdefined under International Financial Reporting Standards, as issued by the International AccountingStandards Board and as adopted by the European Union (“IFRS”). The items excluded from EBITDA andEBITDA margin are significant in assessing the Company’s operating results and liquidity. EBITDA andEBITDA margin have limitations as analytical tools and should not be considered in isolation from, or as asubstitute for, analysis of the Company’s results as reported under IFRS. Other companies in theCompany’s industry and in other industries may calculate EBITDA and EBITDA margin differently from theway that the Company does, limiting their usefulness as comparative measures.
DISCLAIMER

Page 3Page 3
Brent remains stable in the mid to high US$60’s per barrel
Oil supply/demand is getting closer to an equilibrium
Projects are being sanctioned across markets, and sentiments are rapidly changing with supermajors posting higher profits in 4Q2017 and confirming/increasing CAPEX guidance for 2018* (examples: Exxon +4%, BP +3%, ENI +1%, Shell +1%, Total unchanged)
Subsea and offshore wind installations are on the rise across the Atlantic basin
Global OSV market utilisation has stabilised at ~50%, and the cycle has bottomed
MACRO VIEW
E&P news
OSV news
OSV tender activity is slowly improving
Adjustment of the supply overhang will be required for substantial market improvement; most of the ~30% of the global fleet which is currently laid-up is not expected to return to market
Several companies have gone through restructuring
An increase in resale transactions and M&A activity is expected. Industry consolidation is required and will come
Topaz is evaluating options to position ourselves best for future growth and to maximise value for our shareholders
* Compared to 2017 actual CAPEX spend Source: Pareto Securities, Thomson Reuters

Page 4
TOPAZ’S 2017 IN A NUTSHELL (1/2)
Core fleet utilization was stable with a strong safety record – two years without LTIsSeven vessels were reactivated from layup during the year; only five remainingCost focus yielded further results with US$20m year-on-year savings in 2017 vs. 2016, in addition to the US$40m reduction achieved in 2016 (year-on-year compared with 2015)Investment in systems continued, supporting vessel maintenance, safety, technical and customer relationship managementCrew training, competency programs and localization efforts continuedFleet renewal/optimization program progressed
Continued execution of our strategy in a challenging environment
Steady, industry-leading backlog (US$1.5b end December) underlining our ability to win new contracts continuouslyTendering activity showed a positive trend and will provide improved business conditionsOur positive outlook for Africa remains, as performance has been turned aroundWe leveraged client relationships in new markets (Exxon, Chevron, Total, BP) and continued exploring broader marine logistics offerings
Continued execution of our strategy Operational excellence

Page 5
TOPAZ’S 2017 IN A NUTSHELL (2/2)Continued execution of our strategy in a challenging environment
First two ships commenced operation in 2017, six months ahead of schedule
Project ramp-up remained on track for Q2 2018; 10 vessels have been delivered so far
Healthy US$78m cash balance as of 31 Dec 2017Proactively revised covenant thresholds in December for the senior secured facility, while staying within previous thresholdsContinued our relentless focus on optimizing cash managementSupportive shareholders (parent company debt repayment deferred)
Focus on liquidity Tengiz - Topaz Solutions

INDUSTRY LEADING BACKLOGLeading US$1.5bn contract backlog underpins revenue visibility
Source: Company data.1 Backlog consists of estimated revenue from the uncompleted portion of all vessel charter contracts, based on day rates and assumingextension of contracts at the option of our clients.
…provides high revenue visibility long term (Q4 2017 US$m)
Robust historical contract backlog evolution1… (US$bn)
0.9 1.2
1.0 0.7
1.5 1.5
2012 2013 2014 2015 2016 Q1 2017Q4 2017
45%
38%
4%
4%
$21
$288$342 $338
$134
$21
$29 $23
$116
$182
2017(Dec) 2018 2019 2020 2021 2022 & beyond
Firm Option
Firm $1,140Option $372Total $1,512
7%
Key Highlights:
Proven ability to secure contracts in challenging operating conditions
Focus on development and production phases of the energy cycle underpins revenue stability
2017 included two major contract wins:
5-year contract (plus options) for 6 vessels in TurkmenistanLong-term contracts for the in Africa fleet
Page 7Page 71Inlcudes US$20m of one-off charges incurred during HY bond refinancing
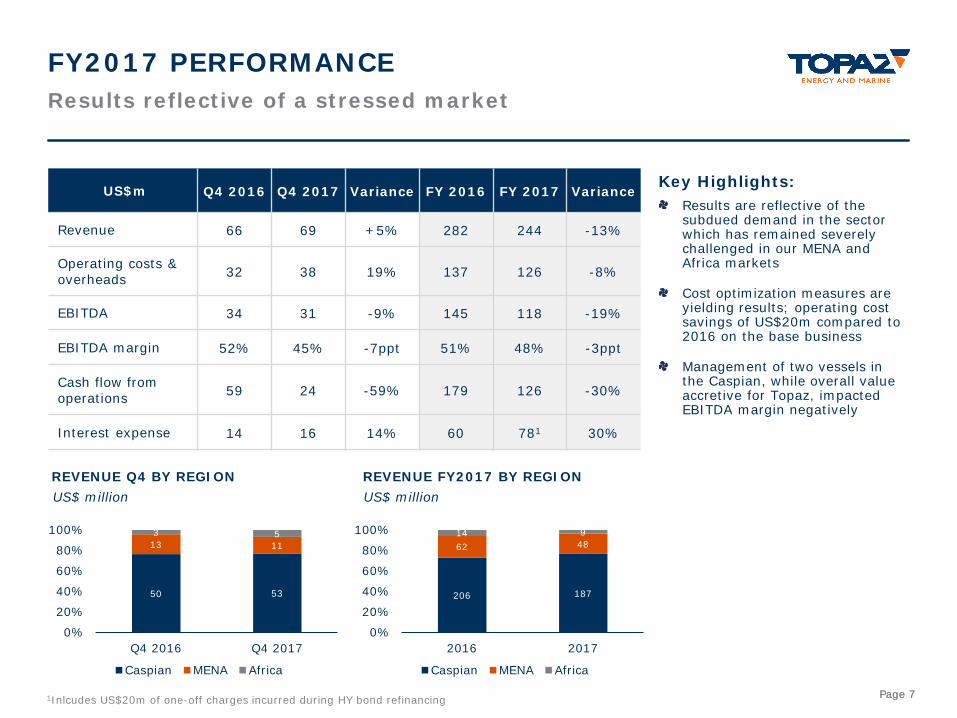
Key Highlights:Results are reflective of the subdued demand in the sector which has remained severely challenged in our MENA and Africa markets
Cost optimization measures are yielding results; operating cost savings of US$20m compared to 2016 on the base business
Management of two vessels in the Caspian, while overall value accretive for Topaz, impacted EBITDA margin negatively
Results reflective of a stressed marketFY2017 PERFORMANCE
US$m Q4 2016 Q4 2017 Variance FY 2016 FY 2017 Variance
Revenue 66 69 +5% 282 244 -13%
Operating costs & overheads 32 38 19% 137 126 -8%
EBITDA 34 31 -9% 145 118 -19%
EBITDA margin 52% 45% -7ppt 51% 48% -3ppt
Cash flow from operations 59 24 -59% 179 126 -30%
Interest expense 14 16 14% 60 781 30%
50 53
13 113 5
0%
20%
40%
60%
80%
100%
Q4 2016 Q4 2017
Caspian MENA Africa
206 187
62 4814 9
0%
20%
40%
60%
80%
100%
2016 2017
Caspian MENA Africa
US$ millionREVENUE Q4 BY REGION
US$ millionREVENUE FY2017 BY REGION
Page 8Page 8
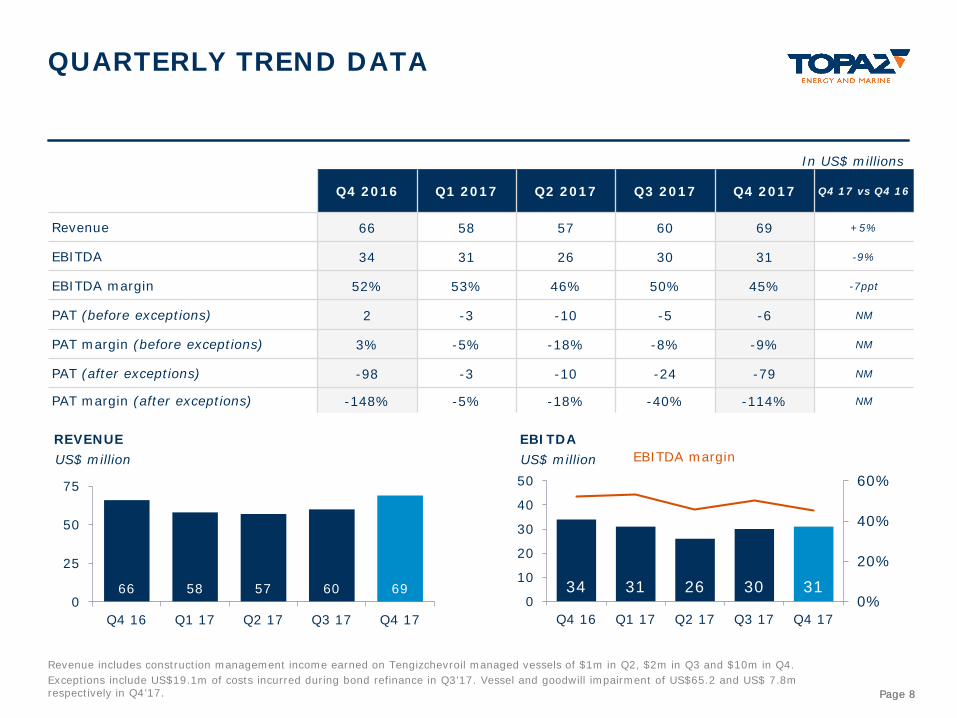
QUARTERLY TREND DATA
Q4 2016 Q1 2017 Q2 2017 Q3 2017 Q4 2017 Q4 17 vs Q4 16
Revenue 66 58 57 60 69 +5%
EBITDA 34 31 26 30 31 -9%
EBITDA margin 52% 53% 46% 50% 45% -7ppt
PAT (before exceptions) 2 -3 -10 -5 -6 NM
PAT margin (before exceptions) 3% -5% -18% -8% -9% NM
PAT (after exceptions) -98 -3 -10 -24 -79 NM
PAT margin (after exceptions) -148% -5% -18% -40% -114% NM
In US$ millions
66 58 57 60 690
25
50
75
Q4 16 Q1 17 Q2 17 Q3 17 Q4 17
US$ millionREVENUE
34 31 26 30 310%
20%
40%
60%
0
10
20
30
40
50
Q4 16 Q1 17 Q2 17 Q3 17 Q4 17
US$ millionEBITDA
EBITDA margin
Revenue includes construction management income earned on Tengizchevroil managed vessels of $1m in Q2, $2m in Q3 and $10m in Q4.Exceptions include US$19.1m of costs incurred during bond refinance in Q3’17. Vessel and goodwill impairment of US$65.2 and US$ 7.8mrespectively in Q4’17.
Page 9Page 9
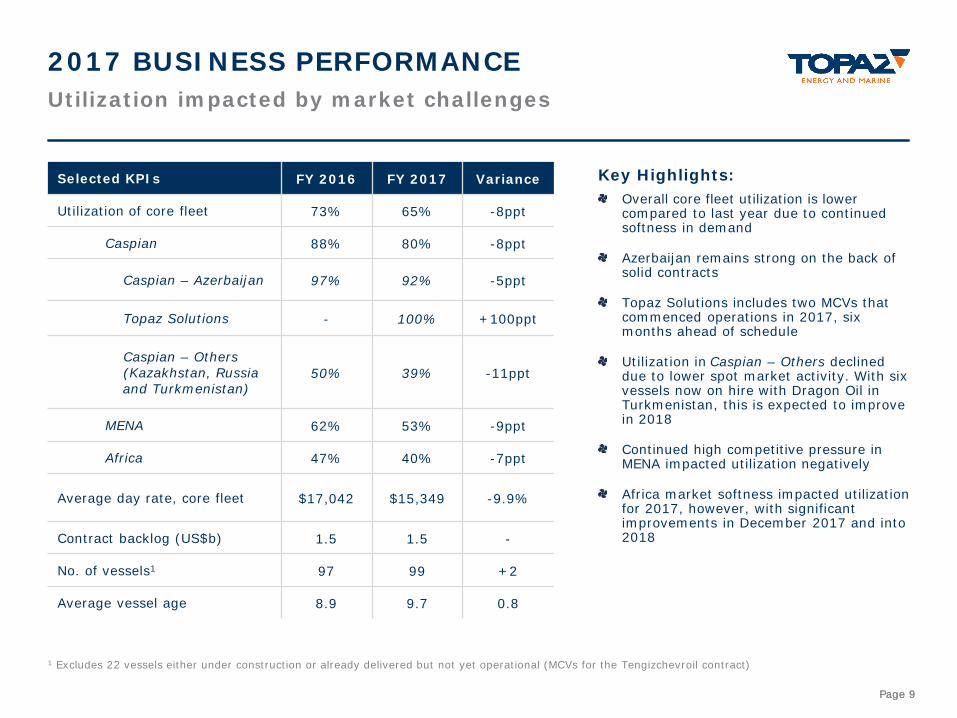
1 Excludes 22 vessels either under construction or already delivered but not yet operational (MCVs for the Tengizchevroil contract)
Utilization impacted by market challenges2017 BUSINESS PERFORMANCE
Key Highlights:Overall core fleet utilization is lower compared to last year due to continued softness in demand
Azerbaijan remains strong on the back of solid contracts
Topaz Solutions includes two MCVs that commenced operations in 2017, six months ahead of schedule
Utilization in Caspian – Others declined due to lower spot market activity. With six vessels now on hire with Dragon Oil in Turkmenistan, this is expected to improve in 2018
Continued high competitive pressure in MENA impacted utilization negatively
Africa market softness impacted utilization for 2017, however, with significant improvements in December 2017 and into 2018
Selected KPIs FY 2016 FY 2017 Variance
Utilization of core fleet 73% 65% -8ppt
Caspian 88% 80% -8ppt
Caspian – Azerbaijan 97% 92% -5ppt
Topaz Solutions - 100% +100ppt
Caspian – Others(Kazakhstan, Russia and Turkmenistan)
50% 39% -11ppt
MENA 62% 53% -9ppt
Africa 47% 40% -7ppt
Average day rate, core fleet $17,042 $15,349 -9.9%
Contract backlog (US$b) 1.5 1.5 -
No. of vessels1 97 99 +2
Average vessel age 8.9 9.7 0.8
Page 10Page 10
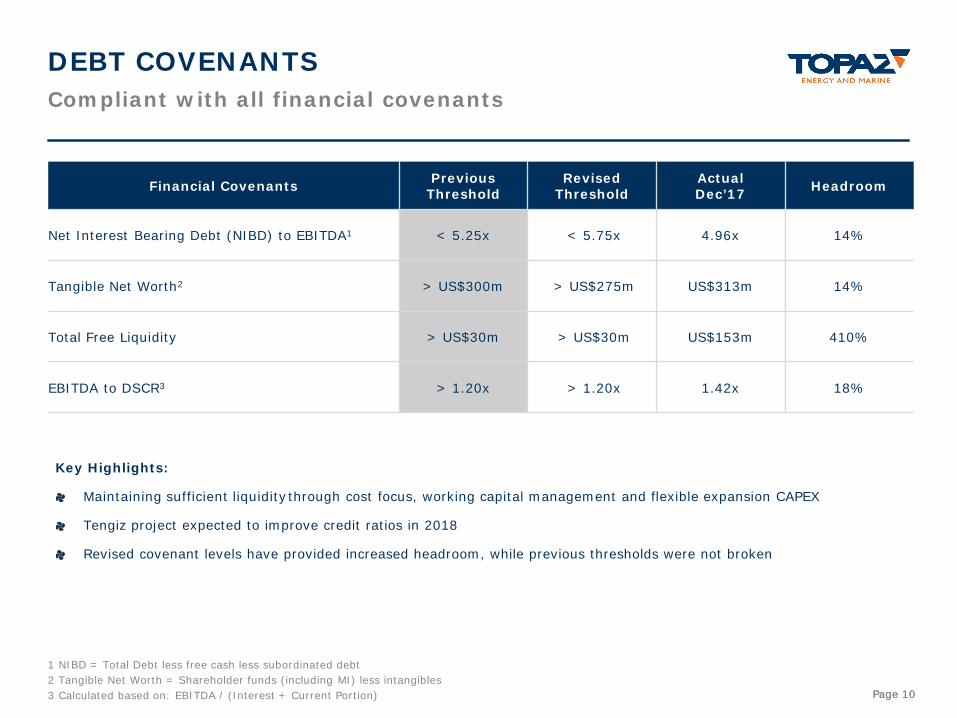
1 NIBD = Total Debt less free cash less subordinated debt2 Tangible Net Worth = Shareholder funds (including MI) less intangibles3 Calculated based on: EBITDA / (Interest + Current Portion)
Compliant with all financial covenantsDEBT COVENANTS
Key Highlights:
Maintaining sufficient liquidity through cost focus, working capital management and flexible expansion CAPEX
Tengiz project expected to improve credit ratios in 2018
Revised covenant levels have provided increased headroom, while previous thresholds were not broken
Financial Covenants Previous Threshold
Revised Threshold
ActualDec’17 Headroom
Net Interest Bearing Debt (NIBD) to EBITDA1 < 5.25x < 5.75x 4.96x 14%
Tangible Net Worth2 > US$300m > US$275m US$313m 14%
Total Free Liquidity > US$30m > US$30m US$153m 410%
EBITDA to DSCR3 > 1.20x > 1.20x 1.42x 18%

Page 11Page 11
Strong focus on LiquidityLIQUIDITY POSITION AS OF 31 DEC 2017
US$m Limit Drawn Available Tenor
RCF (committed lines) 100 25 75 Expires April 2020
Cash & Bank Balances - - 78 As of 31st December 2017
Total Liquidity 153
Key Highlights:
Drew US$25m on our RCF during Q4 as a proactive measure to ensure access to short term liquidity; cash remained on our bank accounts throughout the period

Page 12Page 12
*IMCA Safety Statistics for 2016, published in June 2017.
Topaz has now operated for TWO YEARS without any LTI!
Management vessel visits ratio (MVR), trended upwards from end Q3 and throughout Q4 2017
High levels of reporting and awareness indicate a mature safety culture
Topaz has been LTI-free for 2 years!QHSSE PERFORMANCE
0.000.000.000.00
0.200.20
0.58
1.12
0.0
0.2
0.4
0.6
0.8
1.0
1.2
Q3Q2Q1Q4Q3Q2Q1
Industry benchmark = 0.43*
0.880.860.86
0.21
0.81
1.41
1.74
2.42
0.0
0.5
1.0
1.5
2.0
2.5
Industry benchmark = 1.81*
Lost Time Injury Frequency (LTIf – 12 months rolling)
Total Recordable Injury Rate (TRIR – 12 months rolling)
Comments
Q4
Q3Q2Q1Q4Q3Q2Q1 Q4