financial long range planning dr. bruce capron honeoye falls – lima central school district...
TRANSCRIPT

Financial Long Range Planning
Dr. Bruce CapronHoneoye Falls – Lima Central School District
Livonia Central School District

Overview
Present a model budget Identify key drivers of budget increases Generate forecasts Consider reserve spending and
sustainability Simulate the impact of changes over five
years Summarize

Purpose of Multi-year Budgeting
Generate focus on the things that matter.
Make common sense of the obvious.
Understand how today’s decisions propagate forward.
Anticipate icebergs.
Plan soft landings
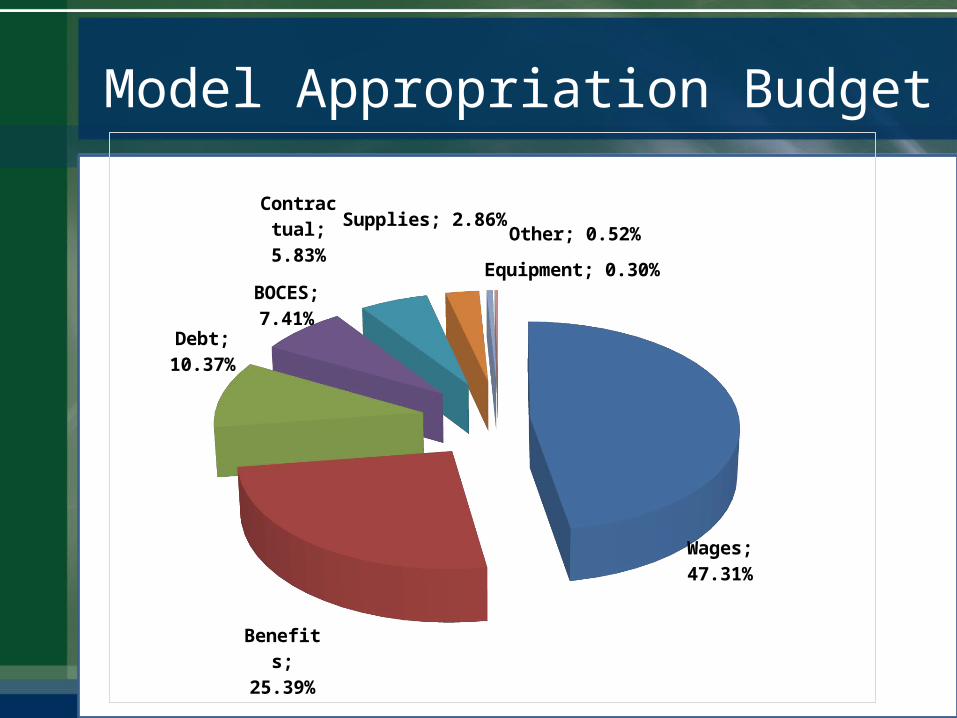
Model Appropriation Budget
Wages; 47.31%
Benefits; 25.39%
Debt; 10.37%
BOCES; 7.41%
Con-tractual;
5.83%Supplies; 2.86%
Other; 0.52%
Equipment; 0.30%

Size and Sensitivity
Budget Component
Percent of Budget
Change Impact on Budget
Required Increase in
LevyWages 47% 2% 0.94% 1.62%
Health Care 12.2% 8% 0.97% 1.68%
Debt Service 10.4% 1% 0.10% 0.18%Contractual + BOCES Expenses 8.3% 1% 0.08% 0.14%
TRS Pension 6.0% 2 Points 0.73% 1.27%
ERS Pension 2.2% 2 Points 0.21% 0.37%Other Employer Expenses 5.0% 2% 0.10% 0.17%
Energy 2.6% 5% 0.13% 0.22%
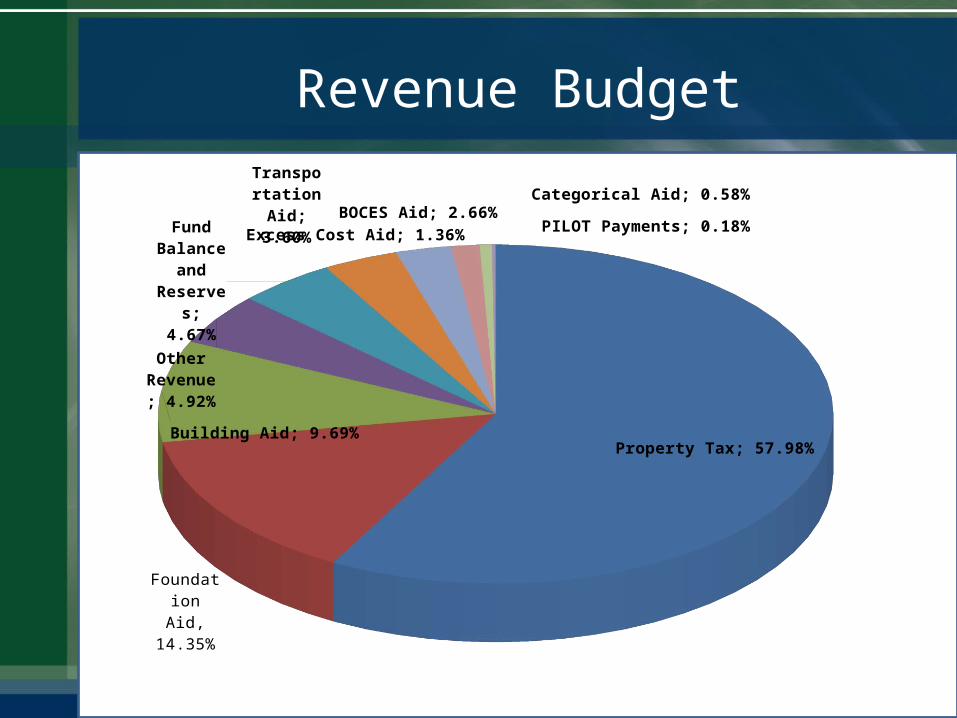
Revenue Budget
Property Tax; 57.98%
Foundation Aid, 14.35%
Building Aid; 9.69%
Other Revenue;
4.92%
Fund Balance and Re-serves; 4.67%
Trans-portation
Aid; 3.60%
BOCES Aid; 2.66%Excess Cost Aid; 1.36%
Categorical Aid; 0.58%
PILOT Payments; 0.18%

Revenue Budget
Property Tax; 57.98%
Foundation Aid, 14.35%
Building Aid; 9.69%
Other Rev-
enue; 4.92%
Fund Balance and Re-serves; 4.67%
Transportation Aid
BOCES Aid Excess Cost Aid Textbook, Software, Library, Hardware
PILOT Payments; 0.18%

Revenue Assumptions
Expense Driven Aid formulas remain unchanged.
Foundation + GEA Aid increase at 2X the CPI
Jan Feb Mar Apr May Jun Jul Aug Sep Oct Nov Dec0.00%
0.50%
1.00%
1.50%
2.00%
2.50%
3.00%
3.50%
CPI
20122013

Balancing the Budget
1. Gap = Budgeted Revenue + Reserves - Budgeted Expenses
2. What increase in the levy balances the budget?
3. Is this levy increase above the tax cap?
0.25%
0.75%
1.25%
1.75%
2.25%
2.75%
Levy Increase
Tax Cap Limit
Budget Increase
Perc
ent C
hang
e

Salary and Wages

Salaries and Wages
Consider a 2.5% annual wage increase
14-15 15-16 16-17 17-18 18-19
Levy Increase 0.0165653317566756 0.0149982434592269 0.0152832483282598 0.0148991932762118 0.0148930097363623
Tax Cap Limit 0.021634933405384 0.0251625199787012 0.0251615961447265 0.0251606689264575 0.025159778278335
Budget Increase 0.0148114322782486 0.0149594040342751 0.0151066621480497 0.0152531675459986 0.0153988820065604
0.25%
0.75%
1.25%
1.75%
2.25%
2.75%
Perc
ent C
hang
e

Retirements and Breakage
Retire without Rehiring Salary = $ 85,000 TRS = $ 13,813 FICA and Medicare = $ 6,522 Total $105,315
Retire and rehire an early career teacher Salary = $ 40,000 TRS = $ 6,500 FICA and Medicare = $ 3,600 Total $ 49,560
Breakage = $ 55,755

Employee Demographics(Minimal Upcoming Retirements)
1 2 4 5 6 7 8 9 10 11 12 13 14 15 16 17 18 19 20 21 22 23 24 25 26 27 29 30 32 350
2
4
6
8
10
12
14
16
18
20
Years of Service
Teac
her C
ount

Employee Demographics(Significant Upcoming Retirements)
1 2 3 4 5 6 7 8 9 10 11 12 13 14 15 16 17 18 19 20 21 22 23 24 25 26 27 28 29 30 31 320
2
4
6
8
10
12
Years of Experience
Teac
her C
ount

Other Factors
Review enrollment projections and carefully consider whether the position will be replaced.
If you are rehiring for this position:
What experience level is complimentary to your other staff?
Are you seeking second career teachers that have private sector experience?
What hiring practice will smooth annual breakage?

Salary Projections
Project 2.5% wage increase Assume 1.0% savings from breakage
14-15 15-16 16-17 17-18 18-19
Levy Increase 0.00638198559023331
0.00462648814412841
0.0047069951519886 0.00410022986028107
0.00386795759254989
Tax Cap Limit 0.021634933405384 0.0251631526038818 0.0251628617746268 0.0251625672707866 0.0251623117781729
Budget Increase 0.00890669539770408
0.00896024173446681
0.00901363281250119
0.0090668634519001 0.00911992853915222
0.25%
0.75%
1.25%
1.75%
2.25%
2.75%
Perc
ent C
hang
e

Teacher Retirement
System

Teacher Retirement System
TRS Employer Contribution Rate
Normal Rate
15.85%
Expense Rate
0.27%
Group Life Insurance Rate
0.13%
Excess Benefit Plan Rate 0. 0%
16.25%
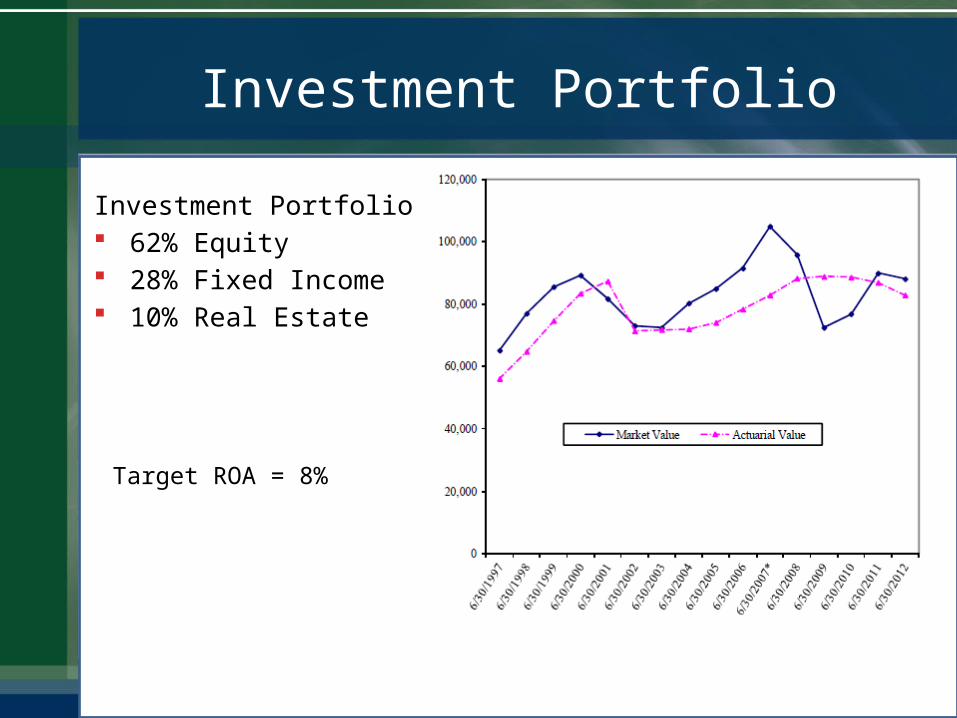
Investment Portfolio
Investment Portfolio 62% Equity 28% Fixed Income 10% Real Estate
Target ROA = 8%

TRS
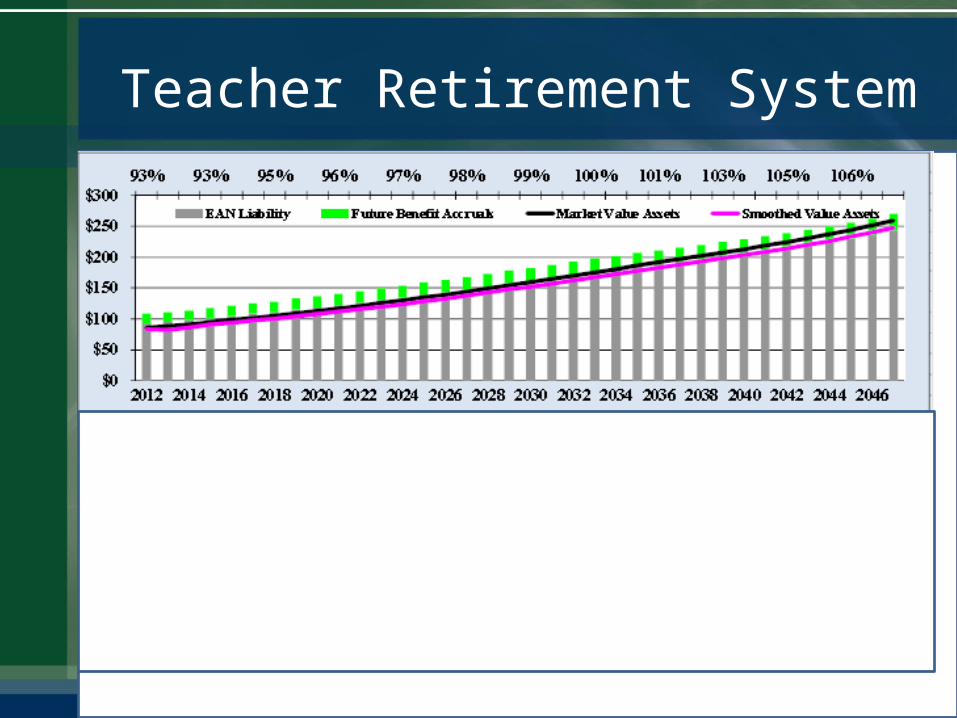
Calculation of Normal Rates
Normal Rate = Total Liabilities – (Assets + Receivables)
Present Value of Future Salaries
Normal Rate = 108.2 billion – (82.8 billion + 3.6 billion)
138.2 billion
Normal Rate = 15.85%

Teacher Retirement System
Teacher Retirement System

Teacher Retirement System
2013-2014 2014-2015 2015-2016 2015-2017 2017-2018 2018-201910.00%15.00%20.00%25.00%30.00%
16.25%
18.25%
18.60%
19.00%
20.00%
25.00%
TRS Rate
14-15 15-16 16-17 17-18 18-19
Levy Increase 0.0295408235236754
0.017384993444476
0.0180312091243687
0.0216287746429795
0.0480042998314389
Tax Cap Limit 0.021634933405384
0.0251617320279464
0.0251606771559874
0.0251596024517162
0.0448794199870425
Budget In-crease
0.0223351738389839
0.0163533832576127
0.0167144458146037
0.0191882089007291
0.0348174972334854
0.50%
1.50%
2.50%
3.50%
4.50%
5.50%
Perc
ent C
hang
e
Teacher Retirement System
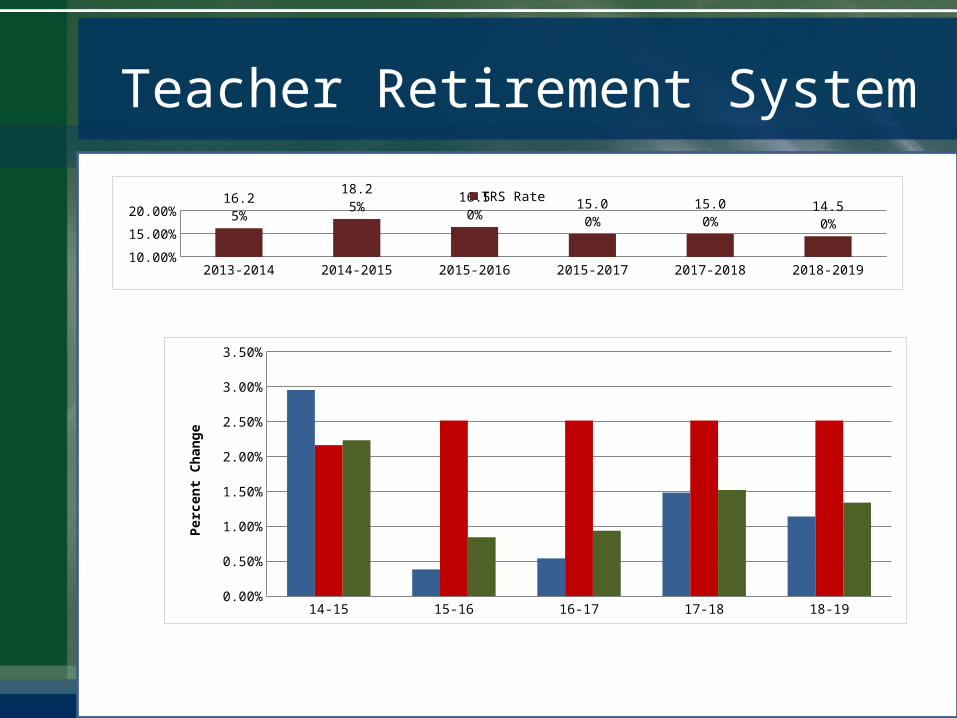
Teacher Retirement System
2013-2014 2014-2015 2015-2016 2015-2017 2017-2018 2018-201910.00%
14.00%
18.00%16.25
%
18.25% 16.50
% 15.00%
15.00%
14.50%
TRS Rate
14-15 15-16 16-17 17-18 18-19
Levy Increase 0.0295408235236754
0.00382081736213266
0.00540576420350486
0.0148163673130363
0.0114135906330638
Tax Cap Limit 0.021634933405384
0.0251617320279464
0.0251614970589161
0.0251611664077385
0.0251602733752714
Budget In-crease
0.0223351738389839
0.00843286260846523
0.00936545297555171
0.0152068936156363
0.013387572844555
0.25%
0.75%
1.25%
1.75%
2.25%
2.75%
3.25%
Perc
ent C
hang
e

Employee Retirement
Pension

ERS Pension
Short Term Fixed Income4%
Government Bonds17%
Corporate Bonds
7%
Domestic Equity35%International Equity
16%
Private Equity9%
Real Estate7%
Other4%
Investment Portfolio
$160 billion 60% Equity 30% Fixed Income 10% Real Estate
• Return of 10.4% (3/13)
• 498,000 Active Members• 381,000 Retirees

Employee Retirement System
2013-2014 2014-2015 2015-2016 2015-2017 2017-2018 2018-201910.00%15.00%20.00%25.00%
21.90%
21.00%
21.00%
21.90%
21.90%
21.90%
ERS Rate (%)
14-15 15-16 16-17 17-18 18-19
Levy Increase 0.0149471430331683
0.0149822971855647
0.0152676034478901
0.0148827741311061
0.0148764167592928
Tax Cap Limit 0.021634933405384
0.0251626196579063
0.0251616953202828
0.0251607675454957
0.0251598764182867
Budget In-crease
0.0138731376863528
0.0149501119083238
0.0150974156431031
0.0152439691011229
0.0153897340064018
0.25%
0.75%
1.25%
1.75%
2.25%
2.75%
Perc
ent C
hang
e

Health Care Costs
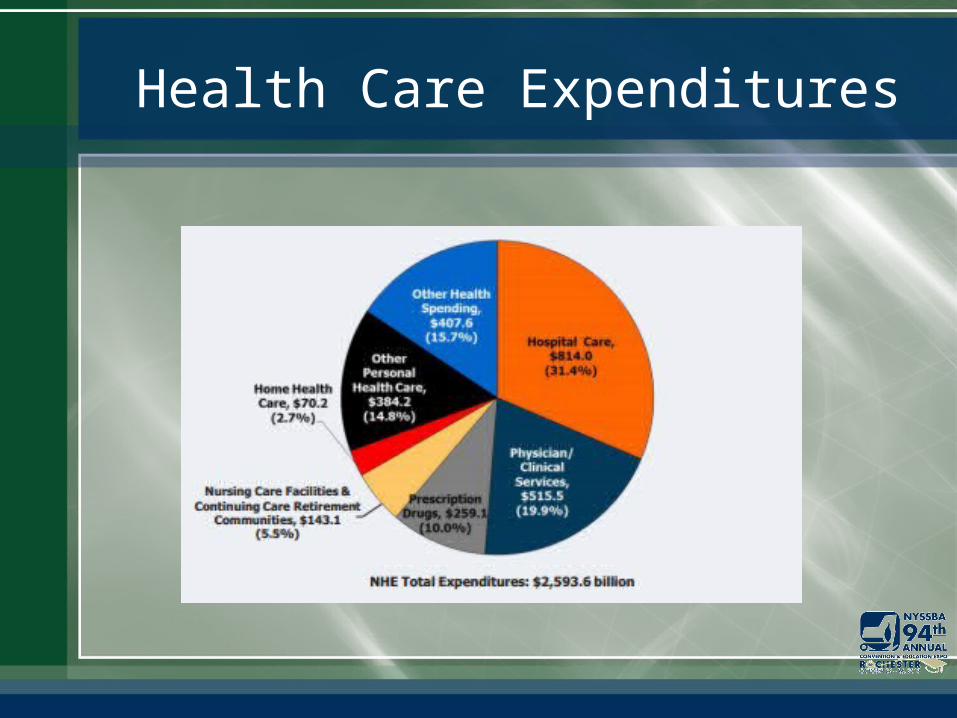
Health Care Expenditures
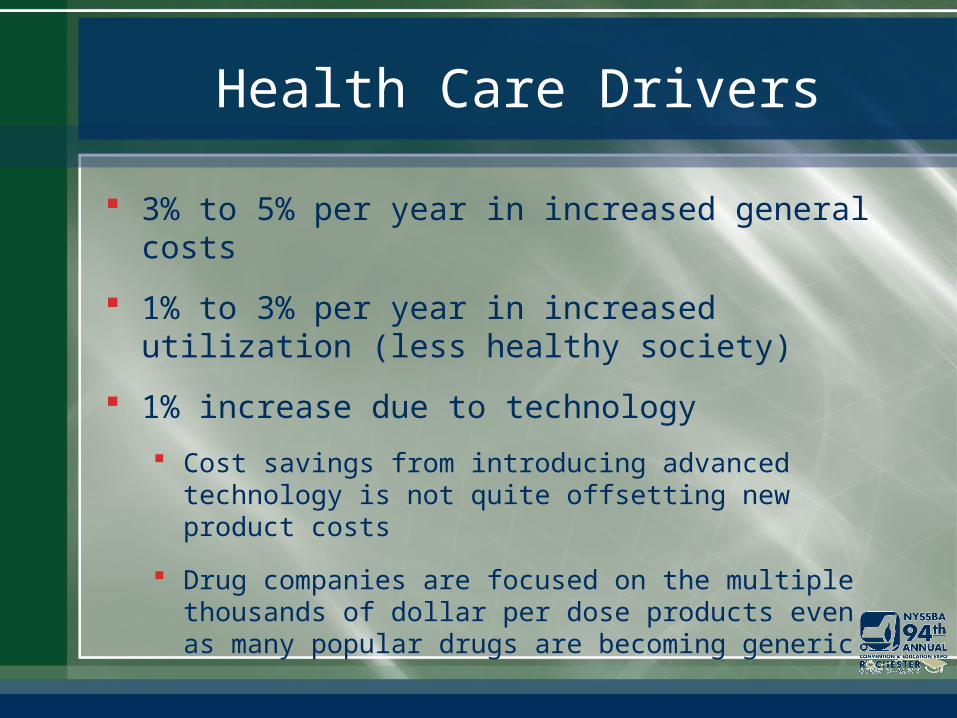
Health Care Drivers
3% to 5% per year in increased general costs
1% to 3% per year in increased utilization (less healthy society)
1% increase due to technology
Cost savings from introducing advanced technology is not quite offsetting new product costs
Drug companies are focused on the multiple thousands of dollar per dose products even as many popular drugs are becoming generic

Health Care Growth(Average Annual Change in National Health Care Expenditures)
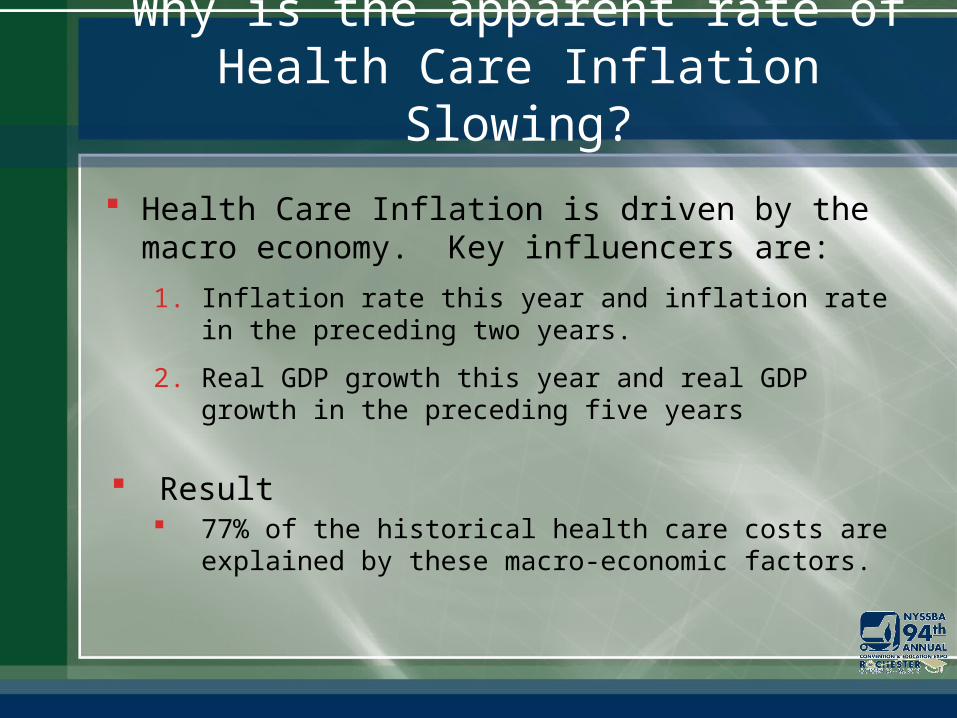
Why is the apparent rate of Health Care Inflation Slowing?
Health Care Inflation is driven by the macro economy. Key influencers are:
1. Inflation rate this year and inflation rate in the preceding two years.
2. Real GDP growth this year and real GDP growth in the preceding five years
Result 77% of the historical health care costs are
explained by these macro-economic factors.

Health Care Projections

Health Insurance
2013-2014 2014-2015 2015-2016 2015-2017 2017-2018 2018-20195.0%
7.0%5.5%
6.5% 7.0% 7.5% 7.7% 7.5%Health Insurance Increase (%)
14-15 15-16 16-17 17-18 18-19
Levy Increase 0.0331915119753 0.0192769283000214
0.0223204476364974
0.0228344077073418
0.0228226474956898
Tax Cap Limit 0.021634933405384 0.0251615139034275
0.0251603505305768
0.0251590328900456
0.0251577150021555
Budget In-crease
0.0262001235005286
0.0202614277214254
0.022213744203463 0.0229341157874647
0.0231290999431066
0.25%
0.75%
1.25%
1.75%
2.25%
2.75%
3.25%
Perc
ent C
hang
e

Why not hope for low health care inflation?
Both health care and pension costs correlate with multi-year trailing averages that largely follow the economy.
Health care and pension costs tent to move in opposite directions
Low Health Care inflation -> Higher pension costs Higher Health Care inflation -> Lower pension costs

What’s Worse?
What is more challenging to the budget? $1 million in additional pension costs
or $1 million in additional health care
costs?
Health Care – the tax cap doesn’t go up with the cost of health insurance.

Energy, Contractual and
Supply Expenses

Natural Gas
19901992
19941996
19982000
20022004
20062008
20102012
20142016
20182020
20222024
20262028
20302032
20340.00
2.00
4.00
6.00
8.00
10.00
12.00 Natural Gas Forecast
Henry Hub Lower 48 Wellhead
$ /
MBT
U
Energy Information Administration www.eia.gov

Energy, Supply Contractual Expenses
2013-2014 2014-2015 2015-2016 2015-2017 2017-2018 2018-20191.00%1.50%2.00%2.50% 2.00%
1.65%2.00% 2.00% 2.00% 2.00%
Energy, Supplies, and Contractual Costs
14-15 15-16 16-17 17-18 18-19
Levy Increase 0.0185049500517156
0.0160469957199496
0.0159024317982054
0.0153219626852172
0.0151120451857229
Tax Cap Limit 0.021634933405384 0.0251624009170368
0.0251614153846226
0.0251604540187132
0.0251595417226603
Budget In-crease
0.0176842307457126
0.0183953033744516
0.0184968027859867
0.0185970860319208
0.0186961494918602
0.25%
0.75%
1.25%
1.75%
2.25%
2.75%
Perc
ent C
hang
e

Putting it All Together

Putting it all Together
Wages increase: 2.5%
Health Care increases: 6.5%-> 7.0% -> 7.5% -> 7.7% -> 7.5%
Pension costs follow projections TRS: 16.25% -> 18.25% -> 18%...
ERS: 21.9% -> 20.9% -> 20.9% ….
Energy, contractual expenses and supplies increase with the CPI CPI: 1.65% -> 2%...

Putting it all together
14-15 15-16 16-17 17-18 18-19
Levy Increase 0.0456099405140696 0.0319014398085219 0.0348757822276063 0.035290866754894 0.0351925840599098
Tax Cap Limit 0.021634933405384 0.0251607833193116 0.025158904190814 0.0251569190929246 0.0251549788419394
Budget Increase 0.0321691086441836 0.0261403934224605 0.028042775042416 0.0286929095046975 0.0288186718462718
0.25%
0.75%
1.25%
1.75%
2.25%
2.75%
3.25%
3.75%
4.25%
4.75%
Perc
ent C
hang
e

What do you do?
First, count the breakage from retirements.
Second, hope the legislative budget contains additional aid.

Impact of 1% Breakage
14-15 15-16 16-17 17-18 18-19
Levy Increase 0.0353157913911061 0.0219090910936982 0.0250629958209302 0.0256850251074979 0.0257853549515859
Tax Cap Limit 0.021634933405384 0.0251613876881028 0.0251600715745047 0.025158602812461 0.0251571352910752
Budget Increase 0.0262001235005286 0.0202614277214254 0.022213744203463 0.0229341157874647 0.0231290999431066
0.25%
0.75%
1.25%
1.75%
2.25%
2.75%
3.25%
3.75%
Perc
ent C
hang
e
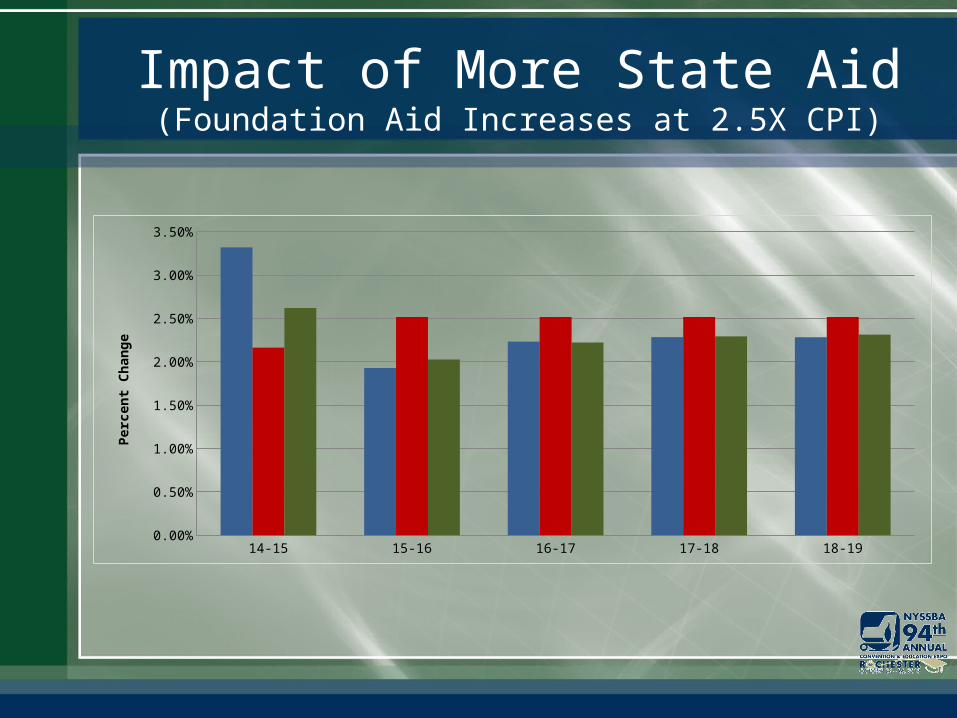
Impact of More State Aid(Foundation Aid Increases at 2.5X CPI)
14-15 15-16 16-17 17-18 18-19
Levy Increase 0.0331915119752998 0.019276928300022 0.0223204476364969 0.0228344077073412 0.022822647495716
Tax Cap Limit 0.021634933405384 0.0251615139034275 0.0251603505305768 0.0251590328900456 0.0251577150021555
Budget Increase 0.0262001235005286 0.0202614277214254 0.022213744203463 0.0229341157874647 0.0231290999431066
0.25%
0.75%
1.25%
1.75%
2.25%
2.75%
3.25%
Perc
ent C
hang
e

Reserves and Fund Balance

Reserves and Fund Balance
Fund Balance Excess of Revenues over Appropriations.
Renewable Reserve Use
Ongoing use of appropriated fund balance?
Generate enough fund balance to maintain 4% Unassigned Fund Balance?
Non-renewable Reserve Use Potential deficit spending spiral

But what about the $2 million in Restricted Reserves
What does it mean to the school if reserves are used to make up the budget gap rather than increasing taxes?

Recall the Budget that worked in most years
14-15 15-16 16-17 17-18 18-19
Levy Increase 0.0331915119753 0.0192769283000214
0.0223204476364974
0.0228344077073418
0.0228226474956898
Tax Cap Limit 0.021634933405384 0.0251615139034275
0.0251603505305768
0.0251590328900456
0.0251577150021555
Budget In-crease
0.0262001235005286
0.0202614277214254
0.022213744203463 0.0229341157874647
0.0231290999431066
0.25%
0.75%
1.25%
1.75%
2.25%
2.75%
3.25%
Perc
ent C
hang
e
• Note that only the 2014-2015 year budget requires exceeding the tax cap.

Use of Non-renewable Reserves
Use $300k of reserves to plug the first year’s budget
14-15 15-16 16-17 17-18 18-19
Levy Increase 0.0215433197639215
0.0308992778839889
0.022320447636497 0.0228344077073413
0.0228226474956912
Tax Cap Limit 0.021634933405384 0.0251622153183914
0.0251603505305768
0.0251590328900456
0.0251577150021555
Budget In-crease
0.0262001235005286
0.0202614277214254
0.022213744203463 0.0229341157874647
0.0231290999431066
0.25%
0.75%
1.25%
1.75%
2.25%
2.75%
3.25%
Perc
ent C
hang
e
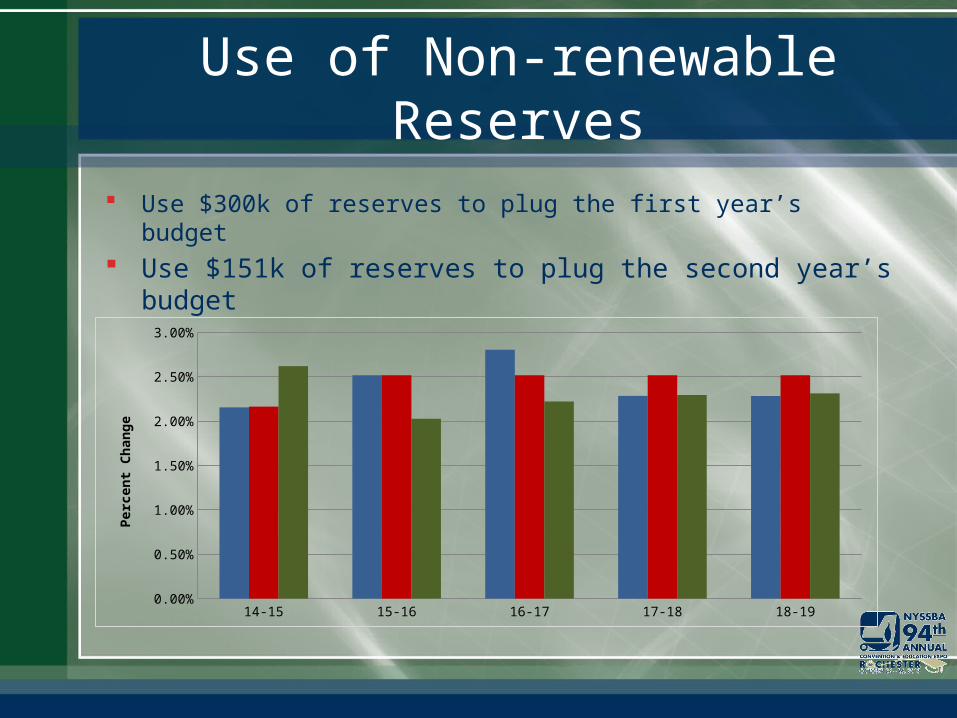
Use of Non-renewable Reserves
Use $300k of reserves to plug the first year’s budget Use $151k of reserves to plug the second year’s budget
14-15 15-16 16-17 17-18 18-19
Levy Increase 0.0215433197639215
0.0251599976208517
0.0280438308950539
0.0228344077073413
0.022822647495691
Tax Cap Limit 0.021634933405384 0.0251622153183914
0.0251606883984313
0.0251590328900456
0.0251577150021556
Budget In-crease
0.0262001235005286
0.0202614277214254
0.022213744203463 0.0229341157874647
0.0231290999431066
0.25%
0.75%
1.25%
1.75%
2.25%
2.75%
Perc
ent C
hang
e

Use of Non-renewable Reserves
Use $300k of reserves to plug the first year’s budget Use $151k of reserves to plug the second year’s budget Use $77k of reserves to plug the third year’s budget
14-15 15-16 16-17 17-18 18-19
Levy Increase 0.0215433197639215
0.0251599976208517
0.0251519297919458
0.0257197711993308
0.0228226474956911
Tax Cap Limit 0.021634933405384 0.0251622153183914
0.0251606883984313
0.0251591994188057
0.0251577150021555
Budget In-crease
0.0262001235005286
0.0202614277214254
0.022213744203463 0.0229341157874647
0.0231290999431066
0.25%
0.75%
1.25%
1.75%
2.25%
2.75%
Perc
ent C
hang
e

Use of Non-renewable Reserves
Use $300k of reserves to plug the first year’s budget Use $151k of reserves to plug the second year’s budget Use $77k of reserves to plug the third year’s budget
Use $15k of reserves to plug the forth year’s budget
14-15 15-16 16-17 17-18 18-19
Levy Increase 0.0215433197639215
0.0251599976208517
0.0251519297919458
0.0251591980409279
0.0233819429915184
Tax Cap Limit 0.021634933405384 0.0251622153183914
0.0251606883984313
0.0251591994188057
0.0251577465616256
Budget In-crease
0.0262001235005286
0.0202614277214254
0.022213744203463 0.0229341157874647
0.0231290999431066
0.25%
0.75%
1.25%
1.75%
2.25%
2.75%
Perc
ent C
hang
e
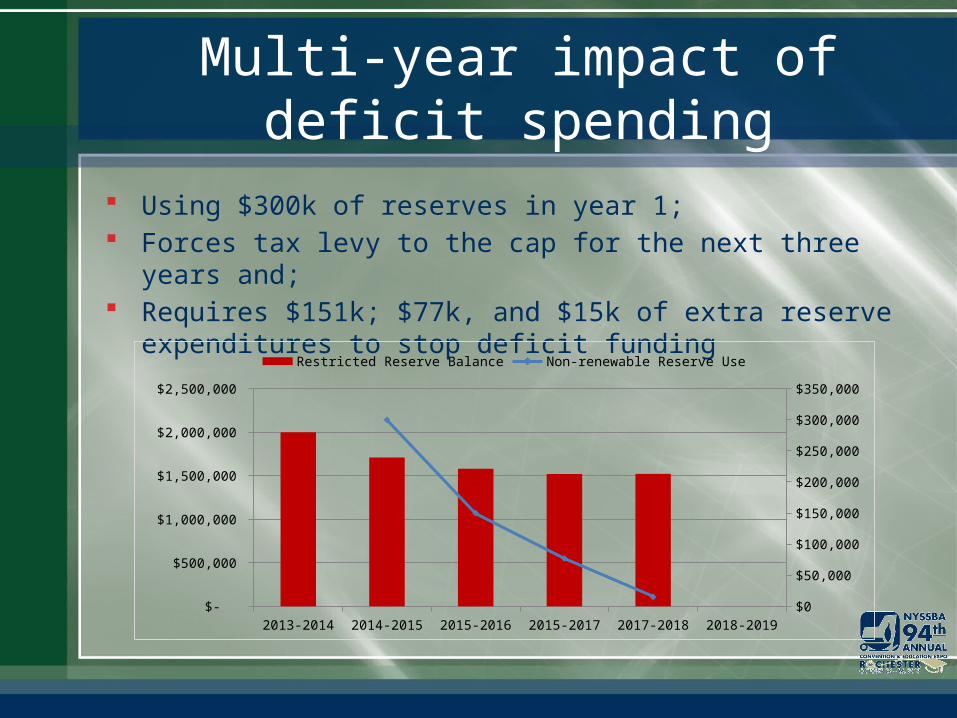
Multi-year impact of deficit spending
Using $300k of reserves in year 1; Forces tax levy to the cap for the next three years and; Requires $151k; $77k, and $15k of extra reserve
expenditures to stop deficit funding
2013-2014 2014-2015 2015-2016 2015-2017 2017-2018 2018-2019 $-
$500,000
$1,000,000
$1,500,000
$2,000,000
$2,500,000
$0
$50,000
$100,000
$150,000
$200,000
$250,000
$300,000
$350,000
Restricted Reserve Balance Non-renewable Reserve Use

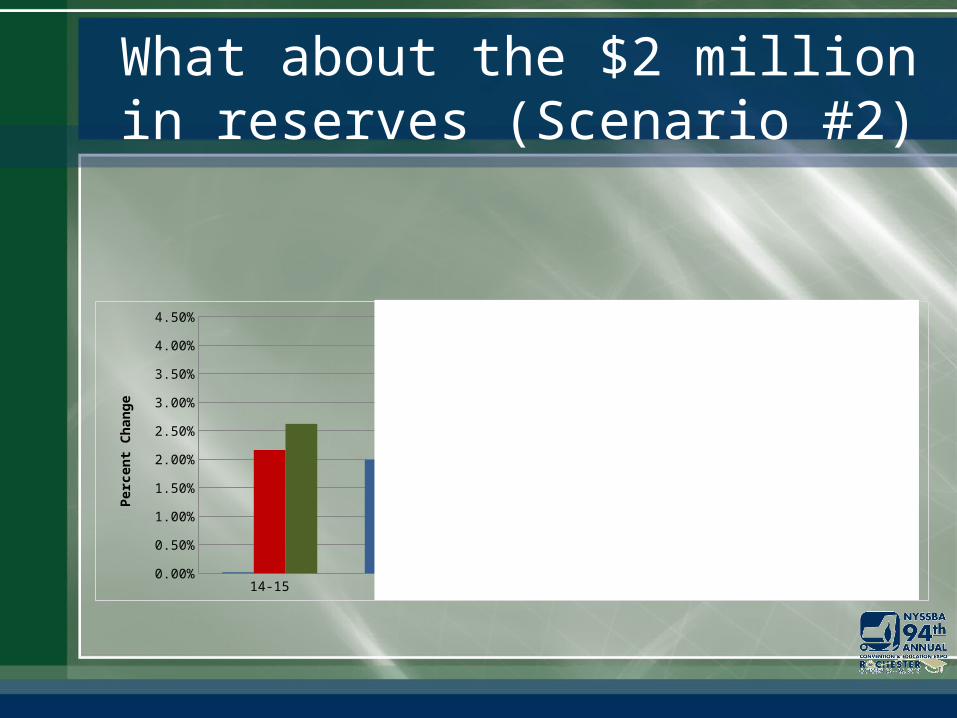
What about the $2 million in reserves (Scenario #2)
With $2 million in reserves, why shouldn’t the taxpayers have a year with no increase?

What about the $2 million in reserves (Scenario #2)
2013-2014 2014-2015 2015-2016 2015-2017 2017-2018 2018-2019 $-
$500,000
$1,000,000
$1,500,000
$2,000,000
$2,500,000
$0
$100,000
$200,000
$300,000
$400,000
$500,000
$600,000
$700,000
$800,000
$900,000
$2,000,000
$1,160,427
$331,616
$716 $17,892
Restricted Reserve Balance Non-renewable Reserve Use
What about the $2 million in reserves (Scenario #2)
14-15 15-16 16-17 17-18 18-19
Levy Increase 0.000188300709727584
0.0199130090627998 0.0421116713499079 0.0358723444131398 0.0228226474956907
Tax Cap Limit 0.021634933405384 0.0251635436775702 0.0251623030366371 0.0251597853745906 0.0251577150021555
Budget Increase 0.0262001235005286 0.0202614277214254 0.022213744203463 0.0229341157874647 0.0231290999431066
0.25%0.75%1.25%1.75%2.25%2.75%3.25%3.75%4.25%
Perc
ent C
hang
e

What about the $2 million in reserves (Scenario #2)
2013-2014 2014-2015 2015-2016 2015-2017 2017-2018 2018-2019 $-
$500,000
$1,000,000
$1,500,000
$2,000,000
$2,500,000
$0
$100,000
$200,000
$300,000
$400,000
$500,000
$600,000
$700,000
$800,000
$900,000
$2,000,000
$1,160,427
$331,616
$716 $17,892
Restricted Reserve Balance Non-renewable Reserve Use

What about the $2 million in reserves (Scenario #2)
14-15 15-16 16-17 17-18 18-19
Levy Increase 0.000188300709727584
0.0199130090627998 0.0421116713499079 0.0358723444131398 0.0228226474956907
Tax Cap Limit 0.021634933405384 0.0251635436775702 0.0251623030366371 0.0251597853745906 0.0251577150021555
Budget Increase 0.0262001235005286 0.0202614277214254 0.022213744203463 0.0229341157874647 0.0231290999431066
0.25%0.75%1.25%1.75%2.25%2.75%3.25%3.75%4.25%
Perc
ent C
hang
e
Explain to the taxpayers why you need to exceed theTax Cap two years in a row for something done 3 years ago

So when should you use Non-renewable reserves?
When you have a plan to stop!

Sustainable Uses of Reserves
Fund first year start up costs for an aided program (e.g., BOCES aided software).
Bridge operating expenses until significant retirements occur.
Emergency repairs.
Retirement incentives.
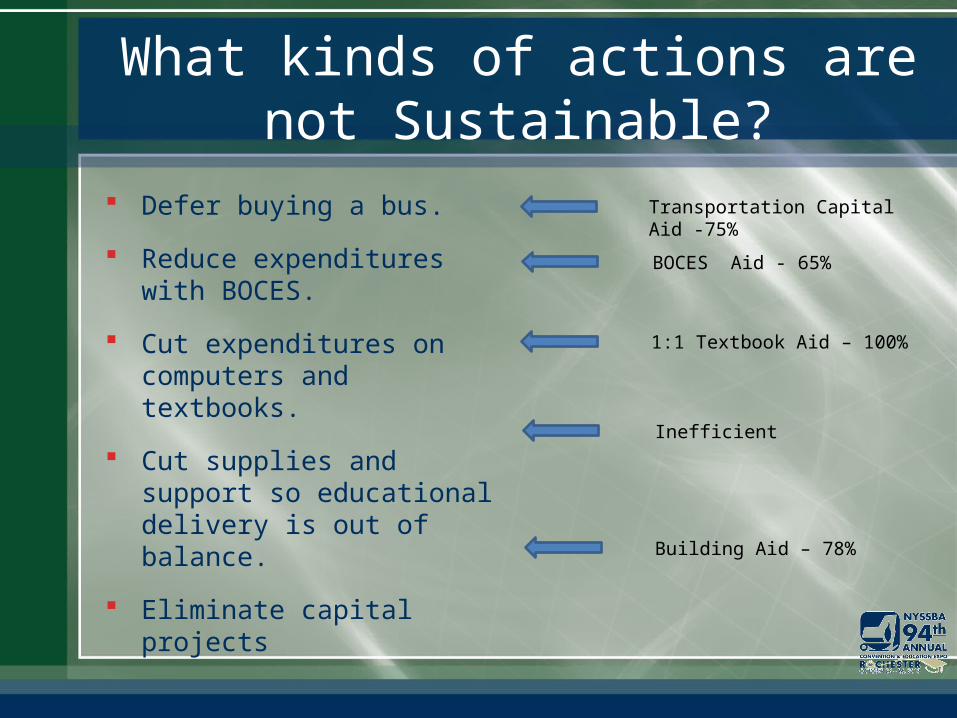
What kinds of actions are not Sustainable?
Defer buying a bus.
Reduce expenditures with BOCES.
Cut expenditures on computers and textbooks.
Cut supplies and support so educational delivery is out of balance.
Eliminate capital projects
Transportation Capital Aid -75%
BOCES Aid - 65%
1:1 Textbook Aid – 100%
Inefficient
Building Aid – 78%

Multi-year BudgetingPlanning for accelerating change!
Technology Networks and access
Collaboration
Content Management and Leaning Systems
Assessments Library and Information Subscriptions Data sources and data analysis 21st century skills

Summary
Multi-year budgeting exposes the consequences of current year decisions.
Allows schools to better manage reserves.
Provides an important tool for collective bargaining negotiations.
Helps the district manage public perceptions and expectations.