financial literacy in italy: what works among millennials ...dse.univr.it › home › workingpapers...
TRANSCRIPT

Working Paper Series
Department of Economics
University of Verona
Financial Literacy in Italy:What works among millennials most?
Alessia Sconti
WP Number: 1 January 2020
ISSN: 2036-2919 (paper), 2036-4679 (online)

Financial Literacy in Italy:
What works for millennials∗���
�Abstract
Nowadays, financial literacy is one of the most important skills that can be acquired by a
tech-savvy millennial. In order to understand what format of financial education works
best for millennials, we set up an experiment that involved implementing a financial
education program called “Futuro Sicuro” on a sample of 650 high school students in
Italy. The program allowed us to gather data from two treatments at the class level,
namely 1) a theoretical, rule-of-thumb-based financial education program with the
presence of a financial advisor, and 2) a digitized financial education program using web-
based applications based on the learn-by-playing rule. The two treatments were
associated with different costs but showed similar effects: three weeks after their
conclusion, we find that the courses did increase actual financial knowledge and the
results also aligned with participants’ realistic assessments of their own financial skills. A
follow-up study also reveals the persistence of these effects three months later for the first
treatment (i.e. the traditional course).
JEL Classification: D14, G53, I20. Keywords: Financial Literacy; Perceived Financial Literacy; Financial Education; Field Experiment; Millennials; Fintech.
�
∗ � I would like to express my deep gratitude to Professor Francesco Drago, my Ph.D. Supervisor, for his
patient guidance, valuable support and suggestions. I would like to express my very great appreciation to Professor Alessandro Bucciol, my Research Supervisor, for his useful and constructive suggestions. I am particularly grateful for useful comments and tips given by Diya Elizabeth Abraham, Simone Quercia, Tommaso Reggiani and Alessandro Saia. I would like to thank the Italian Edufin Committee for including this program in the first edition of the month of financial education in Italy, October 2018. All the
participants of the ���� AMASES edition - parallel session in Behavioral Finance - in Naples as well as the participants of the 6th SIdE Workshop for PhD students in Econometrics and Empirical Economics (WEEE 2018) in Perugia, for useful suggestions. I am very grateful to have had the opportunity to present my research at the brown-bag seminars organized at Masaryk University, VSE University of Economics in Prague and the University of Verona, where thoughtful comments and discussions allowed me to improve this work.
�

� �
1. Introduction
With the advent of globalization and the development of technology, the financial world
has become more accessible. However accessible is not synonymous with simple.
Besides stipulating mortgages, accessing credit and investing have also become actions
taken by those who may not fully grasp the associated conditions and implications of
such actions. Financial inclusion and consumer protection thus make financial literacy an
object of interest for policymakers. In particular, it is of crucial importance to spread
financial literacy among millennials who will be riding the crest of financial technology
(Fintech) wave. This notion is also widely supported by the Italian economic press and
several institutions. The aim of this research is to identify whether, in order to spread
financial literacy among millennials, it is more advantageous to implement a traditional
course or a course that exploits modern technological facilities.
Before going deeper, it is necessary to define and specify certain terms. Financial
Education identifies a set of tools for improving consumer financial literacy. According
to the Organization for Economic Cooperation and Development, financial literacy refers
to a mix of financial and numerical knowledge and those skills necessary for good
autonomous wealth management (OECD, 2005). Moreover, financial literacy allows
greater rational, motivated and self-confident participation in economic life (OECD,
2014) which is an important safeguard against market instability. Finally, financial
capability is the ability to put into practice one’s financial knowledge and to adopt sound
financial behaviors that are appropriate to one’s needs. The World Bank definition
provides a more technical definition, stating that financial capability is the “internal
capacity to act in one's best financial interest, given socioeconomic and environmental
conditions” (www.worldbank.it).
The level of financial literacy is deficient throughout the world, with only 2.1 percent of
countries qualifying as top performers (PISA, 2012). According to the most recent PISA
survey, young Italian students still perform worse than their peers in OECD countries. In
particular, Italian 15-year-old students were 29 points under the OECD average score in
2018. As emerged, Italy is at the thirteenth position among 20 countries and economies
that participated in this optional assessment (OECD, 2020). Despite recognizing the need
to improve financial literacy levels worldwide, the best way to achieve this is far from
� �
clear.
In this paper, we focus on students from a secondary school in the south of Italy (Reggio
Calabria). We organize short courses in financial literacy for some of the classes of the
penultimate year of a secondary school. The courses involve about 126 students in treated
classes (exposed to the course). Time and budget constraints do not allow us to repeat the
program for more than six classes. We collect data on more than 650 students from
treated and untreated (not exposed to the course) classes. Importantly, we have quasi-
experimental variation in exposure to courses because there is no particular selection of
students into classes (the allocation of students into classes is random). Consistently with
this, we find balanced observable characteristics of students both in the treated and
untreated classes.
The financial courses are of two different types. The first one is delivered traditionally. It
consists of four in-person lessons by a teacher and a financial advisor using slides. The
second one is delivered in a highly digitized way through the platform “Kahoot”
following the same schedule. The main difference between the two treatments is that the
digitized course involves the learn-by-playing concept whereas the other is a more
traditional classroom course. In the digitized course, students answer short quizzes on an
interactive multimedia whiteboard that can be accessed via their smartphones. They are
also able to verify and improve their knowledge by watching short videos freely available
on the official website of the Museum of Saving2 (Museo del Risparmio).
Besides these, a tracking task is part of both treatments. The task requires students to
track their expenses digitally or traditionally, depending on their course type. A prize,
valued at around 10 EUR, acts as an additional incentive for students to perform well.
The contribution of the paper to the existing literature consists of the investigation of the
effects of two financial literacy courses similar in terms of their content, duration and
goals but very different with respect to their method of dissemination. To the best of our
�
2 The Museum of Saving is not a traditional museum but rather a place in which technology, interactivity and games are used for educational purposes. In particular, “edutainment” and gamification are used to spread financial literacy. Videos are available at the following link http://www.museodelrisparmio.it/edupop-la-nuova-educazione-finanziaria/ (last visited on March
����, 2020).
�

� �
knowledge, this is the first paper to focus on this particular population (Italian
millennials) within a quasi-experimental setting comparing the potential of digital learn-
by-playing methods and traditional instructor-driven rule-of-thumb3 methods to increase
financial literacy.
High school students in Italy are a relevant target group for financial literacy courses for
several reasons. Firstly, the age range (between 16 and 18 years) is among the most
interesting for examining the impact of a long-term early-impact targeted policy
measures. High school students are not yet economically independent, have lower
financial exposure in comparison with university students and are highly motivated to
attain financial freedom as soon as possible. Their intrinsic motivation pushes them to
engage in a meaningful way thus enabling a conducive environment for the introduction
of a financial education program. Our data collection and experimental study was
facilitiated by the the fact that students in our sample are enrolled in a school that
randomly assigns them to different classes and the school stores personal details and
marks for each student within each subject.
In the paper by Brugiavini et al. (2018) a different subgroup of millennials is targeted for
financial literacy, both in terms of interests and in terms of their age. However the
advantages highlighted by them (such as essential math ability, heterogeneity, low
financial exposure) are reasonably applicable also to our target population. Both targets
are able to do simple calculations required by minimum financial literacy standards.
Homogeneity is ensured not only in age but also in the area of residence. In comparison
to university students, high-school students in Italy have little exposure to the financial
concepts that allow for sound wealth management. For this reason, courses in financial
education could have a significant impact on their financial skills. The implementation of
the different treatments in the familiar environment of the classroom in which students
are already accustomed to learning also further enhances the impact of our treatments.
Through our experiment, we provide two key findings. First, our results indicate a
positive effect of financial education on financial literacy. After the course, the treated
students appear more financially literate than before in comparison with the control
group. Second, following a short course on financial education, there is a reduction in
�
3 The costs of each course would be similar if financial advisors are free of charge. However, the traditional course requires a lot of effort in comparison to the digitized one.�

� �
self-assessed financial literacy, which may suggest a better alignment with actual
financial literacy.
The paper is organized as follows. Section 2 reviews the relevant literature review on
financial literacy. Section 3 describes the research design and methodology. Section 4
provides some preliminary analysis. Section 5 details the main results. Section 6
concludes.
2. Literature
It has been widely demonstrated that individuals are not able to cope with the complex
financial situations around them (Lusardi et al., 2014). It is from this awareness that both
scholars and politicians have shifted their focus to the need to spread financial culture and
to study the determinants of financial decision-making (OECD, 2005; Lefevre and
Chapman, 2017).
Several scholars consider financial literacy akin to human capital investment, both of
which are geared toward eventually achieving higher earnings. Among them, Jappelli and
Padula (2011) have studied a multi-period life cycle model in which financial literacy is
considered endogenous and hump-shaped. They have argued that the relationship
between financial literacy and wealth is strongly correlated over the life cycle, except
after retirement. An important conclusion suggested by these authors is that since
financial literacy is similar to an investment, there could be sub-groups for which it
would require unacceptably high costs. In this regard, the OECD has stressed the
importance of increasing literacy for new generations starting right from primary school
or ideally from kindergarten (OECD, 2005; OECD- International Network on Financial
Education - INFE, 2012) where it would be possible to take advantage of the time period
during which people tend to be particularly receptive. Another interesting aspect is the
positive relationship between financial literacy and education. Lusardi and Mitchell
(2011) have argued that young adults who attended college understand complex concepts
such as financial diversification compared with those who did not. Empirical evidence
shows that providing financial knowledge to the least educated group improves their

� �
wellbeing by 82 percent in the pre-employment stage and 56 percent for college
graduates (Lusardi et al., 2011).
Moreover, there is empirical evidence which has also shown a gender gap (Lusardi et al.,
2014). They suggest that while women are less financially literate, they are also those
who most often recognize their limits in this field by choosing more often "do not know"
as a response (47% women against only 26% of men in the US).
As can be seen in the literature, a solution must be found to increase the protection of
wealth. Protecting wealth also means safeguarding savings and having the ability to
evaluate when it is convenient and how much it costs to borrow money. In fact, it is
widely demonstrated that people with low financial literacy pay high transaction costs
and excessive interest rates (Lusardi and Tufano, 2009).
The goal of financial education programs should be (according to the International
Network on Financial Education - INFE) the acquisition of expertise in the following
areas: money and transactions, financial planning and management, risk and performance
and basic numerical skills and knowledge of the financial system (terms and roles). The
effect of financial education on behavior should be investigated and evaluated, proving
effectiveness through counterfactual techniques that involve a comparison between
beneficiaries (treated group) and a group of people similar in other respects to the treated
group but who do not follow any financial education course (control group).
�
However, while financial literacy programs are targeted at many groups, the existing
literature provides little evidence on the effects of these programs. The most critical issue
to consider is that financial education programs often lack an evaluation as part of the
design. Among them, for school-age students, see Bruhn et al. (2016) for Brazil,
Romagnoli and Trifilidis (2013), Frisancho (2018); for Italy, for working professionals,
see Bernheim and Garrett (2001), Clark and d’Ambrosio (2008) and Clark et al. (2012a,
2012b); for household literacy programs, see Collins and O’Rourke (2010). Notable
exceptions are Becchetti et al. (2013) and Lührmann et al. (2015) and Frisancho (2018),
who assess the effect of financial education programs on high-school students, and
Brugiavini et al. (2018) on University students. More in detail, Lührmann et al. (2015), as
well as Frisancho (2018), find a positive impact of short training sessions on financial
� �
attitudes such as interest in financial matters and saving propensity. In contrast, Becchetti
et al. (2013) do not find any statistically significant effect of the treatment on financial
literacy. Besides these, Brugiavini et al. (2018), focusing on 579 university students, also
find that a short one-day course increased more self-assessed financial literacy in
comparison with the actual increase in knowledge. Taken together, a positive impact of
such programs on hypothetical behaviors emerges.
Several scholars argue that by playing, children retain knowledge (Dau, 1999; Levin,
1996, Pramling Samuelsson et al., 2008). Levin (1966), claims that during play, children
become aware of what they know and assume control of what is happening. In addition,
the school involved seems to follow the principles stated by the Swedish preschool
curriculum (Ministry of Education and Sciences in Sweden, 1998) since the environment
is joyful, gives students a feeling of belonging and mixes communication, play and
learning as a whole during the yearly activities. Finally, Johansson et al. (2006) argue that
in such an environment, children exchange their ideas learning by each other through
discussions, argument and exploration. �
�
To the best of our knowledge, no studies in the literature are focused on the effect of
learning-by-playing in financial education for high school students. However, three
studies in the literature are similar to our set up. The first one is a traditional financial
education program called “Finanzas en mi Colegio” (Frisancho, 2018), conducted on a
large-scale using counterfactual techniques and a comprehensive evaluation strategy. It
involved 300 schools in Peru and the main result is increased savings behavior both for
students as well as teachers. The quantitative impact of this financial education program
is 0.14 standard deviation (SD) in real knowledge on average in the pooled sample of
students. In addition, not only do students learn more but they also become more aware
of their financial proficiency (0.11 SD). According to Frisancho (2018), this study is the
first one which includes a cost-benefit evaluation in this context. They found that their
intervention is cost-effective. In fact, on a sample of 31,000 students in 150 schools, they
spent US$ 6.6 per student and the cost-effectiveness ratio was 0.021. In the end, they
point out that every dollar spent per student is equivalent to a 2.2 point improvement in
the PISA 2015 financial literacy test. The second financial literacy field experiment of
interest is conducted in the north of Italy by Brugiavini et al., (2018). It is an intensive
short course in which university students are interviewed before and after being exposed

�
to financial education videos on the same day. On a sample of 579 university students,
the statically significant effect on financial knowledge was 0.046 for “Inflation” after the
course, 0.176 for “Interest compounding” and no effect emerged for the “Diversification”
outcome. However, the number of correct answers after the course increased by 0.229.
The main results are that this kind of course increases both real as well as perceived
financial knowledge, but the latter increases more quickly. The similarity with our study
is that we also use a short period of learning (though relatively longer compared to
previous studies) and the use of videos. In the end, the tablet-based program introduced
by Attanasio et al. (2019), studied an all-female sample and involved a conditional
money transfer program (CCT) in Colombia. Their program had a significant positive
impact on knowledge, attitudes, practices and financial performance. Among the users
who showed an increase in financial health over two years later, those who benefitted
most were the poorest, least educated and most rural populations. The impact on the
treatment group is 0.20 SD immediately after the program, and it is persistent seven
months later 0.18 SD, as well as two years later, with 0.14 SD higher compared to the
control group for the basic test. In the next section, we explain in detail the characteristics
of our “Futuro Sicuro” field experiment.
3. The Field Experiment
A field experiment must meet six key factors: the nature of the subject pool, the nature of
the information that the subjects bring to the task, the nature of the commodity, the nature
of the task or trading rules applied, the nature of the stakes and the nature of the
environment that the subject operates in (Harrison and List, 2004). Following these
criteria, our financial education program not only can be considered a field experiment
but can also be considered a natural field experiment since it is set in a school which is is
the most natural environment in which students learn. In addition, for these students, it is
not unusual to be involved in external activities since the school frequently adopts actions
promoted by different local or national stakeholders. For this reason, we can assume that
the subjects in our sample are not aware that they are in an experiment.
Having reviewed all the initiatives implemented by many banking and non-banking
parties (Franceschi et al. 2017), we have developed a program in line with what has
already done for extrinsic parameters (like mean duration and general content). The target

�
is 16 to 18-year-old students attending the fourth classes of the “da Vinci” Scientific High
School in Reggio Calabria. This target group is able to follow key financial concepts like
students of fifth classes, but also allows us to expand the study the following year. The
experiment involved 6 treated and 28 untreated classes, chosen randomly. The treatment
is the exposure to the financial course that can be the traditional or the digitized one
(henceforth T and D). We randomly assigned different treatments (T and D) to the
treated.
We describe the timeline of the experiment in Figure 1. Before the start of the course (t0
in Figure 1), we measure the level of financial literacy with a questionnaire for students
in T, D and the untreated classes (henceforth, C). Specifically, students are required to
answer questions about their personal characteristics and family background in the first
section, their financial habits (such as saving habits and use of prepaid cards) and risk
aversion behavior in the second section4, and their financial literacy (inflation, interest
and diversification) in the last one.
One week after the survey (� in figure 1), the courses T and D started, with 2-hour
lessons once a week. Attendance is compulsory because it falls within school hours. We
ask students in T, D and C (untreated classes) to fill the same questionnaire again at the
end of the course (�). We repeat the same procedure (i.e. asking students to fill the
questionnaire) three months later (��) but only for students in the T and D classes.
�4 Since the effect of risk aversion is strictly linked to financial behavior, we report the two questions addressed to the students that concern their risk aversion and preferences below: Question 1: “If you win the lottery an amount corresponding to your family's annual income will be paid to you in a year. To what extent would you give up part of the amount to withdraw the residual amount immediately? a) I would give up 20% too b) I would give up 10% c) I would give up 5% d) I would give up only 2%” Question 2: “If you could choose from the following options, which would you prefer? a) a certain gain of 5% b) flip a coin by gaining 10% if it comes heads, 0 if it comes cross”.�

� ��
Additionally, we assign a tracking task to each treatment group which requires them to
make notes of their expenses. Thus, we distribute a pre-printed sheet to the treated of the
theoretical course (T treatment). Instead, to the treated of the digital course, we ask to
download a free app called 70.20.10 (available for both iOS and Android devices until
October 2019) to keep digitized track of their expenses. For both of them, we set the
deadline to complete the task at the end of the course. This task allows us to evaluate the
degree of participation of students.
Furthermore, it enables us to understand which method is more effective for millennials
to keep track of their expenses. Finally, it allows us to know whether these methods
succeeded in changing saving habits or their interest and consequently their knowledge.
In order to increase participation, we promise a prize consisting of a handmade credit
card holder (valued at around 10 EUR) to those who were able to achieve the course’s
requirements.
The traditional course is characterized by the presence of professional financial advisors
(in three T classes). The first lesson of the traditional course is a motivation lecture about
the importance of increasing human capital to increase their awareness and their
involvement in the learning process as a whole, not only for the course. Then, we explain
the task (giving them a balance sheet) introducing the importance of planning in wealth
management as well as in everyday life. We use slides to keep things simple enough and
1
Baseline Survey
for all classes treated and untreated
Measurement of the outcome
For all classes treated and untreated
Measurement of the outcome
For all classes treated and untreated
Baseline Survey
for other untreated classes
Study Starts
Study Ends
3 weeks after 3 months after

� ��
to allow the financial advisor to introduce examples focused on investments (i.e.,
planning, diversification and so on). Price and inflation are the main topics of the second
lesson. The third lesson is about saving and payment instruments, taking into account
inflation and refreshing the concept of simple interest calculations. The fourth and last
lesson, after an overview of financial markets, is a brief introduction to mortgages,
insurance and retirement.
We follow the same schedule for the digitized course. To the best of our knowledge, this
is the first short course in financial literacy that covers all the major topics concerning
wealth management using this particular digitized methodology. Since the aim of the
digitized course (in three D classes) is to learn by playing, we show a video on human
capital and we explain the details of the course and the task structure. Then, through a
user-friendly platform called Kahoot, we administer the first short quiz (10 questions)
about financial planning. The quiz is projected on an interactive multimedia whiteboard.
Using computers or smartphone as pushbuttons, students could join by choosing their
nickname and entering a unique code (automatically randomly generated every time a
quiz starts). Next, a classification in comparison with their schoolmates appears. Short
videos that are freely available on the official website of the Museum of Saving about
financial planning are projected after each quiz. A Q&A section follows at the end of
each lesson.
The design of the field experiment allows us to test three main hypotheses. The first
regards the effectiveness of the financial courses. The second one is about any change in
self-assessed Financial Literacy (FinLit), about the last regards the existence of a gender
effect.
3.1 Descriptive Statistics
The sample comprised a total of 650 students, 126 treated (61 in the T treatment and 65
in the D treatment) and 524 untreated.
Before starting the courses, we created a three-section questionnaire following the
Lusardi and Mitchell (2011) approach – Simplicity, Relevance, Brevity and Capacity To

� ��
Differentiate. We administered it both to the treated (in the T and D classes) and to the
students in the untreated classes (C). In the first section, we collected students’ personal
information, family background, whether the student is an only child or not, the
educational experience of family members and individual marks obtained in English,
Italian and Mathematics during the year. In the next two sections, we collected data
useful for testing our hypotheses about their saving habits and their financial literacy
levels. These sections were administered before the courses, just after the course and
three months after the end of the courses. In these sections, we introduced questions
concerning the main topics of financial planning, inflation, diversification and interest
calculation to evaluate students’ financial knowledge. The same financial literacy
questions (but arranged in a different order, as suggested by Lusardi and Mitchell (2009)
and Van Rooij, Lusardi and Alessie (2011)) were also administered after the course. In
addition, the second time it was filled out, there were new questions aimed at
understanding if the treatments had any positive externalities in their everyday life. This
allowed us to test H3. After discussing practical examples of daily life with the help of
financial experts or through a learn-by-playing approach, we also wanted to understand if
the students spoke about the project with family which might further amplify the positive
effects of the course. In the end, comparing answers of the control group to the treated
groups in the second and the third wave would enable us to ascertain any learning effects.
As mentioned before, there are two treated groups and one control group. Students in the
treated groups received either training D (digitized course) or T (traditional course).
Students in the control group C did not receive any training but participated in the survey.
The experiment was conducted at the class level. In other words, we had classes in which
all the students were treated and classes in which all students were untreated.
Before estimating a model, we want to stress that we have a quasi-experimental variation.
The identifying assumption in model 1 is that students are assigned to treatment D or T
(or to the control group) randomly. Since the randomization is done at the class level with
a few classes, this assumption is equivalent to the random assignment of students into
different classes. Conversations with the principal of the school and the teachers revealed
that students are indeed allocated to different classes randomly and so we should not
observe, for instance, some classes with a disproportionate number of high ability
students. To support our assumption, we conduct a balancing test where we report for the
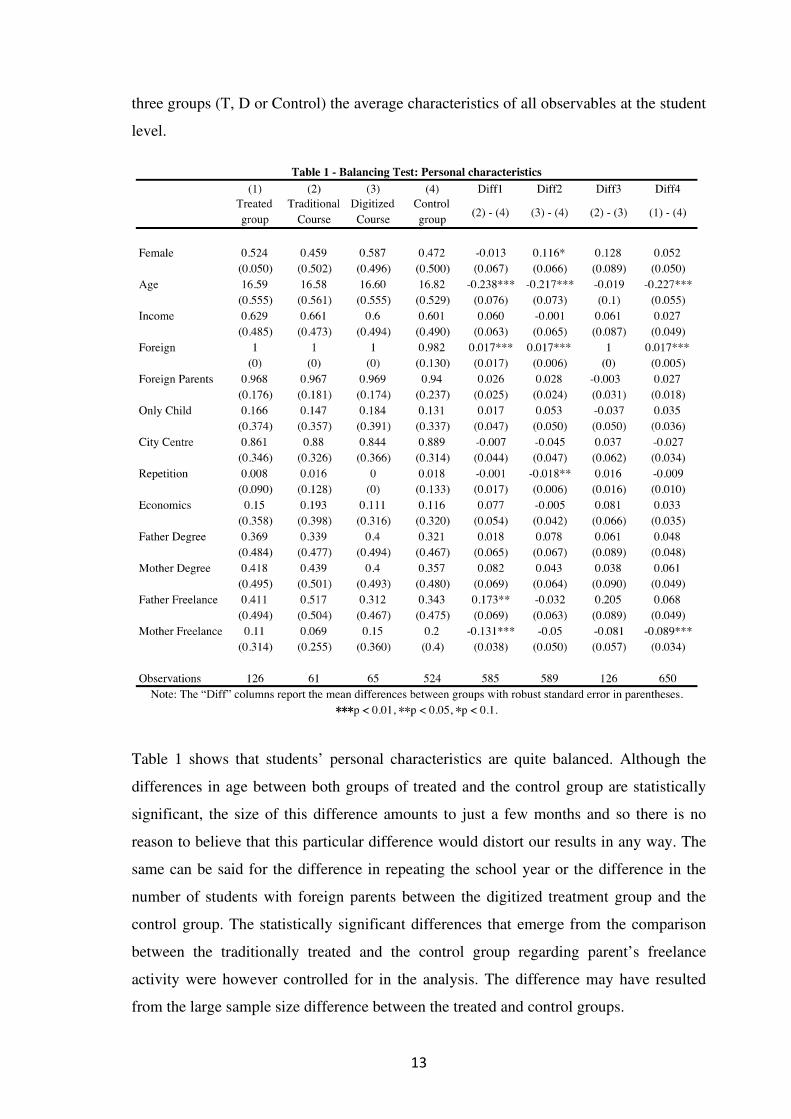
� ��
three groups (T, D or Control) the average characteristics of all observables at the student
level.
Table 1 shows that students’ personal characteristics are quite balanced. Although the
differences in age between both groups of treated and the control group are statistically
significant, the size of this difference amounts to just a few months and so there is no
reason to believe that this particular difference would distort our results in any way. The
same can be said for the difference in repeating the school year or the difference in the
number of students with foreign parents between the digitized treatment group and the
control group. The statistically significant differences that emerge from the comparison
between the traditionally treated and the control group regarding parent’s freelance
activity were however controlled for in the analysis. The difference may have resulted
from the large sample size difference between the treated and control groups.

� ��
Table 2 makes it possible to assume that financial knowledge among students is quite
balanced before the course. We also collect data about abilities in subjects related to this
field and we control for math abilities. In the following sections, we present preliminary
analysis and results based on the data described above.
4. Results
In exploring the real financial knowledge data collected, we analyze them in two steps
reported in Sub-sections 4.1 and 4.2, respectively. The first step is a preliminary analysis
of the Big Three questions shares three weeks after the course. In doing so, we test their
differences in each group using T-tests and show them graphically. Then, in Section 4.2,
we report results from a diff-in-diff probit regression in which we control for several
observable characteristics. In the next section, we extend the diff-in-diff probit model to
analyze the effects of the treatment on perceived financial literacy.
4.1 Preliminary results
We conduct a preliminary analysis starting from considering the share of inflation,
interest and diversification outcomes three weeks after the course. Then, we also show
these results graphically.

� ��
�Three weeks after the courses, we administered the same questionnaire to both the treated
group as well as to the control group. Comparing the results before (Table 2) and after the
course (Table 3), it may be possible to argue that both courses were effective at
increasing financial knowledge.
After the course, students in the traditional treatment (T), had a higher probability of
answering the inflation question correctly by 24 percentage points (p.p.) in comparison
with the control group. Similarly they were 18 p.p more likely to correctly answer the
question on diversification and 28 p.p more likely to correctly answer the question
oninterest outcomes. Attending the digitized course also had a positive effect, but in
comparison to the tradition course, this effect was larger only in the case of the inflation
question. Compared to the control group, students in the digitized course (D) were 31 p.p,
13 p.p and 13 p.p more likely to correctly answer the questions on inflation,
diversification and interest, respectively. This is worth noting for future policies that aim
to improve financial literacy in the shortest possible period at the lowest possible cost.
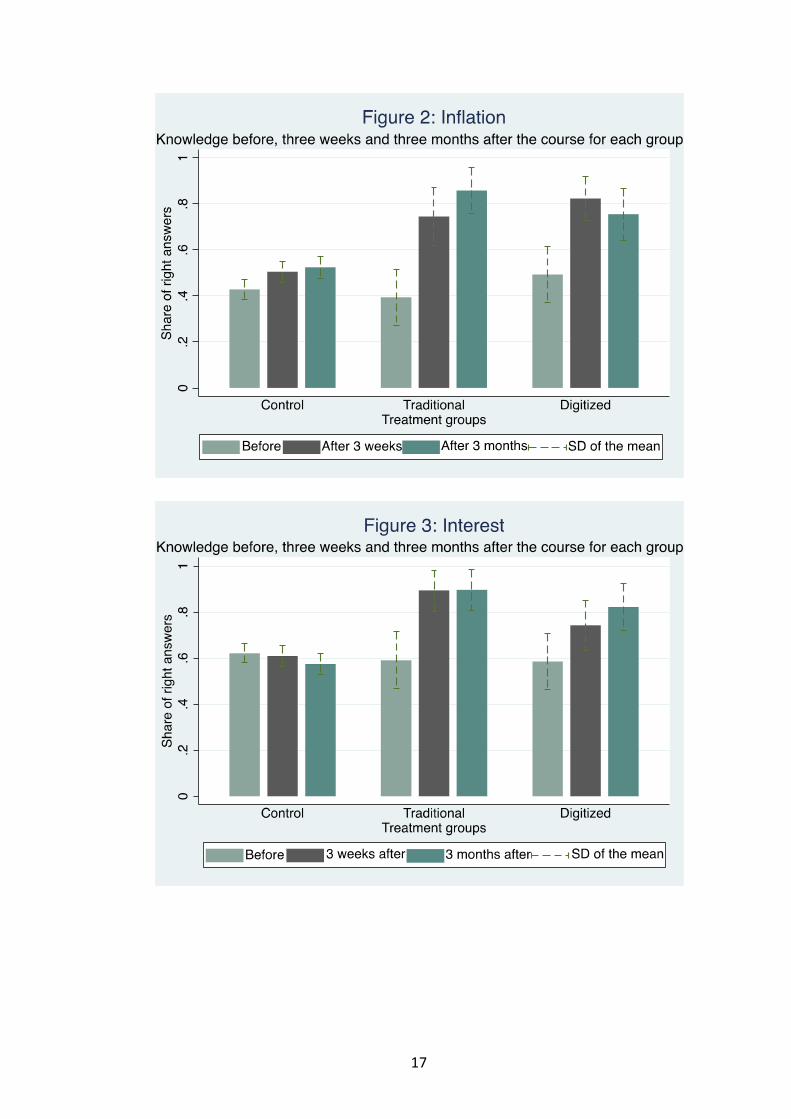
This can further be seen from the bar graphs depected in Figures 2, 3 and 4. These charts
depict a clear picture of the differences in the share of correctly answered questions
before the courses, three weeks after the courses and three months after the end of the
courses for each group.
The most relevant measure is the persistence of the effects three months after the end of
� ��
the courses. Figure 1 highlights not only the persistence of the effect but also an
increment in inflation knowledge three months after the course for the traditional group.
The digitized course, on the other hand, seems to lose effectiveness three months after the
end of the course. However, the share of the right answers is still higher in comparison to
before the course (see Figure 2). The results of the control group also seem to suggest a
spillover effect which would mean that the treatment effects reported here are
underestimated.
The interest outcome in Figure 3 highlights an increased and persistent knowledge both
three weeks and three months after the courses for the treated groups. However, since
these students are attending a scientific high school, they become more proficient at math
calculations over the course of a few months. Figure 3 shows not only the persistence of
the effect for both groups but also an increment in interest calculation ability for the
digitized group three months later.
In contrast to adults, millennials understand the diversification concept better and the
inflation concept less. Analyzing diversification outcomes (Figure 4) before and after the
course, a ceiling effect might be affecting the statistical significance of the results for the
digitized group. However, an increase in the share of right answers in the traditional
treated group can be observed in comparison to the other groups.
The effectiveness of both courses is persistent after three months, even if it is slightly
reduced for both treated groups (more so in the case of the digitized group).
� ��

� �
Moreover, looking at an aggregate measure of financial literacy knowledge, we create a
financial literacy index (Deep FinLit). It is the sum of the big three5 financial literacy
questions regarding inflation, interest and diversification. This index takes the value 0 if
no question is answered correctly, 1 if at least one question is answered correctly, 2 if two
questions are answered correctly and 3 if all three are answered correctly. Comparing this
index before and three weeks after the course reveals that the share of students who
respond correctly to all the three questions went from 22% to 60% (14 to 28) for the
traditional group and from 38% to 54% (24 to 33) for the digitized group. This is another
way to see the results of this financial education program. The same can also be seen
from Figure 5. It appears that this share remains quite stable also three months after the
end of the course.
�5 As are called the following questions: 1) “Suppose you had $100 in a savings account and the interest rate was 2% per year. After 5 years, how much do you think you would have in the account if you left the money to grow?” A) More than $102 B) Exactly $102 C) Less than $102 D) Don’t know E) Refuse to answer 2) “Imagine that the interest rate on your savings account was 1% per year and inflation was 2% per year. After 1 year, with the money in this account, would you be able to buy…” A) More than today B) Exactly the same as today C) Less than today D) Don’t know E) Refuse to answer 3) “Do you think the following statement is true or false? Buying a single company stock usually provides a safer return than more stocks of different companies.” A) True B) False C) Don’t know D) Refuse to answer
�

� �
Next, as a robustness check, we create a dummy variable to identify their rough level of
financial literacy. The variable takes the value 0 if they respond to zero or only one
question correctly and 1 if they answered correctly to more than one question.

� ��
As we can see from Figure 6, it is clear that the rough financial literacy increased for both
treated groups.
To conclude, the aggregate measure of financial literacy outcomes after three months
confirms the persistence of the treatment but since there is also a positive increment in
the share of right answer for the control group, it might be considered as a lower bound
due to the spillover effect. We further note that the traditional course seems to shows a
higher effect three months after the course in comparison to the digitized one.
4.2 Regression Analysis
The design of the experiment allows us to use a diff-in-diff analysis. In this approach we
can relax the assumption that students in T, D and C classes are randomly allocated. In
particular, while the diff-in-diff design can account for differences in fixed
characteristics, the key hypothesis is the absence of different trends for the treated and
untreated students affecting their level of financial literacy.
We estimate the following model (1). The treatment dummies, D and T, are equal to 1 if a
student i is in class j treated with D or T and 0 otherwise, and yij is our outcome of
interest (inflation, interest and diversification). We will estimate the variation of the
following model:
yij= α + β1 Dij + β2 P1ij + β3 P2ij + β4 DijP1ij + β5 DijP2ij +
+β6Tij + β7TijP1ij + β8TijP2ij + β9 X ij + εij (1)
where the dummy variables P1 and P2 take value 0 before the treatment, 1 three weeks
and three months after the treatment, respectively. β4 , β5 , β7 and β8 are the coefficients of
interest, namely the interactions between each treatment dummy and the dummy period.
They reveal whether the expected mean change in outcome from before to after was
different in the two groups both three weeks and three months later. X is a vector of
individual controls (age, sex, income and predetermined individual characteristics). We
included clustered standard errors at the class level.

� ��
Table 4 indicates that both the traditional and the digitized course increased knowledge
three weeks after the course (the traditional one each outcome, the digitized one 2 out of
3 outcomes). In particular, interest and inflation results are meaningful. In fact, there is a
positive correlation between following one of the financial education programs proposed
and correctly answering questions which require more mathematical skills compared to
the control group. The average marginal effect for diversification outcome for students
who attended the traditional course is 0.27 after three weeks, becoming lower but still
statistically significant after three months (0.15).
However, considering our proxy for financial knowledge, Rough Finlit, the digital course
shows a positive and statistically significant marginal effect only in the short-run (0.24
after three weeks). The traditional course on the other hand shows a more stable marginal
effect both three weeks later (0.32) as well as three months later (0.25). Moreover, in line
(1) (2) (3) (4)
VARIABLES
D Classes_After Three Weeks 0.287** 0.141*** 0.068 0.245***
(0.134) (0.048) (0.069) (0.074)
D Classes_After Three Months 0.101 0.229*** -0.005 0.291
(0.145) (0.059) (0.129) (0.181)
T Classes_After Three Weeks 0.237*** 0.424*** 0.268*** 0.324**
(0.069) (0.148) (0.073) (0.126)
T Classes_After Three Months 0.286*** 0.410*** 0.147** 0.246*
(0.058) (0.074) (0.064) (0.129)
D Classes 0.125** 0.002 0.079 -0.001
(0.057) (0.048) (0.08) (0.045)
T Classes -0.056 -0.057 0.016 -0.005
(0.058) (0.087) (0.028) (0.073)
Control_G_After Three Weeks 0.058 -0.023 0.034 0.05
(0.044) (0.041) (0.032) (0.048)
Control_G_After Three Months 0.089** -0.035 0.009 0.036
(0.04) (0.034) (0.029) (0.037)
Female -0.157*** -0.119*** -0.082** -0.125***
(0.032) (0.040) (0.037) (0.026)
Income 0.019 -0.019 -0.061* -0.029
(0.047) (0.037) (0.033) (0.037)
Economics 0.018 0.101** 0.031 0.037
(0.065) (0.051) (0.057) (0.068)
Math Grade (Above 6) 0.129*** 0.140*** 0.109*** 0.100***
(0.045) (0.043) (0.033) (0.037)
Other Control YES YES YES YES
Observations 1,188 1,192 1,187 1,062
Pseudo R2 0.081 0.061 0.05 0.073
Inflation Rough FinlitDiversification
Table 4 - Diff-in-Diff Probit Estimation of Financial Literacy outcomes - Marginal Effects
Interest
Clustered standard errors at the class level in parentheses *** p<0.01, ** p<0.05, * p<0.1
Other Control weakly or not statistically significant: Age, Repetition, Only Child, Foreign, Foreign Parents, Distance from
the City Centre, Father/ Mother Degree, Father/Mother Freelance.
For each question, the number of missing values is different.
The last column aggregates the questions, so the number of observations is different.

� ��
with PISA results, there is a positive and significant correlation (0.10) between
mathematicsal ability and overall financial knowledge. This kind of effect is also higher
for outcomes strictly related to numerical ability, such as inflation (0.13) and interest
calculation (0.14).
We also see a gender gap emerge. The marginal effect of being female on Rough Finlit is
-0.12. This gap is higher for inflation knowledge (-0.16). Moreover, students who would
like to study Economics at the University, show a positive and significant marginal effect
(0.10) in correctly answering the interest question.
Thus following one of the two types of courses based on the same free available material
published by the Museum of Savings, has positive effects of dissemination of financial
education at negligible costs. In just 8 hours, attending the course increases the
probability of responding correctly to the inflation question after three weeks. While both
treatments are effective in the short-run, the positive effect of the traditional course effect
is persistent significant in the long-run, as well. This being said, the traditional course
does require a higher cost in comparison to the digitized one. Our findings suggest that
the digitized course may be a good starting point from which to build new policies to
improve financial literacy in the shortest possible time but the more expensive traditional
course might be a more suitable alternative if the effects are to persist over a longer time
frame.
In a variant of the model (1), we also split the sample and study the effects of the
treatments conditional on several observable characteristics (for example sex, ability in
math, and other personal characteristics) of the student. For instance, Appendix Tables
A1 and A2 repeat the analysis of Table 4 investigating the existence of differential effects
for females and math-skilled students, respectively. The main results here are: that female
students who attended one of the two courses benefited most from attending the
traditional one in terms of financial literacy learning in the long run. Further, students
with high mathematical skills show increased knowledge of inflation (0.33 is the effect
for the digital treated group in the short run) and interest calculation concepts (0.22 is the
effect for the digital treated group in the long run).

� ��
5. Real and Self-Assessed Financial Literacy
Several findings emerge from the descriptive analysis. Among them, an interesting aspect
is a misalignment between self-assessed and real financial knowledge. In contrast with
the adult population (Di Salvatore et al., 2018), millennials are not overconfident about
their level of financial literacy. In fact, the first survey conducted before the course
reveals that more than 75% of students interviewed (in a sample of 642 students who
answered this question) assessed themselves as having a low financial literacy level, 23%
claim that they know enough about financial concepts and only 1% of students consider
themselves very financially literate. Those who followed one of the two courses showed
an increased self-assessed financial literacy level. Moreover, in comparison to the digital
course, the results suggest that the traditional course does not just increase financial
knowledge but also increases the awareness of the real financial literacy level. To show
this, we will create another dummy variable regarding self-assessed financial literacy. Its
value will be 0 if students consider their level very low, and 1 if they claim to have a
good or a very good level of financial literacy.
Taking into account both previous results as well as results from the Fig. 7, we
can conclude that following one of the two simplified financial education programs, there
is an improvement and greater alignment of real and perceived financial literacy. In fact,
� ��
even if both real and perceived financial literacy are still higher in comparison to the
period before the course, when real financial literacy decreases over the course of time
then, so also does their perception of their own financial knowledge.
These results also show that perceived financial literacy is linked to real financial
knowledge as a whole learning process and not only to the confindence in the single right
answer. For this reason, the control group increased in the share of the right answers but
not in the perceived level of their real financial knowledge. To go deeper, we report the
results graphically below.
Thus regardless of the course the students attended, they were able to increase not only
their knowledge but also the perception of their real knowledge in economics and
finance. In fact, over 34% of the students of the digital course and 50% of students of the
traditional course declared no longer declared a low level but rather a medium perceived
level of financial literacy. The absence of a high perceived level of knowledge is in itself
a good result. Following Brugiavini et al. (2018), we analyze whether self-assessed
knowledge corresponds to real knowledge level before and after and if a gender effect is
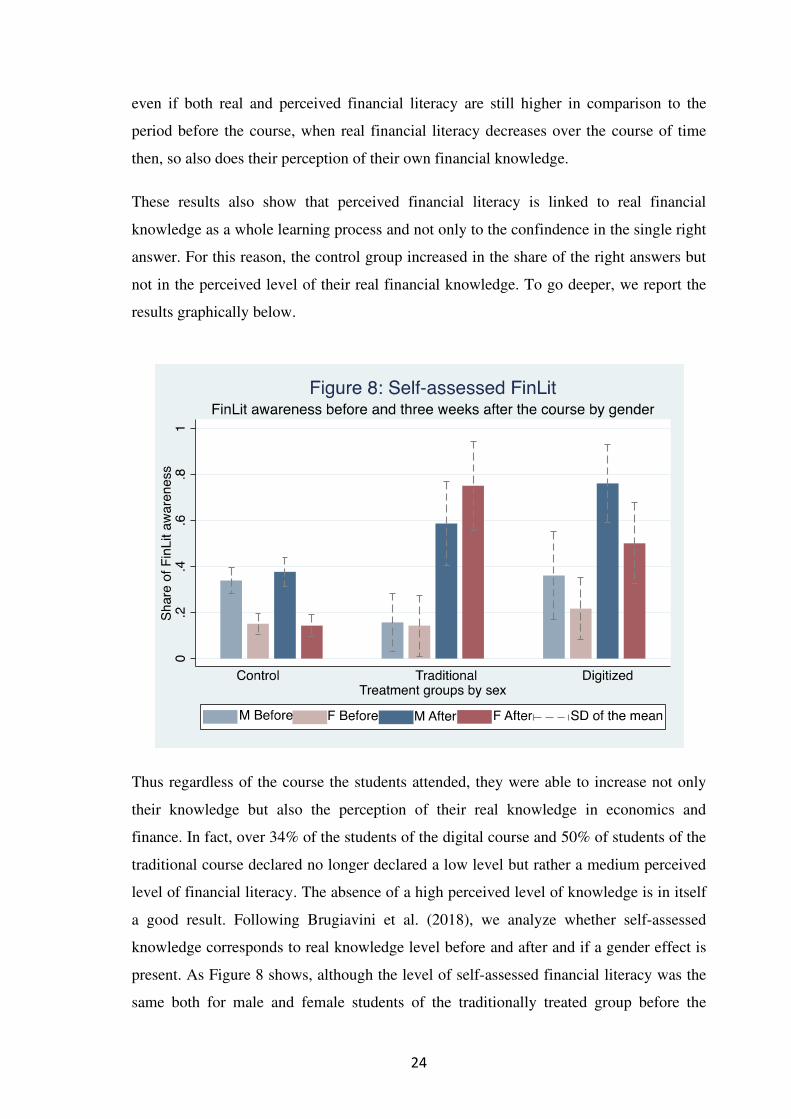
present. As Figure 8 shows, although the level of self-assessed financial literacy was the
same both for male and female students of the traditionally treated group before the

� ��
course, it is higher for female students after the course. In the case of the digital treated
group however, it was male students who showed a greater increase in the self-assessed
level of finaical literacy compared compared to their female school-mates. Comparing
the traditional and the digitized course, a gender effect emerges. We find that awareness
increased exponentially for students who attended the course with the support of a
financial advisor, in particular among females.
This particular design allows us to estimate a diff-in-diff model running a probit
estimation on self-assessed financial knowledge. The self-assessed financial knowledge
dummy takes the value 0 if students consider their financial knowledge level very low
and the value 1 if they claim to have a good or a very good level of financial literacy. To
disentangle the effects, we estimate model (1), with self-assessed financial knowledge as
the dependent variable, first. Then, we repeat the analysis, including real financial
knowledge (Deep FinLit) as an additional control variable. Finally, we add the interaction
terms with Deep FinLit to the previous estimation.

� ��
The main result in Table 5 is that self-assessed financial literacy level increased three
weeks (0.45) and three months (0.46) after for students attended the traditional course,
column (1). This result is robust to the inclusion of the variable for real financial
knowledge Deep FinLit, column (2). Interacting real financial knowledge and treated
groups before and after the course, we find that in line with the Socrate’s Paradox, the
data in column (3) reveals that for people who attended one of the two courses, self-
(1) (2) (3)
Self-Assessed Self-Assessed Self-Assessed
VARIABLES Financial Literacy Financial Literacy Financial Literacy
Deep Finlit_D Classes_After Three Weeks -0.076
(0.082)
Deep Finlit_D Classes_After Three Months 0.115*
(0.06)
Deep Finlit_T Classes_After Three Weeks 0.091
(0.112)
Deep Finlit_T Classes_After Three Months 0.129*
(0.075)
Deep Finlit_D Classes -0.082***
(0.03)
Deep Finlit_T Classes -0.148***
(0.047)
Deep Finlit_After Three Months -0.062**
(0.028)
Deep Finlit 0.076*** 0.109***
(0.017) (0.026)
D Classes_After Three Weeks 0.162 0.1 0.323
(0.111) (0.1) (0.295)
D Classes_After Three Months 0.065 0.037 -0.191
(0.077) (0.073) (0.172)
T Classes_After Three Weeks 0.457*** 0.414*** 0.264
(0.058) (0.053) (0.241)
T Classes_After Three Months 0.463*** 0.385*** 0.172
(0.059) (0.069) (0.251)
Control_After Three Weeks 0.025 0.015 0.018
(0.033) (0.031) (0.094)
Control_After Three Months 0.003 0.001 0.123*
(0.029) (0.028) (0.07)
D Classes 0.107 0.103 0.264***
(0.07) (0.064) (0.103)
T Classes -0.188 -0.179 0.101
(0.123) (0.12) (0.117)
Female -0.200*** -0.170*** -0.171***
(0.04) (0.038) (0.039)
Income 0.044 0.05 0.052
(0.033) (0.033) (0.032)
Economics 0.147** 0.137** 0.137**
(0.057) (0.055) (0.054)
Math Grade (Above 6) 0.022 -0.006 -0.007
(0.043) (0.04) (0.039)
Other Controls YES YES YES
Observations 1,188 1,160 1,160
Pseudo R2 0.122 0.144 0.152
Table 5 - Diff in Diff Probit Estimation of Self-Assesed Financial Literacy - Marginal Effects
Other Control weakly or not statistically significant: Age, Repetition, Only Child, Foreign, Foreign Parents, Distance from
the City Centre, Father/ Mother Degree, Father/Mother Freelance.
Clustered standard errors at the class level in parentheses *** p<0.01, ** p<0.05, * p<0.1

� ��
assessed financial knowledge is negatively correlated with financial knowledge before
the courses. It is however to positively correlated three months after courses (0.115 and
0.126, which is weakly statistically significant). The interpretation here is tricky. The
effect of Deep FinLit is smaller before they take the course. It seems they anticipate that
since they are about to take a course in financial literacy, their level of knowledge on the
topic is inadequate. The course itself does not make any relevant change. However,
students with a higher level of financial literacy are more aware of their knowledge (0.08
and 0.11 in the full specification). The difference in age but also in course hours could
explain the difference in our different results compared with Brugiavini et al. (2018).�
We also see a positive and robust effect (0.14) that emerges between self-assessed
financial literacy and the desire to choose an Economics University in the next future.
However, female students are less confident than their male peers (-0.20 and -0.17 in the
full specifications). This gap is an interesting in the context of overconfidence and
investment choice. The fact that financially educated millennials are more aware of their
financial knowledge supports the idea that they will make better financial decisions in
their future. The lower confidence of female students is in line with the most recent
literature on the financial gender gap (GFLEC, 2020). In our experiment, the difference
in self-assessed financial literacy level becomes smaller after the course. If the treatment
would be addressed mainly to female students, the existing gap could be alleviated or
even eliminated.
Self-assessed knowledge is higher than real knowledge on average (0.26 and 0.10 before
the courses for D and T Classes respectively, column 3). Following this type of financial
education program improves both their knowledge and their awareness of their real
financial literacy level. In particular, running an OLS regression on the difference
between the categorical variables Self-Assessed Financial Literacy and Deep FinLit
before, after and at the end of the course, for each group, we can conclude that � ��
���������� �������������� �������� � �� ��� between real and self-assessed knowledge (-0.28
three weeks after, -0.46 three months later at 1%)�� This result is true especially for the
traditional treatment. The interaction terms are negative for both courses after three
months, in particular, -0.46 is the effect for the traditional one statistically significant at
the 5% level.

� �
6. Conclusion
Nowadays, the need to improve financial literacy is ubiquitous throughout the world. As
the OCSE-PISA report states in its title (OECD, 2014), financial literacy is the necessary
skill for the 21st century. Following the OECD-INFE guidelines, we set up a field
experiment implementing a financial education program called “Futuro Sicuro: Sapere
per sapersi difendere” on a sample of 650 high school students in Italy. So, the
contribution is to identify alternatives ways to teach financial concepts, making the
learning process more straightforward and funny at negligible costs. The school
environment makes it possible to take advantage of the period during which people tend
to be particularly receptive.
We randomly provide two treatments at the class level. One is a theoretical, rule-of-
thumb-based financial education program with the presence of a financial advisor, and
the other is a digitized financial education program using web-based applications based
on the learn-by-playing rule. The study conducted on six classes suggests that both
courses have some positive and statistically significant effects. More research is required
before we can make conclusive statements about which financial education program is
better to spread financial literacy. The two treatments were associated with different costs
but showed similar effects. In particular, three weeks after their conclusion, we find that
the probability that the treated groups correctly answer financial literacy questions
increased by more than 20 percentage points compared to the control group. On top of
that, results also aligned with participants’ realistic assessments of their financial skills. A
follow-up study reveals that only the traditional course seems to confirm the same
statistical significance for two out of three outcomes in the long run.
It appears that the “Futuro Sicuro” setting causes significant improvements and can both
simplify training and rely more on digital power. Findings indicate the opportunity to
obtain higher results also with lower stress, also increasing self-assessed financial
knowledge. Comparing costs between traditional and the digitized course, the last one
outperforms the traditional course. However, even if the traditional course is much more
expensive due to the presence of an expert in the classroom, such as a financial advisor,
its effect seems to be more impressive in the minds of students in the long run in
comparison to the effect of the digitized course. It is focusing on the control group, just
filling out questionnaires more than twice could trigger a mechanism that excites their

� �
curiosity about the theme. Still, no effect emerges on their self-assessed financial literacy.
It could be a compelling public policy starting point.
Moreover, talking about daily problems with a good dose of expertise related to this field
could increase their curiosity as well as their ability to face up good wealth management
requirements. In line with OCSE-PISA reports, a gender gap emerges. Female students
perform worse than male students. The gender gap could be due to non-cognitive skills
and a declared higher comfort of males with technology.
However, several are the next steps to do before reaching a final position about them.
First of all, behavioral aspects must be an object of analysis to understand if the courses
could change them after their attendance. Finally, we can spread the courses wider to
increase financial literacy among millennials. The replication of the study in other areas
could help to detect the presence of specific regional patterns.
REFERENCES
Agarwal, S., Driscoll, J., Gabaix, X., Laibson, D., (2009) “The Age of Reason: Financial
Decisions over the Lifecycle with Implications for Regulation”, Brookings Papers on
Economic Activity. Fall: 51–101.
Alessie, R., Van Rooij, M., Lusardi, A., (2011) “Financial literacy and retirement
preparation in the Netherlands”. Journal of Pension Economics and Finance 10, 527-545.
Almenberg, J., Dreber, A., (2015) “Gender, stock market participation and financial
literacy”. Economics Letters 137, 140-142.
Almenberg, J., Lusardi, A., Save-Soderbergh, J., Vestman, R., (2016) “Attitudes toward
debt and debt behavior”. EIB Institute Working Paper.
Attanasio, O., Bird, M., Cardona-Sosa, L., Lavado, P., (2019) “Freeing Financial
Education via Tablets: Experimental Evidence from Colombia” NBER Working Paper
No. 25929
Becchetti, L., Caiazza, S., and Coviello, D., (2013) “Financial education and investment

� ��
attitudes in high schools: evidence from a randomized experiment”. Applied Financial
Economics 23, 817–836.
Behrman, J.R., Mitchell, O.S., Soo, C.K., Bravo, D., (2012) “The effects of financial
education and financial literacy”. American Economic Review: Papers & Proceedings
102, 300-304. 18
Bernheim, B.D., (1995) “Do Households Appreciate Their Financial Vulnerabilities? An
Analysis of Actions, Perceptions and Public Policy.” Tax Policy and Economic Growth,
1-30. Washington, D.C.: American Council for Capital Formation.
Bernheim, B.D., Garret, D.M., Maki, D.M., (2001) “Education and saving: The long-
term effects of high school financial curriculum mandates”. Journal of Public Economics
80(3), 435-465.
Bernheim, B.D., and Garrett, D.M. (2003) “The effects of financial education in the
workplace: evidence from a survey of house-holds”. Journal of Public Economics 87,
1487–1519.
Brugiavini, A., Cavapozzi, D., Padula, M., Pettinicchi, Y., (2018) “On the effect of
financial education on financial literacy: evidence from a sample of college students” in
Journal of Pension Economics And Finance, vol. "" (ISSN 1474-7472).
Bruhn, M., de Souza Leao, L., Legovini, A., Marchetti, R. and Zia, B. (2016) “The
impact of high school financial education: evidence from a large-scale evaluation in
Brazil”. American Economic Journal: Applied Economics 8, 256–295.
Bucciol, A., Manfrè, M., Veronesi, M., (2018) “The Role of Financial Literacy and
Money Education on Wealth Decisions” Working Papers 05/2018, University of Verona,
Department of Economics.
Bucciol, A., Miniaci, R., (2018) “Financial risk propensity, business cycles and
perceived risk exposure”. Oxford Bulletin of Economics and Statistics 80(1), 160-183.
Bucciol, A., Veronesi, M., (2014) “Teaching children to save: What is the best strategy
for lifetime savings?”. Journal of Economic Psychology 45, 1-17.

� ��
Bucciol, A., Zarri, L., (2019) “Saving education received in early life and future
orientation in adulthood”. Journal of Financial Counseling and Planning, 30(1), 67-82.
Clark, R., and D’Ambrosio, M., (2008) “Adjusting retirement goals and saving behavior:
the role of financial education”. In Lusardi A (ed.), Overcoming the Saving Slump: How
to Increase the Effectiveness of Financial Education and Saving Programs. Chicago:
University of Chicago Press, pp. 237–256.
Clark, R.L., Morrill, M.S., and Allen, S.G., (2012a) “Effectiveness of employer- provided
financial information: hiring to retiring”. American Economic Review 102, 314–318.
Clark, R.L., Morrill, M.S., and Allen, S.G., (2012b) “The role of financial literacy in
determining retirement plans”. Economic Inquiry 50, 851–866.
Collins, J. M., (2011). “Improving Financial Literacy: The Role of Nonprofit Providers.
In Financial Literacy: Implications for Retirement Security and the Financial
Marketplace”. Eds. O. S. Mitchell and A. Lusardi. Oxford: Oxford University Press: 268-
187.
Collins, J. M., Colin M. O’Rourke, (2010) “Financial Education and Counseling: Still
Holding Promise”. Journal of Consumer Affairs 44(3): 483-489.
Dau, E., (1999) “Child’s play. Revisiting play in early childhood settings”. Sydney,
Australia: Maclennan Petty.
Di Salvatore, A., Franceschi, F., Neri, A., Zanichelli, F., (2018) “Measuring The
Financial Literacy of The Adult Population: The Experience Of Banca D’Italia”,
Questioni di Economia e Finanza n. 435.
Drexler, A., Fischer, G., Schoar, A., (2014) “Keeping It Simple: Financial Literacy And
Rules Of Thumb” American Economic Journal: Applied Economics Vol. 6, No. 2, April
2014 (pp. 1-31).
Duflo, E., Glennerster, R., and Kremer, M., (2008) “Using Randomization in
Development Economics Research: A Toolkit.” T. Schultz and John Strauss, eds.,
Handbook of Development Economics. Vol. 4. Amsterdam and New York: North

� ��
Holland.
Fornero, E., Monticone, C., (2011) “Financial Literacy and Pension Plan Participation
in Italy”. Journal of Pension Economics and Finance 10(4): 547-564.
Fornero, E., Rossi, M., Sansone, D., (2016) “Four bright coins shining at me, Financial
education in childhood, financial confidence in adulthood”. Center for research on
pensions and welfare policies Working Paper, 162/16.
Franceschi, F., Romagnoli, A., Traclò., F., (2017) “Rilevazione sulle iniziative di
educazione finanziaria in Italia nel triennio 2012-14”, Roma.
Friedman, M., (1957) “A Theory of the Consumption Function”. Princeton: Princeton
University Press.
Frisancho, V., (2018) “The Impact of School-Based Financial Education on High School
Students and Their Teachers: Experimental Evidence from Peru”. IDB Working Paper
No. IDB-WP-871. Available at SSRN: https://ssrn.com/abstract=3305510 or http://sci-
hub.tw/10.2139/ssrn.3305510
GFLEC - FINRA, (2020) “Mind the Gap: Women, Men, and Investment Knowledge”
FACT SHEET https://gflec.org/research/?item=21936
Hackman, J., J., (2006) “Skill Formation and the Economics of Investing in
Disadvantaged Children”, Science, 30 Jun 2006: Vol. 312, Issue 5782, pp. 1900-1902.
Hasler, A., Lusardi, A., Yakoboski, P., J., (2018) “Millennial Financial Literacy and Fin-
tech Use: Who Knows What in the Digital Era”. TIAA Institute – GFLEC Report.
Harrison, G. W. and List, J., (2004) “Field Experiments” Journal of Economic Literature,
Vol. 42, No. 4 (Dec., 2004), pp. 1009-1055
Hathaway, I., Khatiwada, S., (2008) “Do financial education programs work? FRB of
Cleveland Working Paper”, 08-03.
Hsu, J., (2011) “Aging and Strategic Learning: The Impact of Spousal Incentives on
Financial Literacy” Networks Financial Institute Working Paper 2011-WP-06, Indiana

� ��
State University.
Huston, S., (2010) “Measuring Financial Literacy”. Journal of Consumer Affairs, 44:
296–316.
Jappelli, T., Padula, M., (2013) “Investment in financial literacy and saving decisions”.
Journal of Banking & Finance 37, 2779–2792.
Jappelli, T., Padula, M., (2011) “Investment in Financial Knowledge and Saving
Decisions”. CSEF Working Paper 272, University of Salerno.
Jappelli, T., Pistaferri, L., (2018) “The Economics of Consumption: Theory and
Evidence”. OUP USA
Johansson, E., Pramling Samuelsson, I., (2006) Lek och la �roplan. Mo �ten mellan barn
och la �rare i fo �rskola och skola [Play and curriculum; in Swedish] (Go �teborg Studies in
educational Sciences 249.). Go �teborg, Sweden: Acta Universitatis Gothoburgensis.
Klapper, L., Lusardi, A., Panos, G., (2012) “Financial Literacy and the Financial Crisis”.
NBER Working Paper 17930.
Klapper, L., Lusardi, A., Van Oudheusden, P., (2015) “Financial Literacy around the
World: insights from the S&P Global Finlit Survey”.
Levin, D., (1996) “Endangered play, endangered development: A constructivist view of
the role of play in development and learning”. In A. Phillips (Ed.), Topics in early
childhood education 2: Playing for keeps. St. Paul, MI: Inter-Institutional Early
Childhood Consortium, Redleaf Press.
Lührmann, M., Serra-Garcia, M., and Winter J., (2015) “Teaching teenagers in finance:
does it work?” Journal of Banking & Finance 54, 160–174.
Lusardi, A., de Bassa Scheresberg, C., (2013) “Financial Literacy and High-Cost
Borrowing in the United States,” National Bureau of Economic Research Working Paper
18969.
Lusardi, A., de Bassa Scheresberg, C., Avery, M., (2018) “Millennial Mobile Payment
Users: A Look into their Personal Finances and Financial Behaviors” GFLEC working

� ��
papers.
Lusardi, A., Hasler, A., (2019) “Millennials’ Engagement with Online Financial
Education Resources and Tools: New Survey Insights and Recommendations” GFLEC
working papers.
Lusardi, A, Mitchaud, P., C., Mitchell. O.S., (2014) “Optimal Financial Knowledge and
Wealth Inequality”, Global Financial Literacy Excellence Center Working Paper No.
2014-3.
Lusardi, A., Mitchell, O.S., (2007b) Baby boomer retirement security: The roles of
planning, financial literacy, and housing wealth. Journal of Monetary Economics 54, 205-
224.
Lusardi, A, Mitchell. O.S., (2014) “The Economic Importance of Financial Literacy:
Theory and Evidence”, Journal of Economic Literature 52, 5-44.
Lusardi, A., Mitchell, O., S., (2011) “Financial Literacy And Planning: Implications For
Retirement Wellbeing”, National Bureau Of Economic Research 1050 Massachusetts.
Lusardi, A., Tufano, P., (2009) “Debt Literacy, Financial Experiences, and
Overindebtedness”, NBER Working Paper 14808.
Lusardi, A., Tufano, P., (2009b) “Teach Workers about the Peril of Debt”, Harvard
Business Review. November: 22–24.
Lusardi, A., Shneider, D., J., Tufano, P., (2011) “Financially Fragile Households:
Evidence and Implications”, NBER Working Paper No. 17072.
Hasler, A., Lusardi, A., Oggero, N., (2018) “Financial Fragility in the US: Evidence and
Implication”, GFLEC report.
Montanaro, P., Romagnoli, A., (2016) “La financial literacy in PISA 2012: un’analisi dei
risultati e il ruolo delle famiglie in Italia”, Questioni di Economia e Finanza, (Occasional
Papers).

� ��
OECD, (2005) “Recommendation on Principles and Good Practices for Financial
Education and Awareness”.
OECD, (2014) “PISA 2012 Results: Students and Money. Financial Literacy Skills for the
21st Century”, Vol. VI, Parigi, 2014.
OECD, (2019) “PISA 2018 Results (Volume I): What Students Know and Can Do”,
PISA, OECD Publishing, Paris, https://doi.org/10.1787/5f07c754-en.
OECD, (2020) “PISA 2018 Results (Volume IV): Are Students Smart about Money?”
PISA, OECD Publishing, Paris, http://sci-hub.tw/10.1787/48ebd1ba-en.
Otto, A., Webley, P., (2016) “Saving, selling, earning, and negotiating: How adolescents
acquire monetary lump sums and who considers saving”. Journal of Consumer Affairs
50, 342-371.
Pramling Samuelsson, I., Asplund Carlsson, M., (2008) “The Playing Learning Child:
Towards a pedagogy of early childhood”, Scandinavian Journal of Educational Research,
52:6, 623-641, DOI: 10.1080/00313830802497265
Romagnoli, A., and Trifilidis, M., (2013) “Does financial education at school work?
Evidence from Italy.” Questioni di Economia e Finanza (Occasional Papers) 155, Bank of
Italy, Economic Research and International Relations Area.͒
Sherraden, M., Johnson, L., Guo, B., Elliott, W., (2009) “Financial capability in
children: Effects of participation in a school-based financial education and saving
programme”. Journal of Family and Economic Issues 32, 385-399.
Sundarasen, S.S.D., Rahamn, M.S., Otham, N.S., Danaraj, J., (2016) “Impact of financial
literacy, financial socialization agents, and parental norms on money management”.
Journal of Business Studies Quarterly 8(1), 137-153.
Van Rooij, M., A., Lusardi, and R., Alessie (2011) “Financial Literacy and Stock Market
Participation”. Journal of Financial Economics 101(2): 449–472.

� ��
Van, Rooij M., Lusardi, A., Alessie, R., (2012) “Financial literacy, retirement planning
and household wealth”. Economic Journal 122, 449-478.
Varcoe, K., Peterson, S., Gabertt, C., Martin, A., Costello, C., (2001) “What teens want to
know about financial management”. Journal of Family and Consumer Sciences 93(2), 30-
34.
Visco, I., (2010) “Financial education in the aftermath of the financial crisis” -
Symposium on Financial Education: improving financial literacy.
World Bank (2013) “Making Sense of Financial Capability Surveys around the World: A
Review of Existing Financial Capability and Literacy Measurement Instruments”. World
Bank,Washington,DC.http://responsiblefinance.worldbank.org/~/media/GIAWB/FL/Doc
uments/Misc/Financial-Capability- Review.pdf
World Bank “Financial Education Programs and Strategies: Approaches and Available
Resources”, World Bank, Washington, DC. http://responsiblefinance.worldbank.org

� ��
APPENDIX
The table A1 reporting diff-in-diff probit estimation for female treated students reveals
that both courses improve financial outcomes. The average marginal effect of attending
the digitized course on female Rough FinLit (0.21) is statistically significant but only in
the short run. However, the average marginal effect of traditional course is highly
statistically significant just three months after the course for female students (0.22).
However, table 2A, shows in columns (1) and (2) that among students with high ability
in math attending one of the two courses, the marginal effect is higher for numeracy
outcomes such as inflation and interest calculation. Moreover, in column (4), they show a
(1) (2) (3) (4)
VARIABLES
Female_D Classes_After Three Weeks 0.271* 0.138* 0.129 0.206**
(0.148) (0.072) (0.143) (0.092)
Female_D Classes_After Three Months 0.142 0.152 -0.016 0.291
(0.124) (0.095) (0.171) (0.201)
Female_T Classes_After Three Weeks 0.158 0.397* 0.361*** 0.22
(0.130) (0.232) (0.103) (0.161)
Female_T Classes_After Three Months 0.385*** 0.382*** 0.482*** 0.222***
(0.109) (0.103) (0.120) (0.077)
Female_D Classes 0.129 -0.013 0.09 -0.008
(0.083) (0.103) (0.075) (0.075)
Female_T Classes -0.077 -0.036 -0.146** -0.017
(0.064) (0.108) (0.060) (0.097)
Female_Control G_After Three Weeks 0.112 -0.022 -0.047 0.120*
(0.073) (0.064) (0.055) (0.062)
Female_Control G_After Three Months 0.083 -0.072 -0.004 0.093*
(0.052) (0.055) (0.049) (0.055)
Female_Control G -0.247*** -0.105** -0.081* -0.205***
(0.046) (0.053) (0.047) (0.041)
Income 0.016 -0.027 -0.064* -0.031
(0.047) (0.036) (0.034) (0.036)
Economics 0.021 0.109** 0.036 0.044
(0.063) (0.052) (0.054) (0.067)
Math Grade (Above 6) 0.135*** 0.147*** 0.112*** 0.105***
(0.044) (0.042) (0.032) (0.037)
Other Control YES YES YES YES
Observations 1,189 1,192 1,187 1,062
Pseudo R2 0.076 0.049 0.051 0.064
Rough Finlit
Table 1A - Diff-in-Diff Probit Estimation of Financial Literacy outcomes - Marginal Effects (Female)
Clustered standard errors at the class level in parentheses *** p<0.01, ** p<0.05, * p<0.1
Other Control weakly or not statistically significant: Age, Repetition, Only Child, Foreign, Foreign Parents, Distance from
the City Centre, Father/ Mother Degree, Father/Mother Freelance.
Inflation Interest Diversification

� �
high and positive statistically significant average marginal effect on the overall financial
knowledge just for the traditional course in the short run (0.30).
�
�
�
(1) (2) (3) (4)
VARIABLES
Math_D Classes_After Three Weeks 0.115 -0.007 -0.226 -1.415
(0.234) (0.209) (0.206) (71.502)
Math_D Classes_After Three Months -0.377 -0.028 -0.426** -1.39
(0.254) (0.218) (0.207) (73.688)
Math_T Classes_After Three Weeks -0.174 -0.034 -0.199 -0.033
(0.246) (0.274) (0.262) (0.266)
Math_T Classes_After Three Months -0.45 -1.292 -1.462 -1.42
(0.278) (35.463) (33.768) (96.273)
Math_D Classes -0.175 -0.131 0.197 -0.072
(0.148) (0.142) (0.139) (0.133)
Math_T Classes 0.153 -0.184 0.15 -0.01
(0.166) (0.147) (0.139) (0.144)
Math_Control G 0.171*** 0.157*** 0.104** 0.115**
(0.05) (0.048) (0.044) (0.046)
D Classes_After Three Weeks 0.213 0.14 0.182 1.549
(0.179) (0.160) (0.149) (71.502)
D Classes_After Three Months 0.387* 0.244 0.25 1.564
(0.216) (0.170) (0.160) (73.688)
T Classes_After Three Weeks 0.360* 0.434* 0.380* 0.338*
(0.201) (0.222) (0.198) (0.205)
T Classes_After Three Months 0.621*** 1.657 1.472 1.573
(0.240) (35.463) (33.768) (96.272)
Control G_Three Weeks After 0.073 -0.05 0.014 0.032
(0.055) (0.051) (0.047) (0.051)
Control G_Three Months After 0.108** -0.03 0.019 0.031
(0.054) (0.05) (0.046) (0.05)
D Classes 0.230** 0.08 -0.021 0.044
(0.116) (0.11) (0.097) (0.104)
T Classes -0.168 0.062 -0.072 0.001
(0.139) (0.118) (0.105) (0.117)
Female -0.156*** -0.120*** -0.083*** -0.126***
(0.027) (0.027) (0.025) (0.026)
Income 0.022 -0.021 -0.060** -0.028
(0.03) (0.029) (0.027) (0.029)
Economics 0.024 0.110** 0.033 0.048
(0.044) (0.044) (0.04) (0.043)
Other Control YES YES YES YES
Observations 1,189 1,192 1,187 1,062
Pseudo R2 0.090 0.068 0.059 0.086
Rough FinlitDiversification
Clustered standard errors at the class level in parentheses *** p<0.01, ** p<0.05, * p<0.1
Other Control weakly or not statistically significant: Age, Repetition, Only Child, Foreign, Foreign Parents, Distance from
the City Centre, Father/ Mother Degree, Father/Mother Freelance.
Table 2A - Diff-in-Diff Probit Estimation of Financial Literacy outcomes - Marginal Effects (Math Skills)
Inflation Interest

� �
�
In addition, testing the differences between Rough FinLit three weeks and three months
after, the knowledge acquired through a traditional simplified course is not only more
persistent in comparison to the digitized treatment, but these results are also independent
of the incentives given to the students for the second survey (after three weeks from the
end of the course). However, if we consider a cost-benefit analysis, it could be possible to
opt for the digitized one since students can watch at the video whenever they want to fix
better the concept or to refresh their memory, at the only cost of internet Wi-fi
connection.

� ��
The real-financial-literacy gap between males and females treated in both courses reveals
different results (Table 3A). For the traditional one, it is statistically significant before,
but the difference is filled with attending the course. Instead, the gender gap becomes
weakly statistically significant after students attended the digitized course. A gender gap
in the total sample as well as in the control group emerged before the course and it is
persistent, even if reduced, also after the course.
To wrap up, considering a diff-in-diff analysis in financial knowledge between each
group, the main message is that there is no statistically significant difference between the
increment both of real financial literacy and self-assessed financial literacy between
traditional and digitized treated. In contrast, for both of them, their difference between
students who follow a financial literacy program in comparison with those who do not
attend anyone is higher and highly statistically significant. In particular, the traditional
course increased on average real financial literacy level by more than 28 percentage
points. A diff-in-diff analysis reveals that the average marginal effect is 0.32 in the short
run and 0.24 in the long run. Moreover, the increment in self-assessed knowledge is in
line with the real level. Finally, their financial awareness and real financial literacy level
are aligned among each group. The probability of becoming more aware among those
who have a high level of financial knowledge increased in each group of treated in
comparison with the control group (it increased more in the traditional one even if their
difference is not statistically significant). Their differences from the control group are

� ��
positive and highly statistically significant. At the same time, following a financial
education program decreases the probability of students who self-assessed a low level of
financial literacy in comparison with the control group.