financial information alfa laval in brief alfa laval is a ... · [email protected] tel: +49 69...
TRANSCRIPT

An
nu
al Rep
ort 2014 – S
ustainability R
epo
rt – Co
rpo
rate Go
vernance Rep
ort
CC00322EN 1503
Annual Report 2014
Financial information
Analysts tracking Alfa Laval
Alfa L
aval
3 ABOUT ALFA LAVALAlfa Laval in brief 3
2014 in brief 5
President’s comments 7
Structural growth drivers 10
Vision, business concept, goals and strategy 12
The share 16
Research and development 18
Key technologies 20
Adding creativity to food processing 24
Divisions 26
Equipment Division 28
Process Technology Division 30
Marine & Diesel Division 32
Operations Division 34
Service 36
Employees 38
40 SUSTAINABILITYReport 40
44 CORPORATE GOVERNANCE Introduction by the Chairman of the Board 45
Corporate Governance Report 2014 46
Board of Directors and auditors 52
President and Group management 54
Board of Directors’ report on internal control 57
Auditor’s statement on the
Corporate Governance Report 58
Contents
Årsredovisning 2014
Tillbaka till framtiden
Alfa Laval uses a number of channels to provide information about the company’s operations and financial development. The website – www.alfalaval.com/investors – is updated continuously with annual reports, quarterly reports, press releases and presentations. Annual reports are also sent to those share-holders who have notified the company that they wish to receive a copy.
Conference calls with analysts, investors and the media are arranged by Alfa Laval in conjunction with the publication of the company’s quarterly reports. A capital markets day is organized each year, during which represent-atives from the financial market are offered more in-depth information regarding
the company’s operations. In addition, representatives of Group management meet with analysts, investors and journalists on an ongoing basis to ensure that they have correct and current information. Pursuant to the company’s agreement with Nasdaq OMX Stockholm, information that could have an effect on the share price and that is not yet publicly known is never disclosed in conjunction with these types of meetings or contacts. Alfa Laval employs a so-called silent period of three weeks prior to the publication of a quarterly report. The President and Chief Financial Officer do not meet or speak to representatives from the financial market during this period.
Financial information during 2015
Alfa Laval will publish quarterly reports on the following dates in 2015:
Year-end report 2014 February 3First-quarter report April 23Second-quarter report July 16Third-quarter report October 27
Shareholder information
Gabriella GrotteInvestor Relations ManagerTel: +46 46 36 74 82Mobile: +46 709 78 74 82E-mail: [email protected] or [email protected]
ABG Sundal CollierAnders [email protected]: +46 8 5662 8674
Bank of America Merrill LynchBen [email protected]: +44 20 7996 4783
Barclays CapitalLars [email protected]: +44 20 3134 1156
CarnegieNatalie [email protected]: +46 8 5886 92 36
Citi Investment ResearchKlas [email protected]: +44 207 986 4018
CommerzbankSebastian [email protected]: +49 69 136 89800
Credit SuisseMax [email protected]: +44 20 7883 8501
Danske BankOscar [email protected]: +46 8 568 806 06
Deutsche BankAndreas [email protected]: +44 20 754 565 80
DNB MarketsChrister Magnergå[email protected]: +46 8 473 48 44
BESI GRUPO NOVO BANCONick [email protected]: +44 20 3364 6766
Goldman Sachs InternationalGunther [email protected]: +44 20 7552 3237
Handelsbanken Capital MarketsPeder Frölé[email protected]: +46 8 701 12 51
HSBC BankColin [email protected]: +44 20 7991 6592
JP MorganGlen [email protected]: +44 20 7155 6113
Kepler CheuvreuxJoakim Hö[email protected]: +46 8 723 51 63
Nordea BankFredrik [email protected]: +46 8 534 919 20
Pareto SecuritiesDavid [email protected]: +46 8 402 52 72
SEBDaniel [email protected]: +46 8 522 296 75
SwedbankAnders [email protected]: +46 8 585 900 93
UBSSven [email protected]: +49 69 1369 8278
ÅlandsbankenLars Sö[email protected]: +46 8 791 46 57
Annual General Meeting 2015
The Annual General Meeting of Alfa Laval AB (publ) will be held on Thursday, April 23, 2015 at 4:00 p.m. at Sparbanken Skåne Arena, Klostergården’s sports area, Stattenavägen, in Lund. Light refreshments will be served after the Meeting. In accordance with the company’s Articles of Association, notice of the Annual General Meeting will be inserted as an announcement in the Swedish Official Gazette and on the company’s website not more than six and not less than four weeks prior to the Meeting. An announcement that notification has been issued will be placed in Dagens Nyheter. As a service to existing shareholders, information about the Annual General Meeting can be sent to them by mail. The following information concerning the Meeting does not constitute legal notice.
Notification of participation Shareholders who wish to participate in the Meeting and be entitled to vote must be entered in the share register maintained by Euroclear AB not later than Friday, April 17, 2015, and register their intention to participate, along with any assistants, not later than Friday, April 17, 2015, preferably before 12:00 noon. Shareholders whose shares are held in trust must temporarily re-register their shares in their own names not later than April 17. Shareholders must request such registration from the trustee a few working days prior to the deadline.
Notification of participation shall be made to:
– Alfa Laval AB, Group Staff Legal, Box 73, SE-221 00 Lund, Sweden
– E-mail: [email protected]
– Fax: +46 46 36 71 87
– Website: www.alfalaval.com
– Tel: +46 46 36 74 00 or +46 46 36 65 00.
Shareholders must state their name, personal identity number and telephone number on the notice of participation. If participation is by proxy, a power of attorney or authorization must be submitted to the company prior to the Meeting.
Meeting program 1:30 p.m. Bus departs from Sparbanken Skåne Arena for Alfa Laval’s
production unit for heat exchangers in Lund 3:30 p.m. Registration starts 4:00 p.m. Start of Meeting
Tour of production facility in LundPrior to the Annual General Meeting, participants will have an opportunity to view the production of plate heat exchangers at the plant in Lund. The tour will begin with assembly at Sparbanken Skåne Arena, Klostergården’s sports area, Stattenavägen in Lund not later than 1:30 p.m. Buses will be provided for transportation to the plant and back to the Meeting venue. Registration for the tour must be made in conjunction with registration for participation in the Annual General Meeting. Please note that the number of participants is limited.
Dividend The Board of Directors and the President propose to the Annual General Meeting that a dividend of SEK 4.00 per share be paid. The proposed re-cord date for this dividend is Monday, April 27, 2015. If the Meeting ap-proves the proposal, the dividend is expected to be distributed on Thursday, April 30, 2015. However, the record date and dividend payment date may be postponed due to the technical procedures required for exe-cuting the payment.
Back to the future
Soy sauce.Since long a key ingredient in Eastern cooking. Nowadays also a must on Western world dining tables. Invented in the 5th century BC. The place: China. Today the country turns out some five million tonnes soy sauce annually – more than half of world output. Not very surprisingly, production methods are traditional and labour intensive. Enter Alfa Laval. By introducing our leading-edge separators and evaporators we help modernize and streamline soy sauce manufacturing. Processing time can be substantially reduced. Energy is saved. Fewer workers are needed. Cleaning becomes easier. Hygiene is improved. All adding up to refined quality. No wonder seven out of the ten main Chinese soy producers have implemented our technology recently. Taking them back to the future.
Pure Performance. Food. Sanitary. Energy. Marine. Engineering. Chemicals. Environment. You name the industry. Alfa Laval is helping them to purify and refine their processes and products. Time and time again. Our equipment, systems and service are hard at work in more than 100 countries. Our driving force is to create better, more comfortable living conditions for all mankind. And, whenever possible, adding an extra spice to life.
Alfa Laval in brief
Alfa Laval is a leading global provider of spe-cialized products and engineered solutions. The company’s equipment, systems and services are dedicated to helping customers optimize the performance of their processes. Time and time again. Alfa Laval helps customers to heat, cool, separate and transport products such as oil, water, chemicals, beverages, foodstuffs, starch and pharmaceuticals. Alfa Laval’s worldwide organization works closely with customers in 100 countries to help optimize their processes.
More information on the Internet
Alfa Laval’s website is continuously updated with new information, including contact details for all countries.
Read more at www.alfalaval.com andwww.alfalaval.com/investors
59 FINANCIAL STATEMENTSBoard of Directors’ Report 60
Consolidated cash flows 72
Comments to the consolidated cash-flows 73
Consolidated comprehensive income 74
Comments to the consolidated
comprehensive income 75
Consolidated financial position 78
Comments on the consolidated
financial position 80
Changes in consolidated equity 81
Comments on changes
in consolidated equity 83
Parent company cash flows 84
Parent company income 84
Parent company financial position 85
Changes in parent company equity 86
Notes to the financial statements 87
Accounting principles 87
Objectives, policies and processes
for managing capital 96
Financial risks 97
Operational risks 101
Notes 104
Proposed disposition of earnings 134
Auditor’s report 135
Ten-year overview 136
Definitions 138
Financial information 139
Annual General Meeting 139

3 Alfa Laval in brief
Ten largest markets (SEK million)
The goal is to grow an average of at least 8 percent annually measured over a business cycle.
* Excluding exchange-rate variations.
The goal is to have an operating margin of 15 percent measured over a business cycle.
The goal is to have a return on capital employed of at least 20 percent.
Order intake in Alfa Laval’s top ten markets 2014.
Net salesRevenues from goods sold and services performed that are part of the ordinary operations of the Group, after deduction for given discounts, value added tax and other tax directly linked to the sales.
Comparison distortion itemsItems that do not have any link to the normal oper-ations of the Group or that are of a non-recurring nature, where a reporting together with other items in the consolidated comprehensive income statement would have given a comparison distortion effect that would have made it difficult to judge the development of the ordinary operations for an outside viewer.
Orders receivedIncoming orders during the year, calculated in the same way as net sales. The orders received give an indication of the current demand for the Group’s products and services, that with a varying delay appear in net sales.
Order backlog at year-endIncoming orders that not yet have been invoiced. The order backlog at the end of the year is equal to the sum of the order backlog at the beginning of the year plus the orders received during the year less the net sales for the year. It gives an indication of how the net sales can be expected to develop in the future.
EBITA“Earnings Before Interest, Taxes and Amortisation” or operating income before amortisation of step-up values. This measure of result is fully comparable over time independent of the financing costs and the amortisation of step-up values that from time to time burden the Group.
EBITDA“Earnings Before Interest, Taxes, Depreciation and Amortisation” or operating income before depreciation and amortisation of step-up values. This measure of result is fully comparable over time independent of the financing costs and the depreciation and amortisation of step-up values that from time to time burden the Group.
EBITA-margin %Operating income before amortisation of step-up values (EBITA) in relation to net sales, expressed in percent.
EBITDA-margin %Operating income before depreciation and amorti-sation of step-up values (EBITDA) in relation to net sales, expressed in percent.
Adjusted EBITASame as EBITA, but adjusted for comparison distortion items.
Adjusted EBITDASame as EBITDA, but adjusted for comparison distortion items.
Adjusted EBITA-margin %Same as EBITA-margin, but adjusted for comparison distortion items.
Adjusted EBITDA-margin %Same as EBITDA-margin, but adjusted for comparison distortion items.
Profit margin %Result after financial items in relation to net sales, expressed in percent.
Capital turnover rate, timesNet sales in relation to average capital employed, expressed as a multiple of capital employed. Shown excluding and including goodwill, step-up values and the corresponding deferred tax liability.
Capital employedAverage total assets less liquid funds, other long-term securities, accrued interest income, operating liabilities and other non-interest bearing liabilities, including tax and deferred tax, but excluding accrued interest costs. Shown excluding and including goodwill and step-up values and the corresponding deferred tax liability. Shows the capital that is used in the operations. The capital employed for the Group differs from the net capital for the segments concerning taxes, deferred taxes and pensions. Return on capital employed %EBITA in relation to average capital employed, expressed in percent. Shown excluding and in-cluding goodwill and step-up values and the cor-responding deferred tax liability.
Return on equity %Net income for the year in relation to average equi-ty, expressed in percent.
Solidity %Equity in relation to total assets, expressed in percent.
Net debtInterest-bearing liabilities including interest-bearing pension liabilities and capitalised finance leases less liquid funds.
Net debt to EBITDA, timesNet debt in relation to EBITDA is one of the covenants of Alfa Laval’s syndicated loan and an important key figure when reviewing the proposed dividend.
Debt ratio, timesNet debt in relation to equity, expressed as a multi-ple of the equity.
Interest coverage ratio, timesEBITDA plus financial net increased by interest costs in relation to interest costs. Expressed as a multiple of interest costs. Gives an expression for the Group’s ability to pay interest. The reason EBITDA is used as the starting point is that this forms the starting point for a cash flow perspective on the ability to pay interest. Financial items classified as comparison distorting are excluded from the calculation.
Cash flow from operating activitiesShows the Group’s cash flow from operating activities, that is the cash flow generated in the daily operational activities.
Cash flow from investing activitiesShows the Group’s cash flow from investing activities, i.e. the cash flow generated by mainly the Group’s divestments and acquisitions of businesses and divestments of real estate.
Cash flow from financing activitiesShows the Group’s cash flow from financing activities, that is mainly the cash flow impact of the Group’s loans in terms of interest payments and amortisation.
InvestmentsInvestments represent an important component in the cash flow for the Group. The level of investments during a couple of years gives a picture of the capacity build up in the Group.
Average number of employeesThe costs that are related to the number of employees represent a large part of the total costs for the Group. The development of the average number of em-ployees over time in relation to the development of the net sales therefore gives an indication of the cost rationalisation that is taking place.
Earnings per shareNet income for the year attributable to the equity holders of the parent divided by the average number of shares.
Free cash flow per shareThe sum of cash flows from operating and investing activities for the year divided by the average number of shares. This represents the cash flow available for interest payments, amortisation and dividends to investors.
Definitions
Ten-year overview
Consolidated
SEK millions, unless otherwise stated 2014 2013 * 2012 ** 2011 2010 2009 2008 2007 2006 2005
Key ratios Orders received 36,660 30,202 30,339 28,671 23,869 21,539 27,464 27,553 24,018 18,516
Order backlog at year end 22,293 14,568 14,468 13,736 11,552 11,906 14,310 14,730 12,359 7,497
EBITA 5,575 4,914 4,883 5,117 4,772 4,360 5,992 5,034 2,891 1,692
EBITDA 6,140 5,360 5,330 5,566 5,197 4,751 6,296 5,299 3,153 1,957
EBITA-margin % 15.9% 16.5% 16.4% 17.9% 19.3% 16.7% 21.5% 20.3% 14.6% 10.4%
EBITDA-margin % 17.5% 18.0% 17.9% 19.4% 21.0% 18.2% 22.6% 21.3% 15.9% 12.0%
Adjusted EBITA 5,895 4,914 4,934 5,287 4,682 4,585 6,160 4,980 3,010 1,765
Adjusted EBITDA 6,460 5,360 5,381 5,736 5,107 4,976 6,464 5,245 3,273 2,030
Adjusted EBITA-margin % 16.8% 16.5% 16.5% 18.5% 18.9% 17.6% 22.1% 20.0% 15.2% 10.8%
Adjusted EBITDA-margin % 18.4% 18.0% 18.0% 20.0% 20.7% 19.1% 23.2% 21.1% 16.5% 12.4%
Profit margin % 11.8% 14.0% 15.2% 16.3% 17.7% 14.4% 19.2% 18.3% 12.0% 6.7%
Excl. goodwill and step-up values:
Capital turnover rate, times 7.9 6.4 6.7 6.3 5.6 5.2 5.6 6.4 6.3 5.5
Capital employed 4,447 4,657 4,430 4,560 4,399 5,052 4,973 3,863 3,137 2,958
Return on capital employed % 125.4% 105.5% 110.2% 112.2% 108.5% 86.3% 120.5% 130.3% 92.2% 57.2%
Incl. goodwill and step-up values:
Capital turnover rate, times 1.3 1.6 1.7 1.8 1.9 2.0 2.5 2.7 2.5 2.2
Capital employed 27,259 18,598 17,833 16,324 12,752 12,976 11,144 9,289 8,062 7,470
Return on capital employed % 20.5% 26.4% 27.4% 31.3% 37.4% 33.6% 53.8% 54.2% 35.9% 22.7%
Return on equity % 17.6% 20.4% 22.9% 22.9% 24.4% 24.5% 42.8% 44.1% 25.3% 16.0%
Solidity % 30.8% 46.3% 41.3% 43.9% 50.0% 46.7% 36.1% 34.2% 36.4% 35.9%
Net debt 15,068 2,611 4,270 3,264 -551 533 2,074 2,397 1,478 2,013
Net debt to EBITDA, times 2.45 0.49 0.80 0.59 -0.11 0.11 0.33 0.45 0.47 1.03
Debt ratio, times 0.88 0.16 0.30 0.22 -0.04 0.04 0.20 0.30 0.22 0.35
Interest coverage ratio, times 18.3 22.1 23.2 28.6 35.9 15.2 26.2 23.7 14.4 6.9
Cash flow from:
operating activities 5,123 4,233 3,586 3,429 4,098 5,347 4,062 3,264 2,619 1,617
investing activities -14,970 -951 -3,260 -5,497 -1,417 -2,620 -1,333 -1,676 -1,578 -665
financing activities 10,250 -3,191 -407 2,317 -2,431 -2,667 -2,599 -1,291 -935 -973
Investments 603 492 531 555 429 451 747 556 373 324
Average number of employees 17,109 16,238 16,060 14,667 12,078 11,773 11,821 10,804 9,923 9,524
Earnings per share, SEK *** 7.02 7.22 7.64 7.68 7.34 6.42 8.83 7.12 3.78 1.98
Free cash flow per share, SEK *** -23.48 7.82 0.78 -4.93 6.38 6.46 6.38 3.60 2.33 2.13
* Restated to IFRS 11. ** Restated to the new IAS 19. *** The figures for 2008 until 2005 have been recalculated due do the 4:1 split.
Alfa Laval AB (publ)Box 73SE-221 00 LundCorporate Registration Number:556587-8054
Visiting address:Rudeboksvägen 1Tel: + 46 46 36 65 00Website: www.alfalaval.com
Production: Alfa Laval AB / Bysted AB
Prepress and printing: Gigantprint
Translation: The Bugli Company 341 063Trycksak
Alfa LavalAlfa Laval is a world-leading supplier of products and solutions in the areas of heat transfer, separation and fluid handling. The company’s equipment is used to heat, cool, separate and transport products in industries that produce food, beverages, fuel, chemicals, pharmaceuticals, starch, sugar and ethanol. They are also used aboard vessels, in power plants, in the engineering industry, for treating sludge and wastewater, for heating homes and offices, for comfort heating and cooling, and much more.
Market-leading positions
Heat transfer
More than 30 percent of the world market Most industrial processes need some form of solution for heat transfer. Alfa Laval’s offering includes a number of products, including compact heat exchangers that optimize customers’ energy consumption, cut costs and reduce their environmental impact.
Read more on page 21.
Separation
25–30 percent of the world market Alfa Laval’s separators, decanters, belt filter presses and membranes can be used in a range of applications to separate liquids from one another, solid particles from liquids, and particles and liquids from gases.
Read more on page 22.
Fluid handling
10–12 percent of the world market Alfa Laval offers pumps, valves, tank cleaning equipment and installation material for industries with stringent hygiene require-ments, such as the food and pharmaceu-tical industries. The product portfolio also includes specific pumping systems for the marine industry and offshore market.
Read more on page 23.
A global footprint Alfa Laval’s global sales and aftermarket organization helps customers in more than 100 countries to optimize their processes. Its production operations include 42 major production units in Europe (22), Asia (10), the US (8) and Latin America (2). Alfa Laval had an average of 17,109 employees in 2014, most of whom were located in Sweden (2,133), China (2,768), Denmark (1,802), the US (1,830) and India (1,435).
Market-adapted sales organization with a shared supply chain Alfa Laval has three sales divisions – Equipment, Process Technology and Marine & Diesel – as well as one division known as Operations, which is responsible for production, procurement and logistics. The sales divisions have separate business models designed to enable Alfa Laval to meet customer requirements and purchasing habits in the best possible manner and thus ultimately help customers to optimize the performance of their processes. The company’s three key technologies – heat transfer, separation and fluid handling – are offered in all three sales divisions.
EquipmentEquipment is characterized by a fast-moving business comprising components sold to customers with recurring requirements and well-defined needs through various sales channels. The division comprises four segments: Industrial Equipment, Sanitary, OEM and Service.
Read more on page 28.
Process TechnologyProcess Technology sells customized solutions and systems directly to end customers through the Group’s own sales companies and through contractors. The division comprises four segments: Energy & Process, Water & Waste Treatment, Food & Life Science and Service.
Read more on page 30.
Marine & DieselMarine & Diesel offers components, modules, systems and service for customers in the marine and offshore markets and land-based diesel power. The division comprises four segments: Marine & Diesel Equipment, Marine & Offshore Systems, Marine & Offshore Pumping Systems and Service.
Read more on page 32.
OperationsOperations is responsible for the Group’s production-related procurement, as well as its manufacturing, distribution and logistics. Having a centralized, coordinated and global supply chain is crucial to ensuring reliable access to the company’s products worldwide.
Read more on page 34.
Procurement Manufacturing Distribution/Logistics
Return on capital employed, %Operating margin, % Invoicing growth, %*
0 1 000 2 000 3 000 4 000 5 000 6 000
UK
Benelux
Adriatic
South East Asia
Japan
Region Mid Europe
Nordic
South Korea
China
United States
-15-10
-505
1015202530
14131211100
5
10
15
20
25
14131211100
10
20
30
40
50
60
1413121110
0
4
8
12
16
20
14131211100
1
2
3
1413121110-0,5
0,0
0,5
1,0
1,5
2,0
2,5
3,0
1413121110
-15-10
-505
1015202530
14131211100
5
10
15
20
25
14131211100
10
20
30
40
50
60
1413121110
0
4
8
12
16
20
14131211100
1
2
3
1413121110-0,5
0,0
0,5
1,0
1,5
2,0
2,5
3,0
1413121110
-15-10
-505
1015202530
14131211100
5
10
15
20
25
14131211100
10
20
30
40
50
60
1413121110
0
4
8
12
16
20
14131211100
1
2
3
1413121110-0,5
0,0
0,5
1,0
1,5
2,0
2,5
3,0
1413121110
R&D is keyThe ability to provide the market with new and more efficient products is crucial to achieving profitable growth. Accordingly, Alfa Laval aspires to a benchmark value entailing that the company’s annual spend on research and development should correspond to approximately 2.5 percent of its sales. In 2014, the company invested SEK 790 million, corresponding to 2.3 percent.

52014 in brief
Amounts in SEK million unless otherwise stated +/- %6) 2014 2013* 2012 2011 2010
Order intake 21 36,660 30,202 30,339 28,671 23,869
Net sales 18 35,067 29,801 29,813 28,652 24,720
Adjusted EBITDA 1) 21 6,460 5,360 5,381 5,736 5,107
Adjusted EBITA 2) 20 5,895 4,914 4,934 5,287 4,682
Operating margin (adjusted EBITA 2)), % 16.8 16.5 16.5 18.5 18.9
Profit after financial items -1 4,121 4,172 4,529 4,676 4,364
Return on capital employed, % 20.5 26.4 27.4 31.3 37.4
Return on shareholders’ equity, % 17.6 20.4 22.9 22.9 24.4
Earnings per share, SEK -3 7.02 7.22 7.64 7.68 7.34
Dividend per share, SEK 7 4.00 3) 3.75 3.50 3.25 3.00
Equity per share, SEK 6 41.01 38.53 34.46 36.10 32.30
Free cash flow per share, SEK 4) -23.48 7.82 0.78 -4.93 6.38
Equity ratio, % 30.8 46.3 41.3 43.9 50
Net debt to EBITDA, times 2.45 0.49 0.80 0.59 -0.11
Number of employees 5) 9 17,753 16,262 16,419 16,064 12,618
0
5,000
10,000
15,000
20,000
25,000
30,000
35,000
40,000
1413*121110-12,000
-7,500
-3,000
1,500
6,000
14131211100
1,300
2,600
3,900
5,200
6,500
14131211100
5
10
15
20
25
SEK MILLION SEK MILLION SEK MILLION %
23,869
2,681 3,282
-2,068
-9,847
326
28,671
30,339
30,202
36,660
• Order intake amounted to SEK 36.7 billion compared with 30.2 billion in 2013.
• Invoicing rose 18 percent to 35.1 billion.
• The adjusted EBITA margin, or operating margin, for 2014 was 16.8 percent, compared with 16.5 percent in 2013.
2014 in brief
Restated to IFRS 11.
1) Adjusted EBITDA – Operating income before depreciation, amortization of goodwill and amortization of other surplus values, adjusted for items affecting comparability.
2) Adjusted EBITA – Operating income before amortization of goodwill and other surplus values, adjusted for items affecting comparability.
3) Board proposal to the Annual General Meeting.4) Free cash flow is the sum of cash flow from operating and investing activities.5) Number of employees at year-end.6) Percentage change between 2013 and 2014.
Order intake Free cashflow Adjusted EBITA
Order intake reached SEK 36.7 billion in 2014, an increase of 18 percent, excluding exchange rate variations.
Alfa Laval generated a free cash flow of SEK -9,847 million (3,282) in 2014.
Adjusted EBITA amounted to SEK 5,895 million in 2014, compared with SEK 4,914 million in 2013.
4,682
5,287
4,934
4,914
5,895
Adjusted EBITA Operating margin* Restated to IFRS 11.

6 Financial statements
Vegetable oil order in Brazil Alfa Laval secured an order for heat exchangers, mixers and separators for a complete process line for refining vegetable oil in Brazil. The order was worth SEK 50 million and confirmed Alfa Laval’s strong position as a reliable supplier of process solutions to the vegetable oil industry.
Ministerial meeting in China Alfa Laval participated in an informal breakfast meeting, arranged by the General Consulate of Sweden, to discuss the business climate and production challenges. Since the meeting was held at the Shanghai World Financial Tower, Alfa Laval’s Managing Director in China took the opportunity to show the Alfa Laval- supplied heating and cooling installations to the Swedish Foreign Minister among others.
Alfa Laval signs an agreement to acquire Frank Mohn AS Frank Mohn AS is a leading manufacturer of submerged pumping systems to the marine and offshore markets. This acquisition strengthened Alfa Laval’s fluid handling portfolio by adding a unique pumping technology. It also further reinforced the company’s position as a leading supplier to the marine and offshore oil and gas markets.
Several large orders announced Alfa Laval landed two large orders for the exhaust gas scrubber Pure SOx and also announced an order for air cooler systems for a US export terminal for natural gas liquids. Furthermore, approval was received from the competition authorities regarding the acquisition of Frank Mohn, which consequently was consolidated as of May 22.
35 years in South Korea In June, Alfa Laval celebrated its 35th anniversary in South Korea, with events held to mark the occasion in both Seoul and Busan. Approximately 200 guests, distributors and key customers participated in the events. In Busan, marine seminars were hosted focusing on new products, such as PureSOx, PureNOx and PureDry.
Open house in Aberdeen The oil and gas team in Aberdeen arranged an open house for customers over the course of three days in July, with a specific focus on the range of gasketed plate heat exchangers for the oil and gas market. Sessions during the three days included presentations and discussions, as well as a guided tour of the premises, to encourage interaction and dialog between customers and Alfa Laval.
Record order Alfa Laval booked an order with a record value of 290 million kronor, for OLMI air-cooled heat exchangers to be installed in an oil and gas production facility in Kazakhstan. The heat exchangers will be used in a highly demanding cooling application, handling high pressure and aggressive gas in the oil extraction process.
Large order for pumping systems Alfa Laval announced its first large order for offshore pumping systems. The order comprised the delivery of Framo pumping systems to Samsung Heavy Industries in South Korea, for installation onboard an FPSO. The order was worth approximately SEK 240 million, with delivery scheduled for 2015.
Lars Renström ranked as one of the world’s top CEOs Harvard Business Review lists the 100 best-performing CEOs in the world, focusing on long-term results, specifically for shareholder returns and market capitalization. Three Swedish CEO’s were recognized on the top 100 list, with Lars Renström ranked number 91.
EUR 800 million corporate bond issue Alfa Laval raised EUR 800 million in the corporate bond market. The long-term financing replaced the bridge loan taken in connection with the acquisition of Frank Mohn AS.
Swedish spirit of innovation An initiative, driven by Alfa Laval, Atlas Copco, Ericsson, IKEA, SKF and Volvo, was introduced to promote the unique and innovative Swedish business culture among young professionals in China. The project, which will run well into 2015 as a nationwide campaign, kicked off with events at two Chinese universities in December.
New service center in India Alfa Laval inaugurated a new service center in Kundli, Haryana in the Delhi region. This is the company’s third service center aimed at meeting customer needs in the northern part of the country.
JANUARY
APRIL
JULY
OCTOBER
FEBRUARY
MAY
AUGUST
NOVEMBER
MARCH
JUNE
SEPTEMBER
DECEMBER
6 2014 in brief

7
President’s comments
2014 began with an optimistic view of the global economy, although this optimism successively waned as the conditions gradually deteriorated over the course of the year. Nonetheless, we experienced a very strong order intake from the shipbuilding industry and the areas linked to oil and gas also displayed a strong trend. The year was particu-larly marked by our acquisition of Frank Mohn AS, a leading supplier of submerged pumping systems for the marine and offshore markets. This acquisition, our largest to date, made a significant contribution to the Group’s order intake, sales and operating profit. In 2014, our order intake increased 21 percent to SEK 36.7 billion and sales rose 18 percent to SEK 35.1 billion. The operating margin was 16.8 percent, an improvement compared with 2013.
Focus on structural growth drivers contributed to a strong year

8 President’s comments
Geographically speaking, the US strengthened its position as Alfa Laval’s largest market, driven by generally favorable demand, shale gas extraction and a minor acquisition. In China, we noted significant, broad-based growth due to increasing demand from the shipbuilding industry and the recent expansion of our sales and service resources. South Korea advanced to a third-place position as a result of strong demand from the shipbuilding and offshore industry, in which Frank Mohn is also active, while the opera-tions in Russia felt the effects of the country’s conflict with Ukraine and declined somewhat compared with the record levels achieved in 2013. In Western Europe, Germany displayed a positive trend, partly driven by environ-mental investments in the marine industry.
Performance of the business divisions In Process Technology, order intake remained unchanged compared with 2013. The division, whose focus areas include energy, the environment and an increased presence in faster-growing markets, noted a strong trend in oil and gas extraction, both on land and offshore. At the same time, the ample access to cheap gas in North America helped enable the reindustrialization of the process industry in the US to continue unabated, which benefited Alfa Laval. In the food industry, we experienced growing interest in our process lines for the production of vegetable proteins and starch for health foods and animal feed. The ongoing strong trend in craft beer, for which Alfa Laval’s equipment is highly suitable, also contributed to favorable demand from the brewery industry.
Equipment, whose order intake also remained unchanged, is focusing on increasing its market presence in a cost-efficient manner, by adding more sales channels, and expanding its presence in the aftermarket. Work on these goals con-tinued during the year at the same time as we noted positive results among our major direct customers. With respect to our end markets, we noted a positive trend in the dairy industry, where China is driving global demand. A clear trend contributing to this favorable development is the growing demand for processed milk products, such as yoghurt, as well as lactose-free and protein-enriched products.
The Marine & Diesel division prioritizes areas such as the environment and energy efficiency. Order intake rose strongly thanks
to strong contracting in the shipbuilding industry and the acquisition of Frank Mohn AS. The environmental product Pure SOx, which cleans exhaust gas using scrubber technology, experienced a sharp increase in demand, and several major orders were booked for installation aboard both new and existing vessels. Heat recovery from exhaust gas is also a fast-growing area. The division as a whole built up a large order backlog, which will generate stable invoicing over the next few years.
Priority: Service We believe that our Service business offers significant potential given that our installed
base is continuously growing. Our goal is to sell spare parts and service to a larger proportion of this base and thus increase our market shares. At the same time, we are aiming to sell more man-hours and expand our service operations. The aim is to protect our installed base and ensure that it is Alfa Laval that succeeds in capital-izing on these growth opportunities. From a medium and long-term perspective, Service is expected to make a significant contribution to both our profitability and our growth. Five new service centers were opened during the year, bringing our total number of service centers at year-end to 107 – giving us the absolute best market

9President’s comments
Lund, February 2015
Lars Renström
President and CEO
coverage in the industry. We also expanded our existing centers in order to better meet the needs of our customers. With all divisions contributing, Service displayed organic growth of 6 percent during the year with respect to its order intake. The expansion of our installed base and our focus on advancing the operations played a key role in this growth. Including currency and the acquisition of Frank Mohn, the increase amounted to 25 percent.
Frank Mohn AS – our largest acquisition to date A few years ago, the Board of Directors and Group Management decided to focus on expansion in the area of industrial fluid handling products by including these prod-ucts in our offering to customers with whom Alfa Laval already commanded a strong position. Our top choice was Frank Mohn AS, a company we had the opportu-nity to acquire in May. The company is a world-leading supplier of submerged pumping systems for the marine and off-shore markets. In the marine industry, the systems are used for loading and unload-ing liquid cargo aboard product and chem-ical tankers. These systems are critical to the operations conducted onboard and improve productivity and earnings capacity. The company’s product offering comple-mented our existing offering in the area of fluid handling, where until now we have pri-marily focused on hygienic pumps and valves. We are also familiar with Frank Mohn AS’s customers. Finally, Frank Mohn AS has a substantial order backlog for delivery in the coming years. Frank Mohn AS, which now comprises the Marine & Offshore Pumping Systems segment in the Marine & Diesel Division, contributed SEK 3.8 billion to our order intake and SEK 3.3 billion to our sales.
Adjustment and consolidation Based on our expectations of an upturn in the global economy, we conducted selective investments over an 18-month period in order to increase our sales resources. However, the upturn was weaker and came later than anticipated, which meant that our sales and administration costs increased at a faster rate than our revenues and an adjustment was thus required. At the same time, we identified a need to enhance the efficiency of our research and
development processes and also to con-solidate a number of the production units gained through acquisitions in recent years. Based on this, we launched an action program that is expected to reach a level of savings of SEK 300 million, on an annual basis, by year-end 2015. This program already had a positive impact on our operat-ing margin during 2014.
A sound corporate culture provides a foundation for motivated employees Alfa Laval’s goal is to be an attractive employer with motivated and committed employees, thus creating a foundation for our continued success. We implemented a number of initiatives and training programs throughout the year, but I would like to high-light the two programs we offered for employees with special potential: a mentor program for female employees and a 12-day training program for young employees. Our experience from previous programs has taught us that the participants in these programs will, to a large degree, go on to pursue successful careers at Alfa Laval.
In Sweden, Alfa Laval was named one of the ten most attractive employers in the country. The most gratifying part of this recognition is that it was voted on by our employees during a period in which we were implementing a cost-cutting program.
With nearly 18,000 employees spread across 60 different countries, our corpo-rate culture is the glue that holds the com-pany together. Accordingly, we are making a concerted effort to communicate and instill Alfa Laval’s core values in all of our employees.
Sustainability – focusing on high-risk areasAlfa Laval is a result-oriented company. In our sustainability work we focus on sys-tematically ensuring that the company is focusing on sustainability areas that entail a higher risk and where we are able to exert an influence and make improvements. Our business principles serve as the foundation for our sustainability initiatives and our goal is for all necessary risk reduction measures to be integrated into our daily work. This process is guided and supported by vari-ous councils comprising members of Group management and managers from the relevant divisions. Our progress, as well as our goals and priorities, are reviewed
annually by the Board of Directors and Group management. For more information about the areas we have chosen to prior-itize in our sustainability work, refer to page 40 of the Sustainability Report.
I would like to conclude by extending my sincere thanks to all of our employees for your continued commitment and your determination in contributing to building an even more successful Alfa Laval.

Long-term changes drive demand Demand for Alfa Laval’s products and solutions in the areas of heat transfer, separation and fluid handling are naturally driven by individual customer requirements, but also by more general external factors. Alfa Laval takes a proactive approach to understanding and analyzing these external changes, as well as the underlying dynamics. The goal is to identify existing and potential future requirements and respond to these requirements by having a presence in the right markets and offering the right products. The following description provides an overview of four structural changes that are expected to impact demand for the company’s products.
Stricter environmen-tal regulation Human impact on the environment is coming under greater scrutiny, giving rise to new, stricter laws. These laws encompass a range of areas and include everything from exhaust gas cleaning requirements for trucks and vehicles to bans on releasing contaminated water into the world’s oceans and lakes. As part of this environ-mental focus, a sustainability mindset has also evolved and is encouraging companies to voluntarily take steps that contribute to environmental improvements.
Growing energy needs The world’s energy needs are growing. The International Energy Agency predicts that the world’s energy demand will grow by approximately 37 percent by 2040, compared with the current level. To meet demand, oil and gas exploration will need to increase and the production of energy from alternative sources will need to be expanded, not least through the continued development and expansion of renewable energy sources. Distribution chains will need to be broadened. However, the focus is not only on expansion, but also increasingly on developing and using technologies that enable the energy already being produced to be used more efficiently, partly by means of recycling.
Alfa Laval and energy Alfa Laval delivers products and solutions for oil and gas exploration, power production, renewable fuels, refinement and much, much more. Over time, the product portfolio has been expanded both organically and through acqui-sitions, at the same time as the company’s cutting-edge expertise in various customer processes has been strengthened and enhanced. As part of this development, a new center of excellence was established in Malaysia to support the local sales offices by providing expertise in the areas of oil, gas, petrochemistry and refinery. In addition to actively participating in the expansion of the energy sector, Alfa Laval’s products are also playing an important role in making the world’s industrial processes more energy efficient, with its compact heat exchangers at the heart of its business.
Alfa Laval and the environment Alfa Laval has a large portfolio of products for managing various environmental problems. The company’s heat exchangers are also highly energy efficient, which in itself is a gain for the environment. Among other benefits, Alfa Laval offers products that can clean crankcase gas from trucks, reduce the sulphur content in ships’ exhaust gas, dewater sludge in wastewater treatment plants or clean bilge water onboard vessels.

Structural growth drivers 11
Alfa Laval in the food sector Alfa Laval has its roots in products for the food industry and its offering has continuously been developed since the company was formed in 1883. Today, heat exchangers, separators, pumps and valves for hygienic applications are sold to the world’s food, beverage and pharmaceutical industries. The company also offers heat exchangers used in cooling chains, which enable raw materials and processed foods to be transported and stored without going to waste.
Alfa Laval in the shipping sector Alfa Laval has delivered equipment for the marine industry for decades. The company’s products have traditionally been used in engine rooms in the form of separators for cleaning fuel and heat exchangers for cooling the engines. However, the current product portfolio includes everything from heat exchangers for freshwater production to pum-ping systems for efficient loading and unloading of various types of liquid cargo. The portfolio also includes a number of environmental solutions, such as ballast water treatment systems and systems for reducing the sulphur content in ships’ exhaust gas.
Higher standard of living The world’s developing countries have experienced extremely strong economic growth over the past decade. According to figures from the International Monetary Fund (IMF), the growth rate in these areas is, despite a certain level of slowdown, expected to reach 5.1 percent for 2014 and 5.4 percent for 2015. This is more than double the rate of already industrialized countries. A stronger economy tends to be accompanied by increased demand for better food. At the same time, urbanization is accelerating, resulting in greater demand for everything from various types of ready-made food to grocery stores.
Globalized world with increased trade creating transport requirementsThe world is more connected than ever before. Raw materials may be extracted in one country only to be shipped to another for processing. From there, the end products are transported to customers and consumers. This creates one large cycle requiring efficient and eco-nomically justifiable transportation solutions in order to function. This is where the shipping industry enters the picture. Approximately 90 percent of international trade is currently transported by shipping. As long as international trade continues to increase – as it has by an average of 5.4 percent annually over the past 20 years – there will be a growing need for transportation solutions, which will have a direct impact on the marine industry.

-15-10
-505
1015202530
14131211100
5
10
15
20
25
14131211100
10
20
30
40
50
60
1413121110
0
4
8
12
16
20
14131211100
1
2
3
1413121110-0,5
0,0
0,5
1,0
1,5
2,0
2,5
3,0
1413121110
In 2014, invoicing increased 14.2 percent*, with organic growth accounting for 2.5 percent and acquisitions for 11.7 percent.
*Excluding exchange-rate variations
The operating margin for 2014 was 16.8 percent, compared with 16.5 percent for full-year 2013.
The return on capital employed for 2014 was 20.5 percent.
Growth, % Profitability, % Return on capital employed, %

13Vision, business concept, goals and strategy
-15-10
-505
1015202530
14131211100
5
10
15
20
25
14131211100
10
20
30
40
50
60
1413121110
0
4
8
12
16
20
14131211100
1
2
3
1413121110-0,5
0,0
0,5
1,0
1,5
2,0
2,5
3,0
1413121110
Vision, business concept, goals and strategyVisionTo “help create better everyday conditions for people” by offering efficient and environ-mentally responsible products and solutions in the areas of heat transfer, separation and fluid handling.
Business concept Based on its three key technologies – heat transfer, separation and fluid handling – Alfa Laval offers products and solutions that are in line with its business concept: “To optimize the performance of our customers’ processes, time and time again.” In other words, Alfa Laval aims to help its customers become more productive, energy-efficient and competitive.
Goals and benchmark values Financial goals Alfa Laval’s operations are governed not only by its business concept, but also by the financial goals established with regard to growth, profitability and return. Achieving or exceeding these goals creates the neces-sary scope for continued development. It also generates increased shareholder value in the form of an annual dividend and by boosting the value of the company.
Growth The goal is to have an average annual growth rate of at least 8 percent measured over a business cycle, with organic growth accounting for 4 to 5 percentage points and acquisitions for 3 to 4 percentage points. This goal is based on the actual results achieved over a period of ten years and on an assessment of future prospects.
Profitability The goal is to have an operating margin (adjusted EBITA) of 15 percent measured over a business cycle. The profitability goal was established based on historical margins and the company’s growth ambitions.
Capital utilization The goal is to have a return on capital employed of at least 20 percent, down from the previous goal of at least 25 percent. The new level was established taking into account the acquisition of Frank Mohn AS. Based on the significant increase in surplus value, Alfa Laval’s Board of Directors decided that a goal of a return on capital employed of at least 20 percent is realistic from a medium-term perspective.
Financial benchmark values In addition to the Group’s financial goals, the Board of Directors has established benchmark values for three key financial ratios, which further specify the framework and goals for the operation of the company. During the year, a transition was made from a benchmark value expressed as a debt/equity ratio to a benchmark value expressed in terms of net debt in relation to EBITDA, since the latter is considered more relevant by most stakeholders, not least lenders.
Net debt in relation to EBITDA In the long term, net debt in relation to EBITDA, meaning operating profit before depreciation and amortization of step-up values, is to be not more than 2. Although the ratio may exceed the goal in connection with major acquisitions, this should be
viewed as a temporary situation, since the company’s cash flow is expected to offset this effect.
Investments The benchmark value states that 2 percent of sales should go to investments. Given the investments and capacity expansion carried out in recent years, this investment level is deemed sufficient to create the scope for replacement investments and a continued expansion of capacity in line with the organic growth goal for the Group’s existing key products.
Cash flow from operating activities Cash flow from operating activities is to amount to 10 percent of sales, including investments in fixed assets. This value is lower than the goal for the operating margin, since organic growth normally requires an increase in working capital. In addition, taxes are paid in an amount corresponding to approx-imately 28 percent of earnings before tax.
Sustainability goals Alfa Laval also has a number of non-financial goals, including a reduction in water con-sumption, increased energy efficiency, a reduction in the use of restricted “grey-list” chemicals and a reduction in greenhouse gas emissions from freight transportation and travel. For more information about these goals and other sustainability initiatives, visit:
www.alfalaval.com/about-us/sustainability
The net debt/EBITDA at year-end 2014 was 2.45. Investments in 2014 amounted to 1.7 percent. In 2014, cash flow from operating activities amounted to 12.9 percent.**
Net debt/EBITDA Investments, % * Cash flow from operating activities, %*
* As a percentage of sales. ** Including investments in fixed assets

14 Vision, business concept, goals and strategy
Strategy In order to achieve its vision, implement its business concept and attain its growth, profitability and capital utilization goals, Alfa Laval has established various strategic pri-orities. These cover both products and mar-ket presence and are mainly to be achieved organically, but also through acquisitions. Furthermore, improvement initiatives are con-tinuously carried out in all areas of the company.
Products Alfa Laval’s existing products in its three key technologies provide a foundation for the company’s continued profitable growth, since it is assessed that their high quality and energy efficiency are, and will continue to be, important criteria for customers. At the same time, the company is investing in research and development to ensure it is also able to meet future needs by offering new products or improved versions of existing products. Identifying new areas of application for existing products and key technologies is another important strategic approach. At the same time, Alfa Laval also strengthens its offering by adding new prod-ucts through acquisitions, both complementary products in its three key technologies and new products that complement the company’s offering in application areas where it is already active.
Examples of strategic priorities: – During the year, the company acquired
Frank Mohn AS, a Norwegian supplier of specialized pumping systems for the marine and offshore markets. This acquisition has strengthened Alfa Laval’s product offering in fluid handling and complemented its offering to the marine and offshore markets, where Alfa Laval has been active for many years.
– Alfa Laval invests approximately 2.5 percent of its sales in research and development annually. This allocation of funds covers both the development of new products and upgrades to existing products. One example is PureSOx 2.0, a new version of Alfa Laval’s scrubber solution to remove sulphur pol-lution from the exhaust gas of ships. The new version is smaller and more flexible than its predecessor, making it an excellent alternative for many types of vessels.
Market presence Having a local presence is crucial for Alfa Laval’s operations, from production and sales to aftermarket. It is important that the company selectively expands and/or
strengthens its geographic presence in areas with good growth potential with regard to demand and favorable production conditions, considerations that are assessed on a con-tinuous basis. Expansion should primarily occur organically – either in terms of breadth, by entering new geographic areas, or in terms of depth by further expanding the Group’s presence in countries and regions where Alfa Laval is already estab-lished. Acquisitions may also be used as a secondary means of expansion and pro-vide an efficient way of quickly strengthen-ing the company’s local presence. However, expansion can also entail adding new sales channels.
Examples of strategic priorities: – Alfa Laval opens two to three new service
centers every year as a way of continuously improving the market coverage of its installed base of products. Over the years, the company has also expanded its network of service centers through acquisitions.
– The roll-out of the Alfa Laval Anytime e-commerce solution continued during the year, providing a cost-efficient way of bringing the Group’s component-based offering to various markets.
– The Group’s multibrand strategy, which has been established for several years, has resulted in the acquisition of prominent competitors in order to add new channels in specific geographic and industry-based markets. Examples include Tranter and LHE.
Profitability and return A number of basic questions must be answered in order to ensure profitability and a favorable return. One such question, concerning procurement and production, is which products Alfa Laval should produce itself and which products should be purchased from suppliers. Another question, pertaining to logistics, is how Alfa Laval can meet its customers’ service requirements, while at the same time ensuring an efficient allocation of capital. A third question pertains to the business models to be applied in the com-pany’s divisions and the breadth that Alfa Laval should have in its offering.
Examples: – Alfa Laval conducts continuous reviews to
determine which products the Group should produce itself and which products should be purchased from suppliers. These are fundamental decisions when it comes to
achieving a favorable return. The company also conducts continuous reviews to determine the most suitable geographic distribution of its production operations. One example is the gradual relocation of production from Aalborg, Denmark, to Qingdao, China – a process that has been under way since the 1990s. The process was completed in 2014 following the final relocation of the company’s heat exchanger and oil burner production. This was a logical move since these products are targeted at the shipbuilding industry, which is largely con-centrated in China, South Korea and Japan.
– Alfa Laval maintains central stocks of inventories in order to enable a high service level. The downside of this is higher trans-portation costs. However, the net result is positive since Alfa Laval is also able to maintain a lower level of tied-up capital. Take, for example, the Group’s inventories of spare parts. It is not possible for the Group to have the complete product range in stock in each individual market. Consequently, spare parts are divided into different cate-gories: spare parts that should always be available, spare parts that should be available for order from a central warehouse and spare parts ordered on demand. These categories are adjusted on an ongoing basis as new products are continuously introduced.
– With respect to its sales and mix, Alfa Laval has adopted business models that allow sales of both components and solutions. The Equipment Division’s business model, which focuses exclusively on sales of key products, offers relatively high margins com-pared with Process Technology’s business model, which focuses on a broader offering including third-party products. Nevertheless, there are advantages to be gained by combining these two models, including more frequent customer contact. A combined approach is also attractive since it enables Alfa Laval to reduce the customer’s work-load by customizing a package comprising a mix of proprietary and third-party products, which adds value. Although Alfa Laval also assumes part of the risk and its capital becomes tied up in production, the Group can ultimately achieve a reduction in tied-up capital by demanding advance payments. A limit has also been established with regard to the scope of the offering. In order to limit its risk exposure and ensure profitability, Alfa Laval does not deliver solutions outside a process line.

Vision, business concept, goals and strategy
2010
ACQUISITIONS REASON SALES, SEK MILLION*
Champ Products Inc., USA Product 100
Service company, USA Channel 100
Astepo S.r.l., Italy Product 70
Si Fang, China (65 percent) Channel 150
Definox, France Channel 200
Olmi S.p.A, Italy Product 700
DIVESTMENTS REASON SALES, SEK MILLION*
– – –
2011
ACQUISITIONS REASON SALES, SEK MILLION*
P&S Multibrand Channel 100
Aalborg Industries A/S, Danmark Product 3,300
DIVESTMENTS REASON SALES, SEK MILLION*
– – –
2012
ACQUISITIONS REASON SALES, SEK MILLION*
Additional 8.5 percent of the share capital in Alfa Laval India. (Total holding 97.5 percent) Geography Did not affect sales
Vortex Systems, USA Product 100
Ashbrook Simon-Hartley, USA Product 500
Gamajet Cleaning Systems, USA Product/geography 75
Air Cooled Exchangers, LLC, USA Product/geography 350**
DIVESTMENTS REASON SALES, SEK MILLION*
– – –
2013
ACQUISITIONS REASON SALES, SEK MILLION*
Gas combustion unit Product 40***
Niagara Blower Company Product 425
DIVESTMENTS REASON SALES, SEK MILLION*
– – –
2014
ACQUISITIONS REASON SALES, SEK MILLION*
Frank Mohn AS Product 3,600
DIVESTMENTS REASON SALES, SEK MILLION*
– – –
* Refers to sales for the year preceding the acquisition or divestment.
** Sales in 2012.
*** Expected sales for 2013 on the acquisition date.
Between 2010 and 2014, Alfa Laval acquired 15 companies with combined sales of SEK 9,810 million, corresponding to average annual growth of SEK 1,962 million.
15

16 The share
Source: SIX / Fidessa Source: SIX
02 03 04 05 06 07 08 09 11 12 1413100
50
100
150
200
250
Total return, May 17, 2002 – December 30, 2014
SEK SEK
Number of shares (000s)
Total share turnover per month (incl. trading on alternative marketplaces and OTC trading)
Alfa Laval Alfa Laval
SX Industrials IndexSIX ReturnOMX Stockholm Index
0
20,000
40,000
60,000
80,000
100,000
DecNovOctSepAugJulJunMayAprMarFebJan130
140
150
160
170
180
190
200
A year with many new shareholders
Price trend, January 2 – December 30, 2014
Alfa Laval experienced a strong start to 2014, with the share price climbing to SEK 187.0 on April 7, corresponding to an increase of 13.4 percent. This trend subsequently turned and a lowest share price of SEK 138.7 was noted on December 16. The share ended the year at SEK 148.30 (165.00), which meant that the share price for the full year fell 10.1 percent. Including the dividend of SEK 3.75 per share, the total return for the Alfa Laval share was a negative 8.1 percent. Alfa Laval’s market capitalization at year-end was SEK 62.2 billion (69.2).
OMX Stockholm Industrials, the sector index for industrial shares in which Alfa Laval is listed, rose 13.1 percent in 2014, while Nasdaq Stockholm as a whole rose 11.9 percent.
The Alfa Laval share is listed on Nasdaq OMX Stockholm and is included in the large cap segment in Stockholm and the Nordic region. The share is also included in a number of other indexes in Sweden and abroad, including the OMXN40 Index, which comprises 40 companies with the largest market capitalization and most-traded shares in the Nordic region, as well as the OMXS30 Index, which includes 30 companies with the most-traded shares in Stockholm.
Strong long-term return Since Alfa Laval was relisted on the Stockholm Stock Exchange on May 17, 2002, the company’s share, including reinvested dividends, has generated a yield of 741 percent. Measured over the full listing period,
the average annual yield amounts to 17.1 percent, compared with an average annual yield of 7.3 percent for the SIX Return Index during the same period.
Share turnover Alfa Laval’s share is not traded exclusively on Nasdaq Stockholm, but also on BATS Chi-X, Turquoise, UBS MTF and POSIT, to name a few of the largest alternative marketplaces. Nasdaq Stockholm was once again dominant in 2014, accounting for 39 percent (41) of all shares traded. The liquidity of the Alfa Laval share is favorable and 750 (690) million shares in the company were traded in 2014 at a combined value of SEK 122 billion (101), including all alternative marketplaces. This corresponds to a turnover rate of 1.8 (1.6) times the total number of shares outstanding. During the year, an average of 6,273 (5,516) share transactions were completed in Alfa Laval shares per day.
Dividend policy The Board of Directors’ goal is to regularly propose a dividend that reflects the Group’s performance, financial status, and current and expected capital requirements. Taking into account the Group’s cash-generating capacity, the goal is to pay a dividend of between 40 and 50 percent of adjusted EPS. For 2014, the Board has proposed that the Annual General Meeting approve a dividend of SEK 4.00 (3.75). The proposed dividend corresponds to 46.7 percent (45.8) of EPS, adjusted for step-up amortization, net of taxes.
Share capital The par value at year-end was SEK 2.84 (2.84) per share. All shares carry equal voting rights and equal right to the company’s assets. Alfa Laval has no options outstanding that could create a dilution effect for shareholders.
After Alfa Laval announced in April 2014 that it would acquire Frank Mohn AS, the Board of Directors resolved to revoke the motion to the Annual General Meeting per-taining to the authorization of the Board to repurchase the company’s own shares. This authorization, which was intended to adjust the capital structure of the company, was no longer considered necessary. Accordingly, the total number of shares during the year was unchanged at 419,456,315.
Shareholders At year-end 2014, Alfa Laval had 40,505 (36,212) shareholders. A net total of 4,293 (1,582) new shareholders were added during the year. The ten largest shareholders con - trolled 55.5 percent (54.6) of the shares at year-end 2014. The single largest shareholder was Tetra Laval B.V., whose holding remained unchanged at 26.1 percent. In addition, the ownership structure was relatively stable. A reweighting took place among certain insti - tutions, and the Second Swedish Pension Insurance Fund increased its holding and became one of the ten largest shareholders in Alfa Laval. The First Swedish Pension Insurance Fund, on the other hand, reduced its holding slightly and is thus no longer one of the company’s ten largest shareholders.

17
0
1
2
3
4
14131211100
20
40
60
0
10,000
20,000
30,000
40,000
50,000
14131211100
25
50
75
100
1413121110
SEK % %
2014 2013 2012 2011 2010
Share price at year-end, SEK 148.30 165.00 135.30 130.30 141.70
Highest paid, SEK 187.00 167.00 146.50 147.70 142.60
Lowest paid, SEK 138.70 133.00 110.40 101.40 94.95
Shareholders’ equity, SEK 41.01 38.53 34.46 36.10 32.40
Earnings per share 7.02 7.22 7.64 7.68 7.34
Dividend, SEK 4.001) 3.75 3.50 3.25 3.00
Free cash flow, SEK 2) -23.48 7.82 0.78 -4.93 6.38
Price change during the year, % -10 22 4 -8 43
Dividend as % of EPS, % 57.0 51.9 45.8 42.3 40.9
Direct return, % 3) 2.70 2.3 2.6 2.5 2.1
Share price/shareholders’ equity, multiple
3.6 4.3 3.9 3.6 4.4
P/E ratio 4) 21 23 18 17 19
No. of shareholders 40,505 36,212 34,629 36,567 33,565
No. of share-holders
No. of share-holders, %
No. of shares
Holding, %
1 – 500 27,528 68.0 4,555,191 1.1
501 – 1,000 5,770 14.2 4,813,115 1.1
1,001 – 5,000 5,310 13.1 12,293,462 2.9
5,001 – 10,000 780 1.9 5,799,239 1.4
10,001 – 20,000 414 1.0 6,089,310 1.5
20,001 – 50,000 297 0.7 9,695,060 2.3
50,001 – 406 1.0 376,210,938 89.7
Total number of shareholders
40,505
No. of shares
Capital/voting
rights, %
Change in holding in 2014, percen-
tage points
Tetra Laval BV 109,487,736 26.1 +/- 0
Alecta 27,111,000 6.5 0.2
Foundation Asset Management AB 25,100,000 6.0 +/- 0
Swedbank Robur Funds 24,845,024 5.9 -0.5
AMF Insurance and Funds 22,829,625 5.4 1.5
Nordea Investment Funds 7,710,308 1.8 -0.3
Fourth Swedish Pension Insurance Fund
5,075,100 1.2 0.2
Handelsbanken Funds 3,793,837 0.9 +/- 0
Second Swedish Pension Insurance Fund
3,519,179 0.8 0.3
Folksam 3,158,203 0.8 +/- 0
Total ten largest shareholders
232,630,012
55.5
Ten largest shareholders at December 30, 2014*Data per share
Total number of shareholders
Dividend and percentage of adjusted EPS**
Geographic distribution of the free float, % of capital and voting rights
*Board proposal to the Annual General Meeting.**Adjusted for step-up amortization net of taxes.
Sweden
USA
UK
Other
1) Board proposal to the Annual General Meeting.2) Free cash flow is the sum of cash flow from operating and investing activities.3) Measured as the proposed dividend in relation to closing price on the last trading day.4) Closing price on the last trading day in relation to earnings per share.
3.00
3.25
3.50
3.75
4.00*
37.4
41.745.8
46.7
38.6
No. of shares Holding, %
Financial companies 116,620,525 27.80
Other financial companies 25,525,613 6.09
Social insurance funds 9,299,720 2.22
Government 1,439,727 0.34
Municipal sector 85,025 0.02
Trade organizations 5,917,259 1.41
Other Swedish legal entities 10,088,108 2.41
Shareholders domiciled abroad (legal entities and individuals) 217,318,066 51.81
Swedish individuals 27,114,245 6.46
Uncategorized legal entities 6,048,027 1.44
Source: Euroclear
Source: Euroclear
Source: Euroclear
* The table is adjusted for custodian banks. Were they to be included, they would represent a total holding of 6.53%.
Source: Euroclear
Source: SIX / Nasdaq Stockholm
Source: Euroclear
Excluding Tetra Laval (Netherlands) 26.1%
The share
Ownership distribution by size at December 30, 2014 Ownership categories at December 30, 2014
33,565
36,567
34,629
36,212
40,505
Dividend Percentage of adjusted EPS

18 Forskning och utveckling

19Research and development
Focus on R&D promotes profitable growthAcross the world, companies are increasingly focusing on enhancing the efficiency of their processes and strengthening their competitiveness. Alfa Laval aims to offer these companies efficient products and solutions that can help them achieve these goals. Ensuring that Alfa Laval always remains one step ahead – with the newest, most efficient products in the industry – requires continuous investments in research and development (R&D). The goal is to be the customer’s first choice. This is why Alfa Laval invests approximately 2.5 percent of its sales in research and development annually – more than any other company in the industry.
Alfa Laval AQUA Blue – freshwater generatorThis freshwater generator converts sea water into drinking water or process water and is thus an addition to the company’s offering to the marine and power industry. Optimized technology enables AQUA Blue to convert more sea water to freshwater, while at the same time halving the need for water for cooling. With half the amount of water to pump, energy consumption is reduced by 50 percent. Even over a short period of time, this generates a significant energy saving and also a reduction in oper-ating costs of up to a 25 percent compared with freshwater generators with a similar design and up to 72 percent compared with shell-and-tube heat exchangers.
Alfa Laval’s offering encompasses several key technologies, all of which are very distinct from one another. Accordingly, R&D is carried out in the specific units responsible for the individual product groups. There are centers for separators, boilers, fluid handling products and air heat exchangers, as well as welded, brazed and gasketed heat exchangers, to name a few. The goal is to continuously develop new products and refine existing in order to ensure that Alfa Laval offers
globally competitive products. By being the first to offer the latest, most efficient products, Alfa Laval aims to remain the first choice in selected application areas – which is extremely important when it comes to achieving profitable growth for the Group as a whole.
Alfa Laval employs many engineers and never experiences a shortage of new, excit-ing ideas. However, only a small number of these ideas go all the way from the drawing board to ultimately become one of the 35 to
40 new products launched each year. This may seem like a modest amount, but in fact, this is the number deemed to be optimal, based on the capacity of both the R&D and sales organizations. The aim is to avoid spreading the organizations too thin across a number of projects at the same time in order to ensure a smooth development process and to create the optimal conditions for a favorable launch.
Products launched during the year
Alfa Laval PureSOx 2.0PureSOx 2.0 is the second generation of the company’s exhaust gas sulphur cleaning system. The system has been operating at sea since 2009 and was launched com-mercially in 2012. PureSOx 2.0 combines the tried-and-tested scrubber technology from the first generation with a number of innovations to improve its compactness and flexibility during installation and operation, making it suitable for an even wider range of vessels.
Alfa Laval’s tantalum-treated heat exchangers Alfa Laval’s new tantalum-treated heat exchangers minimize the life cycle cost of heat exchangers in highly corrosive applica-tions, for example, in the chemical industry. This new product series offers customers the same exceptional durability as heat exchangers made from solid tantalum, but at a significantly lower investment cost. This combination of lower capital costs, long service life and minimal maintenance requirements results in a significantly lower life cycle cost than for a heat exchanger made from solid tantalum, zirconium, special alloys, graphite, silicon carbide or glass.

Three technologies for optimized processesAlfa Laval’s operations are based on three key technologies for heat transfer, separation and fluid handling, which are of decisive importance for many industrial processes. In 2014, heat transfer products accounted for 47 percent (54) of sales, separation products for 21 percent (22) and fluid handling products for 20 percent (11). Alfa Laval is the global leader in all three technology areas.

21
47%
1
Key technologies
Global leader in heat transfer
Air heat exchangersAir heat exchangers offer the most efficient method of transferring heat between air and liquid. They consist of a series of tubes threaded through corrugated lamellas. Fans force the air between the lamellas, while liquid (water or a cooling medium) flows in the tubes. The range includes air-cooled condensers, air-cooled liquid coolers, dry coolers, and unit coolers for commercial use, as well as industrial cooling, refrigeration and air-conditioning. They are used in applications ranging from industrial cold stores to power plants, industrial processes, breweries, dairies, office properties, etc.
Plate heat exchangers enable efficient energy utilizationA heat exchanger transfers heating or cooling, usually from one fluid to another, but also between different gases. These products are of vital importance in ensuring the efficiency of the customer’s entire manu facturing
process. Compact plate heat exchangers, the main product in Alfa Laval’s offering, can offer the customer a very efficient energy utilization, which cuts costs and reduces the environmental impact. Their efficiency stems from their construction, plate
heat exchangers are made up of a series of plates assembled closely to each other. Between the plates, there are two channels containing media at different temperatures. These pass on either side of the plates and in opposite directions to each other. Heating or cooling is then transferred via the plates and the temperatures balanced. Different types of plate heat exchangers have been designed to withstand various forms of pressure and a range of temperatures.
Shell-and-tube heat exchangersAlfa Laval has a niche range of shell-and-tube heat exchangers, specially designed for applications in the food and pharmaceutical industries, as well as for cooling, but also for applications in the petrochemical, power, oil and gas, process and marine industries. A shell-and-tube heat exchanger is made up of a shell containing a bundle of tubes. The primary liquid (cooling medium) flows through the tubes, while the secondary liquid (normally water) flows through the shell around the tubes to enable heat to be transferred from one liquid to the other. Thanks to their robust configuration, shell-and-tube heat exchangers can withstand extremely high pressure and temperatures.
Thermal fluid systemsA thermal fluid system is a closed system that permits the heating medium – synthetic oil – to circulate in a coiled heating surface. The surface then gathers the heat that is produced, either from waste steam or through a combustion process, and this heat is transferred to the synthetic oil, enabling it
to remain in liquid form. Thermal fluid systems are generally used to generate heat for oil tanks, separators and systems for heating fuel. Other typical applications include delivering heat to steam generators, tank cleaning systems and the central heating of a vessel. These systems are also used to heat various types of cargo being transported, such as bitumen, oil-based products and chemicals.
BoilersA boiler is a closed vessel containing thin tubes. The larger the boiler, the more tubes it contains. The technology is extremely common onboard vessels but can also be utilized for industrial applications. Alfa Laval’s product range includes two different types of boilers, in which the tubes are heated in different ways: one uses waste heat from the engine exhaust, while the other, which mainly operates when the engine is turned off, utilizes heat from an oil burner. The heat from the tubes is used, in turn, to heat and vaporize the water in the container, generating steam that can then be used for a number of processes, including heating, cooling, cleaning, generating electricity or producing hot water for people onboard a vessel.
Alfa Laval has been active in the field of heat transfer since 1931, when the company started to supply pasteurizing equipment for the dairy industry. Today, the company can supply heat exchangers that optimize energy use for heating, cooling, refrigeration, ventilation, evaporation and condensation. The offering comprises heat exchangers for applications that range from use in environments with lower pressures and temperatures to environments that require the handling of aggressive fluids at high and variable pressures and temperatures. Most industrial processes need some form of solution for heat transfer. Accordingly, Alfa Laval’s customers can be found in such widely diverse industries as the chemical, food, oil, gas and power production, marine, construction and many, many more.
Market segments Competitors Market position Sales
GEA (Germany)
HISAKA (Japan)
SPX/APV (USA)
SWEP (USA)
KANGRIM (Korea)
SAACKE (Germany)
MIURA (Japan)
HEATMASTER (Netherlands)
OSAKA (Japan)
More than 30 percent of the world market
Share of Group sales
Industrial Equipment
OEM
Sanitary
Marine & Diesel Equipment
Marine & Offshore Systems
Marine & Offshore Pumping Systems
Food & Life Science
Water & Waste Treatment
Energy & Process

22 Key technologies
Separation expertise since 1883Ever since Alfa Laval was established in 1883; separation technology has been a central part of operations. The technology is used to separate different liquids from each other and solid particles from liquids. The technology can also be used to separate particles and liquids from gases.
121%
Membrane filtrationAnother separation technology offered by Alfa Laval is membrane filtration, which is an established solution for separating very small particles.
High-speed separatorsHigh-speed separators have many areas of application, including the treatment of fuel and lubricating oils onboard vessels, the processing of vegetable oil, the production of pharmaceuticals, milk, beer, wine, juice and other beverages, and in the chemical and oil and gas industry. They have high rotation speeds and can rotate as quickly as 12,000 revolutions per minute. They are generally mounted vertically and are used primarily for separating liquids from one another.
DecantersDecanter centrifuges are normally based on horizontal separation technology, which works at a speed of 5,000 revolutions per minute. They are used to separate large particles and are thus commonly used in such applications as the dewatering of sludge in wastewater treatment plants, olive oil production, distilleries and handling drilling mud in conjunction with oil extraction.
Belt filter pressesPresses intended for the dewatering of municipal and industrial wastewater. This separation technology was added through the acquisition of Ashbrook Simon-Hartley and is a complement to our decanters.
Competitors Market position Sales
25 to 30 percent of the world market
Share of Group sales
Market segments
Separators
GEA (Germany)
MITSUBISHI KAKOKI KAISHA (Japan)
PIERALISI (Italy)
SPX/Seital (USA)
Decanters
GEA (Germany)
GUINARD/ANDRITZ (France, Austria)
FLOTTWEG (Germany)
PIERALISI (Italy)
Industrial Equipment
OEM
Sanitary
Marine & Diesel Equipment
Marine & Offshore Systems
Marine & Offshore Pumping Systems
Food & Life Science
Water & Waste Treatment
Energy & Process

23Key technologies
Precise and hygienic fluid handlingTransporting and regulating fluids in an efficient, safe and hygienic manner are crucial to processes in many industries. Alfa Laval focuses on fluid handling in industries with stringent hygiene requirements, such as the food and pharma-ceutical industries. The company’s pumps, valves and installation material are used in such applications as the production of beverages, dairy products, food, pharmaceutical products, and health and personal care products, in other words, in environments where any risk of contamination is precluded. Alfa Laval also offers equipment for tank cleaning.
Following the acquisition of Frank Mohn AS, the company now offers pumping systems for the marine industry and offshore market. Application areas include pumping systems for loading and unloading liquid cargo aboard product and chemical tankers and pumping systems for floating and stationary oil and gas platforms, where they are used in fire safety solutions, to supply heat exchangers with water for cooling applications and to pump ballast water, as well as the cargo itself.
120%
Tank equipmentAlfa Laval offers hygienic tank equipment primarily designed for use in the food and pharmaceutical industries. The company’s range includes everything from mixers to cleaning equipment. Alfa Laval’s mixers work well on both high and low-viscosity liquids, ranging from milk, wine and juice to yoghurt, desserts and fruit drinks. There is even a mixer that offers mixing of liquids and cleaning of the tank afterwards.
Pumps and valves Pumps drive the flow of liquids during a process and valves are used to guide and direct the flow by opening and closing. For hygienic applications, Alfa Laval mainly offers centrifugal, liquid ring and rotary lobe pumps. The most common types of valves include control valves, constant-pressure valves, butterfly valves and diaphragm valves.
To the marine market Alfa Laval offers submerged, hydraulic pumping systems for product and chemical tankers. These efficient systems enable safe and flexible load handling. In turn, this results in less time in port and fewer journeys with ballast. In oil and gas, the offering includes pumping systems for sea water, water injection and fire extinguishing, which contribute to safe and efficient operation.
Market position Sales
10 to 12 percent of the world market
Share of Group sales
Market segments Competitors
GEA (Germany)
SPX/APV/ WAUKESHA
CHERRY BURRELL (USA)
FRISTAM (Germany)
HAMWORTHY (UK)
Sulzer (Switzerland)
Industrial Equipment
OEM
Sanitary
Marine & Diesel Equipment
Marine & Offshore Systems
Marine & Offshore Pumping Systems
Food & Life Science
Water & Waste Treatment
Energy & Process

24 Adding creativity to food processing
Adding creativity to food processing
Chili con careKeeping vegetables and fruit fresh as long as possible after harvest is a key issue for food producers all over the world.
Take, for example, chili production. After drying in the fields, the hot spice has to be carefully kept in cold stores to stay aromatic. Achieving the right temperature and humidity is critical. As well as min-imizing energy consumption.
The obvious solution: technology and equipment from Alfa Laval. Our innovative spirit is leading the way in processing of chili. It’s a symbol for our care.
The food, dairy and beverage industries are constantly challenged to produce more, better and tastier products. At the same time, their hygienic and safety standards have to be uncompromising. At Alfa Laval we are leading the way in this accelerating race with our innovative products and solutions. Helping manufacturers to optimize production. It is all about maximizing the use of raw materials while minimizing impact on the environment. Here are some appetizers:
Releasing the flavourThe tomato is loved for its beauty and versatility in kitchens all over the world.
It is also an important raw material for the food industry. Forming the basis for a whole range of sauces, soups, dips and, of course, the famous tomato ketchup. A built-in advantage is that the tomato is a natural source of lycophene, a scientifi-cally recognized anticancer compound.
Alfa Laval’s separators, heat exchangers and fluid handling equipment are essential for transforming ripe, tasty tomatoes into premium products. We work in close partnership with the food industry to unzip the inner qualities of their products.

25Adding creativity to food processing
Adding creativity to food processing
Lubrication for your heartOlive oil reduces your level of dangerous cho-lesterol. This in turn lowers the risk of blocked arteries. No wonder it has become the basis for a healthier new lifestyle.
And at Alfa Laval – thanks to our high-quality separators, decanters and heat exchangers – we are helping to advance this movement.
Our equipment and systems produce more than 300 million litres of extra-virgin olive oil every year. Extremely pure and without additives. Helping to create a richer life for people. That’s a mission very close to our hearts.
The vitamin packageRich in fibre, vitamins and lots of other essential nutrients, the mango, like other tropical fruits, provides an important contribution to our diet.
However, producers of mango juice and puree have an annoying problem to cope with – the tiny black specks occurring in the product. They are perfectly normal, but they make the processed mango look less appetizing than it should.
By incorporating Alfa Laval’s decanters into existing production lines, the speck rate is reduced to barely perceptive levels. A true package solution!

26 Divisions
An organization that supports the Group’s business conceptAlfa Laval’s organization is rooted in its business concept: to optimize the performance of customers’ processes, time and time again. To achieve this goal, the company’s structure must be based on an understanding of its customers’ needs and processes, which hinges on the specialist expertise of its employees. Combined with insight into how customers conduct procurement and purchasing, this expertise serves as the foundation for Alfa Laval’s sales organization and its three divisions: Equipment, Process Technology and Marine & Diesel.

27Divisions
The Group has a shared supply chain that serves all three sales divisions. Known as the Operations Division, this centralized unit is responsible for production-related procurement, manufacturing and distribution. Time, cost, quality and sustainability are guiding concepts for this division, since optimal supply chain performance is one of many critical steps in delivering products that in turn can help optimize the performance of customers’ processes, time and time again. Final delivery should include the right product with the right quality and the right documentation at the right time. Combined with the sales divisions, Operations helps Alfa Laval achieve its business concept. Read more on pages 34–35.
Operations
Business modelEquipment offers components for cus-tomers with a well-defined and regularly recurring need for Alfa Laval’s products.
Business modelThe division offers products, solutions and systems in the areas of energy, the environ-ment and safety for customers in the marine and offshore markets and land-based diesel power.
Business modelProcess Technology serves customers that require customized solutions in the areas of heat transfer, separation or fluid handling in order to enhance the efficiency of their processes and boost their capacity.
SalesSales are primarily conducted through system builders and contracting companies, as well as dealers, agents and distributors. The division continuously increases its number of sales channels since availability is a key prerequisite. Availability is ensured through several channels to various geographic markets and industries. Given this business model, it is natural that the division also continuously develops its e-commerce offering.
Sales Sales are conducted through the Group’s own sales organization directly to shipowners, shipyards, manufacturers of diesel engines and offshore customers. The offering includes various main product groups comprising components, modules, adapted systems, boilers, separa-tors, heat exchangers, pumping systems, inert gas systems, freshwa-ter generators, exhaust gas cleaning systems, heat recovery systems and ballast water treatment systems.
Sales Sales are mainly conducted through the Group’s own sales companies and contractors, and are made directly to customers. The division combines expertise in its key technologies with solid knowledge about customer processes, and offers package solutions that cover everything from individual products to systems, complete solutions and efficient customer service.
Segments: – Sanitary– Industrial Equipment– OEM– Service
Segments: – Marine & Diesel Equipment– Marine & Offshore Systems – Marine & Offshore Pumping
Systems– Service
Segments: – Energy & Process– Water & Waste Treatment– Food & Life Science– Service
Share of Group’s order intake 27%
Share of Group’s order intake 39%
Share of Group’s order intake 34%
Aftermarket’s share of the division 17%
Aftermarket’s share of the division 30%
Aftermarket’s share of the division 28%
Equipment
Process Technology
Marine & Diesel
Read more on pages 28–29.
Read more on pages 30–31.
Read more on pages 32–33.
Procurement
Manufacturing
Distribution/Logistics

28 Financial statements28 Divisioner
Equipment Division The division’s customers are characterized by a well-defined and regularly recurring need for Alfa Laval’s products. In most cases, sales are conducted through system builders and contracting companies, as well as dealers, agents and distributors – direct sales to end-users are limited. The Equipment Division continuously increases its number of sales channels, since it is strategically important that its products are available through many channels worldwide. Given that its business model focuses on availability, it is natural that the division also strives to further develop and strengthen the Group’s e-commerce offering.
Sales Operating profit
1
2
34
5
6
7
0
2,000
4,000
6,000
8,000
10,000
1413*1211100
1,000
2,000
3,000
4,000
0
2,000
4,000
6,000
8,000
10,000
1413*121110
1,389 1,3061,320
8,627
8,902
9,508
9,701
9,471
9,867
9,447
9,476
9,462
9,787
1,4111,278
SEK MILLION SEK MILLION SEK MILLION
Sales and operating profit
1 Sweden 7%2 Other EU 34%3 Other Europe 8%4 North America 20%5 Latin America 4%6 Asia 25%7 Other 2%
Order intake
Significant events in 2014 – The year began on a positive note, with
record-high demand noted in the second quarter. However, the impact of growing concerns in the external environment were felt in the second half of the year and resulted in an unchanged order intake for the full year. Nevertheless, growth remained stable in a number of strategically important areas, with a generally strong trend reported in many emerging economies, particularly Asia.
– Sanitary noted increased demand for products for manufacturing soup and baby food, as well as soy and tomato-based foods. However, investments in logistics solutions declined in the food sector, resulting in lower demand for heat exchangers for cooling applications in the Industrial Equipment segment.
– The e-commerce platform, launched in 2013, became available to customers in
the EU and North America for essentially all products. Significant growth was reported, and in many traditional markets, e-commerce accounted for a large per-centage of the total number of orders. The roll-out of the platform into additional geographic regions will continue in 2015.
– During the year, the division delivered the majority of a large project encompassing district heating and cooling products for a large university campus in the US. This project represents a breakthrough for district heating in North America.
– A new product was launched for the cooling of data centers, a market that is expected to grow considerably. At the same time, the division experienced a breakthrough in hygienic applications with a major order secured in South Korea for heat exchangers, optimized for the phar-maceutical industry.
Susanne Pahlén Åklundh
President, Equipment Division
* Restated to IFRS 11. * Restated to IFRS 11.

29Divisions
Change in order intakeOrder intake
Sanitary
20132014 2012== +Share of division’s order intake 34%
Change in order intakeOrder intake
OEM
20132014 2012== -Share of division’s order intake 15%
Change in order intakeOrder intake
Service
20132014 2012+= +Share of division’s order intake 17%
Change in order intakeOrder intake
Industrial Equipment
20132014 2012== =Share of division’s order intake 34%
OperationsSales comprise heat exchangers for district heating and cooling, air conditioning of plants, offices and shopping malls, and cooling and freezing solutions for the food, beverage and pharmaceutical industries, as well as supermarkets. In addition, the segment’s customers are active in the manufacturing industries to which Alfa Laval sells heat exchangers and separators for temperature regulation and/or cleaning of liquids to enable their reuse, thus lowering operating costs and protecting the environment.
Forces driving demandActivity levels in the construction industry, energy price trends, the need for energy-efficient solutions, the shift toward demand for more environmentally friendly cooling media, environmental legislation, industry capacity utilization, commodity and energy price trends, increased environmental focus and expansion of power supply.
OperationsAlfa Laval’s products are used to produce liquid and viscous foods, pharmaceuticals and hygiene products. Customers are active in the beverage, dairy, food and biotechnology industries, all of which have stringent requirements in terms of hygiene and safety.
Forces driving demandChanges in consumption habits as a result of urbanization in growing economies, the development of new medicines, improved standard of living, demo - graphic changes, the need for energy-efficient solutions and expanded food production.
OperationsCustomers in this segment include manufacturers of air-conditioning systems, air compressors, heat pumps, air dryers and gas boilers. Among other products, Alfa Laval sells brazed plate heat exchangers, which are later integrated into customers’ end-products.
Forces driving demandIncreased focus on the environment, the need for energy-efficient solutions, government subsidies and energy price trends.
OperationsCustomers are active in all of the division’s segments, with the exception of OEM. The aftermarket is a priority area and the overall strategy is to further develop and expand the spare parts and service operations. Read more on pages 36–37.
Forces driving demandThe industrial capacity utilization rate and growth in the installed base.

30 Divisioner
Svante Karlsson
President, Process Technology Division
Process Technology DivisionThis division serves customers that require customized solutions to enhance the efficiency of their processes or boost their capacity. Sales are mainly conducted through the Group’s own sales companies and contractors, directly to customers. Alfa Laval combines expertise in its key technologies with solid knowledge about customer processes, and offers package solutions that cover everything from individual products to systems, complete solutions and efficient customer service.
0
3,000
6,000
9,000
12,000
15,000
1413*1211100
1,000
2,000
3,000
4,000
0
3,000
6,000
9,000
12,000
15,000
1413*121110
2,1942,479
2,230
13,813
14,410
10,632
13,935
14,271
10,923
12,738
14,081
12,160
12,812
2,159
2,506
Sales and operating profit Order intake
1
2
3
4
5
6
7
1 Sweden 1%2 Other EU 22%3 Other Europe 9%4 North America 30%5 Latin America 8%6 Asia 27%7 Other 3%
Significant events in 2014– The division re-organized into four new
segments in order to better reflect and serve the end customer markets: Energy & Process, Food & Life Science, Water & Waste Treatment and as before, the after-market segment Service.
– Energy & Process still benefited from a high investment activity in the oil & gas sector. Several orders were won in the area of EOR, enhanced oil recovery, as well as in gas, not least thanks to earlier acquisitions made in this area.
– Food & Life Science benefited from struc-tural growth in emerging economies, where capacity expansion in several food areas contributed. Brewery declined due to the non-repeat of large projects. Still, the craft brewery market developed well, resulting in good demand.
– Breakthroughs were made in a number of areas, as new opportunities were identified: coal to liquid in refineries, tall oil processing from pulp & paper, heavy crude oil sepa-ration, protein extraction from sunflower and starch production from wheat, to mention a few.
– The Water & Waste Treatment segment expanded its presence further with the recently launched, and locally produced, decanters for the Chinese market. The segment also started to build an organi-zation to focus on industrial waste appli-cations across a number of industry sectors.
– The Service segment continued to grow following increased activities for capturing more of the installed base’s aftermarket potential. Increased focus on service sales further contributed to the positive development.
Sales Operating profit
* Restated to IFRS 11. * Restated to IFRS 11.
SEK MILLION SEK MILLION SEK MILLION

31Divisions
Change in order intakeOrder intake
Food & Life Science
20132014 +-
OperationsAlfa Laval supplies process solutions for the beverage and food industries, as well as the life science sector. Among other applications, the Group’s solutions are used in the production of beer, wine, juice, fruit concentrates, pharma-ceuticals, food ingredients, milk proteins, sugars, semi-processed foods, vegetable/olive oil, and meat and fish proteins.
Forces driving demandDemographic changes, population growth, higher standard of living, changes in consumption patterns, increased focus on healthy food, subsidies and raw material price trends.
Share of division’s order intake 22%
Change in order intakeOrder intake
Energy & Process
20132014 -=
OperationsAlfa Laval’s products, modules and systems play a major role in oil and gas extraction as well as power production. They can also be used in the manufacturing of petrochemical products, plastics, polymers, metals, minerals, biofuels, pharmaceuticals, starch, paper, sugar and much more.
Forces driving demandGlobal market prices for raw materials, such as sugar, ethanol, corn, oil, gas and steel. Energy prices, environmental legislation, the need for energy-efficient solutions, the need for productivity enhancements, demand for fuel and technological shifts. A growing need for energy in developing countries, national independence and the expansion of energy production to include renewable fuels are some of the factors driving demand.
Share of division’s order intake 45%
Change in order intakeOrder intake
Water & Waste Treatment
20132014 +-
OperationsAlfa Laval offers products that can help customers fulfill increasingly strict legislation and environmental requirements. For example, the company supplies decanter centrifuges for the dewatering of sludge in municipal treatment plants across the world.
Forces driving demandNew rules and regulations, increased need for freshwater due to a growing population and increased urbanization.
Share of division’s order intake 3%
Change in order intakeOrder intake
Service
20132014 ++
OperationsCustomers are active in all of the division’s segments. The aftermarket is a priority area and the overall strategy is to develop and expand the spare parts and service business, which offers customer value, brings customers closer to Alfa Laval and is less sensitive to variations in the business cycle. By creating continuous customer contacts, the division facilitates new sales. Read more on pages 36–37.
Forces driving demandThe general activity level in various industries, the need to upgrade older equipment, an increased need for efficiency, and the need for service and spare parts to prevent unplanned stoppages and minimize the time necessary for planned stoppages.
Share of division’s order intake 30%
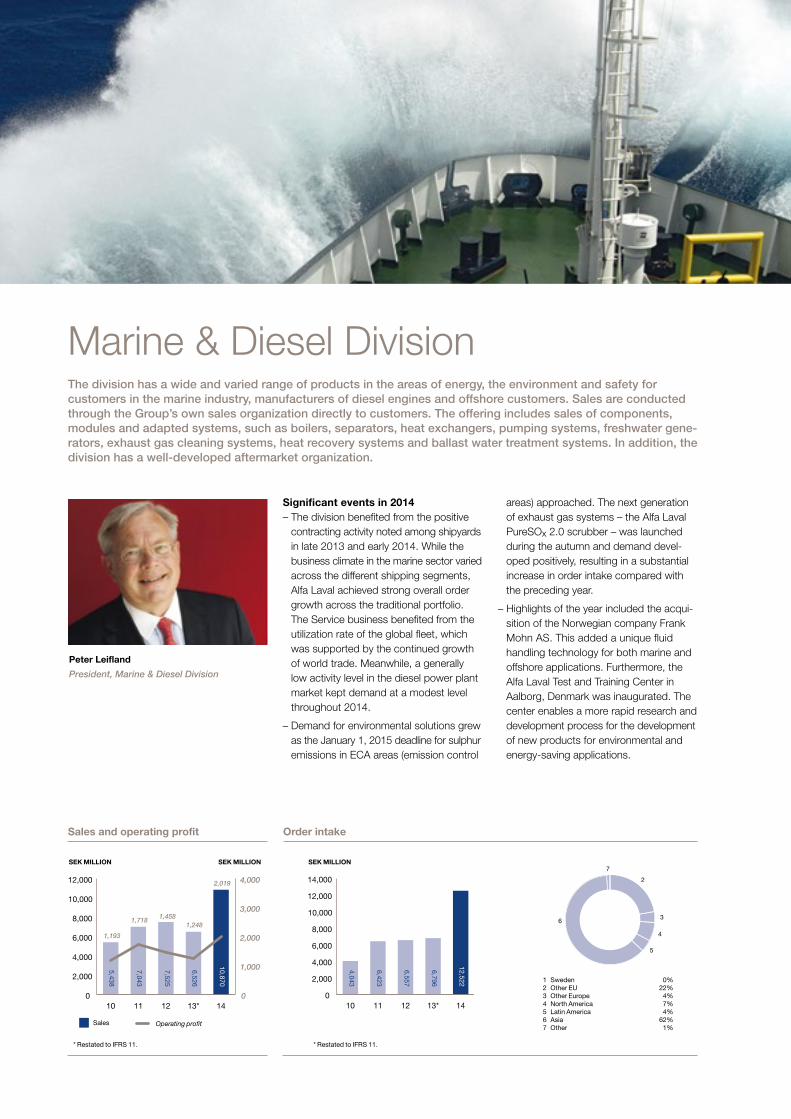
32 Financial statements32 Divisioner32 Divisioner32 Divisioner
Peter Leifland
President, Marine & Diesel Division
Marine & Diesel DivisionThe division has a wide and varied range of products in the areas of energy, the environment and safety for customers in the marine industry, manufacturers of diesel engines and offshore customers. Sales are conducted through the Group’s own sales organization directly to customers. The offering includes sales of components, modules and adapted systems, such as boilers, separators, heat exchangers, pumping systems, freshwater gene-rators, exhaust gas cleaning systems, heat recovery systems and ballast water treatment systems. In addition, the division has a well-developed aftermarket organization.
0
2,000
4,000
6,000
8,000
10,000
12,000
1413*1211100
1,000
2,000
3,000
4,000
0
2,000
4,000
6,000
8,000
10,000
12,000
14,000
1413*121110
1,4581,248
2,019
6,526
10,870
5,438
6,796
12,522
4,043
6,423
6,557
7,043
7,525
1,193
1,718
Sales and operating profit Order intake
2
3
4
5
6
7
1 Sweden 0%2 Other EU 22%3 Other Europe 4%4 North America 7%5 Latin America 4%6 Asia 62%7 Other 1%
Significant events in 2014– The division benefited from the positive
contracting activity noted among shipyards in late 2013 and early 2014. While the business climate in the marine sector varied across the different shipping segments, Alfa Laval achieved strong overall order growth across the traditional portfolio. The Service business benefited from the utilization rate of the global fleet, which was supported by the continued growth of world trade. Meanwhile, a generally low activity level in the diesel power plant market kept demand at a modest level throughout 2014.
– Demand for environmental solutions grew as the January 1, 2015 deadline for sulphur emissions in ECA areas (emission control
areas) approached. The next generation of exhaust gas systems – the Alfa Laval PureSOx 2.0 scrubber – was launched during the autumn and demand devel-oped positively, resulting in a substantial increase in order intake compared with the preceding year.
– Highlights of the year included the acqui-sition of the Norwegian company Frank Mohn AS. This added a unique fluid handling technology for both marine and offshore applications. Furthermore, the Alfa Laval Test and Training Center in Aalborg, Denmark was inaugurated. The center enables a more rapid research and development process for the development of new products for environmental and energy-saving applications.
Sales Operating profit
* Restated to IFRS 11. * Restated to IFRS 11.
SEK MILLION SEK MILLION SEK MILLION

33Divisions
Change in order intakeOrder intake
Service
201220132014 ==+
OperationsHas a wide offering for the division’s customers comprising spare parts, service, repairs, upgrades and replacement products. The network is well developed and ready to help customers whenever and wherever they need assistance. Read more on pages 36–37.
Forces driving demandIncreased trade and capacity utilization in the global shipping fleet.
Share of division’s order intake 28%
Change in order intakeOrder intake
Marine & Offshore Systems
20132014 ++
OperationsSupplies customers in the marine industry and offshore sector with a number of components, modules and adapted systems aimed at optimizing their processes, saving energy and reducing emissions. The offering includes boilers, inert gas systems, exhaust gas cleaning systems and thermal fluid systems.
Forces driving demandGlobal transport requirements, governmental initiatives to support local shipyards, environmental legislation, increased focus on energy efficiency, safety regulations for transporting flammable cargoes, investments in offshore oil and gas exploration, and offshore drilling technology improvements.
Share of division’s order intake 22%
Change in order intakeOrder intake
Marine & Diesel Equipment
2013 20122014 = -+
OperationsThe segment supplies shipowners, shipyards and manu-facturers of diesel engines with a wide range of products in the areas of energy, the environment and power. The product portfolio includes separators, heat exchangers, freshwater generators, tank cleaning equipment, ballast water treatment systems and much more.
Forces driving demandMarine: Global transport requirements, consolidation in the shipbuilding industry, government initiatives to support local shipyards, environmental legislation and a focus on energy efficiency.
Diesel: The need for electricity in remote locations, global energy demand and the need for power reserves, for example, for nuclear power plants and wind farms.
Share of division’s order intake 24%
Change in order intakeOrder intake
Marine & Offshore Pumping Systems
2014*
OperationsSupplies customers in the marine industry and offshore sector with pumping systems. For the marine industry, the division offers submerged pumping systems for optimizing loading and unloading on chemical and product tankers. In offshore oil and gas, the division offers pumping systems that contribute to safe and efficient operation. The offering includes pumping systems for fire-extinguishing equipment.
Forces driving demandGlobal transportation needs, for example, for refined oil products and chemicals, a growing need among shipowners for solutions that optimize loading and unloading, the expansion of floating production, storage and offloading (FPSO), the trend of refineries located closer to their source, the expansion of shale gas in the US and a general increase in the need for fossil fuels. The need for safety solutions for the offshore market.
Share of division’s order intake 26% * The segment is new, no corresponding numbers for the previous year exist.

the quality of the reporting and ultimately simplify the company’s follow-up work. The organization also developed a plan to help its suppliers understand the contents of Alfa Laval’s business principles and the type of changes required to ensure their compliance with the principles.
Production Alfa Laval’s production organization covers four continents: Europe, Asia, North America and Latin America. This structure reflects both practical and cost-related considerations. In many cases, the best way to respond to local demand is through local manufactur-ing. There are naturally also advantages to be gained by having manufacturing opera-tions located in low-cost regions. The com-pany’s production, in turn, is based on manufacturing technology, product group and the size of the product, not on its final application. The company’s management of the manufacturing process is reviewed continuously to ensure that Alfa Laval is able to meet demand in the best possible manner – where and when it arises – by offering high-quality products.
Environment and sustainability In line with Alfa Laval’s business principles, considerable efforts are made internally to limit the company’s impact on the environ-ment. While a large portion of the compa-ny’s products help customers reduce their energy and water consumption, it is equally important that Alfa Laval’s own footprint is
34 Divisions
Competitive on all fronts Operations – a key link in the chainAlfa Laval’s position as a world-leading supplier of products and services in the areas of heat transfer, separation and fluid handling is attributable to a number of factors – many of which are externally visible – including efficient, high-quality products, an unrivalled sales and service network, the industry’s broadest product range and employees with in-depth knowledge about a large number of industrial processes. Less obvious from the outside, yet equally crucial to Alfa Laval’s continued success, is the work conducted in the Operations Division, the company’s shared supply organization.
Operations is responsible for production-related procurement, manufacturing, logistics and distribution. This means that the organization is continuously faced with a number of important issues that must be resolved to ensure that the company’s work and processes run smoothly. Quality, efficiency, cost, capacity utilization, delivery reliability, delivery times, secure access to raw materials, environmental considerations and safety are only a few of the countless factors the organization manage and balance on a daily basis. Ultimately, this should lead to competitive products delivered with short lead times, the right quality and the right documentation at the right time.
Procurement The company’s production-related procure-ment is extensive and includes a wide range of raw materials and components. For Alfa Laval, direct materials comprise the single largest item in the cost of goods sold, and metals such as steel, nickel, copper, alu-minum and titanium, in turn, account for the largest portion of these direct materials. Because of this exposure, Alfa Laval invests considerable time and resources in contin-uously developing its procurement process. Procurement is consolidated in order to cover the total needs of the Group, provid-ing the strength required in negotiations with suppliers. However, price is only one component. Other key factors that must be considered include punctual deliveries, rea-sonable lead times and the right quality, as well as the supplier’s compliance with Alfa Laval’s business principles with respect to safety, health, the environment and ethics. During the year, the organization’s efforts to develop this part of the procurement pro-cess resulted in a new platform for supplier audits. This new platform applies a global standard, which enables uniform and thus comparable audits. This is expected to increase transparency, reduce risks, improve
as clean, effective and energy-efficient as possible. This environmental work is led by the line organization to ensure that it is incorporated into daily operations. For more information about Alfa Laval’s environ-mental and sustainability work, visit www.alfalaval.com/about-us.
Distribution/Logistics Distribution and logistics include everything from order handling and inventory manage-ment to stock picking and invoicing. Dis-tribution and logistics activities are based out of distribution centers located in Sweden, Denmark, China, Singapore, the US, Japan and India. These centers are responsible for ensuring the delivery reliability of products, as well as the supply, inventory management and deliveries of spare parts. Large volumes of products and spare parts are distributed each year. Alfa Laval’s overall transport needs are managed by a Group-wide organization, which – thanks to the company’s consoli-dated volumes – is able to ensure that this work is carried out efficiently and in a cost-conscious and environmentally friendly manner. The organization works continuously to reduce its CO2 emissions by transporting as little as possible by air. However, on cer-tain occasions, Alfa Laval is not able to control the delivery method used – for example, in situations where customers require that deliveries be made with very short lead times or when the organization needs to make up for a delay at an earlier stage in the supply chain. On such occa-sions, air transportation is the only possible solution, which has a direct negative impact on the Group’s emissions target. The company’s goal is to reduce the amount of carbon emissions from transpor-tation by 3 percent annually by 2014. In 2014, 25 percent (26) of the Group’s goods were shipped by sea, 69 percent (67) by road and 6 percent (7) by air.
Procurement Manufacturing Distribution/Logistics
Approximately 80 percent of the value of Alfa Laval’s total procure-ment volume is attributable to 420 suppliers (356) and 65–70 percent occurs within the framework of global contracts.

35
USA (1)
Sweden (2)
Denmark (1)
China (1)
Singapore (1)
Japan (1)
India (1)
UK (1)
France (5)
Germany (1)
Italy (2)
Poland (1)
Russia (1)
India (4)
Korea (2)
China (3)
Japan (1)
Alfa Laval’s production includes 42 major manufacturing units:
USA (8)
Brazil (2)
Sweden (4)
Norway (3)
Denmark (3)
Finland (1)
Divisions
Distribution centers Distribution 2014
Investments by geographic market, %
Purchases by geographic market, %
1
2
3
4
51
2
3
4
5
1
2
3
4
Production units
Road69%
Sea25%
Air6%
Geographic distribution of direct labor hours in production, %
1 North America 12%2 Latin America 2%3 Western Europe 64%4 Central and Eastern Europe 5%5 Asia 17%
1 North and Latin America 31%2 Asia 15%3 Central and Eastern Europe 2%4 Western Europe 52%
1 North America 6%2 Latin America 5%3 Western Europe 29%4 Central and Eastern Europe 4%5 Asia 56%

36 Service
ServiceHigh quality, operational reliability, a long service life, optimal performance and favorable operating economy. All of this can be achieved by investing in new equipment from Alfa Laval. But why stop there? If you have chosen to invest in the best equipment, you should naturally also enjoy the benefits of top-notch service. This creates the optimal conditions for providing confidence throughout the service life of the equipment, allowing your processes to continue unimpeded without unplanned stoppages.
The most cost-effective long-term alternativeAlfa Laval’s equipment is installed in a large number of industries – across the world. Different industries, different products, different customers – Alfa Laval’s service operations face a wider range of variations than any other area of the company. Accordingly, it goes without saying that the company cannot offer a single solution to suit all needs. Customer needs vary depending on the type of technology in question – heat transfer, separation or fluid handling. They also vary with respect to the frequency of the customer’s processes, the environment in which they work, their duties and whether or not the customer has its own service organization. Taking all of these variables into consideration, it is obvious why the need for spare parts and service may arise after only a few months in certain cases and after several years in others. This is why it is so important that Alfa Laval is able to offer the exact services required by the individual customer – no more and no less. The company’s service agreements, which are tailored to meet the customer’s individ-ual needs and wishes, cover everything from the replacement of spare parts and scheduled maintenance to total responsibility for the operation and maintenance of the
equipment. After all, it is cheaper to take a preventive approach than to run the risk of unplanned stoppages.
Alfa Laval always close at hand Alfa Laval has more than 100 service centers located worldwide. Proximity to customers is extremely important, and in certain cases, a determining factor in the customer’s initial decision to invest in products from Alfa Laval. Knowing that help is available when and where it is needed provides a sense of security.
At the local service units, the company’s well-trained, experienced service engineers are supported by central groups of specialists. Some of this work can naturally be carried out at the customer’s premises, but a service center is always close by if major repairs or reconditioning are needed. Alfa Laval’s service network is a strategically important part of the operations and is continuously being expanded. In 2014, new service centers were added in Greece, Indonesia and China, to give three examples.
Taking equipment to new heights In addition to maintenance and spare parts, Alfa Laval’s service operations offer perfor-mance upgrades to previously installed products, such as plate heat exchangers, separators and decanters, in order to boost
capacity, improve productivity, reduce energy consumption and cut operating and main-tenance costs. Another type of upgrade, central to the marine industry, involves upgrading equipment to meet new legislative requirements. Upgrades ensure access to the latest technological advancements and improvements, without needing to invest in entirely new equipment.
Everyone is a winner! Investing in service and spare parts from Alfa Laval generates value for the customer, since the installed products then are given optimal conditions for a long, problem-free service life. Naturally, there are also benefits for Alfa Laval. The business is not only prof-itable, but also less sensitive to economic trends and thus has a stabilizing effect on the company in periods of economic down-turn. At the same time, it is an important component of the Group’s efforts to identify new requirements and needs, which can be translated into new products with the help of the research and development organization. Last but not least, the organization’s frequent customer contacts create opportunities for additional new sales. In other words, the service organization is not “one step behind,” but rather part of a cycle – and a vital com-ponent of Alfa Laval.

37Service
107
Plate heat exchangers x 1–7
Decanters x 1.5
Pumps and valves x 1–2.5
Separators x 4
Service centers Installed base
Long-term potential – Value of the aftermarket relative to new sales
Large and mature installed base that needs to be maintained and renewed.
A combination of fast-growing markets and established niche applications.
Installed base that is growing rapidlyAt year-end 2014, Alfa Laval had 107 service centers (106). A reclassification explains the modest increase compared to the preceding year.
Order intake, SEK million
0
2,000
4,000
6,000
8,000
10,000
1413121110
6,799
7,486
8,023
8,144
9,469

38 Employees
This is the challenge facing the individual managers at Alfa Laval, with the support of the HR function – encompassing everything from attracting new employees to caring for those already in place in the organization. Managers also play a role in ensuring that the employees in acquired units feel welcome at the company. Alfa Laval aims to have a safe workplace with favorable working con-ditions, access to various career paths and opportunities for personal development. Satisfied employees are ultimately the com-pany’s best ambassadors.
The first and most important step is to comply with local legislation and regulations, and the second is to follow the company’s business principles, which prohibit discrimi-nation, support freedom of association, respect human rights, prohibit child labor and stipulate that Alfa Laval is to offer a healthy and safe workplace. However, Alfa Laval’s business principles not only state how the company and its employees are to act with respect to human rights, but also in terms of the environment, ethics and transparency. All employees are expected to be familiar with these principles and use them as a basis for their own actions both internally and externally.
EmployeesA company grows with its employees. But how can it get its employees to thrive and grow? People are not a homogenous group, but rather individuals with different needs and driving forces. Some people enjoy a challenge, while others perform best with the sense of security that comes from repetitive work. Yet despite all of these differences, some needs are universal – such as the need to feel safe and appreciated at work. Given this complexity, how can a company create an environment where people are content and strive toward the same goals, despite their individual differences and needs?
Health and safety It is fundamental that Alfa Laval’s employees have a safe work environment and do not put their health at risk while on the job. The company has a vision of a workplace that is free from accidents and work-related illnesses. Its work in the area of health and safety is ongoing and supported by an Occupational Health and Safety (OHS) program aimed at establishing safety issues and considerations, as well as various health considerations, into the daily procedures. The OHS program includes a council responsible for establishing deadlines and strategies, global priority areas and action plans. The council not only determines the direction of this work, but also contributes tools to support the realization of this vision. Alfa Laval has established several goals pertaining to health and safety. Learn more about this in the Group’s GRI report and the progress report published in the sustainability section on www.alfalaval.com.
Career paths open to all Alfa Laval is an innovative company that requires creativity and fresh ideas. For this to be possible, the composition of employees
must be varied. New ideas and approaches are developed through cooperation between people with different genders, nationalities and sexual orientations, as well as varying ages, experiences and opinions. Accordingly, it is important that all employees feel that they have career paths open to them. To accomplish this, Alfa Laval uses an open internal recruiting process. All available positions are published on the company’s intranet and all employees are welcome to apply. This approach broadens the base of applicants and promotes mobility and diversity, two key concepts that characterize the company’s recruitment, employee development and managerial appointments. At year-end 2014, 93 nationalities were represented at Alfa Laval. The proportion of female employees in the company was 19 percent and the proportion of women in the group of managers reporting directly to Group management was 17.5 percent.
Training and development Alfa Laval offers a broad range of training opportunities, some of which are managed locally and others as part of a central program. The training portal on Alfa Laval’s intranet

39Employees
17
2
34
5
6
10,000
12,000
14,000
16,000
18,000
14131211100.0
0.5
1.0
1.5
2.0
2.5
1413121110
12,078
2.05
2.05
14,667
1.95
16,060
16,238
17,109
1.86
1.84
Average number of employees Sales per employee, SEK million Employees per region
1 Sweden 12%2 Other EU 32%3 Other Europe 7%4 North America 11%5 Latin America 4%6 Asia 33%7 Other 1%
The outcomes for 2009-13 were affected by the strong Swedish krona. The outcome 2011-12 by the acquisition of Aalborg Industries and the Euro crisis. Aalborg Industries has lower sales/employee than Alfa Laval. The outcome 2014 was affected by a weaker Swedish krona and the acquisition of Frank Mohn AS.
serves as a hub for these company-wide programs and provides information about all courses and training sessions. More than 350 courses were offered in 2014, 150 of which were internet-based. These courses are held in a real-time group set-ting or as independent study programs that allow the participants to determine the location and pace of the program. Interest in and demand for these types of programs are increasing and the HR organization is responding by developing and adding new programs as the need arises. During the year approximately 7,700 employees took part in one of the training courses offered by the portal. If the number of training hours is distributed across all employees,
each employee received 6.4 hours of training from the central program. Employee devel-opment can also take other forms – for example, applying for a new job via the intranet, which could entail moving to a new position or even to another country. Alfa Laval operates in an ever-changing world and is exposed to a wide range of sectors and countries. Accordingly, the company must continuously develop in order to identify and capitalize on the potential that exists. In an organization dedicated to performance and development, it is crucial to create a stimulating environment that enables ongoing learning. Only then can the com-pany optimize its own performance and that of its customers.
Each year, Alfa Laval conducts a global, Group-wide employee survey. A total of 94 percent of the company’s employees participated in the most recent survey. The results indicated an employee satisfaction index of 88 percent and an engagement level of 78 percent.
Employee survey
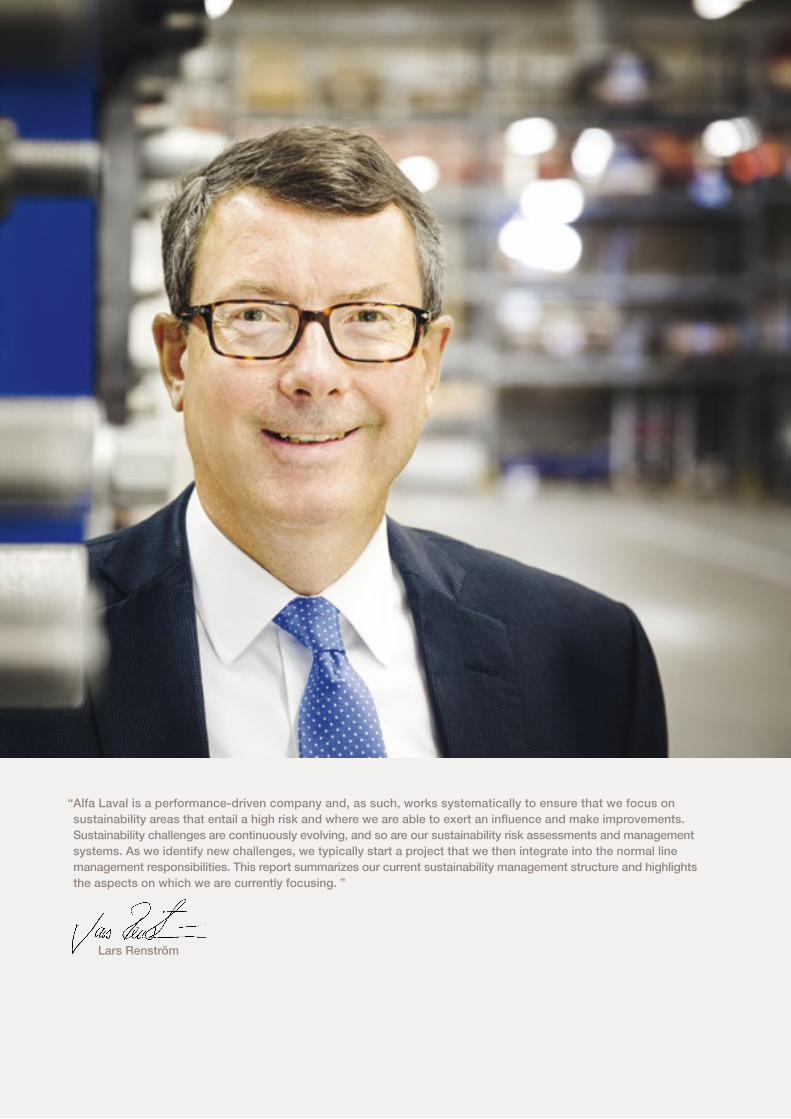
40 Hållbarhetsrapport
“ Alfa Laval is a performance-driven company and, as such, works systematically to ensure that we focus on sustainability areas that entail a high risk and where we are able to exert an influence and make improvements. Sustainability challenges are continuously evolving, and so are our sustainability risk assessments and management systems. As we identify new challenges, we typically start a project that we then integrate into the normal line management responsibilities. This report summarizes our current sustainability management structure and highlights the aspects on which we are currently focusing. ”
Lars Renström

41Sustainability report
Social:The Social Business Principle could be considered to have the broadest scope of all of the Principles. It is based on the United Nations Guiding Principles and the OECD Guidelines. Our risk assessment looks at the possibility of human rights breaches against people in our supply chain, our company and our customers’ organizations. In accordance with the UN Guiding Principles, our priorities are based on the risk to people, rather than the risk to business.
Suppliers and supply chain: Risk assess-ment and mitigation is the prime responsi-bility of the purchasing departments.
We have found that the main risks arise in countries with ineffective enforcement of national employment legislation, as well as international human rights standards. For Alfa Laval, this is largely China and India. In these countries, we focus on suppliers with an inherent risk to people based on the processes they operate, for example, metal
polishing, casting and forging. With several thousand suppliers worldwide, priority is given to pushing for improvements in sup-pliers where we can influence change – in other words, suppliers for whom we repre-sent a large and significant customer.
Alfa Laval employees: Risk assessment and mitigation is the prime responsibility of the line management, supported by human resources.
Internally, we have found that the most severe risks to health and safety arise in our workshops and among our field service engineers working at customer sites. The Health & Safety Council sets the policies and prioritizes Group-wide initiatives. The council is chaired by the Senior Vice President of Human Resources and also includes the most senior managers from the organiza-tions exposed to the highest risks, such as the Operations Division and Service.
General employee welfare is also essential. Important employee feedback is provided
through a global employee satisfaction survey, as well as representative bodies such as the European Employee Council. As with all Swedish companies, employee representa-tives are present at all Board meetings at the Group level, helping to create a strong communication link between employees and management.
Customers: Risk assessments and mitigation initiatives are the main responsibility of the sales management teams.
They are supported and guided by the Commercial Ethics Council (CEC), which is chaired by the CEO and also includes three other members of Group management.
Human rights issues are frequently at the root of international trade embargoes. Thus, export control is a key focus for the CEC to ensure that all relevant embargoes are respected and implemented throughout the sales channels used for Alfa Laval products. Commercial dilemmas originating from conflicts and human rights issues, but
ENVIRONMENT
Optimizing the use of natural resources is our business
TRANSPARENCY
Our commitment to open dialog builds trust
Our Business PrinciplesOur four Business Principles form the basis of our work on sustainability.
BUSINESS INTEGRITY
High ethical standards guide our conduct
SOCIAL
Respect for human rights is fundamental
They incorporate the 2011 “Protect, Respect and Remedy” framework introduced in the United Nations Guiding Principles on Business and Human Rights, as well as the 2011 revision of the OECD Guidelines for Multinational Enterprises. We are also signatories to the UN Global Compact.
We recognize that we cannot focus on everything at the same time:The Business Principles are very broad and thus enable us to identify many potential risks. However, it would not be realistic for us to tackle them all at the same time. In reality, some of the challenges actually lie outside our sphere of influence. So we set priorities to reach a good balance between the severity of the risk and our ability to influence and create meaningful change.
Our efforts to achieve such a balance are referred to as the “Vital Few.”
Committed and involved Board and Group Management: Each year, our progress, targets and priorities towards realizing the aspirations described in our Business Principles are reviewed on two different occasions by both the Board of Directors and Group Management.
Implementation is a line management functionOur goal is to integrate necessary risk miti-gation steps into our regular day-to-day business. The implementation process is guided by councils made up of managers from relevant departments and chaired by a member of Group Management.
Each Business Principle has its own management structure
Sustainability report 2014

42 Sustainability report
not subject to official trade embargoes, are also addressed.
Customer safety is a prime concern and any safety-related product issues are auto-matically referred to the Group Crisis Management team to ensure that a thor-ough root cause analysis is performed and appropriate corrective actions implemented, including product recalls, if necessary.
Vital Few: We have prioritized two signifi-cant risk aspects: 1: Improving the working conditions of employees of selected suppli-ers in low-cost countries, and 2: Reducing the frequency and severity of workplace accidents in our workshop areas.
Business Integrity:Our Business Integrity Principle includes: legal compliance; conflicts of interest; politi-cal contributions; anti-bribery and anti-cor-ruption (ABAC); fair competition and gov-ernance. The Commercial Ethics Council drives risk assessments and mitigation pro-cesses, while managers are responsible for ensuring compliance with Group policies and applicable laws. Recently, the focus has been on ABAC processes, with sales companies conducting a new risk and miti-gation assessment. We see the most sig-nificant risks arising in countries with high levels of corruption, where we sell through third-party agents.
In 2014, we rolled out improved ABAC processes, including e-learning modules in multiple languages. All sales personnel will be required to complete the e-learning modules in 2015.
Vital Few: The implementation of improved ABAC processes in all sales organizations.
Environment:Our products represent our main contribu-tion to sustainability since they play an increasingly important role in minimizing industrial energy consumption (and thus greenhouse gases) and maximizing the yield from natural resources. Our environ-mental solutions are sometimes essential if industrial processes are to meet legislation on emissions to both air and water. A list of sustainability case studies can be found in the GRI Report on our website.
Our environmental management processes are in focusOur efforts to minimize our own environmen-tal impact are overseen by the Environment Council. Chaired by the President of the Operations Division, the council includes top managers from organizations with the most significant environmental impact, such as manufacturing, repair shops and new product development.
Alfa Laval’s manufacturing processes are neither energy nor water intensive. However, the most significant energy con-sumption still occurs here, with 23 of our major sites accounting for about 85 percent of the total Group manufacturing energy consumption. Water pollution risks mainly arise in the service repair workshops, where residue and cleaning chemicals from customer production processes require careful handling to avoid leaks.
Emissions from air freight are of the same order of magnitude as those from manufac-turing. The logistics department analyzes the weight and distance of all air freight shipments every month to help pinpoint projects that can reduce the need for air freight.
The positive environmental impact of Alfa Laval products, once installed, far exceeds the negative impact from our operations. The effective implementation of an environ-mental life cycle impact assessment is therefore an integral part of the new prod-uct design process.
Vital Few: We aim to: 1. Ensure that we have close control over the use of chemi-cals which may be associated with environ-mental or health risks, 2: Ensure that the new products have a lower environmental impact than the ones they replace, and 3. Minimize greenhouse gas emissions from manufacturing and goods transportation.
Transparency: Our main audiences for sustainability infor-mation are SRI analysts, investors, students and, more recently, our customers as a part of their responsible supply chain initiatives.
Alfa Laval’s CSR Manager, who reports to the CEO, provides implementation sup-port to the line managers and handles communication to external and internal audiences. A prime tool is the Alfa Laval website www.alfalaval.com, which contains two additional sustainability reports: the Progress Report, which is a summary of key achievements and challenges, and the GRI Report, containing detailed statistics.
Vital Few: Improving our dialog with cus-tomers.
Alfa Laval’s environmental work
Our internal environmental work
Optimising the use of natural resources is our business
Green operations
Business principles
Green processes Environmental
products

43Financial statements
Alfa Laval’s site for plate heat exchanger manufacturing in Lund, Sweden, consumes 3,700 MWh of district heat annually to heat its buildings and tap water. This corresponds to the annual consumption of 176 average-sized Swedish homes.
After considering the best way to utilize the heat generated in the production, by presses and other equipment, for several years, an installation including heat exchangers was
Practicing what we preachmade on site. The solution means that 80 percent of the heating requirements will be met using re covered heat. This will cut costs by SEK 1.5 million per year and reduce CO2 emissions by 140 tons per year, corre-sponding to 141 one-way journeys from Copenhagen to New York.
The investment has a payback period of three years and is expected to generate long-term savings. In addition, the facility
will serve as a reference installation, where customers can observe several of the com-pany’s products at work.
The overall gains however go beyond monetary value since the investment is com-pletely in line with Alfa Laval’s focus on sus-tainability. With the new solution, waste heat can be utilized and the carbon footprint reduced. A true gain for the environment.

44 Financial statements
Introduction by the Chairman of the Board 45
Corporate Governance Report 2014 46
Introduction to Alfa Laval 46
Share and ownership structure 46
Annual General Meeting 48
Annual General Meeting for the 2013 fiscal year 48
Nominating Committee 48
Board of Directors 49
Committees 50
The company’s auditors 51
Remuneration to auditors 51
Board of Directors and auditors 52
President and Group management 54
Areas of responsibility 56
Group management meetings in 2014 56
Remuneration to senior executives 56
Board of Directors’ report on internal control 57
Control environment 57
Risk assessment 57
Control structures 57
Information and communication 58
Follow-up 58
Auditor’s statement on the Corporate Governance Report 58
Contents – Corporate Governance Report

45Corporate Governance Report
Introduction by the Chairman of the BoardAlfa Laval has a clear strategy – to create profitable growth by capitalizing on the structural changes we observe with respect to energy, the environment, food and increasing globalization. Alfa Laval’s end markets are all linked to these areas in one way or another.
We are working to achieve organic growth by strengthening our presence in fast-growing regions, where an improved standard of living has driven – and continues to drive – the expansion of the food sector. We are also taking initiatives to strengthen our presence in the energy sector, partly in response to external forecasts of growing energy needs and partly to enable a more efficient use of energy. We are developing new products to meet more stringent environmental regulations and supplementing our operations through acquisitions in areas where we have identified advantages to adding a new market channel or a broader product portfolio. During the year, this strategy resulted in Alfa Laval’s largest acquisition to date: Frank Mohn AS. The company is a world-leading supplier of pumping systems for applications in the marine and offshore markets – for example, loading and unloading liquid cargo aboard product and chemical tankers. The acquisition complemented Alfa Laval’s offering to the marine industry, which benefits as an increasingly globalized world with growing world trade, contributes to a greater need for transportation.
In parallel with this focus on growth, we always strive to become more productive. Along with the acquisition of Frank Mohn AS, productivity improvements – achieving more for less – were a key feature of the work of the Board during the year. For example, we announced a cost-cutting program, focusing on structural changes, as well as sales and administration. As a result of these adjustments and the company’s competitive offering, we believe that Alfa Laval is extremely well positioned for the future.
The work of the Board has also focused on the Group’s ongoing financial and operational development. The common thread to all of the items addressed by the Board during the year is that our discussions and decisions have focused on the same overall goal: that Alfa Laval display profitable growth by remaining a world-leading player in the areas of heat transfer, separation and fluid handling. In presenting this report, our aim is to show that our decision-making processes, division of responsibilities and control activities – both in the Board and in the company’s operating activities – ensure that our path toward achieving this goal is in line with the prevailing laws and regulations and with Alfa Laval’s business principles.
Lund, February 2015
Anders NarvingerChairman of the Board

46 Corporate Governance Report
Introduction to Alfa Laval Vision To “help create better everyday conditions for people” by offering efficient and environ-mentally responsible products and solutions in the three key technologies of heat transfer, separation and fluid handling.
Business concept Based on its three key technologies, Alfa Laval offers products and solutions that “optimize the performance of customers’ processes, time and time again.” In reality, this involves helping customers become more productive, energy-efficient and competitive.
Financial goals Alfa Laval is a result-oriented company with clear financial goals. Alfa Laval’s oper-ations are therefore governed not only to meet the business concept, but also to reach the financial goals established with regard to growth, profitability and return. By achieving, or even exceeding, these goals, Alfa Laval creates the necessary scope for its continued development in line with its strategic priorities. A favorable result also generates value for its share-holders in the form of an annual dividend and by boosting the value of the company.
Corporate Governance Report 2014Alfa Laval is to be governed in a manner that is sustainable from a long-term perspective taking its shareholders, employees, customers, suppliers and other stakeholders into consideration. This requires clear goals, guidelines and strategies, as well as truly putting into practice the company’s business principles regarding the environment, human rights, ethics and transparency. This report describes the regulations, guidelines, legislation and policies to which Alfa Laval is subject, the division of responsibility within the company and the actions and interaction of its decision-making bodies – the Annual General Meeting, the Board of Directors and the President.
Strategy In order to achieve its vision, fulfill its business concept and attain its financial goals, Alfa Laval has established a number of strategic priorities. These include expanding the Group’s product offering and market presence – mainly organically, but also through acquisitions – as well as strategies for increased efficiency.
The path to goal achievement Equally as important as achieving the goals and fulfilling the Group’s business concept are the conduct of the company and its employees along the way. As a public company, Alfa Laval’s corporate govern-ance is subject to a number of laws and regulations, the most important of which include the Swedish Companies Act, the Swedish Annual Accounts Act, the rules of the stock exchange and the Swedish Corporate Governance Code (the “Code”). The company also has internal regulations, including governing documents, such as guidelines and instructions, as well as pro-cedures for control and risk management. The work of the Board and the President is governed by formal work plans. And Alfa Laval’s business principles permeate the entire operations. All Alfa Laval employees are expected to be familiar with these prin-
ciples and use them as a basis for their own actions. Read about the business principles at www.alfalaval.com.
Alfa Laval’s 2014 Corporate Governance Report was reviewed by the company’s auditor.
Share and ownership structure At December 31, 2014, Alfa Laval had 419,456,315 shares outstanding, allocated among 40,505 shareholders according to Euroclear Sweden’s shareholders’ register. Each share corresponds to one vote. Tetra Laval was the largest shareholder, with 26.1 percent of the shares at year-end, and the only owner with a stake larger than 10 percent. The second largest owner was Alecta Pensionsförsäkring with 6.5 percent, followed by Foundation Asset Management with a holding of 6.0 percent. Legal entities accounted for slightly more than 93 per-cent of holdings, while individuals account-ed for the remainder. From a geographic perspective, the following countries repre-sented a total of 94.2 percent of the share-holdings: Sweden, the Netherlands, the US, the UK and Luxembourg. For more information about Alfa Laval’s share and ownership structure, refer to the Share section on pages 16 and 17.
0
1
2
3
4
14131211100
20
40
60
0
10,000
20,000
30,000
40,000
50,000
14131211100
25
50
75
100
1413121110
SEK % %
Dividend and percentage of adjusted EPS**
Ten largest shareholders at December 30, 2014*
*Board proposal to the Annual General Meeting.**Adjusted for step-up amortization.
3.00
3.25
3.50
3.75
37.4
41.745.8
38.6
46.7
No. of shares
Capital/voting rights, %
Change in holding in 2014, percentage points
Tetra Laval BV 109,487,736 26.1 +/- 0
Alecta 27,111,000 6.5 0.2
Foundation Asset Management AB 25,100,000 6.0 +/- 0
Swedbank Robur Funds 24,845,024 5.9 -0.5
AMF Insurance and Funds 22,829,625 5.4 1.5
Nordea Investment Funds 7,710,308 1.8 -0.3
Fourth Swedish Pension Insurance Fund 5,075,100 1.2 0.2
Handelsbanken Funds 3,793,837 0.9 +/- 0
Second Swedish Pension Insurance Fund 3,519,179 0.8 0.3
Folksam 3,158,203 0.8 +/- 0
Total ten largest shareholders 232,630,012 55.5
Source: Euroclear
* The table is adjusted for custodian banks. Were they to be included, they would represent a total holding of 3.4%.
4.00*
Dividend Percentage of adjusted EPS

Corporate Governance Report
Corporate governance
President and CEO
Divisions Regions
GoalsStrategies
Policy documentsBusiness principles
Board of Directors
Annual General Meeting Audit Nominating Committee
Group Management
Staff functions
Reports
Remuneration CommitteeAudit Committee
Internal Audit HRCommunication
Finance and LegalCorporate Development
47
Alfa Laval – the company
The registered name of the company is Alfa Laval AB (publ) and the registered office of the Board of Directors shall be in Lund Municipality in Sweden. The company’s share capital shall amount to not less than SEK 745,000,000 and not more than SEK 2,980,000,000. The number of shares shall be not less than 298,000,000 and not more than 1,192,000,000. The fiscal year is the calendar year. The objective of the company’s operations is to, directly or through subsidiaries and joint venture companies in and outside Sweden, develop, manufacture and sell equipment and installations, primarily in the areas of separation, heat transfer and fluid handling, and to administer fixed and movable property, and other related operations. The Articles of Association do not include any limitations regarding the number of votes a shareholder can cast at a General Meeting. Nor does it include any specific rules regarding the appointment and dismissal of Board members or changes in the Articles of Association. The currently prevailing Articles of Association were adopted at the Annual General Meeting on April 20, 2009 and are available in their entirety on www.alfalaval.com
0
1
2
3
4
14131211100
20
40
60
0
10,000
20,000
30,000
40,000
50,000
14131211100
25
50
75
100
1413121110
SEK % %
Total number of shareholders
Source: Euroclear
33,565
36,567
34,629
36,212
40,505

48 Corporate Governance Report
Annual General Meeting The Annual General Meeting is Alfa Laval’s highest decision-making body in which all shareholders are entitled to participate and each share entitles its holder to one vote. The majority of proposals addressed at the Annual General Meeting are decided by a simple majority. However, certain points require a qualified majority, for example, amendments to the company’s Articles of Association or resolutions to buy back shares. The Annual General Meeting is to be held annually within six months of the close of the fiscal year in either Lund or Stockholm. Normally, the Annual General Meeting takes place in late April or early May in Lund. The date and location are announced not later than in conjunction with the publication of the interim report for the third quarter. To be entitled to participate and vote in the Annual General Meeting, shareholders must be registered in the shareholders’ register maintained by Euroclear Sweden AB. Any shareholder who is unable to attend in person, may participate through a proxy with a power of attorney. Shareholders with nominee-registered shares must have the shares temporarily registered under their own name. The Annual General Meeting is held in Swedish and all docu-mentation is available in Swedish and English. Alfa Laval endeavors to ensure that all Board members participate, as well as, in so far as it is possible, all members of Group management. The company’s auditors are always present.
Annual General Meeting for the 2013 fiscal year The Annual General Meeting for the 2013 fiscal year was held at Färs och Frosta
Sparbank Arena in Lund on April 28, 2014. The Annual General Meeting was attended by 411 people, including shareholders, proxies, assistants, guests and officials. The total number of votes represented was 62.6 percent. Chairman of the Board Anders Narvinger was elected as the Meeting Chairman. The minutes from the Annual General Meeting, and all other information related to the Meeting, are available at http://www.alfalaval.com/about-us/investors/pages/investors.aspx. The resolutions passed at the Meeting included the following:
– A resolution was passed to adopt the income statement and balance sheet and discharge the Board of Directors and President from liability.
– A resolution was passed in accordance with the Board’s motion that a dividend of SEK 3.75 per share be paid for the 2013 fiscal year.
– A resolution was passed to re-elect Board members Gunilla Berg, Arne Frank, Björn Hägglund, Anders Narvinger, Finn Rausing, Jörn Rausing, Lars Renström, Ulla Litzén and Ulf Wiinberg. In addition, a resolution was passed in favor of the Nominating Committee’s proposal for auditors. Authorized public accountants Håkan Olsson Reising and Helene Willberg were elected for the coming year. In addition, auditors David Olow and Duane Swanson were elected as deputy auditors for the company.
– A resolution was passed that fees paid to non-executive directors on the Board
amount to SEK 4,575,000. In addition, fees are payable for work on the Board’s committees.
– A resolution was passed accepting the Board’s motion for remuneration principles for senior executives. These principles comprise fixed remuneration and short-term and long-term programs for variable remuneration.
Nominating Committee Work of the Nominating Committee The Nominating Committee prepares and submits proposals regarding candidates for Board members and, if applicable, auditors. The supporting documentation utilized for the Committee’s work includes the annual evaluation of the work of the Board, which is initiated by the Chairman of the Board. Other key factors to be considered, against the background of the company’s strategy, include the type of competence required. The Nominating Committee can call upon the assistance of external resources in its search for suitable candidates and can also conduct interviews with individual Board members. Its duties also comprise the sub-mission of motions in respect of remuneration to members of the Board and its committees.
Composition The composition of the Nominating Committee is determined in accordance with the process approved by the Annual General Meeting.
This means that the Chairman of the Alfa Laval Board contacts representatives of the largest shareholders at the end of the third quarter and requests that they each appoint one member of the Nominating
Name Representing Shareholding in Alfa Laval, %*
Jörn Rausing Tetra Laval 26,1
Claes Dahlbäck Foundation Asset Management 6,0
Jan Andersson Swedbank Robur Funds 6,0
Ramsay Brufer Alecta 5,8
Lars-Åke Bokenberger AMF Insurance and Funds 4,8
* As of September 30, 2014.
Proposals to the Nominating CommitteeComposition of the Nominating Committee for the 2015 Annual General Meeting
Shareholders wishing to submit proposals to the Nominating Committee prior to the Annual General Meeting may con-tact Alfa Laval’s Board Chairman Anders Narvinger, or one of the owner representatives. Contact may also be made directly by e-mail at [email protected]

49Corporate Governance Report
Committee. The Nominating Committee may then decide whether or not to include the Chair- man of the Board or other Board members.
Once the composition of the Nominating Committee has been established, an announcement is made in a press release, the third-quarter interim report and on Alfa Laval’s website. Ahead of the 2015 Annual General Meeting, the composition of the Nominating Committee was announced on October 15, 2014. It was also included in Alfa Laval’s third-quarter interim report, which was published on October 28.
Ahead of the Annual General Meeting for the 2014 fiscal year The following individuals comprise the Nominating Committee for the Annual General Meeting for the 2014 fiscal year: Jörn Rausing (appointed by Tetra Laval,) Jan Andersson (appointed by Swedbank Robur Funds), Ramsay Brufer (appointed by Alecta), Claes Dahlbäck (appointed by Foundation Asset Management) and Lars-Åke Bokenberger (appointed by AMF). The holdings of the Nominating Committee represented 48.7 percent of the number of shares outstanding at September 30, 2014. The Chairman of the Board Anders Narvinger was elected as member and secretary, and Jörn Rausing was elected as Chairman of the Nominating Committee. Due to Jörn Rausing’s position as a Board member, his role as Chairman is considered a deviation from the Code. The reason for this deviation is that the Nominating Committee deemed Jörn Rausing to be particularly well-suited to lead the work of the Committee and obtain the best possible results for the company’s owners.
Work of the Nominating Committee ahead of the Annual General Meeting The Nominating Committee held three meetings ahead of the Annual General Meeting for the 2014 fiscal year and con-ducted a number of discussions by phone and e-mail. The focus of the Committee’s meetings included an assessment of the potential future competence requirements of the Board.
Board of Directors Work and responsibilities The Board bears the ultimate responsibility for the organization and administration of the company. Its work and responsibilities are governed by the Swedish Companies Act, the Swedish Board Representation (Private Sector Employees) Act, the Articles of Association, the Board’s own formal work plan, Nasdaq’s Rule Book for Issuers and the Code. The Board prepares and evaluates Alfa Laval’s overall long-term objectives and strategies, which include establishing business and financial plans, reviewing and approving financial statements, adopting guidelines, making decisions on issues relating to acquisitions and divest-ments, and deciding on major investments and significant changes to Alfa Laval’s organization and operations. The Board also establishes the instructions for the chief executive officer with respect to the Group’s daily operations and, through the Audit Committee, procures auditing services and maintains ongoing contact with the company’s auditors. In addition, the Board works to ensure that the company has a sound internal control function and formalized procedures.
The Board also appoints the President and, through the Remuneration Committee, determines salaries and remuneration for the President and senior executives.
Composition The Board of Directors is to comprise a minimum of four and maximum of ten members, with a maximum of four deputy members. At present, the Board comprises nine members and no deputies. The members are elected annually for the period until the conclusion of the next Annual General Meeting and are obligated to dedicate the requisite time and diligence to the assignment, as well as have the necessary knowledge to best look after the interests of the company and its owners. In addition, the trade-union organizations appoint three employee rep-resentatives and three deputy employee representatives. Salaried employees in the company are invited to Board meetings as presenters and experts. The company’s Chief Financial Officer participates in all meetings and Alfa Laval’s Chief Legal Counsel serves as Board Secretary.
Independence of Board members All members of the Alfa Laval Board elected by the Annual General Meeting are considered independent of the company, except Lars Renström, who is President and CEO of the company. All members are also considered independent of the company’s major share-holders, except Finn Rausing, Jörn Rausing and Lars Renström, who cannot be consid-ered independent due to their relation to Tetra Laval, which, on December 31, 2014, owned 26.1 percent of the shares in the company.
Annual General Meeting for the 2014 fiscal year Board training
Each year, a combined training course and field trip takes place at one of Alfa Laval’s facilities. In 2014, the trip had as its destination Alfa Laval’s facilities in Tumba and Eskilstuna.
The Annual General Meeting of Alfa Laval AB (publ) will be held on Thursday, April 23, 2015 at 4:00 p.m. at Sparbanken Skåne Arena, Klostergården’s sports area, Stattenavägen, in Lund. Light refreshments will be served after the Meeting. In accordance with the company’s Articles of Association, notice of the Annual General Meeting will be inserted as an announcement in the Swedish Official Gazette and on the company’s website not more than six and not less than four weeks prior to the Meeting. An announcement that the notification has been issued will be placed in Dagens Nyheter. As a service to existing shareholders, information about the Annual General Meeting can be sent to them by mail.

50 Corporate Governance Report
The Board’s formal work plan The work of the Board is governed by a formal work plan that is determined annually at the statutory meeting. This formal work plan describes the Board’s work assignments and the division of responsibility between the Board, the committees and the President. It also defines the role of the Chairman of the Board and includes a separate instruc-tion for the company’s President regarding the financial reporting to be submitted to the Board to enable ongoing assessment of the financial position.
Work of the Board in 2014 A total of 10 Board meetings were held in 2014, eight of which were scheduled meetings. Three meetings were held by phone and one per capsulam, and the other meetings were held in Lund, Stockholm and Eskilstuna. The normal agenda items addressed at Board meetings include earnings results, order trends, investments and acquisitions. The company’s President prepares an agenda for each meeting in consultation with the Chairman of the Board. Board members who want to discuss a particular matter must inform the Chairman of the Board well in advance, so that the necessary material on which to base decisions can be prepared. Notices of meetings, including the meeting agenda and the requisite information or documentation on which to base decisions, must reach the Board members not later than one week prior to the date of the meeting. Decisions are made based on open discussions led by the Chairman.
Board training All new Board members receive a compre-
hensive introduction program. In addition, each year, a combined training course and field trip takes place at one of Alfa Laval’s facilities. In 2014, the trip had as its destination Alfa Laval’s facilities in Tumba and Eskilstuna, Sweden.
Evaluation of the Board’s workThe Chairman of the Board ensures that an annual evaluation is conducted of the work of the Board. The evaluation focuses on the Board’s work methods, its work climate and its access to and need for particular Board competence. The goal is to ensure a well-functioning Board. The evaluation forms part of the supporting documentation for the Nominating Committee when nominating Board members and proposing remuner-ation levels.
Responsibilities of the Chairman of the Board The Chairman of the Board directs the work of the Board in a manner that ensures it complies with the Swedish Companies Act, the Articles of Association, the formal work plan of the Board and the Code. The Chairman must ensure that the work is well organized and conducted efficiently, so that the Board fulfills its tasks. In dialog with the company’s President, the Chairman monitors operational developments. He is also responsible for ensuring that the other members continuously receive all information necessary for the work of the Board to be performed in the most effective manner. In addition to being respon-sible for evaluating the Board’s work, the Chairman participates in evaluation and devel-opment matters with respect to the Group’s senior executives. The Chairman also ensures
that the Board’s decisions are executed and represents the company in ownership issues.
Remuneration of the Board Remuneration to the Board is determined by the Annual General Meeting based on the motions submitted by the Nominating Committee. The Chairman and members of the Audit Committee and the Remuneration Committee receive supplementary remu-neration. No Board member is entitled to pension payments from the company.
Committees Alfa Laval’s Articles of Association stipulate that there must be a Remuneration Committee and an Audit Committee that report to the Board. Committee members are appointed from among the Board members for a period of one year.
Audit Committee Areas of responsibility The Audit Committee’s tasks include ensuring compliance with the principles for financial reporting and internal control. The Committee formulates guidelines for the company’s financial reporting and follow-up, and has the right to determine the focus of the internal audit. The Committee also examines the procedures for reporting and financial con-trols, as well as the work, qualifications and independence of the external auditors. For further information regarding the responsi-bilities of the Audit Committee, refer to “The Board of Directors’ report on internal control” on page 57.
Members and meetings in 2014 Members are appointed annually at the
Board of Directors
Name Present Remuneration
Appointed by the Annual General Meeting Anders Narvinger 9 1,250,000
Gunilla Berg 8 475,000
Arne Frank 8 475,000
Björn Hägglund 9 475,000
Ulla Litzén 8 475,000
Finn Rausing 9 475,000
Jörn Rausing 9 475,000
Lars Renström 9
Ulf Wiinberg 8 475,000
Total 4,575,000
Employee representatives Jan Nilsson 9
Susanna Norrby 9
Bror García Lantz 9
Number of meetings 9
Remuneration of Board members and attendance at Board meetings Chairman

51Corporate Governance Report
Board’s statutory meeting. In 2014, the Committee comprised Finn Rausing (Chairman), Gunilla Berg and Ulla Litzén. Alfa Laval’s Chief Legal Counsel served as the Committee’s secretary. Four meetings were held in 2014, one of which was conducted by phone. The company’s Chief Financial Officer, the Head of the Internal Audit Function and the com-pany’s auditors were also present at the meetings. During the year, the following items were dealt with at the Committee meetings: review of the procedures for corporate gov-ernance, review and follow-up of the results of the current annual feedback from approxi-mately 200 managers regarding controls, updates regarding new IFRS develop-ments, amendments to the Code, and a review of Group provisions and allocations.
Remuneration Committee Areas of responsibility The Remuneration Committee is involved in recruitment, appointments, and matters pertaining to other conditions of employment relating to the President or members of Group management. The Committee’s assignment is to prepare the guidelines for remuneration to senior executives to be resolved on by the Annual General Meeting and to submit proposals to the Board of Directors regarding salary and employment terms for the President. In addition, the Committee addresses matters regarding salary and employment terms for senior executives who report directly to the President.
Members and meetings in 2014 The Remuneration Committee is appointed annually at the Board’s statutory meeting. In 2014, the Committee comprised Anders
Narvinger (Chairman), Jörn Rausing and Arne Frank. The Remuneration Committee held three meetings, which were attended by all members. Phone meetings were also held to address ongoing issues. Separate minutes are taken at all meetings and the contents are distributed to the Board mem-bers, except in certain cases when the minutes are noted directly in the corresponding Board minutes. The meetings of the Committee included a review and follow-up of the guidelines for remuneration to senior exec-utives, other Group guidelines and interna-tional issues pertaining to this area, as well as personnel issues related to the integra-tion of acquired companies. The Committee also reviewed the Group’s management development program and terms of employ-ment for Group management, as well as addressing the Group’s incentive program.
The company’s auditors The auditors comprise a supervisory body appointed by the Annual General Meeting. Their assignment includes the following: auditing the accounting and financial state-ments of individual companies, evaluating the accounting policies applied, assessing the administration of company management, reviewing the interim report for the third quarter and evaluating the overall presentation in the Annual Report. The result of the audit – the Audit Report – is communicated to shareholders in the Annual Report and at the Annual General Meeting. In addition, the auditors present a statement regarding the discharge from liability of the Board of Directors, a statement regarding the adoption of the income statement and balance sheet by the Annual General Meeting and a state-
Remuneration and attendance at Committee meetings Chairman
Remuneration Committee Audit Committee
Name Present Remuneration Present Remuneration
Appointed by the Annual General Meeting Anders Narvinger 3 50,000
Gunilla Berg 4 100,000
Arne Frank 3 50,000
Björn Hägglund
Ulla Litzén 4 100,000
Finn Rausing 4 150,000
Jörn Rausing 3 50,000
Lars Renström
Ulf Wiinberg
Total 150,000 350,000
Employee representatives Jan Nilsson
Susanna Norrby
Bror García Lantz
Number of meetings 3 4
ment regarding the Corporate Governance Report. The Group must have a minimum of one and maximum of two auditors, with not more than two deputy auditors. An authorized public accountant or registered auditing firm is to be appointed as the company’s auditor and, where applicable, as deputy auditor.
At the Annual General Meeting on April 28, 2014, authorized public accountants Håkan Olsson Reising and Helene Willberg were elected as the company’s auditors. David Olow and Duane Swanson were elected as deputy auditors. According to Alfa Laval’s assessment, none of these auditors has any relationship to Alfa Laval, or any company related to Alfa Laval, that could affect their independent status. In 2014, the entire Board received reports from the company’s external auditors on two occasions. On one occasion, this occurred without the presence of the President or other members of Group man-agement. The Audit Committee received separate reports on four occasions.
Remuneration to auditors (Refer to Note 7 on page 109).

52 Corporate Governance Report
Board of Directors and auditors
7
10
11
12
1 5 9
6
8
2
4
3

53Corporate Governance Report
Employee representatives
1
Anders NarvingerChairman since 2003.
Born: 1948.Formerly President of Teknikföretagen and formerly President and CEO of ABB Sweden.Education: BSc. Eng. from the Faculty of Engineering at Lund University, BSc. Econ from Uppsala University.Chairman of the Board: ÅF AB, Coor Service Management AB and Capio AB.Board member: JM AB and Pernod Ricard SA.Independent of the company and major shareholders.Number of shares in Alfa Laval: 40,000* (40,000**).
2
Gunilla BergBoard member since 2004.
Born: 1960.CFO of the PostNord Group.Former positions include Executive Vice President and CFO of the SAS Group and Executive Vice President and CFO of the KF Group.Education: BSc. Econ from the Stockholm School of Economics.Board member: Vattenfall AB.Independent of the company and major shareholders.Number of shares in Alfa Laval: 3,400* (3,400**).
3
Björn HägglundBoard member since 2005.
Born: 1945.Former positions include Deputy CEO of Stora Enso.Education: PhD (For.)Chairman of the Board: SweTree Technologies.Board member: among others, Bergvik Skog AB, the Knut and Alice Wallenberg Foundation, the UN Global Compact and AB Karl Hedin.Independent of the company and major shareholders.Number of shares in Alfa Laval: 12,000* (12,000**).
4
Ulla LitzénBoard member since 2006.
Born: 1956.Former positions include President of W Capital Management and various executive positions at Investor.Education: BSc. Econ from the Stockholm School of Econo-mics, MBA from the Massachusetts Institute of Technology.Board member: among others, Atlas Copco AB, Boliden AB, Husqvarna AB, NCC AB and SKF AB.Independent of the company and major shareholders.Number of shares in Alfa Laval: 15,600* (15,600**).
7
Ulf WiinbergBoard member since 2013.
Born: 1958.Former CEO of H. Lundbeck A/S. Former positions include director of Wyeth Pharmaceuticals, EMEA/Canada & BioPharma, and a number of other senior positions in Wyeth.Chairman of the Board: Avillion, a pharmaceutical development company.Independent of the company and major shareholders.Number of shares in Alfa Laval: 20,000* (0**).
9
Jörn RausingBoard member since 2000.
Born: 1960.Head of Mergers and Acquisitions (M&A) in the Tetra Laval Group.Education: BSc. Econ.Board member: The Tetra Laval Group, Ocado Ltd. and De Laval Holding AB.Independent of company.
Appointed by the Annual General Meeting
6
Lars RenströmBoard member since 2005.
Born: 1951.President and CEO of Alfa Laval.Education: Eng., BSc. Econ.Chairman of the Board: ASSA ABLOY AB Board member: Tetra Laval Group.Number of shares in Alfa Laval: 40,400* (40,400**).
8
Arne FrankBoard member since 2010.
Born: 1958.President and CEO of AAK AB.Education: BSc. Eng. in industrial economics from Linköping Institute of Technology.Chairman of the Board: Inwido AB.Independent of the company and major shareholders.Number of shares in Alfa Laval: 16,000* (16,000**).
5
Finn RausingBoard member since 2000.
Born: 1955.Education: B.L., MBA from INSEAD.Board member: Tetra Laval Group, De Laval Holding AB, EQT Holdings AB and Swede Ship Marine AB.Independent of company.
10
Jan NilssonEmployee representative since 2000.
Born: 1952.Employed by Alfa Laval since 1974.Employee representative for the Swedish Metal Workers’ Union (IF Metall).
11
Susanna NorrbyEmployee representative since 2003.
Born: 1967.Employed by Alfa Laval since 1992.Employee representative for the Swedish Association of Graduate Engineers (CF).Number of shares in Alfa Laval: 5,000* (5,000**).
12
Bror García LantzEmployee representative since 2012.
Born: 1965.Employed by Alfa Laval since 1990.Employee representative for the Swedish Union of Clerical and Technical Employees in Industry (Unionen).
Deputy employee representatives
Henrik NielsenDeputy member since 2008.
Born: 1968.Employed by Alfa Laval since 1994.Deputy employee representative for the Swedish Metal Workers’ Union (IF Metall).
Leif NorkvistDeputy member since 2009.
Born: 1961.Employed by Alfa Laval since 1993.Deputy employee representative for the Swedish Metal Workers’ Union (IF Metall).
Stefan SandellDeputy member since 2005.
Born: 1971.Employed by Alfa Laval since 1989.Deputy employee representative for the Swedish Organization for Managers (Ledarna).
Auditors
Helene Willberg Authorized Public Accountant, KPMG.
Born: 1967.Elected auditor at 2014 Annual General Meeting.
Håkan Olsson ReisingAuthorized Public Accountant, KPMG.
Born: 1961.Elected auditor at 2014 Annual General Meeting.
Deputy auditors
David OlowAuthorized Public Accountant, KPMG.
Born: 1963.Deputy auditor for Alfa Laval since 2014.
Duane SwansonAuthorized Public Accountant, KPMG.
Born: 1959.Deputy auditor for Alfa Laval since 2014.
* Holdings as of December 31, 2014.** Holdings as of December 31, 2013.

54 Corporate Governance Report
President and Group management
8
9
10
11
1 4
5
6
7
2
3

55Corporate Governance Report
* Holdings as of December 31, 2014.** Holdings as of December 31, 2013.
1
Lars RenströmPresident and CEO
Born: 1951.CEO since October 1, 2004.Former positions include President and CEO of Seco Tools AB, Division Manager at Ericsson AB and Atlas Copco AB.Chairman of the Board: ASSA ABLOY AB.Board member: Tetra Laval Group.Education: Eng., BSc. Econ.Number of shares: 40,400* (40,400**).
2
Joakim VilsonExecutive Vice President in charge of the Central and Eastern Europe, Latin America, Middle East and Africa regions
Born: 1965.Employed by Alfa Laval since 1990.Regional manager since January 1, 2013. Former positions include head of the Mid Europe Region and the Process Industry segment.Education: BSc. Eng.Number of shares: 6,520* (6,520**).
3
Peter TorstenssonSenior Vice President, Corporate Communications
Born: 1955.Employed by Alfa Laval since 1999.Senior Vice President, Corporate Communications since 1999. Former positions include President of Borstahusen Informationsdesign.Number of shares: 66,000* (66,000**).
4
Thomas ThuressonChief Financial Officer
Born: 1957.Employed by Alfa Laval since 1988.Chief Financial Officer since 1995. Former positions include Controller of the Flow business area and Group Controller of the Alfa Laval Group.Board member: PartnerTech AB.Education: BSc. Econ., IMD (BPSE).Number of shares: 130,170* (130,720**).
5
Susanne Pahlén ÅklundhPresident, Equipment Division
Born: 1960.Employed by Alfa Laval since 1983.President of the Equipment Division since 2009.Previously responsible for regions Mid Europe and Nordic as well as the Process Industry segment.Board member: Nederman AB.Education: BSc. Eng.Number of shares: 6,000* (756**).
6
Ray FieldExecutive Vice President in charge of the Asia, India and Oceania regions
Born: 1954.Employed by Alfa Laval since 1985.Regional manager since September 1, 2004. Prior to this, he served as President of Alfa Laval China for more than ten years.Education: BSc. Eng.Number of shares: 54,588* (54,588**).
7
Nish PatelExecutive Vice President in charge of the Western Europe and North America regions
Born: 1962.Employed by Alfa Laval since 1984.Regional manager since 2011. Prior to this, he served as head of India and the UK.Education: BSc. Eng.Number of shares: 47,552* (47,552**).
8
Göran MathiassonPresident, Operations Division
Born: 1953.Employed by Alfa Laval since 1979.President of the Operations Division since April 2003. Previously in charge of Alfa Laval Manufacturing and Thermal Technology, including research and development, production development, system development and purchasing.Board member: Heatex AB.Education: BSc. Eng.Number of shares: 6,588* (6,588**).
9
Svante KarlssonPresident, Process Technology Division
Born: 1955.Employed by Alfa Laval since 1984.Former positions include President of the Equipment Division, head of the Thermal business area and President of Marine & Power.Education: BSc. Econ.Number of shares: 60,344* (62,744**).
10
Peter LeiflandPresident, Marine & Diesel Division
Born: 1954.Employed by Alfa Laval since 1985.President of the Marine & Diesel Division since 2011. Former positions include regional manager in charge of the Western Europe and North America Region 2004-2011, the Asia and Latin America Region 2001-2004 and the Eastern Europe and Latin America Region 1999-2001.Education: B.L., lic.spec. IMD (PED).Number of shares: 430,000* (430,000**).
11
Peter BailliereSenior Vice President, Human Resources
Born: 1963.Employed by Alfa Laval since 2007.Senior Vice President, Human Resources since July 1, 2007.Many years of experience at Volvo Cars, most recently as Head of Group Human Resources.Education: Master of Sociology, Bachelor in Fiscal Law.

56 Corporate Governance Report
Alfa Laval’s business control model comprises a matrix in which the Group’s divisions and segments are presented vertically, intersecting with the Group’s geographic regions, which are presented horizontally. The Operations Division, which is responsible for production-related procurement, production, logistics and distribution, serves as a shared supply chain for the sales divisions.
Business control
Areas of responsibilityThe President directs the daily operations and is responsible for ensuring that the Board has access to information and the necessary supporting documentation for its decision-making purposes. The President is also responsible for ensuring that the company’s accounting complies with appli-cable laws and provisions, and that the ethical guidelines included in Alfa Laval’s business principles are reflected in the con-duct of the company. The President has the support of the Group management, to which responsibilities and authority are del-egated. The members of Group manage-ment include three regional managers, four divisional managers and the heads of HR, Communication and Finance/Legal/IT.
Group management meetings in 2014 The Group management held six meetings in 2014, during which minutes were taken. Each quarter, a review is made of all busi-ness developments in the divisions and the regions, which address the business cli-mate, earnings, earnings projections for the next 12 months and specific issues affect-ing the respective business areas. In addi-tion, separate strategy meetings were held that, among other things, addressed the management’s proposals concerning future direction with regard to organic growth and growth through acquisition. In 2014, the review concentrated on risks and opportu-nities in individual segments, application areas and geographic regions, as well as the consequences on the supply chain.
Furthermore, a review was performed of the direction for acquisitions with regard to product, technology, channel and geography.
Remuneration to senior executives, pensions and severance pay/termination of employment The remuneration principles for the President and other members of Group management are determined by the Annual General Meeting. For additional information, see pages 107–108.
President and CEO
CSRHR
Corporate developmentCommunication
Finance, Legal & IT
Operations
Equipment Process Technology Marine & Diesel
Western Europe and North America
Central and Eastern Europe, Latin America, Middle East and Africa
Asia and Oceania

57Corporate Governance Report
Control environment The control environment includes the internal governance instruments set by the Board for the company’s daily operations. In practice, these control instruments comprise policy documents, which are continuously assessed, reviewed and updated. These policies encompass such instruments as the Board’s formal work plan, the President’s instructions, reporting instructions, the company’s finance policy, business principles, investment policy and communication policy.
The Board is responsible for ensuring that the company’s organizational structure is logical and transparent, with clearly defined roles, responsibilities and processes. The work of the Board is also covered by processes and formal work plans, with a clear internal distribution of tasks. Among other duties, the Board has overriding responsibility for financial reporting and, accordingly, must assess the performance and earnings of the operations through a package of reports including results, forecasts and analyses of key indicators. The Board also reviews the company’s interim reports and year-end report.
The Board’s Audit Committee is tasked with ensuring compliance with the principles for financial reporting and internal control. It follows up the effectiveness of the internal control system and reviews the financial procedures to ensure that the information can be traced back to underlying financial systems and that it is in line with legislation and relevant standards. It examines proce-dures for reporting and financial controls, as well as addressing the company’s financial reports. The Committee monitors, evaluates and discusses significant issues in the areas of accounting and financial reporting. It evaluates and manages information per-taining to disputes and potential improprie-ties, as well as assisting management with identifying and evaluating the primary risks that are relevant to the operations in order to ensure that management focuses on managing these risks. The Audit Committee
Board of Directors’ report on internal control The Board is responsible for ensuring the reliability of Alfa Laval’s financial reporting and its compliance with legislation, regulations, applicable accounting policies and the company’s business principles. All communica-tion and financial reporting is to be correct, relevant, objective and transparent.
has the right to determine the focus of the internal audit and examines the work, quali-fications and independence of the external auditors. Reports are provided to the Board regarding internal meetings, as well as meetings with the internal auditors, the external auditors and various specialists in Group management and its support functions.
The President is subject to instructions issued by the Board and is responsible for ensuring the existence of an effective control environment. The President is also responsible for the ongoing work pertaining to internal control and for ensuring that the company’s accounting complies with legislation and that the management of assets is adequately performed.
Group management is responsible for man-aging and maintaining the internal control systems required to manage significant risks in the company’s operating activities. Management is also responsible for clearly ensuring that all employees understand the requirements for and the individual’s role in maintaining sound internal control.
The internal auditors report to the CFO. They review and implement improvements to the internal control function, conduct internal audits – which are reported to the Audit Committee – and propose plans for the coming six to eight months. The internal auditors also issue reports from individual audits to the appropriate members of Group management. Procedures are in place for performing regular reviews of the agreed actions to ensure that specific actions are taken following the internal audit. These are based on a schedule agreed on with the party responsible for the individual activities. The internal audit function comprises two internal auditors, internal specialist resources and external auditors. Internal audits encompass a broad spectrum of functions and issues determined by the Board. The areas audited include:
– compliance with the systems, guidelines, policies and processes established for the Group’s business operations.
– the existence of systems to ensure that financial transactions are carried out, archived and reported in an accurate and lawful manner.
– opportunities to improve management control, the company’s profitability and the organization, which may be identified during audits. In 2014, 32 internal audits were performed.
Risk assessment Within the framework of the company’s operating activities and review functions, procedures are in place for risk assessments pertaining to the financial reporting. These procedures aim to identify and evaluate the risks that may affect internal control. The procedures encompass risk assessments in conjunction with strategic planning, forecasts and acquisition activities, as well as pro-cesses for identifying amendments to the accounting policies to ensure that they are accurately reflected in the financial reporting.
Control structures The control structures manage the risks that the Board and management consider to be significant to the business operations, internal control and financial reporting. They com-prise an organization with clearly defined roles that enables an effective and – from an internal control perspective – appropriate division of responsibility, and specific control activities that enable the identification and timely prevention of risks becoming a reality. Control activities also include clearly defined decision-making processes and a policy for decision-making with respect to, for example, investments, agreements, acquisitions and divestments, earnings analyses and other forms of analytical reviews, reconciliations, inventory-taking and automatic controls in the IT systems.

58 Corporate Governance Report
Assignment and responsibilitiesWe have audited the Corporate Governance Report for the year 2014 on pages 45-58. The Board of Directors is responsible for the Corporate Governance Report and for ensuring that it has been prepared in accordance with the Swedish Annual Accounts Act. Our responsibility is to express an opinion on the Corporate Governance Report based on our audit.
Auditor’s statement on the Corporate Governance ReportTo the annual meeting of the shareholders of Alfa Laval AB (publ), corporate registration number 556587-8054
Lund, March 3, 2015
Helene Willberg Håkan Olsson Reising Authorized Public Accountant Authorized Public Accountant
Focus and scope of the audit We conducted our audit in accordance with FAR’s auditing standard RevU 16: The Auditor’s Examination of the Corporate Governance Report. This standard requires that we have planned and performed the audit to obtain reasonable assurance that the Corporate Governance Report is free of material misstatements. An audit includes examining, on a test basis, evidence sup-
Information and communication The company’s regulations, guidelines and manuals are communicated through several internal channels to ensure sound control. The effectiveness of this communication is monitored continuously to ensure that the information is accessible. There are formal and informal information channels that enable employees to communicate important infor-mation to relevant recipients and ultimately, if necessary, to the Board of Directors. Clear guidelines have also been established for external communications, the aim of which is to provide the most accurate overview pos-sible while at the same time ensuring that all obligations with regard to information are met.
Follow-up The internal control process is mainly followed up by two bodies: the Audit Committee and the Internal Audit function. The Audit
Committee establishes the principles that apply for the company with respect to accounting and financial reporting, and monitors compliance with these regulations. The Committee also meets with the external auditors to obtain information about the focus and scope of the audit and to discuss results and coordination of the external and internal audits. In addition, the Committee establishes the direction, scope and time schedules for the work of the internal audit team, whose audits are reported to the Audit Committee and continuously to Group management so that any necessary measures may be taken. The scope of the internal audit includes, among other factors, operational efficiency, compliance with regulations and guidelines, and the quality of financial reporting from the subsidiaries. An annual feedback function is also in place, which is geared toward the company’s senior exec-
utives. This feedback function is designed to ensure that Alfa Laval’s internal instructions and rules are fully implemented. All managers who report directly to Group management are expected to review the guidelines and rules that apply to their respective areas. They must sign and submit documents confirming their understanding of the significance of these guidelines and compliance with these guidelines in their area of responsibility. If there are any deviations compared with the instructions, they must specify what actions they intend to take to ensure compliance. This process also aims to increase trans-parency and thus facilitate assessments by the external and internal auditors.
Lund, February 2015 Board of Directors
porting the information included in the Corporate Governance Report. We believe that our audit procedures provide a reason-able basis for our opinion set out below.
Opinion In our opinion, a Corporate Governance Report has been prepared and is consistent with the annual accounts and consolidated financial statements.

59
Financial statements
Board of Directors’ Report 60
Consolidated cash flows 72
Comments to the consolidated cash-flows 73
Consolidated comprehensive income 74
Comments to the consolidated
comprehensive income 75
Consolidated financial position 78
Comments on the consolidated
financial position 80
Changes in consolidated equity 81
Comments on changes
in consolidated equity 83
Parent company cash flows 84
Parent company income 84
Parent company financial position 85
Changes in parent company equity 86
Notes to the financial statements 87
Accounting principles 87
Objectives, policies and processes
for managing capital 96
Financial risks 97
Operational risks 101
Notes 104
Proposed disposition of earnings 134
Auditor’s report 135
Ten-year overview 136
Definitions 138

60 Financial statements
Board of Directors’ Report
The Board of Directors and the President of Alfa Laval AB (publ) hereby submit their annual report for the year of operation January 1, 2014 to December 31, 2014.
The information in this annual report is such information that Alfa Laval AB (publ) must publish in accordance with the Securities Market Act. The information was made public by publishing the annual report on Alfa Laval’s website on March 31, 2015 at 10.00 CET and by sending the printed annual report to the shareholders in week 14, 2015 starting at April 2, 2015.
Alfa Laval AB is a public limited liability company. The seat of the Board is in Lund and the company is registered in Sweden under corporate registration number 556587-8054. The visiting address of the head office is Rudeboksvägen 1 in Lund and the postal address is Box 73, 221 00 Lund, Sweden. Alfa Laval’s website is: www.alfalaval.com.
Financial statementsThe following parts of the annual report are financial statements: the Board of Directors’ Report, the ten-year overview, the consolidated cash flows, the consolidated comprehensive income, the consolidated financial position, the changes in consolidated equity, the parent company cash flows, the parent company income, the parent company financial position, the changes in parent company equity and the notes. All of these have been audited by the auditors.
The Corporate Governance Report, which also has been audited, is to be found on page 44.
Ownership and legal structureAlfa Laval AB (publ) is the parent company of the Alfa Laval Group.
The company had 40,505 (36,211) shareholders on December 31, 2014. The largest owner is Tetra Laval B.V., the Nether-lands who owns 26.1 (26.1) percent. Next to the largest owner there are nine institutional investors with ownership in the range of 6.5 to 0.8 percent. These ten largest sharehold-ers own 55.5 (54.6) percent of the shares.
OperationsThe Alfa Laval Group is engaged in the development, production and sales of products and systems based on three main technologies: separation/filtration, heat transfer and fluid handling.
Alfa Laval’s business is divided into three business divisions ”Equipment”, ”Process Technology” and “Marine & Diesel” that sell to external customers and one division “Other” covering procurement, production and
logistics as well as corporate overhead and non-core businesses. These four divisions constitute Alfa Laval’s four operating segments.
The three business divisions (operating segments) are in turn split into a number of customer segments. The customers to the Equipment division purchase products whereas the customers to the Process Technology division purchase solutions for processing applications. The customers to the Marine & Diesel division purchase prod-ucts and solutions for marine and offshore applications and for diesel power plants. The Equipment division consists of four customer segments: Industrial Equipment, OEM (Original Equipment Manufacturers), Sanitary Equipment and the aftermarket segment Service. The Process Technology division consists of four customer segments: Energy & Process, Food & Life Science and Water & Waste Treatment and the after-market segment Service. The Marine & Diesel division consists of four customer segments: Marine & Diesel Equipment, Marine & Offshore Systems, Marine & Off-shore Pumping Systems and the aftermarket segment Service.
The Process Technology division did as of April 1, 2014 re-organise its three former capital sales segments Energy & Environment, Food Technology and Process Industry into three new segments: Energy & Process, Food & Life Science and Water & Waste Treatment. The change was basically made by redistrib-uting the existing market units between the customer segments in order to better meet the market and seize the growth opportunities.
The acquisition of Frank Mohn AS meant the creation of a new capital sales segment in the Marine & Diesel division, Marine & Offshore Pumping Systems, which only contains the new business.
Material factors of risk and uncertaintyThe main factors of risk and uncertainty facing the Group concern the price development of metals, fluctuations in major currencies and the business cycle. For additional information, see the sections on financial and operational risks and the section on critical accounting principles, the section on key sources of estimation uncertainty and the section on judgements under accounting principles.
Acquisition of businessesThe full information on the acquisitions is found in Note 16. Below follows a shorter summary of each acquisition during 2014.
Frank Mohn ASIn a news release on April 7, 2014 Alfa Laval communicated that the company had signed an agreement to acquire Frank Mohn AS, a leading manufacturer of submerged pumping systems to the marine and offshore markets. After approval from regulatory authorities the acquisition was closed on May 21, 2014. The acquisition, which strengthens Alfa Laval’s fluid handling portfolio by adding a unique pumping technology, will further reinforce Alfa Laval’s position as a leading supplier to the marine and offshore oil & gas markets. Alfa Laval has acquired 100 percent of Frank Mohn AS (“Frank Mohn”), with the product brand Framo, for a total cash consideration of NOK 13 billion, on cash and debt free basis, from Wimoh AS, a company controlled by the Mohn family. Frank Mohn is headquartered in Bergen, Norway and has approximately 1,200 employees. In 2013 Frank Mohn had an order intake of NOK 6.1 billion and generated sales of NOK 3.4 billion. The operating margin is significantly above the Alfa Laval average. Lars Renström, President and CEO of the Alfa Laval Group, commented on the acquisition: “Frank Mohn is an excellent company that we have been following closely for several years. It has highly skilled employees, high quality products and a market-leading position within segments offering attractive long-term growth prospects. The combination of Frank Mohn and Alfa Laval will provide a very attractive offering of products, systems and services and it will strengthen our leading position as a provider of critical systems for ships and offshore oil & gas production units, with unmatched service capabilities.” The acquisition of Frank Mohn was funded by existing credit facilities and a fully committed bridge facility. The bridge loan has been replaced by two tranches of corporate bonds issued by Alfa Laval. The synergies from the acquisition are expected to reach about NOK 120 million annually, gradually realized over a three year period. Alfa Laval has included Frank Mohn and the product brand Framo in the Marine & Diesel division in a new capital sales segment, Marine & Offshore Pumping Systems. The company will be kept together under the same management as today. The activities in the Bergen area in Norway; the head office and sales & service facility at Askøy – as well as production facilities at Fusa, Flatøy and Frekhaug – will become Alfa Laval’s operational centre for marine and offshore pumping systems.

61Financial statements
0
2,000
4,000
6,000
8,000
10,000
12,000
Q414Q314Q214Q114Q413Q313Q213Q113Q412Q312Q212Q112
0
5,000
10,000
15,000
20,000
25,000
30,000
35,000
40,000
+21
%
+3%
-6%
+11
%
-5%
+1%
+4%
+16
%
+5%
+18
%
+26
%
+22
%
Orders received
SEK millions
quarterSEK millions12 months
Order intake per quarter Orders received rolling 12 months value
% = change by quarter compared to corresponding period last year, at constant rates
CorHexOn November 4, 2014 Alfa Laval acquired 100 percent of the Korean company CorHex Corp. The company is a small development company within heat transfer technology.
Sale of real estateDuring 2014 a few minor properties in different countries have been sold for SEK 4 million with a realised loss of SEK -12 million, which has been reported in other operating costs.
Alfa Laval Aalborg BV moved to Alfa Laval’s office in Breda in the Netherlands in the first half of 2013. The vacated property in Spi-jkenisse in the Netherlands is to be sold, but it is not expected to be sold within the next year. One small property in France is planned for sale. It is empty and has been for sale for several years. It is not expected to be sold within the next year. As a conse-quence of the decided cost reduction pro-gramme some operations will be re-organ-ised and the concerned properties be sold in the U.S., China, Germany and the Neth-erlands. Only the property in China is ex-pected to be sold within the next year. Due to this it has been re-classified as a current asset held for sale with SEK 6 (-) million. The fair value of the concerned properties exceeds the book value by approximately SEK 18 (5) million.
During 2013 a property in Korea that was used by Onnuri was sold at book value without any effect on profit and loss.
Large ordersLarge orders are orders with a value over EUR 5 million. The volume of large orders is an important indicator of the demand situation and is therefore monitored separately within Alfa Laval. A large volume of large orders normally also means a good load in the factories. During 2014 Alfa Laval has received large orders for more than SEK 2,340 (2,100) million. By quarter it has looked like the following:
During the first quarter 2014 Alfa Laval received large orders for SEK 280 (445) million:
– An order from the Korean company Daewoo Shipbuilding & Marine Engineering (DSME) for a freshwater generator module to an offshore oil platform in the North Sea. The order, booked in the Energy & Environment segment, has a value of approximately SEK 110 million. Delivery is scheduled for 2014.
– An order to supply Alfa Laval Packinox heat ex-changers to an integrated refinery-petrochemical complex in the Middle East. The order, booked in the Process Industry segment, is worth approxi-mately SEK 65 million and delivery is scheduled for 2014 and 2015.
– An order to supply equipment for a complete
process line to a vegetable oil refining plant in Brazil. The order, booked in the Food Technology segment has a value of approximately SEK 50 million and delivery is scheduled for 2014 and 2015.
– An order to supply Alfa Laval Packinox heat ex-changers to a refinery and petrochemical plant in Vietnam. The order is booked in the Process Industry segment and has a value of approximately SEK 55 million. Delivery is scheduled for 2015.
During the second quarter 2014 Alfa Laval received large orders for more than SEK 500 (310) million:
– An order to supply Alfa Laval PureSOx exhaust gas cleaning systems to Finnlines Plc. The order
is booked in the Marine & Offshore Systems segment and delivery is scheduled for 2014. Due to a confidentiality agreement Alfa Laval is unable to disclose the value of the order.
– An order to retrofit Alfa Laval PureSOx exhaust gas cleaning systems on board four vessels. The order, which comes from a new customer in Germany, is booked in the Marine & Offshore Systems segment. It has a value of approximately SEK 75 million and delivery is scheduled for 2015.
– An order to supply air cooler systems to a U.S. export terminal for natural gas liquids. The or-der, booked in the new Energy & Process seg-ment, has a value of approximately SEK 55 mil-lion and delivery is scheduled for 2014.
– An order to supply compact welded heat ex-changers to a coal liquefaction plant in China.
Order bridge
Consolidated
SEK millions, unless otherwise stated 2014 2013 *
Order intake last year 30,202 30,208
Structural change1) 14.1% 2.2%
Organic development 2) 4.0% 1.6%
Currency effects 3.3% -3.8%
Total 21.4% 0.0%
Order intake current year 36,660 30,202
* Restated to IFRS 11.
Orders received from the aftermarket Service3) constituted 25.8 (27.0) percent of the Group’s total orders received for 2014. Excluding currency effects, the order intake for Service increased by 12.9 percent during 2014 compared to last year. The corresponding organic development was an increase by 6.2 percent.
1) Acquired businesses are: CorHex Corp at November 4, 2014, Frank Mohn AS at May 22, 2014 and Niagara Blower Company at May 29, 2013.
2) Change excluding acquisition of businesses.3) Formerly Parts & Service.
Orders received amounted to SEK 36,660 (30,202) million during 2014. The order intake for Frank Mohn has impacted the 2014 figures with SEK 3,781 million.

62 Financial statements
The order, booked in the new Energy & Process segment, has a value of approximately SEK 100 million and delivery is scheduled for 2014.
– An order to supply compact heat exchangers for the caustic evaporation plant of AkzoNobel in Rotterdam, the Netherlands. The order, booked in the new Energy & Process segment, has a value of approximately SEK 120 million and de-liveries are scheduled for 2014 and 2015.
– An order to supply heat exchangers to a natural gas stabilization plant in Russia. The order, booked in the new Energy & Process segment, is worth approximately SEK 50 million with delivery scheduled for 2015.
– An order to supply compact heat exchangers to an offshore platform in the UK. The order, booked in the new Energy & Process segment, is worth approximately SEK 50 million and de-livery is scheduled for 2014.
During the third quarter 2014 Alfa Laval received large orders for SEK 780 (445) million:
– An order to supply air cooler systems to a U.S. export terminal for natural gas liquids. The order, booked in the Energy & Process segment, has a value of approximately SEK 95 million and delivery is scheduled for 2015.
– An order to supply compact heat exchangers to an oil production facility in Canada. The order, booked in the Energy & Process segment, has a value of approximately SEK 80 million and delivery is scheduled for 2015.
– An order to supply Framo pumping systems to Samsung Heavy Industries in South Korea. The order, booked in the Marine & Offshore Pumping Systems segment, has a value of approximately
SEK 240 million and delivery is scheduled for 2015.
– An order to supply air cooler systems to a natural gas plant in the U.S. The order, booked in the Energy & Process segment, has a value of ap-proximately SEK 65 million. Delivery is sched-uled for 2015.
– An order to supply compact heat exchangers to one of the biggest phosphoric acid plants in the world to be built in the Middle East. The or-der, booked in the Energy & Process segment, has a value of approximately SEK 55 million and deliveries are scheduled for 2015.
– An order to supply Framo water pumping systems to an oil drilling platform that will be located in the Atlantic Ocean off the Canadian coast. The order, booked in the Marine & Offshore Pumping Systems segment, has a value of approximately SEK 120 million and delivery is scheduled for 2015.
– An order to supply Alfa Laval Packinox heat ex-changers to a refinery in India. The order, booked in the Energy & Process segment, has a value of approximately SEK 70 million and delivery is scheduled for 2015.
– An order for four Alfa Laval PureSOx exhaust gas cleaning systems. The order, booked in the Marine & Offshore Systems segment late September, has a value of approximately SEK 55 million and delivery is scheduled for 2015 and 2016.
During the fourth quarter 2014 Alfa Laval received large orders for SEK 780 (900) million:
– A record-size order for air cooled heat ex-changers, to be installed in an oil and gas pro-duction facility in Kazakhstan. The order, booked in the Energy & Process segment, has a value of approximately SEK 290 million. Delivery
is scheduled for 2015 and 2016.
– An order to supply a fuel oil treatment system to a power plant in the Middle East. The order is booked in the Energy & Process segment and has a value of approximately SEK 60 million. Delivery is scheduled for 2015.
– An order to supply compact heat exchangers to an oil production facility in Canada. The order, booked in the Energy & Process segment, has a value of approximately SEK 115 million with delivery scheduled for 2015.
– An order to supply equipment to a Russian processing plant. The order, booked in the Food & Life Science segment, has a value of approximately SEK 75 million. Delivery is scheduled for 2015.
– An order to supply a complete process line to a pulp mill in Russia. The order, booked in the Energy & Process segment, has a value of ap-proximately SEK 50 million and delivery is scheduled for 2015.
– An order to supply Alfa Laval Packinox heat ex-changers to a petrochemical plant in South Korea. The order, booked in the Energy & Process segment, has a value of approximately SEK 85 million and delivery is scheduled for 2015.
– An order to supply heat exchangers to an oil production facility in the U.S. The order is booked in the Energy & Process segment and has a value of approximately SEK 55 million. Delivery is scheduled for 2015.
– An order to supply compact heat exchangers for two FPSOs to be moored offshore Angola. The order, booked in the Energy & Process segment, has a value of approximately SEK 50
million and delivery is scheduled for 2015.
0
4,000
8,000
12,000
16,000
20,000
24,000
20142013201201020304050607080
Order backlog December 31
SEK millions %
11,569
2,899
14,468
11,438
3,130
14,568
17,250
5,043
22,293
For delivery during next year
For delivery later than next year
Order backlog’s part of last 12 monthsinvoicing (proforma for Frank Mohn)
Sales bridge
Consolidated
SEK millions, unless otherwise stated 2014 2013 *
Net sales last year 29,801 29,682
Structural change 11.8% 2.9%
Organic development 2.5% 1.2%
Currency effects 3.4% -3.7%
Total 17.7% 0.4%
Net sales current year 35,067 29,801
* Restated to IFRS 11.
The order backlog at December 31, 2014 was SEK 22,293 (14,568) million. Excluding currency effects and adjusted for acquisitions of businesses the order backlog was 7.4 percent higher than the order backlog at the end of 2013. The order backlog at December 31, 2014 for Frank Mohn was SEK 6,172 million.
Net invoicing relating to Service constituted 27.1 (26.9) percent of the Group’s total net invoicing for 2014. Excluding currency effects, the net invoicing for parts and service increased by 15.1 percent during 2014 compared to last year. The corresponding organic development was an increase by 7.2 percent.
Net salesNet sales amounted to SEK 35,067 (29,801) million during 2014. The net sales for Frank Mohn have impacted the 2014 figure with SEK 3,333 million.

63Financial statements
Marine & Offshore Systems 6%
Industrial Equipment 11%
Sanitary 10%
OEM 5%
Service 5%
Service 9%
Marine & Diesel Equipment 8%
Service 13%
Marine & Offshore Systems 8%
Marine & Offshore Pumping Systems 9%
Industrial Equipment 9%
Sanitary 9%
OEM 4%
Service 5%
Service 10%
Marine & Diesel Equipment 8%Energy & Process 17%
Water & Waste Treatment 1%
Service 12%
Food & Life Science 8%
Energy & Process 20%
Water & Waste Treatment 2%
Food & Life Science 11%
Orders received by customer segment
Equipment
Process Technology
Marine & Diesel
increase
decrease
unchanged (+/- 3%)
Orders received by customer segment 2014
Compared to previous year, at constant rates adjusted for acquisition of businesses.
* New customer segment, no comparison �gures exist.
Orders received by customer segment 2013
than in the fourth quarter 2013, partly explained by the development in Industrial Equipment which was affected by the non-repeat of larger orders as well as the unusually cold winter weather in North America. The latter also explained the lower demand from customers in the U.S. as a whole. In the Nordic area and Asia Pacific, however, the division had a good development. In Sanitary demand declined compared to the fourth quarter for dairy applications following non-repeat orders in the previous quarter and for products going into personal care applications, where legislation in China drove invest-ments during 2013. Products for pharma-ceutical applications, on the other hand, reported a good development. Industrial Equipment experienced a decline compared to the fourth quarter, partly due to the reasons already mentioned. At the same time, the unstable situation in Ukraine had a negative impact on demand in Russia, especially for products going into HVAC and refrigeration applications. In OEM, the overall order intake remained unchanged. The demand was higher than in the previous quarter from manufacturers of air conditioning units, while demand for products targeting the heat pump market came in somewhat lower. The overall demand for services and spare parts was unchanged from the previous quarter.
Order intake reached an all-time high level in the second quarter, driven by positive seasonal variations in Industrial Equipment as well as a generally good demand situa-tion in the food sector. Order intake devel-oped nicely in many geographies, especially so in the U.S. and China, but the positive development was also visible in much of the European Union. In Sanitary demand increased compared to the previous quarter for products, such as separators and valves, going into personal care, dairy and other food applications. Industrial Equipment ex-perienced an increase in volume compared to the previous quarter, mainly driven by the normal seasonality in HVAC and refrigeration. In OEM, a larger order contributed to the segment reporting a slight increase in order intake, from the already good level reported in the first quarter. The Service segment reported an increase in order intake com-pared to the previous quarter.
Order intake in the Equipment division declined in the third quarter from the record levels in the previous quarter. Although In-dustrial Equipment had a good order intake for products going into HVAC applications, demand was lower across most other areas. Sanitary had a decline in order intake, affected by a negative demand situation for products going into dairy applications. Another ex-
Operating segmentsThe Process Technology division did as of April 1, 2014 re-organise its three former capital sales segments Energy & Environment, Food Technology and Process Industry into three new segments: Energy & Process, Food & Life Science and Water & Waste Treatment. The change was basically made by redistributing the existing market units between the customer segments in order to better meet the market and seize the growth opportunities. See the section in the Process Technology division below for more details. The comparison figures in the graphs above have been restated.
The acquisition of Frank Mohn AS meant the creation of a new capital sales segment in the Marine & Diesel division, Marine &
Offshore Pumping Systems, which only contains the new business. For this reason there are no comparison figures.
EQUIPMENT DIVISIONThe Equipment division consists of four customer segments: Industrial Equipment, OEM (Original Equipment Manufacturers), Sanitary Equipment and the aftermarket segment Service.
Order intake(all comments are excluding currency effects)
Taking a quarterly view the development for Equipment division during 2014 has been as follows:
Order intake for the Equipment Division came in somewhat lower in the first quarter

64 Financial statements
Equipment division
Consolidated
SEK millions 2014 2013 *
Orders received 9,867 9,471
Order backlog** 1,571 1,495
Net sales 9,787 9,462
Operating income*** 1,320 1,306
Operating margin 13.5% 13.8%
Depreciation and amortisation 188 170
Investments 59 54
Assets** 6,424 5,902
Liabilities** 764 882
Number of employees** 2,667 2,696
* Restated to IFRS 11. ** At the end of the period. *** In management accounts.
Change excluding currency effects
Consolidated
Order intake Net sales
%Structural
changeOrganic
development TotalStructural
changeOrganic
development Total
2014/2013 – 0.8 0.8 – 0.1 0.1
2013/2012 0.7 1.2 1.9 0.7 3.5 4.2
planatory factor for the overall weaker de-velopment was the impact on demand for Alfa Laval’s products in conflict affected areas such as Russia and the Middle East. Indus-trial Equipment also experienced a drop in order intake, affected by a lower activity level in areas requiring products for refrigeration purposes, such as food industry cold chains. Demand for HVAC related products, how-ever, continued to benefit seasonally and rose compared to the second quarter, boosted by strong demand in for instance China. In OEM, order intake declined driven by a combination of a weak season for A/C due to a relatively cold summer in parts of Europe and the fact that some of our key customers advanced orders to the second quarter ahead of the vacation pe-riod. Demand for Service remained on the same high level as the previous quarter.
Order intake was unchanged for the divi-sion as a whole in the fourth quarter com-pared to the third. The Industrial Equipment segment saw a normal seasonal decline in demand, reflecting a lower demand for carrying out heating or cooling installations during the cold season, while Sanitary and OEM both grew. From a geographical per-spective the picture was equally varied with a good development recorded in the U.S. market, whereas China declined somewhat from the good numbers in the third quarter, affected by the seasonality. Sanitary saw a positive development with an increase in
order intake, driven by a generally higher demand from customers in the dairy and non-viscous food industries, as wells as the pharmaceutical sector. Industrial Equipment encountered a seasonal decline in demand, mainly driven by comfort, whereas demand from customers buying refrigeration equip-ment remained on about the same level as in the previous quarter. Order intake in Russia was good as there were continued public investments in equipment for district heating. In OEM, order intake increased, mainly driven by a good demand from customers manufacturing boilers, air-conditioning units and diesel engines. In Service the de-mand for parts and services remained on the same high level as the previous quarter.
Operating income (excluding comparison distortion items)
The increase in operating income during 2014 compared to last year is mainly explained by a higher sales volume and lower sales and administration costs, partly mitigated by higher development costs.
PROCESS TECHNOLOGY DIVISIONRe-organisationThe Process Technology division did as of April 1, 2014 re-organise its three former capital sales segments Energy & Environment, Food Technology and Process Industry into three new segments: Energy & Process, Food & Life Science and Water & Waste
Treatment. The following changes were made: Market unit environment was moved from Energy & Environment to the new Water & Waste Treatment segment. Market units oil & gas and power from Energy & Environment and the market units inorganics, metals & paper, petrochemicals and refinery from Process Industry were moved to the new Energy & Process segment. Market unit life science & renewable resources in Process Industry and the market units in Food Technology (protein, brewery, food solutions & olive oil and vegetable oil technology) were moved to the new Food & Life Science segment.
Process Technology division thus consists of four customer segments: Energy & Process, Food & Life Science and Water & Waste Treat-ment and the aftermarket segment Service.
Order intake (all comments are excluding currency effects)
Taking a quarterly view the development for Process Technology division during 2014 has been as follows:
Process Technology declined in the first quarter compared to the previous quarter, explained by the non-repeat of large orders. The base business*, however, remained unchanged compared with the previous quarter. Energy & Environment declined due to large orders, primarily in the market units Power and Oil & Gas, not being re-peated. Order intake from the oil & gas in-dustry, however although down, remained on a high level reflecting the extensive invest-ment programmes ongoing in the industry. Environment declined, primarily caused by non-repeats in the North American municipal market. Process Industry was virtually un-changed from the fourth quarter. The market units Life Science and Petrochemicals both declined as a result of non-repeat of large orders. The Refinery market unit however, grew substantially, boosted by several large orders. The segment’s base business was unchanged. Food Technology noted a con-traction compared to the previous quarter, mainly due to the development in the Protein and Brewery market units, which both had very large orders of a non-repeat nature booked in the fourth quarter. The market units Food Solutions and Vegetable Oil Technology on the other hand showed very strong growth. The base business for the segment also recorded strong growth, sharply up from the fourth quarter. Demand for parts as well as service remained unchanged.
Compared to the previous quarter, Process Technology delivered growth in the second quarter 2014, primarily driven by a very strong
* Base business and base orders refer to orders with an order value of less than EUR 0.5 million.

65Financial statements
development for the base business. Support came also from large orders, which saw a steady development. Regionally, strong growth was noted in all parts of Europe, not least in Eastern Europe. A similar development was seen in North America, whereas Latin America and Asia declined due to non-repeated large orders. Energy & Process was up compared to the previous quarter, with a particularly strong development noted in the market units inorganics, metals & paper and petrochemicals. The oil & gas market unit also grew, amid a continued high activity in the industry, not least in North America. The only market unit to decline was refinery, with its typical project business. Food & Life Science saw an unchanged base business in the quarter. The overall decline was hence explained by large first- quarter orders for the market units vegetable oil, protein and brewery, which were not repeated in the second quarter. The life science & renewable resources market unit however showed strong growth. Water & Waste Treatment showed a positive development, mainly thanks to large orders, a pattern evident in all geographical regions. The base business also performed well. For Service the demand for parts as well as service showed a very strong growth.
The Process Technology division’s order intake in the third quarter was unchanged from the second quarter, reflecting a steady
development for both the base business and large orders. Strong growth was noted in North America, whereas Europe, Latin America and Asia all declined. The order intake for the Energy & Process segment was unchanged with a mixed development in its different end markets. Market unit oil & gas developed very well, thanks to a generally high investment activity in the industry, not least in North America. Market unit power also reported a strong quarter. The market units refinery and petrochemicals with project-based businesses, which frequently swing in between the quarters, declined. Food & Life Science did well in the third quarter, compared to the second. Good growth was recorded in market unit brewery as well as life science & renewable resources. Market unit food solutions and olive oil was unchanged, whereas order intake contracted somewhat in market unit vegetable oil technology. Water & Waste Treatment also declined somewhat. Europe noted a con - traction, reflecting the end of the current investment cycles in some countries in the region. North America and Asia, on the other hand, showed strong growth. For Service the demand for parts as well as service declined somewhat due to non-repeats of large orders in the previous quarter.
The division’s order intake grew in the fourth quarter compared to the third, mainly through a very strong development for
large orders. The base business declined somewhat, as did demand for parts and service. Energy & Process was up, reflecting a generally positive development across different end markets. Market unit oil & gas continued up after securing the company’s largest order ever, comprising SEK 290 million of air heat exchangers for enhanced oil recovery. The base business however, declined somewhat as customers, particularly in North America, slowed down their activities following the lower oil price. The power generation market was another area reporting growth, largely through large orders, and a similar development was noted for demand from markets relating to inorganics, metals and paper. Activities in petrochemicals and refinery developed favourably. A positive development was noted in the Food & Life Science segment, with good growth for protein, vegetable oil, brewery and life science. A solid develop-ment was recorded in North and Latin America as well as Asia, whereas declines were noted in Europe. Water & Waste Treatment was unchanged compared to the third quarter. In Service the demand for parts as well as service declined somewhat. Applications within Food & Life Science developed strongly, whereas a contraction was noted within Energy & Process.
Operating income (excluding comparison distortion items)
The decrease in operating income during 2014 compared to last year is mainly explained by a negative price/mix variation and higher sales and administration costs, partly mitigated by a higher sales volume.
MARINE & DIESEL DIVISIONRe-organisationThe responsibility for manufacturing Aalborg products was as per May 1, 2014 moved from the Marine & Diesel Division to Operations within Other. The comparison figures for last year have been restated correspondingly. The acquisition of Frank Mohn AS meant the creation of a new capital sales segment in the Marine & Diesel division, Marine & Offshore Pumping Systems, which only contains the new business.
The Marine & Diesel division thus con-sists of four customer segments: Marine & Diesel Equipment, Marine & Offshore Sys-tems, Marine & Offshore Pumping Systems and the aftermarket segment Service.
Order intake (all comments are excluding currency effects)
Taking a quarterly view the development
Process Technology-divisionen
Consolidated
SEK millions 2014 2013
Orders received 14,271 13,935
Order backlog* 8,440 8,393
Net sales 14,410 13,813
Operating income** 2,230 2,479
Operating margin 15.5% 17.9%
Depreciation and amortisation 325 297
Investments 111 98
Assets* 11,893 10,828
Liabilities* 4,237 4,029
Number of employees* 5,342 5,256
* At the end of the period. ** In management accounts.
Change excluding currency effects
Consolidated
Order intake Net sales
%Structural
changeOrganic
development TotalStructural
changeOrganic
development Total
2014/2013 3.0 -3.3 -0.3 0.8 0.5 1.3
2013/2012 4.3 -0.9 3.4 6.2 6.3 12.5

66 Financial statements
for Marine & Diesel division during 2014 has been as follows:
Order intake for the Marine & Diesel Division increased in the first quarter compared with the fourth quarter 2013, as the positive yard contracting development in 2013 continued to boost demand. The Marine & Diesel Equipment segment saw overall higher order intake in the first quarter, explained by last year’s yard contracting which generated good growth in demand for the marine equipment base business. Demand for equipment for diesel power plants, however, declined somewhat. Environmental products and solutions also declined, due to the non-repeat of a large Alfa Laval Pure Dry order, while ballast water treatment showed an increase. Marine & Offshore Systems re-ported lower order intake as demand for boilers as well as offshore systems declined compared to the very strong fourth quarter. Exhaust gas cleaning systems however, recorded growth. Service showed a very good development due to increased parts sales as well as higher repair activity.
Order intake for the Marine & Diesel Divi-sion increased in the second quarter com-pared with the first, driven by continued high demand across the different capital sales segments. Marine & Diesel Equipment reported an overall increase in order intake in the second quarter compared to the first, as the contracting to the yards late last year continued to generate good demand for
marine equipment. Environmental solutions saw an overall increase in demand and contributed also to the positive development. Demand for diesel equipment was unchanged. Marine & Offshore Systems reported signif-icantly higher order intake reflecting a very strong demand for boilers and heaters. The segment as a whole was hence up, despite the fact that offshore business and exhaust gas cleaning equipment came in slightly lower than the previous quarter. Marine & Offshore Pumping Systems, the new capital sales segment that consists of the capital sales in the acquired Frank Mohn, contributed to the overall development of the Marine & Diesel division as of May 22, 2014. The order intake for Frank Mohn has impacted both periods 2014 with SEK 583 million. The order intake for marine pump-ing systems for tankers was on a high level, reflecting the good yard contracting of chemical and product tankers late 2013 and early 2014. Demand for Service was unchanged from the first quarter.
Order intake for the Marine & Diesel divi-sion, excluding the Marine & Offshore Pumping Systems segment, decreased in the third quarter compared to the previous quarter. This is mainly due to non-repeat large contracts in Marine & Offshore Sys-tems, but also as the decline in yard con-tracting earlier in the year started to impact the order intake. Including Marine & Offshore Pumping Systems, order intake was higher
than in the second quarter. Marine & Off-shore Systems, affected by the non-repeat orders for boilers for larger ship series, saw a decline for offshore systems as well. Demand for exhaust gas cleaning systems, however, recorded continued growth. Marine & Diesel Equipment reported a very modest decline from the previous quarter, as an increase in demand for environmental solutions as well as diesel power partly offset lower demand from the yards for equipment going into new ships. Marine & Offshore Pumping Systems reported continued good order intake, re-flecting a good level of yard contracting of product tankers and chemical tankers. Two large offshore orders, taken in the quarter, added to the positive development. Service showed a good development due to increased parts sales as well as higher repair activity.
Order intake for the Marine & Diesel divi-sion increased in the fourth quarter compared with the third. The decline in contracting at the yards resulted in less of new orders, but the decline was offset by the re-evaluation of the order backlog in Frank Mohn, which was a consequence of the stronger USD. The Marine & Diesel Equipment segment saw a decline from the previous quarter, mainly due to a lower demand for environ-mental solutions. Equipment for diesel power plants also declined somewhat while equipment for new ships remained on about the same level as in the third quarter. The Marine & Offshore Systems segment re-corded order intake growth, due to increased demand for exhaust gas cleaning systems as well as for boilers going into offshore applications. Demand for marine boilers was however lower than in the previous quarter, reflecting the yard contracting development earlier in the year. Marine & Offshore Pumping Systems saw lower demand, partly due to the non-repeat of two large offshore orders taken in the previous quarter, partly due to fewer new marine orders. However, due to the strengthening of the USD, the value of the backlog increased and resulted in an increase of order intake compared to the third quarter. Service showed a good de-velopment due to increased parts demand as well as higher repair activity.
Operating income (excluding comparison distortion items)
The increase in operating income during 2014 compared to last year is mainly ex-plained by a higher sales volume, mainly due to the acquisition of Frank Mohn, partly mitigated by higher costs for sales and administration and higher amortisations on step-up values related to the acquisition of Frank Mohn.
Marine & Diesel division
Consolidated
SEK millions 2014 2013 *
Orders received 12,522 6,796
Order backlog** 12,282 4,680
Net sales 10,870 6,526
Operating income*** 2,019 1,248
Operating margin 18.6% 19.1%
Depreciation and amortisation 591 196
Investments 84 35
Assets** 25,299 7,817
Liabilities** 4,132 2,050
Number of employees** 3,127 1,817
* Restated to IFRS 11 and for move of manufacturing to Other. ** At the end of the period. *** In management accounts.
Change excluding currency effects
Consolidated
Order intake Net sales
%Structural
changeOrganic
development TotalStructural
changeOrganic
development Total
2014/2013 56.6 23.2 79.8 51.8 10.6 62.4
2013/2012 – 7.5 7.5 – -10.3 -10.3

67Financial statements
Information about geographical areasAll comments are reflecting the quarterly development during the year and are excluding currency effects.
Western Europe including NordicThe overall order intake in Western Europe, including the Nordic region, was unchanged in the first quarter compared with the fourth quarter 2013. Marine & Offshore Systems, Food Technology and Process Industry had a good development, while Energy & Environment was affected by fewer large contracts than in the previous quarter. The Service business developed well in both the Equipment and Marine & Diesel division, whereas the Process Technology division reported a decline. The base business* remained unchanged. Region wise, UK, Iberica and Benelux showed growth while France and Nordic were affected by the non-repeat of larger contracts.
Order intake increased in the second quarter compared to the first, driven by a good development across most countries and regions. Both the base business and large projects developed positively. Segments to develop particularly well were Industrial Equipment, OEM, Energy & Process and Food & Life Science. Demand for Service was also higher across the region compared with the previous quarter.
Order intake decreased in the third quarter compared with the second, affected by fewer large contracts and a modest decline in the base business. Marine & Diesel Equipment and Food & Life Science devel-
oped well, while OEM, Sanitary, Energy & Process and Water & Waste Treatment all declined. The Service business remained flat. From a regional perspective Nordic and Adriatic grew, while France was unchanged and Mid Europe, Iberica and Benelux de-clined, mainly due to fewer larger contracts.
Order intake increased in the fourth quarter compared with the third as both the base business and large projects saw a positive development. Segments Energy & Process, Marine & Diesel Equipment and Water & Waste Treatment all performed well and demand for Service was strong across the region. Looking at individual geographies both the UK and France developed positively while Mid Europe and Nordic declined.
Central and Eastern EuropeCentral and Eastern Europe reported a significant drop in order intake in the first quarter compared to the fourth quarter 2013 as the previous quarter’s record development for large orders was not repeated. Central and South Eastern Europe reported a good development and Poland and the Baltic states came in just slightly below the fourth quarter’s level. The base business was lower in Russia and Turkey, reflecting the prevailing uncertainty.
Central & Eastern Europe reported a sig-nificant increase in order intake in the second quarter compared to the first, supported by growth in the base business and for large orders alike. All countries contributed to the positive development as both Russia and Turkey recovered from a weak first
quarter and with regions South Eastern Europe, Central Europe and Poland & Baltics all reporting record-high order intake. The strong development in Russia was explained by large orders in the refinery, oil & gas and power market units at the same time as the base business grew. In Turkey the general activity level picked up following the first quarter elections and the base business recovered strongly in all three divisions.
Central & Eastern Europe reported a drop in order intake in the third quarter compared to the second quarter, mainly due to fewer large orders, but also through a decline in the base business. Russia was negatively affected by non-repeat large projects. The base business however saw a positive development, driven by a good activity level in the food and comfort markets. The general sentiment in the country reflects a slower pace, as the indirect effects of the introduced sanctions are starting to show. Turkey and South East Europe were excep-tions to the otherwise negative sentiment in the region, all reporting order volumes in line with or above the previous quarter, driven by a positive development for the Process Technology division.
Central and Eastern Europe reported a very strong order intake in the fourth quarter compared to the third, driven by a good base business development across the region combined with a number of larger orders. A starch processing line and a project for tall oil recovery in Russia dominated the list of large projects taken in the quarter. However, a number of larger orders related to the oil & gas industry were also booked in Russia, Turkey and Romania. Russia was the main driver for the region’s positive development, with a substantial growth in order intake compared to the third quarter. Poland/Baltics as well as Romania also had a significantly higher order intake than in the previous quarter.
North AmericaIn North America, the overall order intake declined in the first quarter, compared to the fourth quarter 2013, as a result of fewer large orders. The base business, however, remained on an unchanged level compared to the previous quarter. Both Energy & Environment and OEM did particularly well in the quarter, while Process Industry, Industrial Equipment and Sanitary declined, mainly due to less of larger contracts than in the previous quarter.
Order intake increased in the second quarter compared with the first quarter driven by increases in both the base business and large projects. The Equipment and Process
Other
Consolidated
SEK millions 2014 2013 *
Orders received 0 0
Order backlog** 0 0
Net sales 0 0
Operating income*** -529 -586
Depreciation and amortisation 365 344
Investments 349 305
Assets** 5,906 5,517
Liabilities** 3,974 2,558
Number of employees** 6,617 6,493
* Restated for move of manufacturing from Marine & Diesel. ** At the end of the period. *** In management accounts.
OTHEROther is covering procurement, production and logistics as well as corporate overhead and non-core businesses.
As per May 1, 2014 the manufacturing within Aalborg was moved from the Marine & Diesel division to Operations within Other. The comparison figures for last year have been restated correspondingly.
* Base business and base orders refer to orders with an order value of less than EUR 0.5 million.

68 Financial statements
Information about geographical areas
-3%
+11%-2%
+41%
-5%
+18%
Orders received 2014
1
2
3
4
5
6
7
+3%
+0%+7%
+4%
+12%
+4%
Orders received 2013
1
2
3
4
5
6
7
1 Nordic 8%2 Western Europe 21%3 Central & Eastern Europe 7%4 Asia 38%5 Latin America 5%6 North America 19%7 Other 2%
1 Nordic 9%2 Western Europe 22%3 Central & Eastern Europe 9%4 Asia 32%5 Latin America 7%6 North America 19%7 Other 2%
= Compared to 2013 after adjustment for exchange rate fluctuations
= Compared to 2012 after adjustment for exchange rate fluctuations
Technology divisions both performed well, particularly noticeable in the segments Industrial Equipment, Sanitary, Energy & Process and Food & Life Science. Service also developed positively compared with the previous quarter.
North America reported continued order growth in the third quarter compared to the second, completely driven by large orders since the base business remained unchanged. Energy & Process, Water & Waste Treatment and Marine & Offshore Pumping Systems did particularly well in the quarter, while Food & Life Science, Industrial Equipment and Sanitary declined. Canada recorded the strongest growth, but the United States also performed very well.
Order intake decreased in both the U.S. and Canada in the fourth quarter, compared with the third, the main explanatory factor being the non-repeat of large project orders, particularly in Energy & Process.
The base business also declined some-what. Segments Sanitary, OEM, Marine & Diesel Equipment and Marine & Offshore Systems all developed favourably.
Latin AmericaOrder intake in Latin America came in lower in the first quarter than in the fourth quarter 2013, due to fewer large orders in Brazil. The service business had a very strong run in the region, across the three divisions. Mexico, Colombia, Venezuela and Panama also reported strong growth, boosted by the oil & gas and food markets.
The order intake in Latin America was slightly down in the second quarter com-pared to the previous quarter due to fewer large orders. The only exception was Ar-gentina which showed very good growth across all divisions, compared to a weak first quarter. The base business developed very well across the region.
Order intake dropped in the third quarter compared to the previous quarter, mainly due to fewer large orders in the quarter in Brazil. Large investments in the country were affected by the economic development and general uncertainty due to the ongoing elections. The base business, however, performed well in the country, boosted by a positive development in the Equipment division. Generally in the region, food volumes were lower, while the service business de-veloped well. Oil & gas also performed well outside of Brazil, with large orders booked in Mexico and Peru.
Latin America reported an increase in order intake in the fourth quarter compared to the third, driven by Brazil and also by a generally good base business development across the region. The latter was driven by high activity in food, dairy and marine. From a very weak third quarter, with few large orders, Brazil bounced back and booked a number

69Financial statements
of larger orders related to the food and oil & gas industries. A good development of the service business in the Process Tech-nology division contributed to the very strong development.
AsiaOrder intake remained unchanged in the first quarter compared to the fourth quarter 2013. The base business showed a positive development, especially within Industrial Equipment, Marine & Diesel Equipment, Sanitary and OEM, where Marine Equipment continued to benefit from last year’s development in ship contracting. The project business was however more mixed, reflecting a continued cautious approach from customers across the Asia region. Process Technology had a strong development, especially for solutions going into refinery, petrochemical and vegetable oil applications. Marine & Offshore Systems, however, showed a slower development to a large extent caused by the distribution over time of marine boiler contracts. Geographically the best develop-ment was seen in South East Asia, India and Japan. China declined as larger projects, booked in the fourth quarter, were not repeated. The base business in China still showed a continued good development, supported by a high activity level in Industrial Equipment, Sanitary and Environment.
Order intake enjoyed a strong development during the second quarter compared to the first, driven by a good development for both the base and project business. The strongest performance was seen in Marine, which continued to benefit from an earlier surge in ship contracting as well as demand for energy transportation (tankers and LNG carriers). Process Technology had a slower development as the strong performance in the first quarter, particularly within refinery and petrochemicals, was not repeated. Vegetable oil also slowed down somewhat, as customers absorbed increased capacity, particularly in South East Asia. Equipment remained basically unchanged from the first quarter, with growth in Industrial Equipment driven by the comfort market unit, whereas Sanitary saw a moderated development compared to the first quarter. Service grew across the line. The best geographical per-formance was seen in the major shipbuilding nations such as Japan, Korea and China. China was also enjoying a broad-based growth across all three divisions as well as Service, indicating an easing of the wait and see position previously adopted by many customers.
Order intake enjoyed a strong development during the third quarter compared to the second, as a result of the Frank Mohn ac-
quisition. Excluding Frank Mohn, order in-take was slightly lower due to the non-repeat of large projects, mainly in Marine & Diesel, but also in Process Technology. The base business and Service both performed very well in the region. Marine saw a negative impact from large projects, while the base business performed very well, still benefitting from the earlier surge in ship contracting at the yards. In Equipment and Process Technology, which also saw fewer large projects, the best performance was reported in market units comfort, refrigeration, food solutions & olive oil and petrochemicals. China saw a broad-based positive development, but with fewer large projects, as the customers’ wait-and-see attitude led to projects being postponed.
Order intake showed a positive develop-ment during the fourth quarter compared to the third, mainly as a result of re-evaluation effects related to Frank Mohn. Excluding those effects order intake was slightly lower than in the third quarter, primarily due to the decline in shipyard contracts earlier during the year. Marine project orders, however, remained on a high level. The best divisional performance was in Process Technology, where the segments Energy & Process and Food & Life Science both showed a strong development compared to the previous quarter. The base business grew, as did the project business. The latter was reflecting a good end-market mix of pharmaceuticals, oil & gas, refinery, inorganic chemicals and vegetable oil. In the Equipment division the order intake was slightly below the third quarter, particularly within the Industrial Equipment segment, which was affected by a continued weak activity level in the North Asian construction industry. Sanitary was flat compared to the third quarter while OEM grew. Service was unchanged in the fourth quarter compared to the third. On a country level, the best performance was seen in South Korea, driven by positive demand for products going into energy related ap-plications. South East Asia also developed well, reporting a broad-based growth across all three divisions. China grew compared with the previous quarter, boosted by the re-evaluation effects in Frank Mohn. Excluding those effects the pace was down somewhat from a strong third quarter. Large orders contributed to the strong quarter in the Middle East, the main contributor being a large power project in Saudi Arabia. Middle East also had a good base business devel-opment in the food industry as well as a positive development for marine service.
Research and developmentAs the result of an intensive and consistent commitment over many years to research
and development, Alfa Laval has achieved a world-leading position within the areas of separation and heat transfer. The product development within fluid handling has resulted in a strong market position for a number of products. In order to strengthen the Group’s position and to support the organic growth, by identifying new applications for existing products as well as developing new products, research and development is always an activity of high priority. Research and development is conducted at approximately twenty facilities around the world.
The costs for research and development have amounted to SEK 790 (702) million, corresponding to 2.3 (2.4) percent of net sales. Excluding currency effects and acquisition of businesses, the costs for research and development have increased by 6.4 percent compared to last year. The increase is mainly explained by a limited increase of the de-velopment resources and salary inflation.
PersonnelThe parent company does not have any employees.
The Group has on average had 17,109 (16,238) employees. At the end of December 2014 the Group had 17,753 (16,262) em-ployees. The employee turnover rate for 2014 is 7.5 (10.2) percent and mainly relates to employees within manufacturing units, warehouse and logistical units and the sales organisation.
Alfa Laval has the ambition to develop the employees on all levels within the Group. Part of this is made through local training and development efforts in the different factories and sales companies around the world, for instance ALPS (Alfa Laval Production System) that is based on the well known concepts of Lean and Six Sigma, while the more comprehensive group-wide training pro-grammes and development projects are performed within the Alfa Laval Academy framework. Examples of these training pro-grammes are Challenger (for young talents with international leadership potential), Impact (for women in the middle of the career), Project Management, Product trainings, Information Security (mandatory training via E-learning) and Pure Leadership (for middle management).
Alfa Laval is working to achieve equal career opportunities independent of for instance gender or ethnic origin. The latter is not the least important in an international company. Likewise the number of female managers shall increase in order to better reflect the females’ part of the total number of em-ployees. To facilitate this, a mentor programme has started for women with capacity to be-come future leaders.

70 Financial statements
Dec 31, 2014Dec 31, 2013*
0
500
1,000
1,500
2,000
2,500
2009 2010 2011 2012 2013* 2014
0
2,500
5,000
7,500
10,000
12,500
15,000
17,500
0
2,500
5,000
7,500
10,000
12,500
15,000
17,500
2013* 2014
389
4,870
1,637
1,582
7,582
493
98
4,930
1,592
1,766
7,651
539
1,275
2,212
388
2,047
360 307 303 345
1,9541,856 1,835
2,050
4,144
3,003
746
5,461
1,932
16,238
783169
4,884
3,072
752
5,556
1,930
17,109
749 166
Employees
Average number of employees – by region
Employees – by category
Employees – Productivity development
Nordic
North America
Western Europe
Latin America
Central & Eastern Europe
Other
Asia
Manufacturing, logistics & procurement
Central Sales & Marketing
Management & Administration
Local Sales & Service
R&D
Acquired during the year
Adjusted EBITA/average number of employees Net sales/average number of employees
Number
Number
SEK thousands
The whole period 2009-2013 has been affected by the strengthening of the Swedish krona. The outcome for 2011 and 2012 has been affected by the acquisition of Aalborg Industries and the Euro crisis. Aalborg Industries has a lower turnover per employee than Alfa Laval. The outcome for 2014 has been affected by the weakening of the Swedish krona and the acquisition of Frank Mohn.
The productivity by employee has developed as follows:
The distribution of the number of employees by region is:
The distribution of the number of employees by personnel category at year end is:
* Restated to IFRS 11.

71Financial statements
The distribution of employees per country and per municipality in Sweden and between males and females can be found in Note 5 in the notes to the financial statements. The specification of salaries, wages, remunerations, social costs and pension costs are provided in Note 6 in the notes to the financial statements.
Guidelines for remunerations to executive officersThe guidelines for remunerations to executive officers are established by the Annual General Meeting, see further description in Note 6.
The Annual General Meeting 2014 decided to implement step four of a cash based long term incentive programme for maximum 85 senior managers in the Group including the Chief Executive Officer and the persons defined as executive officers. The Board of Directors will propose the Annual General Meeting 2015 to implement step five of this cash-based long term incentive programme for the period January 1, 2015 – December 31, 2017. No other changes of these guide-lines are proposed by the Board of Directors.
Ethics and social responsibilityTwo of Alfa Laval’s four business principles are: ”Respect for human rights is funda-mental” and ”High ethical standards guide our conduct”. This means that Alfa Laval respects human rights and the very different social cultures in which the company works and supplies its products and services and that Alfa Laval conducts its business with honesty, integrity and respect for others.
Globalisation gives Alfa Laval new business opportunities for increased sales as well as lower costs for manufacturing the products. But when part of the supply chain is moved to countries with lower costs the company is often confronted with ethical questions in a more obvious manner. Health, security and working conditions for the employees at the company’s suppliers are some of Alfa Laval’s main topics. When Alfa Laval procures prod-ucts from quickly growing economies like China and India it is important for the company to secure that the cost reduction opportunities are not at the expense of those performing the work in each country. Alfa Laval regards it as an obligation to make sure that its suppliers develop quickly if the work, health and security conditions are not acceptable.
Alfa Laval has developed an internal training programme to give sales people and purchase departments knowledge on legal business practice.
EnvironmentOne of Alfa Laval’s four business principles is: ”Optimizing the use of natural resources in the most efficient manner is our business.”
The company’s products make a significant contribution to reducing the environmental impact of industrial processes and are used to produce renewable energy.
Since 2004 the Group runs a project to improve the internal environmental man-agement systems. Today all sites (except recent acquisitions) have an environmental management system in place. At the end of 2014 28 (28) production sites with ISO 14001 certification accounted for about 92 (93) percent of the delivery value. The goal is to have a certification level of at least 95 percent.
The subsidiary, Alfa Laval Corporate AB, is involved in operational activities that are subject to an obligation to report and com-pulsory licensing according to Swedish en-vironmental legislation. The permits mainly relate to the manufacturing of heat ex-changers in Lund and Ronneby and the manufacturing of separators in Tumba and Eskilstuna. The external environment is af-fected through limited discharges into the air and water, through waste and noise.
The foreign manufacturing sites within the Alfa Laval Group are engaged in opera-tional activities with a similar effect on the external environment. To what extent this activity is subject to an obligation to report and/or compulsory licensing according to local environmental legislation varies from country to country. Alfa Laval has an over-all intention to operate well within the limits that are set by local legislation.
Asbestos-related lawsuitsThe Alfa Laval Group was as of December 31, 2014, named as a co-defendant in a total of 816 asbestos-related lawsuits with a total of approximately 819 plaintiffs. Alfa Laval strongly believes the claims against the Group are without merit and intends to vigorously contest each lawsuit.
Based on current information and Alfa Laval’s understanding of these lawsuits, Alfa Laval continues to believe that these lawsuits will not have a material adverse effect on the Group’s financial condition or results of operation.
Result for the parent companyThe parent company’s result after financial items was SEK 1,659 (1,762) million, out of which dividends from subsidiaries were SEK 1,630 (1,697) million, net interests SEK 33 (71) million, realised and unrealised exchange rate gains and losses SEK 10 (4) million, costs related to the listing SEK -4 (-3) million, fees to the Board SEK -7 (-6) million, costs for annual report and annual general meeting SEK -2 (-2) million and other operating income and operating costs the remaining SEK -1 (1) million. Change of tax allocation reserve has been made with SEK -65 (30)
million. Group contributions amount to SEK 947 (855) million, Tax on this year’s result amount to SEK -205 (-212) million. Net income for the year was SEK 2,336 (2,435) million.
Unrestricted equity for the parent companyThe unrestricted equity of Alfa Laval AB (publ) was SEK 10,015 (9,253) million.
Proposed disposition of earningsThe Board of Directors propose a dividend of SEK 4.00 (3.75) per share corresponding to SEK 1,678 (1,573) million and that the remaining income available for distribution in Alfa Laval AB (publ) of SEK 8,337 (7,680) million be carried forward, see page 134.
The Board of Directors are of the opinion that the proposed dividend is in line with the requirements that the type and size of operations, the associated risks, the capital needs, liquidity and financial position put on the company.
Disclosure on share related information Paragraph 2a in chapter 6 of the Swedish Annual Accounts Act requires listed companies to disclose certain information relating to the company’s shares in the Board of Directors’ Report. This information is found in the following paragraphs, in the “Changes in consolidated equity” and in Note 6.
Events after the closing dateThe statements on financial position and the comprehensive income statements will be adopted at the Annual General Meeting of shareholders on April 23, 2015.
Outlook for the first quarter In the fourth quarter and full year 2014 report issued on February 3, 2015, the President and Chief Executive Officer Lars Renström stated:
“We expect that demand during the first quarter 2015 will be somewhat lower than in the fourth quarter.”
Earlier published outlook (October 28, 2014): “We
expect that demand during the fourth quarter 2014
will be on about the same level as in the third quarter.”
Date for the next financial reports during 2015 Alfa Laval will publish interim reports during 2015 at the following dates:
Interim report for the first quarter April 23Interim report for the second quarter July 16Interim report for the third quarter October 22

72 Financial statements
Consolidated cash flows
Consolidated cash flows
SEK millions Note 2014 2013 *
Operating activities
Operating income 4,671 4,353
Adjustment for depreciation and amortisation 1,469 1,007
Adjustment for other non-cash items -83 -38
6,057 5,322
Taxes paid -1,422 -1,093
4,635 4,229
Changes in working capital:
Increase(-)/decrease(+) of receivables -282 113
Increase(-)/decrease(+) of inventories -99 -133
Increase(+)/decrease(-) of liabilities 596 204
Increase(+)/decrease(-) of provisions 273 -180
Increase(-)/decrease(+) in working capital 488 4
5,123 4,233
Investing activities
Investments in fixed assets (Capex) -603 -492
Divestment of fixed assets 76 36
Acquisition of businesses 16 -14,443 -495
-14,970 -951
Financing activities
Received interests and dividends 114 122
Paid interests -281 -208
Realised financial exchange differences -266 -16
Dividends to owners of the parent -1,573 -1,468
Dividends to non-controlling interests -5 0
Increase(-)/decrease(+) of financial assets 54 -190
Increase(+)/decrease(-) of borrowings 12,207 -1,431
10,250 -3,191
Cash flow for the period 403 91
Cash and bank at the beginning of the period 1,446 1,389
Translation difference in cash and bank 164 -34
Cash and bank at the end of the period 25 2,013 1,446
Free cash flow per share (SEK) ** -23.48 7.82
Capex in relation to sales 1.7% 1.7%
Average number of shares 419,456,315 419,456,315
* Restated to IFRS 11.
** Free cash flow is the sum of cash flows from operating and investing activities.

73Financial statements
Comments to the consolidated cash-flows
For further comments on certain individual lines in the cash-flow statement, reference is made to Notes 16 and 25.
Cash flows from operating activitiesThe increase in cash flows from operating activities in 2014 is explained by higher operating income before depreciation and amortisation and a higher increase in working capital, mitigated by higher tax payments.
Cash and bankThe item cash and bank mainly consists of short term deposits of less than three months with banks.
Cash flowCash flow from operating and investing activities amounted to SEK -9,847 (3,282) million during 2014. Out of this, acquisitions of businesses were SEK -14,443 (-495) million whereas divestments generated cash of SEK 76 (36) million.
Adjustment for other non-cash itemsOther non-cash items are mainly referring to realised gains and losses in connection with sale of assets. These have to be eliminated since the cash impact of divestments of fixed assets and businesses are reported separately under cash flow from investing activities.
Working capitalWorking capital decreased by SEK 488 (4) million during 2014.
InvestmentsInvestments in property, plant and equipment amounted to SEK 603 (492) million during 2014. The investments made for the individual product groups are as follows:
Heat exchangersInvestments have been made in machines for manufacturing of new products and in productivity enhancing equipment in Ronneby in Sweden and in Jiang Yin in China for brazed heat exchangers. Investments have been made in Jiang Yin in China and in Lund in Sweden in equipment to increase capacity and widen the product range for gasketted heat exchangers. Two larger investments have been made for welded heat exchangers in Jiang Yin in China and in Fontanil in France.
High speed separatorsInvestments in machine capacity for separator disks have been made during the year in Eskilstuna in Sweden.
Fluid handling productsDuring 2014 investments in productivity and capacity increasing equipment have been made relating to fluid handling products in Kolding in Denmark as well as in Kunshan in China.
DepreciationsDepreciation, excluding allocated step-up values, amounted to SEK 565 (446) million during the year.
Acquisitions and disposalsFor a further analysis of the impact on the cash flow by acquisitions and disposals, see Note 16.
Free cash flow per shareThe free cash flow per share is SEK -23.48 (7.82).

74 Financial statements
Consolidated comprehensive income
Consolidated comprehensive income
SEK millions Note 2014 2013 *
Net sales 1, 2, 3, 4 35,067 29,801
Cost of goods sold 9 -23,347 -19,267
Gross profit 11,720 10,534
Sales costs 5, 6, 9 -3,862 -3,478
Administration costs 5, 6, 7, 9 -1,738 -1,582
Research and development costs 9 -790 -702
Other operating income ** 8 565 459
Other operating costs ** 8, 9 -1,224 -895
Share of result in joint ventures 33 0 17
Operating income 4,671 4,353
Dividends and changes in fair value 10 30 8
Interest income and financial exchange rate gains 11 420 358
Interest expense and financial exchange rate losses 11 -1,000 -547
Result after financial items 4,121 4,172
Tax on this year's result 15 -1,129 -1,098
Other taxes 15 -24 -34
Net income for the year 2,968 3,040
Other comprehensive income:
Items that will subsequently be reclassified to net income
Cash flow hedges -621 13
Translation difference 439 39
Deferred tax on other comprehensive income 15 220 -14
Sum 38 38
Items that will subsequently not be reclassified to net income
Revaluations of defined benefit obligations -476 234
Deferred tax on other comprehensive income 15 71 -81
Sum -405 153
Comprehensive income for the year 2,601 3,231
Net income attributable to:
Owners of the parent 2,946 3,027
Non-controlling interests 22 13
Earnings per share (SEK) 7.02 7.22
Average number of shares 419,456,315 419,456,315
Comprehensive income attributable to:
Owners of the parent 2,563 3,212
Non-controlling interests 38 19
* Restated to IFRS 11.
** The line has been affected by comparison distortion items, see specification in Note 8.

75Financial statements
For comments on the individual lines in the consolidated comprehensive income statement, reference is made to Notes 1 to 15 and Note 28. For comments on the operating segments, see Note 1.
As a basis for comments on the various main items of the consolidated comprehensive in-come statement, please find a comparison between the last two years:
Income analysis
Consolidated
SEK millions 2014 2013 *
Net sales 35,067 29,801
Adjusted gross profit ** 12,624 11,095
- in % of net sales 36.0 37.2
Expenses *** -6,164 -5,735
- in % of net sales 17.6 19.2
Adjusted EBITDA 6,460 5,360
- in % of net sales 18.4 18.0
Depreciation -565 -446
Adjusted EBITA 5,895 4,914
- in % of net sales 16.8 16.5
Amortisation of step up values -904 -561
Comparison distortion items -320 –
Operating income 4,671 4,353
* Restated to IFRS 11. ** Excluding amortisation of step up values. *** Excluding comparison distortion items.
Comments to the consolidated comprehensive income
The gross margin has decreased by 1.2 percentage units between 2013 and 2014. The decrease is mainly explained by a neg-ative price/mix effect, but also by a lower gross margin level for the acquired Frank Mohn compared to the rest of Alfa Laval, negative exchange rate effects and a lower utilisation in the factories.
Sales and administration expenses amounted to SEK 5,600 (5,060) million. Excluding currency effects and acquisition of businesses, sales and administration ex-penses were 2.9 percent higher than last year. The increase comes from salary and wage inflation and a limited build-up of re-sources for organic growth.
The costs for research and development have amounted to SEK 790 (702) million, corresponding to 2.3 (2.4) percent of net sales. Excluding currency effects and ac-quisition of businesses, the costs for re-search and development have increased by 6.4 percent compared to last year. The
increase is mainly explained by a limited in-crease of the development resources and salary inflation.
The net income attributable to the owners of the parent, excluding depreciation of step-up values and the corresponding tax, is SEK 8.56 (8.18) per share.
Compared with last year Alfa Laval has been affected during 2014 by exchange rate differences, both through translation differences and through the net exposure when trading in foreign currencies. The effect on adjusted EBITA has been calculated to totally about SEK 70 (-187) million for 2014 compared with last year. The effect of the exchange rate variations has been limited through exchange rate hedging and through the distribution of the company’s financial debts in relation to its net assets in different currencies.

76 Financial statements
0
2,000
4,000
6,000
8,000
10,000
12,000
Q414Q314Q214Q114Q413Q313Q213Q113Q412Q312Q212Q112
30
32
34
36
38
40
42
Net sales & adjusted gross profit margin
SEK millions %
Net sales Adjusted gross pro�t in % of net sales
0
400
800
1,200
1,600
2,000
Q414Q314Q214Q114Q413Q313Q213Q113Q412Q312Q212Q1124
8
12
16
20
24
Adjusted EBITA
SEK millions %
Adjusted EBITA Adjusted EBITA in % of net sales
In order to illustrate the quarterly development, the last 12 quarters are shown below for four of the parameters in the income analysis:
The operating income has been affected by comparison distortion items of SEK -320 (-) million, which are specified below. In the consolidated comprehensive income statement these are reported gross as a part of other operating income and other operating costs, see summary in Note 8.
The comparison distortion cost during 2014 consists of two components. SEK -60 million relate to one time acquisition costs in connection with the acquisition of Frank Mohn AS. The remaining SEK -260 million relate to a cost reduction and restructuring programme, where Alfa Laval has reviewed costs and structure relating to the supply chain as well as R&D, sales and administration. Change activities and saving measures were initiated in the third quarter including initiatives for reduced costs and activities as well as structural changes, for instance the announced move of production from Denmark to China. The programme is expected to be fully im-plemented during the fourth quarter 2015, when the savings are estimated to reach a level of SEK 300 million on a yearly basis. The costs are expected to amount to SEK 260 million, out of which SEK 235 million have a cash flow effect. The measures are expected to affect about 400 employees gross and after completion mean a per-sonnel reduction of 300 employees.
The financial net has amounted to SEK -184 (-90) million, excluding realised and unrealised exchange rate losses and gains. The main elements of costs were interest on the debt to the banking syndicate and on the bridge loan of SEK -56 (-21) million, interest on the bilateral term loans of SEK -79 (-70) million, interest on the private placement of SEK -11 (-12) million, interest on the commercial papers of SEK -5 (-) million, interest on the corporate bonds of SEK -27 (-) million and a net of dividends and other interest income and interest costs of SEK -6 (13) million.
The net of realised and unrealised exchange rate differences has amounted to SEK -366 (-91) million. Out of this SEK -440 million is relating to realised and unrealised exchange rate losses in Frank Mohn, split on realised exchange losses of SEK -240 million and unrealised exchange losses of SEK -200 million. The exchange losses are referring to currency forward contracts that have not been possible to link directly to the opera-tional exposure of the business.
The item cash flow hedges in other com-prehensive income almost entirely consist of fair value changes in cash flow hedges:

77Financial statements
Fair value changes in cash flow hedges
Consolidated
SEK millions 2014 2013
Opening balance 123 110
Booked into other comprehensive income during the year -617 -41
Reversed from other comprehensive income due to inefficiency:
booked against cost of goods sold -2 17
Reversed from other comprehensive income:
booked against cost of goods sold -1 46
booked against interest income/interest costs -1 -9
Closing balance -498 123
Change reported against other comprehensive income -621 13
The Group has not had any cash flow hedges that have affected the initially recognised carrying amount of non-financial assets.
In the item cash flow hedges in other comprehensive income the fair value changes in shares in external companies is also included with SEK -0 (-0) million for 2014. They are not material enough to render a separate line in the comprehensive income statement.
Accumulated translation differences *
Consolidated
SEK millions
Year Main explanation to translation differences Change Accumulated
Pre-tax effect on change by hedging
measures
Formation of the Group
2000 The EUR was appreciated by 6 %, which affected the EUR based acquisition loans -94 -94 -312
2001 The USD was appreciated by 10.7 % 97 3 -105
2002 The USD was depreciated by 16.7 % -190 -187 165
2003 The USD was depreciated by 17.5 % -38 -225 195
2004 The USD was depreciated by 9.0 % -103 -328 -19
2005 The USD was appreciated by 20.3 % and the EUR was appreciated by 4.8 % 264 -64 -65
2006 The USD was depreciated by 13.5 % and the EUR was depreciated by 4.0 % -269 -333 56
2007 The USD was depreciated by 5.7 % whereas the EUR was appreciated by 4.7 % 224 -109 13
2008 The USD was appreciated by 20.5 % and the EUR was appreciated by 16.2 % 850 744 -468
2009 The USD was depreciated by 7.5 % and the EUR was depreciated by 6.0 % -392 352 220
2010 The USD was depreciated by 5.7 % and the EUR was depreciated by 12.9 % -554 -202 99
2011 The USD was appreciated by 1.4 % whereas the EUR was depreciated by 0.8 % -254 -456 34
2012 The USD was depreciated by 5.8 % and the EUR was depreciated by 3.6 % -798 -1,254 214
2013 The USD was appreciated by 0.3 % and the EUR was appreciated by 4.1 % 39 -1,215 -83
2014 The USD was appreciated by 20.5 % and the EUR was appreciated by 6.3 % 439 -776 -1,033
* Reported against other comprehensive income. Prior to 2009 these translation differences were reported against equity.

78 Financial statements
Consolidated financial position
Consolidated financial position
ASSETS
SEK millions Note 2014 2013 *Opening balance January 1, 2013
Non-current assets
Intangible assets 16, 17
Patents and unpatented know-how 2,932 1,927 1,943
Trademarks 4,920 1,618 1,819
Licenses, renting rights and similar rights 46 37 45
Goodwill 20,408 10,061 9,792
28,306 13,643 13,599
Property, plant and equipment 16, 18
Real estate 2,602 1,664 1,702
Machinery and other technical installations 1,597 1,435 1,430
Equipment, tools and installations 601 549 530
Construction in progress and advances to suppliers concerning property, plant and equipment 204 137 150
5,004 3,785 3,812
Other non-current assets
Other long-term securities 13, 14, 19 30 35 35
Pension assets 26 6 11 3
Deferred tax assets 15 1,986 1,401 1,497
2,022 1,447 1,535
Total non-current assets 35,332 18,875 18,946
Current assets
Inventories 20 7,883 6,312 6,170
Assets held for sale
Real estate 18 6 – 9
Current receivables
Accounts receivable 13, 21 6,684 5,039 5,196
Current tax assets 1,357 1,112 1,206
Other receivables 13, 22 1,393 1,083 1,097
Prepaid costs and accrued income 13, 23 245 218 199
Derivative assets 13, 14 176 219 325
9,855 7,671 8,023
Current deposits
Other current deposits 13, 24 697 605 422
Cash and bank 13, 25 2,013 1,446 1,389
Total current assets 20,454 16,034 16,013
TOTAL ASSETS 55,786 34,909 34,959
* Restated to IFRS 11.

79Financial statements
Consolidated financial position, continued
EQUITY AND LIABILITIES
SEK millions Note 2014 2013 *Opening balance January 1, 2013
Equity
Attributable to owners of the parent
Share capital 1,117 1,117 1,117
Other contributed capital 2,770 2,770 2,770
Other reserves -2,332 -1,949 -2,134
Retained earnings 15,522 14,149 12,639
17,077 16,087 14,392
Attributable to non-controlling interests 12 125 75 61
Total equity 17,202 16,162 14,453
Non-current liabilities
Liabilities to credit institutions etc 13, 28 16,454 3,529 5,393
Provisions for pensions and similar commitments 26 2,221 1,494 1,727
Provision for deferred tax 15 3,074 1,758 1,931
Other provisions 27 543 423 466
Total non-current liabilities 22,292 7,204 9,517
Current liabilities
Liabilities to credit institutions etc 13, 28 1,251 1,049 610
Advances from customers 3,796 2,027 2,121
Accounts payable 13 2,706 2,244 2,192
Notes payable 13 198 144 135
Current tax liabilities 1,399 1,064 1,102
Other liabilities 13, 29 2,003 1,520 1,371
Other provisions 27 1,862 1,539 1,603
Accrued costs and prepaid income 13, 30 2,105 1,722 1,668
Derivative liabilities 13, 14 972 234 187
Total current liabilities 16,292 11,543 10,989
Total liabilities 38,584 18,747 20,506
TOTAL EQUITY AND LIABILITIES 55,786 34,909 34,959
PLEDGED ASSETS AND CONTINGENT LIABILITIES
Pledged assets 31 18 17 10
Contingent liabilities 31 2,430 1,916 1,982
* Restated to IFRS 11.

80 Financial statements
Comments on the consolidated financial position
For comments on the individual lines in the statement on financial position, reference is made to Notes 12 to 34. For comments on the operating segments, see Note 1.
Capital employedThe average capital employed including goodwill and step-up values amounted to SEK 27,259 (18,598) million during the year.
Return on capital employedThe return on average capital employed including goodwill and step-up values amounted to 20.5 (26.4) percent during the year.
Capital turnover rateThe capital turnover rate calculated on the average capital employed including good-will and step-up values amounted to 1.3 (1.6) times for the year.
Return on equityNet income in relation to the average equity was 17.6 (20.4) percent during the year.
SolidityThe solidity, that is the equity in relation to total assets, was 30.8 (46.3) percent at the end of the year.
Net debtThe net debt was SEK 15,068 (2,611) million at the end of the year.
Net debt to EBITDANet debt in relation to EBITDA was 2.45 (0.49) times at the end of December.
Debt ratioThe debt ratio, that is the net debt in relation to equity, was 0.88 (0.16) times at the end of December.

81Financial statements
Changes in consolidated equity
Changes in consolidated equity
Attributable to: Owners of the parent Non-controlling interests Total
Other reserves
SEK millionsShare
capital
Other contributed
capitalCash flow
hedgesTranslation differences Revaluations
Deferredtax
Retainedearnings Subtotal
Translation differences
Retainedearnings Subtotal
As of December 31, 2012 1,117 2,770 110 -1,235 -1,045 36 12,639 14,392 -19 80 61 14,453
2013
Comprehensive income
Net income – – – – – – 3,027 3,027 – 13 13 3,040
Other comprehensive income – – 13 33 234 -95 – 185 6 – 6 191
Comprehensive income – – 13 33 234 -95 3,027 3,212 6 13 19 3,231
Transactions with shareholders
Decrease of non-controlling
interests – – – – – – -49 -49 – -5 -5 -54
Dividends to owners of the
parent – – – – – – -1,468 -1,468 – – – -1,468
Dividends to non-controlling
interests – – – – – – – – – – – –
As of December 31, 2013 1,117 2,770 123 -1,202 -811 -59 14,149 16,087 -13 88 75 16,162
2014
Comprehensive income
Net income - - - - - - 2,946 2,946 - 22 22 2,968
Other comprehensive income - - -621 423 -476 291 - -383 16 - 16 -367
Comprehensive income - - -621 423 -476 291 2,946 2,563 16 22 38 2,601
Transactions with shareholders
Non-controlling interests in
acquired companies – – – – – – – – – 17 17 17
Dividends to owners of the
parent – – – – – – -1,573 -1,573 – – – -1,573
Dividends to non-controlling
interests – – – – – – – – – -5 -5 -5
As of December 31, 2014 1,117 2,770 -498 -779 -1,287 232 15,522 17,077 3 122 125 17,202

82 Financial statements
Specification of changes in number of shares and share capital
Year Event DateChange in number
of sharesTotal number
of shares
Change in share capital SEK millions
Total share capital SEK millions
2000 Company formation March 27, 2000 10,000,000 10,000,000 0.1 0.1
New issue of shares August 24, 2000 27,496,325 37,496,325 0.3 0.4
2002 Bonus issue of shares May 3, 2002 37,496,325 74,992,650 0.4 1
Bonus issue of shares May 16, 2002 – – 749 750
New issue of shares May 16, 2002 3,712,310 78,704,960 37 787
New issue of shares May 17, 2002 32,967,033 111,671,993 330 1,117
2008 Cancellation of repurchased shares May 27, 2008 -4,323,639 107,348,354 -43
Bonus issue of shares May 27, 2008 – 107,348,354 43 1,117
Split 4:1 June 10, 2008 322,045,062 429,393,416 – 1,117
2009 Cancellation of repurchased shares July 9, 2009 -7,353,950 422,039,466 -19
Bonus issue of shares July 9, 2009 – 422,039,466 19 1,117
2011 Cancellation of repurchased shares May 16, 2011 -2,583,151 419,456,315 -7
Bonus issue of shares May 16, 2011 – 419,456,315 7 1,117

83Financial statements
Comments on changes in consolidated equity
The articles of association of Alfa Laval AB state that the share capital should be between SEK 745,000,000 and 2,980,000,000 and that the number of shares should be between 298,000,000 and 1,192,000,000.
At January 1, 2014 the share capital of SEK 1,116,719,930 was divided into 419,456,315 shares. Since then no changes have been made.
The company has only issued one type of shares and all these have equal rights. There are no restrictions in law or in the articles of association in the negotiability of the shares.
The only shareholder holding more than 10 percent of the shares is Tetra Laval B.V., the Netherlands who owns 26.1 (26.1) per-cent. The employees of the company do not own any shares in the company through company pension trusts.
No restrictions exist in how many votes that each shareholder can represent at a general meeting of shareholders. The com-pany has no knowledge of any agreements between shareholders that would limit the negotiability of their shares.
The articles of association stipulate that members of the Board are elected at the Annual General Meeting. Election or discharge of members of the Board is otherwise regulated by the provisions in the Swedish Companies Act and the Swedish Corporate Governance Code. According to the Companies Act changes in the articles of association are decided at general meetings of shareholders.
The senior credit facility with the banking syndicate, the private placement, the cor-porate bonds and the bilateral term loans with Swedish Export Credit and the European Investment Bank contain conditions that give the lenders the opportunity to terminate the loans and declare them due and payable if there is a change of control of the company through an acquisition of more than 30 percent of the total number of shares.
The possibilities to distribute unappropri-ated profits from foreign subsidiaries are limited in certain countries due to currency regulations and other legislation.

84 Financial statements
Parent company cash flows and income
Parent company cash flows
SEK millions 2014 2013
Cash flow from operating activities
Operating income -14 -10
Taxes paid -212 -3
-226 -13
Changes in working capital:
Increase(-)/decrease(+) of receivables -1,733 112
Increase(+)/decrease(-) of liabilities 14 4
Increase(-)/decrease(+) in working capital -1,719 116
-1,945 103
Cash flow from investing activities
Investment in subsidiaries – –
– –
Cash flow from financing activities
Received interests 39 71
Paid interests -5 0
Received dividends from subsidiaries 1,630 1,697
Paid dividends -1,573 -1,468
Received/paid group contribution 855 -403
Increase/(decrease) of loans 999 –
1,945 -103
Cash flow for the year – –
Cash and bank at the beginning of the year – –
Cash and bank at the end of the year – –
Parent company income *
SEK millions Note 2014 2013
Administration costs -13 -11
Other operating income 3 4
Other operating costs -4 -3
Operating income -14 -10
Dividends from subsidiaries 1,630 1,697
Interest income and similar result items 11 51 79
Interest expenses and similar result items 11 -8 -4
Result after financial items 1,659 1,762
Change of tax allocation reserve -65 30
Group contributions 947 855
Result before tax 2,541 2,647
Tax on this year's result -205 -212
Net income for the year 2,336 2,435
* The parent company income statement also constitutes its comprehensive income statement.

85Financial statements
Parent company financial position
Parent company financial position
SEK millions Note 2014 2013
ASSETS
Non-current assets
Financial non-current assets
Shares in group companies 19 4,669 4,669
Current assets
Current receivables
Receivables on group companies 10,120 8,263
Current tax assets 47 40
Other receivables 4 3
Accrued income and prepaid costs – 1
10,171 8,307
Cash and bank – –
Total current assets 10,171 8,307
TOTAL ASSETS 14,840 12,976
EQUITY AND LIABILITIES
Equity
Restricted equity
Share capital 1,117 1,117
Statutory reserve 1,270 1,270
2,387 2,387
Unrestricted equity
Profit brought forward 7,679 6,818
Net income for the year 2,336 2,435
10,015 9,253
Total equity 12,402 11,640
Untaxed reserves
Tax allocation reserve, taxation 2009 – 239
Tax allocation reserve, taxation 2010 224 224
Tax allocation reserve, taxation 2011 313 313
Tax allocation reserve, taxation 2012 140 140
Tax allocation reserve, taxation 2014 320 320
Tax allocation reserve, taxation 2015 304 –
1,301 1,236
Current liabilities
Commercial papers 999 –
Liabilities to group companies 138 99
Accounts payable 0 1
1,137 100
TOTAL EQUITY AND LIABILITIES 14,840 12,976
MEMORANDUM ITEMS
Pledged assets and contingent liabilities
PLEDGED ASSETS None None
CONTINGENT LIABILITIES (for subsidiaries):
Performance guarantees None None
Other contingent liabilities None None

86 Financial statements
Changes in parent company equity
Changes in parent company equity
SEK millions Share capital Statutory reserveUnrestricted
equity Total
As of December 31, 2012 1,117 1,270 8,285 10,672
2013
Comprehensive income
Net income – – 2,435 2,435
– – 2,435 2,435
Transactions with shareholders
Dividends – – -1,468 -1,468
As of December 31, 2013 1,117 1,270 9,253 11,640
2014
Comprehensive income
Net income – – 2,336 2,336
– – 2,336 2,336
Transactions with shareholders
Dividends – – -1,573 -1,573
As of December 31, 2014 1,117 1,270 10,015 12,402
The share capital of SEK 1,116,719,930 (1,116,719,930) is divided among 419,456,315 (419,456,315) shares.

87Financial statements
Notes to the financial statements
Accounting principles
The accounting principles mentioned below are only the ones that are relevant for the parent company and the consolidated group.
Basis of preparationThe consolidated financial statements have been prepared on a historical cost basis, except for certain financial instruments including derivatives that are valued at fair value. The statements are presented in SEK millions, unless otherwise stated.
Statement of complianceAs from January 1, 2005 Alfa Laval applies International Financial Reporting Standards (IFRS) as adopted by the European Union. Furthermore recommendation RFR 1 ”Supplementary accounting principles for consolidated groups” from the Council for Financial Reporting in Sweden is applied.
The accounting and valuation principles of the parent company comply with the Swedish Annual Accounts Act and the rec-ommendation RFR 2 ”Accounting for legal entities” issued by the Council for Financial Reporting in Sweden.
Changed/implemented accounting principlesThe company has chosen to only comment the changed accounting principles that are relevant for the company’s financial reporting.
During 2014 IFRS 10 ”Consolidated fi-nancial statements” has been implemented. IFRS 10 replaces the part of IAS 27 ”Con-solidated and separate financial statements” that covers consolidation principles. The consolidation principles have not been changed. The change is rather related to how an entity shall proceed to decide if a decisive influence is present and thus if an entity shall be consolidated. Control (decisive influence) is present when the investor has:
– power over the investee, which is described as having rights to direct the activities that significantly affect the investee’s returns,
– exposure or rights to variable returns from the involvement in the investee and
– the ability to use its power over the investee to affect the amount of the investor’s returns.
An investor is a party that has a potential influence over an entity. A decisive influence does not need to arise purely through ownership of shares (voting rights). An
investor can have a decisive influence over another entity without holding the majority of the shares. An entity must be consolidated until the day the control ceases, even if the control is present only during a limited period.
The standard must be applied retroactively in accordance with IAS 8, with certain modifications, that includes exceptions from consolidation where this is impracticable.
During 2014 IFRS 11 ”Joint arrangements” has been implemented. Joint arrangements are defined as a contractual arrangement where two or more parties have a joint de-cisive influence. IFRS 11 replaced IAS 31 ”Interests in Joint Ventures” and SIC 13 ”Jointly Controlled Entities – Non-Monetary Contributions by Ventures”.
It is crucial to be able to judge whether a party has control over another party, that is decisive influence or if it rather is a substantial or common influence. If it is the latter, then it is a so called joint arrangement, which could be either:
– a joint operation or
– a joint venture.
Jointly owned assets and joint activities are called joint operations. Each owner or party accounts for his share of assets, liabilities, revenues and costs.
Joint ventures are no longer allowed to be consolidated according to the proportional consolidation method, but instead the equity method must be used. This means that the interest is accounted for on one line in the consolidated statement of financial position and that the share of the result is accounted for on one line in the consolidated statement of comprehensive income.
The application of the equity method means that the net income before tax in the joint ventures will be booked into one line in other operating income and the corre-sponding tax on the tax line. The counter entry will be an increase or decrease of the value of shares in joint ventures. The sales volume and other result items and the bal-ance items in the joint ventures will no longer be reported in the statements over consolidated comprehensive income and consolidated financial position in any of the two owner companies. In the case of Alfa Laval, the operations in these companies are however presently fairly limited, why IFRS 11 at least initially will have limited im-pact on the financial statements of Alfa Laval and the disclosures in them.
The standard must be applied retroactively with certain transitional provisions.
During 2014 IFRS 12 ”Disclosures of in-terest in other entities” has been implemented. Entities having interests in subsidiaries, as-sociates, joint arrangements and uncon-solidated structured entities must disclose information about these in accordance with IFRS 12. The purpose with these disclosures is to enable the users of the financial reports to understand:
– the composition of the group,
– the effect of the interests on the financial statements and
– any risks with the current interests.
Substantial qualitative and quantitative disclosures must be made of each interest. The disclosure requirements include the following:
– Financial information regarding subsidiaries with a considerable part of non-controlling interests.
– Disclosures on the judgments and estimation that have been made in judging whether an entity shall be consolidated or not and if an associate shall be accounted for or whether a joint arrangement is considered to be joint operation or a joint venture.
– Financial disclosures on interests in material associates and joint arrangements.
– Disclosures on the risks and rewards that are associated with unconsolidated structured entities and what the effect would be if the risks changed.
The standard must be applied retroactively in accordance with IAS 8.
During 2014 the amendments to IAS 32 ”Financial Instruments: Presentation” have been implemented. The amendment con-tains clarifications on the legal right to net and items settled with a net amount. The standard must be applied retroactively in accordance with IAS 8.
During 2014 IFRIC 21 ”Levies” has been implemented. IFRIC 21 is an interpretation that clarifies when a liability for levies is to be accounted for. Levies relate to levies/taxes that governmental or corresponding bodies are charging companies in accord-ance with laws or regulations with exception of income taxes, penalties and fines. The interpretation must be applied retroactively in accordance with IAS 8.

88 Financial statements
During 2013 the changes in IAS 1 ”Presen-tation of Financial Statements” were imple-mented. The change meant that the grouping of transaction reported in other comprehensive income was changed. The items that are recycled over the income statement are to be reported separately from the items that are not recycled over the income statement. The changes did not change the actual content of other comprehensive income but only the for-mat. The changes were to be applied ret-roactively in accordance with IAS 8.
During 2013 the changes in IAS 19 ”Em-ployee Benefits” were implemented. The changes meant substantial changes con-cerning the accounting for defined benefit pension schemes, for example:
– The possibility to phase actuarial gains and losses as a part of the corridor cannot be used, but these are to be accounted for currently in other comprehensive income. The items that relate to the vesting of defined benefit pensions and gains and losses that arise when settling a pension liability and the financial net concerning the defined benefit plan are reported in the income statement above net income.
– Changes in the obligations that relate to changes in actuarial assumptions are accounted for in other comprehensive income.
– The return on plan assets is calculated with the same interest rate as the discount rate. The expected return cannot be used any longer.
– The difference between the actual return on plan assets and the interest income in the previous bullet point is reported in other comprehensive income.
– Past service costs must be recognised in the income statement already when the plan is amended or curtailed.
– The plan assets must be specified on different types of assets.
– Sensitivity analysis must be made concerning reasonable changes in all assumptions made when calculating the pension liability.
– The difference between short and long term remunerations focuses on when the commitment is expected to be settled rather than the link to the employee’s vesting of the commitment.
– The changes include further changes that do not focus on accounting for pensions but other forms of employee benefits. Termination benefits shall be accounted for at the earliest of the following - the time when the benefit offer cannot be withdrawn, alternatively in accordance with IAS 37 as a part of for instance restructuring the operations.
– For Swedish entities the actuarial calcula-tions will also include future payments of special salary tax.
The revised standard was to be applied retroactively in accordance with IAS 8.
The changes to IAS 19 meant that:
– The present value of the defined benefit obligations is fully booked in the statement of financial position, with a magnitude approximately corresponding to the unrecognised actuarial losses as per the end of 2011.
– This results in an increased deferred tax receivable.
– The net of these two amounts is booked as a reduction of equity as a change in accounting principles per January 1, 2012.
– As a consequence of this the comparison figures for 2012 have been changed.
– From January 1, 2012 the actuarial gains and losses are reported currently in other comprehensive income.
– None of these actuarial items will ever be reported in operating income, but will instead remain in other comprehensive income.
– The impact on other comprehensive income can as a result become substantial between the years.
– The amount of disclosures will increase.
During 2013 an early application was made of the amendments to IAS 36 “Impairment of Assets” in order to avoid unnecessary disclosures. The amendments reduced the circumstances in which the recoverable amount of assets or cash-generating units must be disclosed and clarified the disclosures required. The amendments were to be applied retroactively in accordance with IAS 8. Early application was allowed.
During 2013 IFRS 13 ”Fair Value Measure-ment” was implemented. IFRS 13 describes how a fair value is established when such value is to be or may be used in accordance with each IFRS standard. In accordance with IFRS a fair value is defined as the price that would be received to sell an asset or paid to transfer a liability in an orderly transaction between market participants at the meas-urement date (i.e. an exit price).
The standard presents elucidations on the fair value concept including the following areas:
– Concepts such as ”highest and best use” and ”valuation premise” are described. These are only applicable on non-financial assets.
– Market participants are assumed to act in a way that maximizes the value for all involved parties in situations where there is no guidance concerning the calculation
of fair value in individual IFRS standards.
– The effect of so called block discounts (large position in relation to the market) may never be included in the calculation of fair value.
– Deciding fair value when the market activity is falling.
New disclosures must be made to explain what valuation models that are used and what information that is used in these models and which effects the valuation has caused in the result.
The standard was to be applied pro-spectively.
During 2013 Alfa Laval made an early adoption of the changes in RFR 2 issued by the Council for Financial Reporting in Sweden. The parent company chose to account for group contributions according to the alternative rule. This means that both received and given group contributions are reported as appropriations in the income statement. The comparison figures were restated.
During 2013 the opinion UFR 9 ”Redovis-ning av avkastningsskatt” from the Swedish Financial Reporting Board was implemented. The opinion covers how the Swedish tax on returns from pension funds is to be treated in light of the changes to IAS 19. The tax on returns from pension funds is to be reported currently as a cost in the profit and loss and must not be included in the actuarial calculation for defined benefit pension plans. UFR 9 meant no change compared to how the Swedish tax on re-turns from pension funds was accounted for earlier. It was rather a clarification in or-der to establish that the tax should not be included in the actuarial calculations.
Critical accounting principlesIFRS 3 ”Business Combinations” means that goodwill and intangible assets with indefinite useful life are not amortised. They are instead tested for impairment both annually and when there is an indication. The effect of IFRS 3 can be considerable for the Group if the profitability within the Group or parts of the Group goes down in the future, since this could trigger a substantial impairment write down of the goodwill according to IAS 36 Impairment of Assets. Such a write down will affect net income and thereby the financial position of the Group. The reported goodwill is SEK 20,408 (10,061) million at the end of the year. No intangible assets with indefinite useful life other than goodwill exist.
The Group has defined benefit plans, which are reported according to IAS 19 ”Employee Benefits”. This means that the plan assets are valued at fair value and that

89Financial statements
the present value of the benefit obligations in the defined benefit plans is decided through yearly actuarial calculations made by inde-pendent actuaries. If the value of the plan assets start to decrease at the same time as the actuarial assumptions increase the benefit obligations the combined effect could result in a substantial deficit. The monetary magnitude comes from the fact that the deficit is the difference between two large numbers. The risk for this happening has increased due to the implementation of the new IAS 19. The effect on profit and loss however only affects other comprehensive income and not net income. The risk has been limited since many of these defined benefit schemes are closed for new participants and replaced by defined contribution schemes.
The Group’s reporting of provisions ac-cording to IAS 37 means that SEK 2,405 (1,962) million is reported as other provisions. This constitutes 4.3 (5.6) percent of the Group’s assets and is important for the assessment of the Group’s financial position, not the least since provisions normally are based on judgements of probability and estimates of costs and risks. If the accounting principles for provision would be changed sometime in the future, this could have a substantial impact on the Group’s financial position.
IAS 39 ”Financial Instruments: Recogni-tion and Measurement” has a considerable effect on the Groups comprehensive income and equity and may have a substantial effect on net income if the used derivatives turns out not to be effective.
Key sources of estimation uncertaintyThe key source of estimation uncertainty is related to the impairment test of goodwill, since the testing is based on certain assumptions concerning future cash-flows. See the section on critical accounting principles above for further details.
JudgementsIn applying the accounting policies Management has made various judgements, apart from those involving estimations, that can significantly affect the amounts recognised in the financial statements. These judgements mainly relate to:
– classification of financial instruments;
– probability in connection with business risks;
– determination of percentage of completion in work in progress;
– recoverability of accounts receivable;
– obsolescence in inventory; and
– whether a lease entered into with an external lessor is a financial lease or an operational lease.
AssociatesThe Group does not own shares in any
material companies that fulfil the definition of an associate in IAS 28 ”Investments in Associates”, that is where the ownership is between 20 and 50 percent.
Borrowing costsBorrowing costs are accounted for according to IAS 23 ”Borrowing Costs”, which means that the borrowing costs are charged to the profit and loss in the period to which they relate.
Transaction costs that arise in connection with raising a loan are capitalised and amor-tised over the maturity of the loan according to IAS 39 ”Financial Instruments: Recognition and Measurement”. The capitalised amount is reported net against the raised loan.
Business combinations – consolidation principles The consolidated financial statements have been prepared according to IFRS 3 ”Business Combinations” and IFRS 10 ”Consolidated financial statements”.
An entity shall be consolidated if a deci-sive influence is present. Control (decisive influence) is present when Alfa Laval has:
– power over the investee, which is described as having rights to direct the activities that significantly affect the investee’s returns,
– exposure or rights to variable returns from the involvement in the investee and
– the ability to use its power over the investee to affect the amount of the investor’s returns.
A decisive influence does not need to arise purely through ownership of shares (voting rights). An investor can have a decisive influence over another entity without holding the majority of the shares. An entity must be consolidated until the day the control ceases, even if the control is present only during a limited period.
The consolidated financial statements include the parent company Alfa Laval AB (publ) and the subsidiaries in which it has a decisive influence.
The statement on consolidated financial position has been prepared in accordance with the purchase method, which means that the book value of shares in the sub-sidiaries is eliminated from the reported eq-uity in the subsidiaries at the time of their acquisition. This means that the equity in the subsidiaries at the time of acquisition is not included in the consolidated equity.
The difference between the purchase price paid and the net assets of the acquired companies is allocated to the step-up values related to each type of asset, with any re-mainder accounted for as goodwill.
During the first 12 months after the
acquisition the value of the goodwill is often preliminary. The reason to this is that experience has shown that there is some uncertainty linked to the different components of the purchase price allocation concerning:
– primarily the calculation of the allocation to different intangible step up values, that are dependent on different judgemental questions and estimations,
– the calculation of tangible step up values, that are dependent on external market valuations, which can extend in time before they can be finalised,
– adjustments of the purchase price contingent on contractual terms, that are dependent on the final size of the operating capital at the acquisition date, once this has been audited and the outcome has been approved by the parties and
– the final value of the acquired equity, which is also dependent on the audit of the acquired closing balance sheet.
Since the goodwill is a residual that emerges once all other parameters in the purchase price allocation have been established, it will be preliminary and open for changes until all other values are final.
At acquisitions where there is a goodwill it should be stated what the goodwill is relating to. Since goodwill by definition is a residual this is not always that easy. Generally speaking the goodwill is usually relating to estimated synergies in procurement, logis-tics and corporate overheads. It can also be claimed that the goodwill is relating to the acquired entity’s ability to over time recreate its intangible assets. Since the value of the intangible assets at the time of acquisition only can be calculated on the assets that exist then, no value can be attached to the patents etc. that the operations manage to create in the future partially as a replacement for the current ones and these are therefore referred to goodwill.
Goodwill and intangible assets with in-definite useful life are not amortised. These assets are instead tested for impairment both annually and when there is an indica-tion. The impairment test is made accord-ing to IAS 36 Impairment on assets.
Transaction costs are reported in net in-come. If the value of an additional purchase price is changed the difference is reported in net income. In business combinations achieved in stages the goodwill is calculated and valued when the acquirer obtains control over a business. If the acquirer previously has reported an equity interest in the company the accumulated change in value of the holding is recognised in net income at the acquisition date. Changes in holdings in subsidiaries, where the majority owner does not lose its decisive influence, are reported

90 Financial statements
in equity. This means that these transactions no longer will generate goodwill or lead to any gains or losses. In addition the trans-action will result in a transfer between owners of the parent and non-controlling interests in equity. If the non-controlling in-terest’s share of reported losses is higher than its reported share of the equity, a neg-ative non-controlling interest is reported.
Comparison distortion itemsItems that do not have any link to the normal operations of the Group or that are of a non- recurring nature are classified as comparison distortion items. In the consolidated comprehensive income statement these are reported gross as a part of the most concerned lines, but are specified separately in Note 8. To report these together with other items in the consolidated comprehensive income statement without this separate reporting in a note would have given a comparison distortion effect that would have made it difficult to judge the development of the ordinary operations from an outside viewer. Comparison distortion items affecting operating income are reported as a part of operating income, while comparison distortion items affecting the result after financial items are reported as a part of the financial net.
Comprehensive incomeAlfa Laval has chosen to report the items in other comprehensive income as a part of one statement over comprehensive income instead of reporting the result down to net income for the year in one statement and the result below this down to comprehensive income in a separate statement.
Other comprehensive income is referring to items that are not transactions with shareholders, but that before 2009 were reported directly against equity. Now they are instead reported in comprehensive income as a part of other comprehensive income. Other comprehensive income relates to for instance cash flow hedges and translation differences and deferred tax related to these.
Disclosures of interest in other entitiesInformation about interests in subsidiaries, associates, joint arrangements and unconsolidated structured entities must be disclosed in accordance with IFRS 12 ”Disclosures of interest in other entities”. The purpose with these disclosures is to enable the users of the financial reports to understand:
– the composition of the group,
– the effect of the interests on the financial statements and
– any risks with the current interests.
Substantial qualitative and quantitative disclosures must be made of each interest.
The disclosure requirements include the following:
– Financial information regarding subsidiaries with a considerable part of non-controlling interests.
– Disclosures on the judgments and estimation that have been made in judging whether an entity shall be consolidated or not and if an associate shall be accounted for or whether a joint arrangement is considered to be joint operation or a joint venture.
– Financial disclosures on interests in material associates and joint arrangements.
– Disclosures on the risks and rewards that are associated with unconsolidated structured entities and what the effect would be if the risks changed.
Disclosures relating to the company’s sharesParagraph 2a in chapter 6 of the Swedish Annual Accounts Act requires listed companies to disclose certain information relating to the company’s shares in the Board of Directors’ Report. This information is found at the end of the Board of Directors’ Report, in the “Changes in consolidated equity” and in Note 6.
Employee benefitsEmployee benefits are reported according to IAS 19 ”Employee Benefits”.
The present value of the benefit obligations in the defined benefit plans is decided through yearly actuarial calculations made by independent actuaries. The plan assets are valued at fair value. The net plan asset or liability is arrived at in the following way.
+ the present value of the defined benefit obligation at December 31
- the fair value of the plan assets at December 31
= a net liability if positive / a net asset if negative
If the calculation per plan gives a negative amount, thus resulting in an asset, the amount to be recognised as an asset for this particular plan is the lower of the two following figures:
– The above net negative amount.
– The present value of any economic benefits available in the form of refunds from the plan or reductions in future contributions to the plan. This is referred to as the asset ceiling.
The items that relate to the vesting of defined benefit pensions and gains and losses that arise when settling a pension liability and the financial net concerning the defined benefit plan are reported in the income statement above net income. Past service
costs are recognised in the income statement already when the plan is amended or curtailed.
Actuarial gains and losses are accounted for currently in other comprehensive income. Changes in the obligations that relate to changes in actuarial assumptions are ac-counted for in other comprehensive income. None of these actuarial items will ever be reported in operating income, but will instead remain in other comprehensive income.
The return on plan assets is calculated with the same interest rate as the discount rate. The difference between the actual re-turn on plan assets and the interest income in the previous sentence is reported in other comprehensive income.
The plan assets are specified on different types of assets.
Sensitivity analysis must be made concern-ing reasonable changes in all assumptions made when calculating the pension liability.
The difference between short and long term remunerations focuses on when the commitment is expected to be settled rather than the link to the employee’s vesting of the commitment.
Termination benefits are accounted for at the earliest of the following – the time when the benefit offer cannot be withdrawn, alter-natively in accordance with IAS 37 as a part of for instance restructuring the operations.
For Swedish entities the actuarial calcu-lations also include future payments of special salary tax. The Swedish tax on re-turns from pension funds is reported cur-rently as a cost in the profit and loss and are not included in the actuarial calculation for defined benefit pension plans.
The discount rate used to calculate the obligations is determined based on the market yields in each country at the closing date on high quality corporate bonds with a term that is consistent with the estimated term of the obligations. In countries that lack a deep market in such bonds the country’s government bonds are used instead.
The costs for defined contribution plans are reported in Note 6.
The Swedish ITP plan is a multi-employer plan insured by Alecta. It is a defined benefit plan, but since the plan assets and liabilities cannot be allocated on each employer it is reported as a defined contribution plan ac-cording to item 30 in IAS 19. The construc-tion of the plan does not enable Alecta to provide each employer with its share of the assets and liabilities or the information to be disclosed. The cost for the plan is reported together with the costs for other defined contribution plans in Note 6. Alecta reported a collective consolidation level at December 31, 2014 of 143 (148) percent. The collective consolidation level is defined as the fair value of Alecta’s plan assets in percent of the insured pension commitments calculated

91Financial statements
according to Alecta’s actuarial assumptions, which are not in accordance with IAS 19. Such a surplus can be distributed among the employers or the beneficiaries, but there is no agreement concerning this that enables the company to report a receivable on Alecta.
Events after the closing dateEvents after the closing date are reported according to IAS 10 under a separate heading in the Board of Directors’ report.
Financial instrumentsThe reporting of financial instruments is governed by the following four accounting and financial reporting standards:
– IAS 39 Financial Instruments: Recognition and Measurement,
– IAS 32 Financial Instruments: Presentation,
– IFRS 7 Financial Instruments: Disclosures and
– IFRS 13 Fair Value Measurement.
IAS 39 means that financial derivatives, holdings of bonds and external shares are adjusted to fair value. IFRS 7 contains expanded disclosure requirements related to the significance of financial instruments for the company’s financial position and performance and the nature and extent of risks arising from financial instruments.
IFRS 13 describes how a fair value is es-tablished when such value is to be or may be used in accordance with each IFRS standard. Disclosures must be made to explain what valuation models that are used and what information that is used in these models and which effects the valua-tion has caused in the result.
Both IAS 39 and IFRS 7 formally contain a considerable amount of information that should be presented. According to IFRS 7.B3 the company however should decide how much detail it provides in order not to overburden the financial statements with excessive details.
Financial assets are classified into four different portfolios:
– Financial assets at fair value through profit or loss,
– Held to maturity investments,
– Loans and receivables and
– Available for sale financial assets.
The Financial assets at fair value through profit or loss are split on:
– Designated upon initial recognition,
– Held for trading and
– Derivatives used for hedging.
Financial liabilities are classified into two portfolios:
– Financial liabilities at fair value through profit or loss and
– Loans.
The Financial liabilities at fair value through profit or loss are split on:
– Designated upon initial recognition,
– Held for trading and
– Derivatives used for hedging.
The classification into different portfolios has a direct impact on the valuation of the instruments, i.e. if the instrument is valued at fair value or amortised cost. “Loans and receivables”, “Held to maturity investments” and “Loans” are valued at amortised cost, whereas “Financial assets and Financial liabilities at fair value through profit or loss” and “Available for sale financial assets” are valued at fair value. Derivatives are always classified in the portfolios “Financial assets and Financial liabilities at fair value through profit or loss”.
The amortised cost is normally equal to the amount recognised upon initial recognition, less any principal repayments and plus or minus any effective interest adjustments.
Prepaid costs, prepaid income and ad-vances from customers are not defined as financial instruments since they will not re-sult in future cash flows.
Disclosures must be made on the methods and, when a valuation technique is used, the assumptions applied in determining the fair value of each class of financial assets and liabilities. The methods are to be clas-sified in a hierarchy of three levels:
1. Quoted prices in active markets,
2. Other inputs than quoted prices that are directly observable (prices) or indirectly observable (derived from prices) and
3. Unobservable market data.
The fair values of holdings of bonds are arrived at using market prices according to level 1. The effect of the measurement at fair value is reported in net income. The fair value adjustment of these instruments is reflected directly on the item bonds in the statement of financial position.
The fair values of shares in external companies are arrived at using market prices according to level 1 or other inputs according to level 2. The effect of the measurement at fair value is reported in other comprehensive income. The fair value ad-justment of these instruments is reflected directly on the item other long-term securities in the statement of financial position.
The fair values of the Group’s currency forward contracts, currency options, interest-
rate swaps, metal forward contracts and electricity futures are arrived at using market prices according to level 1. The fair value changes are arrived at by comparing the conditions of the derivative entered into with the market price for the same instrument at the closing date and with the same maturity date. The effect of the measurement at fair value is reported in other comprehensive income if the derivative constitutes an ef-fective cash flow hedge and otherwise on the concerned line above net income. The fair value adjustment of these instruments is reported as derivative assets or derivative liabilities in the statement of financial position.
For each class of financial instruments disclosures shall be made on credit risk and an analysis of financial assets that are past due or impaired. Within Alfa Laval credit risk is in reality only related to ac-counts receivable. The disclosures just mentioned are therefore to be found in Note 21. The factors to be taken into ac-count when providing for bad debts are:
– If the customer despite reminders does not pay, in spite of the fact that the customer has not raised any objections against the invoice or part of the invoice,
– For how long the invoice has been past due,
– If the customer has cancelled their payments,
– If the customer has asked for composition and
– If the customer has filed for bankruptcy.
Based on this the best estimate based on past experience is made on which amount that is probable to be received and the difference is provided for as unsecure.
Only at a final loss the receivable is written off.
Group contributions to and from the parent companyThe parent company is accounting for group contributions according to the alternative rule in RFR 2 issued by the Council for Financial Reporting in Sweden. This means that both received and given group contributions are reported as appropriations in the income statement.
Hedge accountingAlfa Laval only applies two types hedge accounting: cash flow hedges and hedges of net investments in foreign operations.
Cash flow hedgesAlfa Laval has implemented documentation requirements to qualify for hedge accounting on derivative financial instruments.
The effect of the fair value adjustment of derivatives is reported as a part of other

92 Financial statements
comprehensive income for the derivatives where hedge accounting is made (accord-ing to the cash flow hedging method) and above net income only when the underlying transaction has been realised. Hedge ac-counting requires the derivative to be effec-tive within an 80 – 125 percent range. For the part of an effective derivative that ex-ceeds 100 percent effectiveness the fair value adjustment is reported above net in-come. For the derivatives where hedge ac-counting is not made the fair value valua-tion is reported above net income. The fair value adjustment of derivatives is reported separately from the underlying instrument as a separate item called derivative assets/derivative liabilities in the statement of finan-cial position.
Hedges of net investments in foreign operationsIn order to finance acquisitions of foreign operations loans are raised, if possible, in the same currency as the net investment. The loans thereby constitute a hedge of the net investment in each currency. Exchange rate differences relating to these loans are therefore booked to other comprehensive income.
Income TaxesIncome taxes are reported in accordance with IAS 12 ”Income Taxes”.
Current tax is the amount of income taxes payable (recoverable) in respect of the tax-able profit (tax loss) for a period. Current tax liabilities (receivables) for the current and prior periods are measured at the amount expected to be paid to (recovered from) the tax authorities, using the tax rates (and tax laws) that have been enacted or sub-stantively enacted by the closing date. In essence, this means that current tax is cal-culated according to the rules that apply in the countries where the profit was generated.
Deferred tax liabilities are the amounts of income taxes payable in future periods in respect of taxable temporary differences. Deferred tax liabilities are recognised for all taxable temporary differences, except for goodwill.
Deferred tax assets are the amounts of income taxes recoverable in future periods in respect of: (a) deductible temporary dif-ferences; (b) the carry-forward of unused tax losses; and (c) the carry-forward of unused tax credits. Deferred tax assets are recognised for all deductible temporary differences to the extent that it is probable (>50 percent) that taxable profit will be available against which the deductible temporary difference can be utilised. Deferred tax assets are recognised for the carry-forward of unused tax losses and unused tax credits to the extent that it is probable (>50 percent) that
future taxable profit will be available against which the unused tax losses and unused tax credits can be utilised.
Deferred tax assets and liabilities are measured at the tax rates that are expected to apply to the period when the asset is re-alised or the liability is settled, based on tax rates (and tax laws) that have been enacted or substantively enacted by the closing date.
If it is not any longer probable that sufficient taxable profits will be available against which a deferred tax asset can be utilised, then the deferred tax asset is reduced accordingly.
InventoriesThe Group’s inventory has been accounted for after elimination of inter-company gains. The inventory has been valued according to the “First-In-First-Out” (FIFO) method at the lowest of cost or net realisable value, taking into account obsolescence.
This means that raw material and pur-chased components normally are valued at the acquisition cost, unless the market price has fallen. Work in progress is valued at the sum of direct material and direct labour costs with a mark-up for the product’s share in capital costs in the manufacturing and other indirect manufacturing costs based on a forecasted assumption on the capac-ity utilisation in the factory. Finished goods are normally valued at the delivery value (i.e. at cost) from the factory if the delivery is forthcoming. Spare parts that can be in the inventory during longer periods of time are normally valued at net realisable value.
Joint venturesJoint ventures are consolidated according to IFRS 11 ”Joint arrangements”. Joint arrangements are defined as a contractual arrangement where two or more parties have a joint decisive influence.
It is crucial to be able to judge whether a party has control over another party, that is decisive influence or if it rather is a sub-stantial or common influence. If it is the latter, then it is a so called joint arrangement, which could be either:
– a joint operation or
– a joint venture.
Jointly owned assets and joint activities are called joint operations. Each owner or party accounts for his share of assets, liabilities, revenues and costs.
Joint ventures are no longer allowed to be consolidated according to the propor-tional consolidation method, but instead the equity method must be used. This means that the interest is accounted for on one line in the consolidated statement of financial position and that the share of the result is accounted for on one line in the consoli-dated statement of comprehensive income.
The application of the equity method means that the net income before tax in the joint ventures will be booked into one line in other operating income and the corre-sponding tax on the tax line. The counter entry is an increase or decrease of the value of shares in joint ventures. The sales volume and other result items and the balance items in the joint ventures will no longer be reported in the statements over consolidated com-prehensive income and consolidated financial position in any of the two owner companies.
LeasingLeasing is accounted for in accordance with IAS 17 ”Leases”.
When Alfa Laval is the lessor, leased assets that are classified as financial leases are accounted for as a financial receivable from the lessee in the statement on financial po-sition. The leasing fee received from the lessee is accounted for as financial income calcu-lated as interest on the outstanding receiv-able and as amortisation of the receivable.
When Alfa Laval is the lessee, leased assets that are classified as financial leases are accounted for as capitalised assets and a corresponding financial payable to the lessor in the statement on financial position. The leasing fee to the lessor is accounted for as financial cost calculated as interest on the outstanding payable and as amortisation of the payable. Depreciation according to plan is done in the same manner as pur-chased assets.
Leased assets classified as operational leases are not capitalised. The leasing fees are expensed as incurred.
Long-term construction projectsRevenue for projects is recognised using the percentage of completion method in IAS 11 ”Construction Contracts”. This means that when the outcome of a construction project can be calculated reliably, the revenue and the costs related to the project are recognised in relation of the percentage of completion at the closing date. An estimated loss is recognised immediately. The percentage of completion for a construction project is normally established through the relationship between incurred project costs for work performed at the closing date and the estimated total project costs.
Disclosures shall be made for:
– the amount of recognised project sales revenue,
– the aggregated amount of costs incurred and recognised profits less recognised losses,
– retentions,
– the gross amount due from customers for work in progress,
– advances and

93Financial statements
– the gross amount due to customers for work in progress.
The amount of recognised project sales revenue is the amount recognised in consolidated comprehensive income as a reflection of the percentage of completion of the projects. It has nothing to do with the volume of progress billing in the period. This figure shows how much of the net invoicing of the Group that originates from project sales.
The aggregated amount of costs incurred and recognised profits less recognised losses shows the total volume of work per-formed on ongoing projects at the closing date. It has nothing to do with the recog-nised costs in the consolidated compre-hensive income statement.
Retentions are amounts of progress billing that are not paid according to the contract until conditions specified in the contract have been satisfied or until defects have been rectified. This has a negative effect on the profitability of the project. Progress billing is amounts billed for work performed on a project whether or not they have been paid by the customer.
The gross amount due from customers for work in progress on plant projects is the net amount of:
1. + costs incurred
2. + recognised profits
3. - recognised losses
4. - progress billing
for each project in progress where the net of the first three items is higher than item 4. The figure shows how much progress billing is lacking behind the work performed.
Advances are amounts received from the customer before the related work is performed and are usually very important for the overall profitability of the project.
The gross amount due to customers for work in progress on plant projects is the net amount of:
1. + costs incurred
2. + recognised profits
3. - recognised losses
4. - progress billing
for each project in progress where the net of the first three items is smaller than item 4. The figure shows how much progress billing is ahead of the work performed.
Non-current assets (tangible and intangible)Assets have been accounted for at cost, net after deduction of accumulated depreciation according to plan. Depreciation according to plan is based on the assets’ acquisition values and is calculated according to the estimated useful life of the assets.
The following useful lives have been used:
Tangible:
Computer programs, computers 3.3 years
Office equipment 4 years
Vehicles 5 years
Machinery and equipment 7–14 years
Land improvements 20 years
Buildings 25–33 years
Intangible:
Patents and unpatented know-how 10–20 years
Trademarks 10–20 years
Licenses, renting rights and similar rights 10–20 years
The depreciation is made according to the straight-line method.
Any additions to the purchase price in connection with investments in non-current assets or acquisitions of businesses are amortised over the same period as the original purchase price. This means that the time when the asset is fully depreciated is identical regardless of when payments are made. This is a reflection of the fact that the estimated useful life of the asset is the same.
Upon sale or scrapping of assets, the results are calculated in relation to the net book value after depreciation according to plan. The result on sales is included in op-erating income.
Impairment of assetsWhen there are indications that the value of a tangible asset or an intangible asset with a definite useful life has decreased, there is a valuation made if it must be written down according to IAS 36 ”Impairment of Assets”. If the reported value is higher than the recoverable amount, a write down is made that burdens net income. When assets are up for sale, for instance items of real estate, a clear indication of the recoverable amount is received that can trigger a write down.
Goodwill and intangible assets with in-definite useful life are not amortised. These assets are instead tested for impairment both annually and when there is an indication. The impairment test is made according to IAS 36 ”Impairment on assets”.
The recoverable amount for goodwill and intangible assets with indefinite useful life is determined from the value in use based on discounted future cash flows. For other assets the recoverable amount is normally determined from the fair value less costs to sell based on an observable market price.
For the impairment testing of goodwill, three of Alfa Laval’s operating segments, the divisions “Equipment”, “Process Tech-nology” and “Marine & Diesel” have been identified as the cash-generating units within Alfa Laval. Technically a recently ac-
quired business activity could be followed independently during an initial period, but acquired businesses tend to be integrated into the divisions at a fast rate. This means that the independent traceability is lost fairly soon and then any independent measure-ment and testing becomes impracticable. The net present value is based on the pro-jected EBITDA figures for the next twenty years, less projected investments and changes in operating capital during the same period. The used discount rate is the pre-tax weighted average cost of capital (WACC). The growth rate for the divisions during the period is the perceived expected average industry growth rate. No terminal value has been calculated since this would render a very large and uncertain value, which could give an erroneous impression that no im-pairment exists.
Non-current Assets Held for Sale and Discontinued OperationsThe Group is applying IFRS 5 ”Non-current Assets Held for Sale and Discontinued Operations”. IFRS 5 specifies the accounting for assets held for sale and the disclosures to be made for discontinued operations.
Assets held for sale are to be measured at the lower of the carrying amount and fair value, less sales costs. No depreciation of such assets is made. An asset held for sale is an asset whose carrying amount will be recovered basically through a sale rather than through continuing use. It must be available for immediate sale in its current condition. The sale must be highly probable, that is a decision must have been made and an active sales effort must have been initiated. The sale must be expected to be finalised within one year. Non-current as-sets are reclassified to current assets and presented separately in the statement on financial position.
Objectives, policies and processes for managing capitalIAS 1 ”Presentation of Financial Statements” paragraphs 134 and 135 contain disclosure requirements on the company’s objectives, policies and processes for managing capital. This information is disclosed in a separate section after the description of the accounting principles.
Other operating income and other operating costsOther operating income relates to for instance commission, royalty and license income. Other operating costs refer mainly to restructuring costs and to royalty costs.
Comparison distortion items that affect the operating income are reported in other operating income and other operating costs.

94 Financial statements
ProvisionsThe Group is applying IAS 37 ”Provisions, Contingent Liabilities and Contingent Assets” for the reporting of provisions, contingent liabilities and contingent assets.
A provision is recognised when and only when:
– there is a present legal or constructive obligation as a result of past events;
– it is probable that a cost will be incurred in settling the obligation; and
– a reliable estimate can be made of the amount of the obligation.
The amount recognised as a provision is the best estimate of the cost required to settle the present obligation at the closing date.
In measuring the provision:
– risks and uncertainties are taken into account;
– the provisions are discounted, where the effect of the time value of money is material. When discounting is used, the increase of the provision over time is recognised as an interest cost;
– future events, such as changes in law and technology, are taken into account where there is sufficient objective evidence that they will occur; and
– gains from the expected disposal of assets are not taken into account, even if the expected disposal is closely linked to the event giving rise to the provision.
If a reimbursement of some or all of the costs to settle a provision is expected (e.g. through insurance contracts, indemnity clauses or supplier’s warranties), the reimbursement is recognised:
– when and only when, it is virtually certain that the reimbursement will be received if the obligation is settled. The amount recognised for the reimbursement must not exceed the amount of the provision; and
– as a separate asset (gross). In the consolidated comprehensive income statement, however, the income related to the reimbursement is netted against the cost for the provision.
Provisions are reviewed at each closing date and adjusted to reflect the current best estimate. If it is no longer probable that a payment to settle the obligation will be incurred, the provision is reversed.
A provision must only be used for the purpose it was originally recognised for. Provisions are not recognised for future operating losses. An expectation of future operating losses is though an indication that certain assets of the operation may be impaired. If a contract is onerous, the pre-
sent obligation under the contract is recog-nised and measured as a provision, once the assets used in order to finalize the con-tract have been tested for impairment.
A provision for restructuring costs is rec-ognised only when the general recognition criteria are met. A constructive obligation to restructure arises only when there is:
– a detailed formal plan for the restructuring, identifying at least:
a) the business or part of a business concerned;
b) the principal locations affected;
c) the location, function and approximate number of employees who will be compensated for terminating their services;
d) the costs that will be undertaken; and
e) when the plan will be implemented; and
– a valid expectation in those affected that the restructuring will be carried out.
A management or board decision to restructure does not give rise to a constructive obligation at the closing date unless the company has, before the closing date:
– started to implement the restructuring plan ; or
– communicated the restructuring plan to those affected by it in a sufficiently specific manner to raise a valid expectation in them that the restructuring will happen.
When a restructuring involves the sale of an operation, no obligation arises for the sale until the company is committed to the sale, i.e. through a binding sales agreement.
A restructuring provision only includes the direct costs arising from the restructuring, which are those that are both:
– necessarily entailed by the restructuring; and
– not associated with the ongoing activities of the company.
Research and developmentResearch costs are charged to the result in the year in which they are incurred. Development costs are charged to the result in the year in which they are incurred provided that they do not fulfil the conditions for instead being capitalised according to IAS 38 ”Intangible Assets”.
Revenue recognitionRevenue recognition is made according to IAS 18 ”Revenue” and IAS 11 ”Construction Contracts”.
Revenues from sale of goods, services and projects are reported as “Net sales” in the statement of consolidated comprehen-sive income.
Sale of goodsRevenue from sale of goods is recognised when all of the following conditions have been fulfilled:
– the seller has transferred the significant risks and rewards of ownership of the goods to the buyer;
– the seller retains neither continuing managerial involvement to the degree usually associated with ownership nor effective control over the goods sold;
– the amount of revenue can be measured reliably;
– it is probable that the seller will get paid; and
– the costs incurred or to be incurred related to the transaction can be measured reliably.
The revenue recognition is usually governed by the delivery terms used in the sale. Net sales are referring to sales value less sales taxes, cancellations and discounts.
Sale of servicesTo the extent that Alfa Laval also delivers services the three last conditions above apply together with:
– the stage of completion at the closing date can be measured reliably.
Project salesRevenue for projects is recognised using the percentage of completion method in IAS 11 ”Construction Contracts”, see above under “Long-term construction projects”.
Operating segmentsIFRS 8 means that the reporting of operating segments must be made according to how the chief operating decision maker monitors the operations, which may deviate from IFRS. Furthermore information according to IFRS for the company as a whole must be given about products and services as well as geographical areas and information about major customers.
The difference between the operating in-come for the operating segments and the operating income according to IFRS for the company as a whole is explained by two reconciliation items.
Alfa Laval’s operating segments are the divisions. The chief operating decision maker within Alfa Laval is its Board of Directors.
Transactions in foreign currenciesReceivables and liabilities denominated in foreign currencies have been valued at year-end rates of exchange.
Within the Group, exchange gains and losses on loans denominated in foreign currencies that finance acquisitions of foreign subsidiaries are transferred to other compre-

95Financial statements
hensive income as foreign currency trans-lation adjustments if the loans act as a hedge to the acquired net assets. There they offset the translation adjustments resulting from the consolidation of the foreign subsidiaries. In the parent company, these exchange differences are reported above net income.
IAS 21 ”The Effects of Changes in Foreign Exchange Rates” covers among other things the existence of functional currencies. Almost all of Alfa Laval’s subsidiaries are affected by changes in foreign exchange rates for their procurement within the Group. They do however usually sell in their local currency and they have more or less all of their non-product related costs and their personnel related costs in their local currency.
This means that none of Alfa Laval’s sub-sidiaries qualify for the use of another func-tional currency than the local currency, with the following exception. Subsidiaries in highly inflationary countries report their closings in the functional hard currency that is valid in each country, which in all cases is USD. During 2014 Venezuela is regarded as a highly inflationary country.
In the consolidation, the foreign subsidiaries have been translated using the current method. This means that assets and liabilities are translated at closing exchange rates and income and expenses are translated at the year’s average exchange rate. The translation difference that arises is a result of the fact that net assets in foreign com-panies are translated at one rate at the be-ginning of the year and another at year-end and that the result is translated at average rate. The translation differences are part of other comprehensive income.
Recently issued accounting pronouncementsInternational Accounting Standards Board (IASB) has issued the following new or revised accounting pronouncements, which may be applicable on Alfa Laval and are effective for fiscal years beginning on or after January 1, 2015. Alfa Laval has chosen not to make any early adoption of any of these pronouncements.
IAS 19IAS 19 ”Employee Benefits” has been amended. The amendment relates to disclosure requirement for employee contributions to defined benefit plans.
The amendment to IAS 19 has been adopted by the European Union and be-comes effective for financial years beginning on or after January 1, 2015. The standard must be applied retroactively in accordance with IAS 8. Early application is allowed.
Alfa Laval’s assessment is that the amendments to IAS 19 will have limited
impact on the financial statements of Alfa Laval and the disclosures in them.
IFRS 9IFRS 9 ”Financial Instruments: Recognition and Measurement” is the first step of a complete revision of the current standard IAS 39. The standard means a reduction of the number of valuation categories for financial assets and contains the main categories reported at cost (amortised cost) and fair value through profit or loss. IFRS 9 has not yet been adopted by the European Union.
Alfa Laval’s assessment is that IFRS 9 will mean a reallocation of the financial assets on fewer categories, but otherwise will have limited impact on the financial statements of Alfa Laval and the disclosures in them.
IFRS 15IFRS 15 ”Revenue from Contracts with Customers” covers how revenue recognition on contracts with customers shall be made. IFRS 15 supersedes mainly IAS 11 “Construction Contracts” and IAS 18 “Revenue”. Revenue recognition is based on five steps:
1. Identify the contract with a customer.
2. Identify the performance obligations in the contract.
3. Determine the transaction price.
4. Allocate the transaction price to the performance obligations in the contract.
5. Recognise revenue when the entity satisfies a performance obligation.
Two or more contracts entered into at or near the same time with the same customer are accounted for as a single contract if:
– the contracts are negotiated as a package and/or
– the amount of consideration to be paid in the contracts are linked to each other and/or
– the goods or services in the contracts are a single performance obligation.
A contract modification is treated as a sepa-rate contract if added products or services:
– are distinct and
– have a stand alone selling price.
An entity shall recognise the revenue when it has satisfied the performance obligation by transferring control over a promised good or service to the customer.
Performance obligations can be satisfied either over time or at a point in time.
If an entity transfers control of a good or service over time and therefore satisfies a performance obligation over time and rec-ognises revenue over time if:
– the customer simultaneously receives and consumes the benefits at the same time as the entity performs, or
– the customer controls the asset while the entity creates of enhances the asset, or
– the entity’s performance does not create an asset with an alternative use for the entity and there is an enforceable right to payment for the performance completed.
In order to establish the performance over time the entity can use a method based on output (survey/investigation, achieved milestones or delivered units) or a method based in input (incurred costs, worked hours or machine hours).
If a performance obligation is not satisfied over time it is satisfied at a point in time. To establish the point in time when the customer obtains control of a promised asset and the entity satisfies a performance obligation the following control criteria must be considered:
– The entity has a present right to payment for the asset.
– The customer has legal title to the asset.
– The customer has physical possession of the asset.
– The customer has the significant risks and rewards of ownership of the asset.
– The customer has accepted the asset.
IFRS 15 has not yet been adopted by the European Union. There are three alterna-tives for the transition with varying degrees of retroactivity. Early application is allowed.
Alfa Laval’s assessment is that IFRS 15 will have limited impact on the financial statements of Alfa Laval and the disclo-sures in them, since it does not mean any real change in the revenue recognition but only in how it is arrived at.
International Accounting Standards Board (IASB) has not issued any financial reporting interpretations developed by the International Financial Reporting Interpretations Com-mittee (IFRIC), which may be applicable on Alfa Laval and are effective for fiscal years beginning on or after January 1, 2015.
Otherwise Alfa Laval will further evaluate the effects of the application of the new or revised accounting standards or interpreta-tions before each time of application.

96 Financial statements
Objectives, policies and processes for managing capitalAlfa Laval defines its managed capital as the sum of consolidated net debt and equity including the part that is attributable to non-controlling interests. At the end of 2014 the managed capital was SEK 32,270 (18,773) million.
The Group’s objective when managing capital is to safeguard the Group’s ability to continue as a going concern and provide an adequate return for shareholders and benefits for other stakeholders.
When managing the capital the Group monitors several measures including:
Measure
GoalTarget
standardTarget not set
Outcome Average over last
2014 2013 * 3 years 5 years 8 years
Invoicing growth per year ** ≥8% 17.7% 0.4% 7.5% 6.9% 9.6%
Adjusted EBITA margin ** 15% 16.8% 16.5% 16.6% 17.4% 18.4%
Return on capital employed ≥20% 20.5% 26.4% 24.8% 28.6% 35.6%
Net debt to EBITDA ≤2,0 2.45 0.49 1.2 0.8 0.6
Cash flow from operating activities including investments in fixed assets *** 10% 12.9% 12.5% 11.9% 12.1% 12.8%
Investments *** 2.0% 1.7% 1.7% 1.7% 1.8% 1.9%
Return on equity X 17.6% 20.4% 20.3% 21.6% 27.5%
Solidity X 30.8% 46.3% 39.5% 42.5% 41.2%
Debt ratio X 0.88 0.16 0.45 0.30 0.26
Interest coverage ratio X 18.3 22.1 21.2 25.6 24.2
Credit rating X BBB+ A-
*Restated to IFRS 11. ** average over a business cycle *** in % of sales
These measures are connected to each other as communicating vessels. This means that if actions are taken that primarily aim at a certain measure they will also have an impact on other measures to a varying degree. It is therefore important to consider the whole picture.
During 2014 Alfa Laval has adjusted the goal for the return on capital employed from ≥25 percent to ≥20 percent to reflect the very substantial step up and goodwill values that have been added through the two major acquisitions in the last couple of years. During 2014 the debt ratio has also been replaced by net debt to EBITDA as the target standard for the capital structure, with a target of ≤2.0.
In order to maintain a good capital structure the Group may for instance raise new loans or amortise on existing loans, adjust the amount of dividends paid to shareholders, return capital to shareholders, repurchase own shares, issue new shares or sell assets.
As examples on the Group’s active work with managing its capital the following can be mentioned:
– Two tranches of corporate bonds totalling EUR 800 million were issued in September 2014.
– Commercial papers of nominally SEK 1,000 million with a duration of 3-5 months has been issued since the spring in 2014.
– The bilateral term loans with Swedish Export Credit from June 2011 and June 2014.
– The senior credit facility with a new banking syndicate from June 2014.
– The finance contracts with the European Investment Bank from September 2009 and December 2013, where bilateral term loans were called for in March 2011 and in June 2014 respectively.
– The private placement in the U.S. in 2006.
– The repurchases of shares made during 2007, 2008 and 2010.
The repurchases of shares should be viewed in light of that the consolidated cash flows from operations are large enough to finance the build-up of working capital and the mid-size acquisitions of businesses that have been made as well as the dividend to the shareholders.
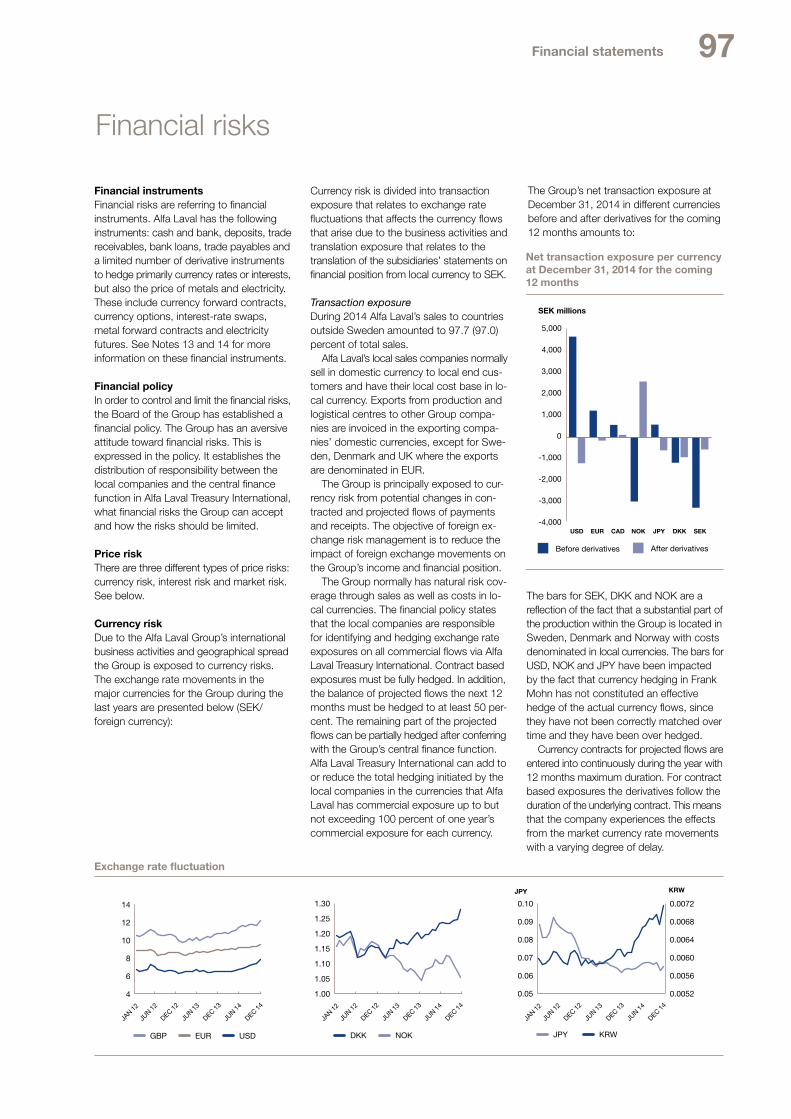
97Financial statements
Financial risks
Financial instrumentsFinancial risks are referring to financial instruments. Alfa Laval has the following instruments: cash and bank, deposits, trade receivables, bank loans, trade payables and a limited number of derivative instruments to hedge primarily currency rates or interests, but also the price of metals and electricity. These include currency forward contracts, currency options, interest-rate swaps, metal forward contracts and electricity futures. See Notes 13 and 14 for more information on these financial instruments.
Financial policyIn order to control and limit the financial risks, the Board of the Group has established a financial policy. The Group has an aversive attitude toward financial risks. This is expressed in the policy. It establishes the distribution of responsibility between the local companies and the central finance function in Alfa Laval Treasury International, what financial risks the Group can accept and how the risks should be limited.
Price riskThere are three different types of price risks: currency risk, interest risk and market risk. See below.
Currency riskDue to the Alfa Laval Group’s international business activities and geographical spread the Group is exposed to currency risks. The exchange rate movements in the major currencies for the Group during the last years are presented below (SEK/foreign currency):
4
6
8
10
12
14
Exchange rate fluctuation
1.00
1.05
1.10
1.15
1.20
1.25
1.30
0.05
0.06
0.07
0.08
0.09
0.10
0.0052
0.0056
0.0060
0.0064
0.0068
0.0072
JAN 12
JUN 12
DEC 12
JUN 13
DEC 13
JUN 14
DEC 14
JAN 12
JUN 12
DEC 12
JUN 13
DEC 13
JUN 14
DEC 14
JAN 12
JUN 12
DEC 12
JUN 13
DEC 13
JUN 14
DEC 14
GBP EUR USD DKK NOK KRW
KRW
JPY
JPY
Currency risk is divided into transaction exposure that relates to exchange rate fluctuations that affects the currency flows that arise due to the business activities and translation exposure that relates to the translation of the subsidiaries’ statements on financial position from local currency to SEK.
Transaction exposureDuring 2014 Alfa Laval’s sales to countries outside Sweden amounted to 97.7 (97.0) percent of total sales.
Alfa Laval’s local sales companies normally sell in domestic currency to local end cus-tomers and have their local cost base in lo-cal currency. Exports from production and logistical centres to other Group compa-nies are invoiced in the exporting compa-nies’ domestic currencies, except for Swe-den, Denmark and UK where the exports are denominated in EUR.
The Group is principally exposed to cur-rency risk from potential changes in con-tracted and projected flows of payments and receipts. The objective of foreign ex-change risk management is to reduce the impact of foreign exchange movements on the Group’s income and financial position.
The Group normally has natural risk cov-erage through sales as well as costs in lo-cal currencies. The financial policy states that the local companies are responsible for identifying and hedging exchange rate exposures on all commercial flows via Alfa Laval Treasury International. Contract based exposures must be fully hedged. In addition, the balance of projected flows the next 12 months must be hedged to at least 50 per-cent. The remaining part of the projected flows can be partially hedged after conferring with the Group’s central finance function. Alfa Laval Treasury International can add to or reduce the total hedging initiated by the local companies in the currencies that Alfa Laval has commercial exposure up to but not exceeding 100 percent of one year’s commercial exposure for each currency.
The Group’s net transaction exposure at December 31, 2014 in different currencies before and after derivatives for the coming 12 months amounts to:
SEKDKKJPYNOKCADEURUSD
Net transaction exposure per currency at December 31, 2014 for the coming 12 months
Before derivatives After derivatives
SEK millions
-4,000
-3,000
-2,000
-1,000
0
1,000
2,000
3,000
4,000
5,000
The bars for SEK, DKK and NOK are a reflection of the fact that a substantial part of the production within the Group is located in Sweden, Denmark and Norway with costs denominated in local currencies. The bars for USD, NOK and JPY have been impacted by the fact that currency hedging in Frank Mohn has not constituted an effective hedge of the actual currency flows, since they have not been correctly matched over time and they have been over hedged.
Currency contracts for projected flows are entered into continuously during the year with 12 months maximum duration. For contract based exposures the derivatives follow the duration of the underlying contract. This means that the company experiences the effects from the market currency rate movements with a varying degree of delay.

98 Financial statements
If the currency rates between SEK and the most important foreign currencies are changed by +/- 10 % it has the following effect on operating income, if no hedging measures are taken:
Effect on operating income by exchange rate fluctuations excluding hedging measures
ConsolidatedSEK millions 2014 2013Exchange rate change against SEK + 10% - 10% + 10% - 10%
USD 468 -468 192 -192EUR 123 -123 96 -96CAD 56 -56 52 -52NOK -301 301 35 -35DKK -120 120 -95 95JPY 57 -57 2 -2Other 74 -74 40 -40Total 357 -357 322 -322
Outstanding currency forward contracts and currency options for the Group amounted to the following at the end of the year:
Outstanding currency forward contracts and currency options
ConsolidatedMillions 2014 2013
Original
currency SEKOriginal
currency SEKOutflows: USD -752 -5,907 -590 -3,844EUR -163 -1,551 -526 -4,715CAD -49 -331 -26 -155CHF -6 -46 -1 -9JPY -16,978 -1,107 -1,402 -87RUB -201 -27 -13 -3GBP -3 -42 – –Other -17 -19Total -9,028 -8,832Inflows: SEK 1,426 1,426 2,926 2,926DKK 408 523 605 727NOK 6,035 6,357 4,771 5,062CNY – – 151 162SGD 9 52 16 84GBP – – 10 103AUD 17 109 8 47
Other 0 0Total 8,467 9,111
Translation exposureWhen the subsidiaries’ statements of finan-cial position in local currency are translated into SEK a translation difference arises that is due to the current year being translated at a different closing rate than last year and that the comprehensive income statement is translated at the average rate during the year whereas the statement of financial position is translated at the closing rate at December 31. The translation differences are reported against other comprehensive income. The translation exposure consists of the risk that the translation difference represents in terms of impact on compre-hensive income. The risk is largest for the currencies where the Group has the largest net assets and where the exchange rate movements against SEK are largest. The Group’s net assets or liabilities for the major currencies are distributed as follows:
-10,000
-8,000
-6,000
-4,000
-2,0000
2,000
4,000
6,000
8,000
10,000
12,000
14,000
Net assets
Net liabilities
SEK millions N
OK
SE
K
DK
K
INR
CN
Y
BR
L
JPY
HK
D
KR
W
CA
D
PLN
Oth
er
US
D
EU
R
Net assets and liabilities by currency

99Financial statements
The translation differences are a central responsibility and are managed by distributing the loans on different currencies based on the net assets in each currency and through cross currency swaps. Loans taken in the same currency as there are net assets in the Group, decrease these net assets and thereby decrease the translation exposure.
These hedges of net investments in for-eign operations work in the following way. Exchange gains and losses on loans de-nominated in foreign currencies that finance acquisitions of foreign subsidiaries are re-ported as a part of other comprehensive income if the loans act as a hedge to the acquired net assets. In other comprehensive income they offset the translation adjust-ments resulting from the consolidation of the foreign subsidiaries. In the Group, net exchange differences of SEK -1,033 (-83) million relating to debts in foreign currencies have been charged to other comprehensive income as hedges of net investments in foreign operations. The loans that hedge net investments in foreign operations are denominated in EUR and USD since these foreign currencies have the largest impact on the statement of financial position. Since the Group uses part of its cash flows to amortise the loans in order to improve the financial net, the extent of this hedge tends to decrease over time. A change in the net assets of the foreign subsidiary over time can have the same effect.
Interest riskBy interest risk is meant how changes in the interest level affect the financial net of the Group and how the value of financial instruments vary due to changes in market interest rates. The Group attempts to manage interest rate risk by matching fixed interest periods of financial assets and liabilities and through the use of derivative financial instruments such as interest rate swaps.
The financial policy states that the interest rate risk and duration are measured by each main currency. The minimum interest duration for the loans should be 10 months and the maximum interest duration should be 24-48 months depending on the currency the loan is raised in according to the policy.
The senior credit facility, the bilateral term loans, the commercial papers and the EUR 300 million tranche of the corporate bonds accrue interest at floating rate. The Group has chosen to hedge 16 (53) percent of the loans to fixed interest rate, with a duration of 16.3 (19.0) months.
The average interest and currency duration for all loans including derivatives is 28.5 (12.6) months at the end of 2014.
Interest sensitivity analysis versus hedging % of floating rates
SEK millions %
-100
-75
-50
-25
0
20142013
Effect on interest costs/income at 1% increase in market rates
Hedging % of �oating rates
-88
-9
0
25
50
75
100
Calculated on an overall increase of market rates by 100 basis points (1 percentage unit), the interest net of the Group would change according to the bar chart below.
Market riskMarket risk is defined as the risk for changes in the value of a financial instrument due to changed market prices. This applies only to financial instruments that are listed or otherwise traded, which for Alfa Laval concern bonds and other securities and other long-term securities totalling SEK 540 (255) million. The market risk for these is perceived as low. For other financial instruments, the price risk only consists of currency risk and interest risk.
Liquidity risk and refinancing riskLiquidity risk is defined as the risk that the Group would incur increased costs due to lack of liquid funds.
Refinancing risk is defined as the risk that the refinancing of maturing loans becomes difficult or costly. The loans of the Group are mainly long term and only mature when
the agreed loan period expires. Since the maturity of the loans is distributed over time the refinancing risk is reduced.
In 2006 Alfa Laval made a private place-ment in the U.S. The offer was over-sub-scribed and was closed at USD 110 million, corresponding to SEK 864 million. The loan matures in April 2016.
Alfa Laval has a new senior credit facility of EUR 400 million and USD 544 million, corresponding to SEK 8,085 million with a new banking syndicate. The new facility replaced the previous syndicated loan. At December 31, 2014 SEK 2,715 million of the facility was utilised. The new facility matures in June 2019, with two one year extension options.
Alfa Laval has issued EUR 800 million of corporate bonds, corresponding to SEK 7,554 million. This long-term financing re-places the bridge loan taken in connection with the acquisition of Frank Mohn AS. The bonds are listed on the Irish stock exchange. The bonds were raised in two tranches, EUR 300 million with a maturity of five years and EUR 500 million, with a maturity of eight years. Settlement date was September 12, 2014.
Alfa Laval has a bilateral term loan with Swedish Export Credit that is split on one loan of EUR 100 million that matures in June 2017 and one loan of EUR 100 million that matures in June 2021 as well as a loan of USD 136 million that matures in June 2020, corre-sponding to SEK 2,975 million in total.
Alfa Laval also has a bilateral term loan from the European Investment Bank split on one loan of EUR 130 million that matures in March 2018 and an additional loan of EUR 115 million that was called on at June 23, 2014 and that matures in June 2021, corresponding to SEK 2,332 million in total.
Alfa Laval has issued commercial papers of nominally SEK 1,000 million with a dura-tion of 3-5 months.
Swedish Export Credit
European InvestmentBank
2021 2022202020192018201720162015
Maturity structure of Group funding
Non committed – Utilised
Committed
Committed & Utilised
Local facilities
Swedish Export Credit
Swedish Export Credit
SEK millions
Maturity year
Senior Facility
Corporate bonds
Corporate bonds
US Private Placement
Commercial papers
European InvestmentBank
0
2,000
4,000
6,000
8,000
10,000
12,000
14,000
16,000
18,000
20,000
22,000
24,000
In summary the maturity structure of the loans and the loan facilities is as follows:

100 Financial statements
Maturity structure of currency derivatives
SEK millions
0
2,000
4,000
6,000
8,000
-8,000
-6,000
-4,000
-2,000
0
3 6 9 12 15 18 24 36 >40 Months
3,193
-3,358
1,975
-2,066
6,688
-6,855
1,859
-1,961
659
-646
305
-337
235
-245
165
-170
79
-81
Positive cash �ows Negative cash �ows
Maturity structure of electricity futures
SEK millions
-2,0
-1,5
-1,0
-0,5
0,0
3 6 9 12 15 18 3624 Months
Negative cash �ows
-20
-10
0
10
20
30
40
50
60
>363624181512963
Maturity structure of interest derivatives
Positive cash �ows Negative cash �ows
SEK millions
Months
-12
-10
-8
-6
-4
-2
0
12963
Maturity structure of metal derivatives
Negative cash �ows
SEK millions
Months
Cash flow riskCash flow risk is defined as the risk that the size of future cash flows linked to financial instruments is fluctuating. This risk is mostly linked to changed interest and currency rates. To the extent that this is perceived as a problem, different derivative instruments are used to fix rates. See description of exposure and hedging measures under interest risk. See the maturity structure of currency derivatives, interest derivatives, metal futures and electricity futures below.
Counterpart risksFinancial instruments that potentially subject the Group to significant concentra-tions of credit risk consist principally of cash, deposits and derivatives.
The Group maintains cash and bank and short and long-term investments with various financial institutions approved by the Group. These financial institutions are located in major countries throughout the world and the Group’s policy is designed to limit exposures to any one institution. The risk for a counterpart not fulfilling its commitments is limited through the selection of financially solid counterparts and by limiting the engagement per counterpart. The Group performs periodic evaluations of the relative credit standing of those financial institutions that are considered in its investment strategy. The Group does not require collateral on these financial instruments.
The Group is exposed to credit risk in the event of non-performance by counterparts to derivative instruments. The Group limits this exposure by diversifying among counterparts with high credit ratings and by limiting the volume of transactions with each counter party.
In total it is the Group’s opinion that the counterpart risks are limited and that there is no concentration of risk in these financial instruments.

101Financial statements
Operational risks
Costs for bad debts / overdues in % of accounts receivable
SEK millions %
0
20
40
60
80
100
120
201420130
2
4
6
8
10
12
Costs for bad debts in SEK millions
< 30 days
> 30 days but ≤ 90 days
> 90 days
9267 99
Claim costs in SEK millions and in % of sales
SEK millions %
0
100
200
300
400
500
20142013*
Costs for claims & warranty in SEK millions
Claims & warranty in % of sales
* Restated to IFRS 11.
378318 411
0.000.250.500.751.001.251.501.752.002.25
Risk for bad debtsThe risk for bad debts is referring to the risk that the customer cannot pay for delivered goods due to financial difficulties. The Group sells to a large number of customers in countries all over the world. That some of these customers from time to time face payment problems or go bankrupt is unfortunately part of reality in an operation of Alfa Laval’s magnitude. All customers except Tetra Laval represent less than 1 percent of net sales and thereby represent a limited risk. Alfa Laval regularly collects credit information on new customers and, if needed, on old customers. Earlier payment habits have an impact on the acceptance of new orders. On markets with political or financial risks, the Group strives to attain credit insurance solutions. Accounts receivable constitutes the single largest financial asset according to Note 13. With reference to the above description it is management’s opinion that there is no material concentration of risk in this financial asset.
The amount of accounts receivable being overdue is an indication of the risk the company runs for ending up in a bad debt situation.
The Group’s costs for bad debts and the overdues in percent of accounts receivable are presented in the following graph:
Risk for claimsThe risk for claims refers to the costs Alfa Laval would incur to rectify faults in products or systems and possible costs for penalties. Alfa Laval strives to minimize these costs through an ISO certified quality assurance. The major risks for claim costs appear in connection with new technical solutions and new applications. The risks are limited through extensive tests at the manufacturing site and at the customer site. The Group’s net claim costs and their relation to net sales are found in the following graph:
Risk connected to technical developmentThis risk refers to the risk that some competitor develops a new technical solution that makes Alfa Laval’s products technically obsolete and therefore difficult to sell. Alfa Laval addresses this risk by a deliberate investment in research and development aiming at being in the absolute frontline of technical development.
Economic riskCompetitionThe Group operates in competitive markets. In order to address this competition the Group has for instance:
– organized the operations into divisions based on customer segments in order to get a customer focused market penetration,
– a strategy for acquisition of businesses in order to for instance reinforce the presence on certain markets or widen the Group’s product offering,
– worked with creating a competitive cost level based on its international presence and
– worked with securing the availability of strategic metals and components in order to maintain the ability to deliver.
Business climateIn an overall economic downturn the Group tends to be affected with a delay of six to twelve months depending on customer segment. The same applies with an economic upturn. The fact that the Group is operating on a large number of geographical markets and within a wide range of customer segments means a diversification that limits the effects of fluctuations in the business climate. Historically, fluctuations in the business climate have not generated decreases in orders received by more than 10 percent. The downturn in the business climate in 2009 and 2010 however meant a considerably larger decline in order intake. This was partly due to the fact that the decline happened abruptly from a very high level of demand that was the culmination of a long-lasting boom and that the price level in connection with this peak was inflated by substantial increases in raw material prices.
Prices of raw materialThe Group depends on deliveries of stainless steel, carbon steel, copper and titanium etc for the manufacture of products. The prices in some of these markets are volatile and the supply of titanium has occasionally been limited. There are a limited number of possible suppliers of titanium. The risk for severely increased prices or limited supply constitutes serious risks for the operations. The possibilities to pass on higher input prices to an end customer vary from time to time and between different markets depending on the competition. The Group is addressing this risk by securing long-term supply commitments and through fixed prices from the suppliers during six to twelve months. During periods of large price increases the customer price on titanium products has been linked to Alfa Laval’s procurement costs for titanium. Primarily in the period 2007 to 2011 the Group has experienced large price fluctuations for many raw materials, but in particular for stainless steel, carbon steel, copper and titanium.

102 Financial statements
Nickel
USD/ton
Year Year Year
0
5,000
10,000
15,000
20,000
25,000
30,000
35,000
40,000
45,000
50,000
55,000
07 08 10 11 12 13 1409 07 08 10 11 12 13 14 1409 07 08 10 11 12 1309
Copper
USD/ton
0
2,000
4,000
6,000
8,000
10,000
12,000
Aluminium
USD/ton
0
500
1,000
1,500
2,000
2,500
3,000
3,500
Sensitivity analysis and metal price hedging
SEK millions %
0
100
200
300
400
CopperNickel0
10
20
30
40
50
60
Cost increase if current metal prices increase by 100%, without hedging
Cost increase if current metal prices increase by 100%, with hedging
Hedging 2014
Hedging 2015
The price volatility for the most important metals is presented below:
The Group uses metal futures to secure the price on strategic metals. The graph below shows how much of the purchases of nickel and copper that have been hedged during 2014 and how much of the expected purchases during 2015 that were hedged at the end of 2014. Please observe that the Group has ceased to hedge the purchases of aluminium during 2014, since the exposure is so low. The graph also presents to what extent the Group’s costs for these purchases during 2015 would be affected if the prices would double from the current levels.
Environmental risksThis risk relates to the costs that the Group may incur to reduce emissions according to new or stricter environmental legislation, to restore land at previously or currently owned industrial sites, to arrange more effective waste disposal, to obtain prolonged or new concessions etc. The Group has an ambition to be well within the boundaries that local legislation sets, which should reduce the risks. The operations of the Group are not considered to have a significant environmental impact. For more information on Alfa Laval’s environmental impact, see the section on “Sustainability” on page 40.
Political riskPolitical risk is the risk that the authorities, in the countries where the Group is operating, by political decisions or adminis-tration make continued operations difficult, expensive or impossible for the Group. The Group is mainly operating in countries where the political risk is considered to be negligible or minor. The operations that are performed in countries where the political risk is deemed to be higher are not material.
Risk for and in connection with litigationsThis risk pertains to the costs the Group may incur in managing litigations, costs in connection with settlements and costs for imposed penalties. The Group is involved
in a few litigations, mainly with customers. Any estimated loss risks are provided for.
Asbestos-related lawsuitsThe Alfa Laval Group was as of December 31, 2014, named as a co-defendant in a total of 816 asbestos-related lawsuits with a total of approximately 819 plaintiffs. Alfa Laval strongly believes the claims against the Group are without merit and intends to vigorously contest each lawsuit.
Based on current information and Alfa Laval’s understanding of these lawsuits, Alfa Laval continues to believe that these lawsuits will not have a material adverse ef-fect on the Group’s financial condition or results of operation.
Risk for technically related damagesThis risk refers to the costs Alfa Laval may incur in connection with a product delivered by the Group breaking down and causing damages to life and property. The main risk in this context concerns high-speed separators, due to the large forces that are involved when the bowl in the separator spins with a very high number of revolutions. In a breakdown the damages can be extensive. Alfa Laval addresses these risks through extensive testing and an ISO certified quality assurance. The Group has product liability insurance. The number of damages is low and few damages have occurred historically.

103Financial statements
Business interruption risksThese risks refer to the risk that single units or functions within the Group can be hit by business interruption due to:
– strikes and other labour market conflicts,
– fires, natural catastrophes etc.,
– computer access violations, lack of backups etc. and
– corresponding problems at major sub-suppliers.
Alfa Laval has a well-developed dialog with the local unions, which reduces the risk for conflicts and strikes where Alfa Laval is directly involved. It is however more difficult to protect the company against conflicts in other parts of the labour market, for instance within transportation.
Alfa Laval is minimizing the following two risks through an active preventive work at each site in line with the developed global policies in each area under supervision of manufacturing management, the Group’s Risk Management function, Real Estate Management, IT and HR.
Problems at major sub-suppliers are minimized by Alfa Laval trying to use sev-eral suppliers of input goods that when needed can cover up for a drop in produc-tion somewhere else. The wish for long term and competitive delivery agreements however puts restrictions on the level of flexibility that can be achieved. When there is a shortage the total supply may be too limited to allow exchangeability.
HPR stands for “Highly Protected Risk” and is the insurance industry’s highest rat-ing for risk quality. This rating is reserved for those commercial properties where the exposure for physical damages is reduced to a minimum considering building con-struction, operations and local conditions. HPR means that all physical risks in and around the facility are documented and that these are kept within certain limits. Alfa Laval’s production facility in Lund in Sweden, which is the Group’s largest and most important facility is HPR classified, as well as the production facilities in Rich-mond, Lykens, Chesapeake, Sarasota and Newburyport in the U.S. A number of other key production facilities are being evaluated and may eventually become HPR classified.
A HPR classification means that the fa-
cility has state of the art fire and machinery protection systems and that the responsi-ble personnel has adequate security rou-tines to make sure that these protection systems are maintained and in function. In addition, known possible sources of ignition are under strict control to prevent a fire from starting. For an HPR facility the risk for a physical damage is brought to a minimum, which minimises the risk for business inter-ruption that could have extensive conse-quences for Alfa Laval and its customers. For other production facilities, not HPR-classified, the aim is also to reduce the risk for damage and business interruption to a minimum by keeping, among other things, ignition sources under strict control. Loss prevention visits are conducted according to a schedule based on size and impor-tance for Alfa Laval.
Insurance risksThese risks refer to the costs that Alfa Laval may incur due to an inadequate insurance coverage for property, business interruption, liability, transport, life and pensions. The Group strives to maintain an insurance coverage that keeps the risk level at an acceptable level for a Group of Alfa Laval’s size and is still cost efficient. As a part in this Alfa Laval has an own captive. At the same time a continuous work is going on to minimise the risks in the opera-tions through proactive measures.
Risks connected to credit termsThis risk is referring to the limited freedom of action that can be imposed on the Group through restrictions connected to credit terms in loan agreements.

104 Financial statements
NotesNote 1. Operating segments
Alfa Laval’s business is divided into three business divisions ”Equipment”, ”Process Technology” and “Marine & Diesel” that sell to external customers and one division “Other” covering procurement, production and logistics as well as corporate overhead and non-core businesses. These four divisions constitute Alfa Laval’s four operating segments.
The three business divisions (operating segments) are in turn split into a number of customer segments. The customers to the Equipment division pur-chase products whereas the customers to the Process Technology division pur-chase solutions for processing applications. The customers to the Marine & Diesel division purchase products and solutions for marine and offshore appli-cations and for diesel power plants. The Equipment division consists of four customer segments: Industrial Equipment, OEM (Original Equipment Manufac-turers), Sanitary Equipment and the aftermarket segment Service. The Process Technology division consists of four customer segments: Energy & Process, Food & Life Science and Water & Waste Treatment and the aftermarket seg-ment Service. The Marine & Diesel division consists of four customer segments: Marine & Diesel Equipment, Marine & Offshore Systems, Marine & Offshore Pumping Systems and the aftermarket segment Service.
The Process Technology division did as of April 1, 2014 re-organise its three former capital sales segments Energy & Environment, Food Technology and Process Industry into three new segments: Energy & Process, Food & Life Science and Water & Waste Treatment. The change was basically made by redistributing the existing market units between the customer segments in order to better meet the market and seize the growth opportunities. The acquisition of Frank Mohn AS meant the creation of a new capital sales segment in the Marine & Diesel division, Marine & Offshore Pumping Systems, which only contains the new business.
The operating segments are only responsible for the result down to and in-cluding operating income excluding comparison distortion items and for the op-erating capital they are managing. This means that financial assets and liabili-ties, pension assets, provisions for pensions and similar commitments and current and deferred tax assets and liabilities are a Corporate responsibility and not an operating segment responsibility. This also means that the financial net and income taxes are a Corporate responsibility and not an operating segment responsibility.
The operating segments are only measured based on their transactions with external parties.
Orders receivedConsolidated
SEK millions 2014 2013 *Equipment 9,867 9,471Process Technology 14,271 13,935Marine & Diesel 12,522 6,796Other 0 0Total 36,660 30,202
* Restated to IFRS 11.
Order backlogConsolidated
SEK millions 2014 2013Equipment 1,571 1,495Process Technology 8,440 8,393Marine & Diesel 12,282 4,680Other 0 0Total 22,293 14,568
Net salesConsolidated
SEK millions 2014 2013 *Equipment 9,787 9,462Process Technology 14,410 13,813Marine & Diesel 10,870 6,526Other 0 0Total 35,067 29,801
* Restated to IFRS 11.
Operating income in management accountsConsolidated
SEK millions 2014 2013 *
Equipment 1,320 1,306
Process Technology 2,230 2,479
Marine & Diesel 2,019 1,248
Other -529 -586
Total 5,040 4,447
Reconciliation with Group total:
Comparison distortion items -320 –
Consolidation adjustments ** -49 -94
Total operating income 4,671 4,353
Financial net -550 -181
Result after financial items 4,121 4,172
* Restated to IFRS 11. ** Difference between management accounts and IFRS
Assets / LiabilitiesConsolidated Assets Liabilities
SEK millions 2014 2013 * 2014 2013 *Equipment 6,424 5,902 764 882Process Technology 11,893 10,828 4,237 4,029Marine & Diesel 25,299 7,817 4,132 2,050Other 5,906 5,517 3,974 2,558Subtotal 49,522 30,064 13,107 9,519Corporate 6,264 4,845 25,477 9,228Total 55,786 34,909 38,584 18,747
* Restated to IFRS 11 and for move of manufacturing from Marine & Diesel to Other.
Corporate refers to items in the statement on financial position that are interest bearing or are related to taxes.
InvestmentsConsolidated
SEK millions 2014 2013 *Equipment 59 54Process Technology 111 98Marine & Diesel 84 35Other 349 305Total 603 492
* Restated to IFRS 11.
DepreciationConsolidated
SEK millions 2014 2013 *Equipment 188 170Process Technology 325 297Marine & Diesel 591 196Other 365 344Total 1,469 1,007
* Restated to IFRS 11.
Operating income in management accounts is very close to operating income under IFRS. There are only two differences. Operating income in management accounts does not include comparison distortion items nor all the consolidation adjustments that are made in the official accounts.

105Financial statements
Note 2. Information about geographical areas
Countries with more than 10 percent of either of net sales, non-current assets or investments are reported separately.
Net sales
Consolidated
2014 2013 * SEK millions % SEK millions %To customers in: Sweden 820 2.3 881 3.0 Other EU 9,153 26.2 8,128 27.4 Other Europe 2,575 7.3 2,702 9.1 USA 5,446 15.5 4,811 16.1 Other North America 1,105 3.2 1,117 3.7 Latin America 2,205 6.3 1,797 6.0 Africa 364 1.0 299 1.0 China 3,838 10.9 2,992 10.0 South Korea 3,952 11.3 2,078 7.0 Other Asia 5,122 14.6 4,564 15.3 Oceania 487 1.4 432 1.4Total 35,067 100.0 29,801 100.0
* Restated to IFRS 11.
Net sales are reported by country on the basis of invoicing address, which is normally the same as the delivery address.
Non-current assets
Consolidated
2014 2013 * SEK millions % SEK millions % Sweden 1,370 3.9 1,434 7.6 Denmark 4,680 13.3 4,493 23.8 Other EU 4,216 11.9 4,079 21.6 Norway 14,747 41.7 68 0.4 Other Europe 194 0.5 230 1.2 USA 4,434 12.5 3,890 20.6 Other North America 122 0.4 110 0.6 Latin America 371 1.1 366 1.9 Africa 1 0.0 1 0.0 Asia 3,086 8.7 2,680 14.2 Oceania 89 0.3 77 0.4Subtotal 33,310 94.3 17,428 92.3Other long-term securities 30 0.1 35 0.2Pension assets 6 0.0 11 0.1Deferred tax asset 1,986 5.6 1,401 7.4Total 35,332 100.0 18,875 100.0
* Restated to IFRS 11.
Investments
Consolidated
2014 2013 * SEK millions % SEK millions % Sweden 122 20.3 65 13.1 Denmark 51 8.4 82 16.6 Other EU 143 23.8 111 22.6 Other Europe 39 6.5 17 3.5 USA 66 10.9 91 18.5 Other North America 4 0.6 3 0.7 Latin America 14 2.4 14 2.8 Africa 1 0.1 0 0.0 China 102 16.9 56 11.4 Other Asia 55 9.1 52 10.6 Oceania 6 1.0 1 0.2Total 603 100.0 492 100.0
* Restated to IFRS 11.
Note 3. Information about products and services
Net sales by product/service
Consolidated
SEK millions 2014 2013 *Own products within: Separation 7,222 6,576 Heat transfer 16,587 16,001 Fluid handling 6,933 3,254 Other 862 799Associated products 1,915 1,848Services 1,548 1,323Total 35,067 29,801
* Restated to IFRS 11.
The split of own products within separation, heat transfer and fluid handling is a reflection of the current three main technologies. Other is own products outside these main technologies. Associated products are mainly purchased products that compliment Alfa Laval’s product offering. Services cover all sorts of service, service agreements etc.
Note 4. Information about major customers
Alfa Laval does not have any customer that accounts for 10 percent or more of net sales. Tetra Pak within the Tetra Laval Group is Alfa Laval’s single largest customer with a volume representing 3.7 (4.8) percent of net sales. See Note 32 for more information.
Note 5. Employees
Average number of employees - total
Consolidated
Number of female employees
Total number of employees
2014 2013 * 2014 2013 *Parent company – – – –
Subsidiaries in Sweden (8) 479 483 2,133 2,116Total in Sweden (8) 479 483 2,133 2,116Total abroad (135) 2,821 2,581 14,976 14,122
Total (143) 3,300 3,064 17,109 16,238
* Restated to IFRS 11.
The figures in brackets in the text column state how many companies had employees as well as salaries and remunerations in 2014.
Average number of employees – in Sweden by municipality
Consolidated
2014 2013 *Botkyrka 448 443Eskilstuna 213 214Lund 1,045 1,014Ronneby 260 254Stockholm – 11Vänersborg 113 134Other ** 54 46
Total 2,133 2,116
* Restated to IFRS 11. ** “Other” refers to municipalities with less than 10 employees and also includes employees at branch offices abroad.

106 Financial statements
Average number of employees – by country
Consolidated
Number of female employees Total number of employees
2014 2013 * 2014 2013 *Argentina 11 10 38 38Australia 18 17 106 109Belgium 2 2 27 29Brazil 58 54 576 582Bulgaria 7 7 19 23Chile 7 11 32 45Colombia 9 10 23 20Denmark 415 394 1,802 1,740Philippines 4 4 13 12Finland 44 44 250 249France 157 160 888 902United Arab Emirates 20 19 191 182Greece 8 6 21 20Hong Kong 6 7 22 20India 80 79 1,435 1,455Indonesia 21 17 92 84Iran 0 1 5 5Italy 165 150 901 866Japan 57 60 278 267Canada 21 19 100 95Kazakhstan – 0 – 2China 629 577 2,768 2,700Korea 63 58 316 305Latvia 5 5 12 13Malaysia 38 32 121 102Mexico 10 16 42 57Netherlands 70 56 363 312Norway 130 8 699 39New Zeeland 4 5 17 18Panama 3 3 10 9Peru 7 7 25 26Poland 45 45 233 226Portugal 3 3 9 10Qatar – – 8 8Romania 3 4 12 13Russia 126 117 352 348Switzerland 5 4 18 16Singapore 54 49 207 169Slovakia 2 2 11 10Spain 20 20 81 79UK 56 56 347 354Sweden 479 483 2,133 2,116South Africa 10 9 43 42Taiwan 13 13 42 37Thailand 11 12 56 59Czech Republic 8 8 40 38Turkey 9 7 45 43Germany 74 75 394 392Ukraine 7 9 15 19Hungary 4 4 13 13USA 296 280 1,830 1,837Venezuela 1 1 3 6Vietnam – 20 2 54Austria 5 5 23 23Total 3,300 3,064 17,109 16,238
* Restated to IFRS 11.
Gender distribution among managers
Consolidated
2014 2013*Total
numberMale
%Female
%Total
numberMale
%Female
%Board members (excluding deputies) 12 75.0 25.0 12 75.0 25.0
President and other executive officers 11 90.9 9.1 11 90.9 9.1
Managers in Sweden 285 79.3 20.7 264 80.7 19.3
Managers outside Sweden 1,901 85.6 14.4 1,728 84.1 15.9
Managers total 2,186 84.8 15.2 1,992 83.6 16.4
Employees in Sweden 2,133 77.5 22.5 2,116 76.8 23.2
Employees outside Sweden 14,976 81.2 18.8 14,122 81.7 18.3
Employees total 17,109 80.7 19.3 16,238 81.1 18.9
* Restated to IFRS 11.

107Financial statements
Note 6. Salaries and remunerations
Salaries and remunerations - total
Consolidated
SEK millions 2014 2013 *Board of Directors, Presidents and Vice Presidents 243 229 - out of which, variable 44 40Other 6,421 5,415Total salaries and remunerations 6,664 5,644Social security costs 1,097 964Pension costs, defined benefit plans 103 103Pension costs, defined contribution plans 483 415Total costs of personnel 8,347 7,126
* Restated to IFRS 11.
The Group’s pension costs and pension liabilities relating to the Board of Directors, presidents and vice presidents amounts to SEK 43 (37) million and SEK 312 (298) million respectively. SEK 116 (130) million of the pension liabilities is covered by the Alfa Laval Pension Fund.
Equity compensation benefits During the period 2013 to 2014 no equity related benefits existed within Alfa Laval.
Variable remunerationsAll employees have either a fixed salary or a fixed base salary. For certain personnel categories the remuneration package also includes a variable element. This relates to personnel categorises where it is customary or part of a market offer to pay a variable part. Variable remunerations are most common in sales related jobs and on higher managerial positions. Normally the variable part constitutes a minor part of the total remuneration package.
Cash based long term incentive programmeThe Annual General Meetings 2011 to 2014 decided to implement step one to four of a cash-based long term incentive programme. The long term incentive programme is targeting maximum 85 senior managers in the Group including the Chief Executive Officer and the persons defined as executive officers.
Each of the steps stretches over three years and the awards under each step are divided into three tranches (one for each year). The award under each tranche is set independently from the other two tranches. Since each step stretches
over three years, three steps of the programmes will always run in parallel. In 2014 step two, three and four of the programme are running in parallel.
The final award for each step is calculated on the employee’s yearly base salary at the end of the three year period. The maximum award is set to a percentage of the employee’s annual maximum variable remuneration ac-cording to the following:
Maximum long term incentive
Maximum long term incentive in percent of base salary
Maximum variable remuneration per year in percent of
base salaryIn total over the
three year period
60% 45%
40% 30%
30% 25%
25% 20%
15% 12%
The outcome of the programme is linked to the development of earnings per share (EPS) for Alfa Laval. The EPS targets for the three tranches within each step are set by the Board of Directors.
The award is calculated in the following way. When the EPS is within the range of -10 percent to +10 percent of the target EPS the employee gets 5 percent of one third of the maximum outcome per year for each percent that the EPS exceeds the bottom level of 90 percent of the target EPS up to the maximum level of 110 percent of the target EPS.
To be eligible for payout the employees must be in service on the award date and the vesting date (except in case of termination of employment due to retirement, death or disability). If the employee resigns or is dismissed before the end of the three year period, the awards will lapse and the employee will not be entitled to any payout. If the employee moves to a position that is not eligible for this programme the tranches that already have been earned are paid out upon the change of position. Paid remunerations from the long term incentive programme do not affect the pensionable income or the holiday pay.
Based on the reported EPS during the period 2011 to 2014, the different steps have resulted in the following awards:
Cash based long term incentive plan
Consolidated
SEK millions, unless otherwise stated Per year Accumulated
Step
Decided by
Annual General
Meeting
Covering periodPayable
in April
Actual outcome in % of maximum outcomePayable in percent of base salary based on
15% in variable remuneration
Awards
January 1 – December 31 2014 2013 2012 2011 To date Paid Estimated
One 2011 2011 2013 2014 N/A 33.65% 100.00% 100.00% 77.88% 9.35% 23 N/A
Two 2012 2012 2014 2015 0.00% 23.57% 99.06% N/A 40.88% 4.91% N/A 13
Three 2013 2013 2015 2016 66.78% 100.00% N/A N/A 83.39% 6.67% N/A 18
Four 2014 2014 2016 2017 61.77% N/A N/A N/A 61.77% 2.47% N/A 8
Awards per year 15 17 20 10 Total 23 39
The costs for the awards per step and per year are based on estimated base salaries at the future time of payment.
Guidelines for remunerations to executive officersThe remunerations to the Chief Executive Officer/Managing Director are decided by the Board of Directors based on proposals from the Remuneration Committee according to the guidelines established by the Annual General Meeting. The remunerations to the other members of Group Management are decided by the Remuneration Committee according to the same guidelines. The principle used when deciding the remunerations to executive officers is to offer a competitive remuneration where the remuneration package is mainly based on a fixed monthly salary, with an option for a company car and in addition to that a variable remuneration of up to 40 percent of the salary (managing director up to 60 percent of the salary). The size of the variable remuneration depends on the outcome of a number of financial
measurements and the result of special projects, all compared with the objectives that have been established for the year. The guidelines for pension, termination and severance pay differ between the Chief Executive Officer/Managing Director and the other executive officers, see the below table.
The Annual General Meetings 2011 to 2014 decided to implement step one to four of a cash-based long term incentive programme for maximum 85 senior managers in the Group including the Chief Executive Officer and the persons defined as executive officers. The Board of Directors will propose the Annual General Meeting 2015 to implement step five of the cash-based long term incentive programme for the period January 1, 2015 – December 31, 2017. No other changes of these guidelines are proposed by the Board of Directors.
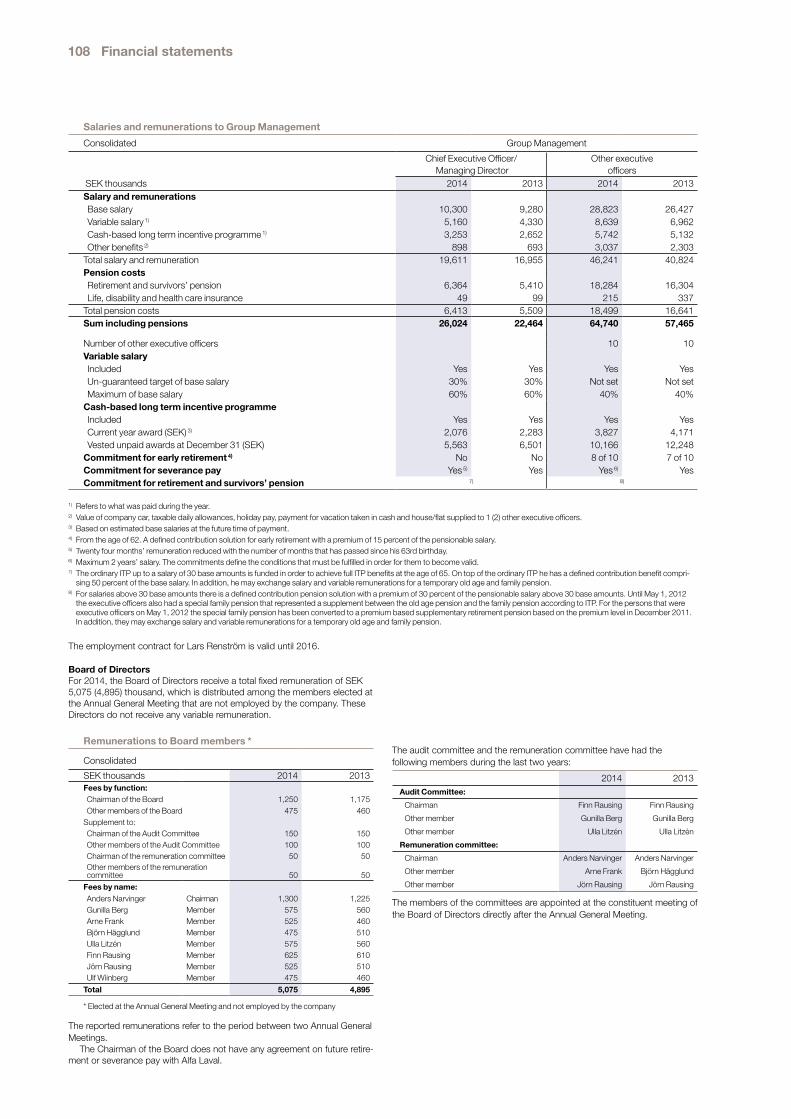
108 Financial statements
Remunerations to Board members *
Consolidated
SEK thousands 2014 2013Fees by function: Chairman of the Board 1,250 1,175 Other members of the Board 475 460Supplement to: Chairman of the Audit Committee 150 150 Other members of the Audit Committee 100 100 Chairman of the remuneration committee 50 50 Other members of the remuneration committee 50 50
Fees by name: Anders Narvinger Chairman 1,300 1,225 Gunilla Berg Member 575 560 Arne Frank Member 525 460 Björn Hägglund Member 475 510 Ulla Litzén Member 575 560 Finn Rausing Member 625 610 Jörn Rausing Member 525 510 Ulf Wiinberg Member 475 460
Total 5,075 4,895
* Elected at the Annual General Meeting and not employed by the company
The reported remunerations refer to the period between two Annual General Meetings.
The Chairman of the Board does not have any agreement on future retire-ment or severance pay with Alfa Laval.
The audit committee and the remuneration committee have had the following members during the last two years:
2014 2013Audit Committee:
Chairman Finn Rausing Finn Rausing
Other member Gunilla Berg Gunilla Berg
Other member Ulla Litzén Ulla Litzén
Remuneration committee:
Chairman Anders Narvinger Anders Narvinger
Other member Arne Frank Björn Hägglund
Other member Jörn Rausing Jörn Rausing
The members of the committees are appointed at the constituent meeting of the Board of Directors directly after the Annual General Meeting.
Salaries and remunerations to Group Management
Consolidated Group Management
Chief Executive Officer/ Managing Director
Other executive officers
SEK thousands 2014 2013 2014 2013Salary and remunerations Base salary 10,300 9,280 28,823 26,427 Variable salary 1) 5,160 4,330 8,639 6,962 Cash-based long term incentive programme 1) 3,253 2,652 5,742 5,132 Other benefits 2) 898 693 3,037 2,303Total salary and remuneration 19,611 16,955 46,241 40,824Pension costs Retirement and survivors’ pension 6,364 5,410 18,284 16,304 Life, disability and health care insurance 49 99 215 337Total pension costs 6,413 5,509 18,499 16,641Sum including pensions 26,024 22,464 64,740 57,465
Number of other executive officers 10 10Variable salary Included Yes Yes Yes Yes Un-guaranteed target of base salary 30% 30% Not set Not set Maximum of base salary 60% 60% 40% 40%Cash-based long term incentive programme Included Yes Yes Yes Yes Current year award (SEK) 3) 2,076 2,283 3,827 4,171 Vested unpaid awards at December 31 (SEK) 5,563 6,501 10,166 12,248Commitment for early retirement 4) No No 8 of 10 7 of 10Commitment for severance pay Yes 5) Yes Yes 6) YesCommitment for retirement and survivors’ pension 7) 8)
1) Refers to what was paid during the year.2) Value of company car, taxable daily allowances, holiday pay, payment for vacation taken in cash and house/flat supplied to 1 (2) other executive officers.3) Based on estimated base salaries at the future time of payment.4) From the age of 62. A defined contribution solution for early retirement with a premium of 15 percent of the pensionable salary.5) Twenty four months’ remuneration reduced with the number of months that has passed since his 63rd birthday.6) Maximum 2 years’ salary. The commitments define the conditions that must be fulfilled in order for them to become valid. 7) The ordinary ITP up to a salary of 30 base amounts is funded in order to achieve full ITP benefits at the age of 65. On top of the ordinary ITP he has a defined contribution benefit compri-
sing 50 percent of the base salary. In addition, he may exchange salary and variable remunerations for a temporary old age and family pension.8) For salaries above 30 base amounts there is a defined contribution pension solution with a premium of 30 percent of the pensionable salary above 30 base amounts. Until May 1, 2012
the executive officers also had a special family pension that represented a supplement between the old age pension and the family pension according to ITP. For the persons that were executive officers on May 1, 2012 the special family pension has been converted to a premium based supplementary retirement pension based on the premium level in December 2011. In addition, they may exchange salary and variable remunerations for a temporary old age and family pension.
The employment contract for Lars Renström is valid until 2016.
Board of DirectorsFor 2014, the Board of Directors receive a total fixed remuneration of SEK 5,075 (4,895) thousand, which is distributed among the members elected at the Annual General Meeting that are not employed by the company. These Directors do not receive any variable remuneration.

109Financial statements
Note 7. Information on auditors and auditors’ fee
The line “Group auditors” in the below table is referring to the auditors elected at Annual General Meeting of Alfa Laval AB (publ). The Annual General Meeting 2014 decided to elect KPMG as the Group’s auditors for the coming year. For 2013 Ernst & Young was the Group’s auditors. This means that the line “Group auditor” in the below table is referring to KPMG for 2014 and to Ernst & Young for 2013.
Fees and expense compensation
Consolidated
SEK millions 2014 2013Audit engagements
Group auditors 29 28Other audit firms 1 1Total 30 29
Audit related services Group auditors 1 3Other audit firms 5 5Total 6 8
Tax services Group auditors 4 5Other audit firms 3 3Total 7 8
Other services Group auditors 1 2Other audit firms 5 2Total 6 4
Expenses Group auditors 0 1Other audit firms 0 0Total 0 1
Total Group auditors 35 39Other audit firms 14 11Total 49 50
An audit engagement includes examining the financial statements, assessing the accounting principles used and significant estimates made by management, as well as evaluating the overall financial statement presentation. It also includes an examination in order to give an opinion on the Board’s discharge from liability. Audit related services are audit services that are outside the audit engagement. Tax services refer to advices given in connection with various tax matters. All other assignments are defined as other services. Expenses refer to reimbursements of travel costs, secretarial services etc.
Specification of comparison distortion items
Consolidated
SEK millions 2014 2013
Cost for:
Restructuring programme -260 –
Acquisition costs Frank Mohn -60 –
Subtotal losses/costs -320 –
Net total -320 –
The comparison distortion cost during 2014 consists of two components. SEK -60 million relate to one time acquisition costs in connection with the acquisition of Frank Mohn AS. The remaining SEK -260 million relate to a cost reduction and restructuring programme, where Alfa Laval has reviewed costs and structure relating to the supply chain as well as R&D, sales and administration. Change activities and saving measures were initiated in the third quarter including initiatives for reduced costs and activities as well as structural changes, for instance the announced move of production from Denmark to China. The programme is expected to be fully implemented dur-ing the fourth quarter 2015, when the savings are estimated to reach a level of SEK 300 million on a yearly basis. The costs are expected to amount to SEK 260 million, out of which SEK 235 million have a cash flow effect. The measures are expected to affect about 400 employees gross and after com-pletion mean a personnel reduction of 300 employees.
Note 9. Depreciation and amortisation
Split by function
Consolidated
SEK millions 2014 2013 *Cost of goods sold -1,293 -835Sales -35 -38Administration -72 -59Research and development -5 -8Other income and costs -64 -67Total -1,469 -1,007
* Restated to IFRS 11.
Split by type of asset
Consolidated
SEK millions 2014 2013 *
Patents and unpatented know-how, trademarks, etc. -858 -513Machinery and equipment -459 -385Financial leasing machinery and equipment -3 -4Buildings and ground installations -143 -98Financial leasing buildings -6 -7Total -1,469 -1,007
* Restated to IFRS 11.
Note 10. Dividends and changes in fair value of financial instruments
Split by type
Consolidated
SEK millions 2014 2013Dividends from other 8 7Fair value changes in securities 22 1Total 30 8
Note 8. Comparison distortion itemsComparison distortion items are reported gross in the consolidated comprehensive income statement as a part of other operating income and other operating costs.
Comparison distortion items
Consolidated
SEK millions 2014 2013 *
Operational
Other operating income 565 459
Comparison distortion items – –
Total other operating income 565 459
Other operating costs -904 -895
Comparison distortion items -320 –
Total other operating costs -1,224 -895
* Restated to IFRS 11.

110 Financial statements
Note 11. Interest income/expense and financial exchange rate gains/losses
Split on type of income/expense or gain/loss
Consolidated
SEK millions 2014 2013Interest income Financial leasing 0 0 Other interest 110 147
Exchange rate gains Unrealised 216 163 Realised 94 48
Total 420 358Interest expenses Financial leasing 0 0 Other interest -324 -245
Exchange rate losses Unrealised -247 -175 Realised -429 -127
Total -1,000 -547
In the Group, reported net exchange differences of SEK -1,033 (-83) million relating to debts in foreign currencies have been charged to other comprehensive income. These debts finance the acquisition of shares in foreign subsidiaries and act as a hedge to the acquired net assets. The amount is charged with tax resulting in a net after tax impact on other comprehensive income of SEK -806 (-65) million.
Split on type of income/expense or gain/loss
Parent company
SEK millions 2014 2013Interest income External companies 1 2 Subsidiaries 38 69
Exchange rate gains Unrealised 12 8
Total 51 79Interest costs External companies -5 –
Exchange rate losses Unrealised -3 -4
Total -8 -4
Note 12. Non-controlling interests
Alfa Laval does not have any subsidiaries with material non-controlling interests, which can be seen in the following table.
Specification of subsidiaries with non-controlling interests
SEK millions, unless otherwise stated
Non-controlling interest %
Attributable to non-controlling interest
Net income Equity
Company name Country of domicile 2014 2013 2014 2013 2014 2013Frank Mohn Mexico Sa de CV * Mexico 0.01 N/A 0 N/A 0 N/AAlfa Laval Aalborg Indústria e Comércio Ltda Brazil 0.5 0.5 0 0 1 1Frank Mohn do Brasil Ltda. * Brazil 4.67 N/A 0 N/A 1 N/ALiyang Sifang Stainless Steel Products Co., Ltd. China 35 35 9 7 74 55Alfa Laval (India) Ltd India 1.8047 1.8047 3 3 20 14Kenus LLP Kazakhstan 10 10 0 0 0 0Chang San Engineering Co. Ltd. * Korea 25 N/A 5 N/A 24 N/AAalborg Industries Water Treatment Pte. Ltd., Singapore 40 40 0 0 0 -2Ziepack SA France 49 49 5 3 5 7Tranter Solarice GmbH Germany N/A 33 ** 0 0 0 0Fusatun AS * Norway 0.65 N/A 0 N/A 0 N/AAO Alfa Laval Potok Russia 0.0007 0.0007 0 0 0 0
Total 22 13 125 75
* Acquired on May 21, 2014. ** Until February 21, 2013. Then it became a 100 percent owned subsidiary.
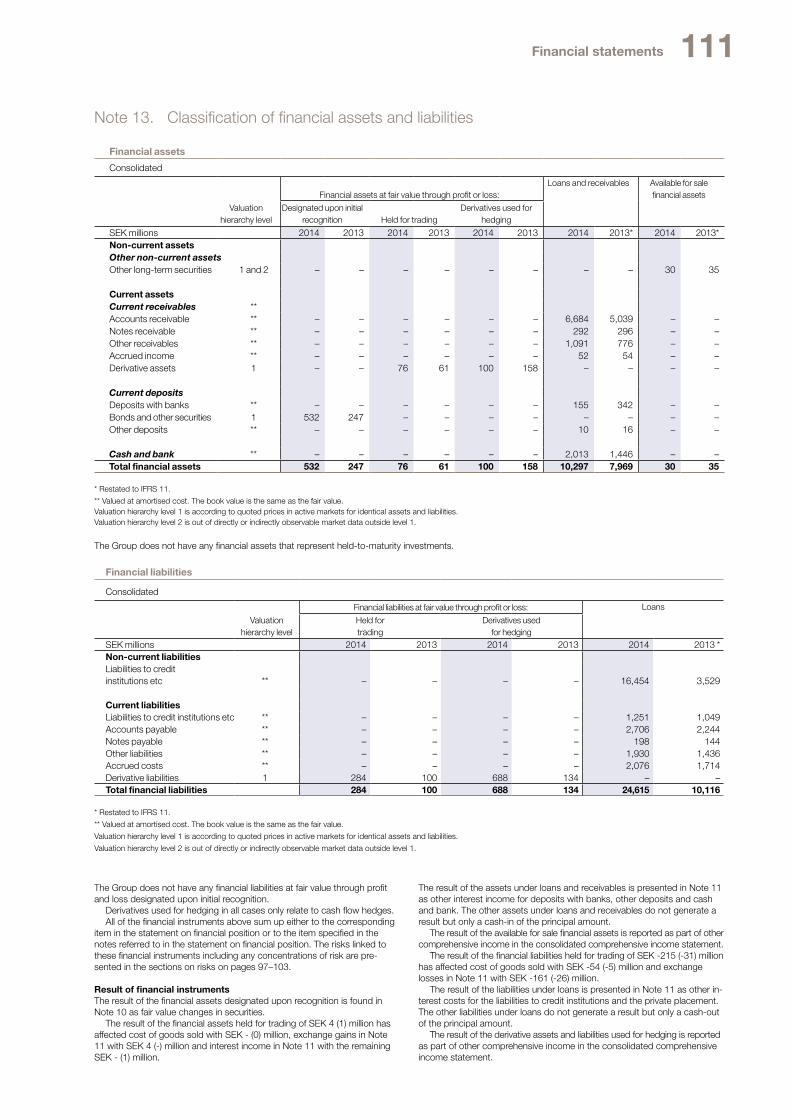
111Financial statements
Financial liabilities
Consolidated
Financial liabilities at fair value through profit or loss: Loans
Valuation hierarchy level
Held for trading
Derivatives used for hedging
SEK millions 2014 2013 2014 2013 2014 2013 *Non-current liabilities Liabilities to credit institutions etc ** – – – – 16,454 3,529
Current liabilities Liabilities to credit institutions etc ** – – – – 1,251 1,049Accounts payable ** – – – – 2,706 2,244Notes payable ** – – – – 198 144Other liabilities ** – – – – 1,930 1,436Accrued costs ** – – – – 2,076 1,714Derivative liabilities 1 284 100 688 134 – –Total financial liabilities 284 100 688 134 24,615 10,116
* Restated to IFRS 11.
** Valued at amortised cost. The book value is the same as the fair value.
Valuation hierarchy level 1 is according to quoted prices in active markets for identical assets and liabilities.
Valuation hierarchy level 2 is out of directly or indirectly observable market data outside level 1.
Note 13. Classification of financial assets and liabilities
Financial assets
Consolidated
Financial assets at fair value through profit or loss:
Loans and receivables Available for sale financial assets
Valuation hierarchy level
Designated upon initial recognition Held for trading
Derivatives used for hedging
SEK millions 2014 2013 2014 2013 2014 2013 2014 2013* 2014 2013*Non-current assets Other non-current assets Other long-term securities 1 and 2 – – – – – – – – 30 35
Current assets Current receivables ** Accounts receivable ** – – – – – – 6,684 5,039 – –Notes receivable ** – – – – – – 292 296 – –Other receivables ** – – – – – – 1,091 776 – –Accrued income ** – – – – – – 52 54 – –Derivative assets 1 – – 76 61 100 158 – – – –
Current deposits Deposits with banks ** – – – – – – 155 342 – –Bonds and other securities 1 532 247 – – – – – – – –Other deposits ** – – – – – – 10 16 – –
Cash and bank ** – – – – – – 2,013 1,446 – –Total financial assets 532 247 76 61 100 158 10,297 7,969 30 35
* Restated to IFRS 11.
** Valued at amortised cost. The book value is the same as the fair value.Valuation hierarchy level 1 is according to quoted prices in active markets for identical assets and liabilities.Valuation hierarchy level 2 is out of directly or indirectly observable market data outside level 1.
The Group does not have any financial assets that represent held-to-maturity investments.
The Group does not have any financial liabilities at fair value through profit and loss designated upon initial recognition.
Derivatives used for hedging in all cases only relate to cash flow hedges.All of the financial instruments above sum up either to the corresponding
item in the statement on financial position or to the item specified in the notes referred to in the statement on financial position. The risks linked to these financial instruments including any concentrations of risk are pre-sented in the sections on risks on pages 97–103.
Result of financial instrumentsThe result of the financial assets designated upon recognition is found in Note 10 as fair value changes in securities.
The result of the financial assets held for trading of SEK 4 (1) million has affected cost of goods sold with SEK - (0) million, exchange gains in Note 11 with SEK 4 (-) million and interest income in Note 11 with the remaining SEK - (1) million.
The result of the assets under loans and receivables is presented in Note 11 as other interest income for deposits with banks, other deposits and cash and bank. The other assets under loans and receivables do not generate a result but only a cash-in of the principal amount.
The result of the available for sale financial assets is reported as part of other comprehensive income in the consolidated comprehensive income statement.
The result of the financial liabilities held for trading of SEK -215 (-31) million has affected cost of goods sold with SEK -54 (-5) million and exchange losses in Note 11 with SEK -161 (-26) million.
The result of the liabilities under loans is presented in Note 11 as other in-terest costs for the liabilities to credit institutions and the private placement. The other liabilities under loans do not generate a result but only a cash-out of the principal amount.
The result of the derivative assets and liabilities used for hedging is reported as part of other comprehensive income in the consolidated comprehensive income statement.

112 Financial statements
Note 15. Current and deferred taxesNote 14. Fair value of financial instruments
The fair value changes in shares in external companies are made under other comprehensive income and amounts to SEK -0 (-0) million, see the comments to the consolidated comprehensive income statement.
The fair value changes in marketable securities are made on the line divi-dends and changes in fair value in the consolidated comprehensive income statement and amounts to SEK 22 (1) million, see Note 10.
Fair value of derivatives
Consolidated
Difference between contracted rate and
current rate
SEK millions Currency pairs 2014 2013
Derivative assets/liabilities Foreign exchange forward contracts: EUR USD -99 37
EUR SEK -70 -38EUR AUD 0 4EUR CAD -7 6EUR DKK – -1EUR JPY 3 4USD CAD 6 1USD DKK -36 10USD GBP 0 –USD SEK 18 -19USD JPY -3 1USD KRW – -14USD SGD -2 -1DKK SEK -1 4NOK EUR 0 -7NOK SEK 22 -1NOK USD -564 -3CNY USD – 1AUD USD 2 -1JPY NOK -41 –
RUB EUR 10 0RUB USD 1 –Other Other -3 1
Subtotal -764 -16 Currency options -12 -1 Interest Rate Swaps 15 20 Metal forward contacts -31 -14 Electricity futures -4 -4Total, corresponding to a net derivative asset (+) or liability (-) -796 -15
For currency options and electricity futures hedge accounting has not been applied. For foreign exchange forward contracts, interest rate swaps and metal forward contracts hedge accounting has been applied when the conditions for hedge accounting have been fulfilled.
The fair value adjustment of derivatives is made through other compre-hensive income if hedge accounting can be applied and the derivatives are effective. In all other cases the fair value adjustment is made above net in-come. The corresponding entries are made on derivative assets and liabili-ties and not on the underlying financial instruments in the statement on fi-nancial position.
Tax on this year’s net income and other taxes
Consolidated
SEK millions 2014 2013
Major components of the Group’s tax costs
Current tax cost -1,324 -1,319
Adjustment for current taxes on prior periods -27 -1
Deferred tax costs/income on changes in temporary differences 205 222
Deferred tax costs/income on changes in tax rates or new taxes 13 0
Tax income from previously unrecognised tax losses or tax credits on temporary differences of prior periods 2 0
Deferred tax income from previously unrecognised tax losses or tax credits on temporary differences of prior periods 0 0
Deferred tax cost from the write down or reversal of a previous write down of a deferred tax asset 2 0
Other taxes -24 -34
Total tax cost -1,153 -1,132
Tax on this year’s other comprehensive income
Consolidated
SEK millions 2014 2013
Major components
Deferred tax on cash flow hedges 220 -14
Deferred tax on revaluations of defined benefit obligations 71 -81
Total tax cost 291 -95
The difference between the tax costs of the group and the tax cost based upon applicable tax rates can be explained as follows:
Tax cost reconciliation
Consolidated
SEK millions 2014 2013
Result after financial items 4,121 4,172
Tax according to applicable tax rates -1,092 -1,126
Tax effect of:
Non-deductible costs -96 -76
Non-taxable income 59 110
Differences between reported official depreci-ation and depreciation according to tax rules -3 0
Differences between reported other official appropriations and other appropriations according to tax rules 24 8
Tax losses and tax credits 6 -13
Adjustment for current tax on prior periods -27 -1
Other -24 -34
Total tax costs -1,153 -1,132
Other taxes are mainly referring to wealth tax.
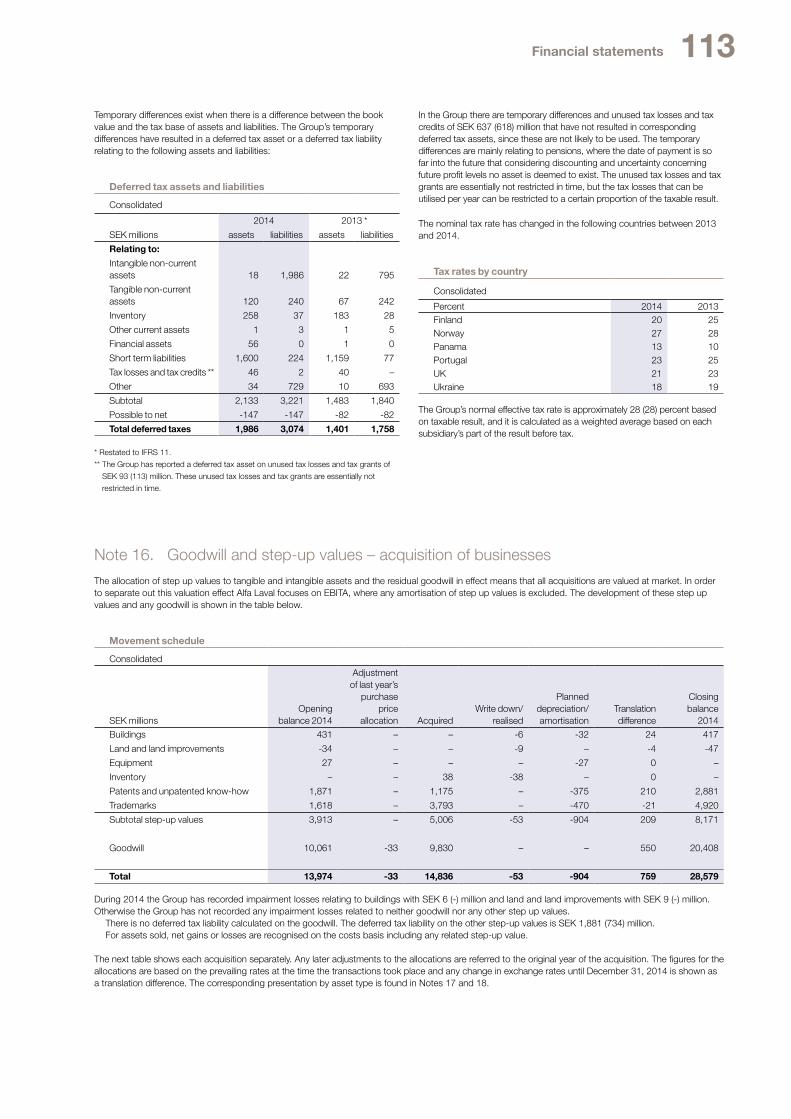
113Financial statements
Temporary differences exist when there is a difference between the book value and the tax base of assets and liabilities. The Group’s temporary differences have resulted in a deferred tax asset or a deferred tax liability relating to the following assets and liabilities:
Deferred tax assets and liabilities
Consolidated
2014 2013 *
SEK millions assets liabilities assets liabilities
Relating to:
Intangible non-current assets 18 1,986 22 795
Tangible non-current assets 120 240 67 242
Inventory 258 37 183 28
Other current assets 1 3 1 5
Financial assets 56 0 1 0
Short term liabilities 1,600 224 1,159 77
Tax losses and tax credits ** 46 2 40 –
Other 34 729 10 693
Subtotal 2,133 3,221 1,483 1,840
Possible to net -147 -147 -82 -82
Total deferred taxes 1,986 3,074 1,401 1,758
* Restated to IFRS 11.
** The Group has reported a deferred tax asset on unused tax losses and tax grants of
SEK 93 (113) million. These unused tax losses and tax grants are essentially not
restricted in time.
The nominal tax rate has changed in the following countries between 2013 and 2014.
Tax rates by country
Consolidated
Percent 2014 2013Finland 20 25Norway 27 28Panama 13 10Portugal 23 25UK 21 23Ukraine 18 19
The Group’s normal effective tax rate is approximately 28 (28) percent based on taxable result, and it is calculated as a weighted average based on each subsidiary’s part of the result before tax.
Note 16. Goodwill and step-up values – acquisition of businesses
The allocation of step up values to tangible and intangible assets and the residual goodwill in effect means that all acquisitions are valued at market. In order to separate out this valuation effect Alfa Laval focuses on EBITA, where any amortisation of step up values is excluded. The development of these step up values and any goodwill is shown in the table below.
Movement schedule
Consolidated
SEK millionsOpening
balance 2014
Adjustment of last year’s
purchase price
allocation AcquiredWrite down/
realised
Planned depreciation/ amortisation
Translation difference
Closing balance
2014
Buildings 431 – – -6 -32 24 417
Land and land improvements -34 – – -9 – -4 -47
Equipment 27 – – – -27 0 –
Inventory – – 38 -38 – 0 –
Patents and unpatented know-how 1,871 – 1,175 – -375 210 2,881
Trademarks 1,618 – 3,793 – -470 -21 4,920
Subtotal step-up values 3,913 – 5,006 -53 -904 209 8,171
Goodwill 10,061 -33 9,830 – – 550 20,408
Total 13,974 -33 14,836 -53 -904 759 28,579
During 2014 the Group has recorded impairment losses relating to buildings with SEK 6 (-) million and land and land improvements with SEK 9 (-) million. Otherwise the Group has not recorded any impairment losses related to neither goodwill nor any other step up values.
There is no deferred tax liability calculated on the goodwill. The deferred tax liability on the other step-up values is SEK 1,881 (734) million.For assets sold, net gains or losses are recognised on the costs basis including any related step-up value.
The next table shows each acquisition separately. Any later adjustments to the allocations are referred to the original year of the acquisition. The figures for the allocations are based on the prevailing rates at the time the transactions took place and any change in exchange rates until December 31, 2014 is shown as a translation difference. The corresponding presentation by asset type is found in Notes 17 and 18.
In the Group there are temporary differences and unused tax losses and tax credits of SEK 637 (618) million that have not resulted in corresponding deferred tax assets, since these are not likely to be used. The temporary differences are mainly relating to pensions, where the date of payment is so far into the future that considering discounting and uncertainty concerning future profit levels no asset is deemed to exist. The unused tax losses and tax grants are essentially not restricted in time, but the tax losses that can be utilised per year can be restricted to a certain proportion of the taxable result.

114 Financial statements
Acquisition of businesses since 2000
Consolidated
SEK millions Year/Businesses Buildings
Land and land impro-
vements Equipment Inventory
Patents and unpatented know-how Trademarks Other
Total step-up values Goodwill Total
2000 Alfa Laval Holding 1,058 -228 452 340 1,280 461 660 4,023 3,683 7,7062002 Danish Separation Systems – – – – – – – – 118 1182003 Toftejorg 1 – – – – – – 1 35 362005 Packinox – – – 6 99 183 – 288 253 5412006 Tranter 17 – – 6 180 265 – 468 530 9982007 AGC Engineering – – – – – 12 – 12 20 32Helpman 9 8 – – 36 – – 53 4 57Public offer Alfa Laval (India) – – – – – – – – 441 441DSO Fluid Handling – – – – – 39 – 39 42 81Fincoil – – – – 233 – – 233 241 4742008 Høyer Promix A/S – – – – – – – – 16 16Nitrile India Pvt Ltd – – – – – – – – 6 6Standard Refrigeration – – – 5 166 – – 171 152 323Pressko AG – – – 1 – – – 1 69 70Hutchison Hayes Separation – – – 1 95 49 – 145 46 191P&D's Plattvärmeväxlarservice – – – – – – – – 10 10Ageratec – – – – – – – – 44 442009 Two providers of parts & service – – – – – 291 – 291 210 501Onnuri Industrial Machinery – – – – 40 39 – 79 48 127HES Heat Exchanger Systems – – – – 83 – – 83 59 142Public offer Alfa Laval (India) – – – – – – – – 311 311Termatrans – – – – – 7 – 7 6 13Tranter acquisitions in Latin America – – – – – 20 – 20 16 36ISO Mix – – – – 22 – – 22 – 22LHE – – – – 298 297 – 595 344 9392010 Champ Products – – – – 15 14 – 29 2 31A leading U.S. service provider – – – – – 134 – 134 82 216G.S Anderson – – – – 35 – – 35 23 58Astepo – – – – 24 15 – 39 8 47Si Fang Stainless Steel Products – – – – 27 16 – 43 42 85Definox – – – – 4 5 – 9 2 11Olmi – – – 37 58 32 – 127 – 1272011 Service company in the U.S. – – – – – 150 – 150 126 276Aalborg Industries 248 – – – 430 860 – 1,538 3,630 5,168
2012 Vortex Systems – – – – 148 – – 148 225 373Ashbrook Simon-Hartley – – – – 86 – – 86 55 141Gamajet Cleaning Systems – – – – 47 – – 47 37 84Air Cooled Exchangers (ACE) – – – – 585 – – 585 346 9312013 Niagara Blower Company – – – – 202 – – 202 203 4052014 Frank Mohn AS – – – 38 1,160 3,793 - 4,991 9,830 14,821CorHex Corp – – – – 15 – – 15 – 15Accumulated during the period Realised -524 122 -24 -435 – – -99 -960 – -960Write down -6 -9 – – – – – -15 -48 -63Planned depreciation/amortisation -376 – -422 – -2,661 -1,647 -571 -5,677 -612 -6,289Translation difference -10 60 -6 1 174 -115 10 114 -247 -133Closing balance 417 -47 – – 2,881 4,920 – 8,171 20,408 28,579
The acquisition of the Alfa Laval Holding AB group in connection with the acquisition by Industri Kapital of the Alfa Laval Group from Tetra Laval on August 24, 2000 is shown on the first row.
“Other” relates to step up values from 2000 for “Machinery” of SEK 548 million that has been fully depreciated or realised, for “Research and development” of SEK 54 million and “Capital gain (Industrial Flow)” of SEK 42 million that have been fully realised and for “Construction in process” of SEK 16 million that has been transferred to “Machinery”.

115Financial statements
Acquisition of businessesDuring 2014In a news release on April 7, 2014 Alfa Laval communicated that the company had signed an agreement to acquire Frank Mohn AS, a leading manufacturer of submerged pumping systems to the marine and offshore markets. After approval from regulatory authorities the acquisition was closed on May 21, 2014. The acquisition, which strengthens Alfa Laval’s fluid handling portfolio by adding a unique pumping technology, will further reinforce Alfa Laval’s position as a leading supplier to the marine and offshore oil & gas markets. Alfa Laval has acquired 100 percent of Frank Mohn AS (“Frank Mohn”), with the product brand Framo, for a total cash consideration of NOK 13 billion, on cash and debt free basis, from Wimoh AS, a company controlled by the Mohn family. Frank Mohn is headquartered in Bergen, Norway. The operating margin is significantly above the Alfa Laval average. Lars Renström, President and CEO of the Alfa Laval Group, commented on the acquisition: “Frank Mohn is an excellent company that we have been following closely for several years. It has highly skilled employees, high quality products and a market-leading position within segments offering attractive long-term growth prospects. The combination of Frank Mohn and Alfa Laval will provide a very attractive offering of products, systems and services and it will strengthen our leading position as a provider of critical systems for ships and offshore oil & gas production units, with unmatched service capabilities.” The acquisition of Frank Mohn was funded by existing credit facilities and a fully committed bridge facility. The bridge loan has been replaced by two tranches of corporate bonds issued by Alfa Laval. The synergies from the acquisition are expected to reach about NOK 120 million annually, gradually realized over a three year period. Alfa Laval has included Frank Mohn and the product brand Framo in the Marine & Diesel division in a new capital sales segment, Marine & Offshore Pumping Systems. The company will be kept together under the same management as today. The activities in the Bergen area in Norway; the head office and sales & service facility at Askøy – as well as production facilities at Fusa, Flatøy and Frekhaug – will become Alfa Laval’s operational centre for marine and offshore pumping systems. The purchase price is SEK 14,782 million, out of which everything has been paid in cash. The costs directly linked to the acquisition (fees to lawyers, due diligence and assisting counsel) come in addition to this and have amounted to SEK 51 million, which is reported as other operating costs.
Liquid assets of SEK 504 million in the acquired company were taken over. The impact on the cash flow is thus SEK -14,329 million. Out of the difference between the purchase price paid and the net assets acquired SEK 1,160 million is allocated to patents and un-patented know-how, SEK 3,793 million to the product brand Framo and SEK 38 million to accrued profit in inventory, while the residual SEK 9,830 million is allocated to goodwill. The goodwill is relating to estimated synergies in procurement, logistics and corporate overheads and the company’s ability to over time recreate its intangible assets. The value of the goodwill is still preliminary. The step up value for patents and un-patented know-how and the step up value for the product brand Framo are both amortised over 10 years. The step up value related to accrued profit in inventory is realised according to the inventory turnover rate. From the date of the acquisition the company has added SEK 3,781 million in orders received, SEK 3,333 million in invoicing and SEK 1,008 million in adjusted EBITA to Alfa Laval. If the company had been acquired at January 1, 2014 the corresponding figures would have been SEK 5,696 million, SEK 5,131 million and SEK 1,087 million respectively. At the end of December 2014 the number of employees was 1,263.
On November 4, 2014 Alfa Laval acquired 100 percent of the Korean company CorHex Corp. The company is a small development company within heat transfer technology. The purchase price is SEK 10 million, out of which all has been paid in cash. The costs directly linked to the acquisition (fees to lawyers, due diligence and assisting counsel) come in addition to this and have amounted to SEK 1 million, which is reported as other operating costs. Liquid assets of SEK 0 million in the acquired company were taken over. The impact on the cash flow is thus SEK -11 million. Out of the difference between the purchase price paid and the net assets acquired SEK 15 million is allocated to patents and un-patented know-how, while nothing is allocated to goodwill. The value of the goodwill is still preliminary. The step up value for patents and un-patented know-how is amortised over 10 years. From the date of the acquisition the company has added SEK 6 million in orders received, SEK 1 million in invoicing and SEK -2 million in adjusted EBITA to Alfa Laval. If the company had been acquired at January 1, 2014 the corresponding figures would have been SEK 13 million, SEK 7 million and SEK -5 million respectively. At the end of December 2014 the number of employees was 12.
Payment of retained parts of the purchase price from previous acquisitions constitutes the remaining part of the cash flow related to acquisition of businesses.
Acquisitions 2014
Consolidated
Frank Mohn Others Total
SEK millions Book valueAdjustment to
fair value Fair value Book valueAdjustment to
fair value Fair value Fair valueProperty, plant and equipment 1,100 – 1,100 1 – 1 1,101Patents and unpatented know-how 1) 0 1,160 1,160 2 15 17 1,177Trademarks 2) – 3,793 3,793 – – – 3,793Other non-current assets 95 – 95 – – – 95Inventory 847 38 885 1 – 1 886Accounts receivable 981 – 981 1 – 1 982Other receivables 255 – 255 – – – 255Current deposits 51 – 51 1 – 1 52Liquid assets 504 – 504 0 – 0 504Provisions for pensions and similar commitments -47 – -47 – – – -47Other provisions -142 – -142 – – – -142Equity attributable to non-controlling interests -17 – -17 – – – -17Loans – – – -4 – -4 -4Accounts payable -235 – -235 -1 – -1 -236Advance payments -1,260 – -1,260 – – – -1,260Other liabilities -563 – -563 -2 – -2 -565Tax liabilities -257 – -257 – – – -257Deferred tax -3 -1,348 -1,351 – -4 -4 -1,355Acquired net assets 1,309 3,643 4,952 -1 11 10 4,962Goodwill 3) 9,830 - 9,830Purchase price -14,782 -10 -14,792Costs directly linked to the acquisitions 4) -51 -1 -52Liquid assets in the acquired businesses 504 0 504Payment of amounts retained in prior years – -103 -103Effect on the Group's liquid assets -14,329 -114 -14,443
1) The step up value for patents and un-patented know-how is amortised over 10 years.2) The step up value for the product brand Framo is amortised over 10 years.3) The goodwill is relating to estimated synergies in procurement, logistics and corporate overheads and the companies’ ability to over time recreate its intangible assets. The value of
the goodwill is still preliminary.4) Refers to fees to lawyers, due diligence and assisting counsel. Has been expensed as other operating costs.
All acquired assets and liabilities were reported according to IFRS at the time of the acquisition.
The acquisitions during 2014 can be summarized as follows. Please observe that the purchase price allocations for Frank Mohn and CorHex are still preliminary.

116 Financial statements
Acquisitions 2013
Consolidated
Minority in subsidiaries Others Total
SEK millions Book valueAdjustment to
fair value Fair value Book valueAdjustment to
fair value Fair value Fair valueProperty, plant and equipment – – – 13 – 13 13
Patents and unpatented know-how 1) – – – 32 202 234 234
Inventory – – – 14 – 14 14
Accounts receivable and other receivables – – – 24 – 24 24
Liquid assets – – – 8 – 8 8
Accounts payable and other liabilities – – – -62 – -62 -62
Deferred tax – – – 2 – 2 2
Acquired net assets – – – 31 202 233 233
Goodwill 2) – 236 236
Equity attributable to owners of parent -49 – -49
Currency translation -8 – -8
Equity attributable to non-controlling interests -5 – -5
Purchase price -62 -469 -531
Costs directly linked to the acquisitions 3) -1 -1 -2
Retained part of purchase price 4) – 66 66
Liquid assets in the acquired businesses – 8 8
Payment of amounts retained in prior years – -36 -36
Effect on the Group's liquid assets -63 -432 -495
1) The step up value for patents and un-patented know-how is amortised over 10 years. 2) The goodwill is relating to estimated synergies in procurement, logistics and corporate overheads and the companies’ ability to over time recreate its intangible assets. The value of
the goodwill is still preliminary.3) Refers to fees to lawyers, due diligence and assisting counsel. Has been expensed as other operating costs.4) Contingent on certain warranties in the contract not being triggered or that certain profitability goals are fulfilled. The probable outcome has been calculated.
All acquired assets and liabilities were reported according to IFRS at the time of the acquisition. The acquisitions of minority shares in different subsidiaries and other acquisitions are not reported per acquisition since such a reporting would have been too fragmented and rather would have burdened the presentation than increased clarity. Instead they are reported together split on acquisitions of minority shares in subsidiaries and other acquisitions.
The acquisitions during 2013 can be summarized as follows:
During 2013On May 29, 2013 Alfa Laval acquired the U.S. based Niagara Blower Company, a manufacturer of energy-efficient niche heat transfer solutions. The company’s products are engineered-to-order, and particularly suited for use in the oil and gas processing industries. They are also used in a wide range of other industries, such as power, food & beverage and pharmaceuticals. Lars Renström, President and CEO of the Alfa Laval Group, comments on the reasons for the acquisition: “The acquisition of Niagara Blower brings in new and complementary heat-transfer products, mainly air-cooled heat exchangers, which further strengthen our offering to the oil and gas processing industries. They strengthen our U.S. portfolio and will gradually also be added to our product offering on a global scale.” Niagara Blower Company is located in Buffalo, New York. The intention is to integrate Niagara Blower into the segment Energy & Environment, within the Process Technology Division. The purchase price is SEK 444 million, out of which SEK 379 million has been paid in cash and SEK 65 million is retained for a period of 1-1.5 years. The retained part of the purchase price is contingent on certain warranties in the contract not being triggered or that certain profitability goals are fulfilled. The outcome can be anything between SEK 0 million and SEK 199 million, but the probable outcome is SEK 65 million, which is also the fair value since the contingent consideration is to be paid in cash. The costs directly linked to the acquisition (fees to lawyers, due diligence and assisting counsel) come in addition to this and have amounted to SEK 1 million, which is reported as other operating costs. Liquid assets of SEK 8 million in the acquired company were taken over. The impact on the cash flow is thus SEK -372 million. Out of the difference between the purchase price paid and the net assets acquired SEK 202 million is allocated to patents and un-patented know-how, while the residual SEK 236 million is allocated to goodwill. The goodwill is relating to estimated synergies in procurement, logistics and corporate overheads and the company’s ability to over time recreate its intangible assets. In connection with the finalisation of the purchase price allocation in 2014 the value of the goodwill has been decreased by SEK 33 million to SEK 203 million. The step up value for patents and un-patented know-how is amortised over 10 years. From the date of the acquisition the company has added SEK 41 million in orders received, SEK 119 million in invoicing and SEK 17 million in adjusted EBITA to Alfa Laval. If the company had been acquired at January 1, 2013 the corresponding figures would have been SEK 127 million, SEK 289 million and SEK 63 million respectively. At the end of December 2013 the number of employees was 98.
On February 28, 2013 Alfa Laval acquired the assets and technology for a gas combustion unit from the company Snecma (Safran). The product, which will be included in the offering from the Marine & Offshore Systems segment, is expected to generate sales of about SEK 40 million in 2013. Lars Renström, President and CEO of the Alfa Laval Group, comments on the acquisition: “With this acquisition we expand and further strengthen our offer to the growing gas transportation business, a business which typically has high barriers to entry. Few companies can offer this type of safety equipment.” The purchase price of SEK 42 million has been paid in cash. The impact on the cash flow is thus SEK -42 million.
In a press release on September 19, 2011 Alfa Laval communicated its proposal to buy all outstanding shares in its subsidiary Alfa Laval (India) Ltd and seek delisting of the shares from Bombay Stock Exchange Limited and National Stock Exchange of India Limited. The proposal came on the back of regulatory changes in India which requires Alfa Laval (India) Ltd to have a minimum public float of 25 percent or seek delisting. In a reverse book building process that was finalised on February 23, 2012 minority shareholders together holding more than the necessary 50 percent of the public float were willing to sell to Alfa Laval at a price of INR 4,000 per share. Through the acquisition of the 1.03 million shares Alfa Laval achieved an ownership of 94.5 percent, which enabled Alfa Laval (India) Ltd to delist from both stock exchanges on April 12, 2012. The cost for the acquisition of the shares was SEK 553 million. As a part of the process the remaining minority owners could sell their shares to Alfa Laval for INR 4,000 during the next 12 months. During this period minority owners with an additional 0.68 million shares have sold their shares to Alfa Laval for SEK 340 million, which has increased Alfa Laval’s ownership to 98.2 percent. This means that the total acquisition cost was SEK 893 million. The purchase price for the purchases made in 2013 of SEK 62 million has been paid in cash. The costs directly linked to the acquisition (fees to lawyers, due diligence and assisting counsel) come in addition to this and have amounted to SEK 1 million, which is reported as other operating costs. The impact on the cash flow is thus SEK -63 million. The difference of SEK 50 million between the purchase price paid and the net assets acquired is reported against equity.
On February 22, 2013 Alfa Laval acquired the remaining minority shares in the company Tranter Solarice GmbH in Germany. The purchase price of SEK 0 million has been paid in cash. The impact on the cash flow is thus SEK -0 million. The difference of SEK -1 million between the purchase price paid and the net assets acquired is reported against equity.
Payment of retained parts of the purchase price from previous acquisitions constitutes the remaining part of the cash flow related to acquisition of businesses.

117Financial statements
Impairment testingAn impairment test has been performed at the end of 2014 indicating that there is not any need to write down the goodwill.
Three of Alfa Laval’s operating segments, the three divisions “Equipment”, “Process Technology” and “Marine & Diesel” have been identified as the cash-generating units within Alfa Laval. Technically a recently acquired busi-ness activity could be followed independently during an initial period, but ac-quired businesses are normally integrated into the divisions at a fast rate. This means that the independent traceability is lost fairly soon and then any independent measurement and testing becomes impracticable. Although Tranter is operating as a separate sales channel it is subject to a considerable co-ordination related to purchasing and some support functions.
The recoverable amount of the cash-generating units is based on their value in use, which is established by calculating the net present value of fu-ture cash flows. The net present value is based on the projected EBITDA fig-ures for the next twenty years, less projected investments and changes in operating capital during the same period. This projection for the coming 20 years is based on the following components:
– The projection for 2015 is based on the Groups normal 12 month revolving ”Forecast” reporting. This is based on a very large number of rather detailed assumptions throughout the organisation concerning the business cycle, volume growth, market initiatives, product mix, currency rates, cost devel-opment, cost structure, R&D etc.
– The projection for the years 2016 and 2017 is based on Management’s general assumptions concerning the business cycle, volume growth, mar-ket initiatives, product mix, currency rates, cost development, cost struc-ture, R&D etc.
– The projection for the years 2018 to 2034 is based on the perceived ex-pected average industry growth rate.
The reason why a longer period than 5 years has been used for the calcula-tion of the net present value is that Management considers 5 years to be a too short period for an operation where applying the going concern concept can be justified.
The assumptions used for the projections reflect past experiences or in-formation from external sources.
The used discount rate is the pre-tax weighted average cost of capital (WACC) of 7.88 (8.95) percent.
There exists no reasonably possible change in a key assumption in the impairment test that would cause the carrying amount to exceed the recoverable amount. The reason is that the recoverable amounts with a very good margin exceed the carrying amounts. Due to this a sensitivity analysis is not presented.
Alfa Laval does not have any intangible assets with indefinite useful lives other than goodwill.
The three cash-generating units have been allocated the following amounts of goodwill:
Goodwill
Consolidated
SEK millions 2014 2013
Equipment 2,697 2,408
Process Technology 3,753 3,370
Marine & Diesel 13,958 4,283
Total 20,408 10,061
Note 17. Intangible non-current assets
Patents and unpatented know-how
Consolidated
SEK millions 2014 2013Accumulated acquisition values Opening balance 4,158 3,876Purchases – 2Acquisition of businesses 2 32Sales/disposals – -6Reclassifications -1 –Step-up values 1,175 202Translation difference 435 52
Closing balance 5,769 4,158
Accumulated amortisation Opening balance -2,231 -1,933Sales/disposals – 3Reclassifications 0 –Amortisation of step-up value -375 -274Amortisation for the year -5 -2Translation difference -226 -25
Closing balance -2,837 -2,231
Closing balance, net book value 2,932 1,927
Trademarks
Consolidated
SEK millions 2014 2013Accumulated acquisition values Opening balance 2,793 2,750Step-up values 3,793 –Translation difference 116 43
Closing balance 6,702 2,793
Accumulated amortisation Opening balance -1,175 -931Amortisation of step-up values -470 -229Translation difference -137 -15
Closing balance -1,782 -1,175
Closing balance, net book value 4,920 1,618
Licenses, renting rights and similar rights
Consolidated
SEK millions 2014 2013Accumulated acquisition values Opening balance 224 224Purchases 8 3Sales/disposals -39 -13Reclassifications 0 20Translation difference 27 -10
Closing balance 220 224
Accumulated amortisation Opening balance -187 -179Sales/disposals 25 0Reclassifications -5 -1Amortisation for the year -8 -8Translation difference 1 1
Closing balance -174 -187
Closing balance, net book value 46 37
Alfa Laval does not have any internally generated intangible assets.

118 Financial statements
Goodwill
Consolidated
SEK millions 2014 2013Accumulated acquisition values Opening balance 10,583 10,318Goodwill in connection with acquisition of businesses 9,797 174Translation difference 600 91
Closing balance 20,980 10,583
Accumulated amortisation Opening balance -522 -526Translation difference -50 4
Closing balance -572 -522
Closing balance, net book value 20,408 10,061
Note 18. Property, plant and equipment
Real estate
Consolidated
SEK millions 2014 2013Accumulated acquisition values Opening balance 2,853 2,802Purchases 101 56Acquisition of businesses 1,556 0Sales/disposal -32 -26Write-down -41 –Reclassifications 20 75Reclassification to assets for sale -16 –Write down of step-up values -6 –Translation difference 244 -54
Closing balance 4,679 2,853
Accumulated depreciation Opening balance -1,309 -1,222Sales/disposals 14 11Acquisition of businesses -636 –Reclassifications 2 -6Reclassification to assets for sale 13 –Depreciation of step-up value -32 -31Depreciation for the year -111 -67Translation difference -137 6
Closing balance -2,196 -1,309
Closing balance, net book value 2,483 1,544
Non-current assets held for saleWithin Alfa Laval these assets are normally relating to real estate.
Alfa Laval Aalborg BV moved to Alfa Laval’s office in Breda in the Nether-lands in the first half of 2013. The vacated property in Spijkenisse in the Netherlands is to be sold, but it is not expected to be sold within the next year. One small property in France is planned for sale. It is empty and has been for sale for several years. It is not expected to be sold within the next year. As a consequence of the decided cost reduction programme some operations will be re-organised and the concerned properties be sold in the US, China, Germany and the Netherlands. Only the property in China is ex-pected to be sold within the next year. Due to this it has been re-classified as a current asset held for sale with SEK 6 (-) million.
Machinery and other technical installations
Consolidated
SEK millions 2014 2013 *Accumulated acquisition values Opening balance 4,738 4,611Purchases 213 160Acquisition of businesses 1,371 13Sales/disposal -105 -153Reclassifications 51 147Translation difference 421 -40
Closing balance 6,689 4,738
Accumulated depreciation Opening balance -3,315 -3,195Sales/disposals 92 132Acquisition of businesses -1,294 -3Reclassifications 8 -8Depreciation for the year -306 -255Translation difference -288 14
Closing balance -5,103 -3,315
Closing balance, net book value 1,586 1,423
* Restated to IFRS 11.
Equipment, tools and installations
Consolidated
SEK millions 2014 2013 *Accumulated acquisition values Opening balance 2,086 2,016Purchases 131 149Acquisition of businesses 376 0Sales/disposal -103 -85Reclassifications 9 31Translation difference 131 -25
Closing balance 2,630 2,086
Accumulated depreciation Opening balance -1,539 -1,488Sales/disposals 90 79Acquisition of businesses -320 0Reclassifications -4 -20Depreciation of step-up value -27 -27Depreciation for the year -126 -103Translation difference -105 20
Closing balance -2,031 -1,539
Closing balance, net book value 599 547
* Restated to IFRS 11.
Construction in progress and advances to suppliers concerning property, plant and equipment
Consolidated
SEK millions 2014 2013
Accumulated acquisition values
Opening balance 137 150
Purchases 150 122
Reclassifications -105 -137
Translation difference 22 2
Closing balance 204 137
Closing balance, net book value 204 137

119Financial statements
Leased real estate
Consolidated
SEK millions 2014 2013
Accumulated acquisition values
Opening balance 153 147
Sales/disposal -5 –
Translation difference 9 6
Closing balance 157 153
Accumulated depreciation
Opening balance -33 -25
Sales/disposals 3 –
Depreciation for the year -6 -7
Translation difference -2 -1
Closing balance -38 -33
Closing balance, net book value 119 120
Leased machinery
Consolidated
SEK millions 2014 2013
Accumulated acquisition values
Opening balance 34 33
Translation difference 3 1
Closing balance 37 34
Accumulated depreciation
Opening balance -22 -19
Depreciation for the year -3 -3
Translation difference -1 0
Closing balance -26 -22
Closing balance, net book value 11 12
Leased equipment, tools and installations
Consolidated
SEK millions 2014 2013
Accumulated acquisition values
Opening balance 3 3
Purchases 1 –
Sales/disposal 0 0
Reclassifications 0 –
Translation difference -1 0
Closing balance 3 3
Accumulated depreciation
Opening balance -1 -1
Sales/disposals – 0
Reclassifications 0 1
Depreciation for the year – -1
Translation difference 0 0
Closing balance -1 -1
Closing balance, net book value 2 2
Leased real estate, machinery and equipment relate to fixed assets which are leased and where the leasing agreement has been considered to be a financial lease. These financial leases are capitalised in the statement on financial position.
Note 19. Other non-current assets
Shares in subsidiaries, joint ventures and other companies
Consolidated Parent company
SEK millions 2014 2013 2014 2013Shares in subsidiaries – – 4,669 4,669Shares in joint ventures 22 27 – –Shares in other companies 8 8 – –Total 30 35 4,669 4,669
Alfa Laval does not hold any shares in unconsolidated structured entities.The consolidated financial statements include the parent company Alfa
Laval AB (publ) and the subsidiaries in which it has a decisive influence, which in all cases refer to companies where the parent company directly or indirectly had an ownership of more than 50 percent during the period. These are consolidated according to the purchase method and are referred to as subsidiaries. Most of the subsidiaries are owned to 100 percent and only 11 companies have non-controlling interests, see note 12. The Subsidi-aries are displayed in the first table below. Since all consolidated companies are owned to more than 50 percent there is no risk that judgements if a de-cisive influence exists or not at ownerships below 50 percent means that companies from time to time are included or not included in the consolidation.
Alfa Laval also has interests in four small joint ventures that are consolidated according to the equity method since no decisive influence exists. These are displayed in a separate table below. The risks associated with joint ventures are basically business oriented and are not materially different than the risks linked to subsidiaries, with one exception. The exception relates to the risk of disagreeing with the other joint venture partner concerning for instance larger investments, financing and future direction for market penetration and product development, which could result in a sub-optimal development of the operations. Since Alfa Laval’s joint ventures are of marginal significance for the Group as a total this risk is judged to be small.
The share of capital in the below tables is in all cases the same as the share of voting rights.

120 Financial statements
Specification of shares in subsidiaries
Company nameRegistration
number DomicileNumber of
sharesShare of
capital %Book value
SEK millionsAlfa Laval Holding AB 556587-8062 Lund, Sweden 8,191,000 100 4,461
Alfa Laval NV Maarssen, Netherlands 887,753 100 –Alfa Laval Inc. Newmarket, Canada 1,000,000 67 –Alfa Laval S.A. DE C.V. Tlalnepantla, Mexico 45,057,057 100 –Alfa Laval S.A. San Isidro, Argentina 1,223,967 95 –Alfa Laval Ltda Sao Paulo, Brazil 21,129,068 100 –Alfa Laval SpA Santiago, Chile 2,735 100 –
Ashbrook Chile S.A. Santiago, Chile 579,999 100 –Ashbrook Do Brasil Ltda Pinhais, Brazil 1,000 100 –
Alfa Laval S.A. Bogota, Colombia 12,195 100 –Alfa Laval S.A. Lima, Peru 4,346,832 100 –Alfa Laval Venezolana S.A. Caracas, Venezuela 10,000 100 –
Alfa Laval Oilfield C.A. Caracas, Venezuela 203 81 –Alfa Laval Taiwan Ltd Taipei, Taiwan 1,499,994 100 –Alfa Laval (China) Ltd Hong Kong, China 79,999 100 –
Alfa Laval (Jiangyin) Manufacturing Co Ltd Jiang Yin, China 100 –Alfa Laval Flow Equipment (Kunshan) Co Ltd Jiangsu, China 75 –
Alfa Laval Flow Equipment (Kunshan) Co Ltd Jiangsu, China 25 –Alfa Laval (Shanghai) Technologies Co Ltd Shanghai, China 100 –Wuxi MCD Gasket Co Ltd Jiang Yin, China 100 –Tranter Heat Exchangers (Beijing) Co Ltd Beijing, China 100 –Liyang Sifang Stainless Steel Products Co., Ltd Liyang City, China 65 –
Alfa Laval Iran Ltd Teheran, Iran 32,983 100 –Alfa Laval Industry (PVT) Ltd Lahore, Pakistan 119,110 100 –Alfa Laval Philippines Inc. Makati, Philippines 72,000 100 –Alfa Laval Singapore Pte Ltd Singapore 5,000,000 100 –Alfa Laval (Thailand) Ltd Bangkok, Thailand 792,000 100 –Alfa Laval Middle East Ltd Nicosia, Cyprus 40,000 100 –
Alfa Laval Service Operations Qatar LLC Doha, Qatar 9,800 49 –Alfa Laval Benelux NV/SA Brussels, Belgium 98,284 100 –Alfa Laval EOOD Sofia, Bulgaria 100 100 –Alfa Laval Slovakia S.R.O. Bratislava, Slovakia 1 –Alfa Laval Spol S.R.O. Prague, Czech Republic 20 –Alfa Laval Nordic OY Espoo, Finland 20,000 100 –
Alfa Laval Vantaa OY Vantaa, Finland 7,000 100 –Alfa Laval Nederland BV Maarssen, Netherlands 10,000 100 –
Alfa Laval Benelux BV Maarssen, Netherlands 20,000 100 –Helpman Capital BV Breda, Netherlands 35,578 100 –
Helpman Holding BV Naarden, Netherlands 80 100 –Alfa Laval Groningen BV Groningen, Netherlands 15,885 100 –
PHE Holding AB 556306-2404 Lund, Sweden 2,500 100 –Tranter Heat Exchangers Canada Inc. Edmonton, Canada 100 100 –Tranter Latin America S.A. de C.V. Queretaro, Mexico 49,999 100 –Tranter Indùstria e Comércio de Equipamentos Ltda Sao Paulo, Brazil 100 –MCD Nitrile India Pvt Ltd Falta, India 2,432 9 –Tranter India Pvt Ltd Poona, India 3,009,999 100 –Alfa Laval Korea Ltd Seoul, South Korea 36,400 10 –Alfa Laval Korea Holding Company Ltd Chungnam, South Korea 13,318,600 100 –
Alfa Laval Korea Ltd Seoul, South Korea 327,600 90 –Alfa Laval Corhex Ltd Daejeon, South Korea 50,000 100
LHE Co. Ltd Gim Hae, South Korea 4,560,000 100 –LHE (Qingdao) Heat Exchanger Co. Ltd Jiaozhou City, China 100 –Kenus LLP Almaty, Kazakhstan 90 –
Tranter Heat Exchangers Middle East (Cyprus) Ltd Nicosia, Cyprus 20,000 100 –MCD SAS Guny, France 7,130 10 –Tranter Srl Monza, Italy 100Tranter International AB 556559-1764 Vänersborg, Sweden 100,000 100 –Multbran AB 556662-3988 Lund, Sweden 2,723 100 –Breezewind AB 556773-6532 Lund, Sweden 1,000 100 –OOO Tranter CIS Moscow, Russia 100 –
Alfa Laval Nordic AB 556243-2061 Tumba, Sweden 1,000 100 –Alfa Laval Corporate AB 556007-7785 Lund, Sweden 13,920,000 100 –
Alfa Laval S.A. San Isidro, Argentina 64,419 5 –Definox (Beijing) Stainless Steel Equipment Ltd Beijing, China 100 –Alfa Laval (Kunshan) Manufacturing Co Ltd Kunshan, China 100 –Alfa Laval (India) Ltd Poona, India 17,832,739 98.2 –Alfa Laval Support Services Pvt Ltd Poona, India 10 0 –Tranter India Pvt Ltd Poona, India 1 0 –PT Alfa Laval Indonesia Jakarta, Indonesia 1,249 100 –
The below specification of shares contains some simplifications, for instance in connection with ownership in multiple layers or when the ownership is split on several owners or at cross-holdings. This is in order not to unnecessarily burden the presentation. A complete specification of shares can be ordered by contacting Alfa Laval’s head office in Lund or via the Swedish Companies Registration Office (Bolagsverket).

121Financial statements
Specification of shares in subsidiaries
Company nameRegistration
number DomicileNumber of
sharesShare of
capital %Book value
SEK millions
Alfa Laval (Malaysia) Sdn Bhd Shah Alam, Malaysia 10,000 100 –Alfa Laval Kolding A/S Kolding, Denmark 40 100 –
Alfa Laval Nordic A/S Rödovre, Denmark 1 100 –Alfa Laval Copenhagen A/S Söborg, Denmark 1 100 –Alfa Laval Nakskov A/S Nakskov, Denmark 242,713 100 –
Alfa Laval Aalborg A/S Aalborg, Denmark 2,560,972 100 –Alfa Laval Aalborg Ltda Petrópolis, Brazil 5,969,400 99,5 –Aalborg Industries Ltda Itu, Brazil 4,644,373 100 –Alfa Laval Aalborg Ltd Shanghai, China 100 –Alfa Laval Qingdao Ltd Jiaozhou City, China 100 –Alfa Laval Aalborg Ltd Hong Kong, China 99 100 –Aalborg Industries Engineering Bhd Kuala Lumpur, Malaysia 100 –Aalborg Industries Water Treatment Pte Ltd Singapore 4,800,000 60 –Alfa Laval HaiPhong Co. Ltd HaiPhong, Vietnam 100 –Alfa Laval Aalborg Oy Rauma, Finland 3,000 100 –Alfa Laval Nijmegen BV Nijmegen, Netherlands 182 100 –Alfa Laval Aalborg Holding Pty Ltd North Wyong, Australia 11,500,000 100 –
Alfa Laval Aalborg Pty Ltd North Wyong, Australia 225,000 100 –Alfa Laval SAS Saint-Priest, France 46,700 7,7 –Alfa Laval Olmi SpA Suisio, Italy 500,000 100 –Alfa Laval Italy Srl Milano, Italy 100 –Alfa Laval Nordic A/S Oslo, Norway 100 100 –
Frank Mohn AS Nesttun, Norway 95,347,695 100 –Frank Mohn Mexico Sa de CV Mexico City, Mexico 49,999 99.99 –Frank Mohn Houston, Inc. La Porte, Texas, the US 5,000 100 –Frank Mohn do Brasil Ltda. Rio de Janeiro, Brazil 303,002 95.33 –Frank Mohn Shanghai Ltd. Shanghai, China 0 100 –Frank Mohn China Ltd. Hong Kong, China 50,000 100 –Frank Mohn Nippon K.K. Tokyo, Japan 600 100 –Chang San Engineering Co. Ltd. Busan, South Korea 15,000 75 –Frank Mohn Singapore PTE Ltd. Singapore 1,000,000 100 –Frank Mohn Nederland B.V. Spijkenisse, Netherlands 500 100 –Frank Mohn Fusa AS Fusa, Norway 86,236 100 –
Frank Mohn Piping AS Frekhaug, Norway 25,000 100 –Fusatun AS Fusa, Norway 1,520 99.35 –
Frank Mohn Flatøy AS Frekhaug, Norway 45,330 100 –Frank Mohn Services AS Nesttun, Norway 10,000 100 –
PHE Holding AS Nesttun, Norway 45,000 100 –Alfa Laval Oilfield C.A. Caracas, Venezuela 47 19 –
Alfa Laval Treasury International AB 556432-2484 Lund, Sweden 50,000 100 –Alfa Laval Europe AB 556128-7847 Lund, Sweden 500 100 –Alfa Laval Lund AB 556016-8642 Lund, Sweden 100 100 –Alfa Laval International Engineering AB 556039-8934 Lund, Sweden 4,500 100 –Alfa Laval Tumba AB 556021-3893 Tumba, Sweden 1,000 100 –Alfa Laval Makine Sanayii ve Ticaret Ltd Sti Istanbul, Turkey 27,001,755 99 –Alfa Laval SIA Riga, Latvia 125 100 –Alfa Laval UAB Ltd Vilnius, Lithuania 2,009 100 –Alfa Laval Australia Pty Ltd Homebush, Australia 2,088,076 100 –
Tranter Heat Exchanger Pty Ltd Sydney, Australia 600,000 100 –Alfa Laval New Zeeland Pty Ltd Hamilton, New Zeeland 1,000 100 –
Alfa Laval Holding BV Maarssen, Netherlands 60,035,631 100 –Alfa Laval (Pty) Ltd Isando, South Africa 2,000 100 –Alfa Laval Slovakia S.R.O. Bratislava, Slovakia 99 –Alfa Laval Spol S.R.O. Prague, Czech Republic 80 –Alfa Laval France SAS Saint-Priest, France 2,000,000 100 –
Alfa Laval SAS Saint-Priest, France 560,000 92.3 –Alfa Laval Moatti SAS Elancourt, France 24,000 100 –Alfa Laval Spiral SAS Nevers, France 79,999 100 –MCD SAS Guny, France 64,170 90 –Alfa Laval Vicarb SAS Grenoble, France 200,000 100 –
Canada Inc. Newmarket, Canada 480,000 100 –Alfa Laval Inc. Newmarket, Canada 481,600 33 –
SCI du Companil Grenoble, France 32,165 100 –Alfa Laval HES SAS Pontcharra sur Turdine,
France 150,000 100 –Alfa Laval Packinox SAS Paris, France 348,115 100 –
Ziepack SA Paris, France 37,701 51 –Tranter SAS Nanterre, France 100 –Definox SAS Gétigné, France 10,000 100 –
Alfa Laval Holding GmbH Glinde, Germany 1 100 –Alfa Laval Mid Europe GmbH Wiener Neudorf, Austria 1 100 –
Tranter Warmetauscher GmbH Guntramsdorf, Austria 100 –
, continued

122 Financial statements
Specification of shares in subsidiaries
Company nameRegistration
number DomicileNumber of
sharesShare of
capital %Book value
SEK millions
Alfa Laval Mid Europe GmbH Glinde, Germany 1 100 –Alfa Laval Stormarn GmbH Glinde, Germany 1 100 –Tranter GmbH Artern, Germany 1 100 –
Tranter Solarice GmbH Artern, Germany 100 –Alfa Laval Mid Europe AG Dietlikon, Switzerland 647 100 –
Alfa Laval AEBE Holargos, Greece 807,000 100 –Alfa Laval Kft Budapest, Hungary 1 100 –Alfa Laval SpA Monza, Italy 1,992,276 99 –Alfa Laval Polska Sp.z.o.o. Warsaw, Poland 7,600 100 –Alfa Laval Kraków Sp.z.o.o. Krakow, Poland 80,080 100 –Alfa Laval (Portugal) Ltd Linda-A-Velha, Portugal 1 –Alfa Laval SRL Bucharest, Romania 38,566 100 –Alfa Laval Iberia SA Madrid, Spain 99,999 100 –
Alfa Laval (Portugal) Ltd Linda-A-Velha, Portugal 1 99 –Alfa Laval Holdings Ltd Camberley, UK 14,053,262 100 –
Alfa Laval Ltd Camberley, UK 11,700,000 100 –Tranter Ltd Doncaster, UK 10,000 100 –
Alfa Laval Eastbourne Ltd Eastbourne, UK 10,000 100 –Ashbrook Simon-Hartley Ltd Newcastle-under-Lyme, UK 2 100 –
Alfa Laval Makine Sanayii ve Ticaret Ltd Sti Istanbul, Turkey 1 1 –Alfa Laval USA Inc. Richmond, Virginia, USA 1,000 100 –
Alfa Laval US Holding Inc. Richmond, Virginia, USA 180 100 –Alfa Laval Inc. Richmond, Virginia, USA 44,000 100 –Niagara Blower Company Inc Buffalo, New York, USA 4,000,200 100 –Alfa Laval US Treasury Inc. Richmond, Virginia, USA 1,000 100DSO Fluid Handling Inc. Irvington, New Jersey, USA 100 100 –AGC Heat Transfer Inc. Bristow, Virginia, USA 1,000 100 –Tranter Inc. Wichita Falls, Texas, USA 1,000 100 –MCD Gaskets Inc. Richmond, Virginia, USA 1,000 100 –Hutchison Hayes Separation Inc. Houston, Texas, USA 1,000 100 –Definox Inc. New Berlin, Wisconsin, USA 1,000 100 –Alfa Laval Aalborg Inc. Miramar, Florida, USA 200 100 –Vortex Ventures Inc Houston, Texas, USA 1,000 100 –Alfa Laval Ashbrook Simon-Hartley Inc Houston, Texas, USA 1 100 –Alfa Laval Tank Equipment Inc Exton, Pennsylvania, USA 1,000 100 –
AO Alfa Laval Potok Koroljov, Russia 31,077,504 100 –Alfa Laval Försäkrings AB 516406-0682 Lund, Sweden 50,000 100 –Alfa Laval Support Services Pvt Ltd Poona, India 99,990 100 –MCD Nitrile India Pvt Ltd Falta, India 24,593 91 –Alfa Laval Ukraine Kiev, Ukraine 100 –Alfa Laval SpA Monza, Italy 20,124 1 –
Alfa Laval KK Tokyo, Japan 1,200,000 100 208Total 4,669
, continued

123Financial statements
Specification of shares in other companies
Company name Domicile Number of shares Share of capital % Book value SEK thousands
Alfa Laval Aalborg Ltda Tractebel Brazil 1,268 125Elektrobras Brazil 7,107 169
Alfa Laval Philippines Inc. Philippine Long Distance Telephone Philippines 820 14
Alfa Laval Nordic OY As Oy Koivulantie 7A Finland 1 296Helsinki Halli Finland 4 133
Alfa Laval Vantaa OY Länsi-Vantaan Tenniskeskus Finland 4 0Mikkelin Puhelin Oyj Finland 5 19
Alfa Laval Aalborg OY Finda OY Finland 1 57
Alfa Laval HES SA Thermothec France 9,130 0
Alfa Laval Benelux BV Bordewes Netherlands 1 162
Helpman Holding BV Helpman Sofia OOD Bulgaria 500 49 6,378
Alfa Laval NV Dalian Haven Automation Co Ltd China 102 43 849
Frank Mohn Flatøy AS Nordhordaland handverk og industrilag AS Norway 50 4 26Meland arbeids- og kompetansesenter Norway 3 3 3
Alfa Laval Tumba AB Smedhälsan Ekonomisk Förening Sweden 0
Alfa Laval Corporate AB European Development Capital Corporation (EDCC) NV Curacao 36,129 0Multiprogress Hungary 100 3 0Kurose Chemical Equipment Ltd Japan 180,000 11 0Poljopriveda former Yugoslavia 0Tecnica Argo-Industrial S.A. Mexico 490 49 0Adela Investment Co S.A. (preference) Luxembourg 1,911 0 0Adela Investment Co S.A. Luxembourg 1,911 0 0Mas Dairies Ltd Pakistan 125,000 5 0
Total 8,231
None of these other companies with a share of capital of 20 percent or more are accounted for as associates since they are dormant and Alfa Laval does not have a significant influence according to IAS 28 item 6.
Specification of shares in joint ventures
Company nameRegistration
number DomicileNumber of
sharesShare of
capital %Book value
SEK millions
Alfa Laval Holding AB
Alfdex AB 556647-7278 Botkyrka, Sweden 1,000 50 20
Alfa Laval Corporate AB
AlfaWall AB 556723-6715 Botkyrka, Sweden 500 50 1
Frank Mohn Services AS
Halaas og Mohn AS Kristiansund, Norway 800 50 1
Alfa Laval Ltd
Rolls Laval Heat Exchangers Ltd Wolverhampton, UK 5,000 50 0
Total 22

124 Financial statements
Note 20. Inventories
Type of inventory
Consolidated
SEK millions 2014 2013 *
Raw materials and consumables 2,528 1,998
Work in progress 2,586 2,178
Finished goods & goods for resale, new sales 1,743 1,318
Finished goods & goods for resale, spare parts 874 686
Advance payments to suppliers 152 132
Total 7,883 6,312
* Restated to IFRS 11.
A considerable part of the inventory for spare parts is carried at fair value.
Obsolescence related to inventories amounts to and has changed as follows:
Obsolescence
Consolidated
SEK millions January 1Translation difference Acquired Write-down
Reversal of previous
write-down December 31
Year:2013 853 -3 2 166 -136 8822014 882 57 136 199 -155 1,119
The Group’s inventories have been accounted for after deduction for inter-company gains in inventory due to internal sales within the Group. The inter-company profit reserve at the end of 2014 amounts to SEK 482 (427) million.
Note 21. Accounts receivable
Accounts receivable with a maturity exceeding one year of SEK 228 (202) million have not been accounted for as non-current assets as they are not intended for permanent use.
Accounts receivable are reported net of provisions for bad debts. The provision for bad debts amounts to and has changed as follows:
Bad Debts
Consolidated
SEK millions January 1Translation difference Acquired
New provisions and increase of existing
provisionsAmounts
used
Unused amounts reversed
Change due to discounting December 31
Year:2013 340 3 0 113 -56 -46 0 3542014 354 22 98 162 -68 -63 0 505
The amount of accounts receivable being overdue is an indication of the risk the company runs for ending up in bad debts. The percentage is in relation to the total amount of accounts receivable.
Accounts receivable - overdue
Consolidated
SEK millions 2014 % 2013 %Overdue: Maximum 30 days 696 10.4 536 10.6More than 30 days but maximum 90 days 556 8.3 279 5.6More than 90 days 534 8.0 336 6.6Total 1,786 26.7 1,151 22.8

125Financial statements
Note 22. Other short-term receivables
Split on type and maturity
Consolidated
SEK millions 2014 2013 *Notes receivable 292 296Financial leasing receivables 10 11Other receivables 1,091 776Total 1,393 1,083Of which, not due within one year: Notes receivable 9 4 Other receivables 32 23Total 41 27
* Restated to IFRS 11.
Note 23. Prepaid expenses and accrued income
Split on type
Consolidated
SEK millions 2014 2013 *
Prepaid expenses 193 164
Accrued income 52 54
Total 245 218
* Restated to IFRS 11.
Note 24. Other current deposits
Split on type and maturity
Consolidated
SEK millions 2014 2013 *
Deposits with banks 155 342
Bonds and other securities 532 247
Other deposits 10 16
Total 697 605
Of which, not due within one year:
Deposits with banks 13 55
Other deposits 6 6
Total 19 61
* Restated to IFRS 11.
Note 25. Cash and bank
The item cash and bank in the statement on financial position and in the cash-flow statement is mainly relating to bank deposits.

126 Financial statements
Note 26. Defined benefit obligations
The Group has defined benefit commitments to employees and former employees and their survivors. The benefits are referring to old age pension, survivor’s pension, disability pension, health care and severance pay.
The defined benefit plans are in place in Austria, Belgium, Canada, France, Germany, India, Indonesia, Italy, Japan, Mexico, the Netherlands, Norway, Philip-pines, South Africa, Sweden, Switzerland, Taiwan, the United Kingdom and the United States. Most plans have been closed for new participants and replaced by defined contribution plans for new employees.
RisksThe cost for defined benefit obligations are impacted by several factors that are outside the control of the company, such as the discount rate, the return on plan assets, future salary increases, the development of the average length of life and the claim rates under medical plans. The size of and the development of these costs are therefore difficult to predict. According to the new IAS 19 all of these remeasurements are reported in other comprehensive income and not in net income.
The following table presents how the net defined benefit liability is arrived at out of the present values of the different defined benefit plans, less the fair value of the plan assets.
Net defined benefit liability
Consolidated
SEK millions 2014 2013
Present value of defined benefit obligation, unfunded -1,300 -999
Present value of defined benefit obligation, funded -5,496 -3,421
Present value of defined benefit obligation at year end -6,796 -4,420
Fair value of plan assets 4,598 2,937
Defined benefit liability -2,198 -1,483
Less disallowed assets due to asset ceiling -17 –
(-) liability/(+) asset at December 31 -2,215 -1,483
The net plan cost for the defined benefit plans describes the different cost elements of the plans. The net plan cost is reported in the consolidated compre-hensive income statement on the lines where personnel costs are reported. The interest cost/income is not part of the financial net, but instead just a way to categorize the components of the net plan cost. All remeasurements are reported in other comprehensive income and will never be reclassified to net income.
Total plan cost
Consolidated
SEK millions 2014 2013
Net plan cost
Current service cost -62 -36
Net interest cost/income -73 -60
Past service cost/income from plan amendments and curtailments and gains and losses on settlements 16 -29
Net plan (-) cost/(+) income -119 -125
Remeasurements
Actuarial losses/gains arising from changes in demographic assumptions -61 20
Actuarial losses/gains arising from changes in financial assumptions -657 102
Actuarial losses/less gains arising from changes in experience -22 -60
Return on plan assets less interest on plan assets 283 172
Change in disallowed assets due to asset ceiling -17 –
Other comprehensive income (OCI) -474 234
Total plan cost -593 109
The following table presents how the present value of the defined benefit liability has changed during the year and lists the different components of the change.
Present value of defined benefit liability
Consolidated
SEK millions 2014 2013
Present value of defined benefit liability at January 1 -4,420 -4,425
Acquired businesses -963 –
Translation difference -616 -43
Current service cost -62 -36
Interest cost -219 -164
Employee contributions -11 -4
Actuarial losses/gains arising from changes in demographic assumptions -61 20
Actuarial losses/gains arising from changes in financial assumptions -657 102
Actuarial losses/gains arising from changes in experience -22 -60
Past service cost/income from plan amendments and curtailments and gains and losses on settlements 16 -29
Benefit payments 219 205
Settlement payments 0 14
(-) liability at December 31 -6,796 -4,420

127Financial statements
The liability has the following duration and maturity:
Duration and maturity
Consolidated
2014 2013
Weighted average duration of the defined benefit obligation (years) 13 12
Maturity analysis of benefit payments (non discounted amounts) SEK millions
maturity ≤ 1 year 303 244
maturity > 1 ≤ 5 years 1,091 828
maturity > 5 ≤ 10 years 1,455 1,101
maturity > 10 ≤ 20 years 2,813 2,122
maturity > 20 years 4,494 3,445
The following table presents how the fair value of the plan assets has developed during the year and lists the components of the change.
Fair value of plan assets
Consolidated
SEK millions 2014 2013
Fair value of plan assets at January 1 2,937 2,701
Acquired businesses 916 –
Translation difference 358 26
Employer contributions 125 110
Employee contributions 11 4
Interest on plan assets 146 104
Return on plan assets less interest on plan assets 283 172
Benefit payments -178 -166
Settlement payments 0 -14
(+) asset at December 31 4,598 2,937
The plan assets are split on the following types of assets:
Split of plan assets
Consolidated
SEK millions 2014 2013
Cash and cash equivalents 839 83
Equity instruments 1,444 1,204
Debt instruments 1,738 1,244
Real estate 198 85
Investment funds 379 321
Fair value at December 31 4,598 2,937
The table below presents how the net defined benefit liability has changed and the factors affecting the change.
Net defined benefit liability/asset
Consolidated
SEK millions 2014 2013
Defined benefit liability/asset at January 1 -1,483 -1,724
Acquired businesses -47 –
Translation difference -258 -17
Net plan cost -119 -125
Employer contributions 125 110
Remeasurements (other comprehensive income) -474 234
Benefit payments, unfunded plans 41 39
Settlement payments, unfunded plans 0 –
(-) liability/(+) asset at December 31 -2,215 -1,483

128 Financial statements
The gross plan assets and gross defined benefit liabilities of each plan are to be reported as a net amount. The following table shows how the net asset and the net liability are calculated.
Gross defined benefit liability/asset
Consolidated
SEK millions 2014 2013Assets Fair value of plan assets 4,598 2,937Less disallowed assets due to asset ceiling -17 –
4,581 2,937Netting -4,575 -2,926Assets in statement on financial position 6 11Liabilities Present value of defined benefit obligation at year end -6,796 -4,420Netting 4,575 2,926Provision in statement on financial position -2,221 -1,494
The weighted averages for the more significant actuarial assumptions that have been used at the year-end are:
Actuarial assumptions
Consolidated
2014 2013Discount rate (%) 3.1 4.2Expected average retirement age (years) 63 63Life expectancy for a 45 year old male (years) 82 N/ALife expectancy for a 45 year old female (years) 85 N/AClaim rates under medical plans (%) 5 5Expected rate of salary/wage increase (%) 3 3Change in health care costs (%) 5 5Index for future compensation increases (%) 3 3
Future contributions
Consolidated
SEK millions 2015Expected employer contributions to the plan for the next calendar year -186Expected employer contributions for the next calendar year to multi-employer plans reported as defined contribution plans -52

129Financial statements
The following table presents how the defined benefit pension schemes are distributed on different countries.
Regional split
Consolidated
SEK millions, unless otherwise statedUnited States
United Kingdom
Nether-lands Germany Norway Italy Belgium Other Total
Net defined benefit liability
Present value of the defined benefit obligation, unfunded -817 – – -198 -9 -43 – -233 -1,300
Present value of the defined benefit obligation, funded -1,059 -2,411 -624 – -932 – -81 -389 -5,496
Present value of the defined benefit obligation at year end -1,876 -2,411 -624 -198 -941 -43 -81 -622 -6,796
Fair value of plan assets 939 1,814 615 – 828 – 54 348 4,598
Defined benefit liability -937 -597 -9 -198 -113 -43 -27 -274 -2,198
Less disallowed assets due to asset ceiling – – -17 – – – – – -17
(-) liability/(+) asset -937 -597 -26 -198 -113 -43 -27 -274 -2,215
Net plan cost -40 -29 14 -6 -29 -9 -3 -17 -119
Remeasurements (OCI) -168 -216 -19 -24 -49 - -6 8 -474
Sensitivity analysis*
Discount rate decreased by 1% point -219 -449 -103 -23 -93 – -3 -40 -930
Life expectancy increased by 1 year -69 -99 -17 -6 – – 0 -9 -200
Expected average retirement age decreased by 1 year -22 – – 0 -10 – 2 -3 -33
Claim rates under medical plans increased by 1 % point -90 – – – – – – – -90
Expected rate of salary increases increased by 1% point 0 -31 -7 – -37 – -8 -18 -101
Medical costs increased by 1% point -90 – – – – – – 0 -90
Index for future compensation increases increased by 1% point 0 -76 -2 -20 -93 – 0 -13 -204
Cost for actuarial services 0 0 0 0 -1 0 0 -1 -2
Number of participants in the plans at December 31
Current employees (active members) 722 52 156 11 351 – 27 2,712 4,031
Current employees (only vested value for closed plans) 34 72 – – – 252 – 11 369
Former employees that are not yet pensioners 252 493 219 13 – – 45 4 1,026
Pensioners 1,878 624 82 328 252 – – 110 3,274
Total 2,886 1,241 457 352 603 252 72 2,837 8,700
Remaining service period
Average remaining service period for active members (years) 8 11 12 4 7 – 14 9 9
* How much would the present value of the defined benefit obligation at December 31 increase if the (all other things being equal):

130 Financial statements
Note 27. Other provisions
Movement schedule
Consolidated
SEK millions January 1Translation difference Acquired
New provisions and increase of
existing provisionsAmounts
used
Unused amounts reversed December 31
2013 *Claims & warranty 1,149 -32 1 412 -369 -94 1,067Deferred costs 167 4 – 61 -24 -18 190Restructuring 191 1 – 3 -57 -31 107Onerous contracts 66 -1 – 46 -19 -7 85Litigations 187 -2 – 28 -6 -2 205Other 309 -16 2 175 -128 -34 308Total 2,069 -46 3 725 -603 -186 1,962Of which: current 1,603 1,539 non-current 466 4232014Claims & warranty 1,067 55 87 519 -451 -108 1,169Deferred costs 190 5 – 130 -65 -59 201Restructuring 107 -1 13 220 -100 -4 235Onerous contracts 85 3 36 46 -16 -8 146Litigations 205 0 – 99 -20 0 284Other 308 25 – 182 -127 -18 370Total 1,962 87 136 1,196 -779 -197 2,405Of which: current 1,539 1,862 non-current 423 543
* Restated to IFRS 11.
Unused amounts reversed refer to, among other items, changed classifications and reversals of provisions made in prior years that have not been used.Each type of provision entails everything from a few up to a large number of different items. It is therefore not practicable or particularly meaningful to
specify the provisions item by item. As indicated above a clear majority of the provisions will result in disbursements within the next year. Claims & warranty refers to claims from customers according to the conditions in issued warranties. The claims concern technical problems with the
delivered goods or that promised performance has not been achieved. Deferred costs are partly costs that are known but not yet debited at the time of invoicing, partly costs that are unknown but expected at the time of
invoicing. The provision for deferred costs is charged to costs of goods sold in order to get a correct phasing of the gross margin. Provisions for restructuring are usually relating to closure of plants or closure or move of production lines, businesses, functions etc. or reduction of the
number of employees in connection with a downturn in the business climate. The provisions for restructuring are affecting approximately 575 (180) employees.The provision for onerous contracts is relating to orders where a negative gross margin is expected. Provisions are made as soon as a final loss on the
order can be expected. This can in exceptional cases happen already at the time when the order is taken. Normally this provision is relating to larger and complex orders where the final margin is more uncertain.
The provision for litigations refers to ongoing or expected legal disputes. The provision covers expected legal costs and expected amounts for damages or settlements.Other refers to miscellaneous provisions that do not fall within any of the above categories.
Note 28. Borrowings and net debt
Net debt
Consolidated
SEK millions 2014 2013 *
Credit institutions 2,981 904
Swedish Export Credit 2,975 1,793
European Investment Bank 2,332 1,165
Private placement 864 716
Commercial papers 999 –
Corporate bonds 7,554 –
Capitalised financial leases 73 84
Interest-bearing pension liabilities 0 0
Total debt 17,778 4,662
Cash, bank and current deposits -2,710 -2,051
Net debt 15,068 2,611
* Restated to IFRS 11.
The loans are distributed among currencies as follows:
Maturity of loans by currency
Consolidated
Current Non-current
SEK millions 2014 2013 2014 2013
Currency:
BRL 8 5 – –
CNY 37 – – –
DKK 1 – 5 8
EUR 94 954 13,108 2,257
INR 13 5 – –
KRW – – 1 –
SEK 1,067 6 – –
USD 31 79 3,340 1,264
Other 0 0 – –
Total 1,251 1,049 16,454 3,529
Of which, not due within five years: 10,596 2,062
The maturity structure of the loans is presented in the bar chart in the section “Liquidity risk and refinancing risk” under Financial risks.

131Financial statements
Loans with floating interest rateLoan from credit institutionsAlfa Laval has a senior credit facility of EUR 400 million and USD 544 million, corresponding to SEK 8,085 million with a new banking syndicate. The new facility replaced the previous syndicated loan. At December 31, 2014 SEK 2,715 million of the facility was utilised. The new facility matures in June 2019, with two one year extension options.
The interest is based on applicable IBOR plus a mark-up based on the relation between net debt and EBITDA and how much of the facility that is utilised.
At year end the mark up is 50 (55) basis points.
Bilateral term loans with other lendersAlfa Laval has a bilateral term loan with Swedish Export Credit that is split on one loan of EUR 100 million that matures in June 2017 and one loan of EUR 100 million that matures in June 2021 as well as a loan of USD 136 million that matures in June 2020, corresponding to SEK 2,975 million in total. The loans accrue interest at floating rate based on applicable IBOR plus a mark-up of 45, 95 and 80 basis points respectively.
Alfa Laval also has a bilateral term loan from the European Investment Bank split on one loan of EUR 130 million that matures in March 2018 and an additional loan of EUR 115 million that was called on at June 23, 2014 and that matures in June 2021, corresponding to SEK 2,332 million. The loans accrue interest at floating rate based on EURIBOR plus a mark-up of 70 and 45 basis points respectively.
Corporate bondsAlfa Laval has issued EUR 300 million of corporate bonds corresponding to SEK 2,833 million with floating interest rate and a maturity of five years. The floating interest rate is based on EURIBOR plus a mark-up of 55 basis points.
Interest level of loans with floating interest rateThe senior credit facility, the bilateral term loans, the commercial papers and the EUR 300 million tranche of the corporate bonds accrue interest at floating rate. At the end of 2014 the loans were accruing interest in the range of 0.52 % - 1.13 % (0.76 % - 1.32 %). The average interest rate at the end of 2014 was 1.03 (2.04) percent. The Group has chosen to hedge 16 (53) percent of the loans to fixed interest rate, with a duration of 16.3 (19.0) months.
Loans with fixed ratePrivate placementIn 2006 Alfa Laval made a private placement in the U.S. The offer was over-subscribed and was closed at USD 110 million, corresponding to SEK 864 million. The loan matures in April 2016. The interest was based on U.S. Treasury bills plus a mark-up of 95 basis points, which gave a fixed interest of 5.75 percent. The loan was raised on April 27, 2006.
Corporate bonds and commercial papersAlfa Laval has issued EUR 500 million of corporate bonds corresponding to SEK 4,721 million, with a fixed interest rate of 1.495 percent and a maturity of eight years.
Alfa Laval has issued commercial papers of nominally SEK 1,000 million with 3-5 months duration. The interest is fixed at inception and is based on STIBOR flat.
Transaction costsThe transaction costs in connection with raising the loans or issuing the bonds have been capitalised and are being amortised over the maturity of the loans. At the end of the year the capitalised amount was SEK 73 (18) million. The current year’s cost for the fee amortisation is SEK -10 (-5) million.
Average interest and currency durationThe average interest and currency duration for all loans including derivatives is 28.5 (12.6) months at the end of 2014.
Financial covenantsThe syndicated loan and the bilateral term loans with Swedish Export Credit are linked to one financial covenant that must be fulfilled throughout the life of the loans. The covenant refers to the relationship between net debt and EBITDA in combination with the current official Alfa Laval rating.
The bilateral term loans from the European Investment Bank are linked to three financial covenants that must be fulfilled throughout the life of the loans. These covenants refer to the relationship between net debt and EBITDA and between EBITDA and total interest expense as well as the debt ratio.
The private placement is linked to two financial covenants that must be fulfilled throughout the life of the loan. These covenants refer to the relationship between net debt and EBITDA and between EBITDA and total interest expense.
If the covenants are not fulfilled, the lenders are entitled to demand immediate repayment of the loans, provided that the breach is not temporary. Alfa Laval has fulfilled the covenants with a good margin ever since the loans were raised.
Note 29. Other current liabilities
Split by type
Consolidated
SEK millions 2014 2013 *
Financial lessee payable 73 84
VAT liabilities, employee withholding taxes 232 146
Other non-interest bearing liabilities 1,698 1,290
Total 2,003 1,520
* Restated to IFRS 11.
Note 30. Accrued costs and prepaid income
Split by type and maturity
Consolidated
SEK millions 2014 2013 *Accruals for social security 316 290Reserve for severance pay 171 139Accrued interest expenses 34 12Other accrued expenses 1,555 1,273Prepaid income 29 8Total 2,105 1,722Of which, not due within one year: Accruals for social security 31 30 Reserve for severance pay 100 96 Other accrued expenses 99 2Total 230 128
* Restated to IFRS 11.
Note 31. Pledged assets and contingent liabilities
Split by type
Consolidated
SEK millions 2014 2013 *
Pledged assets
Other pledges and similar commitments 18 17
Total 18 17
Contingent liabilities
Discounted bills 30 31
Performance guarantees 1,885 1,429
Other contingent liabilities 515 456
Total 2,430 1,916
* Restated to IFRS 11.
As of December 31, 2014 the Group had sold receivables with recourse to-talling SEK 30 (31) million. These are disclosed as discounted bills above.
Other contingent liabilities are among other items referring to bid guarantees, payment guarantees to suppliers and retention money guarantees.

132 Financial statements
Note 32. Transactions with related party
Tetra Pak within the Tetra Laval Group is Alfa Laval’s single largest customer with 3.7 (4.8) percent of net sales. In June 1999, Tetra Pak entered into a purchasing agreement with Alfa Laval that governs the distribution, research and development, market and sales information, use of trademarks and in-tellectual property. The following areas shall be agreed upon from time to time between representatives of the parties: products that are subject to the agreement, prices and discounts of such products, geographical markets and product areas where Tetra Pak is Alfa Laval’s preferred distributor, the right of Tetra Pak to affix its trademarks to Alfa Laval products, sales goals for Tetra Pak in defined geographical markets, products and technologies that are the focus of joint research and development and the ownership rights of the research and development result and use of market and sales information. The agreement aims at the applications within liquid food where Tetra Pak has a natural market presence through the deliveries of packaging equipment and packaging material.
The agreement was prolonged by two years from December 31, 2014. It has a 12 month period of notice. The prices Tetra Pak receives are not lower than the prices Alfa Laval would obtain when selling to a comparable third party. The prices are fixed on a calendar year basis.
Alfa Laval rents premises to DeLaval in Russia. The total rent income for this amounts to SEK 2 (2) million.
The Board of Directors for Alfa Laval AB has two representatives from Tetra Laval - Jörn Rausing and Finn Rausing.
At year-end, Alfa Laval has the following balance items against companies within the Tetra Laval group (Tetra Pak and DeLaval).
Receivables on/payables to related parties
Consolidated
SEK millions 2014 2013Receivables:
Accounts receivable 167 126Other receivables 0 0
Liabilities:
Accounts payable 0 0Other liabilities 151 5
Alfa Laval has had the following transactions with companies within the Tetra Laval group (Tetra Pak and DeLaval).
Revenues/expenses from related parties
Consolidated
SEK millions 2014 2013Net sales 1,289 1,441Other operating income 2 2
Note 33. Interests in joint ventures
Alfa Laval owns 50 percent in four different joint ventures: Rolls Laval Heat Exchangers Ltd with Rolls Royce as partner, Alfdex AB with Haldex as part-ner, AlfaWall AB with Wallenius as partner and Halaas og Mohn AS with Ha-laas Holding AS as partner. None of these joint ventures are of material im-portance and for that reason no disclosures are made of each individual joint venture. Instead disclosures in aggregate are made on the carrying amount of Alfa Laval’s interests in these individually immaterial joint ventures. See the below tables.
Joint ventures were previously consolidated according to the proportional consolidation method in IAS 31 ”Interests in Joint Ventures”, but are now consolidated according to the equity method in IFRS 11 ”Joint arrangements”. Since the proportional consolidation method has disappeared all amounts in the following two tables have disappeared out of Alfa Laval’s statements over consolidated comprehensive income and consolidated financial position. As a consequence of this the comparison figures for 2013 have been changed. The change in accounting principle has not affected the equity.
Assets/liabilities
Joint ventures
SEK millions 2014 2013Current assets 65 55Non-current assets 14 11Current liabilities 40 28Non-current liabilities 9 11Contingent liabilities 38 34
Revenues/expenses
Joint ventures
SEK millions 2014 2013Net sales 176 133Cost of goods sold -118 -81Other operating income 26 26Other operating costs -73 -61Financial net 0 0Result before tax 11 17Taxes -4 -4Net income 7 13Other comprehensive income 0 0Comprehensive income 7 13
Instead the application of the equity method means that the net income before tax in the joint ventures is booked into one line in operating income and the corresponding tax on the tax line. The counter entry is an increase or decrease of the value of shares in joint ventures. Received dividends reduce the value of the shares in joint ventures.
Interests in joint ventures
Consolidated
SEK millions 2014 2013Operating income 11 17Taxes -4 -4Net income 7 13Received dividends 12 12Shares in joint ventures 22 27
The effect on comprehensive income is the same as the net income.
Note 34. Work in progress on plant projects
Impact of percentage of completion method
Consolidated
SEK millions 2014 2013Result items Amount of recognised project sales revenue 3,433 2,056Work performed on ongoing projects Aggregate amount of costs incurred and recognised profits (less recognised losses) 3,495 2,172Assets Retentions 39 52Gross amount due from customers for work in progress 797 472Liabilities Advances received 1,252 1,014Gross amount due to customers for work in progress 209 222

133Financial statements
Note 35. Leasing
Alfa Laval has entered into non-cancellable operating leases mainly relating to premises and finance lease agreements regarding machinery and equipment with leasing periods of 1-20 years. The leasing fees for non-cancellable operat-ing leases for premises were SEK 365 (345) million. During the year, the Group has entered into finance leases with a capitalised value of SEK 1 (-) million. See Note 18 for information on the capitalised value of finance leases.
The future minimum leasing fees concerning non-cancellable operating leases, distributed on maturity dates, amount to:
Future minimum leasing fees for operating leases
Consolidated
SEK millions 2014 2013
Maturity in year:
2014 N/A 281
2015 384 239
2016 374 192
2017 367 135
2018 378 104
2019 374 N/A
Later 782 211
Total 2,659 1,162
The future minimum leasing fees concerning financial leasing agreements and their net present value, distributed on maturity dates, amount to:
Financial leases
Consolidated
Future minimum leasing fees for financial leases
Present value of financial leases
SEK millions 2014 2013 2014 2013
Maturity in year:
2014 N/A 16 N/A 16
2015 16 15 16 14
2016 14 13 13 13
2017 12 11 11 10
2018 11 10 10 9
2019 11 N/A 10 N/A
Later 9 19 8 17
Total 73 84 68 79

134 Financial statements
The unrestricted equity in Alfa Laval AB (publ) is SEK:
Profit brought forward 7,679,698,178
Net income 2014 2,335,602,119
10,015,300,297
The Board of Directors propose a dividend of SEK 4.00 (3.75) per share corresponding to SEK 1,677,825,260 (1,572,961,181) and that the remaining income of SEK 8,337,475,037 (7,679,698,178) be carried forward.
True and fair viewThe undersigned certify that the annual report for the Group and the Parent company has been prepared in accordance with International Financial Reporting Standards (IFRS), as adopted for use in the European Union, and generally accepted accounting principles respectively, and gives a true and fair view of the financial positions and results of the Group and the Parent company, and that the Board of Directors’ report gives a fair review of the development of the operations, financial positions and results of the Group and the Parent company and describes substantial risks and uncertainties that the Group companies face.
Lund, February 26, 2015
Anders Narvinger Gunilla Berg Arne Frank
Chairman Director Director
Björn Hägglund Bror García Lantz Ulla Litzén
Director Employee representative Director
Jan Nilsson Susanna Holmqvist Norrby Finn Rausing
Employee representative Employee representative Director
Jörn Rausing Ulf Wiinberg Lars Renström
Director Director President and CEO
Our Auditors’ Report concerning this Annual Report has been issued on March 3, 2015.
Helene Willberg Håkan Olsson Reising
Authorised Public Accountant Authorised Public Accountant
Proposed disposition of earnings

135Financial statements
Report on the annual accounts and consolidated accountsWe have audited the annual accounts and consolidated accounts of Alfa Laval AB (publ) for the year 2014. The annual accounts and consolidated accounts of the company are included in the printed version of this document on pages 59–135.
Responsibilities of the Board of Directors and the Managing Director for the annual accounts and consolidated accounts The Board of Directors and the Managing Director are responsible for the preparation and fair presentation of these annual accounts in accordance with the Annual Accounts Act and of the consolidated accounts in accordance with International Financial Reporting Standards, as adopt by the EU, and the Annual Accounts Act, and for such internal control as the Board of Directors and the Managing Director determine is necessary to enable the prep-aration of annual accounts and consolidated accounts that are free from material mis-statement, whether due to fraud or error.
Auditor’s responsibilityOur responsibility is to express an opinion on these annual accounts and consolidated accounts based on our audit. We conducted our audit in accordance with International Standards on Auditing and generally accepted auditing standards in Sweden. Those standards require that we comply with ethical requirements and plan and perform the audit to obtain reasonable assurance about whether the annual accounts and consolidated accounts are free from material misstatement.
An audit involves performing procedures to obtain audit evidence about the amounts and disclosures in the annual accounts and consolidated accounts. The procedures selected depend on the auditor’s judgment, including the assessment of the risks of material misstatement of the annual accounts and consolidated accounts, whether due to fraud or error. In making those risk assessments, the auditor considers internal control relevant to the company’s preparation and fair presentation of the annual accounts and consolidated accounts in order to design audit procedures that are appropriate in the circumstances, but not for the purpose
Auditor’s reportTo the annual meeting of the shareholders of Alfa Laval AB (publ), corp. id 556587-8054
of expressing an opinion on the effectiveness of the company’s internal control. An audit also includes evaluating the appropriateness of accounting policies used and the reason-ableness of accounting estimates made by the Board of Directors and the Managing Director, as well as evaluating the overall presentation of the annual accounts and consolidated accounts.
We believe that the audit evidence we have obtained is sufficient and appropriate to provide a basis for our audit opinions.
OpinionsIn our opinion, the annual accounts have been prepared in accordance with the Annual Accounts Act, and present fairly, in all material respects, the financial position of the parent company as of December 31, 2014 and of their financial performance and cash flows for the year then ended in accordance with the Annual Accounts Act. The consolidated accounts have been pre-pared in accordance with the Annual Accounts Act and present fairly, in all material respects, the financial position of the group as of December 31, 2014 and of their financial performance and cash flows for the year then ended in accordance with International Financial Reporting Standards, as adopted by the EU, and in accordance with the Annual Accounts Act. The statutory administration report is consistent with the other parts of the annual accounts and consolidated accounts.
We therefore recommend that the annual meeting of shareholders adopt the income statement and balance sheet for the parent company and the statement of comprehensive income and statement of financial position for the group.
Other mattersThe audit of the annual accounts for year 2013 was performed by other auditors who submitted an auditor´s report dated March 3, 2014, with unmodified opinions in the Report on the annual accounts and consolidated accounts.
Report on other legal and regulatory requirementsIn addition to our audit of the annual accounts and consolidated accounts, we have also audited the proposed appropriations of the
company’s profit or loss and the adminis-tration of the Board of Directors and the Managing Director of Alfa Laval AB (publ) for the year 2014.
Responsibilities of the Board of Directors and the Managing Director The Board of Directors is responsible for the proposal for appropriations of the company’s profit or loss, and the Board of Directors and the Managing Director are responsible for administration under the Companies Act.
Auditor’s responsibilityOur responsibility is to express an opinion with reasonable assurance on the proposed appropriations of the company’s profit or loss and on the administration based on our audit. We conducted the audit in accordance with generally accepted auditing standards in Sweden.
As basis for our opinion on the Board of Directors proposed appropriations of the company’s profit or loss we examined the Board of Directors’ reasoned statement and a selection of supporting evidence in order to be able to assess whether the proposal is in accordance with the Companies Act.
As basis for our opinion concerning dis-charge from liability, in addition to our audit of the annual accounts and consolidated accounts, we examined significant decisions, actions taken and circumstances of the company in order to determine whether any member of the Board of Directors or the Managing Director is liable to the com-pany. We also examined whether any member of the Board of Directors or the Managing Director has, in any other way, acted in contravention of the Companies Act, the Annual Accounts Act or the Articles of Association.
We believe that the audit evidence we have obtained is sufficient and appropriate to provide a basis for our opinions.
OpinionsWe recommend to the annual meeting of shareholders that the profit be appropriat-ed in accordance with the proposal in the statutory administration report and that the members of the Board of Directors and the Managing Director be discharged from lia-bility for the financial year.
Lund, March 3, 2015
Helene Willberg
Authorized Public Accountant
Håkan Olsson Reising
Authorized Public Accountant

136 Financial statements
Ten-year overview
Ten-year overview
Consolidated
SEK millions, unless otherwise stated 2014 2013 * 2012 ** 2011 2010 2009 2008 2007 2006 2005
Profit and loss Net sales 35,067 29,801 29,813 28,652 24,720 26,039 27,850 24,849 19,802 16,330
Comparison distortion items -320 – -51 -170 90 -225 -168 54 -120 -73
Operating income 4,671 4,353 4,396 4,691 4,401 4,030 5,736 4,691 2,552 1,377
Financial net -550 -181 133 -15 -37 -270 -395 -134 -177 -278
Result after financial items 4,121 4,172 4,529 4,676 4,364 3,760 5,341 4,557 2,375 1,099
Taxes -1,153 -1,132 -1,306 -1,425 -1,248 -1,023 -1,534 -1,377 -650 -171
Net income for the year 2,968 3,040 3,223 3,251 3,116 2,737 3,807 3,180 1,725 928
Financial position Goodwill 20,408 10,061 9,792 9,543 5,952 6,143 5,383 4,459 3,706 3,531
Other intangible assets 7,898 3,582 3,807 3,502 2,581 2,490 1,890 1,275 1,191 1,067
Property, plant and equipment 5,004 3,785 3,823 3,936 3,512 3,548 3,546 2,824 2,514 2,553
Financial long-term assets 2,022 1,447 1,509 1,664 1,568 1,542 1,376 1,128 784 676
Inventories 7,883 6,312 6,176 6,148 4,769 4,485 5,972 5,086 3,793 3,091
Current receivables 9,861 7,671 8,050 7,663 6,884 6,584 9,238 7,420 5,987 4,467
Current deposits 697 605 427 483 575 302 544 190 229 342
Cash and bank 2,013 1,446 1,404 1,564 1,328 1,112 1,083 856 546 479
TOTAL ASSETS 55,786 34,909 34,988 34,503 27,169 26,206 29,032 23,238 18,750 16,206
Equity 17,202 16,162 14,453 15,144 13,582 12,229 10,493 7,937 6,831 5,811
Provisions for pensions etc. 2,221 1,494 1,727 852 847 920 990 877 941 903
Provisions for taxes 3,074 1,758 1,932 1,930 1,617 1,390 1,161 1,090 949 767
Other provisions 2,405 1,962 2,076 2,132 2,128 2,365 2,252 1,810 1,281 957
Non-current liabilities 16,454 3,529 5,393 5,060 1,041 1,626 3,394 3,068 2,006 2,702
Current liabilities 14,430 10,004 9,407 9,385 7,954 7,676 10,742 8,456 6,742 5,066
TOTAL EQUITY & LIABILITIES 55,786 34,909 34,988 34,503 27,169 26,206 29,032 23,238 18,750 16,206
* Restated to IFRS 11. ** Restated to the new IAS 19. *** The figures for 2008 until 2005 have been recalculated due do the 4:1 split.
Changes in accounting standardsA reader of the ten-year overview should observe that accounting standards have changed repeatedly over this period of time.
All listed companies within the European Union were obliged to change to IFRS as of January 1, 2005. International Financial Reporting Standards (IFRS) are issued by the International Accounting Standards Board (IASB).
Alfa Laval was a first time applicant under IFRS 1 in 2005. IFRS 1 covered the transitional provisions for the implementation of IFRS. The adoption to IFRS was however already in place since Alfa Laval had implemented all relevant IAS standards since year 2000, except IAS 39 that was implemented as of January 1, 2005.
In 2014 IFRS 11 ”Joint arrangements” has been implemented as per January 1, 2013, which has meant a restatement of the comparison figures for 2013.In 2013 the revised IAS 19 ”Employee Benefits” has been implemented as per January 1, 2012, which has meant a restatement of the comparison figures for 2012.
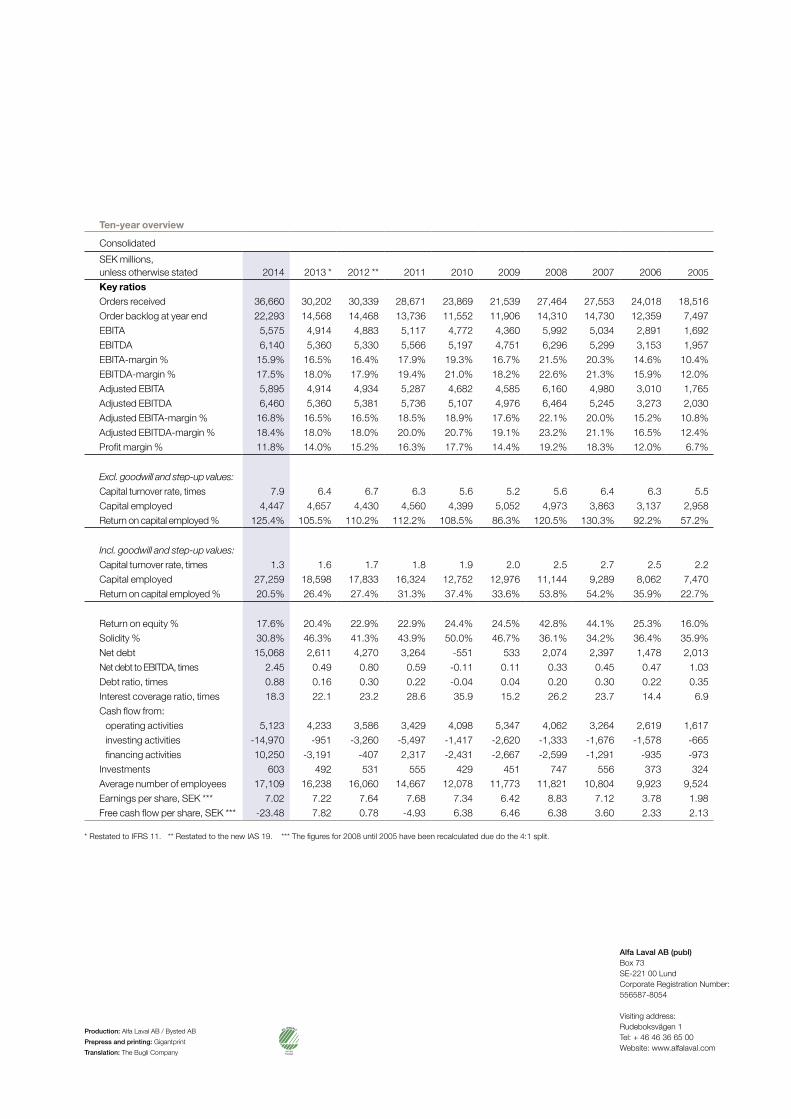
3 Alfa Laval in brief
Ten largest markets (SEK million)
The goal is to grow an average of at least 8 percent annually measured over a business cycle.
* Excluding exchange-rate variations.
The goal is to have an operating margin of 15 percent measured over a business cycle.
The goal is to have a return on capital employed of at least 20 percent.
Order intake in Alfa Laval’s top ten markets 2014.
Net salesRevenues from goods sold and services performed that are part of the ordinary operations of the Group, after deduction for given discounts, value added tax and other tax directly linked to the sales.
Comparison distortion itemsItems that do not have any link to the normal oper-ations of the Group or that are of a non-recurring nature, where a reporting together with other items in the consolidated comprehensive income statement would have given a comparison distortion effect that would have made it difficult to judge the development of the ordinary operations for an outside viewer.
Orders receivedIncoming orders during the year, calculated in the same way as net sales. The orders received give an indication of the current demand for the Group’s products and services, that with a varying delay appear in net sales.
Order backlog at year-endIncoming orders that not yet have been invoiced. The order backlog at the end of the year is equal to the sum of the order backlog at the beginning of the year plus the orders received during the year less the net sales for the year. It gives an indication of how the net sales can be expected to develop in the future.
EBITA“Earnings Before Interest, Taxes and Amortisation” or operating income before amortisation of step-up values. This measure of result is fully comparable over time independent of the financing costs and the amortisation of step-up values that from time to time burden the Group.
EBITDA“Earnings Before Interest, Taxes, Depreciation and Amortisation” or operating income before depreciation and amortisation of step-up values. This measure of result is fully comparable over time independent of the financing costs and the depreciation and amortisation of step-up values that from time to time burden the Group.
EBITA-margin %Operating income before amortisation of step-up values (EBITA) in relation to net sales, expressed in percent.
EBITDA-margin %Operating income before depreciation and amorti-sation of step-up values (EBITDA) in relation to net sales, expressed in percent.
Adjusted EBITASame as EBITA, but adjusted for comparison distortion items.
Adjusted EBITDASame as EBITDA, but adjusted for comparison distortion items.
Adjusted EBITA-margin %Same as EBITA-margin, but adjusted for comparison distortion items.
Adjusted EBITDA-margin %Same as EBITDA-margin, but adjusted for comparison distortion items.
Profit margin %Result after financial items in relation to net sales, expressed in percent.
Capital turnover rate, timesNet sales in relation to average capital employed, expressed as a multiple of capital employed. Shown excluding and including goodwill, step-up values and the corresponding deferred tax liability.
Capital employedAverage total assets less liquid funds, other long-term securities, accrued interest income, operating liabilities and other non-interest bearing liabilities, including tax and deferred tax, but excluding accrued interest costs. Shown excluding and including goodwill and step-up values and the corresponding deferred tax liability. Shows the capital that is used in the operations. The capital employed for the Group differs from the net capital for the segments concerning taxes, deferred taxes and pensions. Return on capital employed %EBITA in relation to average capital employed, expressed in percent. Shown excluding and in-cluding goodwill and step-up values and the cor-responding deferred tax liability.
Return on equity %Net income for the year in relation to average equi-ty, expressed in percent.
Solidity %Equity in relation to total assets, expressed in percent.
Net debtInterest-bearing liabilities including interest-bearing pension liabilities and capitalised finance leases less liquid funds.
Net debt to EBITDA, timesNet debt in relation to EBITDA is one of the covenants of Alfa Laval’s syndicated loan and an important key figure when reviewing the proposed dividend.
Debt ratio, timesNet debt in relation to equity, expressed as a multi-ple of the equity.
Interest coverage ratio, timesEBITDA plus financial net increased by interest costs in relation to interest costs. Expressed as a multiple of interest costs. Gives an expression for the Group’s ability to pay interest. The reason EBITDA is used as the starting point is that this forms the starting point for a cash flow perspective on the ability to pay interest. Financial items classified as comparison distorting are excluded from the calculation.
Cash flow from operating activitiesShows the Group’s cash flow from operating activities, that is the cash flow generated in the daily operational activities.
Cash flow from investing activitiesShows the Group’s cash flow from investing activities, i.e. the cash flow generated by mainly the Group’s divestments and acquisitions of businesses and divestments of real estate.
Cash flow from financing activitiesShows the Group’s cash flow from financing activities, that is mainly the cash flow impact of the Group’s loans in terms of interest payments and amortisation.
InvestmentsInvestments represent an important component in the cash flow for the Group. The level of investments during a couple of years gives a picture of the capacity build up in the Group.
Average number of employeesThe costs that are related to the number of employees represent a large part of the total costs for the Group. The development of the average number of em-ployees over time in relation to the development of the net sales therefore gives an indication of the cost rationalisation that is taking place.
Earnings per shareNet income for the year attributable to the equity holders of the parent divided by the average number of shares.
Free cash flow per shareThe sum of cash flows from operating and investing activities for the year divided by the average number of shares. This represents the cash flow available for interest payments, amortisation and dividends to investors.
Definitions
Ten-year overview
Consolidated
SEK millions, unless otherwise stated 2014 2013 * 2012 ** 2011 2010 2009 2008 2007 2006 2005
Key ratios Orders received 36,660 30,202 30,339 28,671 23,869 21,539 27,464 27,553 24,018 18,516
Order backlog at year end 22,293 14,568 14,468 13,736 11,552 11,906 14,310 14,730 12,359 7,497
EBITA 5,575 4,914 4,883 5,117 4,772 4,360 5,992 5,034 2,891 1,692
EBITDA 6,140 5,360 5,330 5,566 5,197 4,751 6,296 5,299 3,153 1,957
EBITA-margin % 15.9% 16.5% 16.4% 17.9% 19.3% 16.7% 21.5% 20.3% 14.6% 10.4%
EBITDA-margin % 17.5% 18.0% 17.9% 19.4% 21.0% 18.2% 22.6% 21.3% 15.9% 12.0%
Adjusted EBITA 5,895 4,914 4,934 5,287 4,682 4,585 6,160 4,980 3,010 1,765
Adjusted EBITDA 6,460 5,360 5,381 5,736 5,107 4,976 6,464 5,245 3,273 2,030
Adjusted EBITA-margin % 16.8% 16.5% 16.5% 18.5% 18.9% 17.6% 22.1% 20.0% 15.2% 10.8%
Adjusted EBITDA-margin % 18.4% 18.0% 18.0% 20.0% 20.7% 19.1% 23.2% 21.1% 16.5% 12.4%
Profit margin % 11.8% 14.0% 15.2% 16.3% 17.7% 14.4% 19.2% 18.3% 12.0% 6.7%
Excl. goodwill and step-up values:
Capital turnover rate, times 7.9 6.4 6.7 6.3 5.6 5.2 5.6 6.4 6.3 5.5
Capital employed 4,447 4,657 4,430 4,560 4,399 5,052 4,973 3,863 3,137 2,958
Return on capital employed % 125.4% 105.5% 110.2% 112.2% 108.5% 86.3% 120.5% 130.3% 92.2% 57.2%
Incl. goodwill and step-up values:
Capital turnover rate, times 1.3 1.6 1.7 1.8 1.9 2.0 2.5 2.7 2.5 2.2
Capital employed 27,259 18,598 17,833 16,324 12,752 12,976 11,144 9,289 8,062 7,470
Return on capital employed % 20.5% 26.4% 27.4% 31.3% 37.4% 33.6% 53.8% 54.2% 35.9% 22.7%
Return on equity % 17.6% 20.4% 22.9% 22.9% 24.4% 24.5% 42.8% 44.1% 25.3% 16.0%
Solidity % 30.8% 46.3% 41.3% 43.9% 50.0% 46.7% 36.1% 34.2% 36.4% 35.9%
Net debt 15,068 2,611 4,270 3,264 -551 533 2,074 2,397 1,478 2,013
Net debt to EBITDA, times 2.45 0.49 0.80 0.59 -0.11 0.11 0.33 0.45 0.47 1.03
Debt ratio, times 0.88 0.16 0.30 0.22 -0.04 0.04 0.20 0.30 0.22 0.35
Interest coverage ratio, times 18.3 22.1 23.2 28.6 35.9 15.2 26.2 23.7 14.4 6.9
Cash flow from:
operating activities 5,123 4,233 3,586 3,429 4,098 5,347 4,062 3,264 2,619 1,617
investing activities -14,970 -951 -3,260 -5,497 -1,417 -2,620 -1,333 -1,676 -1,578 -665
financing activities 10,250 -3,191 -407 2,317 -2,431 -2,667 -2,599 -1,291 -935 -973
Investments 603 492 531 555 429 451 747 556 373 324
Average number of employees 17,109 16,238 16,060 14,667 12,078 11,773 11,821 10,804 9,923 9,524
Earnings per share, SEK *** 7.02 7.22 7.64 7.68 7.34 6.42 8.83 7.12 3.78 1.98
Free cash flow per share, SEK *** -23.48 7.82 0.78 -4.93 6.38 6.46 6.38 3.60 2.33 2.13
* Restated to IFRS 11. ** Restated to the new IAS 19. *** The figures for 2008 until 2005 have been recalculated due do the 4:1 split.
Alfa Laval AB (publ)Box 73SE-221 00 LundCorporate Registration Number:556587-8054
Visiting address:Rudeboksvägen 1Tel: + 46 46 36 65 00Website: www.alfalaval.com
Production: Alfa Laval AB / Bysted AB
Prepress and printing: Gigantprint
Translation: The Bugli Company 341 063Trycksak
Alfa LavalAlfa Laval is a world-leading supplier of products and solutions in the areas of heat transfer, separation and fluid handling. The company’s equipment is used to heat, cool, separate and transport products in industries that produce food, beverages, fuel, chemicals, pharmaceuticals, starch, sugar and ethanol. They are also used aboard vessels, in power plants, in the engineering industry, for treating sludge and wastewater, for heating homes and offices, for comfort heating and cooling, and much more.
Market-leading positions
Heat transfer
More than 30 percent of the world market Most industrial processes need some form of solution for heat transfer. Alfa Laval’s offering includes a number of products, including compact heat exchangers that optimize customers’ energy consumption, cut costs and reduce their environmental impact.
Read more on page 21.
Separation
25–30 percent of the world market Alfa Laval’s separators, decanters, belt filter presses and membranes can be used in a range of applications to separate liquids from one another, solid particles from liquids, and particles and liquids from gases.
Read more on page 22.
Fluid handling
10–12 percent of the world market Alfa Laval offers pumps, valves, tank cleaning equipment and installation material for industries with stringent hygiene require-ments, such as the food and pharmaceu-tical industries. The product portfolio also includes specific pumping systems for the marine industry and offshore market.
Read more on page 23.
A global footprint Alfa Laval’s global sales and aftermarket organization helps customers in more than 100 countries to optimize their processes. Its production operations include 42 major production units in Europe (22), Asia (10), the US (8) and Latin America (2). Alfa Laval had an average of 17,109 employees in 2014, most of whom were located in Sweden (2,133), China (2,768), Denmark (1,802), the US (1,830) and India (1,435).
Market-adapted sales organization with a shared supply chain Alfa Laval has three sales divisions – Equipment, Process Technology and Marine & Diesel – as well as one division known as Operations, which is responsible for production, procurement and logistics. The sales divisions have separate business models designed to enable Alfa Laval to meet customer requirements and purchasing habits in the best possible manner and thus ultimately help customers to optimize the performance of their processes. The company’s three key technologies – heat transfer, separation and fluid handling – are offered in all three sales divisions.
EquipmentEquipment is characterized by a fast-moving business comprising components sold to customers with recurring requirements and well-defined needs through various sales channels. The division comprises four segments: Industrial Equipment, Sanitary, OEM and Service.
Read more on page 28.
Process TechnologyProcess Technology sells customized solutions and systems directly to end customers through the Group’s own sales companies and through contractors. The division comprises four segments: Energy & Process, Water & Waste Treatment, Food & Life Science and Service.
Read more on page 30.
Marine & DieselMarine & Diesel offers components, modules, systems and service for customers in the marine and offshore markets and land-based diesel power. The division comprises four segments: Marine & Diesel Equipment, Marine & Offshore Systems, Marine & Offshore Pumping Systems and Service.
Read more on page 32.
OperationsOperations is responsible for the Group’s production-related procurement, as well as its manufacturing, distribution and logistics. Having a centralized, coordinated and global supply chain is crucial to ensuring reliable access to the company’s products worldwide.
Read more on page 34.
Procurement Manufacturing Distribution/Logistics
Return on capital employed, %Operating margin, % Invoicing growth, %*
0 1 000 2 000 3 000 4 000 5 000 6 000
UK
Benelux
Adriatic
South East Asia
Japan
Region Mid Europe
Nordic
South Korea
China
United States
-15-10
-505
1015202530
14131211100
5
10
15
20
25
14131211100
10
20
30
40
50
60
1413121110
0
4
8
12
16
20
14131211100
1
2
3
1413121110-0,5
0,0
0,5
1,0
1,5
2,0
2,5
3,0
1413121110
-15-10
-505
1015202530
14131211100
5
10
15
20
25
14131211100
10
20
30
40
50
60
1413121110
0
4
8
12
16
20
14131211100
1
2
3
1413121110-0,5
0,0
0,5
1,0
1,5
2,0
2,5
3,0
1413121110
-15-10
-505
1015202530
14131211100
5
10
15
20
25
14131211100
10
20
30
40
50
60
1413121110
0
4
8
12
16
20
14131211100
1
2
3
1413121110-0,5
0,0
0,5
1,0
1,5
2,0
2,5
3,0
1413121110
R&D is keyThe ability to provide the market with new and more efficient products is crucial to achieving profitable growth. Accordingly, Alfa Laval aspires to a benchmark value entailing that the company’s annual spend on research and development should correspond to approximately 2.5 percent of its sales. In 2014, the company invested SEK 790 million, corresponding to 2.3 percent.

An
nu
al Rep
ort 2014 – S
ustainability R
epo
rt – Co
rpo
rate Go
vernance Rep
ort
CC00322EN 1503
Annual Report 2014
Financial information
Analysts tracking Alfa Laval
Alfa L
aval
3 ABOUT ALFA LAVALAlfa Laval in brief 3
2014 in brief 5
President’s comments 7
Structural growth drivers 10
Vision, business concept, goals and strategy 12
The share 16
Research and development 18
Key technologies 20
Adding creativity to food processing 24
Divisions 26
Equipment Division 28
Process Technology Division 30
Marine & Diesel Division 32
Operations Division 34
Service 36
Employees 38
40 SUSTAINABILITYReport 40
44 CORPORATE GOVERNANCE Introduction by the Chairman of the Board 45
Corporate Governance Report 2014 46
Board of Directors and auditors 52
President and Group management 54
Board of Directors’ report on internal control 57
Auditor’s statement on the
Corporate Governance Report 58
Contents
Årsredovisning 2014
Tillbaka till framtiden
Alfa Laval uses a number of channels to provide information about the company’s operations and financial development. The website – www.alfalaval.com/investors – is updated continuously with annual reports, quarterly reports, press releases and presentations. Annual reports are also sent to those share-holders who have notified the company that they wish to receive a copy.
Conference calls with analysts, investors and the media are arranged by Alfa Laval in conjunction with the publication of the company’s quarterly reports. A capital markets day is organized each year, during which represent-atives from the financial market are offered more in-depth information regarding
the company’s operations. In addition, representatives of Group management meet with analysts, investors and journalists on an ongoing basis to ensure that they have correct and current information. Pursuant to the company’s agreement with Nasdaq OMX Stockholm, information that could have an effect on the share price and that is not yet publicly known is never disclosed in conjunction with these types of meetings or contacts. Alfa Laval employs a so-called silent period of three weeks prior to the publication of a quarterly report. The President and Chief Financial Officer do not meet or speak to representatives from the financial market during this period.
Financial information during 2015
Alfa Laval will publish quarterly reports on the following dates in 2015:
Year-end report 2014 February 3First-quarter report April 23Second-quarter report July 16Third-quarter report October 27
Shareholder information
Gabriella GrotteInvestor Relations ManagerTel: +46 46 36 74 82Mobile: +46 709 78 74 82E-mail: [email protected] or [email protected]
ABG Sundal CollierAnders [email protected]: +46 8 5662 8674
Bank of America Merrill LynchBen [email protected]: +44 20 7996 4783
Barclays CapitalLars [email protected]: +44 20 3134 1156
CarnegieNatalie [email protected]: +46 8 5886 92 36
Citi Investment ResearchKlas [email protected]: +44 207 986 4018
CommerzbankSebastian [email protected]: +49 69 136 89800
Credit SuisseMax [email protected]: +44 20 7883 8501
Danske BankOscar [email protected]: +46 8 568 806 06
Deutsche BankAndreas [email protected]: +44 20 754 565 80
DNB MarketsChrister Magnergå[email protected]: +46 8 473 48 44
BESI GRUPO NOVO BANCONick [email protected]: +44 20 3364 6766
Goldman Sachs InternationalGunther [email protected]: +44 20 7552 3237
Handelsbanken Capital MarketsPeder Frölé[email protected]: +46 8 701 12 51
HSBC BankColin [email protected]: +44 20 7991 6592
JP MorganGlen [email protected]: +44 20 7155 6113
Kepler CheuvreuxJoakim Hö[email protected]: +46 8 723 51 63
Nordea BankFredrik [email protected]: +46 8 534 919 20
Pareto SecuritiesDavid [email protected]: +46 8 402 52 72
SEBDaniel [email protected]: +46 8 522 296 75
SwedbankAnders [email protected]: +46 8 585 900 93
UBSSven [email protected]: +49 69 1369 8278
ÅlandsbankenLars Sö[email protected]: +46 8 791 46 57
Annual General Meeting 2015
The Annual General Meeting of Alfa Laval AB (publ) will be held on Thursday, April 23, 2015 at 4:00 p.m. at Sparbanken Skåne Arena, Klostergården’s sports area, Stattenavägen, in Lund. Light refreshments will be served after the Meeting. In accordance with the company’s Articles of Association, notice of the Annual General Meeting will be inserted as an announcement in the Swedish Official Gazette and on the company’s website not more than six and not less than four weeks prior to the Meeting. An announcement that notification has been issued will be placed in Dagens Nyheter. As a service to existing shareholders, information about the Annual General Meeting can be sent to them by mail. The following information concerning the Meeting does not constitute legal notice.
Notification of participation Shareholders who wish to participate in the Meeting and be entitled to vote must be entered in the share register maintained by Euroclear AB not later than Friday, April 17, 2015, and register their intention to participate, along with any assistants, not later than Friday, April 17, 2015, preferably before 12:00 noon. Shareholders whose shares are held in trust must temporarily re-register their shares in their own names not later than April 17. Shareholders must request such registration from the trustee a few working days prior to the deadline.
Notification of participation shall be made to:
– Alfa Laval AB, Group Staff Legal, Box 73, SE-221 00 Lund, Sweden
– E-mail: [email protected]
– Fax: +46 46 36 71 87
– Website: www.alfalaval.com
– Tel: +46 46 36 74 00 or +46 46 36 65 00.
Shareholders must state their name, personal identity number and telephone number on the notice of participation. If participation is by proxy, a power of attorney or authorization must be submitted to the company prior to the Meeting.
Meeting program 1:30 p.m. Bus departs from Sparbanken Skåne Arena for Alfa Laval’s
production unit for heat exchangers in Lund 3:30 p.m. Registration starts 4:00 p.m. Start of Meeting
Tour of production facility in LundPrior to the Annual General Meeting, participants will have an opportunity to view the production of plate heat exchangers at the plant in Lund. The tour will begin with assembly at Sparbanken Skåne Arena, Klostergården’s sports area, Stattenavägen in Lund not later than 1:30 p.m. Buses will be provided for transportation to the plant and back to the Meeting venue. Registration for the tour must be made in conjunction with registration for participation in the Annual General Meeting. Please note that the number of participants is limited.
Dividend The Board of Directors and the President propose to the Annual General Meeting that a dividend of SEK 4.00 per share be paid. The proposed re-cord date for this dividend is Monday, April 27, 2015. If the Meeting ap-proves the proposal, the dividend is expected to be distributed on Thursday, April 30, 2015. However, the record date and dividend payment date may be postponed due to the technical procedures required for exe-cuting the payment.
Back to the future
Soy sauce.Since long a key ingredient in Eastern cooking. Nowadays also a must on Western world dining tables. Invented in the 5th century BC. The place: China. Today the country turns out some five million tonnes soy sauce annually – more than half of world output. Not very surprisingly, production methods are traditional and labour intensive. Enter Alfa Laval. By introducing our leading-edge separators and evaporators we help modernize and streamline soy sauce manufacturing. Processing time can be substantially reduced. Energy is saved. Fewer workers are needed. Cleaning becomes easier. Hygiene is improved. All adding up to refined quality. No wonder seven out of the ten main Chinese soy producers have implemented our technology recently. Taking them back to the future.
Pure Performance. Food. Sanitary. Energy. Marine. Engineering. Chemicals. Environment. You name the industry. Alfa Laval is helping them to purify and refine their processes and products. Time and time again. Our equipment, systems and service are hard at work in more than 100 countries. Our driving force is to create better, more comfortable living conditions for all mankind. And, whenever possible, adding an extra spice to life.
Alfa Laval in brief
Alfa Laval is a leading global provider of spe-cialized products and engineered solutions. The company’s equipment, systems and services are dedicated to helping customers optimize the performance of their processes. Time and time again. Alfa Laval helps customers to heat, cool, separate and transport products such as oil, water, chemicals, beverages, foodstuffs, starch and pharmaceuticals. Alfa Laval’s worldwide organization works closely with customers in 100 countries to help optimize their processes.
More information on the Internet
Alfa Laval’s website is continuously updated with new information, including contact details for all countries.
Read more at www.alfalaval.com andwww.alfalaval.com/investors
59 FINANCIAL STATEMENTSBoard of Directors’ Report 60
Consolidated cash flows 72
Comments to the consolidated cash-flows 73
Consolidated comprehensive income 74
Comments to the consolidated
comprehensive income 75
Consolidated financial position 78
Comments on the consolidated
financial position 80
Changes in consolidated equity 81
Comments on changes
in consolidated equity 83
Parent company cash flows 84
Parent company income 84
Parent company financial position 85
Changes in parent company equity 86
Notes to the financial statements 87
Accounting principles 87
Objectives, policies and processes
for managing capital 96
Financial risks 97
Operational risks 101
Notes 104
Proposed disposition of earnings 134
Auditor’s report 135
Ten-year overview 136
Definitions 138
Financial information 139
Annual General Meeting 139