financial impact of intellectual property & cyber assets
TRANSCRIPT

Sponsored by Aon Independently conducted by Ponemon Institute LLC
Financial Impact of Intellectual Property & Cyber Assets Report GLOBAL EDITION | 2020

Contents
Part 1 Introduction . . . . . . . . . . . . . . . . . . . . . . . . . . . . . . . . . . . . . . . . . . . . . . 3
Part 2 Key findings . . . . . . . . . . . . . . . . . . . . . . . . . . . . . . . . . . . . . . . . . . . . . . 10
Part 3 Methods . . . . . . . . . . . . . . . . . . . . . . . . . . . . . . . . . . . . . . . . . . . . . . . . 32
Part 4 Caveats . . . . . . . . . . . . . . . . . . . . . . . . . . . . . . . . . . . . . . . . . . . . . . . . . 35
Appendix: Detailed Survey Results . . . . . . . . . . . . . . . . . . . . . . . . . . . . . . . . 37

Financial Impact of Intellectual Property & Cyber Assets: 2020 Aon-Ponemon Global Report 3
Part 1 Introduction
Financial Impact of Intellectual Property & Cyber Assets: 2020 Aon-Ponemon Global Report 4Aon | Ponemon Institute
20112012
2013-20152014
20152016
20172018
2020
2000-2002
2001
9/11 Attacks
20032005
2007-2008
2010
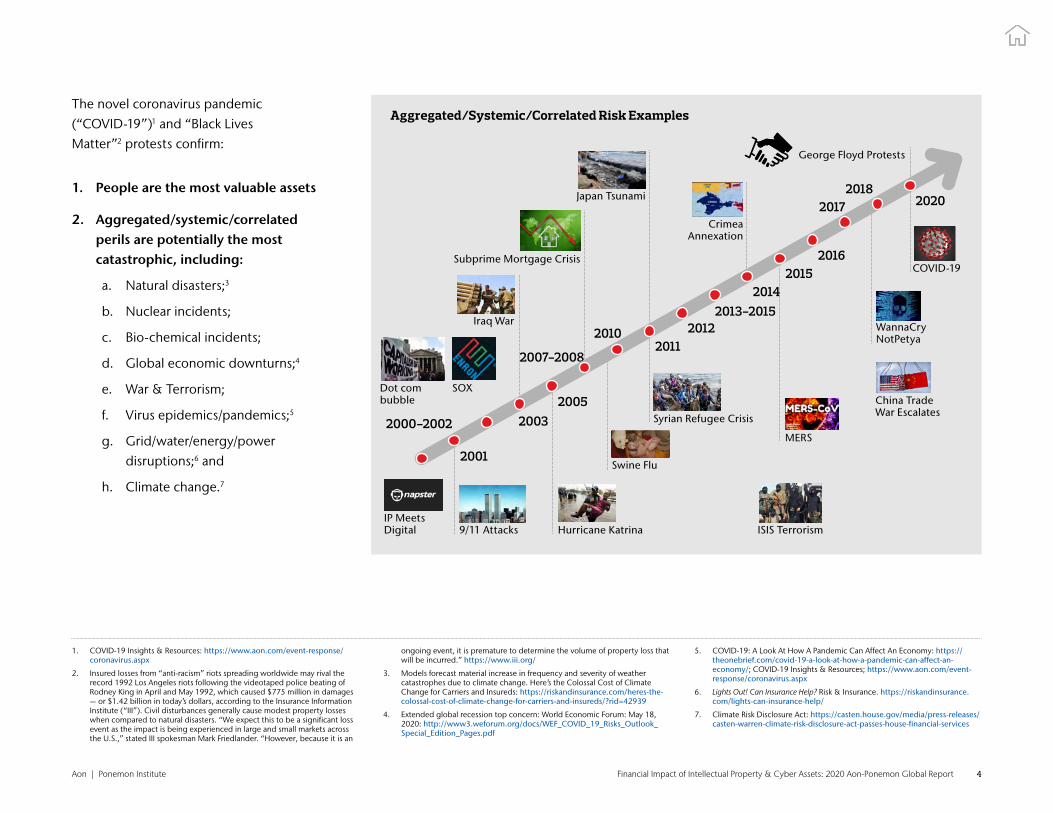
The novel coronavirus pandemic (“COVID-19”)1 and “Black Lives Matter”2 protests confirm:
1. People are the most valuable assets
2. Aggregated/systemic/correlated perils are potentially the most catastrophic, including:
a . Natural disasters;3
b . Nuclear incidents;
c . Bio-chemical incidents;
d . Global economic downturns;4
e . War & Terrorism;
f . Virus epidemics/pandemics;5
g . Grid/water/energy/power disruptions;6 and
h . Climate change .7
1 . COVID-19 Insights & Resources: https://www.aon.com/event-response/coronavirus.aspx
2 . Insured losses from “anti-racism” riots spreading worldwide may rival the record 1992 Los Angeles riots following the videotaped police beating of Rodney King in April and May 1992, which caused $775 million in damages — or $1 .42 billion in today’s dollars, according to the Insurance Information Institute (“III”) . Civil disturbances generally cause modest property losses when compared to natural disasters . “We expect this to be a significant loss event as the impact is being experienced in large and small markets across the U .S .,” stated III spokesman Mark Friedlander . “However, because it is an
ongoing event, it is premature to determine the volume of property loss that will be incurred .” https://www.iii.org/
3 . Models forecast material increase in frequency and severity of weather catastrophes due to climate change . Here’s the Colossal Cost of Climate Change for Carriers and Insureds: https://riskandinsurance.com/heres-the-colossal-cost-of-climate-change-for-carriers-and-insureds/?rid=42939
4 . Extended global recession top concern: World Economic Forum: May 18, 2020: http://www3.weforum.org/docs/WEF_COVID_19_Risks_Outlook_Special_Edition_Pages.pdf
5 . COVID-19: A Look At How A Pandemic Can Affect An Economy: https://theonebrief.com/covid-19-a-look-at-how-a-pandemic-can-affect-an-economy/; COVID-19 Insights & Resources; https://www.aon.com/event-response/coronavirus.aspx
6 . Lights Out! Can Insurance Help? Risk & Insurance . https://riskandinsurance.com/lights-can-insurance-help/
7 . Climate Risk Disclosure Act: https://casten.house.gov/media/press-releases/casten-warren-climate-risk-disclosure-act-passes-house-financial-services
Dot com bubble
Aggregated/Systemic/Correlated Risk Examples
SOX
Iraq War
Subprime Mortgage Crisis
Japan Tsunami
Crimea Annexation
George Floyd Protests
COVID-19
WannaCry NotPetya
China Trade War EscalatesSyrian Refugee Crisis
ISIS Terrorism
MERS
Swine Flu
Hurricane KatrinaIP Meets Digital
Financial Impact of Intellectual Property & Cyber Assets: 2020 Aon-Ponemon Global Report 5Aon | Ponemon Institute
What is the relative financial statement value
and exposure of intangible assets, such as
intellectual property and digital systems/
information? Can cyber and intellectual property
incidents become “Black Swans?”8 If so, where
do they fall on the “Risk Sentiment Index?”9
The purpose of this research is to compare the relative
insurance protection of certain tangible10 versus
intangible11 assets . How do the potential losses related
to intangible asset values compare to potential losses
relating to tangible asset values and potential losses
from traditional perils, such as fires and weather?
Since 2015, Aon and Ponemon Institute have
studied the financial statement impact of tangible
property and specified intangible assets . While
initially focused on losses relating solely to digital/
cyber, over the past few years, the study’s scope has
expanded to include intellectual property . A better
understanding of the relative financial statement
impact of these losses will assist organizations in
better allocating resources and determining the
appropriate amount of risk transfer resources, including
insurance, to mitigate the financial statement impact
of intangible asset losses,12 and potentially increase
the value of the underlying intangible assets .13
Cyber exposures14 can broadly include network
business interruption, breach of privacy and
security of personally identifiable information,
ransomware,15 system failure, confiscating online
bank accounts, creating and distributing viruses on
computers, robotic malfunctions and disrupting
a country’s critical national infrastructure .16 Other
than business interruption for some industries
and ransomware for small organizations, cyber
assessment severity and frequency modelling
demonstrates that the potential largest material
financial statement impact in the majority of cyber
incidents is on a firm’s intellectual property assets .17
8 . A black swan is an unpredictable event that is beyond what is normally expected of a situation and has potentially severe consequences . Black swan events are characterized by their extreme rarity, their severe impact, and the widespread insistence they were obvious in hindsight .
9 . We Can Protect the Economy From Pandemics . Why Didn’t We?, https://www.wired.com/story/nathan-wolfe-global-economic-fallout-pandemic-insurance/
10 . Property, Plant & Equipment (“PP&E”)
11 . Intellectual property; computer systems and related digital assets . An intangible asset is identifiable when it is capable of being separated and sold, transferred, licensed, rented or exchanged, either individually or together with a related contract; or arises from contractual or other legal
rights, regardless of whether those rights are transferable or separable from the entity or from other rights and obligations .
12 . US Cyber Market Update 2019 US Cyber Insurance Profits and Performance; June 2020 . http://thoughtleadership.aon.com/Documents/202006-us-cyber-market-update.pdf
13 . Right IP Strategy Can Maximize Value—IPO, M&A, Enterprise . https://partners.wsj.com/aon/balancing-risk-with-opportunity/right-ip-strategy-can-maximize-enterprise-value/?promo_name=IP-07-2020-03-04-wsj-ip&promo_position=IP-07
14 . Cyber Insurers Get Tough on Risk Assessments Amid Coronavirus Pandemic: https://www.wsj.com/articles/cyber-insurers-get-tough-on-risk-assessments-amid-coronavirus-pandemic-11589794201
15 . It’s 2020 and Only 20% of Companies Are Ready for a Ransomware Attack: https://www.experian.com/content/dam/marketing/na/data-breach/Seventh-Annual-Data-Breach-Preparedness-Study-Experian.pdf
16 . 86% of all breaches are financially motivated, where threat actors are after company financial data, intellectual property, health records, and customer identities that can be sold fast on the Dark Web . Verizon’s 2020 Data Breach Investigations Report . https://enterprise.verizon.com/resources/reports/2020-data-breach-investigations-report.pdf
17 . Aon Global Risk Consulting 2019 Cyber Impact Data and Analytics: https://www.aon.com/cyber-solutions/solutions/cyber-impact-analysis/
18 . Aon’s Intellectual Property Solutions: https://www.aon.com/risk-services/amats/intellectual-property-solutions.jsp
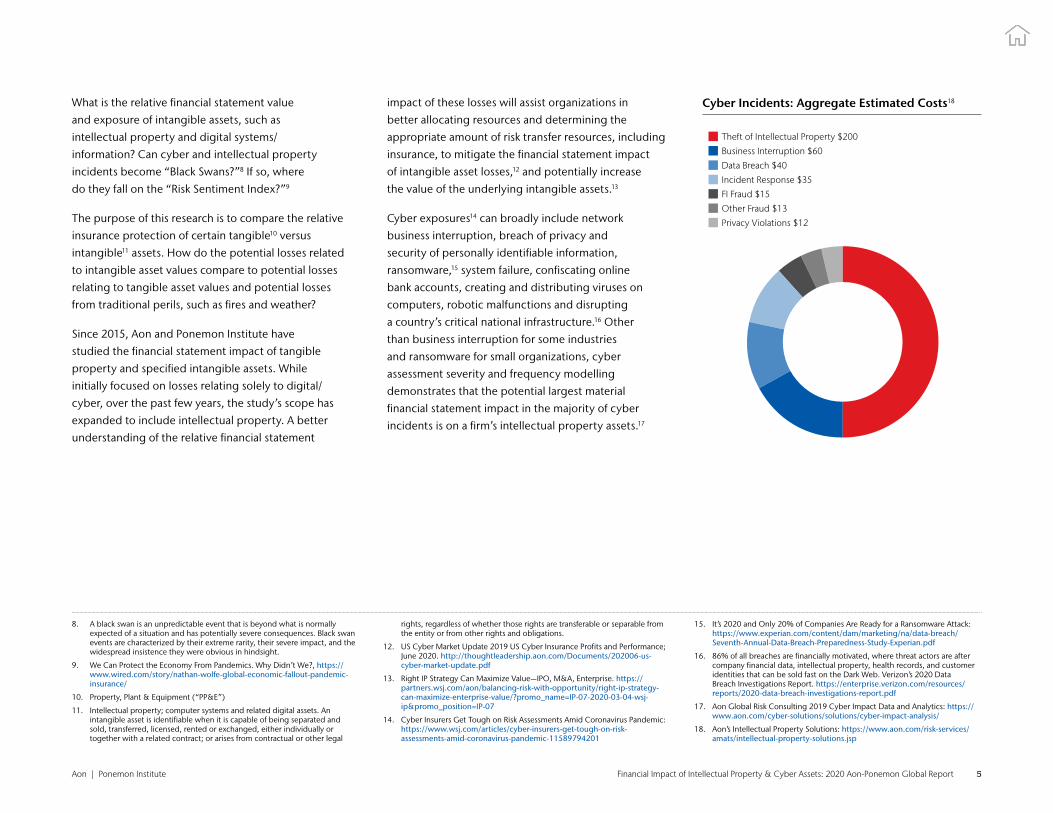
Cyber Incidents: Aggregate Estimated Costs18
Theft of Intellectual Property $200
Business Interruption $60
Data Breach $40
Incident Response $35
FI Fraud $15
Other Fraud $13
Privacy Violations $12

Financial Impact of Intellectual Property & Cyber Assets: 2020 Aon-Ponemon Global Report 6Aon | Ponemon Institute
Intellectual property rights are rapidly becoming
a key basis of wealth19 and “ . . .wealth is not a
thing . It’s an act . Wealth is the commodification
of an act of exclusion — an act we call property
rights .”20 According to the International Journal of
Industrial Organization, on average, a patented
invention has a 50% higher return than the same
unpatented invention .21 A few intellectual property
financial statement impact examples include:
• Balancing Intellectual Property (IP) Interests With
National Interest in Response to the Coronavirus22
WHO embraces plan for COVID-19 intellectual
property pool23
• 3M Targets N95 Respirator Company’s Alleged Price-
Gouging Scheme via Trademark Infringement Suit24
• $440 million patent troll verdict against Apple
upheld in 2019 related to secure communications
over the Internet25
• Cox Communications hit with a $1 billion copyright
verdict December 19, 2019, in a lawsuit alleging
that it allowed its internet subscribers to illegally
download music .26
• Intel put its connected devices patent portfolio up
for sale in 2020 .27
• The US Supreme Court to review Google v. Oracle,28
dubbed Silicon Valley’s “Lawsuit of the Decade,”
which addresses Oracle’s demand for $9 billion in
connection with: (1) whether copyright protection
extends to a software interface; and (2) whether, as
the trial court jury found, the petitioner’s use of a
software interface in the context of creating a new
computer program constitutes fair use .
• China granted twice as many patents as the US
in 2019 .
• Europe leads in the development of licensing
practices establishing and adopting “standards
essential patents” with the single most important
decision handed down anywhere in the world in this
area29 — a huge issue for 5G, Artificial Intelligence,
Internet of Things, etc .
• Caltech wins a $1 .1 billion Wi-Fi technology patent
verdict against Apple and Broadcom30
• Motorola v . Hytera: Extraterritorial Damages Ruling
Enables $764 million Trade Secret Verdict31
• Wells Fargo & Co . ordered to pay $102 .8 million
in patent damages to United Services Automobile
Association (USAA)32
• A trademark dispute dethroned the Tiger King33
• Patents offer tantalizing glimpse of future tech34
19 . Intellectual Property (IP) rights protect intellectual capital, your most valuable asset . However, IP risk poses a threat not only to your intellectual capital but also to your financial success: https://www.willistowerswatson.com/en-US/Solutions/services/intellectual-property-risk-management
20 . Has Wealth Gone Digital? Blair Fix (October 1, 2019) . https://economicsfromthetopdown.wordpress.com/2019/10/01/has-wealth-gone-digital/: “Think about this real-life example: A hotshot programmer creates a new operating system . The OS is heralded as revolutionary and is adopted by millions of people . Does the programmer become wealthy? It depends on property rights . Suppose our programmer is Bill Gates . When he released MS-DOS (and later Windows), Gates fiercely enforced property rights . He patented his software and made people pay to use it . Through a series of shrewd deals with manufacturers, Microsoft eventually gained a near monopoly on PC operating systems . And as we all know, Gates became a wealthy man . Now suppose our programmer is Linus Torvalds . In the 1990s, Torvalds created the Linux operating system . Although adoption was slow at first, Linux now dominates the server market . And through its derivative, Android, Linux also dominates the smartphone market . So Torvalds got rich, right? Actually no . Torvalds released Linux as open source software, meaning it’s free for anyone to use . Because Torvalds didn’t enforce property rights, he didn’t get rich like Bill Gates . The lesson here is that without property rights, goods and services don’t have a price . And without a price, they don’t get counted as ’wealth’ .”
21 . International Journal of Industrial Organization . https://www.journals.elsevier.com/international-journal-of-industrial-organization
22 . McGuire Woods . Patent Infringement for the Public Good . May 5, 2020 . https://www.mcguirewoods.com/client-resources/Alerts/2020/5/patent-infringement-for-the-public-good; Venable LLP . Should Your Company Grant a License to your Company’s Intellectual Property in Response to COVID-19 Emergency? April 1, 2020 . https://www.venable.com/insights/publications/2020/04/should-your-company-grant-a-free-license-to-your
23 . https://www.statnews.com/pharmalot/2020/05/15/who-covid19-coronavirus-patents-intellectual-property/
24 . https://www.ipwatchdog.com/2020/04/16/3m-targets-n95-respirator-companys-alleged-price-gouging-scheme-via-trademark-infringement-suit/id=120684/
25 . On August 7, 2019, Apple filed a Motion to Stay the Mandate and a Motion to Vacate in relation to an August 1, 2019 order of the U .S . Court of Appeals for the Federal Circuit denying Apple’s petition for rehearing and rehearing en banc . That petition related to the Federal Circuit’s previous Rule 36 judgment upholding a district court decision ordering Apple to pay VirnetX nearly $440 million in damages . https://www.ipwatchdog.com/wp-content/uploads/2019/08/Apple-Motion-To-Stay-Mandate.pdf
26 . Sony Music Entertainment, et al.,Plaintiffs V. Cox Communications, et al., Civil Case No . l:18-cv-95, (E .D . Virginia, December 19, 2019) . https://digitalcommons.law.scu.edu/cgi/viewcontent.cgi?article=3107&context=historical
27 . Apple purchased a majority of Intel’s patents related to Intel’s smartphone chip business in 2019 for $1 billion . https://www.ipwatchdog.com/2019/07/30/not-just-another-g-apples-intel-purchase-underscores-
race-5g/id=111751/ & https://www.apple.com/newsroom/2019/07/apple-to-acquire-the-majority-of-intels-smartphone-modem-business/
28 . Google v. Oracle America, No . 18-956 (US Supreme Court, cert . granted November 15, 2019) .
29 . Huawei Technology Co. Ltd v ZTE Corp., ZTE Deutschland GmbH Case C-170/13 . : fundamental guidance for the licensing and enforcement of standard essential patents (SEPs) that are subject to a FRAND licensing commitment (i .e ., a commitment by the patent owner to license those patents on fair, reasonable, and nondiscriminatory terms)) .
30 . January 2020: https://www.latimes.com/business/story/2020-01-29/caltech-wins-a-1-1-billion-jury-verdict-against-apple-and-broadcom
31 . February 14, 2020: https://www.natlawreview.com/article/motorola-v-hytera-extraterritorial-damages-ruling-enables-764m-trade-secret-verdict
32 . United States Automobile Association v . Wells Fargo Bank NA, 18-366, U .S . District Court for the Eastern District of Texas (Marshall)
33 . How a trade mark dispute dethroned the Tiger King . Marks & Clerk . April 7, 2020 https://www.marks-clerk.com/Home/Knowledge-News/Articles/How-a-trade-mark-dispute-dethroned-the-Tiger-King.aspx#.Xxx9D7lKiiR
34 . Mike Murphy . May 17, 2020 . Google wants to be your babysitter https://www.protocol.com/google-wants-to-be-your-babysitter
Financial Impact of Intellectual Property & Cyber Assets: 2020 Aon-Ponemon Global Report 7Aon | Ponemon Institute
Since formerly uninsurable intellectual property
assets, such as trade secrets and patents, can now be
better modelled and insured,35 we have expanded
the study and report to include intellectual property .
With $19 trillion — or nearly 85% of the value of
the S&P 500 — represented by intangible assets,
investment in intellectual property has changed the
global landscape across industries and regions .36
We surveyed 2,235 individuals in North America, Europe,
the Middle East, Africa, Asia Pacific and Latin America
who are involved in their company’s intangible assets
risk management as well as enterprise risk management
activities . Most respondents are in position in either in
finance, treasury and accounting (31%) or risk management
(30%) . Other respondents work in corporate compliance/
audit functions (12%) and general management (10%) .
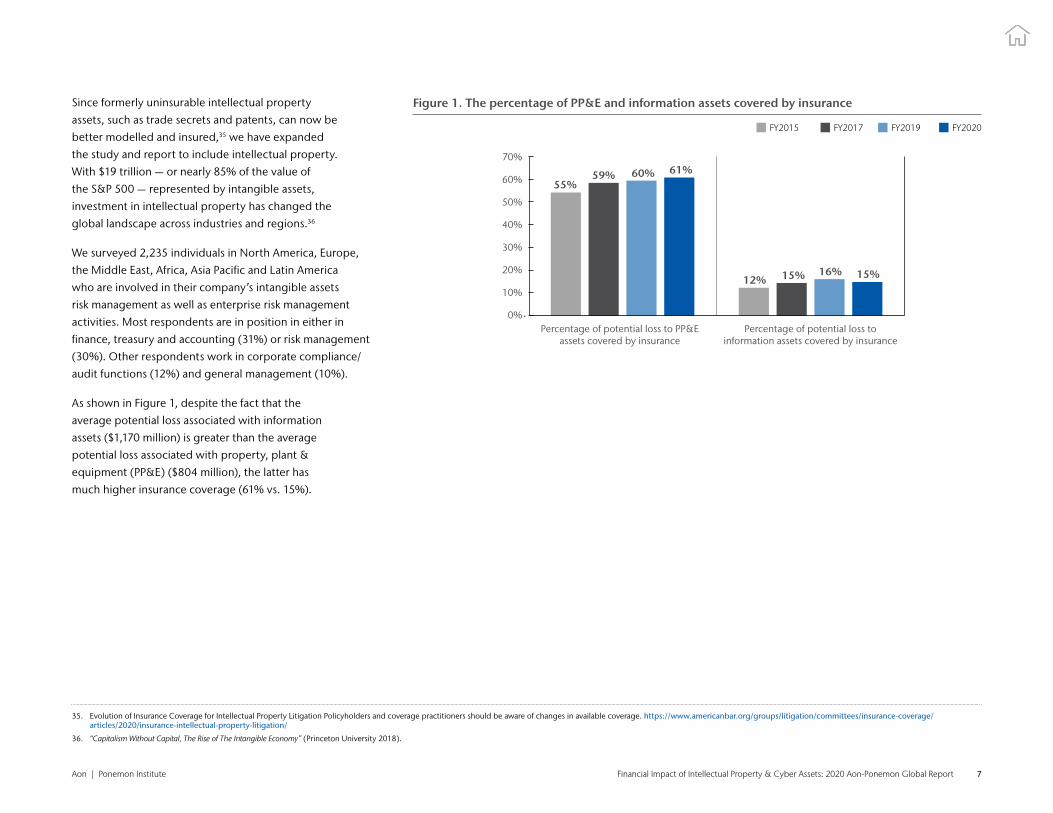
As shown in Figure 1, despite the fact that the
average potential loss associated with information
assets ($1,170 million) is greater than the average
potential loss associated with property, plant &
equipment (PP&E) ($804 million), the latter has
much higher insurance coverage (61% vs . 15%) .
35 . Evolution of Insurance Coverage for Intellectual Property Litigation Policyholders and coverage practitioners should be aware of changes in available coverage . https://www.americanbar.org/groups/litigation/committees/insurance-coverage/articles/2020/insurance-intellectual-property-litigation/
36 . “Capitalism Without Capital, The Rise of The Intangible Economy” (Princeton University 2018) .
Figure 1. The percentage of PP&E and information assets covered by insurance
55%59% 60% 61%
12% 15% 16% 15%
Percentage of potential loss to PP&E assets covered by insurance
Percentage of potential loss to information assets covered by insurance
70%
60%
50%
40%
30%
20%
0%
10%
FY2015 FY2017 FY2019 FY2020

Financial Impact of Intellectual Property & Cyber Assets: 2020 Aon-Ponemon Global Report 8Aon | Ponemon Institute
IP is more important than ever as businesses recognize a paradigm shift from tangible to intangible
assets... While protection is core to any IP strategy, it can also
have a significant capital value for any enterprise.
Greg Case, CEO Aon
“
”
Following are some of the key takeaways from this research:
Companies value information assets slightly higher than they do PP&E.38 The total value of PP&E is approximately $1,223 million
for the companies represented in this research . The average total
value of information assets is slightly higher at $1,274 million .
The value of Probable Maximum Loss (PML)39 is higher for information assets than for PP&E. Companies estimate the average PML resulting from
stolen or destroyed information at approximately $1,170 million . In contrast,
the average value of the largest loss that could result from damage or total
destruction of PP&E is approximately $804 million . Business disruption has a
greater impact on information assets ($321 million)40 than on PP&E ($127 million) .
Insurance coverage is higher for PP&E than for information assets. On average,
approximately 61% of PP&E assets are covered by insurance and approximately
30% of PP&E assets are self-insured41 . Only an average of 15% of information assets
are covered by insurance, while self-insurance is higher for information assets at
63% . Further, the likelihood of a loss is higher for information assets than for PP&E .
Thirty-nine percent of respondents believe no disclosure of a material loss to information assets is required. Forty-two percent of
respondents say their company would disclose a material loss to PP&E
and information assets that is not covered by insurance in its financial
statements as a footnote disclosure . However, 39% of respondents do not
believe disclosure of a material loss to information assets is necessary .
37 . Aon plc NYSE: (AON) Quarterly Earnings Call Q3 2019 https://ir.aon.com/about-aon/investor-relations/financial-reports/quarterly-and-annual-reports/default.aspx
38 . Respondents were asked to assume, with respect to PP&E assets, the root causes of loss (a .k .a . perils) include fire, flooding, weather events, earthquakes and other natural or man-made disasters .
39 . Probable Maximum Loss (PML) is defined as the value of the largest loss that could result from a disaster, assuming the normal functioning of passive protective features (i .e ., firewalls, nonflammable materials, etc .) and proper functioning of most (perhaps not all) active suppression systems (i .e ., sprinklers) .
40 . While the survey results suggest Probable Maximum Loss at approximately $321 million, a growing number of companies are using Risk Decision Platform Analysis and Cyber Modeling to suggest potential losses in excess of $500 million to over $1 billion and are seeking cyber insurance limit premium quotes and policy terms for such amounts .
41 . The percentages do not add up to 100% because they are extrapolated values from questions 3,4,10 and 11 . These results are shown in the complete audited findings in the appendix of the report .
37

Financial Impact of Intellectual Property & Cyber Assets: 2020 Aon-Ponemon Global Report 9Aon | Ponemon Institute
The majority of companies had a material42 or significantly disruptive security exploit or data breach one or more times in the past 24 months. Approximately half (51% of respondents) report that their
company had such a security incident . The average total financial impact
of these incidents was $4 .5 million .43 Seventy percent of these respondents
say the incident increased their company’s concerns over cyber liability .
The number of organizations that believe their cyber insurance is sufficient declined significantly since 2015, from 68% of respondents to 53% of respondents in this year’s research. Despite
the extent of cyber risk, only 31% of respondents say their companies
currently have cyber insurance coverage, with an average limit of
$19 million . Fifty-three percent of these respondents believe this
insurance is sufficient with respect to coverage terms and conditions,
exclusions, retentions, limits and insurance carrier financial security .
Cyber liability and intellectual property risks rank in the top 10 of all business risks facing companies. Eighty-eight percent of respondents
consider a cyber risk as the number one or two business risk (23%),
while 35% rank it among the top five and 30% rank it among the top
10 business risks . Similarly, 84% of respondents rate the risk to their
company’s intellectual property among the top 10 of all business risks
In the past two years, 31% of respondents say their company experienced a material IP event.44 Most of these incidents involved
trade secret rights (35% of respondents) . Fewer events involved
copyright rights (23% of respondents), patent rights (24% of
respondents) and trademark, service mark or trade dress rights (17%
of respondents) . Companies represented in this research estimate
that the average total value of their IP assets such as trademarks,
patents, copyrights, trade secrets and know-how is $578 million .
Most companies’ insurance does not cover all of the consequences of an IP event. Only 36% of respondents say it covers an allegation
that their company is infringing third-party IP rights . Thirty-four
percent of respondents report that their policy covers a challenge to
their company’s IP assets while 29% of respondents say it covers third-
party infringement of their company’s IP assets . More than one-third
of respondents (35%) say the policy does not cover IP events .45
As a complement to a cyber risk policy, few companies have a trade secret theft insurance policy and/or an intellectual property liability policy. Only 27% of respondents say they have a trade secret theft
insurance policy and a similar percentage of respondents (32%) have
an intellectual property liability policy . However, there is significant
misunderstanding regarding the scope of intellectual property coverage
within such policies .46 In fact, IP insurance can be purchased to address IP
infringement allegations even after litigation has been filed .47 However,
such “burning building” IP policies are very expensive with large retentions
– though they could be useful in helping to close an M & A transaction .48
42 . In the context of this study, the term “materiality” takes into consideration monies expended for first-party losses, potential third-party liabilities, value of lost time, litigation costs, reputation damages and revenue losses . This term is broader than “materiality” as defined by GAAP and SEC requirements .
43 . This included all costs, including out-of-pocket expenditures such as consultant and legal fees, indirect business costs such as productivity losses, diminished revenues, legal actions, customer turnover and reputational damages .
44 . “IP event” includes “challenge to company rights,” “infringement of company rights,” and “allegation of company infringement of third-party rights” pursuant to Question 30c in the Appendix hereto .
45 . A detailed review of insurance policies indicates that IP coverage is much lower than survey responses reflect – especially for patent infringement and trade secrets theft, which detailed reviews show less than 5% of organizations have insurance coverage for trade secrets or patents .
46 . Evolution of Insurance Coverage for Intellectual Property Litigation Policyholders and coverage practitioners should be aware of changes in available coverage . https://www.americanbar.org/groups/litigation/committees/insurance-coverage/articles/2020/insurance-intellectual-property-litigation/
47 . Cadence, Synopsys settle Avant IP litigation: https://www.bizjournals.com/portland/stories/2002/11/11/daily48.html
48 . Id .

Financial Impact of Intellectual Property & Cyber Assets: 2020 Aon-Ponemon Global Report 10
Part 2 Key findings

Financial Impact of Intellectual Property & Cyber Assets: 2020 Aon-Ponemon Global Report 11Aon | Ponemon Institute
This report features the consolidated findings of all
regions in this research . All respondents are generally
familiar with the cyber risks facing their company . In
the context of this research, cyber risk means any risk of
financial loss, disruption or damage to the reputation of
an organization from some sort of failure of its information
technology systems .49 The complete audited findings
are presented in the appendix of this report . We have
organized the report according to the following topics:
• Differences between the valuation and Probable
Maximum Loss of Property, Plant & Equipment and
intangible assets
• The cyber risk experience of companies
• Perceptions about the financial impact of cyber exposures
• The risk to intellectual property
Differences between the valuation and PML of PP&E and intangible assetsCompanies value information assets slightly higher than they do PP&E. According to Figure 2, on average, the
total value of PP&E, including all fixed assets plus SCADA
and industrial control systems is approximately $1,223
million for the companies represented in this research . The
average total value of information assets, which includes
customer records, employee records, financial reports,
analytical data, source code, models, methods and other
intellectual properties, is slightly higher, at $1,274 million .
49 . Source: Institute of Risk Management
Figure 2. The total value of PP&E and information assets
Extrapolated value ($ millions)
Total value of PP&E Total value of information assets
$1,400
$1,200
$1,000
$800
$600
$400
$0
$200
$919 $933
$1,223 $1,274
$1,032$1,161
$947
$1,082
FY2015 FY2017 FY2019 FY2020

Financial Impact of Intellectual Property & Cyber Assets: 2020 Aon-Ponemon Global Report 12Aon | Ponemon Institute
The value of PML is higher for information assets than for PP&E. Companies estimate the average PML
resulting from the theft or destruction of information
assets at approximately $1,170 million, according to
Figure 3 . This assumes the normal functioning of passive
protective cybersecurity solutions such as perimeter
controls, data loss prevention tools, data encryption,
identity and access management systems and more .
In contrast, the value of the largest loss that could
result from damage or total destruction of PP&E
is, on average, approximately $804 million . This
also assumes the normal functioning of passive
protective features such as firewalls, nonflammable
materials, proper functioning of active suppression
systems, fire sprinklers, raised flooring and more .
The impact of business disruption to information asset losses continues to increase. According to Figure
4, business disruption has a greater impact on intangible
assets ($321 million)50 than on PP&E ($127 million) .
50 . While the survey results suggest Probably Maximum Loss in the neighborhood of $321 million, a growing number of companies are using Risk Decision Platform Analysis and Cyber Modeling to suggest potential losses in excess of $500 million to over $1 billion and seek cyber insurance limit premium quotes and policy terms for such amounts .
Figure 3. The PML value for PP&E and information assets
Extrapolated value ($ millions) FY2015 FY2017 FY2019 FY2020
$773
Value of the largest loss (PML) that could result from the theft and/or destruction
of information assets
$0 $200 $400 $600 $800 $1,000 $1,200 $1,400
$979
$1,080
$1,170
$701
$770
$796
$804
Value of the largest loss (PML) that could result from damage or the total
destruction of PP&E
Figure 4. The impact of business disruption to information assets and PP&E
Extrapolated value ($ millions)
Value of the largest loss (PML) to information assets due to cyber business interruption
Value of the largest loss (PML) to PP&E due to
business interruption
$350
$300
$250
$200
$150
$100
$0
$50
$257
$112
$321
$127
$299
$138
$266
$130
FY2015 FY2017 FY2019 FY2020

Financial Impact of Intellectual Property & Cyber Assets: 2020 Aon-Ponemon Global Report 13Aon | Ponemon Institute
Other than IP and information assets, the top three
subclasses of intangible assets that are most important
are shown in Figure 5 . The two most important are
third party relationships such as customers, suppliers,
vendors and supply chain (69% of respondents)
and “hard” intangible assets that can be reflected
on balance sheets (59% of respondents) .
Figure 5. What are the top three subclasses of intangible assets that are most important to your company?
Three responses permitted
0% 80%10% 20% 30% 40% 50% 70%
Third party relationships such as customers, suppliers . vendors, supply chain 69%
59%
55%
47%
39%
26%
5
“Hard” intangible assets that can be reflected on balance sheets (i .e ., goodwill,
software licenses, Internet domains)
B2B rights (i .e ., broadcast rights, marketing rights, use rights, franchise agreements, royalty
agreements, licensing agreements, sponsorship)
Public rights (i .e ., drilling rights, import quotas, planning permission/zoning, water rights,
wireless spectrum rights, carbon emission rights)
Non-revenue rights such as non-compete agreements, standstill agreements and
barriers to entry
Don’t know
Brand (i .e ., brand equity, social media influence)
60%

VALUING INTANGIBLES
Tangible assets are easy to value. They’re typically physical assets with finite monetary values, but over the years have become a smaller part of a company’s total worth. As technology disruption continues, and organisations increasingly rely on emerging developments in artificial intelligence, robotics and cloud computing, intangible assets have grown to represent the lion’s share of corporate valuations. But without a physical form and the ability to easily convert them into cash, working out what these assets are truly worth can be challenging
THE EIGHT KEY INTANGIBLE CATEGORIES
07
08
THE VALUE OF INTANGIBLE ASSETS
RELATIONSHIPS
PUBLIC RIGHTS
Value associated with people/corporation networks
The world’s largest publicly traded companies by total intangible value, which includes goodwill, disclosed and undisclosed intangible assets
A company’s intangible assets contain important information about the future strength of its business model
Conventional valuation methods such as discounted cash flow are inadequate without thorough consideration of intangible assets The role of intangible assets in investment assessment
The majority of these categories can be protected by intellectual property, according to Aon
Rights of value generally in the public interest or government handled, such as planning permission or drilling rights
01
Assets created of the mind, such as patents, copyrights, trademarks and trade secrets
Agree Agree
INTELLECTUAL PROPERTY
05
DATA*
Stored information on computer systems, such as customer lists
02
B2B RIGHTS*
Rights of value generated between businesses, such as royalty and licensing agreement
06
NON-REVENUE RIGHTS
Assets that don’t tend to affect any revenue generation, such as non-competition agreements
03
BRAND*
Value associated with consumer perception, such as brand equity
04
HARD INTANGIBLES*
Assets that tend to sit on balance sheets as a specific item, such as goodwill or software licences
Brand Finance 2019
Aon/Ponemon Institute 2019
*Can be protected by intellectual property
MicrosoftAmazon.com
AppleAlphabet
FacebookAT&T
TencentJohnson & Johnson
VisaAlibabaNestle
Procter & GambleAB InBev
VerizonComcast
MastercardNovartisWalmart
UnitedhealthPfizer
Microsoft
Alphabet
Nestle
Amazon.com
Tencent
Johnson & Johnson
Verizon
Walmart
Apple
Visa
Alibaba
Comcast
Unitedhealth
AT&T
Procter & Gamble
AB InBev
Mastercard
Novartis
Pfizer
904
90%
409
79%
675
77%
839
93%
371
84%
521
65%
348
100%
365
88%
313
89%
361
101%
305
101%
344
86%
300
83%
304
99%
259
99%
276
92%
252
101%
252
68%
245
94%
235
98%
SHARE OF ENTERPRISE VALUEIN
TANG
IBLE
VAL
UE ($
BN)
0%
0
10%
20%
30%
40%
50%
60%
70%
80%
90%
100%
900
800
700
600
500
400
300
200
100
HOW SENIOR INVESTMENT DECISION-MAKERS VIEW INTANGIBLES
TANGIBLE VERSUS INTANGIBLE ASSETS COMPARISON
How companies on the S&P 500 have historically valued their tangible and intangible assets (in trillion dollars)
Tangible Intangible
1975
0.59
1.02
1.47
2.32
0.12
0.48
3.12
9.28
4
1985 1995 2005 2018
21.0
3
FIVE BIGGEST COMPANIES
IBMExxon Mobil
Procter & GambleGE3M
FIVE BIGGEST COMPANIES
IBMExxon Mobil
GESchlumberger
Chevron
FIVE BIGGEST COMPANIES
GEExxon MobilCoca-Cola
AttriaWalmart
FIVE BIGGEST COMPANIES
GEExxon MobilMicrosoftCitigroupWalmart
FIVE BIGGEST COMPANIES
AppleAlphabetMicrosoftAmazon
12%
41%
Disagree Disagree
Intangible assets play the same role in my assessment and valuation of companies
as they have in the past
Intangible assets are an increasingly significant part of my assessment and valuation of companies
59%
95% 5% 88%
Columbia Threadneedle Investments 2019
Aon/Ponemon Institute 2019
Financial Impact of Intellectual Property & Cyber Assets 14Aon | Ponemon Institute
51 . Intangible Assets: A Hidden but Crucial Driver of Company Value: https://www.visualcapitalist.com/intangible-assets-driver-company-value/
51
Source: Raconteur https://www.raconteur.net/

Financial Impact of Intellectual Property & Cyber Assets: 2020 Aon-Ponemon Global Report 15Aon | Ponemon Institute
There is a significant difference between the insurance coverage of PP&E and information assets. On average, approximately 61% of PP&E assets are
covered by insurance and approximately 30% of PP&E
assets are self-insured (Figure 6) . Only an average of
15% of information assets are covered by insurance .
Self-insurance is higher for information assets at 63% .
The likelihood of a loss is higher for information assets than for PP&E. Companies estimate the likelihood that
they will sustain a loss relating to information assets
totaling no more than 50% of PML over the next 12
months at 5 .61% and 100% of PML at 2 .95%, as shown in
Figure 7 . The likelihood of a loss relating to PP&E totaling
no more than 50% of PML over the next 12 months is
an average of 1 .74% and at 100% of PML it is 0 .54% .
Figure 6. Percentage of PP&E and information assets covered by insurance
Extrapolated percentage FY2015 FY2017 FY2019 FY2020
Figure 7. Likelihood of loss to PP&E and information assets totaling more than 50% and 100% of PML over the next 12 months
Extrapolated percentage
0% 10% 20% 30% 40% 50% 60% 70%
62%Percentage of potential loss to
information assets that is self-insured59%
62%63%
12%15%
16%15%
30%28%
29%30%
55%59%60%
61%
The percentage of potential loss to information assets covered by insurance
Percentage of potential loss to PP&E that is self-insured
Percentage of potential loss to PP&E covered by insurance
4.57%Likelihood of a loss to information assets totaling no more than 50% of PML over
the next 12 months
0% 6 .00%5 .00%4 .00%3 .00%2 .00%1 .00%
5.24%5.53%5.61%
2.52%2.77%
2.91%2.95%
1.68%1.51%
1.63%1.74%
0.49%0.52%
0.44%0.54%
Likelihood of a loss to information assets totaling 100% of PML over the next
12months
Likelihood of a loss to PP&E assets totaling no more than 50% of PML over
the next 12 months
Likelihood of a loss to PP&E assets totaling 100% of PML over the next 12
months
FY2015 FY2017 FY2019 FY2020

Financial Impact of Intellectual Property & Cyber Assets: 2020 Aon-Ponemon Global Report 16Aon | Ponemon Institute
Thirty-nine percent of respondents believe no disclosure of a material loss to information assets is required. Figure 8 focuses on how companies would
disclose a material loss . Forty-two percent of respondents
say their company would disclose a material loss to PP&E
assets that is not covered by insurance in the footnotes
of its financial statements, followed by a disclosure as a
discussion in the management letter (20% of respondents) .
Forty-two percent say they would disclose a
material loss to information assets in the footnotes
of the financial statements, but 39% of respondents
do not believe any disclosure is necessary .
Figure 8. How would your company disclose a material loss to PP&E and intangible assets?
Methods to disclose a material loss to PP&E assets not covered by insurance
Methods to disclose a material loss to information assets not covered by insurance
42%
42%
39%
15%
8%
19%
7%
20%
4%
4%
0% 20% 30% 40%15% 45%10%
Footnote disclosure in the financial statements
None – disclosure is not necessary
Disclosure as a contingent liability on the balance sheet (FASB 5)
Discussion in the management letter
25% 35%5%
Other

Financial Impact of Intellectual Property & Cyber Assets: 2020 Aon-Ponemon Global Report 17Aon | Ponemon Institute
The cyber risk experience of companies, including defining digital leadership during COVID-19.52
Responsibility for cyber risk management is dispersed throughout the organization. As shown in Figure 9,
no one function is clearly responsible for managing
cyber risks in their organizations .53 The top two are
business unit leaders (25% of respondents) and the
chief information officer (21% of respondents) .54
52 . Suggested industry reading https://hr.economictimes.indiatimes.com/news/industry/defining-digital-leadership-during-covid-19/75735078; https://insights.humancapital.aon.com/assessing-digital-readiness; Herjavec .Robert .Cybersecurity CEO: We Need To Secure A Massively Expanding Cyber-Attack Surface . December 2018 https://cybersecurityventures.com/cybersecurity-ceo-we-need-to-secure-a-massively-expanding-cyber-attack-surface/
53 . “Treating Cyber Risks – Using Insurance and Finance.” Chapter 10 of John Wiley and Sons Book: The Cyber Risk Handbook: Creating and Measuring Effective Cybersecurity Capabilities .
54 . Is Cyber Risk a D & O Risk? Ethical Boardroom . https://ethicalboardroom.com/is-cyber-risk-a-do-risk/
Figure 9. Who is most responsible for cyber risk management?
FY2015 FY2017 FY2019 FY2020
Business unit (LOB) leaders
15%23%
23%25%
29%24%
22%21%
14%15%
16%15%
15%15%15%
14%
6%5%
6%7%
6%6%
6%7%
7%7%
6%5%
3%2%2%3%
4%3%3%
2%
1%1%
0%1%
Chief information office
Risk management
Chief information security officer
Procurement
Chief financial officer
General counsel
CEO/board of directors
Compliance/audit
Other
0% 5% 10% 15% 20% 25% 30% 35%

Financial Impact of Intellectual Property & Cyber Assets: 2020 Aon-Ponemon Global Report 18Aon | Ponemon Institute
The majority of companies had a material or significantly disruptive security exploit or data breach one or more times in the past 24 months. More than
half (51% of respondents) report their company had such
a security incident . The average total financial impact
of these incidents was $4 .5 million . According to Figure
10, 70% of these respondents say the incident increased
their company’s concerns over cyber liability .55
55 . How Cyber Criminals Are Taking Advantage Of COVID-19: https://theonebrief.com/how-cyber-criminals-are-taking-advantage-of-covid-19/
Figure 10. How did the security exploit or data breach affect your company’s concerns over cyber liability?
FY2015 FY2017 FY2019 FY2020
More concerned Less concerned
80%
70%
60%
50%
40%
30%
0%
20%
58%
70%65%63%
No change
17%10%11%12%
26%20%
24%25%
10%

Financial Impact of Intellectual Property & Cyber Assets: 2020 Aon-Ponemon Global Report 19Aon | Ponemon Institute
The types of security incidents that 51% of the companies
in this research faced are displayed in Figure 11 . The
most frequent type of incident was one that caused
disruption to business and IT operations (50% of
respondents) or resulted in a system or business process
failure that caused disruption to business operations
(46% of respondents) . This is followed by 38% of
respondents who say the cyberattack resulted in the
misuse or theft of business confidential information .
Figure 11. What type of data breach or security exploit did your company experience?
More than one response permitted FY2015 FY2017 FY2019 FY2020
41%46%
48%50%
43%47%
43%46%
35%34%
35%38%
28%34%
39%37%
32%26%
31%34%
0% 10% 20% 30% 40% 50% 60%
Cyberattack that caused disruption to business and IT operations
(such as denial of service attacks)
System or business process failures that caused disruption to business operations
(e .g ., software updates)
Cyberattack that resulted in the misuse or theft of business confidential information,
such as intellectual properties
Negligence or mistakes that resulted in the loss of business
confidential information
Cyberattack that resulted in the theft of business confidential information, thus
requiring notification to victims
9%6%6%
7%
Other

Financial Impact of Intellectual Property & Cyber Assets: 2020 Aon-Ponemon Global Report 20Aon | Ponemon Institute
Perceptions about the financial impact of cyber exposures
Awareness of the economic and legal consequences from an international data breach or security exploit is low. Seventy percent of respondents say
their organizations are required to comply with the
EU’s General Data Protection Regulation and/or the
California Consumer Protection Act (CCPA) .56
As revealed in Figure 12, 82% of respondents are either
fully or somewhat aware of the consequences that could
result from a data breach or security exploit in other
countries in which their company operates . Eighteen
percent say they are not aware of the consequences .57
56 . Cyber Perils in a Growing Market – Helping EMEA organizations better understand the interconnectivity among multiple lines of insurance. https://www.aon.com/unitedkingdom/insights/cyber-perils-in-a-growing-market.jsp
57 . The Price of Data Security: A guide to the insurability of GDPR fines across Europe (3rd Edition, May 25, 2020) . https://www.aon.com/risk-services/gdpr-fines-guide.jsp
Figure 12. Awareness of the economic and legal consequences from an international data breach or security exploit
Yes, fully aware Yes, somewhat aware
50%
45%
30%
25%
20%
15%
0%
10%
44%
Not aware
38%
18%
5%
40%
35%

Financial Impact of Intellectual Property & Cyber Assets: 2020 Aon-Ponemon Global Report 21Aon | Ponemon Institute
Companies’ exposure to cyber risk is not decreasing. While organizations are predicting that their cyber
risk exposure will increase, 37% of respondents say
there is no plan to purchase cyber insurance . As the
data in Figure 13 show, 65% of respondents believe
their company’s exposure to cyber risk will increase
and 26% of respondents say it will stay the same . Only
9% of respondents expect it to actually decrease .
Organizations that believe their cyber insurance is sufficient has declined significantly since 2015. Despite the extent of cyber risk, which exceeds that of
PP&E risk, only 31% of respondents say their companies
currently have cyber insurance coverage with an average
limit of $19 million . As Figure 14 reveals, 53% of these
respondents believe this insurance is sufficient with
respect to coverage terms and conditions, exclusions,
retentions, limits and insurance carrier financial security .58
58 . The Future of Insurance to Address Cyber Perils. Insurance Thought Leadership. http://insurancethoughtleadership.com/future-of-insurance-to-address-cyber-perils/
Figure 13. Will your company’s cyber risk exposure increase, decrease or stay the same over the next 24 months?
FY2015 FY2017 FY2019 FY2020
Increase Decrease
70%
60%
50%
40%
30%
0%
20%
58%65%67%
64%
Stay the same
12% 9%11%12%
29% 26%23%25%
10%
Figure 14. Is your company’s cyber insurance coverage sufficient?
FY2015 FY2017 FY2019 FY2020
Yes No
80%
70%
60%
50%
40%
30%
0%
20%
68%
53%58%
63%
Unsure
19%
32%28%
23%
13% 15%13%14%10%

Financial Impact of Intellectual Property & Cyber Assets: 2020 Aon-Ponemon Global Report 22Aon | Ponemon Institute
According to Figure 15, the adequacy of coverage is
determined mainly by a formal risk assessment by a
third party (27% of respondents) or policy terms and
conditions reviewed by a third-party specialist (18%
of respondents) . Only 13% say it was determined by a
formal risk assessment conducted by the insurer, and 16%
say it was a formal risk assessment by in-house staff .
Figure 15. How companies determine the adequacy of coverage
FY2015 FY2017 FY2019 FY2020
21%22%
24%27%
24%22%
20%18%
8%13%13%
16%
17%16%16%
15%
11%13%
14%13%
17%13%
12%11%
3%1%
1%0%
0% 5% 10% 15% 20% 25% 30%
Formal risk assessment by third party
Policy terms and conditions reviewed by a third-party specialist
Formal risk assessment by in-house staff
Maximum available from the insurance market
Formal risk assessment conducted by the insurer
Informal or ad hoc risk assessment
Other

Financial Impact of Intellectual Property & Cyber Assets: 2020 Aon-Ponemon Global Report 23Aon | Ponemon Institute
Understanding the context of each organization’s
industry, size, geography, cyber resiliency and risk
management appetite is critical . For instance, the IBM/
Ponemon industry leading “Cost of a Data Breach” 2019
study59 is useful for small and medium enterprises, but
each specific cyber exposure’s circumstance should
be modelled actuarially by situation and adjusted
accordingly .60 For instance, with respect to public
companies, the average data breach costs $116M .61
59 . Cost of a Data Breach Report 2019: https://databreachcalculator.mybluemix.net/?_ga=2.194343278.2114294015.1589755871-1053918807.1589755871&cm_mc_uid=73810240937415897558600&cm_mc_sid_50200000=54190611589755860100&cm_mc_sid_52640000=27666381589755860107
60 . IRIS 20/20, Cyentia, https://cyentia.com/iris
61 . Trends in Cybersecurity Breach Disclosures . May 2020 . https://www.auditanalytics.com/doc/AA_Trends_in_Cybersecurity_Report_May_2020.pdf
Estimate of $150 record needs proper context
Range of Ponemon Cost of Data Breach Study (14% of losses)

Financial Impact of Intellectual Property & Cyber Assets: 2020 Aon-Ponemon Global Report 24Aon | Ponemon Institute
According to Figure 16, other services provided by the
insurer are access to legal and regulatory experts (82%
of respondents), access to cybersecurity forensic experts
(79% of respondents), access to specialized technologies
and tools (54% of respondents), assistance in reputation
management activities (53% of respondents) and assistance
in the remediation of the incident (52% of respondents) .
Figure 16. Other services provided by the cyber insurer
More than one response permitted FY2015 FY2017 FY2019 FY2020
81%76%
81%82%
82%82%82%
79%
52%47%
51%54%
49%50%50%
53%
56%53%
56%52%
41%42%42%
45%
44%45%45%
44%
48%41%
44%40%
26%25%25%
21%
22%18%19%18%
Other
0% 10% 20% 30% 40% 50% 60% 90%
Access to legal and regulatory experts
Access to cyber security forensic experts
Access to specialized technologies and tools
Assistance in reputation management activities
Assistance in the remediation of the incident
Advanced warnings about ongoing threats and vulnerabilities
Assistance in the notification of breach victims
Credit monitoring services for breach victims
Identity protection services for breach victims
70% 80%

Financial Impact of Intellectual Property & Cyber Assets: 2020 Aon-Ponemon Global Report 25Aon | Ponemon Institute
Cyber liability and IP risks rank in the top 10 of all business risks facing companies. Figure 17 demonstrates
that 88% of respondents consider a cyber risk as the
number one or two business risk (23% of respondents),
among the top five (35% of respondents) and among the
top 10 business risks (30% of respondents) . Similarly, 84%
of respondents rate the risk to their company’s intellectual
property (IP) among the top 10 of all business risks
Companies vary greatly in their approach to determining their cyber risk. To determine the cyber risk
to their company, 36% of respondents say the company
hired a third-party to conduct an assessment or audit and
19% of respondents say it was an informal (ad hoc) internal
assessment (Figure 18) . Only 22% of respondents say
their company completed a formal internal assessment,
but 15% of respondents say it was intuition or gut feel .
Figure 17. How do cyber and IP risks compare to other business risks?
Figure 18. How did you determine the level of cyber risk to your company?
Cyber liability IP risk
FY2015 FY2017 FY2019 FY2020
28%33%34%
36%
15%18%
20%22%
24%22%
21%19%
19%17%
16%15%
14%11%
9%8%
0% 5% 10% 15% 20% 25% 40%
Hired a third party to conduct an assessment or audit
Completed a formal internal assessment
Completed an informal (ad hoc) internal assessment
Intuition or gut feel
Did not do any type of assessment
30% 35%
The number one or two business risk
Top 5 business risk
40%
35%
30%
25%
20%
15%
0%
10%
23%19%
Top 10 business risk
35%31%
5%
30%34%
12%16%
Not in the top 10 of business risks

Financial Impact of Intellectual Property & Cyber Assets: 2020 Aon-Ponemon Global Report 26Aon | Ponemon Institute
Most companies are postponing the purchase of cyber insurance. As discussed previously, 37% of respondents say
their company has no plans to purchase cyber insurance .
Only 17 of respondents say their company will purchase
cyber insurance in the next 12 months . Almost half of
respondents (46%) say they will purchase cyber insurance in
the next 24 months (26%) or more than 24 months (20%) .
According to Figure 19, the main reasons for not
purchasing cyber security insurance are: insurance limits
available are inadequate based on their exposure (44%
of respondents), premiums are too expensive (41%
of respondents) and there are too many exclusions,
restrictions and uninsurable risks (34% of respondents) .
Even though calculating the frequency and severity of
intangible asset risks compared to intangible asset value
relative to other organization assets is not a perfectly
scientific mathematical exercise, we cannot afford to ignore
the risks that are hardest to measure –- especially when
they may pose the greatest threats to our organizations .
“The most calamitous failures of prediction usually have
a lot in common . We focus on those signals that tell
a story about the world as we would like it to be, not
how it really is . We ignore the risks that are hardest to
measure, even when they pose the greatest threats to our
well-being . We make approximations and assumptions
about the world that are much cruder than we realize .
We abhor uncertainty, even when it is an irreducible
part of the problem we are trying to solve .”62
Figure 19. What are the main reasons why your company will not purchase cyber security insurance?
More than one response permitted FY2015 FY2017 FY2019 FY2020
41%40%
36%44%
30%36%
35%41%
27%27%
31%34%
27%30%
27%24%
24%22%22%
20%
20%17%
18%16%
7%7%7%
5%
0% 5% 10% 15% 20% 40% 50%
Insurance limits available are inadequate based on our exposure
Premiums are too expensive
Too many exclusions, restrictions and uninsurable risks
Property and casualty policies are sufficient
Executive management does not see the value of this insurance
Unable to get insurance underwritten because of current risk profile
Other
25% 30% 35% 45%
62 . Silver, Nate . The Signal and the Noise: Why Most Predictions Fail - but Some Don’t. United States . Penguin Group . 2012 .

Aon | Ponemon Institute
We are focused on addressing client need around long-tail risks
– particularly IP and cyber – and there is a tremendous
market opportunity that goes along with it.
Greg Case, CEO Aon
“
”
Risks to intellectual property (IP)63
63 . Only 19% of companies report that their patent portfolios are the right size – one of four key findings discovered in the Cipher report Cipher: https://cipher.ai/insights/beyond-portfolio-optimisation-iam-issue-100-article/
64 . IP market “should be much bigger than cyber” . Risk and Insurance . October 25, 2019 . https://www.theinsurer.com/news/ip-market-should-be-much-bigger-than-cyber-aons-case/5596.article
Basic IP Enterprise Risk Management
Medium High
Low
Med
ium
Hig
h
Severity
Freq
uen
cy
Low
Risk R
anking
64
Financial Impact of Intellectual Property & Cyber Assets: 2020 Aon-Ponemon Global Report 28Aon | Ponemon Institute
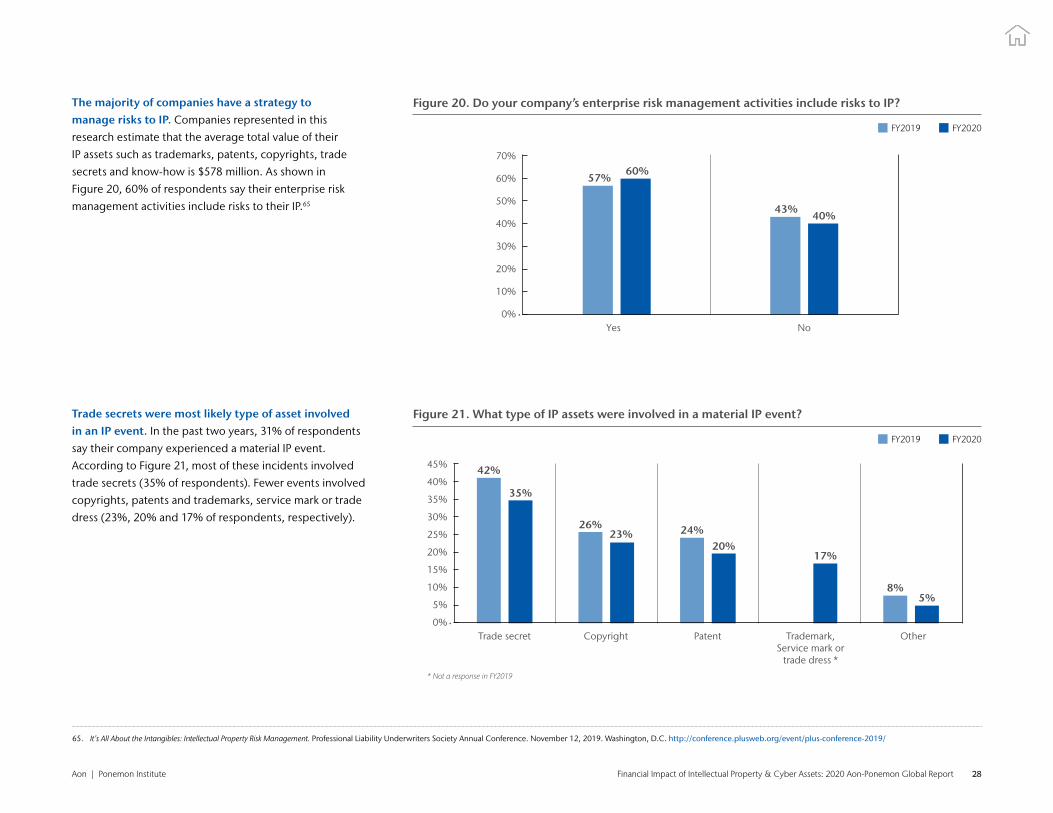
The majority of companies have a strategy to manage risks to IP. Companies represented in this
research estimate that the average total value of their
IP assets such as trademarks, patents, copyrights, trade
secrets and know-how is $578 million . As shown in
Figure 20, 60% of respondents say their enterprise risk
management activities include risks to their IP .65
Trade secrets were most likely type of asset involved in an IP event. In the past two years, 31% of respondents
say their company experienced a material IP event .
According to Figure 21, most of these incidents involved
trade secrets (35% of respondents) . Fewer events involved
copyrights, patents and trademarks, service mark or trade
dress (23%, 20% and 17% of respondents, respectively) .
65 . It’s All About the Intangibles: Intellectual Property Risk Management. Professional Liability Underwriters Society Annual Conference . November 12, 2019 . Washington, D .C . http://conference.plusweb.org/event/plus-conference-2019/
Figure 20. Do your company’s enterprise risk management activities include risks to IP?
FY2019 FY2020
Yes No
70%
60%
50%
40%
30%
20%
0%
10%
57%60%
43%40%
Figure 21. What type of IP assets were involved in a material IP event?
* Not a response in FY2019
FY2019 FY2020
Trade secret Copyright
45%
35%
30%
25%
20%
15%
0%
10%
42%
35%
Patent
26%23%
5%
24%20%
8%5%
Trademark,Service mark or
trade dress *
17%
Other
40%
Financial Impact of Intellectual Property & Cyber Assets: 2020 Aon-Ponemon Global Report 29Aon | Ponemon Institute
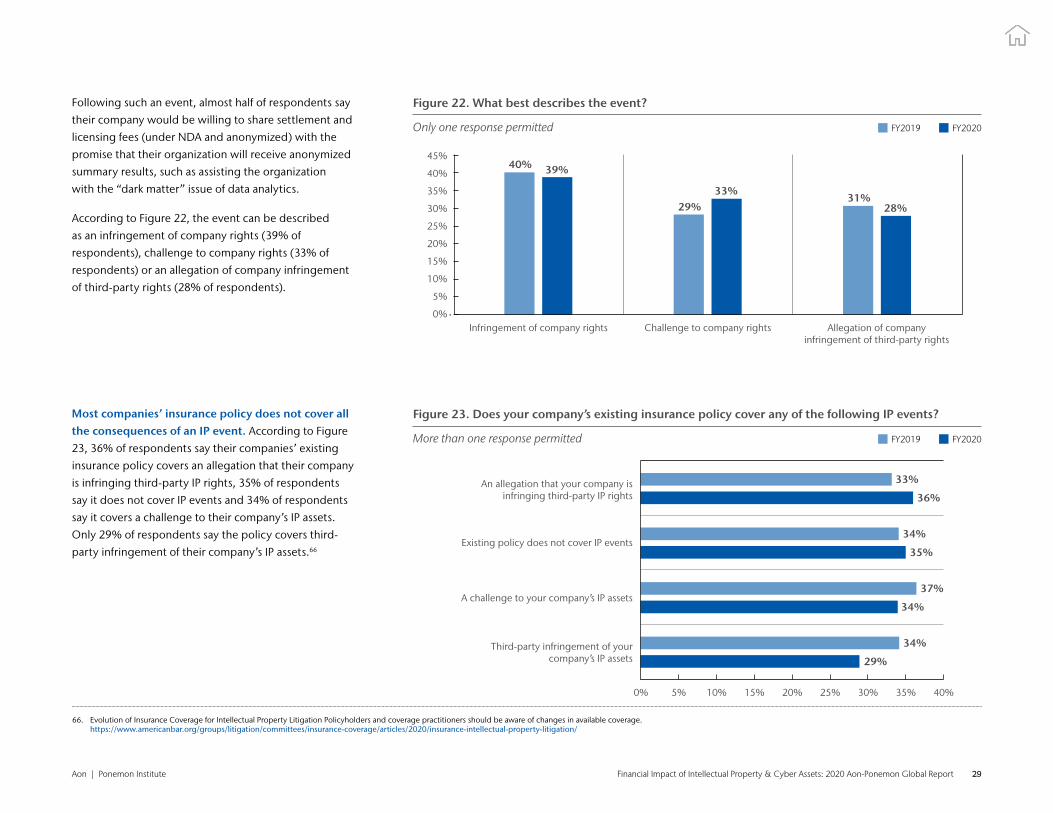
Following such an event, almost half of respondents say
their company would be willing to share settlement and
licensing fees (under NDA and anonymized) with the
promise that their organization will receive anonymized
summary results, such as assisting the organization
with the “dark matter” issue of data analytics .
According to Figure 22, the event can be described
as an infringement of company rights (39% of
respondents), challenge to company rights (33% of
respondents) or an allegation of company infringement
of third-party rights (28% of respondents) .
Most companies’ insurance policy does not cover all the consequences of an IP event. According to Figure
23, 36% of respondents say their companies’ existing
insurance policy covers an allegation that their company
is infringing third-party IP rights, 35% of respondents
say it does not cover IP events and 34% of respondents
say it covers a challenge to their company’s IP assets .
Only 29% of respondents say the policy covers third-
party infringement of their company’s IP assets .66
66 . Evolution of Insurance Coverage for Intellectual Property Litigation Policyholders and coverage practitioners should be aware of changes in available coverage . https://www.americanbar.org/groups/litigation/committees/insurance-coverage/articles/2020/insurance-intellectual-property-litigation/
Figure 22. What best describes the event?
Only one response permitted
Figure 23. Does your company’s existing insurance policy cover any of the following IP events?
More than one response permitted
FY2019 FY2020
FY2019 FY2020
Infringement of company rights Challenge to company rights
45%
35%
30%
25%
20%
15%
0%
10%
5%
40% 39%40%
33%29% 28%
31%
Allegation of company infringement of third-party rights
36%
33%
35%
34%
34%
37%
29%
34%
An allegation that your company is infringing third-party IP rights
Existing policy does not cover IP events
A challenge to your company’s IP assets
0% 20% 30%15% 40%10% 25% 35%5%
Third-party infringement of your company’s IP assets

Financial Impact of Intellectual Property & Cyber Assets: 2020 Aon-Ponemon Global Report 30Aon | Ponemon Institute
As a complement to a cyber risk policy, few companies have a trade secret theft insurance policy and/or an intellectual property liability policy. As shown in Figure 24, only 27% of respondents
say they have a trade secret theft insurance policy
and a similar percentage of respondents (32%)
have an intellectual property liability policy .67
While most companies do not have specific IP insurance policies, there is significant interest in purchasing them. According to Figure 25, 66%
of respondents are very interested or interested in
purchasing a trade secret and/or an IP liability policy .
67 . A detailed review of insurance policies indicates that IP coverage is included in existing policies at a much lower rate than survey responses reflect – especially for patent infringement and trade secrets theft, which detailed reviews show less than 5% of organizations have insurance coverage for trade secrets or patents .
Figure 24. Does your company have a trade secret and/or IP liability policy?
Figure 25. If no, what is your company’s level of interest in purchasing a trade secret theft insurance policy and/or an IP liability policy?
Very interested and Interested responses combined
Trade secret theft insurance policy Intellectual property liability policy
Yes No
80%
60%
50%
40%
30%
20%
0%
10%
27%32%
73%68%70%
FY2019 FY2020
Trade secret theft insurance policy Intellectual property liability policy
70%
60%
50%
40%
30%
20%
0%
10%
62%66%
63%66%

Financial Impact of Intellectual Property & Cyber Assets: 2020 Aon-Ponemon Global Report 31Aon | Ponemon Institute
Only 30% of respondents say management reports
IP status, opportunities and risks to the board of
directors and/or equity investors .68 Thirty-four
percent of respondents say their organizations use
IP as collateral in support of debt financing .
68 . IP Within the Boardroom: Is Intellectual Property a Director & Officer Issue? Ethical Boardroom . https://ethicalboardroom.com/ethical-boardroom-summer-2019/
Figure 26. Does management report IP status, opportunities and risks to the board of directors and/or equity investors and does it use IP as collateral in support of debt financing?
Management reports IP status, opportunities and risks to the board of directors and/or equity investors
IP as collateral in support of debt financing
34%30%
55%
63%
11%7%
Yes No
70%
60%
50%
40%
30%
0%
20%
Don’t know
10%

Financial Impact of Intellectual Property & Cyber Assets: 2020 Aon-Ponemon Global Report 32
Part 3 Methods

Financial Impact of Intellectual Property & Cyber Assets: 2020 Aon-Ponemon Global Report 33Aon | Ponemon Institute
The consolidated sampling frame is composed of 59,602
individuals located in North America, Europe, the Middle
East, Africa, Asia Pacific and Latin America . Respondents
are involved in their company’s cyber risk management
as well as enterprise risk management activities . As Table
1 shows, 2,489 respondents completed the survey, of
which 254 were rejected for reliability issues . The final
sample consisted of 2,235 surveys, a 3 .7% response rate .
Pie Chart 1 reports the current position or organizational
level of the respondents . More than half of the
respondents (58%) reported their current position as
supervisory level or above and 27% of respondents
reported their current position level as technician .
Table 1. Sample response Freq Pct%
Total sampling frame 59,602 100 .0%
Total returns 2,489 4 .2%
Rejected or screened surveys 254 0 .4%
Final sample 2,235 3 .7%
Pie Chart 1. Current position or organizational level
Supervisor
Associate/staff
Technician
Contractor/consultant
Senior executive
Vice president
Director
Manager
6%4%
15%
20%
13%
9%
27%
6%

Financial Impact of Intellectual Property & Cyber Assets: 2020 Aon-Ponemon Global Report 34Aon | Ponemon Institute
As Pie Chart 2 reveals, 69% of the respondents
are from organizations with a global headcount
of more than 1,000 employees .
Pie Chart 3 reports the primary industry classification of
respondents’ organizations . This chart identifies financial
services (18% of respondents) as the largest segment,
which includes banking, investment management,
insurance, brokerage, payments and credit cards .
This is followed by healthcare (11% of respondents),
public sector (11% of respondents), industrial (10% of
respondents), and services (10% of respondents) .69
69 . Cyber Insurance For Law Firms and Legal Organizations. Chapter 15 of The ABA Cybersecurity Handbook: A Resource for Attorneys, Law Firms, and Business Professionals, Second Edition . https://shop.americanbar.org/eBus/Store/ProductDetails.aspx?productId=280127783
Pie Chart 2. Worldwide headcount of the organization
Pie Chart 3. Primary industry focus
500 to 1,000
Less than 500
More than 75,000
25,001 to 75,000
5,001 to 25,000
1,001 to 5,000
Services
Technology & software
Retailing
Energy & utilities
Financial services
Healthcare
Public sector
Industrial
Hospitality
Transportation
Agriculture & food services
Consumer products
Education & research
Communications
Entertainment & media
1%2%
2%
2%2%
3%
5%
6%
8%
9%
10% 10%
11%
11%
18%
7%
13%
27%
22%
18%
13%

Financial Impact of Intellectual Property & Cyber Assets: 2020 Aon-Ponemon Global Report 35
Part 4 Caveats

Financial Impact of Intellectual Property & Cyber Assets: 2020 Aon-Ponemon Global Report 36Aon | Ponemon Institute
There are inherent limitations to survey research that need to be carefully considered before drawing inferences
from findings . The following items are specific limitations that are germane to most web-based surveys .
Non-response bias: The current findings are based on a sample of survey returns . We sent surveys
to a representative sample of individuals, resulting in a large number of usable returned responses .
Despite non-response tests, it is always possible that individuals who did not participate are substantially
different in terms of underlying beliefs from those who completed the instrument .
Sampling frame bias: The accuracy is based on contact information and the degree to which the list is
representative of individuals who are involved in their company’s’ cyber and enterprise risk management . We also
acknowledge that the results may be biased by external events such as media coverage . We also acknowledge
bias caused by compensating subjects to complete this research within a specified time period .
Self-reported results: The quality of survey research is based on the integrity of confidential responses
received from subjects . While certain checks and balances can be incorporated into the survey
process, there is always the possibility that a subject did not provide accurate responses .

Financial Impact of Intellectual Property & Cyber Assets: 2020 Aon-Ponemon Global Report 37
Appendix: Detailed Survey Results

Financial Impact of Intellectual Property & Cyber Assets: 2020 Aon-Ponemon Global Report 38Aon | Ponemon Institute
The following tables provide the frequency or percentage frequency
of responses to all survey questions contained in this study . All
survey responses were captured in December 2019 .
Survey response FY2020
Sampling frame* 59,602
Total returns 2,489
Rejected surveys 254
Final sample 2,235
Response rate 3 .7%
*The sampling frame is a consolidation of four regions: EMEA, APAC, LATAM and North America.
Screening questions
S1 . How familiar are you with cyber risks facing your
company today?
FY2020
Very familiar 25%
Familiar 37%
Somewhat familiar 38%
Not familiar (stop) 0%
Total 100%
S2 . Are you involved in your company’s cyber risk
management activities?
FY2020
Yes, significant involvement 34%
Yes, some involvement 66%
No involvement (stop) 0%
Total 100%
S3 . What best defines your role? FY2020
Risk management 30%
Finance, treasury & accounting 31%
Corporate compliance/audit 12%
Security/information security 11%
General management 10%
Legal (OGC) 6%
None of the above (stop) 0%
Total 100%
S4 . Are you involved in your company’s enterprise risk
management activities?
FY2020
Yes, significant involvement 38%
Yes, some involvement 62%
No involvement (stop) 0%
Total 100%
Financial Impact of Intellectual Property & Cyber Assets: 2020 Aon-Ponemon Global Report 39Aon | Ponemon Institute
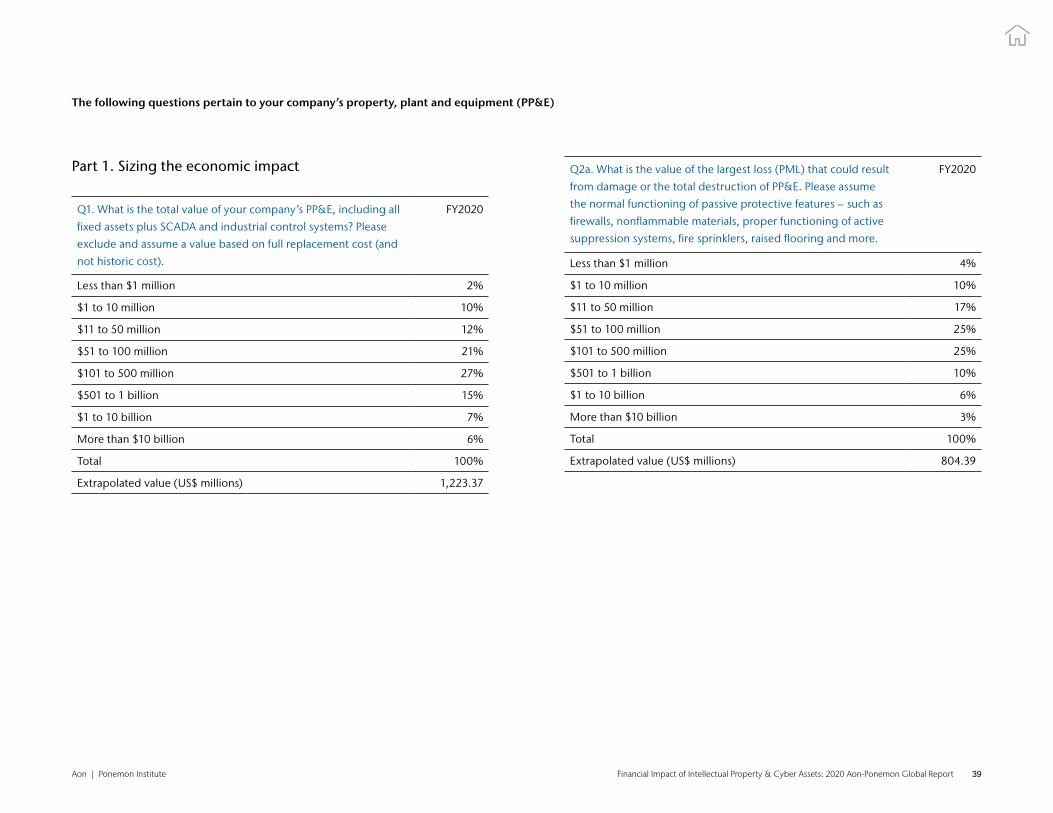
Part 1. Sizing the economic impact
Q1 . What is the total value of your company’s PP&E, including all
fixed assets plus SCADA and industrial control systems? Please
exclude and assume a value based on full replacement cost (and
not historic cost) .
FY2020
Less than $1 million 2%
$1 to 10 million 10%
$11 to 50 million 12%
$51 to 100 million 21%
$101 to 500 million 27%
$501 to 1 billion 15%
$1 to 10 billion 7%
More than $10 billion 6%
Total 100%
Extrapolated value (US$ millions) 1,223 .37
Q2a . What is the value of the largest loss (PML) that could result
from damage or the total destruction of PP&E . Please assume
the normal functioning of passive protective features – such as
firewalls, nonflammable materials, proper functioning of active
suppression systems, fire sprinklers, raised flooring and more .
FY2020
Less than $1 million 4%
$1 to 10 million 10%
$11 to 50 million 17%
$51 to 100 million 25%
$101 to 500 million 25%
$501 to 1 billion 10%
$1 to 10 billion 6%
More than $10 billion 3%
Total 100%
Extrapolated value (US$ millions) 804 .39
The following questions pertain to your company’s property, plant and equipment (PP&E)

Financial Impact of Intellectual Property & Cyber Assets: 2020 Aon-Ponemon Global Report 40Aon | Ponemon Institute
Q2b . What is the value of your largest loss (PML) due to business
interruption? Please assume the normal functioning of passive
protective features – such as firewalls, nonflammable materials,
proper functioning of active suppression systems, fire sprinklers,
raised flooring and more .
FY2020
Less than $1 million 13%
$1 to 10 million 24%
$11 to 50 million 25%
$51 to 100 million 23%
$101 to 500 million 12%
$501 to 1 billion 2%
$1 to 10 billion 1%
More than $10 billion 0%
Total 100%
Extrapolated value (US$ millions) 127 .07
Q3 . What percentage of this potential loss to PP&E assets is
covered by insurance, including captives reinsured but not
including captives not reinsured?
FY2020
Less than 5% 0%
5% to 10% 1%
11%to 20% 4%
21% to 30% 6%
31% to 40% 7%
41% to 50% 12%
51% to 60% 17%
61% to 70% 14%
71% to 80% 16%
81% to 90% 13%
91% to 100% 10%
Total 100%
Extrapolated value 61%
Q4 . What percentage of this potential loss to PP&E assets is self-
insured, including captives not reinsured?
FY2020
Less than 5% 10%
5% to 10% 13%
11% to 20% 17%
21% to 30% 16%
31% to 40% 13%
41% to 50% 11%
51% to 60% 7%
61% to 70% 9%
71% to 80% 3%
81% to 90% 1%
91% to 100% 0%
Total 100%
Extrapolated value 30%
Q5 . What is the likelihood that your company will sustain a loss
to PP&E assets totaling no more than 50% of PML over the next
12 months?
FY2020
Less than 0 .1% 20%
0 .1% to 0 .5% 15%
0 .6% to 1 .0% 18%
1 .1% to 2 .0% 13%
2 .1% to 3 .0% 15%
3 .1% to 4 .0% 8%
4 .1% to 5 .0% 7%
5 .5% to 10 .0% 2%
More than 10 .0% 2%
Total 100%
Extrapolated value 1 .74%

Financial Impact of Intellectual Property & Cyber Assets: 2020 Aon-Ponemon Global Report 41Aon | Ponemon Institute
Q6 . What is the likelihood that your company will sustain a loss to
PP&E assets totaling 100% of PML over the next 12 months?
FY2020
Less than 0 .1% 69%
0 .1% to 0 .5% 15%
0 .6% to 1 .0% 7%
1 .1% to 2 .0% 3%
2 .1% to 3 .0% 1%
3 .1% to 4 .0% 2%
4 .1% to 5 .0% 0%
5 .1% to 10 .0% 3%
More than 10 .0% 0%
Total 100%
Extrapolated value 0 .54%
Q7 . In your opinion, how would your company disclose a
material loss to PP&E assets that is not covered by insurance
in its financial statements?
FY2020
Disclosure as a contingent liability on the balance sheet (e .g .,
FASB 5)
19%
Footnote disclosure in the financial statements 42%
Discussion in the management letter 20%
None – disclosure is not necessary 15%
Other 4%
Total 100%
The following questions pertain to your company’s intangible assets.
Q8 . What is the total value of your company’s intangible assets, including customer records, employee records, financial
reports, analytical data, source code, models, methods and
other intellectual properties? Please assume a value based on full
replacement cost (and not historic cost) . Please note this value
can be either a precise quantification or estimate .
FY2020
Less than $1 million 5%
$1 to 10 million 8%
$11 to 50 million 11%
$51 to 100 million 25%
$101 to 500 million 23%
$501 to 1 billion 15%
$1 to 10 billion 6%
More than $10 billion 7%
Total 100%
Extrapolated value (US$ millions) 1,274 .00
Financial Impact of Intellectual Property & Cyber Assets: 2020 Aon-Ponemon Global Report 42Aon | Ponemon Institute
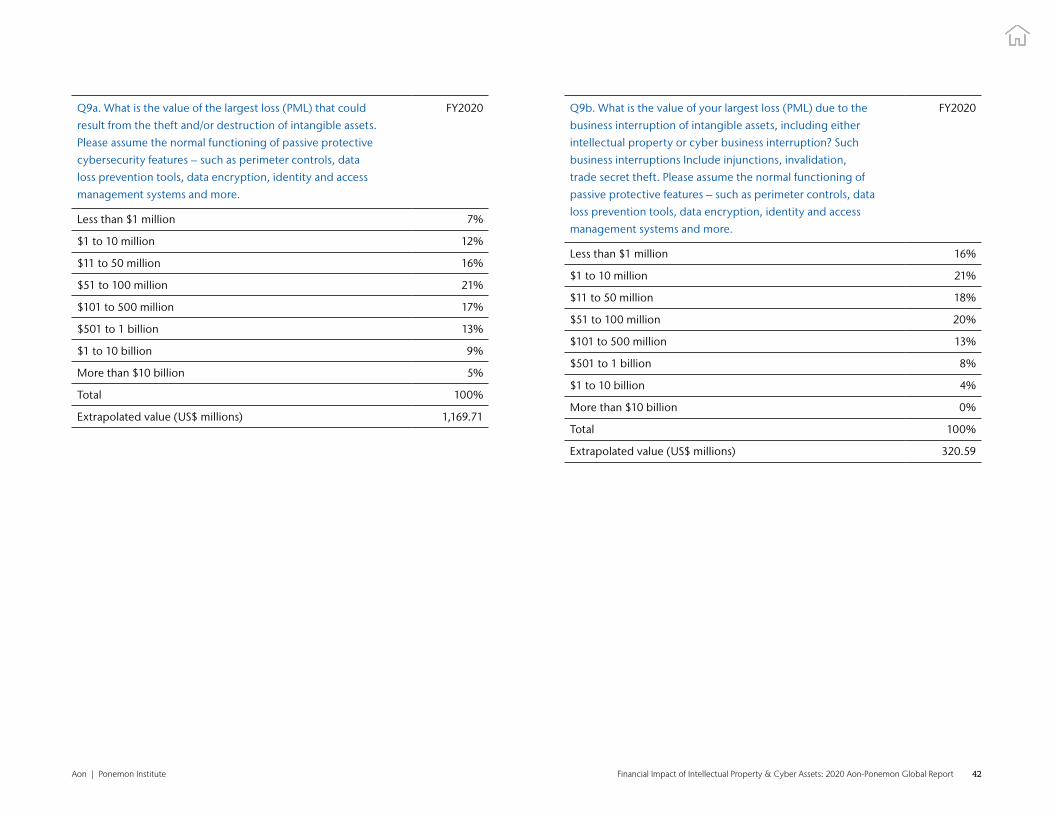
Q9a . What is the value of the largest loss (PML) that could
result from the theft and/or destruction of intangible assets .
Please assume the normal functioning of passive protective
cybersecurity features – such as perimeter controls, data
loss prevention tools, data encryption, identity and access
management systems and more .
FY2020
Less than $1 million 7%
$1 to 10 million 12%
$11 to 50 million 16%
$51 to 100 million 21%
$101 to 500 million 17%
$501 to 1 billion 13%
$1 to 10 billion 9%
More than $10 billion 5%
Total 100%
Extrapolated value (US$ millions) 1,169 .71
Q9b . What is the value of your largest loss (PML) due to the
business interruption of intangible assets, including either
intellectual property or cyber business interruption? Such
business interruptions Include injunctions, invalidation,
trade secret theft . Please assume the normal functioning of
passive protective features – such as perimeter controls, data
loss prevention tools, data encryption, identity and access
management systems and more .
FY2020
Less than $1 million 16%
$1 to 10 million 21%
$11 to 50 million 18%
$51 to 100 million 20%
$101 to 500 million 13%
$501 to 1 billion 8%
$1 to 10 billion 4%
More than $10 billion 0%
Total 100%
Extrapolated value (US$ millions) 320 .59
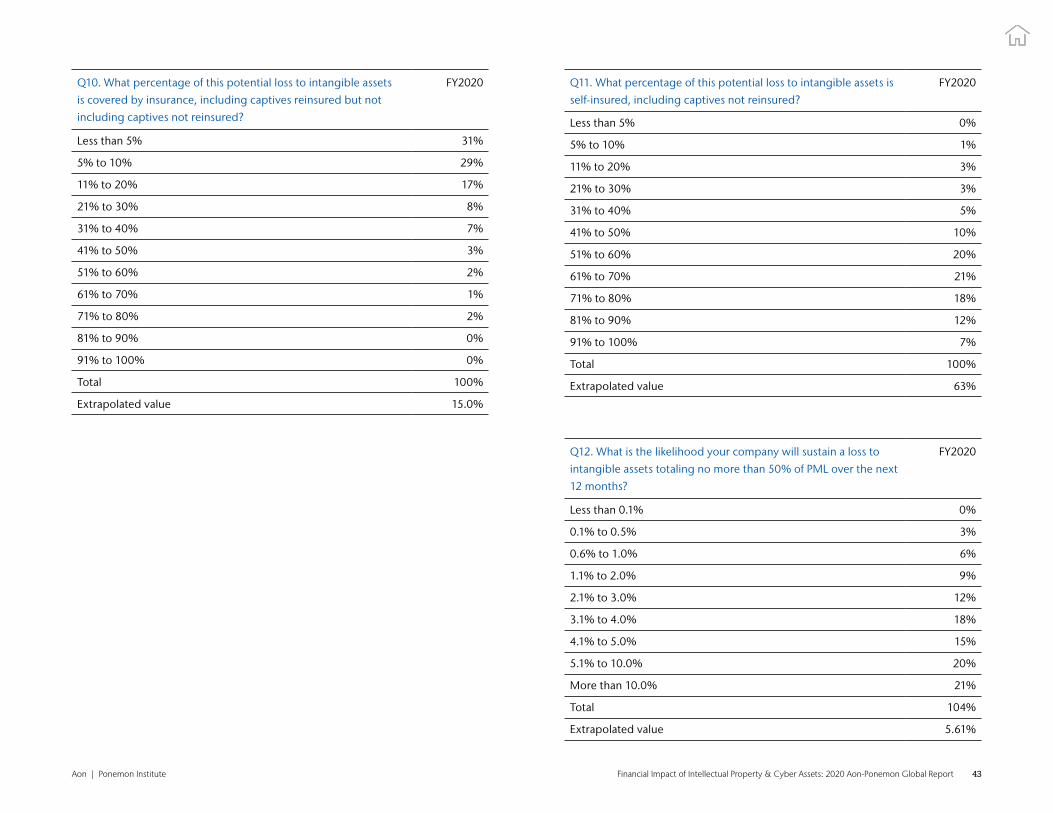
Financial Impact of Intellectual Property & Cyber Assets: 2020 Aon-Ponemon Global Report 43Aon | Ponemon Institute
Q10 . What percentage of this potential loss to intangible assets
is covered by insurance, including captives reinsured but not
including captives not reinsured?
FY2020
Less than 5% 31%
5% to 10% 29%
11% to 20% 17%
21% to 30% 8%
31% to 40% 7%
41% to 50% 3%
51% to 60% 2%
61% to 70% 1%
71% to 80% 2%
81% to 90% 0%
91% to 100% 0%
Total 100%
Extrapolated value 15 .0%
Q11 . What percentage of this potential loss to intangible assets is
self-insured, including captives not reinsured?
FY2020
Less than 5% 0%
5% to 10% 1%
11% to 20% 3%
21% to 30% 3%
31% to 40% 5%
41% to 50% 10%
51% to 60% 20%
61% to 70% 21%
71% to 80% 18%
81% to 90% 12%
91% to 100% 7%
Total 100%
Extrapolated value 63%
Q12 . What is the likelihood your company will sustain a loss to
intangible assets totaling no more than 50% of PML over the next
12 months?
FY2020
Less than 0 .1% 0%
0 .1% to 0 .5% 3%
0 .6% to 1 .0% 6%
1 .1% to 2 .0% 9%
2 .1% to 3 .0% 12%
3 .1% to 4 .0% 18%
4 .1% to 5 .0% 15%
5 .1% to 10 .0% 20%
More than 10 .0% 21%
Total 104%
Extrapolated value 5 .61%

Financial Impact of Intellectual Property & Cyber Assets: 2020 Aon-Ponemon Global Report 44Aon | Ponemon Institute
Q13 . What is the likelihood your company will sustain a loss to
intangible assets totaling 100% of PML over the next 12 months?
FY2020
Less than 0 .1% 9%
0 .1% to 0 .5% 10%
0 .6% to 1 .0% 10%
1 .1% to 2 .0% 12%
2 .1% to 3 .0% 18%
3 .1% to 4 .0% 14%
4 .1% to 5 .0% 15%
5 .1% to 10 .0% 8%
More than 10 .0% 4%
Total 100%
Extrapolated value 2 .95%
Q14 . In your opinion, how would your company disclose a
material loss to intangible assets that is not covered by insurance
in its financial statements?
FY2020
Disclosure as a contingent liability on the balance sheet (FASB 5) 8%
Footnote disclosure in the financial statements 42%
Discussion in the management letter 7%
None – disclosure is not necessary 39%
Other 4%
Total 100%
Part 2. Other Questions
Q15a . Is your organization required to comply with the European
Union’s General Data Protection Regulation (GDPR) and/or the
California Consumer Protection Act (CCPA)?
FY2020
Yes 70%
No 30%
Total 100%
Q15b . If yes, are you aware of the economic and legal
consequences resulting from non-compliance with the GDPR
and/or the CCPA should your organization experience a data
breach or security exploit involving intangible assets, including
intellectual property?
FY2020
Yes, fully aware 44%
Yes, somewhat aware 38%
Not aware 18%
Total 100%
Q16a . Has your company experienced a material or significantly
disruptive security exploit or data breach one or more times over
the past 24 months? Please refer to the definition of materiality
provided above .
FY2020
Yes 51%
No 49%
Total 100%
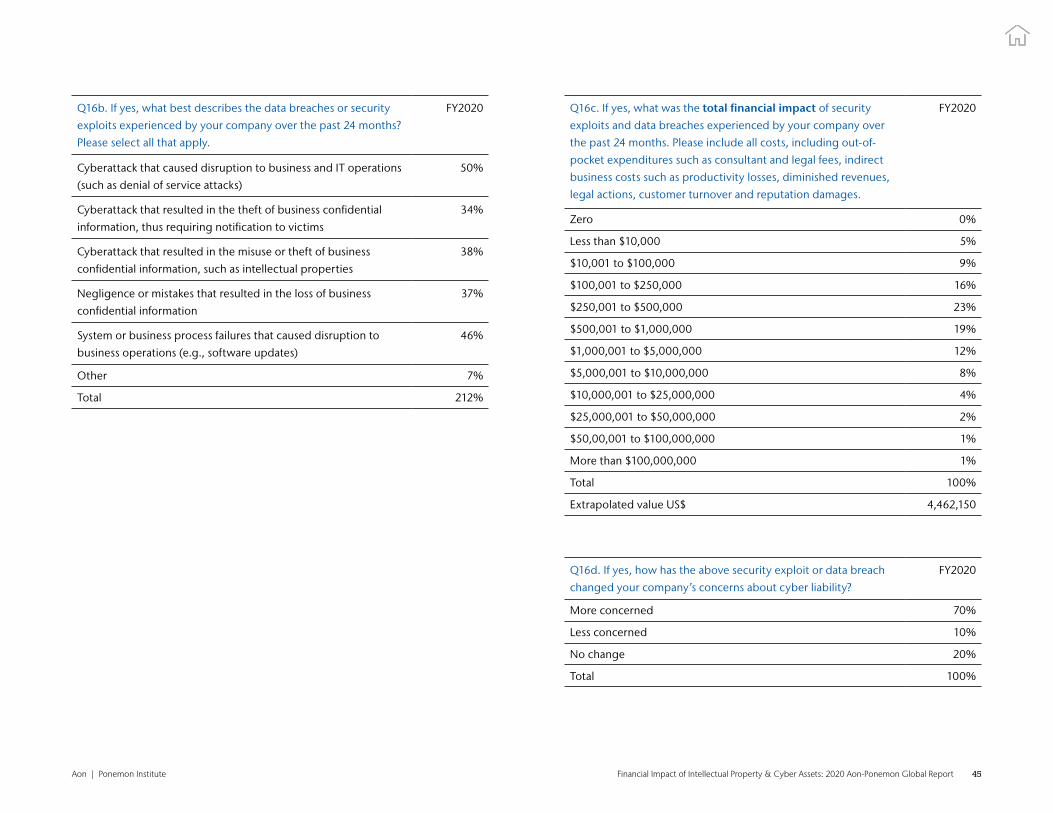
Financial Impact of Intellectual Property & Cyber Assets: 2020 Aon-Ponemon Global Report 45Aon | Ponemon Institute
Q16b . If yes, what best describes the data breaches or security
exploits experienced by your company over the past 24 months?
Please select all that apply .
FY2020
Cyberattack that caused disruption to business and IT operations
(such as denial of service attacks)
50%
Cyberattack that resulted in the theft of business confidential
information, thus requiring notification to victims
34%
Cyberattack that resulted in the misuse or theft of business
confidential information, such as intellectual properties
38%
Negligence or mistakes that resulted in the loss of business
confidential information
37%
System or business process failures that caused disruption to
business operations (e .g ., software updates)
46%
Other 7%
Total 212%
Q16c . If yes, what was the total financial impact of security
exploits and data breaches experienced by your company over
the past 24 months . Please include all costs, including out-of-
pocket expenditures such as consultant and legal fees, indirect
business costs such as productivity losses, diminished revenues,
legal actions, customer turnover and reputation damages .
FY2020
Zero 0%
Less than $10,000 5%
$10,001 to $100,000 9%
$100,001 to $250,000 16%
$250,001 to $500,000 23%
$500,001 to $1,000,000 19%
$1,000,001 to $5,000,000 12%
$5,000,001 to $10,000,000 8%
$10,000,001 to $25,000,000 4%
$25,000,001 to $50,000,000 2%
$50,00,001 to $100,000,000 1%
More than $100,000,000 1%
Total 100%
Extrapolated value US$ 4,462,150
Q16d . If yes, how has the above security exploit or data breach
changed your company’s concerns about cyber liability?
FY2020
More concerned 70%
Less concerned 10%
No change 20%
Total 100%

Financial Impact of Intellectual Property & Cyber Assets: 2020 Aon-Ponemon Global Report 46Aon | Ponemon Institute
Q17 . Do you believe your company’s exposure to cyber risk will
increase, decrease or stay the same over the next 24 months?
FY2020
Increase 65%
Decrease 9%
Stay the same 26%
Total 100%
Q18 . From a business risk perspective, how do cyber risks
compare to other business risks . Please select one best choice .
FY2020
Cyber liability is the number one or two business risk for my
company
23%
Cyber liability is a top 5 business risk for my company 35%
Cyber liability is a top 10 business risk for my company 30%
Cyber liability is not in the top 10 of business risks for my
company
12%
Total 100%
Q19 . How did you determine the level of cyber risk to
your company?
FY2020
Completed a formal internal assessment 22%
Completed an informal (ad hoc) internal assessment 19%
Hired a third party to conduct an assessment or audit 36%
Intuition or gut feel 15%
Did not do any type of assessment 8%
Total 100%
Q20 . Does your company have cyber insurance coverage,
including within a Technology Errors & Omission, Miscellaneous
Professional Liability, Media Liability or similar policy not
including Property, General Liability or Crime policy?
FY2020
Yes 31%
No [skip to Q25] 69%
Total 100%
Q21 . If yes, what limits do you purchase FY2020
Less than $1 million 8%
$1 million to $5 million 28%
$6 million to $20 million 50%
$21 million to $100 million 9%
More than $100 million 5%
Total 100%
Extrapolated value (US$ millions) 18 .81
Q22 . Is your company’s cyber insurance coverage sufficient with
respect to coverage terms and conditions, exclusions, retentions,
limits and insurance carrier financial security?
FY2020
Yes 53%
No 32%
Unsure 15%
Total 100%

Financial Impact of Intellectual Property & Cyber Assets: 2020 Aon-Ponemon Global Report 47Aon | Ponemon Institute
Q23 . How does your company determine the level of coverage it
deems adequate?
FY2020
Formal risk assessment by in-house staff 16%
Formal risk assessment conducted by the insurer 13%
Formal risk assessment by third party 27%
Informal or ad hoc risk assessment 11%
Policy terms and conditions reviewed by a third-party specialist 18%
Maximum available from the insurance market 15%
Other 0%
Total 100%
Q24 . In addition to cost coverage, what other services does the
cyber insurer provide your company in the event of a security
exploit or data breach? Please check all that apply .
FY2020
Access to cyber security forensic experts 79%
Access to legal and regulatory experts 82%
Access to specialized technologies and tools 54%
Advanced warnings about ongoing threats and vulnerabilities 45%
Assistance in the remediation of the incident 52%
Assistance in the notification of breach victims 44%
Identity protection services for breach victims 21%
Credit monitoring services for breach victims 40%
Assistance in reputation management activities 53%
Other 18%
Total 488%
Q25 . Does your company plan to purchase standalone
cyber insurance?
FY2020
Yes, in the next 12 months 17%
Yes, in the next 24 months 26%
Yes, in more than 24 months 20%
No 37%
Total 100%
Q26 . If no, what are the primary reasons why your company is not
planning to purchase standalone cyber security insurance?
FY2020
Premiums are too expensive 41%
Insurance limits available are inadequate based on our exposure 44%
Too many exclusions, restrictions and uninsurable risks 34%
Property and casualty policies are sufficient 24%
Executive management does not see the value of this insurance 20%
Unable to get insurance underwritten because of current
risk profile
16%
Other 5%
Total 184%

Financial Impact of Intellectual Property & Cyber Assets: 2020 Aon-Ponemon Global Report 48Aon | Ponemon Institute
Q27 . Who in your company is most responsible for cyber risk
management? Please select your top choice .
FY2020
CEO/board of directors 3%
Chief financial officer 7%
Business unit (LOB) leaders 25%
Chief information officer 21%
Chief information security officer 14%
Risk management 15%
Procurement 7%
General counsel 5%
Compliance/audit 2%
Other 1%
Total 100%
Part 3. Intellectual Property risks
Q28 . Do your company’s enterprise risk management activities
include risks to intellectual property (“IP”) such as trademarks
and brand, patents, copyrights and trade secrets as well as
liability risks relating to first and third-party IP?
FY2020
Yes 60%
No 40%
Total 100%
Q29 . What is the total value of your company’s IP assets such as
trademarks, patents, copyrights, trade secrets and know-how?
FY2020
Less than $1 million 0%
$1 to 10 million 8%
$11 to 50 million 19%
$51 to 100 million 27%
$101 to 500 million 24%
$501 million to 1 billion 16%
$1 to 10 billion 5%
More than $10 billion 1%
Total 100%
Extrapolated value 578 .35
Q30a . Did your company experience a material IP event in the
past 24 months?
FY2020
Yes 31%
No (Please skip to Q31) 69%
Total 100%
Q30b . If yes, what type of IP assets were involved in the event? FY2020
Patent 20%
Trade secret 35%
Copyright 23%
Trademark, Service mark or trade dress 17%
Other 5%
Total 100%

Financial Impact of Intellectual Property & Cyber Assets: 2020 Aon-Ponemon Global Report 49Aon | Ponemon Institute
Q30c . If yes, what best describes the event? FY2020
Challenge to company rights 33%
Infringement of company rights 39%
Allegation of company infringement of third-party rights 28%
Total 100%
Q30d . If yes, would your company be willing to share settlement
and licensing fees (under NDA and anonymized) with the promise
that your organization will receive anonymized summary results
(assist you with “dark matter” issue of data analytics)?
FY2020
Yes 48%
No 43%
Don’t know 9%
Total 100%
Q31 . How do IP risks compare to other business risks? FY2020
IP risk is the number one or two business risk for my company 19%
IP risk is a top 5 business risk for my company 31%
IP risk is a top 10 business risk for my company 34%
IP risk is not in the top 10 of business risks for my company 16%
Total 100%
Q32 . Does your company’s existing insurance policy
(e .g ., property, general liability or crime) cover any of the
following IP events?
FY2020
A challenge to your company’s IP assets 34%
Third-party infringement of your company’s IP assets 29%
An allegation that your company is infringing third-party IP rights 36%
Our existing policy does not cover IP events 35%
Total 134%
Q33 . Does your company have a patent infringement and/or
trade secret theft insurance policy as a complement to a cyber
risk policy?
FY2020
Yes 27%
No 73%
Total 100%
Q34 . If no, what is your company’s level of interest in purchasing
a trade secret theft insurance policy as a complement to a cyber
risk policy?
FY2020
Very interested 32%
Interested 34%
Somewhat interested 23%
Not interested 11%
Total 100%

Financial Impact of Intellectual Property & Cyber Assets: 2020 Aon-Ponemon Global Report 50Aon | Ponemon Institute
Q35 . Does your company have an intellectual property
liability policy?
FY2020
Yes 32%
No 68%
Total 100%
Q36 . If no, what is your company’s level of interest in purchasing
an intellectual property liability policy?
FY2020
Very interested 33%
Interested 33%
Somewhat interested 24%
Not interested 10%
Total 100%
Q37 . Does management regularly report your company’s IP
status, opportunities and risks to the board of directors and/or
equity investors?
FY2020
Yes 30%
No 63%
Don’t know 7%
Total 100%
Q38 . Does your company currently use its IP as collateral in
support of debt financing?
FY2020
Yes 34%
No 55%
Don’t know 11%
Total 100%
Q39 . How interested is your company in obtaining debt financing
on more favorable terms enabled by an insurance policy covering
the lender’s reliance upon your IP as collateral?
FY2020
Very interested 31%
Interested 36%
Somewhat interested 18%
Not interested 10%
Don’t know 5%
Total 100%
Q40 . Other than IP and information assets, what are the top three
subclasses of intangible assets that are most important to your
company . Please select your top three choices only .
FY2020
Brand (i .e ., brand equity, social media influence) 47%
B2B rights (i .e ., broadcast rights, marketing rights, use rights,
franchise agreements, royalty agreements, licensing agreements,
sponsorship agreements, mortgaging servicing rights, etc .)
55%
“Hard” intangible assets that be reflected on balance sheets (i .e .,
goodwill, software licenses, Internet domains)
59%
Public rights (i .e ., drilling rights, import quotas, planning
permission/zoning, water rights, wireless spectrum rights, carbon
emission rights and air rights)
39%
Third party relationships such as customers, suppliers . vendors,
supply chain
69%
Non-revenue rights such as non-compete agreements, standstill
agreements and barriers to entry
26%
Don’t know 5%
Total 300%
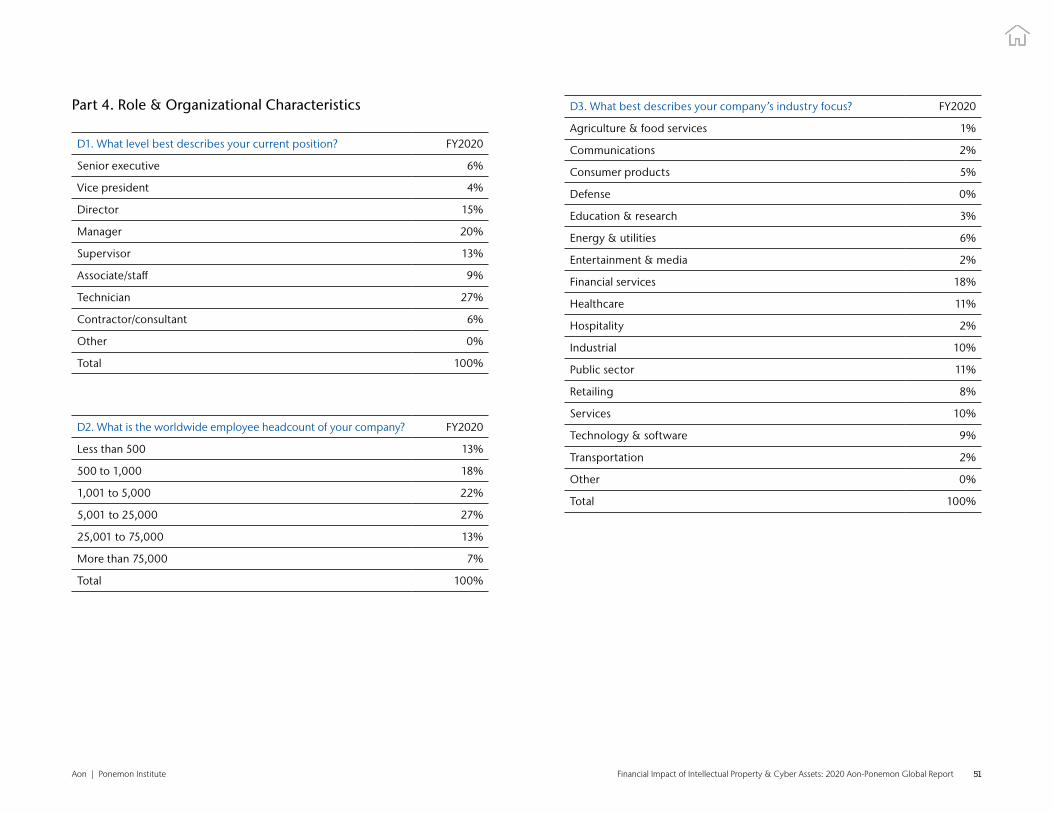
Financial Impact of Intellectual Property & Cyber Assets: 2020 Aon-Ponemon Global Report 51Aon | Ponemon Institute
Part 4. Role & Organizational Characteristics
D1 . What level best describes your current position? FY2020
Senior executive 6%
Vice president 4%
Director 15%
Manager 20%
Supervisor 13%
Associate/staff 9%
Technician 27%
Contractor/consultant 6%
Other 0%
Total 100%
D2 . What is the worldwide employee headcount of your company? FY2020
Less than 500 13%
500 to 1,000 18%
1,001 to 5,000 22%
5,001 to 25,000 27%
25,001 to 75,000 13%
More than 75,000 7%
Total 100%
D3 . What best describes your company’s industry focus? FY2020
Agriculture & food services 1%
Communications 2%
Consumer products 5%
Defense 0%
Education & research 3%
Energy & utilities 6%
Entertainment & media 2%
Financial services 18%
Healthcare 11%
Hospitality 2%
Industrial 10%
Public sector 11%
Retailing 8%
Services 10%
Technology & software 9%
Transportation 2%
Other 0%
Total 100%

Financial Impact of Intellectual Property & Cyber Assets: 2020 Aon-Ponemon Global Report 52Aon | Ponemon Institute
Acknowledgements
The 2020 Intangible Assets Financial Statement Impact Comparison Report is
the fourth intangible assets/cyber risk transfer research paper that examines
the comparative values, probable maximum loss and allocation of resources to
protect certain tangible assets compared with intangible assets . We thank the
following Aon colleagues and industry leaders who assisted Larry Ponemon,
Ph .D ., founder and chairman, Ponemon Institute, and Susan Jayson, executive
director and co-founder, Ponemon Institute, and contributed to these efforts:
• Jesus Gonzalez, Deputy Global Practice Leader, Intangible Assets, Aon
• Carrie Yang, Asia Intangible Assets leader, Aon’s Cyber Solutions
• Shannan Fort, Aon UK Global Broking Center Cyber Leader
• Vanessa Leemans, EMEA Chief Commercial Officer, Aon’s Cyber Solutions
• Kevin Kalinich, Esq ., Global Practice Leader, Intangible Assets, Aon
这个时代缺的不是完美的人,缺的是从自己心底里给出的真心、正义、无畏和同情。
What is lacking in this era is not the perfect person . What is lacking is sincerity, justice,
fearlessness and empathy coming from the bottom of your heart .
看到的和听到的,经常会令你们沮丧,世俗这样强大,强大到生不出改变它们的念头。可是无论外界的社会如何跌宕起伏,都对自己真诚,坚守原则。内心没有了杂念和疑问,才能勇往直前。
What you see and hear often frustrates you. The world is so powerful that you can’t even come up with an idea of
changing it. However, no matter the ups and downs in the outside world, please be truthful to yourself and stick to
the principle. There are no distracting thoughts and doubts in the heart, so that you can move forward.
(Forever_Young_(2018_film))
Financial Impact of Intellectual Property & Cyber Assets: 2020 Aon-Ponemon Global Report 53Aon | Ponemon Institute
Ponemon InstituteAdvancing Responsible Information Management
Ponemon Institute is dedicated to independent research and education that
advances responsible information and privacy management practices within
business and government . Our mission is to conduct high quality, empirical
studies on critical issues affecting the management and security of sensitive
information about people and organizations .
As a member of the Council of American Survey Research Organizations (CASRO), we uphold strict data confidentiality, privacy and ethical research
standards . We do not collect any personally identifiable information from
individuals (or company identifiable information in our business research) .
Furthermore, we have strict quality standards to ensure that subjects are not
asked extraneous, irrelevant or improper questions .
For more information about this study, please contact Ponemon Institute
by sending an email to [email protected].
Contact us
Aon’s Intellectual Property Solutions
intellectualproperty@aon .com
About Aon Aon plc (NYSE:AON) is a leading global professional services firm providing a broad range of risk, retirement and health solutions . Our 50,000 colleagues in 120 countries empower results for clients by using proprietary data and analytics to deliver insights that reduce volatility and improve performance .
© Aon plc 2020. All rights reserved.The information contained herein and the statements expressed are of a general nature and are not intended to address the circumstances of any particular individual or entity . Although we endeavor to provide accurate and timely information and use sources we consider reliable, there can be no guarantee that such information is accurate as of the date it is received or that it will continue to be accurate in the future . No one should act on such information without appropriate professional advice after a thorough examination of the particular situation .
www.aon.com