financial highlights diffe nce er ismarket price per share 7.35 6.00 8.50 10.10 10.75 11.78 6.95...
TRANSCRIPT

LOLC
2011/12 REP
OR
TS & A
CCOU
NTS
No. 100/1 Sri Jayewardenepura Mawatha, Rajagiriya, Sri Lanka.
Tel: +94 11 5880880 Fax: +94 11 2865612 / 2868648
www.lolc.com FiNANCiAl HigHligHTS
For the year ended 31 March 2003 2004 2005 2006 2007 2008 2009 2010 2011 2012
gROUP
Performance Indicators (Rs. Mn)
Profit before tax 290 402 572 709 998 1,183 1,247 2,841 8,282 10,327
Profit after tax 278 391 575 689 1,050 1,343 1,055 2,385 7,023 8,937
Total assets 7,038 8,987 10,706 16,227 24,484 32,994 46,287 75,371 111,813 145,288
New executions 3,189 4,740 5,591 10,064 13,340 14,320 14,906 21,963 47,392 58,233
Gross portfolio (rentals receivable) 6,867 8,517 10,112 14,806 23,057 29,282 44,824 47,351 70,077 98,941
Deposits from customers – 197 716 1,194 1,746 3,340 5,229 10,095 16,348 25,197
Outstanding borrowings 4,615 5,952 6,634 10,475 17,001 22,887 31,764 38,235 50,813 66,075
Non-performing portfolio 815 883 865 113 137 526 1,933 1,431 1,159 1,702
Return on equity (%) 17 21 27 26 31 30 19 26 37 39
Key Indicators (Rs. per share)
Net asset value per share (adjusted) 3.60 3.92 4.92 6.10 7.96 10.78 12.65 16.63 27.35 40.59
Earnings per share (adjusted) 0.57 0.85 1.21 1.44 2.19 2.82 2.22 3.88 8.08 13.17
COmPANy
Performance Indicators (Rs. Mn)
Profit before tax 256 418 562 677 910 841 582 491 1,898 4,423
Profit after tax 256 418 562 664 987 1,059 505 327 1,523 4,301
Total assets 5,981 7,617 8,747 13,298 20,889 28,996 31,335 29,738 31,153 36,662
New executions 3,189 4,427 4,972 8,858 12,068 12,127 12,170 4,569 5,036 3,926
Gross portfolio (rentals receivable) 6,757 8,082 9,144 12,858 19,851 25,056 25,185 17,958 11,897 7,704
Outstanding borrowings 4,113 5,396 6,025 9,824 16,250 22,273 24,850 23,087 22,379 23,894
Non-performing portfolio 815 883 865 113 137 443 538 769 545 500
Key Indicators (Rs. per share)
Dividends per share 0.33 0.19 0.23 0.30 0.15 0.23 0.28 – – –
Market price per share 7.35 6.00 8.50 10.10 10.75 11.78 6.95 16.50 119.60 54.00
Net asset value per share 3.53 3.88 4.86 6.00 7.77 10.02 10.74 11.42 15.67 24.73
(Times)
Debt to equity ratio 2.45 2.93 2.61 3.45 4.40 4.66 4.87 4.25 3.00 2.03
Interest cover 1.52 1.85 2.56 1.96 1.63 1.28 1.14 1.16 1.80 2.74
Dividend cover 3.30 4.50 5.09 4.64 13.86 9.53 3.79 – – –
LOLC 2011/12 REPORTS & ACCOUNTS
erThe Diffe nce is...
The Diffe nce is...
er

For the year ended 31 March 2003 2004 2005 2006 2007 2008 2009 2010 2011 2012
Group
Performance Indicators (Rs. Mn)
Profit before tax 290 402 572 709 998 1,183 1,247 2,841 8,282 10,327
Profit after tax 278 391 575 689 1,050 1,343 1,055 2,385 7,023 8,937
Total assets 7,038 8,987 10,706 16,227 24,484 32,994 46,287 75,371 111,813 145,288
New executions 3,189 4,740 5,591 10,064 13,340 14,320 14,906 21,963 47,392 58,233
Gross portfolio (rentals receivable) 6,867 8,517 10,112 14,806 23,057 29,282 44,824 47,351 70,077 98,941
Deposits from customers – 197 716 1,194 1,746 3,340 5,229 10,095 16,348 25,197
Outstanding borrowings 4,615 5,952 6,634 10,475 17,001 22,887 31,764 38,235 50,813 66,075
Non-performing portfolio 815 883 865 113 137 526 1,933 1,431 1,159 1,702
Return on equity (%) 17 21 27 26 31 30 19 26 37 39
Key Indicators (Rs. per share)
Net asset value per share (adjusted) 3.60 3.92 4.92 6.10 7.96 10.78 12.65 16.63 27.35 40.59
Earnings per share (adjusted) 0.57 0.85 1.21 1.44 2.19 2.82 2.22 3.88 8.08 13.17
Company
Performance Indicators (Rs. Mn)
Profit before tax 256 418 562 677 910 841 582 491 1,898 4,423
Profit after tax 256 418 562 664 987 1,059 505 327 1,523 4,301
Total assets 5,981 7,617 8,747 13,298 20,889 28,996 31,335 29,738 31,153 36,662
New executions 3,189 4,427 4,972 8,858 12,068 12,127 12,170 4,569 5,036 3,926
Gross portfolio (rentals receivable) 6,757 8,082 9,144 12,858 19,851 25,056 25,185 17,958 11,897 7,704
Outstanding borrowings 4,113 5,396 6,025 9,824 16,250 22,273 24,850 23,087 22,379 23,894
Non-performing portfolio 815 883 865 113 137 443 538 769 545 500
Key Indicators (Rs. per share)
Dividends per share 0.33 0.19 0.23 0.30 0.15 0.23 0.28 – – –
Market price per share 7.35 6.00 8.50 10.10 10.75 11.78 6.95 16.50 119.60 54.00
Net asset value per share 3.53 3.88 4.86 6.00 7.77 10.02 10.74 11.42 15.67 24.73
(Times)
Debt to equity ratio 2.45 2.93 2.61 3.45 4.40 4.66 4.87 4.25 3.00 2.03
Interest cover 1.52 1.85 2.56 1.96 1.63 1.28 1.14 1.16 1.80 2.74
Dividend cover 3.30 4.50 5.09 4.64 13.86 9.53 3.79 – – –
FinanCial HiGHliGHts

About these RepoRts And Accounts
LOLC is a COngLOmerate with a unique differenCe. it has just taken On, the faCe Of a parent, by beCOming a hOLding COmpany. Of humbLe beginnings tO a Leasing COmpany, it has grOwn tO beCOme the LOCaLLy diversified finanCiaL COngLOmerate Of tOday.
LOLC is simpLy unLike any Other. keeping with the differenCe Of the COmpany, is the distinCtive struCture Of these repOrts and aCCOunts.
the repOrts seCtiOn has been struCtured tO substantiate the differenCe thrOugh narratives.
the aCCOunts seCtiOn features mOre than just the finanCiaL statements. it aLsO Carries aCCOunts On areas suCh as gOvernanCe, risk management and Leadership.
in its entirety the repOrts and aCCOunts is the stOry Of a triumphant year fOregOne and the bright years ahead with fuLL Of prOmise and OppOrtunity.

REPORTSChairperson’s Statement 04Deputy Chairman’s Message 08Group Managing Director/CEO’s Review 16Business Review 24Financial Review 56The ORIX Connection 70Global Funding Partners 72
ACCOUNTSBoard of Directors 76Corporate Management Team 84Operational Management Team 90Annual Report of the Board of Directors on the Affairs of the Company 94Corporate Governance 102Report of the Remuneration Committee 107Report of the Nomination Committee 107Report of the Integrated Risk Management Committee 108
Corporate Governance Committee Report 109Audit Committee Report 110Risk Management with a Vision 111Directors’ Responsibility for Financial Reporting 117Chief Executive Officer’s and Chief Financial Officer’s Responsibility Statement 118Auditor’s Report 119Financial Statements 120
ANNEXESSustainability Report 208Information on the Company’s Real Estate Portfolio and Listed Debentures 217Ten Year Summary 218Summarised Quarterly Statistics 220Value Addition 221Awards 223Milestones 224Group Companies/Directors 227Share Information 231Glossary 233Notice of Meeting 235Corporate Information 236
Form of Proxy enclosedFinancial Calendar Inner back cover

REPORTS

4 LOLC 2011/12 REPORTS & ACCOUNTS
A conglomerate Responsive to Market needs
01.26
chAIRpeRson’s stAteMent It gives me great pleasure to present the report and accounts of LOLC for a
financial year in which the Group maintained steadfast growth in performance through our proactive business model.
It is noteworthy that such growth was in the face of many challenges, including a mixed and unsettled world and domestic
economic situation in which both positive and negative developments were seen.
the globAl econoMy The global economy remained fragile due to the slow growth of the US economy and the
financial turmoil in the Eurozone. Large injections of liquidity by governments in developed economies, coupled with
socio-political tensions in the Middle East and North Africa; caused oil prices to rise, increasing inflationary and fiscal
pressures as well as driving volatility in the financial markets.
However, the growth in Asia has remained better, with China and India continuing to grow strongly despite cautious
measures by the Chinese Government to rein in an economy in danger of overheating. The global economic downturn
had an impact on the Sri Lankan economy as well due to our dependence on exports to developed countries. More than
50% of our exports are to USA and Europe, regions which were impacted in the year under review.

LOLC 2011/12 REPORTS & ACCOUNTS 5
CHAIRPERSON’S STATEMENT
Nevertheless, Sri Lanka, with its strong fundamentals in monetary policy, rebounded quickly. The Government took
immediate action to buoy up the economy by liberalising the exchange rate policy and tightening both monetary and
fiscal policy, thus bringing under control the deficit in reserves that developed during the second half of the year.
The steady growth of worker foreign remittances was a positive factor to this effect.
the gRoup How did LOLC manage to weather these rough seas as an emerging conglomerate? Our strategy
is simple. We anticipate economic trends, work to understand changing customer needs and, most importantly,
stay responsive to the market.
An agile business model allows us to fine-tune our strategy by investing in growth sectors of the economy. In a relatively
short time we have ventured into leisure, construction and renewable energy, whilst expanding our financial services
portfolio further with insurance, stock-broking and factoring. This year, we continued the momentum by adding a
commodity trading company and a leading hotel on the South Coast. LOLC Leisure is looking forward to being an active
player in this sector, an identified key growth area of the Sri Lankan economy.
Our renewable energy portfolio will begin to earn returns in the upcoming months. All these strategic investments were
possible because of the success of our core financial-services business, which generates more than 55% of our income.
We have identified ourselves as the largest non-bank financial institution in the country by growing and diversifying,
often in unconventional ways, in response to changing market conditions. We were the pioneers in leasing to small
and medium enterprises; SMEs are now the largest contributor by sector to the Sri Lankan economy. We remain the
market leader in factoring, another LOLC innovation of particular significance to the SME community. We are also
moving strongly into microfinance, a largely-untapped market in most regions, with a diverse product mix ranging from
asset financing to group loans and now micro insurance - another first from the LOLC Group. The secret of our success
remains our sensitivity and responsiveness to market needs.

6 LOLC 2011/12 REPORTS & ACCOUNTS
the oRIX connectIon ORIX Corporation, a Japan-based multinational, is LOLC’s single largest shareholder.
Since inception, ORIX has always been a pillar of strength, offering support at every level from Board decision making
to routine operations. Compliance and good governance are of primary importance to ORIX Corporation’s Japanese
management, which explains why LOLC is the only financial institution in Sri Lanka to report according to the provisions
of the US Sarbanes-Oxley Act.
It gives me special pleasure to record that LOLC won a Special ORIX Award for Excellent Performance this year out of a field
of 100 overseas ORIX subsidiaries. This is, in fact, the second consecutive year that LOLC has received an accolade from ORIX.
tRIbutes LOLC was also recognised with another prestigious award, this time from the Open Compliance &
Ethics Group (OCEG), an international think-tank that works to promote principled performance among organisations
worldwide. OCEG named LOLC a winner of one of four 2012 GRC (Governance, Risk Management and Compliance)
Achievement Awards, which honour companies that have shown exceptional quality and integrity in terms of governance,
risk management and compliance.
Locally, we were named overall Runners-up at the National Business Excellence Awards 2011. This overall recognition
was achieved in less than three years of first participation of LOLC in the competition.
outlook In 2012 and possibly into 2013, trends indicate that global economic growth will remain subdued despite
signs of improvement in the US economy. Indeed, continuing financial turmoil in the Eurozone may impact other
countries leading to decline in our exports, diminished worker remittances and rises in commodity prices.
CHAIRPERSON’S STATEMENT

LOLC 2011/12 REPORTS & ACCOUNTS 7
Against this backdrop, domestic economic prospects for the year ahead still seem relatively positive so long as a prudent
fiscal and monetary policy stance is maintained. Growth, which topped 8% for two consecutive years for the first time
in history, is expected to slow down this year, though it will likely be higher than in Asia as a whole. Inflation is rising,
but will probably remain in the single digits, though interest rates may spike in the short term.
Investment in infrastructure, especially from the private sector, together with increased focus on education, training and
development and greater stability in the financial sector, particularly the stock market, will be elements essential to the
maintenance of a positive business climate.
As for LOLC, we are eager to exploit the opportunities that arise from the aggressive development goals of the economy,
especially in the regions and in sectors such as leisure, agriculture, construction and renewable energy. With our
flexible business model, extensive footprint, diverse product mix covering the entire financial value chain and a dynamic
workforce led by strong management, LOLC Group is very well poised to take advantage of these opportunities.
AcknowledgeMents I would like to conclude this Report by thanking the Board of Directors, our shareholders,
our staff and management, as well as our funding partners and banks, for their significant contributions to our success.
I thank all our stakeholders for their implicit trust and confidence in us. And as we move forward into the future,
I would like to assure them that LOLC will continue its diligent efforts to deliver value to all stakeholders.
Rohini NanayakkaraChairperson
CHAIRPERSON’S STATEMENT

8 LOLC 2011/12 REPORTS & ACCOUNTS
An open Mind and a Flexible Agenda
deputy chAIRMAn’s MessAge The Chairperson, in her statement to stakeholders this year, describes how
LOLC has evolved itself into a diversified conglomerate to explore opportunities arising from the Government-led efforts
on resurgence and rebuilding the nation.
I thought of sharing more detail on how we adapted to this transformation.
As a long-established major player in the Sri Lankan business landscape, LOLC is no stranger to change. Although
the main drivers of economic growth in the country have remained more or less the same in the last quarter-
century or more, the political and social environment have seen constant and rapid, almost a revolutionary change.
Economic policy, too, has undergone frequent revisions and adjustments, while the dramatic rollercoaster-ride taken by
the world economy in recent years show just how much of a challenge it has been for us, to survive and thrive through
these fluctuating times.
02.07

LOLC 2011/12 REPORTS & ACCOUNTS 9
Our policy on ‘change management’ has always been open-minded and holistic: we follow trends carefully, plan for the
most likely outcomes, but remain prepared for the unexpected. The agility of our business model is an essential factor
of our continued success. For us, the way to face the future is with an open mind and a flexible agenda. Starting out as
a leasing company, we first transformed ourselves into a broad-spectrum financial-service provider, adding lines of
business as opportunity dictated. Now we have gone further, investing in hotels and tourism, construction, agriculture
and plantations, renewable energy, trading and manufacturing and several other growth sectors. Some of these were
through mergers and acquisitions. For others we set up new entities ourselves or in collaboration with strategic partners.
Whatever the details of engagement, we always bring to the table the same professionalism, flexibility of approach and a
strong code of ethical practice.
tAkIng cARe oF the coRe To move successfully from pure financial services to a diversified business portfolio,
we started by nurturing the financial services business itself. Revenue and reputation earned in our core businesses
are what enabled us to diversify in the first place. Even today, 55% of the Group’s income is derived from financial
services. Starting out as a leasing company in the early days of the liberalised economy, we helped revolutionise the
small- and medium-scale sector by financing assets for productive use that were thus self-financing for the customer.
Having made our mark in this sector, we began adding financial services for which a growing economy fuelled demand.
In 2011, we transformed ourselves into a holding company with controlling interest in six firms offering diversified
financial services.
Briefly reviewing our investments in this sector, the two deposit-taking firms, Lanka ORIX Finance PLC and Commercial
Leasing & Finance Ltd. have surpassed expectations especially in terms of portfolio growth and profitability, as has
LOLC Micro Credit Ltd. which enjoys the advantage of competitive debt financing from our international funding
partners. Each of these three companies has its own well-defined market base and service offering. Thus, among them,
they effectively cover most of the microfinance and SME sectors.
DEPUTY CHAIRMAN’S MESSAGE

10 LOLC 2011/12 REPORTS & ACCOUNTS
We strongly believe that the LOLC Group has an important role to play in the future development of the microfinance
sector. This is why we strengthened our focus on this sector in the year under review. This harmonises with the
Government’s post-war development strategy, which is to concentrate on micro-enterprises and the lower end of the
SME sector. Looking at the figures in this sector since the inception of our microfinancing arm in 2009, we see the very
positive results of our efforts.
helpIng custoMeRs RIse up the lAddeR Presence and access are the keys to success in these grassroots
sectors. LOLC reaches out through its well positioned branch network of 183 comprising of main branches,
mini branches, post office and LIOC centres and branches dedicated for gold products and Islamic financing.
Our low cost but unique channel mechanism with Sri Lanka Post, offers the competitive edge not only in terms of reach
but also enhancing service excellence to otherwise untapped micro clientele. Further, we have the liberty to select
any post office for our operations out of 4,600 post/sub post offices across the island, thus ensuring our footprint is
strategically positioned.
We are the largest microfinance entity in Sri Lanka in terms of geographic presence and portfolio size and the largest
agriculture equipment provider through Brown & Company PLC. Microfinance comes in two varieties: asset-backed
and income-backed. Our group loan model is somewhat different to the popular Grameen Bank model. We have a
smaller group with a speedier and more effective step-up loan cycle. At present, 95% of our group loan portfolio
graduate to individual borrowers. This opportunity not only empowers working women in the microfinance sector,
but also facilitates their transition to an SME entrepreneur, alleviating poverty and uplifting the living standards
of their families. In fact, our microfinance model has been a business case, whereby our associate PRASAC, the largest
DEPUTY CHAIRMAN’S MESSAGE

LOLC 2011/12 REPORTS & ACCOUNTS 11
microfinance institution in Cambodia, has continuously transferred the know-how and best practices to their own
business model. Another value addition that was included during the year was our micro insurance initiative. Through
our insurance arm, LOLC Insurance Company Ltd. (LOIC), we were the first to offer a life insurance plan and a loan
protection cover with our microfinance facilities.
Within the first year of its operations since April 2011, LOLC Insurance Company Ltd., with its captive business alone is
already a significant player in the Insurance industry. In particular, as a catalyst to the micro insurance sector and its
potential to grow in leaps and bounds, LOIC has a promising future in the insurance business.
LOLC Investments Ltd. is the Company that carries our strategic investments in different entities. Among other equity
investments, Seylan Bank as well as Diriya Investments which holds a significant stake of Brown & Company PLC
are noteworthy.
We have a bespoke product portfolio for the SME sector. In addition to the conventional leasing and loan products,
we offer working capital solutions such as invoice discounting, cheque discounting and packing credit. As the pioneers
of factoring, we challenge our own status-quo by adding innovative products. This year, we initiated ‘gold cheque’
discounting - a timely solution to SME borrowers to suit their financial needs in rough times by using their existing
assets. And as our customers rise through the SME ranks, we are with them throughout, offering a diversified portfolio
of financial services to their changing demands.
DEPUTY CHAIRMAN’S MESSAGE

12 LOLC 2011/12 REPORTS & ACCOUNTS
LOLC Securities Ltd. (LOSEC), is our newest subsidiary in the year under review. Although, we are not new to the stock
broking business, LOSEC in less than 12 months of operations has become a leading stock broker to be included in the
top 10 brokers based on annualised turnover.
In fact, with revolving credit, savings and fixed deposits, foreign currency deposits, leases, hire purchases, fleet
management, diverse loan products, factoring and working capital, insurance, stock broking, Islamic financing,
microfinancing, pawning and equity investments such as HDFC bank, our range of financial services is broader than ever.
Small wonder, then, that we are the leading non-banking financial institution in Sri Lanka, and the leading microfinance,
Islamic, agricultural and factoring operations of all such entities - in addition to having the largest fleet and the vehicle
restoration centre in our possession.
leveRAgIng ouR stRengths Our dominance in the financial sector is the result of leveraging our strengths in
order to exploit opportunities as they arise. Sometimes these strengths are not the most obvious ones.
For example, as transparency and regulatory compliance have gained in importance in recent years, we have the
advantage of a well-established corporate governance history behind us, thanks to our long-standing affiliation with
ORIX Corporation, an international leasing-based financial group. Since ORIX is listed on both the Tokyo and New York
stock exchanges, we have long been obliged to follow the reporting and compliance procedures and standards imposed
by these entities as well.
Similarly, we have adopted and developed corporate social responsibility practices over the years thanks to our funding
partners, many of whom are international development funds with specific goals relating to social equity, transparency,
DEPUTY CHAIRMAN’S MESSAGE

LOLC 2011/12 REPORTS & ACCOUNTS 13
environment, etc. Working closely with our valued, long-term funding partners listed in page 72 have helped us develop
as a responsible corporate citizen. Today, credit from these partners accounts half of our lending, while the rest is
drawn from local commercial sources and our own depositors.
Needless to say, the guidance and assistance both financial and technical offered by ORIX and our long-standing
funding partners have made us what we are today in terms of size, penetration and profile, and I take this opportunity to
sincerely thank them for their confidence in us. We reciprocate their trust by continued financial stability led by sound
profitability, attractive return on investment, swift portfolio growth and above all maintaining one of the best NPL ratios
in the industry.
Into new teRRItoRy The decision to move beyond financial services was not taken lightly. Our main motive
was a desire to align ourselves with the economic goals of the nation, since by doing so we are more likely to secure
long-term operational viability and profitability. The prospect of developing a sustainable value chain by exploiting
synergies between our various investments was another strong inducement.
For example, consider our investment in Brown’s Group. This 137-year-old company is heavily involved in complementary
businesses. We are the largest micro financer and they are the largest agriculture equipment provider. Leveraging its
automotive interests further, Brown’s manufactures vehicle batteries and radiators, the market leader in these product
lines. Together with Browns we maintain a healthy portfolio of investments, ranging from banks to hotels, construction
to forestry; plantation to agri inputs. In partnership with Browns, LOLC now owns the Confifi Group and its portfolio of
hotel properties - Eden, Riverina and Club Palm Garden in addition to Tropical Villas, another hotel closely situated.
We are actively looking for a strategic partner to what might be the largest resort complex in the country on completion
of the proposed development.
DEPUTY CHAIRMAN’S MESSAGE

14 LOLC 2011/12 REPORTS & ACCOUNTS
We also acquired one of the most uniquely-positioned resorts in the Southern Coast - Dickwella Resort & Spa, in the year
under review. Our investment in the leisure sector is long term, with a view to being one of the leading players in the
nation’s most promising sector. Group investments in other areas follow a similar pattern.
The energy policy of the country indicated that by 2020, 100% of the country will be electrified with at least 20% of it
generated via renewable energy sources. Hence our venture into renewable energy with a 75% stake in United Dendro
Energy with its biomass power generating plants and plantation investments. Our decision to go with wood as an energy
source was taken after a careful analysis of geographical potential and the probable future impacts of climate change.
In a similar way, our stake in associate company Sierra Construction was taken on the basis of the growing demand
for large scale construction, their capability for major infrastructure projects. Through Sierra, we ventured into Agstar
Fertilizer, a leading fertilizer and agri input producer. This too is a long-term investment aimed at establishing synergies
with other Group companies and equity partners such as Browns. Our investment in Gal Oya Sugar, a public-private
partnership with the Government of Sri Lanka, follows a similar rationale.
conFIdence to FAce A chAngIng FutuRe Surviving and even thriving in turbulent times has given us
confidence in our ability to withstand changes and challenges the future would hold. In fact, our strength is in
identifying opportunities from these both in our core financial and non-financial areas of business. Overall, we will
continue to drive performance in all our financial services businesses, looking at key indicators such as profitability,
portfolio, NPLs and grassroots impact to steer us in the right direction. You will also see us changing our product mix
gradually from concentrated leasing to a wider range of SME and micro based products to cater the changing needs of
our prime customer base.
DEPUTY CHAIRMAN’S MESSAGE

LOLC 2011/12 REPORTS & ACCOUNTS 15
As for our non-finance businesses, they already contribute 45% of Group income. We will place them at the centre of
our strategic focus, keeping a keen eye out for synergies between them. We have already made our investment choices.
Long-term opportunity and a sense of timing will continue to determine our investment strategy. Continuous restructuring,
internal and external, will keep us agile and sensitive to economic and social currents.
Adapting to change is what we are good at. It is what makes us different!
Ishara NanayakkaraDeputy Chairman
DEPUTY CHAIRMAN’S MESSAGE

16 LOLC 2011/12 REPORTS & ACCOUNTS
Foresight and Fast Footwork
gRoup MAnAgIng dIRectoR/ceo’s RevIew The year under review was an exceptional one for the Group.
We achieved the unprecedented pre-tax profit of Rs. 10 Bn even as we transformed ourselves into a diversified business
conglomerate through strategic expansion and investments. Our success was mainly due to what I call ‘Foresight
and Fast Footwork’ - our often surprising ability to predict market and customer trends by leveraging our knowledge,
experience and intuition, as well as the competitive advantage lent to us by our local and international investment and
funding partners.
Financial services remain at the core of LOLC’s strategic business model. However, the irrepressible and dynamic
nature of the Group has witnessed active diversification into strategic growth areas of national significance such as
renewable energy, leisure, forestry and plantations, microfinance and other key sectors. By aligning its vision with that
of the Government, the Group is on the fast track to pursue its ambition to build one of the strongest conglomerates
in the country. The LOLC Group is confident of reaping the benefits of a resurgent economy poised to benefit from the
ongoing ports, aviation and roads and expressway infrastructure development.
01.51

LOLC 2011/12 REPORTS & ACCOUNTS 17
On the financial services side of the business, strong efforts by our marketing and recoveries teams further
strengthened Group collections ratios, which significantly improved the quality of our loan portfolio. Lanka ORIX
Finance PLC (LOFC), has taken over its parent company’s leasing and financial services business, including fixed
deposits, enabling LOLC itself to function more effectively as a holding company. LOFC has successfully sustained its
non-performing loans (NPL) ratio as among the lowest in the industry.
LOFC was listed in the Colombo Stock Exchange during the year under review. Further the LOLC Group’s subsidiary,
Commercial Leasing, received Central Bank approval to operate as a Registered Finance Company, and to reflect its
new status, the Company‘s name was changed to Commercial Leasing & Finance Ltd.
During the year, our microfinance subsidiary, LOLC Micro Credit Ltd., continued to thrive as its breadth and depth of
grassroots penetration increased by leaps and bounds. The Company was successful in bringing invaluable financial
services to this sector by expanding its branch network further. It was also instrumental in creating opportunities for
rural employment through regular training sessions held at its vocational training school, which equips rural youth to
meet the demands of their chosen vocation.
Our performance in 2011/12 was remarkable because it was such a challenging year in terms of competitive pressure.
Here, our sustainable, low-cost business model enabled us to expand and diversify vertically and horizontally.
Today, LOLC Group offers a full spectrum of non-bank financial products and services which makes it a one-stop shop
for customers looking to benefit from our joint Group synergies.
GROUP MANAGING DIRECTOR/CEO’S REVIEW

18 LOLC 2011/12 REPORTS & ACCOUNTS
GROUP MANAGING DIRECTOR/CEO’S REVIEW

LOLC 2011/12 REPORTS & ACCOUNTS 19
the vAlue oF pARtneRshIp The year was marked by several innovative and lucrative partnership agreements.
Lanka ORIX Finance (LOFC) joined hands with Valutrans Sp.A., a prominent international money transfer firm, in a
strategic expansion of our remittance business that will enable Sri Lankan workers in Italy to remit funds home cost
effectively and in real time, while receiving numerous attractive, value added benefits. Families receiving remittances
can withdraw their money from LOFC’s 64 branches and savings centres as well as from Commercial Bank ATMs
islandwide. These efforts by LOFC to promote remittances are timely in view of the fact that this is the first time that
Sri Lanka has recorded over Rs. 1 Bn in worker remittances.
LOFC also entered into a landmark partnership with the International Fund for Agricultural Development (IFAD),
in collaboration with the World Bank, in a programme to uplift the living standards of Sri Lanka’s rural poor by promoting
financial inclusion among those who seek foreign employment. Finally, completing a series of partnerships designed
to benefit remittance customers, the Company worked together with LOLC Micro Credit Ltd. to offer micro loans for
income generating activities in order to reduce beneficiaries’ dependence on remittances over time and help them
develop sustainable income resources.
GROUP MANAGING DIRECTOR/CEO’S REVIEW
20 LOLC 2011/12 REPORTS & ACCOUNTS
InnovAtIon And outReAch The product and service innovations for which we are reputed played a key role in
building and retaining business relationships. A new working capital product named Gold Cheque Financing was
introduced to offer a feasible option for entrepreneurs who lack property or vehicles as collateral. We reintroduced
our Shari’ah compliant children’s savings account, Al-Falaah Junior, with many added benefits. Our footprint grew
to encompass a total of 183 locations, including 39 main branches as well as Post Office service centres, Islamic
finance centres and factoring outlets, which include CLC, LOFC and LOMC branches as well. Locations in the North
and East of the country now account for over 25% of this total. LOFC branches were opened in the Northern Province at
Nelliady, Chunnakam and Chavakachcheri and in other parts of the country. Advanced Information and Communications
Technology systems link nodes on the branch network enabled us to offer sophisticated services even to rural customers,
while branch operations are backed by a round-the-clock customer service hotline. Aggressive marketing and
promotions support the efforts of our branch staff to build relationships and business.
we coMe FIRst becAuse ouR people do LOLC people are recruited for skill and competence, and trained
extensively further to meet LOLC customer service standards. Our HR strategy blends training and development,
rewards and promotion with leadership and management that promotes creativity and innovation among all employees.
Our agility and flexibility is made possible entirely by our talented and dedicated people, and we freely acknowledge that
the difference they make lies at the heart of our success.
GROUP MANAGING DIRECTOR/CEO’S REVIEW

LOLC 2011/12 REPORTS & ACCOUNTS 21
sustAInAbIlIty eMbedded Our strategic focus has long been on investing in innovative and sustainable initiatives,
making a visible difference to our stakeholders’ lives and promoting national development. Sustainability lies at the
heart of our operations and to underscore the importance we attach to sustainable operations, LOLC is a signatory to
the UN Global Compact and implements its charter in every aspect of its business.
LOLC headquarters has the largest solar power installation of any commercial building in the country - a 48kW plant that
meets 15% of monthly energy requirements. Our vision of a green energy portfolio consisting of mini hydro, biomass and
solid waste power generation is now becoming a reality through our investment in companies such as United Dendro
Energy and Gal Oya Plantations.
Social value generation is embedded into the LOLC business model, which is based on financial empowerment for rural
farmers, women and small entrepreneurs. We not only provide financial support for such entrepreneurs, but even help
ensure value chain creation by providing strong market linkages for their products.
A further testament of our commitment to sustainability is LOLC Motors’ state-of-the-art automotive workshop that
delivers such benefits as lower electricity and water usage, widespread use of natural lighting, solar power generation
and rainwater harvesting.
The Group now manifests its direct social responsibility commitments through LOLC Care, which will be the conduit
for all future CSR initiatives. Its current focus is on construction and equipping the Madiwela Special Education School
and Home for Boys.
GROUP MANAGING DIRECTOR/CEO’S REVIEW

22 LOLC 2011/12 REPORTS & ACCOUNTS
chAllenges AheAd We see a bright prospect ahead for the leisure industry, of which the recent uptick in
tourist arrivals is merely the first glimmer. Large scale infrastructure developments and the commissioning of the
Southern Expressway are generating opportunities, as the Government’s concentrated focus on tourism has begun
paying dividends. Our strategic entry into the sector two years ago with the acquisition of four hotels on the south coast
demonstrates the Group’s astute assessment of the sector’s future potential. We deepened our sectoral commitment
further during the period under review by acquiring the Dickwella Resort & Spa, a stunningly located 77-room property
in the deep south of the island. LOLC Leisure is already known as one of the largest leisure property owners in the
country. The upgrading of our Club Palm Garden, Riverina and Tropical Villas properties in tandem with several other
LOLC-owned properties along Sri Lanka’s ‘Golden Mile’ will witness the single largest beach resort block and complex
in the country.
outlook LOLC has created strong links between sectors vital for the country’s economic growth and its core
businesses. By aligning its business interests with these sectors, LOLC has placed itself on a strong upward trajectory
that will grow steeper as post-war growth and development begin to show returns.
GROUP MANAGING DIRECTOR/CEO’S REVIEW

LOLC 2011/12 REPORTS & ACCOUNTS 23
AcknowledgeMents In conclusion, I would like to express my sincere gratitude to the Chairperson and Board of
Directors for their wise counsel throughout the year. In a Company that moves with great agility, many vital decisions
have to be taken swiftly and I am grateful for the support from the Board in this regard. I would like to commend
the LOLC team and all Group companies for their responsive alignment with the vision of the Group. Operating in a
competitive sector requires forbearance and a tactical mindset. I am confident that our team will continue to exhibit
both qualities in equal measure through the coming months, thus creating a strong launching pad for future growth by
building on the gains achieved during the year.
Kapila JayawardenaGroup Managing Director/CEO
GROUP MANAGING DIRECTOR/CEO’S REVIEW

24 LOLC 2011/12 REPORTS & ACCOUNTS
we are committed to the grassroots level
busIness RevIew The year that just concluded was filled with both opportunities and challenges. Post-war
economic resurgence gained significant momentum, opening up tremendous opportunities for entrepreneurs and
financiers, especially in the North and East of the country where an immense reconstruction effort is underway.
The LOLC Group was quick to take advantage of these opportunities, looking to expand through organic growth and
strategic acquisitions while consolidating ourselves in the sectors we already inhabit. This expansionary phase is
expected to continue for the short to medium term.
Less encouragingly, the ongoing global recession had its inevitable effect on Sri Lanka’s economic and business
performance. Export-related businesses were particularly affected. The domestic economy also received shocks from
currency devaluation and inflation. The effects of these developments on the financial services sector were mixed,
though its effect on other sectors were generally negative.
Slower growth and high interest rates foreshadow a difficult year ahead. Some sectors of the economy, such as tourism,
services and construction, are likely to do well. A stable political environment and clear economic policy focusing on
agriculture and infrastructure will help drive growth in 2012. For the Group - as well as for its competitors - such a
clear policy direction makes it possible to invest confidently in these sectors, taking advantage of various incentives and
facilities offered by the Government.
Higher interest rates and lower liquidity will probably cause the volumes of non-performing advances to increase across
the financial services industry in 2012, which would pressurise in limiting the growth in lending. The resulting credit
demand will improve prospects for the various financial services businesses of the LOLC Group. In particular, credit
demand in the SME/micro-enterprise sectors are likely to grow, to the benefit of our own SME and micro-enterprise
operations. Our access to attractive lines of long-term credit for SME and micro-enterprise development from
international bilateral and multilateral funding agencies gives us a very strong advantage in these sectors, one we shall
leverage on increasingly in the months to come.
LOLC 2011/12 REPORTS & ACCOUNTS 25
BUSINESS REVIEW
stRAtegIc dIRectIon Our long-term strategy is to pursue growth in sectors that complement our profile in
financial services, where we continue to maintain our strength. However, the tactical means by which this strategy is
implemented will vary in the short to medium term.
In financial services, the main sources of growth will be our channel network, where we will build business by offering
attractive interest rates based on our sources of low cost funds and promote cross-selling by packaging products from
different Group companies as integrated customer service solutions. Effective collections systems and further back-end
integration through insurance, fleet management and vehicle repairs will also help drive growth in financial services.
Beyond this core sector, the Group will continue to consolidate investments already made in leisure, manufacturing
and trading, agriculture and plantations, renewable energy and construction. In all these sectors, we will consolidate
the positions we now hold through recently launched or acquired businesses, building long-term value and looking for
steady growth.
In financial services as well as in other sectors, we will strive to be always within arm’s reach of potential customers at
grassroots level, building infrastructure and honing our systems to achieve this.
FInAncIAl seRvIces While the LOLC Group continues to evolve into a broad-based conglomerate, we will never
lose our core commitment to financial services. It is on the success in this sector that our current expansion has been
founded, and it is from this sector that much of the resources for future growth will be drawn. Accordingly, we paid
increased attention to growth and integration in financial services throughout the year under review, with strategic
investments in accessibility, service provision and backup, information technology and cross-selling. In particular,
we strove to make our products and services evermore accessible to ordinary Sri Lankans all over the country.

26 LOLC 2011/12 REPORTS & ACCOUNTS
Starting with a leased tractor from LOLC, this successful farmer from Kurunegala has now bought his second tractor to grow his agri business.
Growing her cane basket weaving business through a group loan scheme, Devika of Mathugama now employs eight others to help her.
A seamstress from Divulapitiya who doubled her income through group microfinance.
A group microfinance customer in Chilaw harvesting her gotukola cultivation.
Producing savoury snacks that are packed and sold in Balangoda by a group microfinance-supported family business.
Rushika of Mathugama is now on her second cycle of the group microfinance scheme and is expanding her poultry business.
BUSINESS REVIEW
LOLC 2011/12 REPORTS & ACCOUNTS 27
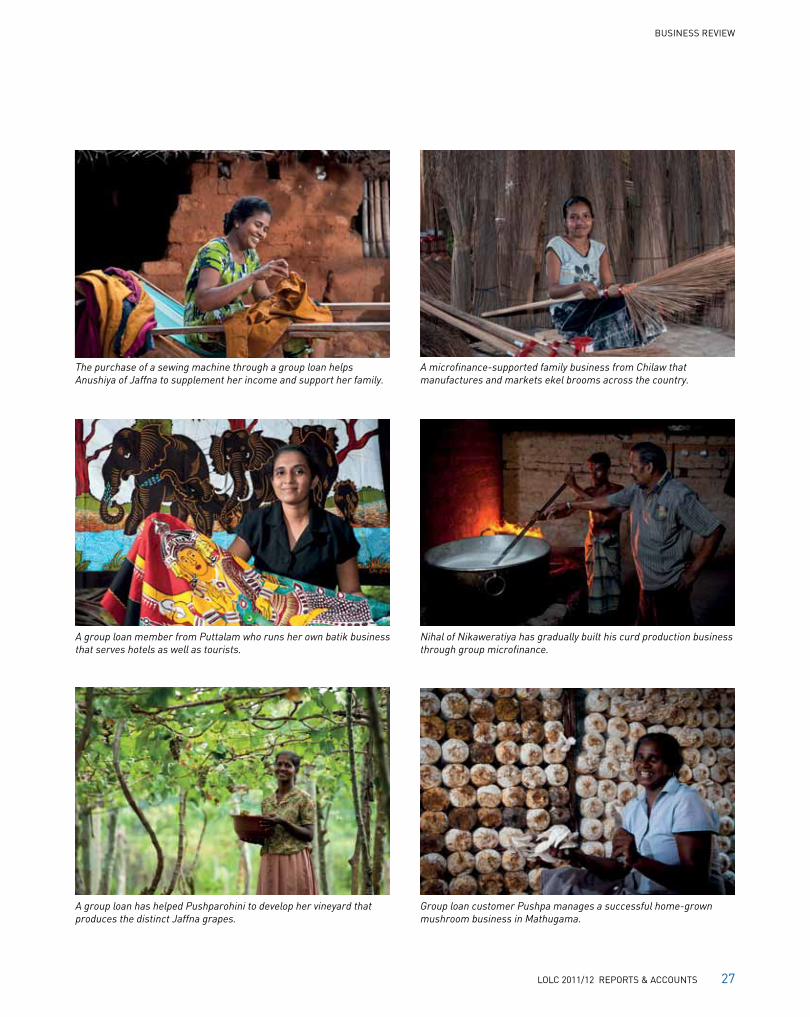
The purchase of a sewing machine through a group loan helps Anushiya of Jaffna to supplement her income and support her family.
A group loan member from Puttalam who runs her own batik business that serves hotels as well as tourists.
A group loan has helped Pushparohini to develop her vineyard that produces the distinct Jaffna grapes.
A microfinance-supported family business from Chilaw that manufactures and markets ekel brooms across the country.
Nihal of Nikaweratiya has gradually built his curd production business through group microfinance.
Group loan customer Pushpa manages a successful home-grown mushroom business in Mathugama.
BUSINESS REVIEW

28 LOLC 2011/12 REPORTS & ACCOUNTS
MIcRoFInAnce Nowhere was our commitment to the grassroots more apparent than in the burgeoning field of
microfinance. In a mere three years, LOLC Micro Credit Ltd. (LOMC) has become the leading microfinance solutions
provider in Sri Lanka, with a loan portfolio of Rs. 12.26 Bn (up from Rs. 8.22 Bn in 2010/11) disbursed through a total
of 100,981 loans, of which 74,821 were in the year under review. The active borrower base, 60% of which is female,
increased by 55%. LOMC also has one of the lowest non-performing loan ratios in the country.
These operations were partly financed by facilities from five international funding partners, amounting to Rs. 2.57 Bn in
total. Meanwhile, the Company’s pawning portfolio, acquired from the sister company Lanka ORIX Finance PLC (LOFC),
grew by 46% to Rs. 1.73 Bn.
In the year under review, LOMC recorded a profit before and after tax of Rs. 818 Mn and Rs. 658 Mn respectively, compared
with last year’s figures of Rs. 554 Mn and Rs. 415 Mn respectively.
Having aggressively expanded its network during the year, LOMC is now active in 23 districts through a total of 34
branches and 95 IsuruDiriya service centres. This strong rural presence also helps create employment opportunities
for local youth: the Company’s 277 loan officers were all recruited from the local towns around the branch network and
deployed in their respective hometowns. To support this initiative, a fully-equipped training and development centre for
loan officers was also set up during the year. In addition, LOMC was proud to be able to provide training for officers of
two overseas ORIX partners namely, Xac Leasing (Mongolia) and BRAC Bank (Bangladesh).
Plans for 2012 call for continued geographical expansion to serve borrowers who do not have access to mainstream
financial institutions - in particular, those resident in the North and East where the Company continues to receive
technical assistance for operational growth under a performance-based grant from the International Finance
Corporation. LOMC now derives 16% of its portfolio from its six branches and 15 service centres in this formerly
war-torn region.
BUSINESS REVIEW

LOLC 2011/12 REPORTS & ACCOUNTS 29
sMAll And MedIuM enteRpRIse FInAnce An important aspect of the LOLC Group’s commitment to national
development is its support for enterprise growth through incremental, need-based access to larger and more
sophisticated financial resources. The first step on this ladder is microfinance, which is the purview of LOMC; here,
at the deep grassroots, customers with no collateral resources guarantee each other’s loans. Once a customer has
outgrown the resources of microfinance, the next step up is to small-and-medium-scale enterprise (SME) financing,
the purview of LOFC.
More than 80% of Sri Lankan enterprises may be described as SMEs. Collectively, they contribute over 30% of GDP in
terms of value addition. The sector makes considerable use of lease financing, and LOLC has played a valuable role in
its development over the years. Our diverse SME portfolio includes customers engaged in agriculture, trading, services
and transport; our exposure to these different sectors is continuously monitored in order to manage risk.
Our operations in this important sector saw substantial growth in the year under review, driven by favourable Government
policy and a climate of economic confidence. Most of this growth was derived from motor vehicle financing, as duty
concessions to certain groups made new vehicles more affordable. Overall, leases and loans in the SME category
amounted Rs. 33 Bn compared with Rs. 20.8 Bn in 2010/11, an increase of 59%. Despite aggressive competitor action,
LOLC retained its edge, largely because of our policy of assessing credit worthiness based on a customer’s cash flow
rather than the collateral he or she can present.
In fact, our credit-assessment process provides a vital competitive advantage. We have developed the means to
gather relevant information from SMEs which, in many instances, cannot produce formal records to justify their
creditworthiness. Industry references and referrals from existing clients are an important part of this process.
Another advantage is our presence at grassroots level. We opened another 26 branches and other outlets during the
year under review, bringing the operating total to 135.
BUSINESS REVIEW

30 LOLC 2011/12 REPORTS & ACCOUNTS
Lease facilities on vehicle purchases, offered through collaborations with selected vehicle dealers, was a key element
of our marketing strategy in 2011-12. These were promoted through media advertising, telemarketing and regional
campaigns. We even entered into a bulk purchasing agreement with a leading commercial vehicle vendor in order to
shorten the delivery period for vehicles purchased with LOFC lease facilities.
In the third quarter of the year, certain Government decisions - increases in interest rates, limits on credit growth by
banks and financial institutions and the devaluation of the Rupee - caused a rise in vehicle prices and a consequent
decline in the demand for lease facilities.
As a result of these policy reversals, Sri Lanka may expect slower growth going forward. Businesses will incur higher
operating costs and margins will shrink. SMEs will be compelled to manage their costs more efficiently, and the LOLC
Group will have to adopt a more conservative approach to credit assessment and the management of exposure.
lAnkA oRIX FInAnce LOFC, a licensed finance company established in 2001, 90% of which is owned by LOLC, is the
main deposit-taking subsidiary of the Group. The Company maintained its growth momentum in the year under review,
with indicators such as deposits, available capital, credit growth, asset quality and profitability all showing impressive
gains. However, a shortage of market liquidity from October 2011 (as discussed above) reduced the overall growth
momentum of the deposit base. Deposits at the end of the year under review amounted to Rs. 25.1 Bn, growing by an
impressive Rs. 7.7 Bn or 44% over the previous year. Foreign-currency deposits did especially well, growing 173% to
reach Rs. 1.96 Bn at year’s end.
BUSINESS REVIEW

LOLC 2011/12 REPORTS & ACCOUNTS 31
Deposit Analysis, F.Y. 2011/12
Category Deposits (Rs. Bn)
Contribution (rounded %)
Fixed Deposits (short-term) 15.20 61Fixed Deposits (long-term) 4.06 16Savings Deposits 0.36 1Foreign Currency Deposits 1.96 8Al-Falaah Deposits 3.52 14Total Deposits 25.10 100
Assets and Liabilities LOFC enjoyed a 58% increase in its asset base, which reached Rs. 38 Bn by year’s end. Most
of this growth came from the accommodations portfolio, comprising finance leases, hire-purchases and other secured
advances, which itself grew by 59% to Rs. 33 Bn. Secured loans were the second highest contributor to asset growth.
Deposits, LOFC’s major source of funding, amounted to 75% of total liabilities, having grown by 44% to Rs. 25 Bn -
one of the largest deposit bases among licensed finance companies. Time deposits accounted for nearly 90% of the base.
Foreign currency deposits showed a spectacular increase. Overall, sustained profitability strengthened the Company’s
capital fund.
Capital & Profits Driven by higher profits and improved profit retention, the equity of LOFC grew by 35% to
Rs. 4.8 Bn. Capital adequacy ratios remained above the statutory minimum. The core capital ratio (as a percentage of
risk-weighted assets) stood at 14.4% at year’s end, in keeping with the industry average, while the ratio of capital to
deposits was 19%.
BUSINESS REVIEW

32 LOLC 2011/12 REPORTS & ACCOUNTS
A Substantial portion of LOLC Group profits under review was derived from the operations of LOFC in the Group’s
core businesses of lending and deposit-taking. At the end of the financial year, LOFC had recorded profit before tax of
Rs. 1.8 Bn, which represents 17% of Group profits and an increase of 20% over the previous financial year’s figure.
Other Lines of Business The contribution of remittances from Sri Lankans employed overseas was of salient
importance in 2011/12. LOFC made a strong contribution to inward remittance growth, handling over US$ 5 Mn
during the course of the year through agreements with exchange houses covering Europe and the Middle East.
The Company also embarked on a financial literacy initiative for beneficiaries of such remittances, supported by a grant
of US$ 245,000 from the Finance for Remittances (FFR) initiative of the International Fund for Agricultural Development
(IFAD). The project, targeting 10,000 migrant worker families, covers financial goal setting, savings, and access to credit
and insurance that will help broaden the Group’s rural customer base.
During the year, LOFC obtained the approval of the Central Bank of Sri Lanka to engage in the business of money
changing, which is now included in its portfolio of services. LOFC is also in the process of implementing a campaign to
promote this new line of business.
Risk Management Credit risk remained low, although non-performing accommodations rose by 5% to Rs. 336 Mn,
mainly due to ‘seasoning’ of the portfolio following rapid expansion. Exposure to NPAs relative to total loans outstanding
declined to 1.01%, a figure that compares very favourably with the industry average of 5.1%. With loan loss provision
considered, the net NPA ratio was 0.73%, compared to an average of 1.9% for the non-bank financial sector. Provision
coverage for NPAs was reduced to 29%.
BUSINESS REVIEW

LOLC 2011/12 REPORTS & ACCOUNTS 33
A single-digit interest rate regime coupled with increased business volumes boosted earnings for most of the
year. Net interest income grew by 123% to reach Rs. 3 Bn; as a percentage of total assets, it had reached 7.9% by
31 March 2012 compared to an average industry margin of 6.4% for the 12 month period ended December 2011.
Liquid assets amounted to Rs 2.95 Bn at the end of the review period, 12% higher than the minimum set by the Central
Bank. Liquid assets in approved securities were maintained at 33% above the stipulated minimum.
Strong and sustained portfolio expansion, augmented by the transfer of LOLC’s finance-leasing franchise, boosted
earnings. Profitability, too, continued to improve. The Company recorded a remarkable profit after tax figure of
Rs. 1.2 Bn. The increase was mainly attributable to business growth derived from LOFC’s expanding network of branches.
Islandwide Presence The year under review saw the Company greatly improve its geographical presence and
accessibility, opening 64 cash-collection centres (Isuru Diriya Centres) at post offices across the country as well as
three savings centres and 13 fully-fledged branches. The number of outlets in the Northern and Eastern Provinces
exceeded thrice over, growing from 8 to 25. Our commitment to financial inclusion was reflected in the operation of
three Al-Falaah centres (see below) in the Eastern Province, where many Muslim Sri Lankans make their homes.
coMMeRcIAl leAsIng And FInAnce ltd. (clc) CLC played a key role in the financial services sector of the
LOLC Group adding value in many fronts in terms of top line and bottom line contribution, island-wide reach, serving a
multitude of customer segments, brand value etc.
CLC’s business model enabled the Company and the Group to reach the clients and markets that have been deprived
of formal finance up to date, thus, developing the rural and newly-developing markets, especially those outside the
Western Province.
BUSINESS REVIEW

34 LOLC 2011/12 REPORTS & ACCOUNTS
The strategy paid rich dividends where the demand for formal credit was high and also backed by the high debt servicing
appetite and capacity. This resulted in high business volumes as well as exceptional collection ratios.
The asset book of CLC grew by 23% during the year from Rs. 21 Bn to Rs. 26 Bn. The non-performing loan ratio
was 2.8% as at 31 March 2012.
The Company recorded a very impressive profit before tax of Rs. 3.2 Bn for FY 2011/12 up from Rs. 741 Mn in the
previous year.
In addition to financial performance, CLC also achieved few key milestones during the year. The highlights of which
include receiving the licence to function as a finance company from the Central Bank of Sri Lanka (CBSL) and the
opening of the 50th branch in the strategic township of Kilinochchi by the Governor of CBSL. With the receipt of finance
company licence, the Company commenced its fixed deposits and savings operations in January 2012. Results to date
indicate that it would be a key player due to high public confidence in the popular CLC brand name developed over the
24-year history of the Company.
CLC Key Indicators
For the year ended 31 March 2012(Rs. Mn)
2011(Rs. Mn)
Increase(%)
Interest Income 5,245 3,402 54Profit Before Tax 3,182 741 329Portfolio Balance 24,104 18,371 31Factoring Portfolio 2,682 2,953 -9
BUSINESS REVIEW

LOLC 2011/12 REPORTS & ACCOUNTS 35
woRkIng cApItAl And FActoRIng Micro-enterprise and SMEs often struggle to find working capital to sustain
ongoing operations and expansion plans. Larger businesses, too, often find themselves short of funds due to delayed
payments from customers and other reasons. Factoring provides a solution for all these entrepreneurs. LOLC Factors
Ltd. (LOFAC) was incorporated to take over the activities of the Working Capital Business Unit of LOLC. Having a separate
firm to handle factoring supports the important shift in the new-business focus of the LOLC Group. For most of its
20-year history, factoring services were offered mainly to corporate customers in the Western Province. Although
LOFAC's first steps into regional markets commenced some years ago, it was the end of the war and the Government’s
declared commitment to rural and regional development that encouraged the Company to make a strong commitment
in this sector. Leveraging the growing branch network of the LOLC Group, LOFAC provided a record number of new
facilities to customers all over the country, successfully cross-selling other financial products through its sister company,
LOFC, at the same time.
The year under review saw LOFAC’s working capital/factoring operation record its highest-ever performance in:
Factoring funds in use
Monthly turnover
Profit per marketing employee
LOFAC also had the lowest expense margin amongst all business units within the Group. Thus, factoring became one of
the highest-yielding Group operations, with the best net return among all our lines of business.
Other highlights of the year included the successful launch of a new product, which brought in many customers
previously thought of as unbankable, by allowing them to offer gold as collateral against their borrowings.
BUSINESS REVIEW

36 LOLC 2011/12 REPORTS & ACCOUNTS
IslAMIc FInAnce LOLC Group’s involvement in Islamic Finance began in response to growing popular demand
for such services. In 2005, the Banking Act made provision for Islamic Finance, giving further recognition and creating
more scope for all stakeholders in the industry to reap the benefits of Islamic finance. With the challenges faced initially,
the scope and the need for a reputable Islamic Financier was immense to re-establish the confidence amongst the
stakeholders and the public at large. Seizing the opportunity, the Group established its Islamic Business Division in
2007. This Division now functions as Al-Falaah, the Islamic Business Unit of Lanka ORIX Finance PLC.
The decision has been borne out by its results. Today, Al-Falaah is a prominent player in an industry where the formal
and informal segments together is estimated to be worth over Rs. 100 Bn. However, more than 70% of Islamic financial
needs are fulfilled by the informal sector and the conventional banking and finance sector. Al-Falaah is moving to tap
this massive potential through the provision of relevant Shari’ah-compliant services at all levels from the grassroots
upward. Currently, Al-Falaah offers fully-Shari’ah-compliant alternatives for term and savings deposits, trade finance,
working capital and import-finance services. By broadening its product mix to include special savings accounts for
senior citizens and minors, the unit plans to serve the entire Muslim community, and ultimately to become the premier
provider of Islamic financial solutions in Sri Lanka.
In the year under review, Al-Falaah achieved its growth targets in deposits and assets. The mudharabah and wakalah
portfolio grew by 22% year on year, from Rs. 2.9 Bn in 2011 to Rs. 3.6 Bn in 2012, while the assets portfolio comprising
Ijarah, Murabaha, Diminishing Musharakah and Musawammah rose in value from Rs. 3.5 Bn to Rs. 4.7 Bn, an increase
of 32%. Collection and NPL ratios also exceeded expectations, the net NPL ratio was maintained at 0.09%.
Due to the efficient and effective management of its assets book, the award winning Al-Falaah Business Unit of LOFC
was able to distribute the highest profit distribution to its Mudharabah account holders. Hence, Al-Falaah was able to
dispel the myth of low returns to Islamic Finance investors through this high profit returns which at times exceeded the
conventional returns.
BUSINESS REVIEW

LOLC 2011/12 REPORTS & ACCOUNTS 37
Overall, the Division’s pre-tax profit showed a twofold increase in the current year compared to last year’s figure of
Rs. 92 Mn.
Operational highlights include the opening of the fifth Al-Falaah centre at Akkaraipattu in April 2012. Future plans include
further broadening of Al-Falaah’s regional and demographic reach, with particular concentration on microfinance for
agricultural and home-based enterprises, while continuing to serve the SME and corporate sectors; increasing the
number of LOLC staff dedicated to Al-Falaah operations and ultimately the establishment of Al-Falaah as an independent
corporate entity under the LOLC Group umbrella.
Al-Falaah is highly committed to run its business in accordance to Shari’ah principles and the Shari’ah Supervisory Board
(SSB) guidelines. This includes quarterly Shari’ah audits, whetting of all transactions by the in-house Shari’ah advisory,
continuous review of processes and procedures by the SSB etc. Al-Falaah intends to be a role model in the industry,
whereby the entire industry will follow suit and ultimately all stakeholders will reap the benefits of Islamic Finance.
Fleet MAnAgeMent Our commitment to providing financial and enterprise support to Sri Lankans in corporate
and other segments of the market across the country are further reflected in our fleet management operations which
we have continued to strengthen over the years. Our three-pronged strategy is to:
serve all segments of the market,
offer attractive rentals on all types of vehicles, and
be self-sufficient in funding asset purchases.
We entered the short-term rent-a-car market a few years ago, hiring out vehicles to walk-in clients as well as to
corporates that rent vehicles for a specified term. The long-term rental portfolio also increased, while our fleet itself
now numbers more than 1,500 vehicles and is still growing. Besides creating a steady, reliable cash flow, the long-term
BUSINESS REVIEW

38 LOLC 2011/12 REPORTS & ACCOUNTS
rental business also realises additional profits from the eventual sale of assets in a market where import duty increases
have raised prices for second-hand vehicles. We also finance the rental of heavy equipment used by the construction
industry. Here our strategy involves disposing of the equipment at the end of its tenure.
Going forward, LOLC will consolidate its positions in the short- and long-term car rental market, continue to augment
its vehicle fleet and introduce value additions such as fuel cards and tracking systems to enhance the efficiency of
customers’ vehicle use. We will also maintain the most important and fundamental value addition to our rental business,
namely our mechanical workshop.
lolc MotoRs Activity in the year under review was dominated by the launch of our new subsidiary, Speed Italia,
which commenced operations in September 2011. Speed Italia markets Fiat automobiles in Sri Lanka, commencing with
an initial order of 70 cars to the Air Force. The launch generated considerable press publicity, which was supplemented
by advertisements for Fiat cars. A radio promotion campaign was conducted in December and January, supported by
more press advertising and local street promotions in Anuradhapura, Jaffna, Kurunegala and Nawalapitiya.
lolc InsuRAnce LOLC Insurance is a new entrant to a highly competitive industry with more than 20 players
in which business volumes grew from Rs. 66.25* Bn in 2010 to an estimated Rs. 78.51 Bn in 2011. The market saw a
substantial growth in General Insurance during the year under review predominantly driven by motor insurance due to
a temporary reduction in vehicle import taxes that drove a boom in vehicle purchases. The industry is now in a period of
regulatory transition, with existing composite insurance companies being required to segregate their life and general
businesses in the next couple of years followed by mandatory listings in the stock exchange whilst rules on solvency
and supervision are also being revised.
* As per IBSL press release on 5 June 2012.
BUSINESS REVIEW

LOLC 2011/12 REPORTS & ACCOUNTS 39
LOLC Insurance obtained a composite insurance licence in 2010 and started writing business in mid-2011. Most of the
year under review was spent in setting up the infrastructure to commence operational activities and opening its office
in Colombo. The Company wrote Life Assurance Policies amounting to Gross Written Premium (GWP) of Rs. 51.4 Mn
and General Insurance GWP of Rs. 364.7 Mn during the period under review and has successfully tied up with leading
international reinsurers for underwriting capacity.
Going forward, LOLC Insurance will be establishing itself in the market as a major player in the industry with a full range
of insurance products and services on offer for both Life and General.
lolc secuRItIes Commencing operations in July 2011, LOLC Securities marks the return of the Group to stock
broking after a two-year hiatus. Leveraging a new operational model centered on investors’ portfolio management
strategies, the Company has captured a significant share of market in a very short period of time. Although it began
operating in a period when the market was declining and highly volatile, it ranked 11th out of 28 stock broking firms in
terms of monthly turnover at the end of the financial year.
In addition to its Colombo Headquarters, LOLC Securities has branches in Galle and Kurunegala and has mobilised
sufficient funds from regional and rural investors to make a positive contribution to its bottom line. The Company plans
to open offices in Kandy and Jaffna in the near future.
Attracting foreign investors to the Sri Lankan equity market is another component of the Company’s strategy: it has
already appointed agents in Malaysia and Dubai and is planning to widen its reach to include India and the United
Kingdom in the near future.
BUSINESS REVIEW

40 LOLC 2011/12 REPORTS & ACCOUNTS
dIveRsIFIed ActIvItIes In a market economy, growth and development depend upon the availability of capital.
Financial services providers thus become facilitators of growth.
This is a vital function as also an intermediary one. Purveyors of finance can have a powerful influence on the character
and direction of development by choosing which sectors, ventures and entrepreneurs they finance. However, this
influence is indirect, and in a reasonably open market for capital, an entrepreneur can usually find a source of funds
with fewer strings attached, especially if he is willing to pay a premium for this.
In the climate of opportunity created by post-war economic revival and with a sense of mission arising from our
commitment to the national agenda, the LOLC Group is no longer content to let its influence on development be wholly
indirect. Behind our recent metamorphosis into a business conglomerate with interests in agriculture and plantations,
renewable energy, leisure and construction is our determination to participate directly in the national effort.
The remaining pages of this Business Review cover our non-financial operations in 2011/12. From ethical tea production,
to renewable energy that lowers the nation’s carbon footprint to essential infrastructure construction projects,
they portray a Group engaged at the heart of Sri Lanka’s development effort and deeply committed to the future.
leIsuRe LOLC Group has identified the potential of tourism and has invested aggressively in leisure. The holdings
through LOLC Leisure Ltd., include five existing resort hotels with a combined room inventory of 616.
BUSINESS REVIEW
LOLC 2011/12 REPORTS & ACCOUNTS 41
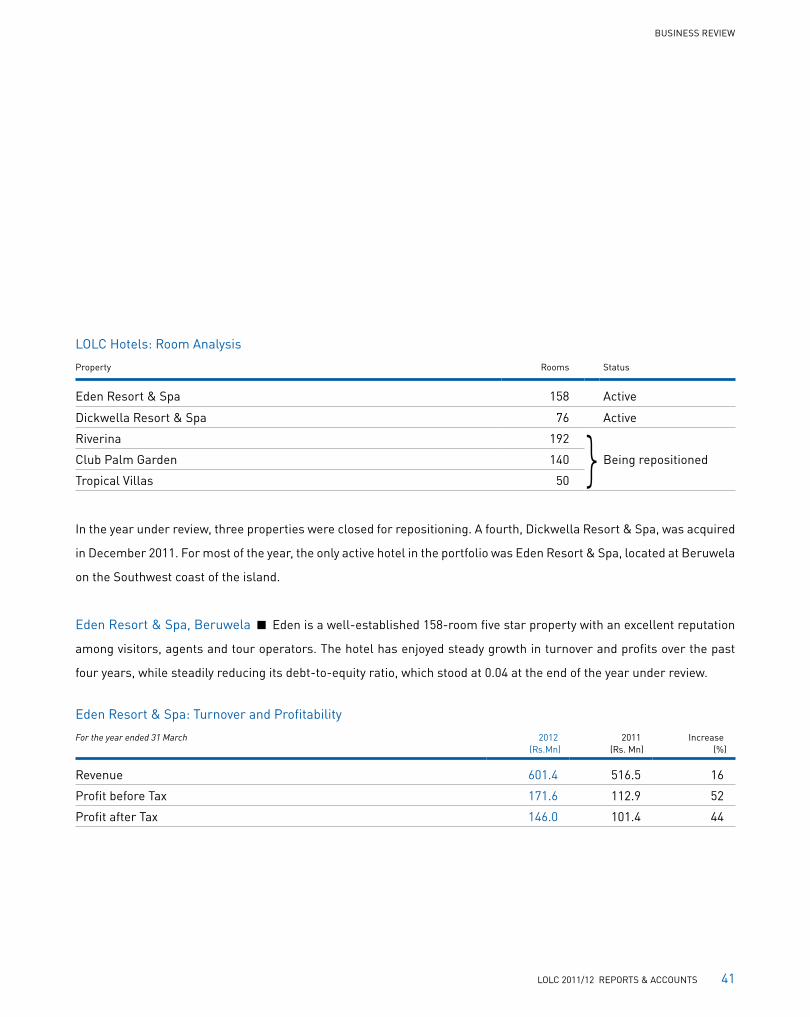
LOLC Hotels: Room Analysis
Property Rooms Status
Eden Resort & Spa 158 Active
Dickwella Resort & Spa 76 Active
Riverina 192 }Club Palm Garden 140 Being repositioned
Tropical Villas 50
In the year under review, three properties were closed for repositioning. A fourth, Dickwella Resort & Spa, was acquired
in December 2011. For most of the year, the only active hotel in the portfolio was Eden Resort & Spa, located at Beruwela
on the Southwest coast of the island.
Eden Resort & Spa, Beruwela Eden is a well-established 158-room five star property with an excellent reputation
among visitors, agents and tour operators. The hotel has enjoyed steady growth in turnover and profits over the past
four years, while steadily reducing its debt-to-equity ratio, which stood at 0.04 at the end of the year under review.
Eden Resort & Spa: Turnover and Profitability
For the year ended 31 March 2012(Rs.Mn)
2011(Rs. Mn)
Increase (%)
Revenue 601.4 516.5 16
Profit before Tax 171.6 112.9 52
Profit after Tax 146.0 101.4 44
BUSINESS REVIEW

42 LOLC 2011/12 REPORTS & ACCOUNTS
Eden was the focus of intensive marketing and promotional activity throughout the year that witnessed the hotel
achieving its highest-ever profit before and after tax of Rs. 171.6 Mn and Rs. 146.0 Mn respectively. These demonstrate
the capacity and ability of the Company to contribute to the Group.
Dickwella Resort & Spa, Dickwella Acquired in December 2011 at a price of Rs. 1,014 Mn, this luxury 76-room
property is situated on a scenic promontory with the sea on three sides and an extraordinarily attractive beach frontage.
Access has been greatly improved since the opening of the Southern Expressway and planned developments in the
South of the country focused on Hambantota are expected to drive business in the medium term.
Dickwella Resort & Spa enjoyed a very good financial year, the first nine months of which were passed under its
previous owners. Gross annual turnover was Rs. 188 Mn, an increase of Rs. 35 Mn over the figure for the previous
year. The property has considerable potential and plans have been drawn up to expand room capacity to 150 over the
next few years.
Marketing activities for the hotel since its acquisition included telesales and press advertising promoting a weekend
getaway package.
Excel World Development Project The 6-acre Excel World site on Darley Road is ideally located to benefit from the
urban renaissance and renewal taking place around the Beira Lake at the centre of Colombo. Formerly underutilised as
a downmarket entertainment and leisure complex, it is now the focus of an ambitious development plan which includes
entertainment, shopping, conferencing, supermarket, leisure etc.
BUSINESS REVIEW

LOLC 2011/12 REPORTS & ACCOUNTS 43
Looking Forward LOLC Leisure is moving to occupy a strong position in the Sri Lankan tourism sector within the
next medium to long term, by which time it will have approximately 1,000 plus rooms in its portfolio. Most of these will
be in four or five-star hotels or exclusive boutique properties. Our existing properties, Eden Resort & Spa and Dickwella
Resort & Spa, together with the properties under refurbishment and the Kosgoda and Nasuvanthivu-Passekudah
development projects will position LOLC Leisure as a formidable force in the industry.
AgRIcultuRe And plAntAtIons Maturata Plantations Ltd. and Pussellawa Plantations Ltd. are two of the largest
tea producing companies in Sri Lanka.
Maturata Plantations Maturata Plantations operates 19 tea estates, of which significant acreage also accommodate
the cultivation of rubber, coconut and spices. The Company posted a turnover of Rs. 1,981 Mn during the year under
review, with tea accounting for 88% of the total, followed by rubber (10%), coconut and others. Plantations are labour
intensive, and wages are reviewed every two years. The last review in 2011 saw a substantial 30% increase in wages
based on the Collective Agreement between Regional Plantation Companies (RPC) represented by the Employers
Federation and trade unions.
Maturata Plantations recorded a landmark yield of 1,232 kg rubber per hectare in 2011, the best performance among
all RPCs. Further, the Company had the highest new planting of cinnamon for the year, reflecting a crop diversification
strategy which includes the large scale planting of trees for timber on uncultivated lands.
In recognition of its worker-friendly and environmentally sound policies, the Company obtained Ethical Tea Partnership
certification for eight tea factories during the year. Several awards were also won at events organised by the Tea
Brokers, while Maturata Plantations won the Gold, Silver and Bronze awards at the Ceylon Specialty Tea Award
Ceremony held in Moscow in September 2011.
BUSINESS REVIEW

44 LOLC 2011/12 REPORTS & ACCOUNTS
Pussellawa Plantations The principal activities of the firm are the cultivation and processing of tea and rubber
and the cultivation of timber. Its holdings comprise of ten tea plantations, including some historic estates originally
established as coffee plantations in the 1840s, nine rubber estates and five estates planted in a mix of tea and rubber.
The total area under cultivation is 9,165 ha.
The Company recorded a turnover of Rs. 3,546.7 Mn and a profit after tax of Rs. 483.6 Mn for the year. Timber tree
stocks were valued at fair value. Gain on change in fair value of timber tree stocks in the reported profit is Rs. 25.9 Mn.
The year’s results were achieved despite substantial drop in tea prices since April 2011 and rubber prices since
October 2011, and also with a high wage increase granted in April 2011.
Capital expenditure during the year under review amounted to Rs. 533.8 Mn, of which Rs. 432.6 Mn was invested in
re-planting and the maintenance of immature plantations. New plantings during the year consisted of 248 ha in rubber
and 16 ha in tea. In all, immature plantings amounted to 2,003 ha in rubber and 137 ha in tea.
Sustainability is a vital element of the Company’s operating ethos, and sustainable programmes to protect the
environment and improve the quality of life of workers continued to receive priority in the year under review. In 2011/12,
Pussellawa Plantations continued, with its own funding, a worker-housing project originally financed by the Plantation
Development Project (PDP), spending Rs. 13.5 Mn to re-roof 169 worker housing units, upgrade 22 staff housing units
and implement seven water-supply schemes on its plantations. Additionally, the Company re-roofed a further 59 worker
housing units and constructed 25 housing units and 25 toilets for estate workers with PDP funding.
BUSINESS REVIEW

LOLC 2011/12 REPORTS & ACCOUNTS 45
Environmental sustainability is an equally salient concern. In a region where soil erosion is a historical problem,
the Company has planted over 54,000 timber trees on previously harvested and marginal tea lands and beside some
hill-country roads. A programme has now been initiated to plant giant bamboos on stream banks and at other
erosion-prone locations in the Pussellawa region in cooperation with the Mahaweli Authority of Sri Lanka.
In recognition of efforts like these the Company achieved Ethical Tea Partnership certification for its Hellbodde and
Rothschild Estates during the course of the financial year.
Brown & Company In the course of its 137-year history, Brown & Company PLC has established a strong presence in
key areas of the Sri Lankan economy, such as agriculture and plantations, tourism, transportation and construction.
Originally, a trading and agency firm supplying the colonial plantation industry, it has evolved over time into a diversified
trading and investment group enjoying leadership in a variety of markets, among them automotive batteries and
radiators, tractors, marine engines, branded power tools and veterinary pharmaceuticals. This breadth and depth of
involvement has bred a thorough understanding of Sri Lankan consumers and markets.
The equity and professional relations between Brown & Company and LOLC Group enable the latter to partake of
Brown’s established strengths and forge important synergies that support LOLC in its mission to build its business and
serve the nation from the grassroots up.
Browns builds on its inherent strengths as a trading and manufacturing entity while making strategic investments in
emerging business areas through its investment arm, Browns Investments. The Browns Group represents a number
of leading global brands in the Sri Lanka market, among them Ashok Leyland Marine, Continental Airlines, Exide,
Eukanuba, FG Wilson, Massey-Ferguson/TAFE, Olympus, Pitney Bowes and Sharp.
BUSINESS REVIEW

46 LOLC 2011/12 REPORTS & ACCOUNTS
Browns is itself a household name across the country. The Company is especially well-known to Sri Lanka’s farmers
and commercial planters to whom it supplies a wide range of agricultural inputs: machinery such as 4- and 2-wheeled
tractors and other farm implements, fertilizer, seeds and planting materials. The plantation investments of Browns are
in a joint venture with Perpetual Holdings, under which are the Maturata and Pussellawa plantations. Exide and Lucas
automotive batteries are by far the leaders in their field, while the Browns ‘BattMobile’ emergency replacement service
has revolutionised the service paradigm in this market.
Browns also has significant presence in the leisure industry through the holdings of Browns Investments, which has
a 30% stake in LOLC Leisure as well wholly owning a 150-room resort property, Samudra Beach Hotel, now under
construction. Brown’s also has access to a significant portfolio of freehold and leasehold property, including Brown &
Company’s former head office at Darley Road.
Aside from its leadership position in veterinary pharmaceuticals, the trading interests of Browns Group include pet foods,
power tools, consumer electrical items, office automation equipment and consumer durables. However, the Group’s
strategic focus going forward will be on construction, tourism, healthcare, plantations, trading and entertainment
sectors of the Sri Lankan economy in which substantial growth is projected in the medium to long-term.
Gal Oya Gal Oya Plantations, run by LOLC and Brown & Company in a public-private partnership with the
Sri Lanka Government, is a project which includes the revival and refurbishment of the sugar plantation and power plant.
Refurbishment of the plant is almost complete and the factory is expected to commence operations in July. The project
also includes a water purification plant with a capacity of 250,000 litres per hour which was successfully renovated
and commissioned in January 2012. Excess purified water is sold to the National Water Supply and Drainage Board.
BUSINESS REVIEW

LOLC 2011/12 REPORTS & ACCOUNTS 47
To fulfil the factory needs, 5,200 ha of landmass has been rejuvenated and brought under sugar cane cultivation Ethanol
will be produced as a by-product, in addition to 2 MW of bagasse-derived power. This initiative possesses the capacity
to provide direct employment for nearly 1,200 individuals and indirect employment for over 15,000 individuals and 5,500
farmer families, largely contributing towards the upliftment of their livelihoods with new revenue streams.
RenewAble eneRgy In a society where energy security and environmental sustainability are increasingly urgent
concerns, few investments make as much sense as renewable energy. LOLC Group’s commitment to this sector is in
alignment with the national policy of increasing the share of renewables in the power sector‘s energy mix, which also
supports sustainable development in order to build a better future for all Sri Lankans.
LOLC acquired a 75% stake in United Dendro Energy in 2010. The company currently has a 6 MW wood-fired power plant
under construction at Dodangoda, in Kalutara, with a further 34 MW of planned capacity to come online over the next
five years from new plants located at Hambantota and Puttalam, as well as from planned increases to generating
capacity at Dodangoda. United Dendro also has 4,000 acres of land in the south of the country presently being planted
with gliricidia, a fuelwood tree whose leaves can be used as cattle feed, adding to the sustainability of the venture.
The company is working to secure an additional 40,000 acres of redundant or barren land for planting gliricidia,
a venture that will provide direct employment for over a 1,000 rural Sri Lankans. Further, fuelwood resources will be
secured through an outgrower programme that will provide economic support to as many as 66,000 more rural families.
Outgrower registration is already underway in the relevant districts.
United Dendro is a ‘green energy’ initiative that will not only help reduce Sri Lanka’s dependence on imported fossil
fuels but will also earn carbon credits which, when traded, make a positive contribution to the national balance of trade.
BUSINESS REVIEW

48 LOLC 2011/12 REPORTS & ACCOUNTS
constRuctIon Founded in 1981, Sierra Construction is today one of Sri Lanka’s most visible enterprises, its
familiar logo adorning large-scale infrastructure construction projects in areas as diverse as water supply and sewerage,
irrigation, power generation and distribution, piling, roads and large building sites, as well as the civil engineering and
telecommunications projects which were its original area of interest. It is one of the few large Sri Lankan engineering
firms to have established a presence outside the country, having undertaken projects in India, Maldives and Qatar.
Sierra today employs over 4,000 people, either directly or indirectly, including more than 300 engineers. The company
takes pride in its highly motivated and talented workforce, which it perceives as the driving force behind its success.
Now in its third decade of operations, Sierra has earned numerous awards and accolades as well as the more formal
endorsement of ISO certification. In the year under review, the company began implementing a best-practice regime in
corporate governance and risk management. Sierra remains focused on its vision of being the preferred infrastructure
development partner in the region, identified by customers and partners as integral to their success.
Few of the major projects completed during the recent past:
Colombo Town North Water Supply Project Package 1 & 2: Rs. 4,900 Mn
Dialog Broadband Stage 1: Rs. 2,400 Mn
Hambantota Water Supply Project: Rs. 1,200 Mn
Muttur Water Supply Project: Rs. 1,070 Mn
Kattankudi Hospital: Rs. 410 Mn
Sainthamaruthu Hospital Project: Rs. 213 Mn
NADA Building Battaramulla: Rs. 223 Mn
BUSINESS REVIEW
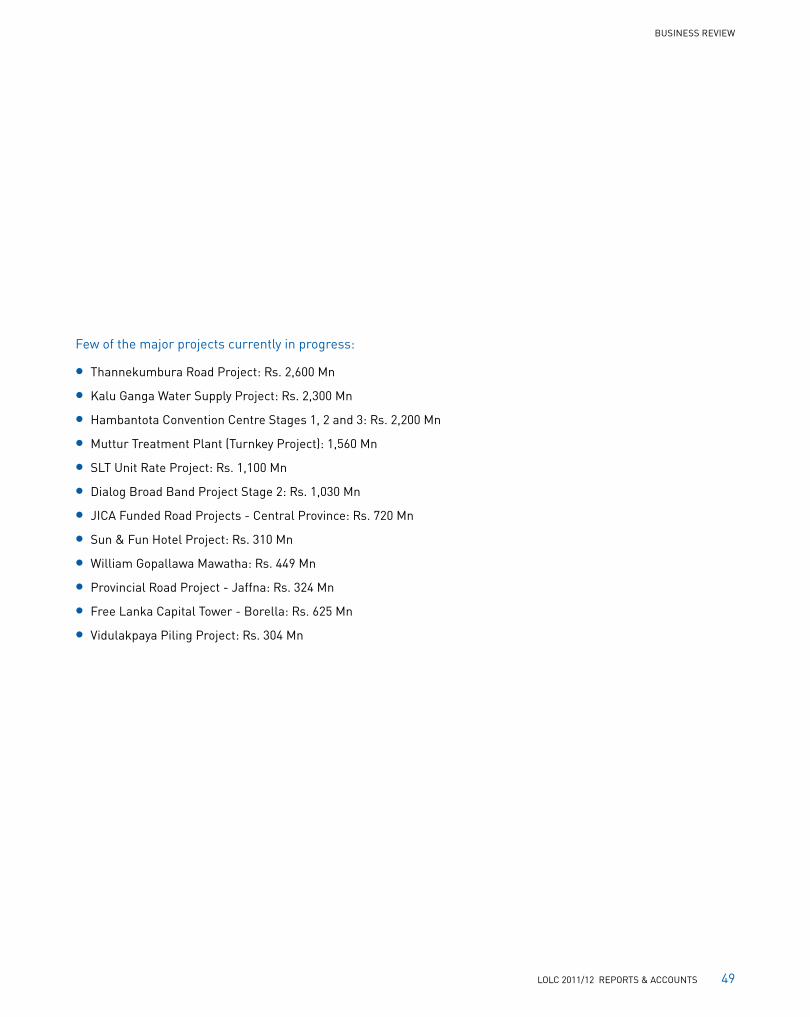
LOLC 2011/12 REPORTS & ACCOUNTS 49
BUSINESS REVIEW
Few of the major projects currently in progress:
Thannekumbura Road Project: Rs. 2,600 Mn
Kalu Ganga Water Supply Project: Rs. 2,300 Mn
Hambantota Convention Centre Stages 1, 2 and 3: Rs. 2,200 Mn
Muttur Treatment Plant (Turnkey Project): 1,560 Mn
SLT Unit Rate Project: Rs. 1,100 Mn
Dialog Broad Band Project Stage 2: Rs. 1,030 Mn
JICA Funded Road Projects - Central Province: Rs. 720 Mn
Sun & Fun Hotel Project: Rs. 310 Mn
William Gopallawa Mawatha: Rs. 449 Mn
Provincial Road Project - Jaffna: Rs. 324 Mn
Free Lanka Capital Tower - Borella: Rs. 625 Mn
Vidulakpaya Piling Project: Rs. 304 Mn

50 LOLC 2011/12 REPORTS & ACCOUNTS
Financial Services
Lending
Microfinance
Savings and Deposits
Foreign Currency Deposits
Factoring/Working Capital
Islamic Finance
SME & Development Finance
Insurance
Stock Broking
Fleet Management
Automobile Restoration and Service
Investments
Agriculture & Plantations
Agriculture Equipment
Tea Plantations
Rubber Plantations
Sugar Plantation
Fertilizer and Agri Products
Renewable Energy
Hydro Power
Biomass Power
Solar Power
Leisure
Construction
Trading & Agencies
Consumer Electronics
Pharmaceuticals
Automotive Spares
Power Tools
A sweep of the sectors we serve
BUSINESS REVIEW

LOLC 2011/12 REPORTS & ACCOUNTS 51
our Reach
northern provinceThis region is predominantly agricultural in pursuit, thus the majority engage in farming and fishing or are professionals within the civil and business sectors.
north-western provinceSri Lanka’s third largest paddy producing region, the North-Western Province has a highly-developed agricultural economy, growing a variety of fruits and vegetables, flowering plants, spices and oil-seeds in addition to the traditional plantation crops such as coconut, rubber and rice. Its fertile land mass and varied climate make it ‘ideal ground’ for growing virtually any crop.
It is also home to vibrant industries such as fishing, prawn farming and rubber.
north-central provinceThe largest of all the provinces, the North-Central Province is predominantly agro-based, with more than 65% of its residents dependent on basic agriculture and agro-based industries for their livelihood.
The North-Central Province is fertile ground for any investor whose interests lie in areas such as agriculture, agro-based industries and livestock farming.
central provinceThis is Sri Lanka’s world famous tea country; the home of authentic, fragrant, world renowned Ceylon tea. Its rich history, scenic mountain beauty and contrastingly cool climate make it a continuing draw for tourists from all over the world.
BUSINESS REVIEW

52 LOLC 2011/12 REPORTS & ACCOUNTS
sabaragamuwa provinceSri Lanka’s fabulous gem mining terrain lies within this province. It is one of the ‘jewels in Sri Lanka’s crown’ famed as Sri Lanka is for its rubies and sapphires, and is on every tourist’s itinerary. One of the world’s last remaining rain forests, the Sinharajah reserve, also lies within its boundaries.
Sabaragamuwa is a rich trove of opportunity for tourists and entrepreneurs alike.
uva provinceWithin Uva’s boundaries flow some of Sri Lanka’s most spectacular waterfalls such as Dunhinda, Diyaluma and Rawana. Along with the Udawalawe National Park and Galoya National Park it is no wonder tourism flourishes in this region.
southern provinceThe bounty from this region is divided between land and sea as farming and fishing provide the main sources of income for the vast majority of people based here.
Substantial development has and is taking place in the region, with Sri Lanka’s new port the Manampitiya Mahinda Rajapaksa Port already operational whilst a new international airport is slated for opening later this year at Mattala.
Sri Lanka’s first super highway is also to be found in this Province. The 126 km long Southern Lanka Expressway is Sri Lanka’s first E Class highway which links the Sri Lankan capital, Colombo with Matara. The new highway has slashed travel time between Colombo and the South by over 50% to less than 1½ hours.
BUSINESS REVIEW

LOLC 2011/12 REPORTS & ACCOUNTS 53
western provinceThis is the most densely populated province in the country. Within its environs lies Colombo, the nation’s administrative and business ’capital’.
As Sri Lanka’s economic hub, all major local and international corporations have their presence in the city and so do major designer and high street retailers.
Almost all the premier educational institutions in the country are located here. Also, this province has the largest number of schools and colleges in the country.
eastern provinceSri Lanka’s Eastern Province is witnessing rapid development after being caught up in a 30-year war which ended in 2009. Its people are an eclectic mix of ethnicity and religious persuasion, with all communities and major religions being represented in abundance. It is an area with vast potential for investment and development, particularly in the leisure sector with vast stretches of pristine and unspoilt beach front.
BUSINESS REVIEW

DIRIYA
50%
51%
10%
FP
HPFL
M
BCP
BI
SB
EGH FLCH
100%
SH
10%
GPPL
22.05%
P
LOIL
100%
LOFAC
100%
LOIC
100%
LOSEC
100%
22.05%
50%
SC
10%
10%
30%
69%
10%
10%
50%
76.39% 59%
BUSINESS REVIEW
gRoup stRuctuRe
LOFC
90%
LOMC
80%
71.24%
AF
20%
60%
13%

DRS
LOLL
70%
TVH
AF - Agstar Fertilizer (Pvt) Ltd.
BCP - Brown & Company PLC
BI - Browns Investment PLC
CIB - Commercial Insurance Brokers Ltd.
CLC - Commercial Leasing & Finance Ltd.
DIRIYA - Diriya Investments (Pvt) Ltd.
DRS - Dickwella Resorts (Pvt) Ltd.
EH - Eden Hotel Lanka PLC
EGH - Excel Global Holdings
FLCH - Free Lanka Capital Holdings PLC
FP - Fernwood Porcelain
GPPL - Gal Oya Plantations (Pvt) Ltd.
HPFL - Hydro Power Free Lanka PLC
LOECO - LOLC Eco Solutions Ltd.
LOFAC - LOLC Factors Ltd.
LOFC - Lanka ORIX Finance PLC
LOIC - LOLC Insurance Company Ltd.
LOIL - LOLC Investments Ltd.
LOITS - Lanka ORIX Information Technology Services Ltd.
LOLL - LOLC Leisure Ltd.
LOMC - LOLC Micro Credit Ltd.
LOMO - LOLC Motors Ltd.
LOSEC - LOLC Securities Ltd.
M - Maturata Plantations Ltd.
P - Pussellawa Plantations Ltd.
PG - Palm Garden Hotel PLC
PRASAC - PRASAC Micro Finance Ltd.
RH - Riverina Hotels PLC
SB - Seylan Bank PLC
SC - Sierra Constructions Company Ltd.
SH - Sierra Holdings Company Ltd.
SIL - Speed Italia (Pvt) Ltd.
TVH - Tropical Villas (Pvt) Ltd.
UDE - United Dendro Energy (Pvt) Ltd.
RH
49% 29%
52.8%
100% 100%
24.39%
PG
EH
21.82%
LOITS
100%
PRASAC
18%
LOECO
UDE
100%
75%
CIB
CLC
90%
40%
SIL
100%
LOMO
100%
25.5%
BUSINESS REVIEW
As at 31 March 2012

56 LOLC 2011/12 REPORTS & ACCOUNTS
FInAncIAl RevIew lolc gRoup LOLC Group posted yet another year of healthy growth in profitability recording
Rs. 10.3 Bn Profit Before Tax (PBT), a 25% year on year growth. The Profit After Tax (PAT) for the year was Rs. 8.9 Bn, a 27%
increase over last year which was Rs. 7.0 Bn. The PAT was after providing for Rs. 1.4 Bn as taxes. LOLC Group’s superior
performance comes amidst a challenging environment where its core business of financial services faced interest
rate volatility, increased taxes on motor vehicles and lower liquidity in the financial markets. Despite these challenges,
the financial services sector remained dominant in profit contribution, with 72% of the Profit Before Tax coming from
this sector, which is the core business operation of the Group. LOLC Group’s gross revenue increased by 18% to reach
Rs. 37.8 Bn from Rs. 32.1 Bn recorded in the previous year. LOLC’s double digit growth in revenue and profits have proven
the dynamism, confidence and ability to build a highly successful and competitive business in diversified areas.
The earnings per share for the year was at Rs. 13.17, an increase of 63% over the previous year. Net assets attributable
to equity holders too increased by 48% to Rs. 19.3 Bn. The total assets of the Group reached Rs. 145.3 Bn compared with
Rs. 111.8 Bn recorded in the previous year, mainly due to increase in financial assets. The total net receivables of the
financial service sector increased to Rs. 80.2 Bn, an increase of 37% over the previous financial year.
The focused strategies adopted by the Group had a positive impact as the Group‘s gross income increased to Rs. 37.8 Bn
(2010/11 - Rs. 32.1 Bn) mainly due to increase in revenue from financial service sector and trading sector. Total revenue
from financial service sector grew by 31% to Rs. 20.5 Bn (2010/11 - Rs. 15.7 Bn) primarily due to growth in business
volumes achieved through the expansion of branches island-wide for the SME and micro lending businesses.
Revenue for the year includes gains made from investment activities. This includes capital gains of Rs. 3.7 Bn from the
divestiture of 10% of two subsidiary companies. However, with the negative sentiments in the equity markets during the
latter part of the financial year, valuation losses from shares for the Group was Rs. 1.5 Bn.
we are on a Roll

LOLC 2011/12 REPORTS & ACCOUNTS 57
Net interest cost increased to Rs. 8.5 Bn compared with previous year’s Rs. 6.4 Bn mainly due to higher level of borrowings
during the year. Total interest-bearing loans and bank overdrafts increased to Rs. 66.1 Bn from Rs. 50.8 Bn due to the
increase in the financial service sector lending portfolio. The total deposit base increased to Rs. 25.2 Bn from Rs. 16.3 Bn.
Direct expenses excluding interest cost reduced by 3% to Rs. 986 Mn mainly due to decrease in VAT on financial services
(Rs. 422 Mn from Rs. 650 Mn). Direct expenses also includes claims and benefits paid on insurance contracts amounting
to Rs. 51 Mn on accounts of LOLC Insurance Ltd.
The operating expenses, including provisioning for bad and doubtful debts, depreciation, staff cost and marketing
expenses increased by 31% to Rs. 10.4 Bn. Staff-related cost increased by 67% to Rs. 3.3 Bn due to growth in number
of staff and increase in related expenses. Provision for bad and doubtful debts for the year was Rs. 609 Mn. Additional
specific provisions were made by each of the financial services companies, amounting to Rs. 487 Mn, over and above the
regulatory provisioning requirement.
The Group strengthened its strategy by further investing into the leisure sector with the acquisition of the controlling
interest in Dickwella Resorts (Pvt) Ltd. (Dickwella) and Excel Global Holdings Ltd. recording negative goodwill of
Rs. 269 Mn and Rs. 2.6 Bn respectively arising from fair valuing the net assets. The Group’s holding in these companies
are 99.9% in Dickwella and 100% in Excel Global Holdings Ltd.
The share of profit from Equity Accounted Investees amounting to Rs. 270 Mn was recognised mainly from PRASAC
Microfinance Institution in Cambodia, Agstar Fertilizer (Pvt) Ltd. and Associated Battery Manufactures.
FINANCIAL REVIEW

58 LOLC 2011/12 REPORTS & ACCOUNTS
lAnkA oRIX leAsIng coMpAny plc (lolc) While the LOLC Group continued its steady growth as a conglomerate,
the Parent Company Lanka ORIX Leasing Company PLC (LOLC) continues its conversion into holding company from a
leasing company, and acts as the catalyst in the investment activities of the Group.
Financial services activities, previously performed by LOLC are now carried out by its subsidiary companies Lanka ORIX
Finance PLC (LOFC), LOLC Micro Credit Ltd. (LOMC) and Commercial Leasing & Finance Ltd. (CLC). These companies
provide the solid base of profitability from financial services to the Group.
In line with LOLC’s strategy to move towards a holding company, no new lending business is booked in the Parent
Company, LOLC’s portfolio of leases were transferred to LOFC resulting in a significant reduction in the lending portfolio
which fell by 47% to Rs. 5.8 Bn from Rs. 11.0 Bn.
FINANCIAL REVIEW
LOLC 2011/12 REPORTS & ACCOUNTS 59
Borrowings increased marginally from Rs. 22.4 Bn to Rs. 23.9 Bn, an increase of 7% over last year, mainly to facilitate
investment and branch expansion within the financial services sector. Shareholders’ funds increased by 58% to
Rs. 11.7 Bn from Rs 7.4 Bn through profits recorded during the period. As a result, LOLC’s gearing, Debt to Equity Ratio,
decreased from 3.0 times to 2.0 times.
LOLC disposed 10% each of its fully-owned subsidiaries LOFC and CLC in compliance with the ruling issued by the
Central Bank of Sri Lanka, requiring finance companies to be listed on the Colombo Stock Exchange. As a result, a net
disposal gain of Rs. 4.1 Bn was recognised in the Income Statement. The year under review was a challenging year for
equity market investments. LOLC recorded marked to market losses of Rs. 745 Mn.
Staff cost reduced to Rs. 268 Mn from Rs. 341 Mn as a result of the business operations getting shifted to the subsidiary
companies. Consequently, the operating expenses of the Company reduced by 15% to Rs. 1.7 Bn leading to a profit after
tax of Rs. 4.3 Bn after providing Rs. 122 Mn as income taxes.
FInAncIAl seRvIces sectoR The financial services sector, which is the core business of the Group, contributed
72% to the Group’s Profit Before Tax. The sector continued to grow with expanding demand for credit reinforced by the
favourable economic and market conditions prevalent during the early part of the year. However, the lending operations
slowed down during the latter part of the year synchronising the credit squeeze in the financial services industry as a
result of the lower level of liquidity.
Despite the competitive market environment and challenging economic conditions prevalent in the latter part of the
year, LOLC Group’s financial services sector completed another extremely successful year in terms of profitability,
financial position and business expansion. Net portfolio (net receivables) grew by 37% to reach Rs. 80.2 Bn from
Rs. 58.4 Bn. These levels of growth were achieved through the continuous funding made available from LOLC and its
funding partners. The Group was successful in sourcing US$ 39.5 Mn as new funding, which were secured through
FINANCIAL REVIEW

60 LOLC 2011/12 REPORTS & ACCOUNTS
LOLC’s long standing relationships with several foreign multilateral and bilateral funding institutions, towards the
expansion of the SME and Micro businesses.
The single largest shareholder in LOLC continues to be ORIX Corporation. Our Japanese founding partner remains a
pillar of strength and continued with support, especially in respect of compliance and governance. LOLC is the only
financial services company in Sri Lanka to report according to the provision of the Sarbanes-Oxley Act. In the year under
review, LOLC received an ORIX Group award recognising its excellent performance among ORIX’s overseas subsidiaries.
This is the second consecutive year in which we have won this prestigious award.
LOLC Group’s policy of zero exposure to foreign exchange risks paid well where the Group was not exposed to the
devaluation effects of the Rupee. This policy was also mandated by the CBSL on all foreign borrowing of the LOLC Group.
Strategic expansion in the branch network to reach 185 locations island-wide provided the companies ease of access to
the target customers in the SME and the Micro sectors. The finance business of the Group grew from strength to strength
achieving a deposit base of Rs. 25.2 Bn, an increase of 54% over the previous year’s Rs. 16.3 Bn. This clearly demonstrates
the confidence placed by the deposit holders in the stability of LOLC and the respective finance companies.
During the year, LOLC Group, being one of Sri Lanka’s premier financial solution providers, further expanded its
service offerings. LOLC Securities Ltd., commenced operations during the year providing broking services at the
Colombo Stock Exchange and made Rs. 21 Mn as PBT within the first few months of operations despite the low level
of market activity. LOLC Insurance Ltd. expanded its operations offering a wide range of general and life insurance
products to the market. The Company in its maiden year of operations made a loss of Rs. 66 Mn before tax as a result
of the start-up costs and build-up of insurance reserves. LOLC Motors and Speed Italia complements the financial
services business with the provision of state-of-the-art automobile restoration facility to the Group’s fleet operation and
to its customers.
FINANCIAL REVIEW

LOLC 2011/12 REPORTS & ACCOUNTS 61
lAnkA oRIX FInAnce plc (loFc) LOFC continued to show robust performance during the year subsequent to being
positioned as the flagship financial service provider of the Group. The Company underwent many structural changes
following LOLC’s decision to become a holding company. Accordingly, LOLC transferred its entire leasing portfolio
to LOFC during the year and also extended its full franchise of branches to LOFC. LOFC benefits from the already
established infrastructure of LOLC and the branch network strategically covering all parts of the island. During the year,
LOFC listed its shares in the Colombo Stock Exchange in line with the Ruling issued by the Central Bank of Sri Lanka to
all registered finance companies to be listed.
LOFC concluded an extremely successful year recording an impressive profit after tax of Rs. 1.2 Bn Gross income from
operations was Rs. 6.3 Bn, an increase of 37% over the previous year’s income of Rs. 4.6 Bn. Increase in interest income
is mainly due to increase in the lending portfolio.
LOFC’s lending portfolio consisting of leases, hire purchases and loans, increased by 59% to Rs. 33 Bn. Growth in loan
portfolio was achieved with no compromise on asset quality. LOFC’s net non-performing loan ratio was maintained at a
superior level of 0.7% at the end of the year. The Company’s effective collection mechanism and tight credit supervision
has resulted in LOFC being able to maintain asset quality at a higher level.
Provision for bad and doubtful debts for the year reduced to Rs. 21 Mn compared with the previous year’s charge of
Rs. 156 Mn. Rs. 90 Mn was made as additional specific provisions towards bad and doubtful debts over and above the
CBSL required levels.
The increase in the lending portfolio was well complemented by mobilising funding to facilitate the additional
disbursements. LOFC’s main funding sources are fixed deposits, savings and bank borrowings. The deposit base of
the Company consists of conventional, Islamic, foreign currency fixed and savings deposits. The total deposit base grew
from Rs. 17.4 Bn to Rs. 25.0 Bn during the year. Foreign currency deposits grew by 173% to Rs. 1.96 Bn during the year
FINANCIAL REVIEW

62 LOLC 2011/12 REPORTS & ACCOUNTS
from Rs. 719 Mn in the previous year. Borrowings too increased to Rs. 5.9 Bn from Rs. 1.1 Bn during the year. The capital
adequacy ratio of the Company was at a healthy 14.4% as at financial year end, well above the regulatory minimum
requirement of 10%.
Net finance cost of the Company was Rs. 3.0 Bn, an increase of 69% over the previous year. The increase in borrowing
cost is mainly due to the increase in customer deposits interest which increased with the growth of the deposit base as
well as in line with the market movements.
The increased level of activity and network expansion led to an increase in operating expenses to Rs. 1.6 Bn, a 16%
growth. The resultant Profit Before Tax for the year was Rs. 1.78 Bn and the Company reported a Profit After Tax of
Rs. 1.24 Bn after providing for income tax of Rs. 534 Mn.
FINANCIAL REVIEW

LOLC 2011/12 REPORTS & ACCOUNTS 63
lolc MIcRo cRedIt ltd. (loMc) Completing three years of operation, LOMC has shown substantial progress in its
business performance in terms of its outreach, portfolio expansion and profitability. Within a short span of three years
LOMC today is considered one of the largest private sector microfinance institutions in Sri Lanka.
LOMC recorded an impressive Profit After Tax of Rs. 658 Mn, an increase of 59% over the previous financial year.
The main contributor to the superior performance is the increase in lending portfolio which consists of leases, loans and
pawning. Lending portfolio grew by 49% to reach Rs. 12.2 Bn from Rs. 8.2 Bn during the year. LOMC’s strategic focus,
strategic presence, and professional approach towards microfinance has been the key factors contributing towards the
outstanding performance.
LOMC was extremely successful in managing the net non-performing loan portfolio at a creditable level as the gross
NPL ratio was maintained at 0.7% during the year reduced from 1.0% in the previous year. LOMC’s rigorous recovery efforts
have been the key to success in managing NPL at a commendable level. The Company made further specific provisions of
Rs. 302 Mn over and above the required levels minimum stipulated by the CBSL towards bad and doubtful debts.
FINANCIAL REVIEW

64 LOLC 2011/12 REPORTS & ACCOUNTS
Whilst the lending portfolio grew 49% during the year, borrowings too increased by 24% to Rs. 9.7 Bn to finance the
portfolio growth. LOMC has been extremely successful in raising funds through foreign bilateral and multilateral
funding institutions which has enabled LOMC to raise long-term funds at very attractive terms. LOMC follows the
Group’s zero foreign currency exposure policy on all these foreign funding by entering into currency swaps. Borrowing
costs increased by 74% to Rs. 963 Mn from previous year with the increase in borrowings.
During the year, the Debt to Equity ratio improved to 4.0 times from 5.9 times in the previous year. Improvement in debt
to equity ratio was due to LOMC’s retained earnings together with the increase in share capital by Rs. 426 Mn by the
conversion of debentures held by its shareholders LOLC and FMO.
LOMC’s interest income grew by 73% to Rs. 2.8 Bn from Rs. 1.6 Bn in the previous year achieved by the growth in
business volumes in leases and loans. Pawning business which was transferred from LOFC during the previous year
contributed 11% to the overall interest income of the Company.
FINANCIAL REVIEW

LOLC 2011/12 REPORTS & ACCOUNTS 65
Operating expenses increased to Rs. 1.3 Bn from Rs. 779 Mn during the year as a result of the rapid expansions of the
business operations. The Company reported Profit Before Tax of Rs. 818 Mn for the year.
coMMeRcIAl leAsIng And FInAnce ltd. (clc) CLC concluded an extremely successful year with total income
increasing to Rs. 7.4 Bn from Rs. 3.6 Bn and a PAT of Rs. 2.9 Bn. CLC achieved remarkable results through strategic
expansion in the lending business and professional management of its asset portfolio.
The total assets increased from Rs. 21.4 Bn to Rs. 26.4 Bn, a 23% growth over the previous year due to the increase
in lending portfolio consisting of Lease, HP, Loan and Factoring. The lending portfolio grew significantly by 31% to
Rs. 24.1 Bn from Rs. 18.4 Bn compared to the previous year as a result of growing business volumes. Managing
non-performing loans was of paramount importance and the Company’s strategy of effective collection and bad
debt management paid off well, achieving an above industry average non-performing loan ratio. CLC’s gross NPL ratio
FINANCIAL REVIEW

66 LOLC 2011/12 REPORTS & ACCOUNTS
was 2.8%. The Company’s provisions were at a strong level of Rs. 711 Mn with additional Rs. 96 Mn provisions being
made on account of bad and doubtful debts, over and above the regulatory provisioning requirement.
During the year, total borrowings increased to Rs. 16.3 Bn from Rs. 15.4 Bn, as a result of growth in business volumes.
However, Debt to Equity Ratio of the Company strengthened to 2.5 times from 4.2 times in 2010/11 as a result of
enhancing equity position of the Company through operating results.
Interest income grew to Rs. 5.2 Bn for the year from Rs. 3.4 Bn, an increase of 54% with interest on Leases and
HP contributing 67% to the total interest income of the Company. Income earned from the factoring business grew to
Rs. 795 Mn, an increase of 73% year on year.
Increase in borrowings to fund the additional volume growth together with rising market interest rates have caused an
increase in interest expenses for the year to Rs. 2.2 Bn, an increase of 66% over the previous year.
During the year, the Company disposed Diriya Investments to LOLC Investments, a subsidiary company of the Group,
which resulted in a capital gain of Rs. 2 Bn to CLC.
Total operating expenses increased by 37% to Rs. 2.1 Bn supporting the branch expansion and increase in business
volumes. The Company reported a Profit After Tax of Rs. 2.9 Bn after providing for income tax of Rs. 263 Mn.
During the year, the Company converted itself to a finance company subsequent to its successful application made to
the CBSL. The Company was listed in the Colombo Stock Exchange in June 2012, keeping with the CBSL requirements
for all finance companies to be listed.
FINANCIAL REVIEW

LOLC 2011/12 REPORTS & ACCOUNTS 67
FINANCIAL REVIEW

68 LOLC 2011/12 REPORTS & ACCOUNTS
lolc InsuRAnce ltd. (lolc InsuRAnce) LOLC Insurance Company Ltd. is a fully-owned subsidiary of LOLC.
The Company commenced its insurance operations during the year providing Life and Non-Life insurance services.
During the year, LOLC Insurance recorded a gross written premium of Rs. 416 Mn which includes Rs. 365 Mn from
non-life insurance and Rs. 51 Mn from life insurance respectively. This level of high income is achieved in the first year
of operations as a result of LOLC Insurance’s presence through the Group’s existing branch network. An amount of
Rs. 49 Mn was incurred as claims after deducting reinsurance receivable. LOLC Insurance on its first year of operation
reported a loss of Rs. 66 Mn before tax.
leIsuRe LOLC Leisure Ltd. (LOLC Leisure), the holding company of the Group’s leisure sector, acquired 99.9%
of Dickwella Resort (Pvt) Ltd. (Dickwella) in December for Rs. 1.1 Bn. Eden Resort & Spa PLC. (Eden) and Dickwella
completed an exceptional year with an excellent contribution being made to LOLC Leisure‘s profits. Eden made
Rs. 172 Mn as PBT, a 52% growth over last year and Dickwella made Rs. 71 Mn PBT for the year. The remaining three
hotels of LOLC Leisure, Palm Garden PLC, Riverina Hotels PLC and Tropical Villas (Pvt) Ltd. were closed for business
to undergo refurbishments which is now underway. All furniture and fittings were sold and the buildings have been
considered for accelerated depreciation. Due to this, the losses reported from Palm Garden was Rs. 523 Mn, Riverina
Rs. 577 Mn and Tropical Villas Rs. 100 Mn.
tRAdIng The Group’s investment into the trading sector is through Brown & Company PLC and its subsidiaries
which are primarily engaged in managing its trading business through leading consumer durable brands, motor
accessories and industrial equipment.
Total contribution to the Group’s revenue from the trading sector increased by 27% to Rs. 13.1 Bn Cost of sales increased
by 41% to Rs. 10.2 Bn. The Profit Before Tax was Rs. 651 Mn.
FINANCIAL REVIEW

LOLC 2011/12 REPORTS & ACCOUNTS 69
RenewAble eneRgy LOLC’s strategy of entering into the renewable energy sector is in line with its green initiatives
and with this in mind the Group invested into United Dendro through LOLC Eco Solutions Ltd. two years ago.
The Company is in the process of setting up the power plant and planting gliricidia, an essential raw material, to generate
biomass power. The Group’s joint venture company, Hydro Power Free Lanka, is engaged in generating power through
mini-hydros. Total revenue from the sector was Rs. 50 Mn and the loss from operating activities was Rs. 61 Mn with the
operations still being at preliminary levels.
plAntAtIons The Group’s investment in the plantation sector mainly consists of Maturata Plantations Ltd.,
Pussellawa Plantations Ltd., two joint venture companies and associate companies, Agstar Fertilizer PLC and Gal Oya
Plantations Ltd.
The Group investment in Agstar Fertilizer PLC further increased to 33% from 20%, during the year. These investments
were made through LOLC and Browns Investments.
Total revenue to the Group from the sector was Rs. 3 Bn. With the cost of sales of Rs. 1.3 Bn the Profit Before Tax from
the sector was Rs. 222 Mn.
In conclusIon LOLC Group concluded yet another successful year with strong top and bottom line growths.
Financial services business remains the main profit contributor and will remain LOLC’s key focus going forward as well.
LOLC as a conglomerate continues to consolidate its position in the selected growth sectors and is expected to derive
steady performance in the coming years.
FINANCIAL REVIEW

70 LOLC 2011/12 REPORTS & ACCOUNTS
we are strengthened by the oRIX connection
the oRIX connectIon An important formative influence featuring in the history of the LOLC Group has been that
of ORIX Corporation, a multinational conglomerate of Japanese origin specialising in lease finance, with investments in
subsidiaries and partner companies across the world.
About oRIX ORIX Corporation was established in 1964 in Osaka as Orient Leasing Company, a venture in which three
trading companies and five banks became capital partners. A pioneer in leasing, ORIX has remained on the leading edge
of financial innovation since its inception. Its growth strategy, based on strategic and geographical expansion, exhibits
a boldness and scope that sets it apart from other large Japanese financial services firms. In 1989, it changed its name
to ORIX Corporation in order to reflect its increasingly international profile and mark a move beyond leasing into other
financial services. ORIX Corporation is listed on the Tokyo and New York Stock Exchanges.
Today, ORIX enjoys a diversity of revenue streams from operating and financing leases, low margin business, auto
and equipment leasing, insurance, corporate rehabilitation, loan servicing, real-estate and other specialised finance,
investment and retail banking and value added services. It provides innovative, value added financial products and
services to SMEs through a global network spanning 27 countries and regions worldwide. The Group is made up of 811
consolidated subsidiaries and 108 affiliates, with a total of 1,114 offices in Japan and another 270 locations in the United
States, Asia, Oceania, Europe, the Middle East and Africa.
LOLC is regarded as one of the most successful ventures under the ORIX aegis, winning internal awards for ‘outstanding
performance among ORIX companies’ and ‘excellent performance in the overseas operations category’ in the year
under review.
Today, after more than 3 years since its establishment, we believe that LOLC is recognised as a unique company in the
world of conglomerates. In view of the global emergence of huge financial services conglomerates and mega financial
institutes, strong corporate governance systems are other important factors help which sustain growth in shareholder
value. ORIX Corporation maintains a 30% stake in LOLC. Its involvement is further continued by its nominating two
Directors to the LOLC Board. These nominees are senior, ORIX executives.

LOLC 2011/12 REPORTS & ACCOUNTS 71
THE ORIX CONNECTION
The persistent development of new businesses and the pursuit of excellence is what we can expect LOLC to be
maintaining in their management philosophy. We at ORIX have seen this at LOLC which keeps them one step ahead of
the competition, by constantly seizing new business opportunities.
Notwithstanding a sluggish world economy, ORIX Corporation surpassed its targets for the financial year ended
March 2011. The Group continued to focus on its dual management strategy and the realisation of stable operations
and steady growth, through enhanced financial stability and comprehensive risk management.
globAl oRIX netwoRk

72 LOLC 2011/12 REPORTS & ACCOUNTS
Institution type of Facility purpose of Funding value Addition
Organisation of the Petroleum Exporting Countries Fund for International Development (OPEC)
Long-term US$ Loan SME sector financing and development
The Netherlands Development Finance Company (FMO) - Netherland
Long-term US$ Loan/Equity Tier I & II and debt capital for the microfinance company
SME and Microfinance sector financing and development
Environmental policy; Anti-Money Laundering policy
French Development Agency Group (PROPARCO) - France
Long-term US$ Loan Tsunami-affected SME sector financing, SME sector financing and development
Environmental policy; Anti-Money Laundering policy
Deutsche Investitionsund Entwicklungsgesellschaft mbH (DEG) - Germany
Long-term US$ Loan SME sector financing and development
Environmental policy; Anti-Money Laundering policy, Liquidity risk management technology
Belgium Investment Organisation (BIO) - Belgium
Long-term US$ Loan SME sector financing and development
Environmental policy; Anti-Money Laundering policy
Overseas Private Investment Corporation (OPIC)
Risk Sharing Facility with Citi Bank, Colombo
SME sector financing and development
Environmental policy; Anti-Money Laundering policy
United States Agency for International Development (USAID) - USA
Portable Guarantee Scheme
Microfinance sector development in Eastern and Uva Provinces
Environmental policy; Anti-Money Laundering
Finish DevelopmentFinance Company(FINNFUND) - Finland
Long-term US$ Loan SME sector financing and development
Environmental policy; Anti-Money Laundering policy
globAl FundIng pARtneRs
we have strong Relationships with Multiple globally-Renowned Funding partners

LOLC 2011/12 REPORTS & ACCOUNTS 73
Institution type of Facility purpose of Funding value Addition
European Investment Bank (EIB)
Long-term Rupee/Euro Refinancing Scheme
Tsunami-affected SME sector development and support in tourism sector
Environmental policy; Anti-Money Laundering policy
The World Bank Long-term Refinancing Rupee Loan
Refinancing of rural sector renewable energy development
Environmental policy; Anti-Money Laundering policy
Japan Bank forInternational Corporation (JBIC) - Japan
Long-term Rupee Loan/ Refinancing Scheme
Environmental protection/ mitigate & eliminate industrial pollution and waste/energy saving, recycling & resource recovery in industries
Environmental policy; Anti-Money Laundering policy
Asian Development Bank (ADB)
Long-term Rupee Loan/ Refinancing Scheme
SME sector financing and development/Tea smallholders income improvement and development. Development of the plantation sector in enhancing profitability. Improve the living and working conditions of the workforce
Environmental policy; Anti-Money Laundering policy
Export DevelopmentCorporation (EDC) -Canada
Long-term US$ Loan SME Sector financing & Development with Canadian imports
Nippon Export and Investment Insurance (NEXI) - Japan
ING Bank - Japan
Citi - JapanCiti Bank and ING Bank Tokyo being the lenders and Nexi as the guarantor
Long-term US$ Loan SME sector financing and development
Deutsche Gesellschaft für Technische Zusammenarbeit (GTZ) - Germany
Technical assistance for Microfinance
Development of Microfinance Sectors
Promotion of Microfinance sector
GLOBAL FUNDING PARTNERS
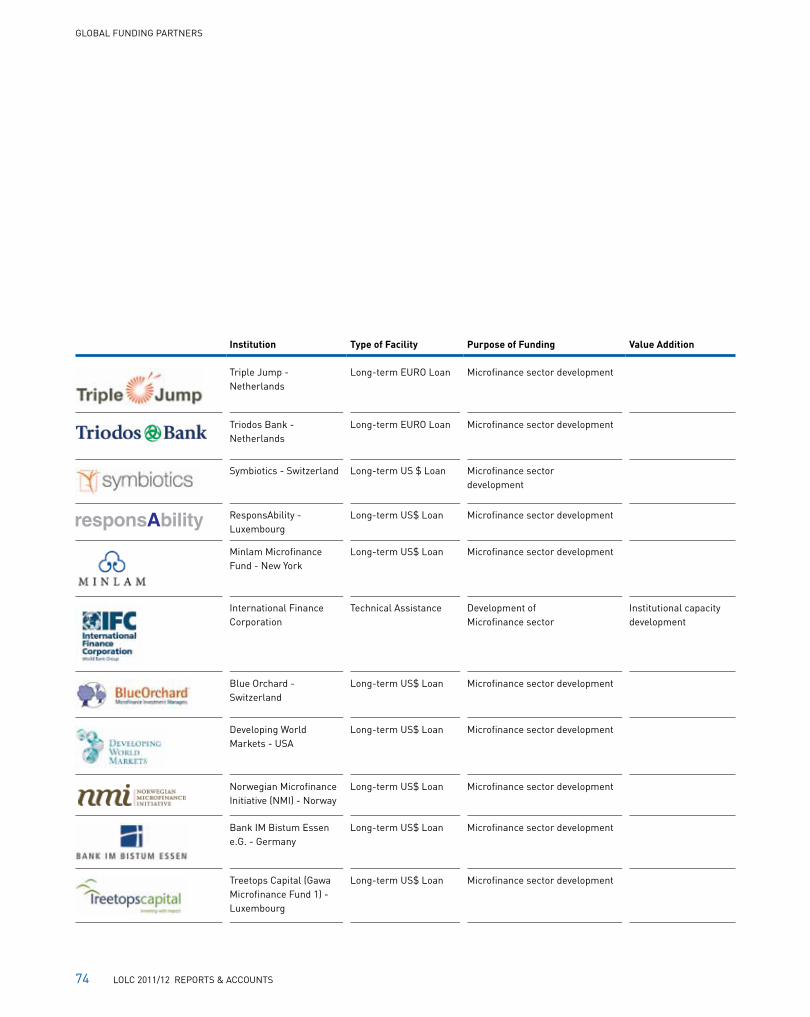
74 LOLC 2011/12 REPORTS & ACCOUNTS
Institution type of Facility purpose of Funding value Addition
Triple Jump - Netherlands
Long-term EURO Loan Microfinance sector development
Triodos Bank - Netherlands
Long-term EURO Loan Microfinance sector development
Symbiotics - Switzerland Long-term US $ Loan Microfinance sector development
ResponsAbility - Luxembourg
Long-term US$ Loan Microfinance sector development
Minlam Microfinance Fund - New York
Long-term US$ Loan Microfinance sector development
International Finance Corporation
Technical Assistance Development of Microfinance sector
Institutional capacity development
Blue Orchard - Switzerland
Long-term US$ Loan Microfinance sector development
Developing World Markets - USA
Long-term US$ Loan Microfinance sector development
Norwegian Microfinance Initiative (NMI) - Norway
Long-term US$ Loan Microfinance sector development
Bank IM Bistum Essen e.G. - Germany
Long-term US$ Loan Microfinance sector development
Treetops Capital (Gawa Microfinance Fund 1) - Luxembourg
Long-term US$ Loan Microfinance sector development
GLOBAL FUNDING PARTNERS

Accounts

76 LOLC 2011/12 REPORTS & ACCOUNTS
Board of directors
Mrs. r.L. NaNayakkaraChairperson
Mrs. k.U. aMarasiNgheExecutive Director
Mr. i.c. NaNayakkaraDeputy Chairman
Mr. r.N. asirwathaMIndependent Director
Mr. w.d.k. JayawardeNaGroup Managing Director/CEO
Mr. h. ichidaNon-Executive Director

LOLC 2011/12 REPORTS & ACCOUNTS 77
BOARd Of diRECTORS
deshaMaNya M.d.d. PierisIndependent Director
Mr. M. kawaNoNon-Executive Director
Mr. r.a. ferNaNdoIndependent Director
Miss c.s. eMMaNUeLCompany Secretary
Mr. r.M. NaNayakkaraNon-Executive Director

78 LOLC 2011/12 REPORTS & ACCOUNTS
Mrs. r. L. NaNayakkara Mrs. Rohini Nanayakkara was appointed to the Board of directors of the Company as an
independent Non-Executive director in August 2004 and assumed duties as Chairperson of LOLC and its subsidiaries.
She holds a second Class BA Honours degree from the University of Peradeniya, Sri Lanka. She also holds a diploma
in french from the Chamber of Commerce, Brussels. She is a fellow of the institute of Management and the institute
of Bankers, Sri Lanka. She was also a Past President of the Sri Lanka Banks Association, Association of Professional
Bankers, a member of the Commission of the University of Colombo, Sri Lanka and of the Task force setup by the
Government for tsunami reconstruction.
She was the first woman executive to join a Commercial Bank, namely Bank of Ceylon, with the rare distinction of
becoming the first woman General Manager/CEO of a Bank in Sri Lanka and the Asian Region.
She was also Chairperson/director of several financial institutions such as the National development Bank, dfCC Bank,
Merchant Bank of Sri Lanka and the first Capital Group of Companies. She has served as director/General Manager/
CEO of one of the largest private banks namely, Seylan Bank PLC.
She is presently the President of United Nations Association of Sri Lanka and also the Chairperson of the Browns
Group of Companies, NdB Venture investments (Pvt) Ltd., Ayojana fund (Pvt) Ltd. and Taprobane investment Group of
Companies. She is also a director of Overseas Realty (Ceylon) PLC, Mireka Homes (Pvt) Ltd., Trans Asia Hotels PLC and
Eastern Merchants PLC.
Mr. i.c. NaNayakkara Mr. ishara Nanayakkara is an astute businessman who holds directorial positions in many
corporates and conglomerates in Sri Lanka.
He ventured into the arena of financial services with the strategic investment in Lanka ORiX Leasing Company PLC
and was appointed to the Board in 2002. Today, as deputy Chairman of LOLC Group, he straddles a conglomerate that
encompasses financial services, agriculture and plantation, leisure, renewable energy, construction, manufacturing
and trading.
Mr. Nanayakkara has extensive exposure in both banking and non-banking financial services sector through his
involvement in Lanka ORiX finance PLC, Commercial Leasing & finance Ltd., and Seylan Bank PLC.
His interest in Microfinance is evident through his recurrent contribution to PRASAC - the largest microfinance company
in Cambodia and in his own initiative, LOLC Micro Credit Ltd. - the only regulated private sector microfinance institution
with foreign equity in Sri Lanka.
BOARd Of diRECTORS

LOLC 2011/12 REPORTS & ACCOUNTS 79
His passion for renewable energy is reflected through the green portfolio of the LOLC Group - comprising hydro power,
solar power, agri waste and biomass - a promising source of alternate energy. The green investments of the LOLC Group
companies are poised to offer their share to the environment.
Mr. Nanayakkara is also conversant in sustainable forestry and plantation through Group companies - Maturata,
Pussellawa and Gal Oya Plantations. The addition of Agstar fertilizers Ltd., a leading agri input provider in the country,
has further enhanced the Group’s contribution to the agriculture and plantation sectors.
The participation in Sierra Constructions Pvt Ltd., one of the largest construction companies in the country is timely,
considering the contribution of the construction sector to the post-war development.
Mr. Nanayakkara is focused on the immense opportunities presented by the leisure sector. With the recent acquisitions
of some of the leading hotels in the Southern coast alongside key properties in the North and East, development plans
are underway for the leisure subsidiaries of LOLC Group - Eden Hotel Lanka PLC, Riverina Hotel PLC, Palm Garden
Hotels PLC, Tropical Villas (Pvt) Ltd. and dickwella Resorts (Pvt) Ltd.
He is also involved at strategic level in Browns Group of Companies, a conglomerate with leading market position in
trade, leisure, manufacturing, consumer appliances and agriculture equipment.
He holds a diploma in Business Accounting from Australia.
Mr. Nanayakkara’s involvement in multifaceted business fields is a fine proof of his perpetual interest on the growth
sectors of the Sri Lankan economy.
Mr. w.d.k. JayawardeNa Mr. Kapila Jayawardena was appointed as the Group Managing director/CEO of LOLC in
June 2007. He holds an MBA in financial Management; is an Associate of the institute of Cost and Executive Accountants
and was awarded fellowship of the institute of Bankers of Sri Lanka (iBSL) in 2006.
He has varied experience in the fields of Banking, Audit, Relationship Management, Corporate finance, Corporate
Banking, investment Banking and Treasury Management. Mr. Jayawardena was appointed as the Chairman of the
Sri Lanka Banks’ Association (SLBA) in 2003/04 and served as President of the American Chamber of Commerce in
Sri Lanka in 2006/07. He served as a director of Lanka Clear, National institute of Business Management (NiBM) and
The institute of Bankers of Sri Lanka (iBSL).
BOARd Of diRECTORS

80 LOLC 2011/12 REPORTS & ACCOUNTS
Mr. Jayawardena was appointed to the financial Sector Reforms Committee (fSRC) by the Prime Minister and was a
member of the finance Sector and Capital Markets Cluster of the National Council of Economic development (NCEd).
He was a key member of the inaugural sovereign rating team and sovereign debt for Sri Lanka appointed by the Governor
of the Central Bank. He was presented with the prestigious Combined Support Group Award by the US Navy for services
rendered after the tsunami in 2005. The Government of Sri Lanka appointed him to the Board of the Sri Lanka fulbright
Commission in 2010.
Mr. Jayawardene was appointed to the Council of the National Chamber of Commerce of Sri Lanka on 27 January 2011.
Mr. Jayawardena has over 27 years experience in all areas of banking, out of which 9 years was in the capacity of CEO/
Country Head Citibank Sri Lanka and the Maldives. He was the first Sri Lankan to be appointed as a Senior Credit Officer
(SCO) by Citibank in Sri Lanka. during his leadership, Citibank Sri Lanka was rated AAA by fitch Ratings in Sri Lanka.
Citibank Sri Lanka was the first foreign Bank to obtain an AAA rating.
Mr. Jayawardena is the Chairman of Lanka ORiX finance PLC, LOLC insurance Ltd., LOLC General insurance Ltd., LOLC
Life insurance Ltd., LOLC Leisure Ltd., LOLC Motors Ltd., LOLC Securities Ltd., Speed italia (Pvt) Ltd., United dendro
Energy (Pvt) Ltd., Palm Garden Hotels PLC, Riverina Hotel PLC, Tropical Villas (Pvt) Ltd., Eden Hotel Lanka PLC and
dickwella Resorts (Pvt) Ltd.
He is also on the Boards of LOLC Micro Credit Ltd. and Commercial Leasing & finance Ltd., which are subsidiaries of
the LOLC Group. Mr Jayawardena is also a director of HdfC Bank.
deshaMaNya M.d.d. Pieris deshamanya dharmasiri Pieris is a Graduate of the University of Ceylon (Peradeniya);
fellow of the Chartered Management institute, UK and has been conferred the degree of doctor of Letters (Honoris
Causa) by the University of Colombo and the title of Honorary Senior fellow by the Postgraduate institute of Medicine.
deshamanya Pieris is an illustrious retired civil servant, who in the course of his distinguished career in the public
service has held several important posts, including that of Secretary to the Prime Minister; Secretary, Ministry of Public
Administration, Provincial Councils and Home Affairs; Secretary, Ministry of Agriculture, food and Co-operatives;
Secretary, Ministry of Education and Higher Education and Chairman and director General of Broadcasting.
He has also acted on several occasions in addition to his duties, in the posts of Secretary to the Ministry of defence and
External Affairs and Secretary to the Ministry of Trade and Shipping.
BOARd Of diRECTORS

LOLC 2011/12 REPORTS & ACCOUNTS 81
He has at various times been the Chairman of the National institute of Education; Chairman - Board of Management of
the Sri Lanka institute of development Administration and Chairman of the Agrarian Research and Training institute.
He has also served on the Governing Councils or Boards of Management of several Universities and Postgraduate institutes.
He has been a director of the People’s Bank, the People’s Merchant Bank and a member of the Rural Credit Advisory
Committee of the Central Bank.
He has served as a member of the National Salaries Commission and as a member of the Presidential Commission on
finance and Banking.
Within the LOLC Group, he has also served as director on the Board of Lanka ORiX finance PLC as well as some
subsidiaries of the LOLC Group. He also serves on the Risk Management Committee, Audit Committee and the
Remuneration Committee, whilst Chairing the Corporate Governance Committee and the Nomination Committee.
Currently, he also serves as deputy Chairman - Mercantile Merchant Bank Ltd. and as a member of the Board of MMBL
Logistics (Pvt) Ltd., MMBL Money Transfer (Pvt) Ltd., Mountain Hawk Express (Pvt) Ltd. and Pathfinder Holdings (Pvt) Ltd.
deshamanya Pieris also serves on the Boards of a few Postgraduate institutes of Universities and is the Chairman
Pro-tem of the S.W.R.d. Bandaranaike National Memorial foundation responsible for the management of the B.M.i.C.H./
B.C.i.S. Complex. He is also currently a member of the Board of the Sri Lanka foundation institute and the Senior
Advisor to the Governing Board of the Regional Centre for Strategic Studies.
Mr. r.a. ferNaNdo Mr. Ravi fernando is a MBA from the University of Colombo and is a fellow of the Chartered
institute of Marketing (UK). He holds a diploma in international Management and completed the Advanced Management
Programme at the iNSEAd Business School in france. He is an Alumni of the University of Cambridge Programme for
Sustainable Leadership having completed the Climate Leadership Programme in 2007 and the Postgraduate Certificate
in Sustainable Business at Cambridge University in 2008 with distinction. Currently, reading for a Master’s in Sustainable
Leadership at Cambridge University at Wolfson College.
He is Operations director - Malaysian Blue Ocean Strategy institute since december 2011.
He was the United Nations Global Compact focal Point for Sri Lanka. He is on the Board of Governors UNOPS - ARU and
on the Boards of Environmental foundation, Ceylon Asset Management Ltd.
BOARd Of diRECTORS

82 LOLC 2011/12 REPORTS & ACCOUNTS
His career with Multinationals - Unilever, Sterling Health international, SmithKline Beecham international and Reckitt
Benckiser covered Africa, Middle East and Asia in CEO/Marketing Management positions. He was the founder CEO
SLiNTEC (Sri Lanka institute of Nanotechnology) in 2008-2010.
in Academia, he was a faculty member of the iNSEAd Advanced Management Programme from 2005-2010 and an
Executive in Residence at the iNSEAd Social innovation Centre from September 2010. He is also a visiting faculty
member at the deusto Business School in Spain and the University of Colombo MBA Programmes. in September 2007,
he won a ‘Global Strategy Leadership Award’ at the World Strategy Summit for his work on Ethical Branding for the
Sri Lankan Apparel and Tea sectors.
Mr. r.M. NaNayakkara Mr. Rajah Nanayakkara is the founder and Executive Chairman of ishara Traders (Pvt)
Ltd., a business which pioneered the import and sale of new and reconditioned motor vehicles. Thirty years later,
this organisation remains an industry leader. He was also the founder Chairman of the Motor Vehicle importers’
Association of Sri Lanka, and continues to play a significant role.
Mr. Nanayakkara is also the Chairman of ishara Plantations (Pvt) Ltd. an Award Winning Estate of Tea and Spices - and
Chairman of ishara Property development, a company which has been involved in construction for the past 18 years.
Mrs. k.U. aMarasiNghe Mrs. Kalsha Amarasinghe holds an Honours degree in Economics. She serves on the
Boards of many of the LOLC Group Companies including the Commercial Leasing Group.
Mr. r.N. asirwathaM Mr. Rajan Asirwatham is a fellow of The institute of Chartered Accountants of Sri Lanka.
He has gained experience as Chairman of the financial Services Stability Committee at the Central Bank of Sri Lanka.
He was a member of the Presidential Commission on Taxation appointed by His Excellency the President.
He joined the Board of directors of the Company on 26 August 2009. He also served as a director of Lanka ORiX finance
PLC, a subsidiary of the LOLC Group.
BOARd Of diRECTORS

LOLC 2011/12 REPORTS & ACCOUNTS 83
Mr. h. ichida Mr. Hideo ichida joined ORiX in 1982. He became the General Manager of the Aircraft Group in the
investment Banking Headquarters in October 2004. After being appointed the deputy Head of the Alternative investment
and development Headquarters in July 2007, Mr. ichida was promoted to deputy Head of the Global Business and
Alternative investment Headquarters in January 2009.
in January 2010, he was made an Executive Officer and was appointed Head of Global Business and Alternative investment
Headquarters in January 2011. in february 2012, he was appointed the Head of Global Business Administrative
Headquarters.
Mr. M. kawaNo Mr. Masaaki Kawano joined ORiX in 1982. He became the Managing director of ORiX Aviation
Systems Ltd., a 100% subsidiary of ORiX, which specialises in aircraft leasing and management services, in August 2000.
After being appointed the Senior Vice-President of Project development and investment Group of ORiX in August 2005, he
became the deputy Managing director and Chief financial Officer of ORiX Leasing Malaysia Berhad in September 2009.
in October 2011, he was made the Managing director of international Business Group. in february 2012, he was
appointed the Acting Head of Global Business and investment Headquarters.
Miss c.s. eMMaNUeL Miss Chrishanthi Emmanuel is a fellow of the institute of Chartered Secretaries and
Administrators - UK and a fellow of the institute of Chartered Corporate Secretaries (Sri Lanka). She is Company
Secretary of several companies within the LOLC Group. She is also Secretary of the Leasing Association of Sri Lanka.
BOARd Of diRECTORS

84 LOLC 2011/12 REPORTS & ACCOUNTS
corPorate MaNageMeNt teaM
BriNdLey de ZyLvaManaging Director/Chief Executive Officer -Lanka ORiX finance PLC
soLoMoN JesUdasoNChief Officer - Marketing Operations - LOLC
rohaN PereraGroup Treasurer
aNUra L. dharMaPreMaCorporate Executive Officer - Recoveries - LOLC
JayaNtha keLegaMa Chief Credit Officer - LOLC
krishaN thiLakaratNeDirector/Chief Executive Officer - Commercial Leasing and finance Ltd.,
Chief Executive Officer - islamic Business Unit and Valuation Unit
coNrad dias Managing Director/Chief Executive Officer - Lanka ORiX information Technologies Ltd.,
Chief Information Officer - LOLC Group
sUNJeevaNi kotakadeNiya Chief Financial Officer - LOLC Group
ravi tissera Director/Chief Executive Officer - LOLC Micro Credit Ltd.

LOLC 2011/12 REPORTS & ACCOUNTS 85
CORPORATE MANAGEMENT TEAM
dhariNi ferNaNdo Chief Operating Officer - LOLC insurance Co. Ltd.
grahaM LawreNceChief Executive Officer - LOLC factors Ltd.,
Chief Officer - Metropolitan Branch Network - LOLC
sharMiNi wickreMasekera Chief Risk Officer - LOLC Group
kithsiri gUNawardeNaChief Operating Officer - LOLC,
Chief Legal Officer - LOLC Group
JacqUeLiNe Lord Chief Human Resources Officer - LOLC Group
sriyaN gUrUsiNghe Managing Director/Chief Executive Officer -LOLC Securities Ltd.
gUNeNdra JayaseNa General Manager - LOLC Ventures Ltd.,
Chief Administration Officer - LOLC Group
ashaN NissaNka Chief Officer - Branch Network - LOLC

86 LOLC 2011/12 REPORTS & ACCOUNTS
CORPORATE MANAGEMENT TEAM
BriNdLey de ZyLva
Managing Director/Chief Executive Officer - Lanka ORIX Finance PLC
Joined in 2003. Counts over 28 years experience in the Non-Banking financial Services Sector. Currently, serves the
industry as a director of the finance Houses Association of Sri Lanka, The financial Ombudsman Sri Lanka (Guarantee)
Ltd. and a Council Member of the Sri Lanka institute of Credit Management.
aNUra L. dharMaPreMa
Corporate Executive Officer - Recoveries - LOLC
Joined in 1998. Counts over 23 years of experience in Recoveries in the financial Services industry. Previously a Senior
Collections Manager of a leading finance company. Anura has been appointed as a director of LOLC Services Ltd.
coNrad dias fCMA (UK), CGMA, MBCS (UK), MBA (University of Leicester)
Managing Director/Chief Executive Officer - Lanka ORIX Information Technologies Ltd., Chief Information Officer - LOLC Group
Joined in 2006. Counts over 21 years of experience in information Technology, Software Engineering, Project Management,
Strategic and investment Planning, finance Management, Corporate Restructuring and Unit Trust& fund Management.
Possesses domain expertise in sectors such as Trading, Banking and finance, Asset Management and Manufacturing.
dhariNi ferNaNdo Chartered insurer, Associate of the Chartered insurance institute of London (ACii)
Chief Operating Officer - LOLC Insurance Co. Ltd.
Joined in december 2010. Counts 19 years of experience in both General and Life insurance. Has work experience with a
number of leading multinational insurance companies in varying roles at senior management level. Wide exposure and
experience in Managing Reinsurance, Property, General Accident and Casualty Lines of Business, Life Assurance and
has been closely involved in the implementation of insurance systems in multinational companies.
kithsiri gUNawardeNa Attorney-at-Law, Postgraduate diploma in Marketing Management (PiM, Sri. J.)
Chief Operating Officer - LOLC, Chief Legal Officer - LOLC Group
Joined in 2004. Counts over 22 years of experience as a Lawyer. Held a number of important positions in the State,
including the office of State Counsel attached to the Attorney General’s department, the Office of director - Legal
of the Securities and Exchange Commission of Sri Lanka and the insurance Board of Sri Lanka and was involved in
setting up the Consumer Affairs Authority as its first director General. Kithsiri holds directorship in number of LOLC
Group Companies.

LOLC 2011/12 REPORTS & ACCOUNTS 87
CORPORATE MANAGEMENT TEAM
gUNeNdra JayaseNa
General Manager - LOLC Ventures Ltd., Chief Administration Officer - LOLC Group
Joined in 2007. Counts over 19 years of experience in Manufacturing, Human Resource Management, Administration,
Renewable Energy and Plantation Management. Gunendra has been appointed as a director in 3 subsidiaries within
the LOLC Group.
soLoMoN JesUdasoN
Chief Officer - Marketing Operations - LOLC
Joined in 1988. Counts over 24 years of experience in the Leasing industry in finance and Marketing Operations.
Currently responsible for the Customer Servicing Operations, which includes Application Processing for finance
Leases, Hire Purchases, Loans, LC facilities, insurance, Savings, fd Operations, RMV Operations, Working Capital
and Microfinance.
JayaNtha keLegaMa BA (Hons.) - University of delhi
Chief Credit Officer - LOLC
Joined in 2005. Counts over 17 years of experience in Leasing, Asset financing, Credit Risk Management and Banking.
Jayantha has been appointed as a director of 4 subsidiaries within the LOLC Group.
sUNJeevaNi kotakadeNiya fCMA (UK), MBA (Col.)
Chief Financial Officer - LOLC Group
Joined in 2005 and counts over 24 years of experience in financial Management and General Management including
financial Accounting, Strategic Planning, insurance, fund Management and Administration, iT Management,
Treasury Management, New Business Set-up, Process Re-engineering, Change Management, ERP implementation
and Project Management.
grahaM LawreNce
Chief Executive Officer - LOLC Factors Ltd., Chief Officer - Metropolitan Branch Network - LOLC
Joined in 1992. Counts over 24 years of experience in the financial Services Sector. Began his career as a Banker and
has evolved to general management having covered Marketing, Credit and Recovery of diverse financial Products,
including Leasing and factoring.

88 LOLC 2011/12 REPORTS & ACCOUNTS
JacqUeLiNe Lord
Chief Human Resources Officer - LOLC Group
Joined in 2006. Counts 21 years of experience in HR in diverse business sectors entailing the development and
execution of human resource strategies, HR business plans and budgeting, setting up of HR systems for new
business ventures whilst engaging in the implementation of strategic initiatives including restructuring automation of
HR processes, etc. External to the Human Resource field, she has gained expertise in the field of Administration/
infrastructure Management.
ashaN NissaNka dipM CiM (UK), Practicing Marketer (SL), MSLiM, MBA
Chief Officer - Branch Network - LOLC
Joined in 1998. Counts over 20 years of experience in Marketing, Credit, Branch Management, Channel development/
Management and General Management in the Banking and finance Sectors.
rohaN Perera MBA, Edith University of Perth, Australia
Group Treasurer
Joined in 2007. Counts over 26 years of experience concentrated on Banking and Corporate Treasuries with expertise
in Treasury Management including Strategic Risk Management and Cash Management. Competent in operational
management with capacity in handling financing of high value projects. Starting his career as a Banker and particularly
in its Treasuries; from thereon moved to Corporate Treasuries. Pioneered the concept of Corporate Treasuries in
Sri Lanka. involved in setting up of the Corporate Treasurers’ Association as its founder President.
krishaN thiLakaratNe AiB (SL)
Director/Chief Executive Officer - Commercial Leasing & Finance Ltd., Chief Executive Officer - Islamic Business Unit of LOFC and Valuation Unit
Joined in 1995. Counts over 22 years of experience in Banking and financial institutions with expertise in Credit, Marketing,
factoring, Leasing and Channel Management. Conceptualised and introduced islamic finance to LOLC in 2007.
CORPORATE MANAGEMENT TEAM

LOLC 2011/12 REPORTS & ACCOUNTS 89
ravi tissera Chartered institute of Marketing - UK
Director/Chief Executive Officer - LOLC Micro Credit Ltd.
Joined in 1993. Has gained experience in SME Banking, Leasing and Microfinance Sectors. Has 20 years experience in
the field of development finance. A development finance Specialist. instrumental in conceptualising and introducing
microfinance to LOLC.
sharMiNi wickreMasekera CiSA, CRiSC
Chief Risk Officer - LOLC Group
Joined in 1983. Counts over 29 years of experience in finance, Accounting, Credit, internal Auditing, information
Systems, Auditing and Governance, Enterprise-wide Risk Management, Business Continuity Management and Business
Process Re-engineering. Member and a Past President of iSACA Sri Lanka Chapter.
sriyaN gUrUsiNghe iCMQ (UK)
Managing Director/Chief Executive Officer - LOLC Securities Ltd.
Joined in 2011. Counts over 19 years of experience in stock broking. Previously director/General Manager at Ceylinco
Stock Brokers for 14 years. Currently serves the industry as the President to Colombo Stock Brokers‘ Association.
CORPORATE MANAGEMENT TEAM

90 LOLC 2011/12 REPORTS & ACCOUNTS
oPeratioNaL MaNageMeNt teaM
sUsaaN BaNdaraHead of Marcom - LOLC Group
MaLLika aBeykooNAGM - Finance Operations - LOLC
saLiya diasAGM - Life (Technical and Operations) - LOiC
gayaNi de siLvaHead of SME Development Finance BU & CRM - LOLC
deePaMaLie aBhayawardaNeAGM - Client Management - LOLC factors/CLC factors
heshaN ferdiNaNdAGM - General (Technical and Operations) - LOiC
chrishaNthi eMMaNUeLCompany Secretary
JUde aNthoNyAGM - Branch Network - CLC
yaNik ferNaNdoAGM - Eastern and Uva Regions - LOLC

LOLC 2011/12 REPORTS & ACCOUNTS 91
OPERATiONAL MANAGEMENT TEAM
JitheNdra gUNatiLakeDGM - Finance Operations - LOLC
rohaNa chaNdrasiriAGM - Branches - LOLC Securities
eNoka JayaMPathyAGM- Finance Corporate - LOLC
chaNdaNa JayaNathDGM - Recoveries - LOLC
isaac devshaNkerAGM - Metro Region - LOLC
NishaNthi kariyawasaMAGM - Finance Corporate - LOLC
rohaNa kUMaraDGM - Micro Finance - LOMC
JayaNtha dharMaPriyaAGM - Legal - LOLC
Mehra MeNdisAGM - Fleet Management - LOLC

92 LOLC 2011/12 REPORTS & ACCOUNTS
OPERATiONAL MANAGEMENT TEAM
MaNish rodrigoAGM - Sales - LOLC Securities
PreethiMaLi soosaithasaNAGM - Client Management - LOLC factors
NihaL weeraPaNaAGM - Legal and Recoveries - CLC
shaNtha rodrigoAGM - Central Region - LOLC
sUJeewa vidaNaPathiraNaAGM - Sales (General Insurance) - LOiC
roshaNi weerasekaraAGM - Marketing Savings and Deposits - LOfC
BahirathaN shaNMUgaLiNgaMAGM - Finance Operations - LOLC
MoNtiNi warNakULaAGM - Western II and North-Western Regions - LOLC

LOLC 2011/12 REPORTS & ACCOUNTS 93
OPERATiONAL MANAGEMENT TEAM
aJit JayeMaNNeConsultant/Director - Projects
LOLC Leisure
MirZa BorhaMManager - dickwella Resort & Spa
tiLak s. seLviahConsultant/General Manager - LOLC Leisure
JayaNtha de siLvaHead of Sales and Marketing
eksath wiJeratNeGeneral Manager - Eden Resort & Spa
cyriL ferNaNdoManager - Tropical Villas
haresh karUNaNayakeManaging Director
LOLC Leisure Ltd.
United dendro Energy (Pvt) Ltd.
sUresh NavaratNaMDeputy General Manager -Plantations

94 LOLC 2011/12 REPORTS & ACCOUNTS
The directors take pleasure in presenting this report, together with the Audited financial Statements and connected
Reports for the year ended 31 March 2012.
PriNciPaL activities As we explained in our Report last year, LOLC, having discussed the issue with the
Central Bank of Sri Lanka, relinquished its leasing license to function primarily as the holding company of the LOLC
Group. LOLC’s focus is now on identifying investment opportunities, monitoring and managing the performance of its
investments, and provision of centralised shared services.
financial services are mainly provided by our subsidiaries, and include conventional and islamic products, (both lending
and savings products) microfinance, factoring, pawning, margin trading financing, insurance and trading in equity and
debt securities.
As a related diversification to these core financial products and services, the Group has a subsidiary providing information
technology services and also a vehicle garage facility.
diversifications into identified growth areas have resulted in investments in hotels and construction as well.
The Statements of the Chairperson, deputy Chairman and Group Managing director/CEO (found on pages 4, 8 and 16
respectively), read together with the Business Review and financial Review found on pages 24 and 56 will provide a
comprehensive review of performance for the year under review and plans for the future.
directorate The directors’ Profiles are given on pages 78 to 83. in terms of Article 88 (i) of the Articles of
Association of the Company, Mr. R.A. fernando retires by rotation and seeks re-election. The Board of directors
recommends his re-election. in terms of Article 95 of the Articles of Association of the Company, Mr. M. Kawano retires
by rotation and seeks re-election. The Board of directors recommends his re-election.
The Company has received notices from shareholders of their intention in terms of Section 210 of the Companies
Act No. 07 of 2007 to propose the re-elections of Mrs. R.L. Nanayakkara, deshamanya M.d.d. Pieris and
Mr. R.M. Nanayakkara, all of whom are over 70 years of age. The Board of directors recommends their re-election.
The aggregate remuneration paid to the directors, is disclosed on page 149.
The other boards on which the directors serve are listed on pages 96 to 101.
aNNUaL rePort of the Board of directors oN the affairs of the coMPaNy

LOLC 2011/12 REPORTS & ACCOUNTS 95
aUditors The Auditors, Ernst & Young retire and offer themselves for reappointment. The Board recommends that
they be reappointed Auditors for the year 2012/13, at a fee to be decided upon by the Board. The fees paid to the Auditors
are disclosed in the Notes to the financial Statements on page 149.
As far as the directors are aware, the Auditors do not have any other relationship with the Company or any of its
subsidiaries nor do they have any interest in contracts with the Company or any of its subsidiaries.
The Auditors’ Report appears on page 119.
goiNg coNcerN The directors believe that the Company is in a position to continue its operations in the
foreseeable future. Accordingly, the financial Statements are prepared on the basis that the Company is a going concern.
coMPLiaNce with Laws aNd regULatioNs The Company is compliant with the Listing Rules of the Colombo
Stock Exchange and the Companies Act No. 07 of 2007.
doNatioNs during the year under review, the Company made donations amounting to Rs. 1.77 Mn (2011 - Rs. 1.5 Mn).
This included a donation of Rs. 1.7 Mn for flood relief in the North and the East.
eveNts occUrriNg after the BaLaNce sheet date Mr. R.N. Asirwatham stepped down as director, citing a
conflict of interest between the Company and an entity on which he serves as Trustee. The Board places on record its
appreciation of Mr. Asirwatham’s contribution to the growth of the Company and the Group.
The last year has been a year of transition to the new structure and seen the listing of two subsidiaries. Consequently,
LOLC is poised to usher its subsidiaries into a new phase, confident that each Group company will be able to achieve
success and enhance shareholder wealth.
On behalf of the Board of directors,
Rohini NanayakkaraChairperson
Kapila JayawardenaGroup Managing Director/CEO
ANNUAL REPORT Of THE BOARd Of diRECTORS ON THE AffAiRS Of THE COMPANY

96 LOLC 2011/12 REPORTS & ACCOUNTS
Name Other directorships held
Mrs. R.L. Nanayakkara chairperson:Lanka ORiX Leasing Company PLCLanka ORiX Project development Ltd.LOLC Micro Credit Ltd.Brown & Company PLCBrowns Group industries Ltd.Browns Group Motels Ltd.Browns Tours (Pvt) Ltd.B.G. Air Services (Pvt) Ltd.C.f.T Engineering Ltd.Engineering Services Ltd.The Hatton Transport and Agency Company Ltd.i.G Browns Rubber industries Ltd.Masons Mixture Ltd.Mutugala Estates Ltd.Pathregalla Estates Ltd.Standard finance (Pvt) Ltd.NdB Venture investments (Pvt) Ltd.Ayojana fund (Pvt) Ltd.Taprobane fund Management Ltd.Taprobane HoldingsTaprobane investment (Pvt) Ltd.Taprobane Plantation Ltd.Hydro Power free Lanka (Pvt) Ltd.AgriSil Holdings Ltd.Browns Termal Engineering (Pvt) Ltd.Browns Healthcare (Pvt) Ltd.Browns Real Estates (Pvt) Ltd.Browns Capital (Pvt) Ltd.Samudra Beach Resort (Pvt) Ltd.Taprobane Securities (Pvt) Ltd.Browns industrial Park (Pvt) Ltd.ARC Capital (Pvt) Ltd.
director:Sifang Lanka (Pvt) Ltd.Sifang Lanka Trading Ltd.Browns Battery (Pvt) Ltd.Browns investments PLC
directors’ decLaratioNs
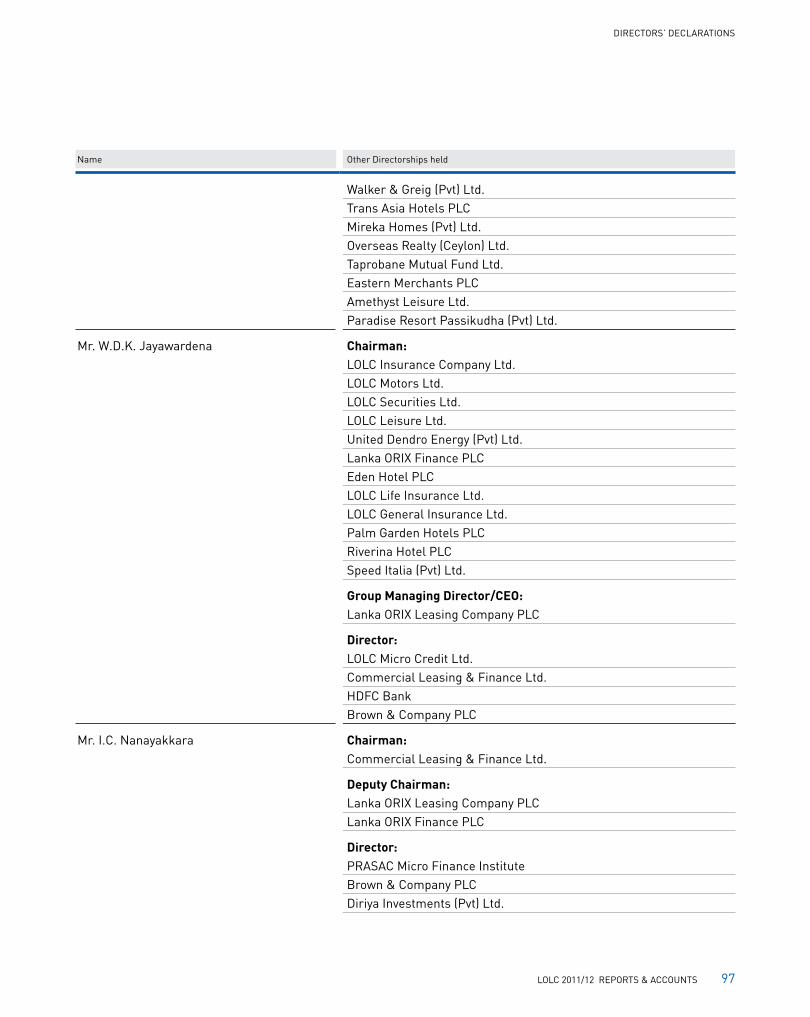
LOLC 2011/12 REPORTS & ACCOUNTS 97
Name Other directorships held
Walker & Greig (Pvt) Ltd.Trans Asia Hotels PLCMireka Homes (Pvt) Ltd.Overseas Realty (Ceylon) Ltd.Taprobane Mutual fund Ltd.Eastern Merchants PLCAmethyst Leisure Ltd.Paradise Resort Passikudha (Pvt) Ltd.
Mr. W.d.K. Jayawardena chairman:LOLC insurance Company Ltd.LOLC Motors Ltd.LOLC Securities Ltd.LOLC Leisure Ltd.United dendro Energy (Pvt) Ltd.Lanka ORiX finance PLC Eden Hotel PLCLOLC Life insurance Ltd.LOLC General insurance Ltd.Palm Garden Hotels PLCRiverina Hotel PLCSpeed italia (Pvt) Ltd.
group Managing director/ceo:Lanka ORiX Leasing Company PLC
director:LOLC Micro Credit Ltd.Commercial Leasing & finance Ltd. HdfC BankBrown & Company PLC
Mr. i.C. Nanayakkara chairman:Commercial Leasing & finance Ltd.
deputy chairman:Lanka ORiX Leasing Company PLCLanka ORiX finance PLC
director:PRASAC Micro finance institute Brown & Company PLCdiriya investments (Pvt) Ltd.
diRECTORS’ dECLARATiONS

98 LOLC 2011/12 REPORTS & ACCOUNTS
Name Other directorships held
Seylan Bank PLC Sierra Constructions Ltd. Agstar fertilizers (Pvt) Ltd. LOLC Micro Credit Ltd. AgriSil Holdings Ltd. free Lanka Capital Holdings (Pvt) Ltd.
Mrs. K.U. Amarasinghe director:Commercial Leasing & finance Ltd.Lanka ORiX finance PLCLanka ORiX Leasing Company PLCLanka ORiX Project development Ltd. LOLC insurance Company Ltd.LOLC Leisure Ltd.LOLC Micro Credit Ltd.LOLC Securities Ltd.United dendro Energy (Pvt) Ltd.Eden Hotel Lanka PLCRiverina Hotels PLCPalm Garden Hotels PLCLOLC Life insurance Ltd.LOLC General insurance Ltd.Speed italia (Pvt) Ltd.Brown & Company PLC
Mr. R.N. Asirwatham director:Lanka ORiX Leasing Company PLC Aitken Spence & Company PLCRoyal Ceramics PLCVallibel One PLCCiC Holdings PLCYarl Hotels (Pvt) Ltd.Rajawella Holdings Ltd.Aitken Spence Hotels PLCBrowns Beach Hotel PLCCeylon Tea Services PLCRenuka Hotels (Pvt) Ltd.Mercantile Merchant Bank Ltd.dialtex industries Ltd.dankotuwa Porcelain PLC
diRECTORS’ dECLARATiONS

LOLC 2011/12 REPORTS & ACCOUNTS 99
Name Other directorships held
Riverina Hotel PLCEden Hotel Lanka PLCCeylon Agro industries Ltd.Lanka House Boats (Pvt) Ltd.
Mr. M.d.d. Pieris director :Mercantile Merchant Bank Ltd.Lanka ORiX Leasing Company PLCfinancial Systems international (Pvt) Ltd.Mercantile financial Brokers Ltd.Mercsair Ltd.MMBL Logistics (Pvt) Ltd.MMBL Money Transfer (Pvt) Ltd.Mountain Hawk Express (Pvt) Ltd.Mountain Hawk (Pvt) Ltd.Pathfinder (Pvt) Ltd.Pathfinder Holdings (Pvt) Ltd.Sanasa Campus Company Ltd.
Mr. R.A. fernando director:Lanka ORiX Leasing Company PLCMalaysian Blue Ocean Strategy institute
Board Member:Environmental foundationCeylon Asset Management Ltd.
Member of the Board of governors:UNOP-ARU
Mr. R.M. Nanayakkara chairman:ishara Traders (Pvt) Ltd.ishara Property developers (Pvt) Ltd.
director:Lanka ORiX Leasing Company PLC
Mr. H. ichida chairman:ORiX (China) investment Company Ltd.ORiX Polska S.A.ORiX Australia Corporation Ltd.
deputy chairman:China Railway Leasing Company Ltd.
diRECTORS’ dECLARATiONS

100 LOLC 2011/12 REPORTS & ACCOUNTS
Name Other directorships held
director:AiRASiA X SdN.BHd.di investment Partners Ltd.ETHOZ Group Ltd.iL&fS Securities Services Ltd.infrastructure Leasing & financial Services Ltd.Lanka ORiX Leasing Company PLCORiX Asia Ltd.ORiX Auto infrastructure Services Ltd.ORiX Auto Leasing Taiwan CorporationORiX Aviation Systems Ltd.ORiX Capital Korea CorporationORiX China CorporationORiX Enterprise CorporationORiX Leasing Malaysia BerhadORiX METRO Leasing and finance CorporationORiX Private Equity Korea CorporationORiX Rentec (Korea) Corporation ORiX Rentec (Tianjin) Corporation ORiX Taiwan CorporationSaudi ORiX Leasing CompanyShanghai Jinheyuan Engineering Construction Company Ltd.Tune Hotels. Com. Ltd.BonifacioLandmark Realty and dev’t. Corporation
vice President:island Reinsurance Corporation
Mr. M. Kawano chairman:OMLf Servicer CorporationORiX Glorious Stars (SPV-AMC), inc.
deputy chairman: ORiX Polska S.A.
director/secretary:Alioth Shipping CorporationMarion Corporation
director/treasurer:Anson Steamship inc.Bartlett Marine CorporationBelfry Ocean inc.
diRECTORS’ dECLARATiONS

LOLC 2011/12 REPORTS & ACCOUNTS 101
Name Other directorships held
Berlian Steamship inc.Botany Shipping Ltd.Brave Point Shipping CorporationCanble Shipping CorporationCherub Shipping CorporationChilin Marine CorporationEquator Shipping inc.famous Steamship S.A.fANTASY SHiPPiNG S.A.fractal Marine Corporationfuture Shipping S.A.Great Concert Navigation CorporationHarper-Line Shipping Corporationichiki Navigation inc.Lealty Marine CorporationMascot Ocean CorporationNabob Shipping CorporationNew Roman CorporationNew Wing Shipping S.A.Noel Shipping CorporationORiX fortune inc.ORiX Treasure inc.Osaka Steamship inc.Panther Navigation inc.Rabell Navigation CorporationRejoice Trans S.A.Ringle Steamship inc.Whale Line S.A.Younex Enterprises CorporationZeeman Marine Corp.
director: indochina Capital CorporationLanka ORiX Leasing Company PLCORiX Australia Corporation Ltd.ORiX Hotels international Private Ltd. ORiX Leasing Singapore Ltd.ORiX Rentec (Singapore) Pte. Ltd. Semarak Capital Sdn. Bhd.Thai incinerate Service Company Ltd.Thai ORiX Leasing Company Ltd.
diRECTORS’ dECLARATiONS

102 LOLC 2011/12 REPORTS & ACCOUNTS
LOLC has today developed from a pioneering leasing company to a financial services provider, from a single entity to
the holding company of a diversified conglomerate. Each change has brought new challenges, including the need for
new processes and controls to facilitate operations and enhance reporting.
LOLC has always endeavoured to instill the essence of good corporate governance throughout the Company and
eventually the Group, so that transparency and disclosure, adherence to procedure and a recognition of the need
for ethical and sustainable business practices are principles which flow right through the Company. The difference
is that controls and processes are not seen as ends in themselves, but as means to facilitate good governance.
Thus, procedures which are no longer viable in the changing business environment can be suitably amended.
This attitude encourages a governance mindset, as procedures can be modified and complied with, while still ensuring
governance and control, instead of creating an environment where adherence frustrates business while not meeting
any governance purpose.
The Company is compliant with all requirements of the Listing Rules of the Colombo Stock Exchange.
the Board of directors The Board comprised 10 directors, of whom 7 were Non-Executive, including the
Chairperson. This meets the recommended best practice of having a majority of Non-Executive directors. Of the
Non-Executive directors, 3 were independent. The directors were of varied disciplines (including finance, administration,
and sustainable business) and their collective experience and expertise is of benefit to the Company, even more so now,
as it expands its role to that of the holding company of a diversified conglomerate. The names of the directors and their
profiles are given on pages 78 to 83.
The roles of Chairperson and Chief Executive Officer are separate, also a recommended best practice. The Non-Executive
Chairperson ensures that the Board receives the information needed for them to monitor performance and compliance,
including where necessary independent professional advice. The Managing director, who also functions as the Group
CEO reports to the Board on all operational aspects.
corPorate goverNaNce

LOLC 2011/12 REPORTS & ACCOUNTS 103
Mr. Ravi fernando and deshamanya dharmasiri Pieris have both served as directors of the Company for over 9 years.
The Board is of the view that, despite this period of service, these directors remain independent. Mr. fernando’s
multifaceted experience, spanning both local and multinational companies, enables him to contribute meaningfully to
the diverse interests which now make up the LOLC Group. Mr. Pieris, who has many years of distinguished service in
several areas of both Government and private commerce, brings to the Group unmatched expertise in administration,
controls and procedures.
Board MeetiNgs Board Meetings are held monthly, and Board Papers are sent out in advance, to enable a
meaningful discussion at the Meeting. in selected instances, issues and/or documents are first studied by the relevant
Board Subcommittees, which then make recommendations to the Board. All directors can request the inclusion of
Board meeting agenda items, or additional information.
Board sUBcoMMittees The Board Subcommittees are listed on page 105 and the Reports of the subcommittees
are found on pages 107 to 110.
groUP strUctUre As the Group began to expand, the Board reviewed the operations and a decision was taken to
centralise support services. This ensured that procedures and controls were standardised across all Group companies.
Thus Group companies could share lessons learnt and experiences, and immediately commence operations at a high
level, rather than go through repetitive cycles of learning. The benefits of innovation and creativity are similarly shared.
All Group companies can take advantage of economies of scale, irrespective of their individual sizes.
As with any other organism, the health of the whole is enhanced by the health of the individual unit. The frequent
Management Meetings, chaired by the Group Md/CEO, ensure that issues between operational units and service units
are discussed and resolved to the satisfaction of all. The quarterly iT Steering Committee Meetings, chaired by the
Group Chairperson ensure that the many demands on the Group’s iT subsidiary are prioritised and their resources
optimised. issues raised at these Committee Meetings also facilitate risk identification and mitigation, streamlining of
processes and management of costs.
CORPORATE GOVERNANCE

104 LOLC 2011/12 REPORTS & ACCOUNTS
Taking cognizance of this symbiosis, at the monthly Board Meetings the Group Managing director/CEO makes a
comprehensive presentation which covers the performance of the core financial services Group and not merely the
Company. Similarly, significant events or decisions affecting these subsidiaries are reported on, discussed and noted.
in this way, the entire group benefits from the deliberations of the Board of the holding company.
iNterNaL coNtroLs The Enterprise Risk Management (ERM) division has been tasked with auditing the procedures
and processes of all business and service units, including information Technology. The connected review of controls
benefits all Group companies. The ERM reports are discussed by the audit committees of the relevant companies,
and certain reports are taken up at the holding company level, to ensure that corrective measures are replicated within
every Group company.
The Board takes pride in the fact that the ERM practices were recognised by the Open Compliance and Ethics Group
(OCEG), which selected LOLC as one of the 4 recipients of its GRC (Governance, Risk Management and Compliance)
award, which was presented at its convention held in Washington dC, United Sates of America. This is the first time this
award had been presented to an Asian company.
reLatioNshiP with stakehoLders LOLC was begun to provide a service to the people of Sri Lanka - leasing
enabled businessmen to prosper by providing access to resources, without the need for ownership of those resources. Each
new financial product of the Group, from factoring to microfinancing to savings products for migrant workers overseas,
has been developed with the mission of helping people reach their full potential, and enjoy the fruit of their labour.
The LOLC Group acknowledges the importance of every one of its stakeholders, be they customer or creditor, supplier
or shareholder, employee or entrepreneur, regulator or financier. The Group was delighted to receive the ‘Excellent
Performance in the Overseas Operations Category’ for the financial Year 2011/12, awarded by ORiX Corporation.
However, it also believes that the yearly improvement in profit, the increase in business volumes and the growth of the
Group is an award by the stakeholders and a testimony to the strength and soundness of the Group.
CORPORATE GOVERNANCE

LOLC 2011/12 REPORTS & ACCOUNTS 105
CORPORATE GOVERNANCE
coMPositioN of Board sUBcoMMittees
Name Executive Committee(dissolved
w.e.f. 1 March 2012)
Audit Committee
RemunerationCommittee
Nomination Committee
Corporate GovernanceCommittee
iT Steering Committee
integrated Risk
Management Committee
Mrs. R.L. NanayakkaraChairperson
Mr. i.C. NanayakkaraDeputy Chairman
Mr. W.d.K. JayawardenaGroup Managing Director/CEO
Mrs. K.U. AmarasingheExecutive Director
deshamanya M.d.d. PierisIndependent Director
Mr. R.N. Asirwatham*Independent Director
Mr. R.A. fernandoIndependent Director
Key Management Personnel
Mrs. S. Wickremasekera Chief Risk Officer
Mrs. S. Kotakadeniya Chief Financial Officer
Mr. C. dias Chief Information Officer
Mr. R. Perera Group Treasurer
Mr. J. Kelegama Chief Credit Officer
* Resigned w.e.f. 10 May 2012

106 LOLC 2011/12 REPORTS & ACCOUNTS
CORPORATE GOVERNANCE
atteNdaNce at MeetiNgs
BoardMeetings
Executive Committee
•
Audit Committee
RemunerationCommittee
Nomination Committee
Corporate GovernanceCommittee
integrated Risk
Management Committee
iT Steering Committee
No. of Meetings 12 02 13 01 00 05 04 03director Classification
Mrs. R.L. Nanayakkara* Non-Executive 12 2 12 N/A N/A 4 1 3
Mr. i.C. Nanayakkara Executive 9 1 2 1 0 N/A 0 N/A
Mr. W.d.K. Jayawardena Executive 10 1 11 N/A N/A 2 2 1
Mrs. K.U. Amarasinghe Executive 11 2 11 N/A N/A 2 3 3
Mr. R.N. Asirwatham** independent 11 N/A 12 1 0 4 4 N/A
deshamanya M.d.d. Pieris independent 10 1 12 1 0 4 4 N/A
Mr. R.A. fernando independent 9 N/A 5 1 0 2 N/A N/A
Mr. R.M. Nanayakkara - by his alternate Mr. i.C. Nanayakkara
Non-Executive 9 N/A N/A N/A N/A N/A N/A N/A
Mr. K. Okimoto - by his alternate Mr. T. Yamazaki
Non-Executive 9 N/A N/A N/A N/A N/A N/A N/A
Mr. H. ichida - by his alternate Mr. T. Yamazaki/ Mr. H. Umetani
Non-Executive 9 N/A N/A N/A N/A N/A N/A N/A
* - Chairman of the Board ** - Chairman of the Committee• - The Executive Committee was dissolved with effect from 1 March 2012

LOLC 2011/12 REPORTS & ACCOUNTS 107
The Remuneration Committee comprises three independent directors.
The Committee met once in the year 2011/12. The Committee reviewed the practices and policies with regard to
remuneration of employees, taking into consideration performance, employee expectations and employee retention.
The Committee satisfied itself that the practices and policies are transparent and appropriate.
R.A. FernandoChairman - Remuneration Committee
rePort of the reMUNeratioN coMMittee
The Nomination Committee comprises three independent directors and the Executive deputy Chairman.
Consequent to the decision to move from being a financial services provider to being the holding company of a diversified
conglomerate, LOLC was no longer required to comply with the directions of the Central Bank of Sri Lanka (CBSL) with
regard to the number of directors on the Board. The Board has its full complement of ten directors, and there is therefore
no vacancy on the Board. There is also no necessity to change the Board composition to comply with CBSL directions.
The Committee has therefore worked closely with the Board to further refine the directors‘ self-evaluations.
The Committee, along with the rest of the Board, is satisfied that the independent directors remain independent, despite
having served for over 9 years.
Deshamanya M.D.D. Pieris Chairman - Nomination Committee
rePort of the NoMiNatioN coMMittee

108 LOLC 2011/12 REPORTS & ACCOUNTS
The iRMC is a requirement of the Central Bank of Sri Lanka. As the Company has relinquished its leasing license,
this is no longer a requirement for LOLC. However, the Committee decided to continue to function, as identification and
management of risk is a vital need in the dynamic environment in which the Company operates.
The Committee continued to meet quarterly. it comprised two independent directors, the Managing director and Senior
Managers overseeing areas identified as critical to risk management and mitigation. The Chairman and Executive
directors attend by invitation.
The identified risks were discussed, together with possible mitigation methods. The Committee’s composition ensures a
cross functional contribution to the discussion, and facilitates a well-rounded and practical approach to managing risk.
R.N. AsirwathamChairman - Integrated Risk Management Committee
rePort of the iNtegrated risk MaNageMeNt coMMittee (irMc)

LOLC 2011/12 REPORTS & ACCOUNTS 109
The Corporate Governance Committee comprises three independent directors and the Chairperson. There is no
statutory requirement for this Committee, but it was established to support the Board in its wish to strengthen Corporate
Governance for the benefit of all stakeholders.
The Committee reviewed the Board subcommittees and made recommendations, following which the Executive
Committee (Ex Co) was dissolved. This was viewed as necessary, in view of the Company moving towards functioning
more as a holding company and less as an operational company. in its place, committees were established to approve
routine administration requirements or credit facilities respectively, with authority being delegated to the Group
Managing director/CEO to chair these committees.
The Committee also reviewed the independence of the directors and made recommendations to the Board.
The Committee met four times during the year 2011/12.
Deshamanya M.D.D. PierisChairman - Corporate Governance Committee
corPorate goverNaNce coMMittee rePort

110 LOLC 2011/12 REPORTS & ACCOUNTS
The Audit Committee comprised three independent directors, and was chaired by a director with qualifications and
experience in accounting and auditing. The Committee met 11 times during the financial year 2011/12.
The Committee reviewed the interim financials and the Audited financial Statements prior to their release to the
Colombo Stock Exchange. The External Auditors were invited to these meetings. The Committee also reviewed
reports submitted by the Enterprise Risk Management division. These reports covered operational issues, processes
and controls.
At the invitation of the Committee, the Chairman of the Company, the Managing director and the Chief financial Officer
were present at meetings, together with the Chief Risk Officer, the Chief HR Officer and the Chief information Officer.
The Committee had a detailed agenda which ensured that critical areas are reviewed annually, in addition to the ones
mentioned above. There was also constant follow-up on issues raised at previous meetings, to ensure that decisions
have been implemented and all necessary corrective/proactive action taken.
The Audit Committee was satisfied that the Auditors, Ernst & Young are independent. This determination is based on
the following:
a. Period of service - Ernst & Young were appointed Auditors, with shareholder approval, in June 2008.
b. Fees and services - neither the fees paid nor the non-audit services rendered are of sufficient quantum to impair their independence.
Accordingly, the Audit Committee has recommended to the Board of directors that Ernst & Young be reappointed as
Auditors for the financial year ending 31 March 2013. The reappointment of the Audit firm and the authorising of the
Board to negotiate its fee will be subject to the approval of the shareholders at the Annual General Meeting to be held
on 18 September 2012.
R.N. AsirwathamChairman - Audit Committee
aUdit coMMittee rePort

LOLC 2011/12 REPORTS & ACCOUNTS 111
risk MaNageMeNt with a visioN
With the vision of creating an organisational culture where protection, assurance, reliability, accountability, transparency
and confidentiality are treasured and lasting values, LOLC considers all employees, including the Board of directors,
as risk managers within the scope of their respective functions.
LOLC defines risk as any circumstance or event that might hinder the achievement of stated corporate objectives.
This definition helps all members of the LOLC team to focus on identifying material, minor or even isolated process level
risks. it also allows us to identify potential issues at source, enabling us to formulate controls and strategies to align
risk with our risk appetite.
the risk MaNageMeNt fraMework The LOLC risk management framework permits active synergies between
risk management, compliance, internal audit and information systems audit functions under the umbrella of the Group
Enterprise Risk Management (ERM) division, ensuring that risk is a consideration with respect to all operational functions.
Action is guided by the Group risk management policy. dedicated officers are appointed within the risk management
function for each subsidiary in which the Parent Company has a material stake. These officers report to the Chief Risk
Officer (CRO). The ERM process retains total independence from other business functions, with the CRO reporting
to the Chairperson of the Board through the integrated Risk Management Committees (iRMC) of every major Group
company. These Committees are constituted from an appropriate mix of independent directors, Executive directors and
Management Personnel.
Each iRMC evaluates the identified risks that are relevant to it. Group level risks are escalated to the Parent Company
iRMC and the Board. The process is simplified by adopting common risk policies across the Group, retaining uniformity
and avoiding policy conflict. Risk information is held centrally at Group level, with reporting lines to Group ERM from
each subsidiary. Additionally, every regulated subsidiary has its own appointed compliance officer for better focus on the
diverse regulatory compliance requirements of each. The Group ERM division enjoys unrestricted access and auditing
rights over all major subsidiaries of the Group.

112 LOLC 2011/12 REPORTS & ACCOUNTS
RiSK MANAGEMENT WiTH A ViSiON
despite our broad presence at grass roots level across Sri Lanka, support services of the Group are managed centrally.
in order to capture vital risk information, reporting lines run to Group ERM from every business unit and branch. Tactical
level operations are governed by well-defined policies and procedures, which once approved by the Board are owned
and protected by Group ERM. Any changes to operating policy or procedures are reviewed for adequacy with respect to
internal controls. internal Audit reviews compliance and the currency of rules when a function is audited.
Accountability and a focus on supervisory functions are maintained by the annual issue, by the heads of each business
unit, of certificates testifying compliance with internal controls, with all material exceptions reported. internal audit also
conducts an annual compliance test on key and material controls relating to financial reporting.
ProPagatiNg awareNess aNd UNderstaNdiNg of risk All Group employees undergo training on risk
management at induction, while training programmes on risks relating to specific functions are conducted periodically
by Group ERM. Should internal audit report a lack of awareness or increased frequency of non-compliance in a certain
function or business unit, Group ERM mandates awareness building and training sessions, which are conducted in
collaboration with the respective unit and the Human Resources division.
how we ideNtify risk The inherent risk of risk management lies in not identifying a particular risk. LOLC
Group practises a three-tier risk identification methodology to help minimise this danger. The three tiers consist of
separate assessments by the risk owner, by stakeholders and finally an independent assessment by LOLC Group ERM.
This process is augmented by a “whistle-blowers’ hotline” whose users enjoy full privacy and confidentiality.
Customers are often the first to detect irregular practices or process efficiency bottlenecks, and they are encouraged
to report them to Group ERM using our customer feedback line. information received is acted upon and followed up
until resolution. This practice has greatly helped us in streamlining our processes and procedures, increasing both
effectiveness and control.
Supplementing the operational monitoring mechanisms established by business and service units of the Group are
compulsory reporting requirements on risk for each unit, as well as field audits by the Group’s internal Auditors.
Anti-money laundering precautions and ‘know your customer’ rules are embedded in all contract and transaction
processes, with centralised monitoring by Group compliance officers.

LOLC 2011/12 REPORTS & ACCOUNTS 113
defeNce-iN-dePth LOLC takes a defence-in-depth approach in responding to risk. Within the policy and procedural
framework, the first line of defence relies on the risk awareness, skills and knowledge of line staff with respect to their
particular functions. The second line of defence is formed by management supervision, embedded information systems
and application controls. Risk detection and response may also result from reviews conducted by the internal monitoring
functions of each business unit as well as from periodic internal and iT audits. finally, Group ERM has the mandate and
capacity to conduct forensic audits and investigations, including the integrity of our iT platform, if the need arises.
internal audit adopts a four-step follow-up process on action to mitigate risk. it consists of:
1. Confirmation by the risk owner that the weakness identified by internal audit has been rectified.
2. follow up review on the effectiveness of rectification by internal audit.
3. Control self-assessment by the risk owner, under the guidance of Group ERM.
4. follow-up by internal audit based on this self-assessment.
caPacity BUiLdiNg aNd qUaLity MaNageMeNt for erM staff ERM staff possess a diverse array of knowledge
and skills covering the entire gamut of operations of the LOLC Group. They are kept updated through continuous training
and education. A broad and comprehensive educational resource base, managed by Group ERM, is in frequent use by
risk officers as well as internal Auditors.
reachiNg for exceLLeNce in this uncertain world, the complete elimination of risk is impossible. However,
we believe there is no limit to continuous improvement in effective risk management. All our risk management
processes are continually reviewed and, wherever possible, improved. internal quality management is strengthened by
a rating system adopted to monitor the quality of assignments handled by department staff, and feedback received from
supervisors‘ drives further improvement.
risk ProfiLe of LoLc This is a highlevel categorisation based on perceived risk. The table below assigns risk
values based on a numerical scale:
Risk Rating Score
Very Low 1Low 2Medium 3High 4Very High 5
RiSK MANAGEMENT WiTH A ViSiON

114 LOLC 2011/12 REPORTS & ACCOUNTS
RiSK MANAGEMENT WiTH A ViSiON

LOLC 2011/12 REPORTS & ACCOUNTS 115
RiSK MANAGEMENT WiTH A ViSiON

116 LOLC 2011/12 REPORTS & ACCOUNTS
fUtUre chaLLeNges The volatile global business environment, a variable macroeconomic outlook and the Group’s
exposure to multiple industry sectors call for aggressive and effective risk mitigation strategies. This has necessitated
changes in our risk management approach and the adjustment of mitigation mechanisms to meet various regulatory
and business requirements. it has also created a need for robust automation to strengthen our processes.
gLoBaL recogNitioN LOLC Group’s institutionalisation of good governance, risk management and compliance
practices was recognised in the year under review with a global achievement award from the Open Compliance and
Ethics Group (OCEG), USA. LOLC is the first Asian business entity to receive this award.
in her congratulatory message to LOLC, Ms. Carole Switzer, President of OCEG observes: “i am writing to extend my
personal congratulations to LOLC, as a recipient of the 2012 GRC Achievement Award from OCEG. The award recognises
the great strides that companies, Government agencies and other organisations have made in improving and integrating
their approaches to governance, risk management and compliance, to achieve principled performance”.
Although elated, we will not rest on our laurels. We are already moving to further improve and consolidate our
internationally-acclaimed risk management practices.
RiSK MANAGEMENT WiTH A ViSiON

LOLC 2011/12 REPORTS & ACCOUNTS 117
The directors confirm that the Company’s financial Statements for the year ended 31 March 2012, are prepared and
presented in conformity with the requirements of the Sri Lanka Accounting Standards, the Regulations and directions
of the Central Bank of Sri Lanka, the Listing Rules of the Colombo Stock Exchange, the finance Leasing Act No. 56 of
2000 and the Companies Act No. 07 of 2007. They believe that the financial Statements present a true and fair view of
the state of the affairs of the Company and of the Group as at the end of the financial year.
The directors also accept responsibility for the integrity and accuracy of the financial Statements presented and confirm
that appropriate accounting policies have been selected and applied consistently and reasonable and prudent judgment
has been exercised so as to accurately report transactions.
The directors have taken reasonable steps to safeguard the assets of the Company, to prevent, deter and detect fraud,
and to ensure the integrity, accuracy and safeguarding of operational and financial records.
The directors confirm that to the best of their knowledge, all statutory payments due in respect of the Company and its
subsidiaries as at the Balance Sheet date have been paid for, or where relevant, provided for.
The directors believe that the Company is in a position to continue its operations in the foreseeable future. Accordingly,
the financial Statements are prepared on the basis that the Company is a going concern.
The External Auditors, Ernst & Young, were provided with the opportunity to make appropriate inspections of financial
records, minutes and other documents to enable them to form an opinion of the financial Statements. The Report of
the Auditors is set out on page 119.
Kapila JayawardenaGroup Managing Director/CEO
20 June 2012
directors’ resPoNsiBiLity for fiNaNciaL rePortiNg

118 LOLC 2011/12 REPORTS & ACCOUNTS
The financial Statements are prepared in compliance with the Sri Lanka Accounting Standards issued by
The institute of Chartered Accountants of Sri Lanka and the requirements of the Companies Act No. 07 of 2007 and
any other applicable statutes to the extent applicable to the Company. There are no departures from the prescribed
accounting standards in their adoption. The accounting policies used in the preparation of the financial Statements are
appropriate and are consistently applied.
The Board of directors and the management of your Company accept responsibility for the integrity and objectivity of
these financial Statements. The estimates and judgments relating to the financial Statements were made on a prudent
and reasonable basis, in order that the financial Statements reflect in a true and fair manner, the form and substance
of transactions and reasonably present the Company’s state of affairs. To ensure this, the Company has taken proper
and sufficient care in installing a system of internal controls and accounting records, for safeguarding assets and for
preventing and detecting frauds as well as other irregularities, which is reviewed, evaluated and updated on an ongoing
basis. Our internal Auditors have conducted periodic audits to provide reasonable assurance that the established
policies and procedures of the Company were consistently followed. However, there are inherent limitations that should
be recognised in weighing the assurances provided by any system of internal controls and accounting.
The financial Statements were audited by Ernst & Young, Chartered Accountants, the Company’s External Auditors.
The Audit Committee of your Company meets periodically with the internal Auditors and the External Auditors to review
the manner in which these Auditors are performing their responsibilities and to discuss auditing, internal control and
financial reporting issues. To ensure complete independence, the External Auditors and the internal Auditors have full
and free access to the members of the Audit Committee to discuss any matter of substance.
it is also declared and confirmed that the Company has complied with and ensured compliance by the Auditor with the
guidelines for the audit of listed companies where mandatory compliance is required. it is further confirmed that all the
other guidelines have been complied with.
Kapila Jayawardena
Group Managing Director/CEO
Sunjeevani KotakadeniyaChief Financial Officer
LOLC Group
20 June 2012
chief execUtive officer’s aNd chief fiNaNciaL officer’s resPoNsiBiLity stateMeNt

LOLC 2011/12 REPORTS & ACCOUNTS 119
E YRNST& OUNG201 De Saram PlaceP.O. Box 101Colombo 10Sri Lanka
Chartered Accountants
TelFax Gen
: (0) 11 2463500: (0) 11 2697369: (0) 11 5578180
Independent AudItor’s report
HMAJ/RM/BV/DM
to tHe sHAreHoLders oF LAnKA orIX LeAsInG CoMpAnY pLC
Report on the Financial StatementsWe have audited the accompanying financial statements of Lanka ORIX Leasing Company PLC (“Company”) and the consolidated financial statements of the Company and its subsidiaries (“Group”) which comprise the balance sheets as at 31 March 2012, and the income statements, statements of changes in equity and cash flow statements for the year then ended, and a summary of significant accounting policies and other explanatory notes.
Management’s Responsibility for the Financial StatementsManagement is responsible for the preparation and fair presentation of these financial statements in accordance with Sri Lanka Accounting Standards. This responsibility includes: designing, implementing and maintaining internal control relevant to the preparation and fair presentation of financial statements that are free from material misstatement, whether due to fraud or error; selecting and applying appropriate accounting policies; and making accounting estimates that are reasonable in the circumstances.
Scope of Audit and Basis of OpinionOur responsibility is to express an opinion on these financial statements based on our audit. We conducted our audit in accordance with Sri Lanka Auditing Standards. Those standards require that we plan and perform the audit to obtain reasonable assurance whether the financial statements are free from material misstatement.
An audit includes examining, on a test basis, evidence supporting the amounts and disclosures in the financial statements. An audit also includes assessing the accounting policies used and significant estimates made by management, as well as evaluating the overall financial statement presentation.
We have obtained all the information and explanations which to the best of our knowledge and belief were necessary for the purposes of our audit. We therefore believe that our audit provides a reasonable basis for our opinion.
OpinionIn our opinion, so far as appears from our examination, the Company maintained proper accounting records for the year ended 31 March 2012 and the financial statements give a true and fair view of the Company’s state of affairs as at 31 March 2012 and its profit and cash flows for the year then ended in accordance with Sri Lanka Accounting Standards.
In our opinion, the consolidated financial statements give a true and fair view of the state of affairs as at 31 March 2012 and the profit and cash flows for the year then ended, in accordance with Sri Lanka Accounting Standards, of the Company and its subsidiaries dealt with thereby, so far as concerns the shareholders of the Company.
Report on Other Legal and Regulatory RequirementsIn our opinion, these financial statements also comply with the requirements of Sections 151(2) and 153(2) to 153(7) of the Companies Act No. 07 of 2007.
25 June 2012Colombo.

120 LOLC 2011/12 REPORTS & ACCOUNTS
BALAnCe sHeet
Group Company
As at 31 March 2012 2011 2012 2011
Note (Rs.) (Rs.) (Rs.) (Rs.)
AssetsCash and cash equivalents 14.1 4,444,709,429 4,659,100,494 250,011,865 392,011,825
Short-term investments 15 158,676,105 196,698,996 31,676,105 53,754,799
Investment in term deposits 16 1,192,812,399 2,456,187,694 149,251,925 221,601,049
Other investment securities 17 13,559,263,441 14,456,096,680 3,519,958,963 3,564,192,696
Rentals receivable on lease assets, hire purchase and operating leases 18.4 40,140,654,684 28,936,756,777 27,884,646 1,712,647,297
Advances and other loans 19 39,947,438,011 28,713,568,515 5,616,432,725 8,554,924,885
Instalment sales 20 157,319,578 766,007,123 157,319,576 766,007,123
Premium receivables 21 239,616,479 – – –
Inventories 22 3,226,719,371 1,599,184,190 – 1,750,000
Trade and other current assets 23 9,428,802,502 5,637,082,628 11,819,408,501 1,816,916,447
Prepaid lease rentals 24 243,943,630 305,535,859 – –
Investment properties 25 4,345,970,500 439,649,668 412,500,000 247,500,000
Real estate stocks 16,449,276 16,261,676 – –
Timber and rubber stocks 26 3,777,671,171 3,778,893,130 – –
Mature and immature plantations 27 1,692,000,390 1,615,524,496 – –
Investments in joint venture companies 28 – – 14,298,187 136,384,471
Investments in equity accounted investees 29 3,552,556,908 2,759,078,715 1,544,757,723 1,211,335,904
Investments in subsidiary companies 30 – – 9,978,045,185 8,944,162,094
Deferred tax assets 31.1 347,479,485 434,654,001 145,709,757 185,030,360
Goodwill on acquisition 32.1 421,627,920 331,713,877 – –
Other intangible assets 32.2 223,117,992 239,531,119 47,677,489 61,011,327
Property, plant and equipment 33 18,170,909,670 14,472,006,950 2,947,114,811 3,283,496,368
Total assets 145,287,738,941 111,813,532,588 36,662,047,458 31,152,726,645

LOLC 2011/12 REPORTS & ACCOUNTS 121
BALANCE SHEET
Group Company
As at 31 March 2012 2011 2012 2011
Note (Rs.) (Rs.) (Rs.) (Rs.)
Liabilities and equity
Liabilities
Bank overdrafts 14.2 4,014,222,740 4,029,204,315 1,603,899,113 2,094,424,623
Deposits from customers 34 25,196,686,539 16,348,135,523 – –
Interest-bearing borrowings 35 62,060,524,584 46,784,293,787 22,290,356,355 20,284,843,757
Insurance provision - Life 36.1 47,570,657 – – –
Insurance provision - General 36.2 320,324,550 – – –
Provision for taxation 559,300,089 516,720,428 29,849,505 71,858,253
Trade and other payables 37 7,549,394,229 7,361,431,347 902,335,465 1,172,832,456
Deferred tax liabilities 31.3 1,196,442,542 872,361,434 – –
Deferred income 38 328,277,459 288,877,431 – –
Retirement benefit obligations 39 950,486,084 889,356,837 85,996,592 80,123,443
Total liabilities 102,223,229,473 77,090,381,102 24,912,437,030 23,704,082,532
Equity
Stated capital 40 475,200,000 475,200,000 475,200,000 475,200,000
Reserves 41 2,210,863,862 1,747,745,668 1,078,243,031 1,096,102,808
Retained earnings 42 16,602,055,414 10,773,393,641 10,196,167,397 5,877,341,305
Equity attributable to equity holders of the Company 19,288,119,276 12,996,339,309 11,749,610,428 7,448,644,113
Minority interest 23,776,390,192 21,726,812,177 – –
Total equity 43,064,509,468 34,723,151,486 11,749,610,428 7,448,644,113
Total liabilities and equity 145,287,738,941 111,813,532,588 36,662,047,458 31,152,726,645
The Notes on pages 126 to 206 are an integral part of these Financial Statements.
Figures in brackets indicate deductions.
I certify that these Financial Statements have been prepared and presented in compliance with the requirements of the Companies Act, No. 07 of 2007.
S.S. Kotakadeniya Chief Financial Officer - LOLC Group
The Board of Directors is responsible for the preparation and presentation of these Financial Statements. Approved and signed for and on behalf of the Board;
Mrs. R.L. Nanayakkara W.D.K. JayawardenaChairperson Group Managing Director/CEO
Rajagiriya (Greater Colombo)
20 June 2012

122 LOLC 2011/12 REPORTS & ACCOUNTS
InCoMe stAteMent
Group Company
For the year ended 31 March 2012 2011 2012 2011
Note (Rs.) (Rs.) (Rs.) (Rs.)
Gross Income 4 37,815,861,546 32,077,327,461 8,709,835,017 6,344,360,964
Revenue 4.1 17,136,314,250 14,288,491,997 – –
Less: Cost of sales (11,805,638,691) (9,911,221,898) – –
Gross profit 5,330,675,559 4,377,270,099 – –
Income 4.2 17,312,892,336 12,150,506,779 3,030,395,171 3,511,733,478
Other income/(expenses) 5 3,366,654,960 5,638,328,685 5,679,439,846 2,832,627,486
Net finance costs 6 (8,469,890,440) (6,420,587,888) (2,543,317,728) (2,384,015,349)
Profit before operating expenses 17,540,332,415 15,745,517,675 6,166,517,289 3,960,345,615
Operating Expenses
Direct expenses excluding finance costs 7 (985,721,033) (1,017,831,003) (198,478,582) (266,842,585)
Provision for bad and doubtful debts (609,059,502) (546,455,858) (22,839,520) (100,485,684)
Personnel costs 8 (3,312,149,808) (1,985,476,257) (267,636,548) (341,104,639)
Depreciation and amortisation 10 (1,669,629,317) (1,110,354,747) (602,974,674) (685,174,234)
Other operating expenses 9 (4,072,138,935) (3,239,924,434) (651,220,519) (673,974,788)
Change in fair value of investment properties 25 251,224,000 (13,549,065) – 5,225,775
Results from operating activities 10 7,142,857,820 7,831,926,311 4,423,367,446 1,897,989,460
Gains on bargain purchase (Negative goodwill) 11 2,914,536,420 271,910,632 – –
Share of profit of Equity Accounted Investees 29.3 269,958,673 178,522,137 – –
Profit before income tax expense 10,327,352,913 8,282,359,080 4,423,367,446 1,897,989,460
Taxation 12.1 (1,390,275,815) (1,259,279,168) (122,401,131) (374,646,172)
Profit for the year 8,937,077,098 7,023,079,912 4,300,966,315 1,523,343,288
Attributable to:
Owners of the Company 6,259,864,500 3,840,227,908 4,300,966,315 1,523,343,288
Minority interest 2,677,212,598 3,182,852,004 – –
8,937,077,098 7,023,079,912 4,300,966,315 1,523,343,288
Earnings per share 13 13.17 8.08
The Notes on pages 126 to 206 are an integral part of these Financial Statements.
Figures in brackets indicate deductions.

LOLC 2011/12 REPORTS & ACCOUNTS 123
stAteMent oF CHAnGes In equItY
Group Equity Attributable to Owners of the Company
Stated Capital
Revaluation Reserve
Future Statutory Reserve
Investment Fund
RetainedEarnings
Total MinorityInterest
TotalTaxation Reserve
For the year ended 31 March 2012 (Rs.) (Rs.) (Rs.) (Rs.) (Rs.) (Rs.) (Rs.) (Rs.) (Rs.)
Balance as at 31 March 2010 475,200,000 155,879,068 205,000,000 404,979,197 – 6,662,696,388 7,903,754,653 11,835,892,945 19,739,647,598
Profit for the year – – – – – 3,840,227,908 3,840,227,908 3,182,852,004 7,023,079,912
Dividends paid during the period – – – – – – – (564,719,966) (564,719,966)
Dividends forfeited – – – – – 1,162,576 1,162,576 – 1,162,576
Revaluation of investments – 790,556,790 – – – – 790,556,790 2,799,654,728 3,590,211,518
Revaluation of property, plant and equipment – 546,889,277 – – – – 546,889,277 231,141,073 778,030,350
Deferred tax on revaluation – (4,937,305) – – – – (4,937,305) (22,200,340) (27,137,645)
Realisation of investment revaluation – (735,975,206) – – – 735,975,206 – – –
Transfers during the year – – – 327,954,925 57,398,922 (385,353,847) – – –
Change in percentage holdings in subsidiary companies – – – – – (81,314,590) (81,314,590) (1,284,685,925) (1,366,000,515)
Additions of minority through acquisition of subsidiaries – – – – – – – 1,703,110,991 1,703,110,991
Share issue of subsidiaries – – – – – – – 3,845,766,667 3,845,766,667
Balance as at 31 March 2011 475,200,000 752,412,624 205,000,000 732,934,122 57,398,922 10,773,393,641 12,996,339,309 21,726,812,177 34,723,151,486
Profit for the year – – – – – 6,259,864,500 6,259,864,500 2,677,212,598 8,937,077,098
Dividends – – – – – – – (408,757,492) (408,757,492)
Share issue of subsidiaries – – – – – – – 250,000,000 250,000,000
Addition to minority through acquisition of subsidiaries (Note 30.5) – – – – – – – 270,647,926 270,647,926
Transfers during the year – – – 370,035,270 223,874,950 (593,910,220) – – –
Revaluation of investments – (453,853,500) – – – – (453,853,500) (1,604,439,017) (2,058,292,517)
Revaluation of property, plant and equipment – 245,266,828 – – – – 245,266,828 331,821,663 577,088,491
Deferred tax on revaluation – 8,057,821 – – – – 8,057,821 22,188,834 30,246,655
Change in percentage holdings in subsidiary companies and consolidation adjustments – 69,736,825 – – – 162,707,493 232,444,318 510,903,503 743,347,821
Balance as at 31 March 2012 475,200,000 621,620,598 205,000,000 1,102,969,392 281,273,872 16,602,055,414 19,288,119,276 23,776,390,192 43,064,509,468
Company
Stated Capital
Revaluation Reserve
Future Taxation Reserve
Statutory Reserve
RetainedEarnings
Total
For the year ended 31 March 2012 (Rs.) (Rs.) (Rs.) (Rs.) (Rs.) (Rs.)
Balance as at 31 March 2010 475,200,000 105,402,842 205,000,000 241,889,290 4,401,162,084 5,428,654,216
Profit for the year – – – – 1,523,343,288 1,523,343,288
Revaluation made – 495,484,033 – – – 495,484,033
Transfers during the year – – – 48,326,643 (48,326,643) –
Dividends forfeited – – – – 1,162,576 1,162,576
Balance as at 31 March 2011 475,200,000 600,886,875 205,000,000 290,215,933 5,877,341,305 7,448,644,113
Balance as at 31 March 2011 475,200,000 600,886,875 205,000,000 290,215,933 5,877,341,305 7,448,644,113
Profit for the year – – – – 4,300,966,315 4,300,966,315
Transfers during the year – – – (17,859,777) 17,859,777 –
Balance as at 31 March 2012 475,200,000 600,886,875 205,000,000 272,356,156 10,196,167,397 11,749,610,428
The Notes on pages 126 to 206 are an integral part of these Financial Statements.
Figures in brackets indicate deductions.

124 LOLC 2011/12 REPORTS & ACCOUNTS
CAsH FLow stAteMent
Group Company
For the year ended 31 March 2012 2011 2012 2011
Note (Rs.) (Rs.) (Rs.) (Rs.)
Cash Flow from operating Activities
Profit before income tax expense 10,327,352,913 8,282,359,080 4,423,367,446 1,897,989,460
Adjustment for:
(Gain)/loss on sale of property, plant and equipment 5.1 (155,164,954) 25,890,860 (137,863,165) 36,300,647
Depreciation and amortisation 10 1,669,629,317 1,110,354,747 602,974,674 685,174,234
Insurance provision 367,895,207 – – –
Change in fair value of forward contracts 5.1 (211,713,264) – – –
Provision for gratuity 39 131,332,229 215,070,845 10,648,775 13,197,616
Provision for bad and doubtful debts 609,059,502 546,455,858 22,839,520 100,485,684
Provision for fall/(increase) in value of investments 1,486,975,245 (1,035,134,489) 744,814,802 (718,294,170)
Gain on sale of Treasury Bonds 5.1 (892,921) (550,983,898) (645,500) (272,172,043)
Investment income (365,650,509) (688,965,710) (64,059,197) (52,882,917)
Net finance costs 6 8,540,365,708 6,433,250,418 1,735,146,208 2,394,677,826
Interest income (474,505,533) (12,662,530) (8,098,989) (10,662,477)
Change in fair value of investment properties 25 (251,224,000) 13,549,065 – (5,225,775)
Amortisation of deferred income (10,066,408) (4,757,172) – –
(Profit)/Loss on sale of quoted and non-quoted shares (611,854,853) (1,958,298,140) (180,983,216) (667,164,597)
(Profit)/Loss on sale of subsidiaries, associates and quoted shares (3,370,422,110) – (4,075,235,698) –
Gains on bargain purchases (Negative goodwill) 11 (2,914,536,420) (271,910,632) – –
Share of profit of equity accounted investees 29 (269,958,673) (178,522,137) – –
Impairment of investments – – 21,244,900 29,940,752
(Gain)/loss on timber valuation 26 27,384,221 (149,563,509) – –
Operating profit before working capital changes 14,524,004,697 11,776,132,656 3,094,150,560 3,431,364,240
Working capital changes
(Increase)/Decrease in trade and other receivables (3,452,315,004) 450,841,344 (7,865,111,656) 1,552,231,698
(Increase)/Decrease in inventories (1,425,839,410) (476,860,129) 1,750,000 7,664,705
Increase/(Decrease) in trade and other payables (422,965,616) 1,471,567,280 (294,931,245) 219,072,176
(Increase)/Decrease in real estate stocks (187,600) 6,668,623 – –
(Increase)/Decrease in investment in leases, hire purchase and others (12,063,691,233) (11,500,763,582) 1,691,822,995 1,584,779,618
(Increase)/Decrease in factoring account receivable 250,733,824 (2,699,238,197) 2,736,752,654 (1,142,066,549)
(Increase)/Decrease in investment in advances and other loans (10,565,181,951) (9,743,424,178) 812,938,035 873,978,759
Increase/(Decrease) in customer deposits 8,848,551,016 6,253,452,297 – –
Increase/(Decrease) in premium receivables (239,616,479) – – –
Cash generated from operations (4,546,507,756) (4,461,623,886) 177,371,343 6,527,024,647
Finance cost paid (8,540,365,708) (6,387,667,991) (1,710,711,954) (2,498,600,000)
Income tax and economic service charge paid (946,633,741) (501,206,982) (51,513,040) (114,226,058)
Defined benefit plan costs paid 39 (97,964,019) (109,855,568) (4,775,626) (2,880,483)
Net cash from/(used in) operating activities (14,131,471,224) (11,460,354,427) (1,589,629,277) 3,911,318,106

LOLC 2011/12 REPORTS & ACCOUNTS 125
CASH FLOW STATEMENT
Group Company
For the year ended 31 March 2012 2011 2012 2011
Note (Rs.) (Rs.) (Rs.) (Rs.)
Cash Flow from Investing ActivitiesInvestment in subsidiary companies – – (1,055,127,991) (5,495,805,225)
Acquisition of minority interests 30.6 (165,000,000) (1,366,000,515) – –
Net cash and cash equivalents on acquisition of subsidiary 30.7 (2,228,943,946) (2,848,451,166) – –
Investment in equity accounted investees (558,388,000) (2,206,647,702) (333,421,819) (756,202,639)
Investment in joint venture – – 122,086,284 (36,384,471)
Acquisition of property, plant and equipment (2,604,054,889) (2,886,588,358) (903,758,542) (1,647,861,464)
Acquisition of intangible assets 32 (37,575,109) (69,197,493) (7,664,693) (14,371,445)
Acquisition/(Disposal) of investment properties 25 6,861,090 – – –
Net proceeds from short-term investments 38,022,891 (114,578,669) 22,078,694 (31,764,807)
Proceeds from sale of subsidiaries and associates and shares 4,278,769,931 7,116,016,375 1,858,555,000 1,940,420,063
Net additions to investment securities (2,014,951,677) (27,293,000) (518,952,353) 870,858,081
Net investment in term deposits 1,340,124,563 383,882,448 72,349,124 952,271,234
Proceeds from the sale of property, plant and equipment 906,440,435 1,087,766,387 631,027,119 931,070,610
Interest received 474,505,533 12,662,530 8,098,989 10,662,477
Dividend received 364,488,860 713,099,630 37,372,416 45,573,201
Rent received 5.1 46,030,129 7,565,793 – –
Additions of timber and rubber stocks 26 (26,162,262) (17,496,840) – –
Additions of mature and immature plantations 27 (116,461,386) (199,931,644) – –
Net cash flow from investing activities (296,293,837) (415,192,224) (67,357,772) (3,231,534,385)
Cash Flow from Financing ActivitiesNet cash proceeds from short-term interest-bearing loans and borrowings 3,155,461,885 1,052,499,211 (2,018,523,147) (640,737,952)
Principal repayment under finance lease liabilities (215,332,758) (466,324,628) 181,647,559 (110,691,251)
Proceeds from long-term interest-bearing loans and borrowings 15,972,695,717 20,374,573,885 4,645,579,180 6,443,121,962
Repayments of long-term interest-bearing loans and borrowings (9,471,968,986) (10,851,810,070) (5,053,190,993) (7,142,904,087)
Proceeds from issuance of debentures 4,889,287,500 – 4,250,000,000 –
Proceeds from issuance of shares of subsidiaries 250,000,000 3,845,766,666 – –
Dividend paid (398,606,871) (564,719,966) – –
Receipt of Deferred income 46,819,084 19,801,663 – –
Net cash generated from financing activities 14,228,355,571 13,409,786,761 2,005,512,599 (1,451,211,328)
Net increase/(decrease) in cash and cash equivalents during the year (199,409,490) 1,534,240,110 348,525,550 (771,427,607)
Cash and cash equivalents at the beginning of the year 629,896,179 (904,343,931) (1,702,412,798) (930,985,191)
Cash and cash equivalents at the end of the year 430,486,689 629,896,179 (1,353,887,248) (1,702,412,798)
Analysis of cash and cash equivalents at the end of the year
Cash in hand and favourable bank balances 14.1 4,444,709,429 4,659,100,494 250,011,865 392,011,825
Unfavourable bank balances used for cash management purposes 14.2 (4,014,222,740) (4,029,204,315) (1,603,899,113) (2,094,424,623)
430,486,689 629,896,179 (1,353,887,248) (1,702,412,798)
The Notes on pages 126 to 206 are an integral part of these Financial Statements.
Figures in brackets indicate deductions.

126 LOLC 2011/12 REPORTS & ACCOUNTS
1 CorporAte InForMAtIon
1.1 GeneralLanka ORIX Leasing Company PLC (‘the Company’) is a public quoted company incorporated on 14 March 1980 and domiciled in Sri Lanka. The address of the Company’s registered office is No. 110/1, Sri Jayawardenapura Mawatha, Rajagiriya, Sri Lanka and the principal place of business is at the same place.
Consolidated Financial Statements of the Company as at and for the year ended 31 March 2012 comprises of the Company and its subsidiaries (together referred to as the ‘Group’ and individually as ‘Group entities’) and the Group’s interest in associates and jointly controlled entities.
The Group is primarily involved in providing diversified financial solutions for the several customer segments.
Ordinary shares of the Company are listed on the main board of the Colombo Stock Exchange (CSE).
1.2 Principal Activities and Nature of OperationsThe principal activities of the Company comprised of leasing, hire purchase, loans, operating leases and investing activities.
However, with effect from 1 April 2011, the Company with the concurrence of the Central Bank of Sri Lanka ceased to operate as specialised leasing company and lease portfolio has been transferred to Lanka ORIX Finance PLC which is a subsidiary of the Company and became a holding company. The Company continued the business of hire purchases and loans and to manage the remaining book of business.
The Group’s principal activities range from financial services, insurance, trading, leisure, plantation to power and energy.
Note Page
1. Corporate Information 126
2. Basis of Preparation 127
3. Significant Accounting Policies 129
4. Gross Income 146
5. Other Income/(Expenses) 147
6. Net Finance Costs 148
7. Direct Expenses Excluding Finance Costs 148
8. Personnel Costs 148
9. Other Operating Expenses 148
10. Results from Operating Activities 149
11. Gains on Bargain Purchases (Negative Goodwill) 149
12. Income Tax Expense 151
13. Earnings Per Share 154
14. Cash and Cash Equivalents 154
15. Short-Term Investments 154
16. Investment in Term Deposits 155
17. Investment Securities 155
18. Rentals Receivable on Lease Assets, Hire Purchases and Operating Leases 159
19. Advances and Other Loans 161
20. Instalment Sales 162
21. Premium Receivables 162
22. Inventories 163
23. Trade and Other Current Assets 163
24. Prepaid Lease Rentals 164
25. Investment Properties 166
26. Timber and Rubber Stocks 167
27. Mature and Immature Plantations 168
28. Investments in Joint Venture Companies 170
29. Investments in Equity Accounted Investees 171
30. Investments in Subsidiary Companies 174
31. Deferred Tax Assets and Liabilities 180
32. Intangible Assets 182
33. Property, Plant and Equipment 184
34. Deposits from Customers 188
35. Interest-Bearing Borrowings 188
36. Insurance Provision 192
37. Trade and Other Payables 194
38. Deferred Income 194
39. Retirement Benefit Obligations 195
40. Stated Capital 196
41. Reserves 196
42. Retained Earnings 197
43. Commitments and Contingencies 198
44. Events After the Balance Sheet Date 199
45. Assets Pledged 199
46. Related Party Disclosures 200
47. Segmental Information 206
notes to tHe FInAnCIAL stAteMents

LOLC 2011/12 REPORTS & ACCOUNTS 127
Descriptions of the nature of operations and principal activities of the, jointly-controlled entities and associates are given in Notes 28.2 and 29.4 respectively in these Financial Statements.
1.3 Parent Entity and Ultimate Parent EntityLanka ORIX Leasing Company PLC is the holding company of the Group and therefore, it does not have an identifiable immediate or Ultimate Parent of its own.
2 BAsIs oF prepArAtIon
2.1 Statement of ComplianceThe Financial Statements of the Company and the Group are prepared in accordance with Sri Lanka Accounting Standards (SLASs) laid down by The Institute of Chartered Accountants of Sri Lanka (ICASL) and in compliance with the Companies Act No. 07 of 2007.
The Financial Statements were authorised for issue by the Directors on 20 June 2012.
2.2 Basis of MeasurementThe Consolidated Financial Statements have been prepared on the historical cost basis and applied consistently with no adjustments being made for inflationary factors affecting the Financial Statements, except for the following material items in the Balance Sheet:
The liability for defined benefit obligations is recognised as the present value of the defined benefit obligation.
Land and buildings are recognised at the revalued amounts.
Leasehold rights to bear land are stated at fair value.
Investment properties are recognised at fair value.
Investment securities are measured at quoted market price.
Timber stocks are measured at fair value less cost at point of sale.
General insurance reserve is stated at fair value.
Life insurance contract liabilities are stated at fair value.
2.3 Functional and Presentation CurrencyThe functional currency is the currency of the primary economic environment in which the entities of the Group operate.
The Financial Statements are presented in Sri Lankan Rupee (SLR), which is the functional currency and the Group’s presentation currency. All financial information presented in Rupees has been rounded to the nearest Rupee unless stated otherwise.
2.4 Use of Estimates and JudgmentThe preparation of the Financial Statements in conformity with SLASs requires management to make judgments, estimates and assumptions that affect the
application of accounting policies and the reported amounts of assets, liabilities, income and expenses. Actual results may differ from these estimates.
Estimates and underlying assumptions are based on historical experience and various other factors that are believed to be reasonable under the circumstances, the results which form the basis of making the judgments about the carrying amount of assets and liabilities that are not readily apparent from other sources.
Estimates and underlying assumptions are reviewed on an ongoing basis. Revisions to accounting estimates are recognised in the period in which the estimates are revised and in any future periods affected.
Information about critical judgments in applying accounting policies that have the most significant effect on the amounts recognised in the Financial Statements are included in the following Notes to these Financial Statements:
Critical Accounting Estimate/Judgment Disclosure Reference
Note Page
Timber stocks 3.7.1/26 134/168
Investment properties 3.16.2/25.4 136/167
Revaluation of lands & buildings 3.17.1.2.2 137
Goodwill on acquisition 3.1.12 131
Insurance provision - Life 3.41.4.6 144
Insurance provision - General 3.41.3.8 144
Unearned premium reserve 3.41.3.3 143
Deferred acquisition cost 3.41.3.6 143
Gross outstanding claims 3.41.4.4 144
Retirement benefit obligation 3.25.2 139
Deferred tax assets & liabilities 3.3.2 131
Loan loss provision 3.6.4 133
Leasehold right to bare land 3.42.5 145
Impairment of non-financial assets 3.18 138
Useful lives of property, plant and equipment 3.17.1.5 137
Useful lives of intangible assets 3.15.5 136
Consolidation of PRASAC Micro Finance Institution Ltd. 29.5 173
Consolidation of Diriya Investments Ltd. 30.2.1 176
Consolidation of Browns Investments PLC 30.2.2 176
NOTES TO THE FINANCIAL STATEMENTS

128 LOLC 2011/12 REPORTS & ACCOUNTS
2.5 Comparative InformationPrevious period figures and Notes have been restated and reclassified wherever necessary to conform to the current year’s presentation.
2.6 Materiality and AggregationEach material class of similar items is presented separately in the Financial Statements. Items of dissimilar nature or function are presented separately unless they are immaterial.
2.7 OffsettingAssets and liabilities, and income and expenses, are not offset unless required or permitted by SLASs.
2.8 Going ConcernThe Board of Directors is satisfied that the Company has adequate resources to continue its operations in the foreseeable future and going-concern basis has been adopted in preparing these Financial Statements.
2.9 Directors’ Responsibility for the Financial StatementsThe Board of Directors is responsible for the preparation and fair presentation of these Financial Statements in accordance with Sri Lanka Accounting Standards and as per the provisions of the Companies Act No. 07 of 2007. This responsibility includes: designing, implementing and maintaining internal controls relevant to the preparation and fair presentation of Financial Statements that are free from material misstatement, whether due to fraud or error; selecting and applying appropriate accounting policies; and making accounting estimates that are reasonable in the circumstances.
2.10 New Accounting Standards Issued but not Effective as at Balance Sheet DateThe Institute of Chartered Accountants of Sri Lanka has decided to converge Sri Lanka Accounting Standard (SLAS) with
International Financial Reporting Standard with effect from financial period beginning on or after 1 January 2012. Accordingly all the existing Sri Lanka Accounting Standards (SLAS) have been prefixed as Sri Lanka Financial Reporting Standards (SLFRS). These Standards (SLFRS) have not been applied in preparing current year Financial Statements as they were not effective for the period ended 31 March 2012.
The Company and the Group will prepare the Financial Statements beginning after 1 April 2012 based on the New Sri Lanka Accounting Standards (SLFRS) which include LKAS, SLFRS and other interpretation issued by International Accounting Standard Board. The Company and the Group is currently analysing the financial effects due to New Accounting Standards. The following is the summary based on financial assessment on possible changes due to application of SLFRS (This assessment is subjected to audit by the Auditors of the Company and the Group):
2.10.1 SLFRS 1 - First Time Adoption of Sri Lanka Accounting Standards
SLFRS 1 is applicable only when the entity prepares its Financial Statement base on SLFRS for the first time. Accordingly this Standard requires an entity to illustrate the transition date adjustments to Financial Statements by a way of reconciliation and explanation notes at the transition date in order to comply with SLFRS. Furthermore, this Standard provides certain accounting options which will then be selected and applied by the management consistently. This standard in general has similar effect on every entity within the Group.
2.10.2 LKAS 1 - Presentation of Financial Statements
LKAS 1 provides the Financial Statement preparation and presentation guidelines in accordance with SLFRS. This standard requires presentation of components of Other Comprehensive Income which will then be part of Comprehensive Income for the year. The Standard further requires
presentation of owner’s transactions with the equity. This standard also requires preparation of three Balance Sheets if the entity has made an accounting policy change or an accounting error under LKAS 8 or reclassification of item. This Standard in general has similar effect on every entity within the Group.
StaNDaRDS oN FiNaNciaL iNStRuMeNtS
2.10.3 LKAS 39 - Recognition and Measurement of Financial Instruments
LKAS 39 provides the guidance for definition, Recognition, Measurement, Impairment and Derecognition for Financial Instruments. LKAS 39 requires the all financial instruments be measured at fair value at its initial recognition. Subsequent to the initial recognition, the measurement will be based on the financial instrument classification. Financial assets will be classified into fair value through profit & loss, loans and receivables, Held to maturity investments and available for sale and financial liabilities will be classified into fair value through profit & loss and other financial liabilities. Depending on the classification, the subsequent measurement will be changed where financial assets and liabilities carried at fair value through profit and loss are valued through Income Statement and available for sale instruments fair valued through other comprehensive income. Loans and receivables, held to maturity instruments and other liabilities will be measured at amortised cost.
Except for financial assets at fair value through profit and loss, other financial assets are subjected to impairment assessment. Accordingly, an entity shall assess at the end of each reporting period whether there is any objective evidence that a financial asset or group of asset is impaired. If any such impairment evidence exists, impairment test will be performed to determine any amount of any impairment loss.
NOTES TO THE FINANCIAL STATEMENTS

LOLC 2011/12 REPORTS & ACCOUNTS 129
2.10.4 LKAS 32 - Presentation of Financial Instruments
This standard provides the principles for presenting financial instruments as liabilities or equity and for offsetting financial assets and liabilities.
2.10.5 SLFRS 7 - Financial Instruments Disclosure
This standard requires the entity to provide detail disclosure on the significance of the financial instruments and nature and the risk of risks arising from financial instruments and how those risks are managed by the entity. Currently, these disclosures are being evaluated with various financial models in order to meet the requirement of the standards.
Financial instrument standards will have a significant impact on financial service sector as most of items within financials are govern through this Standard. Other sectors will have considerable impact depending on the type of financial instrument they hold.
2.10.6 SLFRS 3 - Business Combinations
SLFRS 3 requires an entity to evaluate on the new definition of ‘business’ in order to ensure that an entity acquiring only a business will prepare consolidated financials than simply acquiring a set of assets. This standard further entails the recognition and measurement of the identifiable assets acquired and liabilities assumed and any non-controlling interest. Gains and losses which result in changes in subsidiary without losing control are to be accounted with in the equity. These standards will have significant impact on the consolidated financials of the Group.
2.10.7 SLFRS 8 - Operating Segments
SLFRS 8 requires an entity to present the segmental results in line with the information that is reviewed by the Chief Operating Decision Maker (CODM) to allocate resources and assess performance of the segment.
The Group presents the segmental information based on sector results and will change the current classification of segments based on the requirement of this standard.
2.10.8 SLFRS 4 - Insurance Contacts
An entity applies this standard to insurance contracts (including reinsurance contracts) that it issues and reinsurance contracts that it holds and financial instruments that are issued with discretionary participation feature.
The entity requires to carry out an assessment at the end of each reporting period whether the recognised insurance liabilities are adequate, using current estimates of future cash flows under its insurance contracts. Furthermore, this standard requires carrying out an impairment test on the reinsurance receivables and insurance liabilities to be presented without offsetting them against related insurance assets. These changes will have an impact on the Insurance Company.
2.10.9 LKAS 41 - Biological Assets
LKAS 41 prescribes the accounting treatment for biological assets. Biological assets are to be measured at fair value less cost to sell. The change in fair value of the biological asset will be directly recognised in Income Statement. Agricultural produce harvested from the biological asset considered as inventories and will be measured by applying LKAS 2 - Inventories from the Point of Harvest.
2.10.10 LKAS 16 - Property, Plant and Equipment
LKAS 16 requires property, plant and equipment measured at cost at the initial recognition. Initial cost of the asset also includes the initial estimation of site restoration cost such as environmental cost and similar cost, which will be depreciated over useful life of the asset.
This standard also requires depreciation of assets over their useful lives considering
significant components within the same class of asset evaluated for depreciation separately.
3 sIGnIFICAnt ACCountInG poLICIes
The accounting policies set out below have been applied consistently to all periods presented in these Consolidated Financial Statements, and have been applied consistently by Group entities.
3.1 Basis of Consolidation3.1.1 Subsidiaries
Subsidiaries are entities controlled by the Company. Control exists when the Company has the power, directly or indirectly, to govern the financial and operational policies of an entity so as to obtain benefits from its activities. In assessing control, potential voting rights that presently are exercisable or convertible are taken into account.
The Financial Statements of subsidiaries are included in the Consolidated Financial Statements from the date that control commences until the date that control ceases. Acquisition of subsidiaries is accounted for using the purchase method of accounting.
The accounting policies of subsidiaries have been changed when necessary to align them with the policies adopted by the Group. If a member of the Group uses accounting policies other than those adopted in the Consolidated Financial Statements for like transactions and events in similar circumstances, appropriate adjustments are made to its Financial Statements in preparing the Consolidated Financial Statements.
3.1.2 Minority Interests
Minority interests is the equity in a subsidiary not attributable, directly or indirectly, to the Parent are presented in the Consolidated Balance Sheet within equity, separately from the equity attributable to equity holders of the Parent (Company).
NOTES TO THE FINANCIAL STATEMENTS

130 LOLC 2011/12 REPORTS & ACCOUNTS
3.1.3 Acquisition of Minority Interests
Subsequent to the acquisition of control, any further acquisition of net assets from minority interest is accounted for as transactions with owners in their capacity as owners.
Any difference between the amount by which the minority interests is adjusted and the fair value of the consideration paid or received shall be recognised directly in equity and attributed to the owners of the Parent.
3.1.4 Loss of Control
The Parent can lose control of a subsidiary with or without a change in absolute or relative ownership levels. Upon the loss of control, the Group derecognises the assets and liabilities of the subsidiary, any minority interests and the other components of equity related to the subsidiary. Any surplus or deficit arising on the loss of control is recognised in the Income Statement.
If the Group retains any interest in the previous subsidiary, then such interest is measured at fair value at the date that control is lost. Subsequently it is accounted for as an equity-accounted investee or as other financial asset depending on the level of influence retained.
3.1.5 Adjustments that do not Result in a Loss of Control
Adjustments to minority interests arising from transactions that do not involve the loss of control are based on the proportionate amount of the net assets of the subsidiary.
The resultant gain/loss are accounted in the Income Statement.
3.1.6 Associates - Equity Accounted Investees
Associates are those entities in which the Group has significant influence, but not control, over the financial and operating activities.
Associates are accounted for using the equity method (equity accounted investees) and are initially recognised at cost. The cost of the investment includes transaction costs. The Group’s investment in associate includes goodwill identified on acquisition, net of any accumulated impairment losses.
The Consolidated Financial Statements include the Group’s share of the income and expenses and equity movements of equity accounted investees, after adjustments to align the accounting policies with those of the Group, from the date that significant influence commences until the date that significant influence ceases.
When the Group’s share of losses exceeds its interest in an equity accounted investee, the carrying amount of that interest (including any long-term investments) is reduced to nil and the recognition of further losses is discontinued except to the extent that the Group has an obligation or has made payments on behalf of the investee. Associate companies of the Group which have been accounted for under the equity method of accounting are disclosed under Note 29.2 to these Financial Statements.
3.1.7 Jointly-Controlled Entities
Joint ventures are those entities over whose activities the Group has joint control, established by contractual agreement and requiring unanimous consent for strategic financial and operating decisions.
Jointly-controlled entities are accounted for using proportionate consolidation method, from the date that joint control commences until the date that joint control ceases. The Group combines its share of the joint ventures’ individual income and expenses, assets and liabilities and cash flows on a line-by-line basis with similar items in the Group’s Financial Statements.
Jointly-controlled entities of the Group which have been accounted for under the proportionate consolidation method of accounting are disclosed in Note 28.1 to these Financial Statements.
3.1.8 Reporting Date
All the Group’s subsidiaries, associate companies and joint venture companies have a common financial year end which ends on 31 March other than Commercial Insurance Brokers, LOLC Insurance Company Ltd. and Prasac Micro Finance Company whose financial year ends on 31 December.
The difference between the reporting date of the above companies and that of the Parent does not exceed three months.
3.1.9 Transactions Eliminated on Consolidation
Intra-group balances and transactions, including income, expenses and dividends, are eliminated in full. Profits and losses resulting from intra-group transactions that are recognised in assets, such as inventory and fixed assets, are eliminated in full.
Unrealised gains arising from transactions with equity accounted investees are eliminated against the investment to the extent of the Group’s interest in the investee.
3.1.10 Business Combinations
All business combinations have been accounted for by applying the purchase method in accordance with Sri Lanka Accounting Standard 25 (Revised 2004) - ‘Business Combinations’. Applying this method involves the entity that obtains control of the other entity to recognise the fair value of assets acquired and liabilities and contingent liabilities assumed, including those not previously recognised.
3.1.11 Cost of Acquisition
The cost of an acquisition is measured as the fair value of the assets given, equity instruments issued and liabilities incurred or assumed at the date of exchange, plus costs directly attributable to the acquisition.
NOTES TO THE FINANCIAL STATEMENTS

LOLC 2011/12 REPORTS & ACCOUNTS 131
3.1.12 Goodwill on Acquisition
Goodwill represents the excess of the cost of any acquisition of a subsidiary or an associate over the Group’s interest in the net fair value of the identifiable assets, liabilities and contingent liabilities acquired.
Goodwill is initially recognised at cost. The Company will test the goodwill for impairment annually and assess for any indication of impairment to ensure that its carrying amount does not exceed the recoverable amount. If an impairment loss is identified, it is recognised immediately to the Income Statement. For the purpose of impairment testing, goodwill acquired in a business combination is, from the acquisition date, allocated to groups of cash-generating units that are expected to benefit from the synergies of the combination.
The impairment loss is allocated first to reduce the carrying amount of any goodwill allocated to the unit and then to the other assets pro-rata to the carrying amount of each asset in the unit. Where goodwill forms part of a cash-generating unit and part of the operation within that unit is disposed of, the goodwill associated with the operation disposed of is included in the carrying amount of the operation when determining the gain or loss on disposal of the operation.
Carrying amount of the goodwill arising on acquisition of subsidiaries and joint ventures is presented as an intangible and the goodwill on an acquisition of an equity accounted investment is included in the carrying value of the investment.
3.1.13 Gain on Bargain Purchase (Negative Goodwill)
If the Group’s interest, in the net fair value of the identifiable assets, liabilities and contingent liabilities exceeds the cost of the acquisition of the entity, the Group will reassess the measurement of the acquiree’s identifiable assets and liabilities and the measurement of the cost and recognise the difference immediately in the Consolidated Income Statement.
3.2 Foreign Currency3.2.1 Foreign Currency Transactions
Transactions in foreign currencies are translated to the functional currency (Sri Lankan Rupees) of the Group at exchange rates at the dates of the transactions.
Monetary assets and liabilities denominated in foreign currencies at the reporting date are retranslated to the functional currency at the exchange rate at that date. The foreign currency gain or loss on monetary items is the difference between amortised cost in the functional currency at the beginning of the year, adjusted for effective interest and payments during the year, and the amortised cost in foreign currency translated at the exchange rate at the end of the year.
Non-monetary assets and liabilities denominated in foreign currencies that are measured at fair value are retranslated to the functional currency at the exchange rate at the date that the fair value was determined. Non-monetary items in a foreign currency that are measured in terms of historical cost are translated using the exchange rate at the date of the transaction.
Foreign currency differences arising on retranslation are recognised in Income Statement.
3.2.2 Forward Exchange Contracts
Forward exchange contracts are valued at the forward market rates ruling on the date of the Balance Sheet. The resultant gain or loss in fair value is recognised in the Income Statement.
3.3 Tax ExpenseTax expense comprises of current, deferred tax and other statutory taxes. Income tax expense is recognised in Income Statement except to the extent that it relates to items recognised directly in the statement changes in equity.
3.3.1 Current Tax
Current tax is the expected tax payable or receivable on the taxable income or loss for the year, using tax rates enacted or substantively enacted at the reporting date, and any adjustment to tax payable in respect of previous years. Current tax payable also includes any tax liability arising from the tax on dividend income.
The provision for income tax is based on the elements of income and expenditure as reported in the Financial Statements and computed in accordance with the provisions of the Inland Revenue Act No. 10 of 2006 and subsequent amendments thereto.
Current tax assets and liabilities for the current and prior periods are measured at the amount expected to be recovered from or paid to the Commissioner General of Inland Revenue.
3.3.2 Deferred Tax
Deferred tax is recognised in respect of temporary differences between the carrying amounts of assets and liabilities for financial reporting purposes and the amounts used for taxation purposes. Deferred tax is not recognised for:
Temporary differences on the initial recognition of assets or liabilities in a transaction that is not a business combination and that affects neither accounting nor taxable profit or loss;
Temporary differences related to investments in subsidiaries and jointly-controlled entities to the extent that it is probable that they will not reverse in the foreseeable future; and
Taxable temporary differences arising on the initial recognition of goodwill;
Taxable temporary differences arising on subsidiaries, associates or joint ventures who have not distributed their entire profits to the parent or investor.
Deferred tax is measured at the tax rates that are expected to be applied to temporary differences when they reverse, based on the laws that have been enacted or substantively enacted by the reporting date.
NOTES TO THE FINANCIAL STATEMENTS

132 LOLC 2011/12 REPORTS & ACCOUNTS
Deferred tax assets and liabilities are offset if there is a legally enforceable right to offset current tax liabilities and assets, and they relate to income taxes levied by the same tax authority on the same taxable entity, or on different tax entities, but they intend to settle current tax liabilities and assets on a net basis or their tax assets and liabilities will be realised simultaneously.
A deferred tax asset is recognised for unused tax losses, tax credits and deductible temporary differences, to the extent that it is probable that future taxable profits will be available against which they can be utilised. Deferred tax assets are reviewed at each reporting date and are reduced to the extent that it is no longer probable that the related tax benefit will be realised.
Deferred tax assets and liabilities are not discounted.
The net increase in the carrying amount of deferred tax liability net of deferred tax asset is recognised as deferred tax asset is recognised as deferred tax expense and conversely any net decrease is recognised as reversal to deferred tax expense, in the Income Statement.
3.3.2.1 Application of Deferred Taxation to Group Companies Enjoying a Tax Holiday Period
As per the requirements of Sri Lanka Accounting Standard (SLAS) 14 - Income Taxes (Revised 2005) and the Ruling issued by The Institute of Chartered Accountants of Sri Lanka (ICASL), a group company enjoying a tax exemption period shall only recognise deferred tax in their Financial Statements for temporary differences, where reversals of such differences extend beyond the tax exemption period.
Deferred Tax shall not be considered nor provided for assets/liabilities for which tax impacts and reversals take place within the tax exemption period. There will be no tax implications that take place after the expiration of the tax exemption period for such assets.
Where a company is entitled to claim the total value or any part of expenditure made during the tax holiday period, as deductions for tax purposes after the tax holiday period, such an entity will treat such amount of expenditure as part of the tax base throughout the tax holiday period for the purpose of recognising deferred tax.
3.3.3 Withholding Tax on Dividends
Dividend distributed out of taxable profit of the local companies attracts a 10% deduction at source and is not available for set off against the tax liability of the Company. Withholding tax that arises from the distribution of dividends by the Company is recognised at the same time as the liability to pay the related dividend is recognised.
3.3.4 Economic Service Charge (ESC)
As per the provisions of Economic Service Charge Act No. 13 of 2006 amendments thereto, ESC is payable on the liable turnover at specified rates. ESC is deductible from the income tax liability. Any unclaimed amount can be carried forward and set off against the income tax payable in the five subsequent years as per the relevant provision in the Act.
3.3.5 Nation Building Tax (NBT)
As per the provisions of the Nation Building Tax Act No. 09 of 2009 and the subsequent amendments thereto, Nation Building Tax should be payable at the rate of 2% with effect from 1 January 2011 on the liable turnover as per the relevant provisions of the Act.
3.3.6 Value Added Tax on Financial Services (VAT on FS)
VAT on financial services is calculated in accordance with the amended Value Added Tax (VAT) Act No. 07 of 2003 and subsequent amendments thereto. The base for the computation of VAT on financial services is the accounting profit before income tax adjusted for the economic depreciation and emoluments of employees. VAT on financial services is computed on the prescribed rate of 12%.
3.3.7 Sales Taxes (Value Added Tax and Turnover Tax)
Revenues, expenses and assets are recognised net of the amount of sales tax except for the following:
Sales tax incurred on a purchase of a assets or services is not recoverable from the taxation authority, in which case the sales tax is recognised as part of the cost of acquisition of the asset or as part of the expense item as applicable; and
Receivables and payables that are stated with the amount of sales tax included.
The net amount of sales tax recoverable from, or payable to, the taxation authority is included as part of other receivables or other payables in the Balance Sheet.
3.4 Borrowing CostsBorrowing costs that are directly attributable to the acquisition, construction or production of qualifying assets that take a substantial period of time to get ready for its intended use or sale, are capitalised as part of the assets.
Borrowing costs that are not directly attributable to the acquisition, construction or production of a qualifying asset are recognised in profit or loss using the effective interest method.
ASSETS AND BASES OF THEIR VALUATION
An asset is a resource controlled by the entity as a result of past events and from which future economic benefits are expected to flow to the entity.
3.5 Cash and Cash EquivalentsCash and cash equivalents comprise of cash in hand and cash at banks and other highly liquid financial assets which are held for the purpose of meeting short-term cash commitments with original maturities of less than three months which are subject to insignificant risk of changes in their fair value.
NOTES TO THE FINANCIAL STATEMENTS

LOLC 2011/12 REPORTS & ACCOUNTS 133
Bank overdrafts that are repayable on demand and form an integral part of the Group cash management are included as a component of cash and cash equivalents for the purpose of the Statement of Cash Flows.
3.6 Loans, Advances and Rental Receivables3.6.1 Rentals Receivable on Finance Leases and Hire Purchases
Rentals receivable on leased and hire purchase assets are accounted for as finance leases, hire purchases and reflected in the Balance Sheet at balance cost recoverable after eliminating unearned income and deducting prepaid rentals, rental collections and provision for bad and doubtful debts.
3.6.2 Rental Receivable on Operating Leases
Leases where the Group as the lessor effectively retains substantially all the risk and rewards incidental to the ownership are classified as operating leases. Lease rentals from operating leases are recognised as income on a straight-line basis over the lease term.
3.6.3 Advances and Other Loans to Customers
Advances and other loans to customers comprised of revolving loans, loans with fixed instalments, factoring and pawning advances.
Revolving loans to customers are reflected in the Balance Sheet at amounts disbursed less repayments and provision for doubtful debts. Loans to customers with fixed instalments are stated in the Balance Sheet net of possible loan losses and net of interest, which is not accrued to revenue.
3.6.4 Provision for Doubtful Debts
The specific provisions for doubtful debts are arrived at using the following bases:
Lanka ORIX Leasing Company PLC
Twenty per cent (20%) of all accommodations which are in arrears for a period of 6 to 12 months.
Fifty per cent (50%) of all accommodations (net of unearned income) which are in arrears for a period of 12 to 18 months.
One hundred per cent (100%) of all accommodations (net of unearned income) which are in arrears for a period of 18 months and more.
One hundred per cent (100%) of all accommodations where instalments are not paid on a monthly basis, whenever the Company has realised that instalments will not be paid on the due dates.
LOLC Micro Credit Ltd.
LOLC Micro Credit Ltd. computes provisioning for bad and doubtful debts according to the Central Bank Direction No. 02 of 2006 of the Finance Leasing Act No. 56 of 2000.
The provisions for doubtful debts are arrived at using the following bases:
Lease, hire purchase and loan receivables;
Fifty percent (50%) on all accommodations (net of unearned income) which are in arrears for a period of 6 to 12 months.
One hundred percent (100%) on all accommodations (net of unearned income) which are in arrears for a period of 12 months and more, with additional specific provisions.
In addition to the above provision, LOLC Micro Credit Ltd. provide specific provision for bad and doubtful debts using the following bases for non-asset back loan receivables of the Company:
Fifty percent (50%) on all receivables (net of unearned income) which are in arrears for a period of 3 to 6 months.
One hundred percent (100%) on all receivables (net of unearned income) which are in arrears for a period of 6 months and more, with additional specific provisions.
Balance receivable on Terminated Contract for Lease, Hire Purchase, Advances and Loans.
One hundred percent (100%) of proceeds receivables.
Additional specific provisions are made upon management review on the performance of the lease, hire purchase and loan portfolios.
Lanka ORIX Finance PLC and Commercial Leasing and Finance Ltd.
Lanka ORIX Finance PLC and Commercial Leasing and Finance Ltd. provide for bad and doubtful debts based on the Direction No. 3 of 2006 of the Finance Business Act No. 42 of 2011.
Fifty per cent (50%) on all lease, hire purchase and loan receivables (net of unearned income) which are in arrears for a period of 6 to 12 months.
One hundred per cent (100%) on all lease, hire purchase and loan receivables (net of unearned income) which are in arrears for a period of 12 months and more with additional specific provisions.
Additional specific provisions are made upon management review on the performance of the lease, hire purchases and loan portfolios.
The value of the following items held as collateral for a particular advance has been deducted in arriving the above provisions:
Vehicles that have been repossessed by Lanka ORIX Finance PLC, eighty percent (80%) of the valuation obtained during the preceding 6 months from a professional valuer.
Land and buildings, the full value, in case of a primary mortgage, such value shall not exceed the value decided by a qualified professional valuer at the time of providing the accommodation.
Balance receivable on Terminated Contracts for Lease, Hire Purchase Advances and Loans one hundred per cent (100%) of proceeds receivables are made as provision for bad debts.
NOTES TO THE FINANCIAL STATEMENTS

134 LOLC 2011/12 REPORTS & ACCOUNTS
3.6.5 Acquired Properties on Settlement of Accommodation
Acquired properties represent properties acquired in full or partial settlement of loans and advances are accounted for the carrying amount of the accommodation granted.
The Group reviews these properties at each reporting date or more frequently for the changes in value.
3.6.6 Factoring Receivables
Factoring receivables of the Group have been stated net of specific provisions based on company provisioning policy. Any amount uncollectable is written-off against profits.
The specific provisions for doubtful debts are arrived at using the following bases:
If one hundred per cent (100%) of the sales ledger is disputed, and no further transactions have taken place for a period of 6 months, 50% of the current account balance is provided for, from the last date of dispute.
When this period reaches 12 months 100% is provided for.
However, if the total of settlements received within the said 3 months is less than 25% of the overdue current account balance, 50% of such current account balance is provided in 6 months and the 100% provided after 12 months as in the case of such accounts.
Further, the total portfolio is reviewed quarterly to capture any accounts that are not falling under the above criteria but are considered as ‘non-performing’. Such accounts are considered for provisioning on a case-by-case basis, under specific provisioning.
3.6.7 Pawning Advances
The Group provides pawning facilities with different maturities which are less than one year. The amounts receivables from pawning are included in the advances and other loans at the amounts expect to be recovered.
3.7.1 Timber Stocks and Rubber
The accounting policies adopted for timber plantations which is a consumable biological asset, is stated at fair value less estimated point-of-sale costs. Point-of-sale cost includes all costs that would be necessary to sell the assets including cost necessary to get the assets to the market.
The plantation companies have engaged an Independent Chartered Valuation Surveyor, Mr. K.T.D. Tissera in determining the fair value of timber stocks and rubber as at the Balance Sheet date. The valuer has valued the timber stocks and rubber per tree valuation basis by using available log and tree prices in city centres less point-of-sale costs.
3.7.2 Real Estate Stocks
Real estate stocks of the Group represent the purchase value of properties acquired for resale. Carrying value of the real estate stocks as at the Balance Sheet date represents the purchase value of properties and any subsequent expenditure incurred on development of such properties.
The Group provides 100% of the amount over pawning advance as pawning provision immediately after the due date.
3.7 InventoriesInventories are measured at the lower of cost and net realisable value.
The cost of inventories is based on the first-in first-out principle, and includes expenditure incurred in acquiring the inventories, production or conversion costs and other costs incurred in bringing them to their existing location and condition.
In the case of manufactured inventories and work-in-progress, cost includes an appropriate share of production overheads based on normal operating capacity. Net realisable value is the estimated selling price in the ordinary course of business, less the estimated costs of completion and selling expenses.
For the manufacturing stocks, provision for slow moving inventories is made when the holding period exceeds 365 days, and the sale of the inventories is no longer probable.
The cost incurred in bringing inventories to its present location and condition is accounted using the following cost formula:
Type of Inventory Method of Valuation
Input Materials Weighted average cost formula.
Growing Crop - Nurseries At the cost of direct materials, direct labour and appropriate proportion of directly attributable overheads less provision for over grown plants.
Harvested Crop Produce stocks manufactured up to the Balance Sheet date and sold since then, until the time of preparation of the Financial Statements are valued at since realised price. The balance produce stocks are valued at estimated selling prices. The prices are net of all attributed expenses relating to the public auction.
Spares and Consumables Weighted average cost basis.
Finished Goods and work-in-progress
First-In First-Out (FIFO) basis.
NOTES TO THE FINANCIAL STATEMENTS

LOLC 2011/12 REPORTS & ACCOUNTS 135
3.8 Short-Term InvestmentsShort-term investment comprises of call deposits and interest earning demand deposits with banks. Call deposits and deposits with banks are stated at the amounts to be realised.
3.9 Investments in Term DepositsTerm deposits are stated at principal amount plus interest accrued on a time proportionate basis.
3.10 Investment Securities
3.10.1 Investment in Quoted Shares - Trading Purposes
These investments that are acquired or incurred principally for the purpose of selling or holding as part of a portfolio that is managed for short-term profit.
Investments in quoted shares are stated at their respective market values on an aggregate portfolio basis. The difference between cost and the market value is charged to the Income Statement.
3.10.2 Investment in Long-Term Marketable Securities
The long-term marketable securities of the Group are stated at the market value as at the Balance Sheet date. The excess on revaluation is credited to Revaluation of Investments in the Statement of Changes in Equity.
3.11 Investment in Government Securities3.11.1 Investment in Government Treasury Bills and Treasury Bonds
Investments in Treasury Bills and Treasury Bonds are initially recorded at its cost and interest is accrued up to the period end. The premium/discount arising from Treasury Bonds are systematically amortised in the Income Statement throughout the period up to maturity.
3.11.2 Securities Purchased under Resale Agreements (Reverse Repos)
These are advances collateralised by purchase of Government Treasury Bills and Treasury Bonds from the banks, subject to an agreement to resell them at a predetermined price. Such securities remain on the Balance Sheet of the Group and the asset is recorded in respect of the consideration paid.
The difference between the purchase and the sale price represents interest income and is recognised in the Income Statement over the period of the resale agreement based on a pattern reflecting an effective rate of return.
3.12 Investment in Non-Quoted SharesThese are securities which are acquired and held for yield or capital growth in the medium/long term with the positive intent and ability to hold. Such securities are recorded at cost. Changes in market values of these securities are not taken into account, unless there is considered to be a diminution in value which is other than temporary.
3.13 Trade ReceivablesTrade and other receivables are stated at the amounts they are estimated to realise, net of provisions for bad and doubtful receivables. A provision for doubtful debts is made where as there is objective evidence that the Company will not be able to recover all amounts due according to the original terms of receivables. Bad debts are written-off when identified.
3.14 Other ReceivablesOther receivable balances are stated at estimated amounts receivable after providing for doubtful receivables.
3.15 Intangible Assets 3.15.1 Basis of Recognition
An intangible asset is recognised if it is probable that future economic benefits that are attributable to the assets will flow to the entity and the cost of the assets can be measured reliably.
3.15.2 Basis of Measurement
Intangible assets acquired separately are measured as initial recognition at cost. Following initial recognition intangible assets are carried at cost less any accumulated amortisation and any accumulated impairment losses. The useful life of intangible assets is assessed to be either finite or indefinite. Intangible assets with finite useful life are amortised over the useful economic life and assessed for impairment whenever there is an indication that the intangible asset may be impaired. The amortisation period and the method for an intangible asset with a finite useful life is reviewed at least at each financial year end. Intangible assets with indefinite useful lives are tested for impairment annually either individually or at the cash-generating unit level.
3.15.3 Subsequent Expenditure
Subsequent expenditure on intangible assets is capitalised only when it increases the future economic benefits embodied in these assets. All other expenditure is expensed when incurred.
3.15.4 Derecognition
Intangible assets are derecognised on disposal or when no future economic benefits are expected from its use. The gain or loss arising from derecognition of intangible assets are measured as difference between the net disposal proceeds and the carrying amount of the asset.
NOTES TO THE FINANCIAL STATEMENTS

136 LOLC 2011/12 REPORTS & ACCOUNTS
3.15.5 Amortisation
Amortisation is recognised in the Income Statement on a straight-line basis over the estimated useful lives of intangible assets, other than goodwill, from the date that they are available for use.
The estimated useful life of each intangible asset is as follows:
Computer Software 5 years
Brand Name 10 years
Customer Base 5 years
License and Fees 20 years
Amortisation methods, useful lives and residual values are reviewed at each reporting date and adjusted if appropriate.
3.16 Investment Properties 3.16.1 Basis of Recognition
An investment property is property held either to earn rental income or for capital appreciation or for both, but not for sale in the ordinary course of business, use in the production or supply of goods or services or for administrative purposes.
3.16.2 Basis of Measurement
Fair Value Model
Investment properties are initially recognised at cost. Subsequent to initial recognition, the investment properties are stated at fair values, which reflect market conditions at the Balance Sheet date. Gains or losses arising from changes in fair value are included in the Income Statement in the year in which they arise.
Where Group companies occupy a significant portion of the investment property of a subsidiary, such investment properties are treated as property, plant and equipment in the Consolidated Financial Statements, and accounted for as per SLAS 18 (Revised) - ‘Property, Plant and Equipment’.
3.16.3 Derecognition
Investment properties are derecognised when either they have been disposed of or when the investment property is permanently withdrawn from use and no future economic benefit is expected from its disposal. Any gains or losses on the retirement or disposal of an investment property are recognised in the Income Statement in the year of retirement or disposal.
3.16.4 Subsequent Transfers to/from Investment Property
Transfers are made to investment property when, and only when, there is a change in use, evidenced by the end of owner occupation, commencement of an operating lease to another party or completion of construction or development.
Transfers are made from investment property when, and only when, there is a change in use, evidenced by commencement of owner occupation or commencement of development with a view to sell.
For a transfer from investment property to owner occupied property or inventories, the deemed cost of property for subsequent accounting is its fair value at the date of change in use. If the property occupied by the Company as an owner occupied property becomes an investment property, the Company, accounts for such property in accordance with the policy stated under property, plant and equipment up to the date of change in use. For a transfer from inventories to investment property, any difference between the fair value of the property at that date and its previous carrying amount is recognised in the Income Statement. When the Company completes the construction or development of a self-constructed investment property, any difference between the fair value of the property at that date and its previous carrying amount is recognised in the Income Statement.
3.16.5 Determining Fair Value
External and independent valuers, having appropriate recognised professional qualifications and recent experience in the location and category of property being valued, values the investment property portfolio every 3 years. In financial periods within that period the fair value is determined by the Board of Directors.
The fair values are based on market values, being the estimated amount for which a property could be exchanged on the date of the valuation between a willing buyer and a willing seller in an arm’s length transaction after proper marketing wherein the parties had each acted knowledgeably.
3.17 Property, Plant and Equipment3.17.1 Freehold Property, Plant and Equipment
3.17.1.1 Basis of Recognition
Property, plant and equipment are recognised if it is probable that future economic benefits associated with the asset will flow to the Group and cost of the asset can be reliably measured.
3.17.1.2 Basis of Measurement
Items of property, plant and equipment are measured at cost/revaluation less accumulated depreciation/impairment losses.
Cost includes expenditure that is directly attributable to the acquisition of the asset. The cost of self-constructed assets includes the cost of materials and direct labour, any other costs directly attributable to bringing the assets to a working condition for their intended use, the costs of dismantling and removing the items and restoring the site on which they are located, and capitalised borrowing costs.
Purchased software that is integral to the functionality of the related equipment is capitalised as part of that equipment.
NOTES TO THE FINANCIAL STATEMENTS

LOLC 2011/12 REPORTS & ACCOUNTS 137
When parts of an item of property, plant and equipment have different useful lives, they are accounted for as separate items of property, plant and equipment.
3.17.1.2.1 Cost ModelThe Group applies the cost model to all property, plant and equipment, except freehold land and buildings; which records at cost of purchase together with any incidental expenses thereon less any accumulated depreciation and accumulated impairment losses.
3.17.1.2.2 Revaluation ModelThe Group revalues its land and buildings which are measured at its fair value at the date of revaluation less any subsequent accumulated depreciation and accumulated impairment losses. Revaluations are made with sufficient regularity to ensure that the carrying amount does not differ materially from that which would be determined using fair value at the Balance Sheet date.
On revaluation of lands and buildings, any increase in the revaluation amount is credited to the revaluation reserve in shareholder’s equity unless it off sets a previous decrease in value of the same asset that was recognised in the Income Statement. A decrease in value is recognised in the Income Statement where it exceeds the increase previously recognised in the revaluation reserve. Upon disposal, any related revaluation reserve is transferred from the revaluation reserve to retained earnings and is not taken into account in arriving at the gain or loss on disposal.
3.17.1.3 Subsequent Costs
The cost of replacing part of an item of property, plant and equipment is recognised in the carrying amount of the item if it is probable that the future
economic benefits embodied within the part will flow to the Group and its cost can be measured reliably. The carrying amount of the replaced part is derecognised. The costs of the day-to-day servicing of property, plant and equipment are recognised in profit or loss as incurred.
3.17.1.4 Reclassification to Investment Property
When the use of a property changes from owner-occupied to investment property, the property is remeasured to fair value and reclassified as investment property. Any gain arising on remeasurement is recognised in profit or loss to the extent that it reverses a previous impairment loss on the specific property, with any remaining gain recognised and presented in the revaluation reserve in equity. Any loss is recognised immediately in profit or loss.
3.17.1.5 Depreciation
Depreciation is based on the cost of an asset less its residual value. Significant components of individual assets are assessed and if a component has a useful life that is different from the remainder of that asset, that component is depreciated separately.
Depreciation is recognised in profit or loss on a straight-line basis over the estimated useful life of each component of an item of property, plant and equipment. Leased assets are depreciated over the shorter of the lease term and their useful lives unless it is reasonably certain that the Group will obtain ownership by the end of the lease term. Lands are not depreciated.
Depreciation of an asset begins when it is available for use and ceases at the earlier of the date that the asset is classified as held for sale and the date that the asset is derecognised.
Depreciation methods, useful life values are assessed at the reporting date. The estimated useful lives for the current year are as follows:
Building 40-50 years
Plant and Machinery 8-13 years
Motor Vehicles 4-5 years
Water Sanitation 20 years
Security Fencing 3 years
Penstock Pipes 20 years
Biological Assets 10 years
Tools 20 years
Roads and Bridges 50 years
Furniture and Fittings 5-10 years
Office Equipment 4-5 years
Computer Equipment 5-8 years
Swimming Pool 10 years
Cutlery, Crockery and Glassware 5 years
Linen 3 years
3.17.1.6 Derecognition
An item of property, plant and equipment is derecognised upon disposal or when no future economic benefits are expected from its use or disposal.
The gain or loss on disposal of an item of property, plant and equipment is determined by comparing the proceeds from disposal with the carrying amount of the property, plant and equipment, and is recognised net within other income/other expenses in the Income Statement. When revalued assets are sold, the amounts included in the revaluation surplus reserve are transferred to retained earnings.
3.17.1.7 Operating Lease Assets
Operating lease assets are motor vehicles and equipment shown under property, plant and equipment in the Balance Sheet at cost less accumulated depreciation.
NOTES TO THE FINANCIAL STATEMENTS

138 LOLC 2011/12 REPORTS & ACCOUNTS
Motor vehicles are depreciated net of cost and the estimated residual value over the effective useful life. Residual value is the estimated net amount the Company would currently obtain from disposal of the assets at the end of useful life. 3.17.2 Leasehold Property, Plant and Equipment (Assets Acquired on Finance Leases)
Leases in terms of which the Group assumes substantially obtained all the risks and rewards of ownership are classified as finance leases. Assets acquired by way of a finance lease are stated at an amount equal to the lower of their fair value and the present value of minimum lease payments at the inception less accumulated depreciation.
3.17.3 Capital Work-in-Progress
Capital work-in-progress is stated at cost. These are expenses of a capital nature directly incurred in the construction of buildings.
3.18 Impairment of Non-Financial AssetsThe carrying amounts of the Company’s non-financial assets are reviewed at each reporting date to determine whether there is any indication of impairment. If any such indication exists, then the assets’ recoverable amount is estimated. An impairment loss is recognised if the carrying amount of an asset or its related Cash-Generating Unit (CGU) exceeds its estimated recoverable amount.
The Company’s corporate assets do not generate separate cash inflows and are utilised by more than one CGU. Corporate assets are allocated to CGUs on a reasonable and consistent basis and tested for impairment as part of the testing of the CGU to which the corporate asset is allocated.
Impairment losses are recognised in profit or loss. Impairment losses recognised in respect of CGUs are allocated first to reduce the carrying amount of any goodwill allocated to the CGU (group of CGUs), and
then to reduce the carrying amounts of the other assets in the CGU (group of CGUs) on a pro rata basis.
Impairment losses recognised in prior periods are assessed at each reporting date for any indications that the loss has decreased or no longer exists. An impairment loss is reversed if there has been a change in the estimates used to determine the recoverable amount. An impairment loss is reversed only to the extent that the asset’s carrying amount does not exceed the carrying amount that would have been determined, net of depreciation, if no impairment loss had been recognised.
LIABILITIES AND PROVISIONS
Liabilities are recognised in the Balance Sheet when there is a present obligation as a result of a past event, the settlement of which is expected to result in an outflow of resources embodying economic benefits. Obligations payable at the demand of the creditor within one year of the Balance Sheet date are treated as current liabilities. Liabilities payable after one year from the Balance Sheet date are treated as non-current liabilities.
3.19 Deposits from CustomersDeposits include savings deposits and term deposits. They are brought to account at the gross value of the outstanding balance. Interest for the period is charged to the Income Statement.
3.19.1 Deposit Insurance Scheme
In terms of the Finance Companies Direction No. 2 of 2010 ‘Insurance of Deposit Liabilities’ issued on 27 September 2010, all Registered Finance Companies are required to insure their deposit liabilities in the Deposit Insurance Scheme operated by the Monetary Board in terms of Sri Lanka Deposit Insurance.
Scheme Regulations No. 1 of 2010 issued under Sections 32A to 32E of the Monetary Law Act with effect from 1 October 2010.
Deposits to be insured include time and savings deposit liabilities and exclude the following:
Deposit liabilities to member institutions.
Deposit liabilities to Government of Sri Lanka.
Deposit liabilities to shareholders, Directors, key management personnel and other related parties as defined in Finance Companies Act Direction No. 03 of 2008 on Corporate Governance of Registered Finance Companies.
Deposit liabilities held as collateral against any accommodation granted.
Deposit liabilities falling within the meaning of dormant deposits in terms of the Finance Companies Act, funds of which have been transferred to Central Bank of Sri Lanka.
Registered Finance Companies are required to pay a premium of 0.15% on eligible deposit liabilities as at end of the month to be payable within a period of 15 days from the end of the respective month.
3.20 Grants and SubsidiesGrants related to property, plant and equipment are initially deferred and allocated to Income Statement on a systematic basis over the useful life of the related property, plant and equipment. Grants related to assets, including non-monetary grants at fair value, are deferred in the Balance Sheet and credited to the Income Statement over the useful life of the related asset as given below:
No. of Years
Rate%
Buildings 40 2.5
Plant and Machinery 13 1/3 7.5
Equipment 08 12.5
Roads 50 2.0
Vehicles 05 20.0 Relevant assets are presented separately in the Financial Statements without setting off against the relevant grants.
NOTES TO THE FINANCIAL STATEMENTS

LOLC 2011/12 REPORTS & ACCOUNTS 139
Grants related to income are recognised in the Income Statement in the period in which they are receivable.
3.21 Finance LeasesProperty and equipment on finance leases, which effectively transfer to the Group substantially the entire risk and rewards incidental to ownership of the leased items, are disclosed as finance leases at their cash price and depreciated over the period the Group is expected to benefit from the use of the leased assets.
The corresponding principal amount payable to the lessor is shown as a liability. Lease payments are apportioned between the finance charges and reduction of the lease liability so as to achieve a constant rate of interest on the outstanding balance of the liability. The interest payable over the period of the lease is transferred to an interest in suspense account. The interest element of the rental obligations pertaining to each financial year is charged to the Income Statement over the period of lease.
3.21.1 Lease Payments
Payments made under operating leases are recognised in profit or loss on a straight-line basis over the term of the lease. Lease incentives received are recognised as an integral part of the total lease expense, over the term of the lease.
Minimum lease payments made under finance leases are apportioned between the finance expense and the reduction of the outstanding liability. The finance expense is allocated to each period during the lease term so as to produce a constant periodic rate of interest on the remaining balance of the liability.
3.22 Securities Sold under Repurchase AgreementsThese are borrowings collateralised by sale of Treasury Bills and Treasury Bonds held by the Company to the counterparty from whom the Company borrowed,
subject to an agreement to repurchase them at a predetermined price. Such securities remain on the Balance Sheet of the Company and the liability is recorded in respect of the consideration received. The difference between the sale and the purchase price represents interest expense, which is recognised in the Income Statement evenly over the period of the repurchased agreement.
3.23 Interest-Bearing BorrowingsBorrowings include borrowings from financial institutions. They are brought to account at the gross value of the outstanding balance.
3.24 DebenturesThese represent the funds borrowed by the Group for long-term funding requirements. These are recorded in the Balance Sheet at amounts expected to be payable.
3.25 Employee Benefits
3.25.1 Defined Contribution Plans
A Defined Contribution Plan is a post-employment benefit plan under which an entity pays fixed contributions into a separate entity and will have no legal or constructive obligation to pay further amounts. Obligations for contributions to defined contribution plans are recognised as an employee benefit expense in the Income Statement in the periods during which services are rendered by employees.
3.25.1.1 Employees’ Provident Fund (EPF), Ceylon Plantation Provident Society (CPPS) and Estate Staff Provident Society (ESPS)
The Group and employees contribute 12% and 8% respectively on the salary of each employee to the abovementioned funds.
3.25.1.2 Employees’ Trust Fund (ETF)
The Company/Group contribute 3% of the salary of each employee to the Employees’ Trust Fund.
3.25.2 Defined Benefit Plans
A defined benefit plan is a post-employment benefit plan other than a defined contribution plan. The Company’s net obligation in respect of defined benefit pension plans is calculated by estimating the amount of future benefit that employees have earned in return for their service in the current and prior periods; that benefit is discounted to determine its present value. Any unrecognised past service costs are deducted.
The calculation is performed every three years by a qualified actuary using the Projected Unit Credit Method. For the purpose of determining the charge for any period before the next regular actuarial valuation falls due, an approximate estimate provided by the qualified actuary is used.
When the benefits of a plan are improved, the portion of the increased benefit related to past service by employees is recognised in profit or loss on a straight-line basis over the average period until the benefits become vested. To the extent that the benefits vest immediately, the expense is recognised immediately in profit or loss.
The Company recognises all actuarial gains and losses arising from the defined benefit plan and all expenses related to defined benefit plans in personnel expenses in profit or loss.
This retirement benefit obligation is not externally funded.
3.25.3 Short-Term Employee Benefits
Short-term employee benefit obligations are measured on an undiscounted basis and are expensed as the related service is provided. A liability is recognised for the amount expected to be paid under short-term cash bonus if the Company has a present legal or constructive obligation to pay this amount as a result of past service provided by the employee, and the obligation can be estimated reliably.
NOTES TO THE FINANCIAL STATEMENTS

140 LOLC 2011/12 REPORTS & ACCOUNTS
reliably, there is no continuing management involvement with the goods, and the amount of revenue can be measured reliably.
If it is probable that discounts will be granted and the amount can be measured reliably, then the discount is recognised as a reduction of revenue as the sales are recognised. The timing of the transfer of risks and rewards varies depending on the individual terms of the sales agreement.
3.29.1.2 Rendering of Services
Revenue from services rendered is recognised in profit or loss in proportion to the stage of completion of the transaction at the reporting date. The stage of completion is assessed by reference to surveys of work performed.
3.29.1.3 Earned Income on Leases, Hire Purchases, Loans and Advances
The Group follows the financing method of accounting for its income. The excess of aggregated contract receivable over the cost of the assets constitutes the total unearned income at the commencement of a contract.
The unearned income is recognised over the term of the facility commencing on the month on which the facility is executed in proportion to the declining receivable balance, so as to produce a constant periodic rate of return on the net investment outstanding.
3.26 Swap InstrumentsGroup in its ordinary course of business enter into transactions such as currency swaps and foreign exchange contracts and uses derivative instruments to manage exposure to currency risks. In order to account for such transactions, the Group applies hedging accounting principles based on best accounting practices.
Currency swaps are recognised as Off-Balance Sheet Assets or Liabilities. The Group’s commitment for the contracted period is converted to Sri Lankan Rupees based on the exchange rate agreed.
3.27 Accounts Payables and Accrued ExpensesTrade and other payables are stated at cost.
3.28 ProvisionsProvisions are made for all obligations existing as at the Balance Sheet date when it is probable that such an obligation will result in an outflow of resources and a reliable estimate can be made of the quantum of the outflow. All contingent liabilities are disclosed as a note to the Financial Statements unless the outflow of resources is remote. Contingent assets are disclosed, where inflow of economic benefit is probable.
INCOME STATEMENT
3.29 Gross IncomeGross income comprises of revenue, income and other income other than those relating to contributions from equity participants.
The following are the main components of the revenue:
Finance & Leasing Earned Income on Leases, Hire Purchases, Factoring, Margin Trading, Loans and Advances
Insurance Gross Written Premium
Trading & Related Services Sale of Consumer, Agricultural, Motor Vehicles and Industrial Items and Providing Related Services.
Leisure Accommodation Sales, Service Charges, Food and Beverages, Income and Outlet Sales
Plantation Sale of Perennial Crops
IT Services IT Service Fee
Stock Brokering Brokerage Fees
Power Generation Sale of Electrical Energy, Sale of Solar System
Revenue is income that arises in the course of ordinary activities of an enterprise. Other income such as interest on Treasury Bills, Bonds and Debentures, gain on disposal of property, plant and equipment, rental income, dividend income, royalty income, foreign exchange gain, franchise fees, gain on disposal of investments securities, gain on marked to market valuation of investments, etc., also included in the gross income. 3.29.1 Revenue Recognition
Revenue is recognised to the extent that it is probable that the economic benefits will flow to the Group, and the revenue and associated costs incurred or to be incurred can be reliably measured. Revenue is measured at the fair value of the consideration received or receivable, net of trade discounts and value added taxes, net of sales within the Group.
3.29.1.1 Goods Sold
Revenue from the sale of goods in the course of ordinary activities is measured at the fair value of the consideration received or receivable, net of returns, trade discounts and volume rebates. Revenue is recognised when persuasive evidence exists, usually in the form of an executed sales agreement, that the significant risks and rewards of ownership have been transferred to the customer, recovery of the consideration is probable, the associated costs and possible return of goods can be estimated
NOTES TO THE FINANCIAL STATEMENTS

LOLC 2011/12 REPORTS & ACCOUNTS 141
Non-performing loans are those facilities where the rentals are overdue for 6 months and over. Income accrued is suspended from the date a facility is classified as non-performing and credited to the ‘Earned Income in Suspense’ in compliance with Direction No. 05 of 2005 of the Finance Leasing Act No. 56 of 2000 and Direction No. 15 of 1991 of the Finance Companies Act No. 78 of 1988. Thereafter, such income is recognised on cash basis.
Profit or loss on contracts terminated, collections on contracts written-off, interest on overdue rentals, interest on revolving loans, interest earned on property sale and buy back agreements, interest income on pawn broking are accounted for on cash basis.
3.29.1.4 Factoring
Revenue is derived from two sources, Funding and providing Sales Ledger Related Services.
Funding - Discount income relating to factoring transactions is recognised at the end of a given accounting month. In computing this discount, a fixed rate agreed upon at the commencement of the factoring agreement is applied on the daily balance in the Client’s Current Account.
Sales Ledger-Related Services - A service charge is levied as stipulated in the Factoring Agreement.
Income is accounted for on an accrual basis and deemed earned on disbursement of advances for invoices factored, except where the account is classified as non-performing.
Income is suspended on the basis of, if 100% of the sales ledger is disputed and there are no transactions for a period of 3 months from the last date of dispute.
3.29.1.5 Revenue from Accommodation Sales and Services Charge
Revenue from accommodation sales is recognised for the rooms occupied on a daily basis, together with outlet sales and other income from hotel operations.
90% of service charge collected from guests is distributed among the employees, retaining 10% of such service charge collected for recovery of breakages of cutlery, crockery, glassware and stainless steel items. Any balance amount of the retention after recovery of actual breakages is redistributed among employees at the end of each financial year. 3.29.1.6 IT Service Fee
IT services fee is accounted for on an accrual basis. 3.29.1.7 Turnover from Sale of Solar Systems and Sale of Electricity
The above revenue components are accounted on an accrual basis. 3.29.1.8 Income from Government Securities
Discounts/premiums on Treasury Bills/Bonds are amortised over the period to reflect a constant periodic rate of return. The coupon interest on Treasury Bonds is recognised on an accrual basis.
3.29.2 Other Income
Rent income, non-operational interest income, royalty income and franchise fees are accounted for on accrual basis.
Dividend income is recognised when the right to receive payment is established.
Gain on disposal of property, plant and equipment and other non-current assets, including investments held by the Group have been accounted for in the Income Statement, after deducting from the net sales proceeds on disposal of the carrying amount of such assets.
3.29.2.1 Rental Income
Rental income from investment property is recognised in profit or loss on a straight-line basis over the term of the lease. Lease incentives granted are recognised as an integral part of the total rental income, over the term of the lease. Rental income from subleased property is recognised as other income.
3.29.2.2 Amortisation of Government Grants Received
An unconditional Government grant related to a biological asset is recognised in the Income Statement as other income when the grant becomes receivable.
Other Government grants are recognised initially as deferred income at fair value when there is reasonable assurance that they will be received and the Group will comply with the conditions associated with the grant and are then recognised in the Income Statement as other income on a systematic basis over the useful life of the asset.
Grants that compensate the Group for expenses incurred are recognised in the Income Statement as other income on a systematic basis in the same periods in which the expenses are recognised.
3.30 Expenses RecognitionExpenses are recognised in the Income Statement on the basis of a direct association between the cost incurred and the earning of specific items of income. All expenditure incurred in the running of the business and in maintaining the property, plant and equipment in a state of efficiency has been charged to income in arriving at the profit for the year.
For the presentation of the Income Statement the Directors are of the opinion that the nature of the expenses method present fairly the element of the Company’s performance, and hence such presentation method is adopted.
NOTES TO THE FINANCIAL STATEMENTS

142 LOLC 2011/12 REPORTS & ACCOUNTS
Preliminary and pre-operational expenditure is recognised in the Income Statement.
Repairs and renewals are charged to the Income Statement in the year in which the expenditure is incurred.
3.31 Finance Income and Finance CostsFinance income comprises interest income on funds invested, dividend income, gains on the disposal of financial assets, fair value gains on financial assets. Interest income is recognised as it accrues in profit or loss, using the effective interest method. Dividend income is recognised in profit or loss on the date that the Group’s right to receive payment is established, which in the case of quoted securities is normally the ex-dividend date.
Finance costs comprise interest expense on borrowings and impairment losses recognised on financial assets (other than trade receivables), are recognised in the Income Statement.
3.32 The Group Profits are Stated After- Providing for all bad and doubtful debts
and depreciation of property, plant and equipment.
Charging all expenses incurred in the day-to-day operations of the business and in maintaining the property, plant and equipment in a state of efficiency.
3.33 Earnings Per ShareThe Company presents basic and diluted earnings per share data for its ordinary shares. Basic earnings per share is calculated by dividing the profit or loss attributable to ordinary shareholders of the Company by the weighted average number of ordinary shares outstanding during the year. Diluted earnings per share is determined by adjusting the profit or loss attributable to ordinary shareholders and
the weighted average number of ordinary shares outstanding, for the effects of all dilutive potential ordinary shares.
EQUITY
3.34 Stated CapitalStated capital in relation to the Company means the total of all amounts received by the Company or due and payable to the Company in respect of the issue of shares and in respect of calls on shares.
Incremental costs directly attributable to the issue of ordinary shares are recognised as a deduction from equity, net of any tax effects.
3.35 Movement of ReservesMovement of reserves is disclosed in the Statements of Changes in Equity.
3.36 Cash Flow StatementThe Cash Flow Statement has been prepared using the ‘Indirect Method’ of preparing Cash Flows in accordance with the Sri Lanka Accounting Standard 09 - ‘Cash Flow Statements’. Cash and cash equivalents comprise short term, highly- liquid investments that are readily convertible to known amounts of cash and are subject to an insignificant risk of changes in value.
Cash and cash equivalents comprise of cash in hand and cash at banks and other highly-liquid financial assets which are held for the purpose of meeting short-term cash commitments with original maturities of less than three months which are subject to insignificant risk of changes in their fair value.
3.37 Related Party Disclosures3.37.1 Transactions with Related Parties
The Company carries out transactions in the ordinary course of its business with parties who are defined as related parties in Sri Lanka Accounting Standard 30 (Revised 2005) - ‘Related Party Disclosures’. The Pricing applicable to such transactions
is based on the assessment of the risk and pricing model of the Company and is comparable with what is applied to transactions between the Company and its unrelated customers.
3.37.2 Transactions with Key Management Personnel
According to Sri Lanka Accounting Standard 30 (Revised 2005) - ‘Related Party Disclosures’, key management personnel, are those having authority and responsibility for planning, directing and controlling the activities of the entity. Accordingly, the Board of Directors (including Executive and Non-Executive Directors), personnel hold designation of Divisional General Manager and above positions and their immediate family members have been classified as Key Management Personnel of the Company.
The immediate family member is defined as spouse or dependent. Dependent is defined as anyone who depends on the respective Director for more than 50% of his/her financial needs.
3.38 Segmental ReportingSegment is a distinguishable component of the Group that is engaged either in providing products or services (business segment), or in providing products or services within a particular economic environment (geographical segment), which is subject to risks and rewards that are different from those of other segments.
In accordance with the Sri Lanka Accounting Standard 28 - ‘Segment Reporting’, segmental information is presented in respect of the Group. The segment comprises of Financial Services, Insurance, Trading, Leisure, Plantation, Power and Energy and others are described in Note 47.
Segment results, assets and liabilities include items directly attributable to a segment as well as those that can be allocated on a reasonable basis. Segment capital expenditure is the total cost
NOTES TO THE FINANCIAL STATEMENTS

LOLC 2011/12 REPORTS & ACCOUNTS 143
incurred during the period to acquire segment assets that are expected to be used for more than one period.
Expenses that cannot be directly identified to a particular segment are allocated on bases decided by the management and applied consistently throughout the year.
3.39 Events After the Balance Sheet Date All material Post-Balance Sheet events have been considered and where appropriate adjustments or disclosures have been made in the respective Notes to the Financial Statements.
3.40 Commitments and ContingenciesAll discernible risks are accounted for in determining the amount of all known liabilities. Contingent liabilities are possible obligations whose existence will be confirmed only by uncertain future events or present obligations where the transfer of economic benefit is not probable or cannot be reliably measured. Contingent liabilities are not recognised in the Balance Sheet but are disclosed unless they are remote.
ACCOUNTING POLICIES SPECIFIC TO SPECIFIC INDUSTRY SECTORS
3.41 Insurance Sector3.41.1 Reinsurance Receivable
The Group cedes insurance risk in the normal course of business. Reinsurance assets represent balances due from reinsurance companies. Recoverable amounts are estimated in a manner consistent with the outstanding claims provision and are in accordance with the reinsurance contract. Reinsurance is recorded gross in the Balance Sheet unless a right to offset exists. If a reinsurance asset is impaired, the Company reduces the carrying amount accordingly and recognises a loss in the Statement of Income.
A reinsurance asset is impaired if there is objective evidence, as a result of an event that occurred after the initial recognition of the reinsurance asset, that the Company may not receive all amounts due to it under the terms of the contract, and the event has a reliably measurable impact on the amount that the Company will receive from the reinsurer. Reinsurance assets are derecognised when the contractual rights are extinguished or expire or the contract is transferred to another party.
3.41.2 Premium Receivables
Collectability of premiums and other debts are reviewed on an on-going basis. Policies issued on debt basis and that are known to be uncollectible are cancelled and the respective gross written premium is reversed. A provision for doubtful debts is raised when some doubt as to collection exists.
3.41.3 General Insurance Business
3.41.3.1 Gross Written Premium
Premium is accounted as and when cash is received and in the same period as the policy liabilities are created. For single premium contracts, premiums are recorded as income when received with any excess profit deferred and recognised as income in a constant relationship to the insurance in force, for annuities and the amount of expected benefit payments.
3.41.3.2 Reinsurance Premium
Reinsurance premium expense is accrued on active policies on a monthly basis.
3.41.3.3 Unearned Premium Reserve
Unearned premium is the portion of gross written premium and reinsurance premium written in the current year in respect of risk related to subsequent periods. Unearned premium is calculated on the 1/365 basis in accordance with the Rules made by the Insurance Board of Sri Lanka under the Regulation of Insurance Industry Act No. 43 of 2000.
3.41.3.4 Unexpired Risks
Provision is made where appropriate for the estimated amount required over and above unearned premium to meet future claims and related expenses on the business in force as at 31 December.
3.41.3.5 Unexpired Risk Reserve
The calculation of premium liability requires a comparison between the Company’s held unearned premium reserve less DAC provision with actuarial estimate of the unexpired risk for the total general insurance business. The resulting premium liability is the higher of these two. In estimating the unexpired risk liability, assumptions are made on the expected ultimate loss ratio for each class of business and management expenses incurred whilst these policies remain exposed for claims.
3.41.3.6 Deferred Acquisition Costs (DAC)
Deferred acquisition expenses represent commission and franchise fees which vary with and are directly related to the production of business. Commission expenses are deferred and charged over the period in which the related premiums are earned, on 1/365 basis.
3.41.3.7 Claims
Claims incurred include provisions for the estimated cost of claims and related handling expenses in respect of incidents up to 31 December. Claims outstanding are assessed by reviewing the individual claim files and estimating changes in the ultimate cost of settling claims. The provision in respect of claims Incurred But Not Reported (IBNR) is actuarially valued to ensure a more realistic estimation of the future liability based on past experience and trends. Actuarial valuations are performed on an annual basis. Whilst the Directors consider that the provision for claims-related reinsurance recoveries are fairly stated on the basis of information currently available, the ultimate liability will vary as a result of subsequent information and events. This may result in adjustments to the amounts provided.
NOTES TO THE FINANCIAL STATEMENTS

144 LOLC 2011/12 REPORTS & ACCOUNTS
Such adjustments are reflected in the Financial Statements for that period. The methods used, and the estimates made, are reviewed regularly.
3.41.3.8 Valuation of Insurance Provision - General Insurance Reserve for outstanding claims including IBNR
The Group started writing Non-Life Business in year 2011, the Company has started with Writing Motor Business and was only class of business till 31.12.2011.
The Directors determine the long-term insurance business provisions for the Company on the recommendation of the Actuary, following his annual investigation of the life insurance business. The actuarial valuation takes into account all liabilities including contingent liabilities and is based on assumptions recommended by the Reporting Actuary.
Market ratios were considered arriving at IBNR figures. Actuary has used an average delay method modified suitably looking at Company’s new business policy and delay pattern observed. IBNR calculated is around 7% of Net Earned Premiums, and is on conservative side for a start-up company. Actuary believes that over a period of couple of more years actuary will be able to use some statistical method as data may be sufficient at that time and Company also may have ventured in to other classes of business.
3.41.4 Life Insurance Business
3.41.4.1 Gross Written Premium
Premium is accounted as and when cash is received and in the same period as the policy liabilities are created. For single premium contracts, premiums are recorded as income when received with any excess profit deferred and recognised as income in a constant relationship to the insurance in force, for annuities and the amount of expected benefit payments.
3.41.4.2 Reinsurance Premium
Reinsurance premium expense is accrued on active policies on a monthly basis. Reinsurance recoveries are credited to match the relevant gross claims.
3.41.4.3 Benefits, Losses and Expenses
Expenses related to the acquisition and maintenance of long-term insurance business. Claims by death or maturity are charged against revenue on notification of death or on expiry of the term. Claims payable includes direct cost of settlement. Interim payments and surrenders are accounted for at the time of settlement.
3.41.4.4 Actuarial Valuation for Long-Term Insurance Provision
The Directors determine the long-term insurance business provisions for the Company on the recommendation of the Actuary, following his annual investigation of the life insurance business. The actuarial valuation takes into account all liabilities including contingent liabilities and is based on assumptions recommended by the Reporting Actuary.
3.41.4.5 Life insurance Contract Liabilities
Life insurance liabilities are recognised when the contracts are entered into and premiums are charged. These liabilities are calculated via the net premium method for protection products, the unit fund plus Sterling reserve method for unit-linked products and a modified gross premium method for conventional products. For the net premium method the liability is calculated as the discounted value of the future benefits that are directly related to the contract, less the discounted value of the theoretical premiums that would be required to meet those future benefits based on the valuation assumptions. For the sterling reserve method all contract-related cash flows are projected using best estimate assumptions (but with valuation claim rates) and additional liabilities are set up in the event that contracts are not self-financing. For the modified gross premium method the investment account
is the starting point and in addition to that a liability may be held on account of future cash flows shortfalls. This second component is calculated exactly as per the sterling reserve above.
3.41.4.6 Valuation of Insurance Provision - Life Insurance Contract Liabilities
In the last nine months of operation ending on 31 December 2011, the Group has sold three products viz. Divisaviya, Isuru Sahana and Credit Life Group. All three are single premium term insurance products. As per IBSL’s guidelines, the method of valuation is Net Premium method. As per IBSL’s requirements, the discounting rate used is 5% p.a.; this being the first year of operations of the Company. A mortality table used is A (67-70) ultimate table.
A contingency reserve has been set aside to make provision for other risks like Catastrophe, IBNR.
Reinsurance has been ignored for computation of solvency margin as a conservative basis.
3.42 Plantation Sector3.42.1 Immature and Mature Plantations
The total cost of land preparation, rehabilitation, new planting, re-planting, crop diversification, inter-planting and fertilizing incurred between the time of planting and harvesting (When the planted area attains maturity) are classified as immature plantations.
These immature plantations are shown at direct costs plus attributed overheads, including interest attributable to long-term loans used for financing immature plantations. Attributable overheads incurred on the plantation are apportioned based on the labour days spent on respective replanting & new planting and capitalised on the immature areas. The remaining non-attributable overhead is expensed in the accounting period in which it is incurred.
NOTES TO THE FINANCIAL STATEMENTS

LOLC 2011/12 REPORTS & ACCOUNTS 145
The expenditure incurred on perennial crop (Tea/Rubber/Coconut) fields, which come into bearing during the year, has been transferred to mature plantations and depreciated over their useful life period.
The cost of replanting and new planting are classified as immature plantations up to the time of harvesting the crop.
Further, the general charges incurred on the plantation are apportioned based on the labour days spent on respective replanting and new planting and capitalised in the immature areas. The remaining portion of the general charges is expensed in the accounting period in which it is incurred.
The cost of areas coming in to bearing is transferred to mature plantations at the end of the financial year.
Mature plantations are depreciated over their useful lives or unexpired lease period, whichever is less. No depreciation is provided for immature plantations.
The estimated useful lives for the current and comparative years are as follows:
Tea 30-33 1/3 years
Rubber 20 years
Coconut 50 years
Cardamom/Cinnamon 15 years
3.42.2 Restoration Costs
Expenditure incurred on repairs or maintenance of property, plant and equipment in order to restore or maintain the future economic benefits expected from originally assessed standard of performance is recognised as an expense when incurred.
3.42.3 Permanent Land Development Costs
Permanent land development costs are those costs incurred making major infrastructure development and building new access roads on leasehold lands.
These costs have been capitalised and amortised over the remaining lease period.
3.42.4 Infilling Costs
The land development costs incurred in the form of infilling have been capitalised to the relevant mature field where infilling results in an increase in the economic life of the relevant field beyond its previously assessed standard of performance, in accordance with Sri Lanka Accounting Standard - 32 and depreciated over the useful life at rates applicable to mature plantation. Infilling costs are not capitalised and charged to the Income Statement in the year in which they are incurred.
3.42.5 Leasehold Rights to Bare Land of JEDB/SLSPC Estate Assets and Immovable (JEDB/SLSPC) Estates Assets on Finance Lease
Leasehold Rights to bare land of JEDB/SLSPC estate assets and immovable (JEDB/SLSPC) estates assets on finance lease obtained on a long-term basis, are stated at the recorded carrying values as at the effective date of Sri Lanka Accounting Standard No. 19 - Leases, in line with Ruling of the Urgent Issues Task Force of The Institute of Chartered Accountants of Sri Lanka. Such carrying amounts are amortised over the remaining lease term or useful life of such asset whichever is shorter.
3.42.6 Amortisation of Revaluation Surplus
In compliance with the Sri Lanka Accounting Standards Application Guidance Abstract No. 11 of The Institute of Chartered Accountants of Sri Lanka (ICASL), the valuation of the leasehold rights to bare lands was carried out by a professionally-qualified valuer, Mr. Arthur Perera as at 31 December 2005. The excess of valuation over the carrying amount has been treated as the revaluation surplus and transferred to component of equity.
The difference between depreciation based on the revalued carrying amount of the asset and depreciation based on the asset’s original cost is transferred to retained earnings over the remaining leasehold period.
3.42.7 Prepaid Lease Rentals/Leasehold Properties
Prepaid lease rentals paid to acquire land use rights are amortised over the lease term in accordance with the pattern of benefits provided. Leasehold properties are tested for impairment annually and are written down where applicable. The impairment loss, if any, is recognised in the Income Statement.
3.42.8 Amortisation
The leasehold rights of assets taken over from JEDP/SLSPC are amortised in equal amounts over the lower of lease period and economic useful life.
Depreciation rates used for the purpose are as follows:
No. of Years
Rate%
Bare Land 53 1.89
Improvement to Lands 30 3.33
Mature Plantations 30 3.33
Buildings 25 4.00
Machinery 15 6.67
Crop Diversification 30 3.33
Water and Sanitation 20 5.00
Other Vested Assets 30 3.33
Permanent Land Development 53 1.89
NOTES TO THE FINANCIAL STATEMENTS

146 LOLC 2011/12 REPORTS & ACCOUNTS
Group Company
For the year ended 31 March 2012 2011 2012 2011
(Rs.) (Rs.) (Rs.) (Rs.)
4 Gross InCoMe
Revenue (Note 4.1) 17,136,314,250 14,288,491,997 – –
Income (Note 4.2) 17,312,892,336 12,150,506,779 3,030,395,171 3,511,733,478
Other income (Note 5) 3,366,654,960 5,638,328,685 5,679,439,846 2,832,627,486
total 37,815,861,546 32,077,327,461 8,709,835,017 6,344,360,964
4.1 RevenueGross revenue 17,142,719,653 14,293,506,364 – –
Less - Turnover taxes (6,405,403) (5,014,367) – –
17,136,314,250 14,288,491,997 – –
4.2 IncomeLeasing interest income 4,631,845,792 2,390,289,528 124,162,528 306,098,603
Hire purchases interest income 2,667,096,069 2,871,899,544 30,670,520 159,734,570
Advances and other loans interest income 5,937,530,409 3,498,669,764 1,811,590,218 1,075,960,268
Earned premium on insurance contracts 115,792,303 – – –
Deferred instalment income 175,110,871 305,062,781 175,047,562 305,062,781
Operating lease and hire rental income 466,975,064 830,643,280 450,391,739 796,510,089
Overdue interest income 680,350,751 469,431,023 200,883,981 182,361,902
Debt factoring income 1,449,833,742 927,509,275 40,494,675 466,622,290
Insurance commission income 9,115,757 12,176,354 9,115,757 12,176,354
Securities trading and others 16,565,680 – – –
Recoveries from contracts written-off 57,951,740 35,563,032 47,424,974 35,563,032
Transfer fees and profit on termination 488,679,285 157,773,656 133,009,158 157,773,656
Arrangement/documentation fee and other 172,198,489 191,637,547 7,604,059 13,869,934
Other operational income 443,846,384 459,850,995 – –
total 17,312,892,336 12,150,506,779 3,030,395,171 3,511,733,478
NOTES TO THE FINANCIAL STATEMENTS

LOLC 2011/12 REPORTS & ACCOUNTS 147
Group Company
For the year ended 31 March 2012 2011 2012 2011
(Rs.) (Rs.) (Rs.) (Rs.)
5 otHer InCoMe/(eXpenses)
5.1 Other Income
Rental income 46,030,129 7,565,793 – –
Gain/(loss) on sale of property, plant and equipment 155,164,954 (25,890,860) 137,863,165 (36,300,647)
Profit on sale of vehicles 6,169,351 4,525,772 – –
Dividends income 319,620,380 688,965,710 64,059,197 52,882,917
Interest received from deposits and Government Securities 337,100,961 1,118,583,225 2,543,759 542,932,458
Debenture interest income – – 59,752,485 84,093,924
Royalty income – – – 6,939,260
Foreign exchange gain/(loss) (144,783,960) 6,621,810 9,100,389 16,613,708
Change in fair value of forward contracts 211,713,264 – – –
Gain on sale of Treasury Bonds 892,921 550,983,898 – 272,172,043
Gain on sale of factoring portfolio – – 828,726,215 –
Reversal of provision for fall in value of investments and others 2,900,266 – – –
Appreciation in market value of quoted investments 57,952 1,035,134,489 – 718,294,170
Profit on sale of quoted and non-quoted shares 3,982,276,963 1,958,298,140 4,256,218,914 667,164,597
Franchise fees 114,302,575 85,938,933 114,302,575 85,938,933
Amortisation of capital grants (Note 38.1) 8,448,663 4,690,079 – –
Gain/(loss) on change in fair value of timber stocks (Note 26) (27,384,221) 149,563,509 – –
Insurance policy fees 7,362,300 – – –
Treasury management fees – – 370.722,994 309,639,937
Restructuring and arrangement fees – – 400,000,000 1,304,169
Other expenses (Note 5.2) (1,520,620,853) – (744,814,802) –
Sundry income/(expenses) (132,596,685) 53,348,187 180,964,955 110,952,016
total 3,366,654,960 5,638,328,685 5,679,439,846 2,832,627,486
5.2 Other ExpensesFall in market value of quoted and non-quoted shares 1,487,033,197 – 744,814,802 –
Other expenses 33,587,656 – – –
total 1,520,620,853 – 744,814,802 –
5.3 Credit for Withholding Tax on Government Securities on Secondary Market TransactionsSection 137 of the Inland Revenue Act No. 10 of 2006 provides that a Company which derives interest income from the secondary market transactions in Government Securities be entitled to a notional tax credit (being one-ninth of the net Interest income) provided such interest income forms part of the statutory income of the Company for that year of assessment.
Accordingly, net income earned from secondary market transactions in Government Securities for the year resulting notional tax credit amounted to Rs. 35,215,851/- (2010/11 - Rs. 124,051,297/-) for the Group and Rs. 254,376/- (2010/11 - Rs. 54,293,245/-) for the Company.
NOTES TO THE FINANCIAL STATEMENTS

148 LOLC 2011/12 REPORTS & ACCOUNTS
Group Company
For the year ended 31 March 2012 2011 2012 2011
(Rs.) (Rs.) (Rs.) (Rs.)
6 net FInAnCe Costs
Overdraft and other short-term borrowings 3,231,227,974 2,451,333,422 1,640,408,117 1,501,235,594
Long-term borrowings 2,244,192,748 1,992,447,827 604,542,500 665,183,830
Finance lease interest 60,713,974 72,970,366 32,353,914 31,818,620
Debenture interest 240,229,163 16,874,771 147,105,733 –
Charges on SWAPS 341,758,864 368,313,171 127,006,453 196,439,782
Interest on customer deposits 2,422,242,985 1,531,310,861 – –
8,540,365,708 6,433,250,418 2,551,416,717 2,394,677,826
(-) Interest income on foreign currency deposits (70,475,268) (12,662,530) (8,098,989) (10,662,477)
8,469,890,440 6,420,587,888 2,543,317,728 2,384,015,349
7 dIreCt eXpenses eXCLudInG FInAnCe Costs
Value Added Tax (VAT) on leases/general expenses and VAT on financial services 421,770,942 649,831,089 103,402,864 138,015,591
Business Turnover Tax (BTT), NBT, debits tax and others 447,593,932 367,999,914 95,075,718 128,826,994
Reinsurance premium 14,879,871 – – –
Insurance benefits, losses and expenses 50,800,006 – – –
Increase in long-term insurance fund 47,570,658 – – –
Other direct expenses 3,105,624 – – –
985,721,033 1,017,831,003 198,478,582 266,842,585
8 personneL Costs
Salaries, wages and other benefits 2,863,579,414 1,628,153,494 216,250,006 275,430,731
Contribution to EPF/CCPS/ESPS 267,851,630 116,616,930 34,488,141 44,513,768
Contribution to ETF 49,386,535 25,634,988 6,249,626 7,962,524
Retirement benefit cost (Note 39.1) 131,332,229 215,070,845 10,648,775 13,197,616
3,312,149,808 1,985,476,257 267,636,548 341,104,639
9 otHer operAtInG eXpenses
Administration cost 1,491,884,362 1,251,494,624 349,204,457 373,759,295
Operating and marketing cost 2,529,530,968 1,783,020,530 215,495,451 257,872,764
Specific provisions reversals (141,272,121) (470,061,799) (67,297,667) (366,274,425)
Specific bad debts written-off 114,404,712 587,712,100 78,860,103 378,676,402
Other provisions 77,591,014 87,758,979 74,958,175 29,940,752
4,072,138,935 3,239,924,434 651,220,519 673,974,788
NOTES TO THE FINANCIAL STATEMENTS

LOLC 2011/12 REPORTS & ACCOUNTS 149
10 resuLts FroM operAtInG ACtIvItIes
Results from operating activities are stated after charging all expenses including the following:
Group Company
For the year ended 31 March 2012 2011 2012 2011
(Rs.) (Rs.) (Rs.) (Rs.)
Directors’ Remuneration 53,883,448 40,282,878 46,064,635 38,387,878
Auditors’ fees and expenses:
Remuneration for -
Audit-related services 17,426,584 15,295,529 2,450,000 2,113,104
Non-audit-related services 2,003,379 2,763,361 1,567,793 561,680
Legal expenses 54,134,452 56,621,901 12,458,792 24,126,801
Professional fees 68,417,029 39,062,853 23,072,295 19,479,318
Advertising-related expenses 439,914,228 329,515,219 51,891,974 41,275,084
Donations 8,328,546 4,604,103 1,766,670 1,478,614
Depreciation and Amortisation
Depreciation of property, plant and equipment (Note 33) 1,514,063,360 977,143,735 581,976,145 666,912,764
Amortisation of prepaid lease rentals (Note 24) 61,592,229 46,101,307 – –
Amortisation of intangible assets (Notes 32.3/32.4) 53,988,236 51,298,219 20,998,529 18,261,470
Depreciation of mature plantations (Note 27) 39,985,492 35,811,486 – –
1,669,629,317 1,110,354,747 602,974,674 685,174,234
11 GAIns on BArGAIn purCHAses (neGAtIve GoodwILL) Group
For the year ended 31 March 2012 2011
(Rs.) (Rs.)
On acquisition of subsidiaries (Note 11.1) 2,914,536,420 271,910,632
2,914,536,420 271,910,632
11.1 The gains on bargain purchases (negative goodwill) is attributable for the following entities acquired during the period:
Group
For the year ended 31 March 2012 2011
(Rs.) (Rs.)
Excel Global Holdings (Pvt) Ltd. (Group) (Note 11.2) 2,604,554,950 –
Confifi Hotels Group – 271,910,632
Taprobane Capital Ltd. (Group) 41,469,110 –
Dickwella Resort Ltd. 268,512,360 –
2,914,536,420 271,910,632
NOTES TO THE FINANCIAL STATEMENTS

150 LOLC 2011/12 REPORTS & ACCOUNTS
11.2 Browns Investments PLC (the Group) acquired 100% shareholding of Excel Global Holdings (Pvt) Ltd., on 22 July 2011. Upon this acquisition the Group gained controlling interest of Millennium Development (Pvt) Ltd. (MDL), which is a wholly-owned subsidiary of Excel Global Holdings (Pvt) Ltd. The cost of the acquisition was Rs. 887 Mn. MDL has leasehold rights to a block of land at T.B. Jayah Mawatha to the extent of 897 Perches, presently known as ‘Excel World’. The lease is for a further period of 32 years with a provision for extension for another 40 years, subject to conditions therein.
As per SLAS 25 (14), all business combinations shall apply the purchase method of accounting and SLAS 25 (16) (c) requires to allocate (at the acquisition date), the cost of the business combination to the assets acquired and liabilities and contingent liabilities assumed.
Further, SLAS 25 (36), requires the acquirer to allocate the cost of the business combination by recognising the acquiree’s identifiable assets and identifiable and contingent liabilities that satisfy recognition criteria provided in SLAS 25 (37) at their fair value at the date of the acquisition. Therefore, all identifiable intangible asset acquired in a business combination are recognised separately from goodwill and are measured initially at fair value at acquisition date.
As such, the fair value of this intangible asset has been incorporated in the Financial Statements for the period in computing the goodwill on acquisition and the resultant gain (negative goodwill) of Rs 2,604.5 Mn is reflected in the Group Income Statement for the period ended 31 March 2012.
For the purpose of ascertaining the fair value of leasehold interest, valuation of the said leasehold interest of the property has been obtained from two Chartered Valuers. Mr. P.W. Senaratne, Chartered Valuer has valued the leasehold interest at Rs. 5,102 Mn for a period of 72 years and at Rs. 4,320 Mn for a period of 32 years. Mr. K.T.D. Tissera, Chartered Valuer has valued the leasehold interest at Rs. 4,500 Mn for 72 years and at Rs. 3,500 Mn for 32 years. The Group has incorporated the lower valuation as given by Mr. Tissera as a matter of prudence. MDL intends to develop this property as a mixed development over the next few years. It is planned that this development be in line with the terms of the lease agreement between MDL and the Lessor namely, the Incorporate Trustees of the Church of England in Ceylon. Specifically the development will be in line with the sixth schedule of the lease agreement and the approved development plan. All licenses granted to tenants would be for activities which are in keeping with the tenants of the church.
On 1 October 2011, Taprobane Plantations Ltd., an associate company of the Group took over business activities of the Excel World formerly operated by MDL. As a result, the property was categorised as an investment property as provided for by the Sri Lanka Accounting Standards and consequently, the intangible assets was classified as an investment property and the Company uses the fair value model, in terms of SLAS 40 (35). This investment property was revalued as at 31 March 2012, resulting in a sum of Rs. 250 Mn being credited to the Income Statement.
NOTES TO THE FINANCIAL STATEMENTS

LOLC 2011/12 REPORTS & ACCOUNTS 151
12 InCoMe tAX eXpense
The Company is liable for tax at the rate of 28% on its taxable income in accordance with the Inland Revenue Act No. 10 of 2006, and subsequent amendments made thereto. Provision has been made in the Financial Statements accordingly. The rest of the Group companies are taxable under the prevailing applicable rates.
12.1 Major components of income tax expense are as follows:
Group Company
For the year ended 31 March 2012 2011 2012 2011
(Rs.) (Rs.) (Rs.) (Rs.)
Current tax expense (Note 12.3) 989,109,419 803,875,954 83,080,528 128,892,387
Deferred tax expense (Note 31.5) 401,166,396 455,403,214 39,320,603 245,753,785
Income tax expense reported in the income statement 1,390,275,815 1,259,279,168 122,401,131 374,646,172
12.2 Numerical reconciliation of accounting profits to income tax expense-
Group Company
For the year ended 31 March 2012 2011 2012 2011
(Rs.) (Rs.) (Rs.) (Rs.)
Profit before income tax expense 10,327,352,913 8,282,359,080 4,423,367,446 1,897,989,460
(+) Disallowable expenses 20,175,375,117 9,862,533,960 2,368,730,498 2,831,528,090
(-) Allowable expenses (16,267,032,567) (8,484,982,755) (1,651,372,515) (2,662,748,657)
(-) Tax exempt income (11,791,133,094) (7,268,155,911) (5,314,570,485) (1,758,139,868)
(-) Allowable tax credits (25,535,741) (121,780,651) – –
(+/-) Tax losses incurred/utilised (Note 12.6) 480,222,806 (261,059,971) 173,845,055 (108,020,159)
(+/-) Other adjustments 366,914,588 230,865,135 – –
Taxable income 3,266,164,023 2,239,778,887 – 200,608,866
Income tax @
28% 787,624,853 – – –
12% 26,634,100 – – –
10% 38,632,620 – – –
35% – 692,984,749 – 70,213,104
15% – 38,973,369 – –
Total tax expenses 852,891,573 731,958,118 – 70,213,104
Average statutory income tax rate (%) 26.11 32.68 28.00 35.00
12.3 Current Tax Expense
Tax expense 852,891,573 731,958,118 – 70,213,104
(+) SRL @ 1.5% – 10,979,372 – 1,053,196
Under provision in respect of previous years 134,823,285 60,938,464 83,080,528 57,626,087
Tax on intercompany dividends 925,299 – – –
Deemed dividend tax paid 469,262 – – –
989,109,419 803,875,954 83,080,528 128,892,387
NOTES TO THE FINANCIAL STATEMENTS

152 LOLC 2011/12 REPORTS & ACCOUNTS
12.4 Effective Tax Rate Group Company
For the year ended 31 March 2012 2011 2012 2011
(%) (%) (%) (%)
13.46 15.20 2.77 19.74
12.5 A reconciliation of effective tax rate is as follows:
For the year ended 31 March 2012 2011
(Rs.) (%) (Rs.) (%)
Group
Accounting profit before income tax 10,327,352,913 8,282,359,080
Income tax expense at the average statutory income tax rate 2,696,775,854 26.11 2,706,668,949 32.68
Disallowable expenses 5,669,550,745 54.90 3,678,472,170 44.41
Allowable expenses (4,247,801,058) (41.13) (2,772,886,220) (33.48)
Tax exempt income (3,079,011,948) (29.81) (2,375,228,088) (28.68)
Allowable tax credits (6,668,134) (0.06) (39,797,829) (0.48)
Tax losses incurred/utilised 125,400,311 1.21 (85,314,209) (1.03)
Other adjustments 95,812,200 0.93 75,446,559 0.91
SRL @ 1.5% – – 10,979,372 0.13
Under/(over) provision in respect of previous years 134,823,285 1.31 60,938,464 0.74
Tax on intercompany dividends 925,299 0.01 – –
Deemed dividend tax paid 469,262 0.00 – –
Income tax expense 1,390,275,815 13.46 1,259,279,168 15.20
Company
Accounting profit before income tax 4,423,367,446 1,897,989,460
Income tax expense at the average statutory income tax rate 1,238,542,885 28.00 664,296,311 35.00
Disallowable expenses 702,565,142.44 15.88 1,236,788,617 65.16
Allowable expenses (462,384,304) (10.45) (931,962,030) (49.10)
Tax exempt income (1,488,079,736) (33.64) (615,348,954) (32.42)
Tax losses incurred/utilised 48,676,615 1.10 (37,807,056) (1.99)
SRL @ 1.5% – – 1,053,197 0.06
Under/(over) provision in respect of previous years 83,080,528 1.88 57,626,087 3.04
Income tax expense 122,401,131 2.77 374,646,172 19.74
NOTES TO THE FINANCIAL STATEMENTS

LOLC 2011/12 REPORTS & ACCOUNTS 153
12.6 Tax Losses Group Company
For the year ended 31 March 2012 2011 2012 2011
(Rs.) (Rs.) (Rs.) (Rs.)
Losses brought forward 3,269,759,515 3,530,819,486 1,206,745,573 1,314,765,732
Acquisition of subsidiaries 35,982,578 – – –
Adjustments for brought forward tax losses (217,440,225) – (217,440,225) –
Losses incurred 873,940,619 130,242,273 173,845,055 –
Losses utilised (393,717,813) (391,302,244) – (108,020,159)
Losses carried forward 3,568,524,674 3,269,759,515 1,163,150,403 1,206,745,573
12.7 Tax Exemptions,Concessions or Holidays that have been granted to the Group of CompaniesMaturata Plantations Ltd. and Pussellawa Plantations Ltd.
‘Specified Profit’ from agricultural undertaking under Section 16 of Inland Revenue Act are exempted for a five year period reckoned from the year of assessment 2006/07.
LOLC Leisure Sector Companies
All leisure sector companies are taxed at the rate of 12%.
United Dendro Energy (Pvt) Ltd.
As per the agreement entered with the Board of Investments (BOI) Sri Lanka, the Company’s business profits are tax exempted for first 5 years of operations and the next two years is taxed under a concessionary rate of 10% and thereafter income tax will be payable at the rate of 20%.
During the 2011/12 financial period, the following companies were taxed at the rate of 10% since their turnover is less than Rs. 300 Mn.
1. Browns Group Industries (Pvt) Ltd.
2. Standard Finance (Pvt) Ltd.
3. LOLC Services Ltd.
4. LOLC Leisure Ltd.
5. Dickwella Resort Ltd.
6. LOLC Securities Ltd.
NOTES TO THE FINANCIAL STATEMENTS

154 LOLC 2011/12 REPORTS & ACCOUNTS
13 eArnInGs per sHAre
13.1 Basic Earnings Per ShareThe calculation of basic earnings per share for the year is based on the profit attributable to ordinary shareholders and the weighted average number of ordinary shares outstanding calculated as follows:
Group
For the year ended 31 March 2012 2011
Profit attributable to ordinary shareholders (Rs.) 6,259,864,501 3,840,227,908
Weighted average numbers of ordinary shares (Note 13.1.1) 475,200,000 475,200,000
Basic earnings per share (Rs.) 13.17 8.08
13.1.1 Weighted Average Number of Ordinary Shares
Total as at beginning of the period 475,200,000 47,520,000
Effect on subdivision of 1:10 (Note 13.1.2) – 427,680,000
Total as at end of the period 475,200,000 475,200,000
13.1.2 Subdivision of Shares
In the financial period of 2010/11, each existing fully-paid ordinary share of the Company was subdivided into ten (10) ordinary shares in order to facilitate further market liquidity. Consequent to this subdivision, the number of ordinary shares in issue increased from 47,520,000 to 475,200,000.
13.2 Diluted Earnings Per ShareThere were no potential dilutive ordinary shares outstanding at any time during the year or previous year. Therefore, not presented.
14 CAsH And CAsH equIvALents
14.1 Cash in Hand and Favourable Bank Balances Group Company
As at 31 March 2012 2011 2012 2011
(Rs.) (Rs.) (Rs.) (Rs.)
Cash in hand 97,357,439 25,029,013 2,604,500 1,349,500
Balances at banks 4,347,351,990 4,634,071,481 247,407,365 390,662,325
4,444,709,429 4,659,100,494 250,011,865 392,011,825
14.2 Unfavourable Bank Balances used for Cash Management Purposes
Bank overdrafts (4,014,222,740) (4,029,204,315) (1,603,899,113) (2,094,424,623)
Net cash and cash equivalents 430,486,689 629,896,179 (1,353,887,248) (1,702,412,798)
15 sHort-terM InvestMents
1. Unit trusts 127,000,000 – – –
2. Investments in foreign currency deposits 31,676,105 196,698,996 31,676,105 53,754,799
158,676,105 196,698,996 31,676,105 53,754,799
NOTES TO THE FINANCIAL STATEMENTS

LOLC 2011/12 REPORTS & ACCOUNTS 155
Group Company
As at 31 March 2012 2011 2012 2011
(Rs.) (Rs.) (Rs.) (Rs.)
16 InvestMent In terM deposIts
Investments in fixed deposits 1,192,812,399 2,456,187,694 149,251,925 221,601,049
1,192,812,399 2,456,187,694 149,251,925 221,601,049
17 InvestMent seCurItIes
Investment in debentures 32,523,522 28,000,299 377,931,522 714,400,299
Investment in preference shares – 21,111,110 – –
Investment in mudharabah deposit – – – 35,000,000
Investment in commercial papers 891,822,087 940,984,552 – –
Investment in reverse repurchase agreements 1,050,540,584 2,411,486,792 – –
Investment in Treasury Bills 144,657,267 – – –
Investment in Treasury Bonds 883,637,257 34,532,933 18,655,578 –
Quoted ordinary shares (Note 17.1 ) 10,286,555,682 10,730,084,505 3,123,371,863 2,788,580,298
Non-quoted ordinary shares (Note 17.2) 262,167,696 289,896,489 – 26,212,099
Investments in capital savings 7,359,346 – – –
13,559,263,441 14,456,096,680 3,519,958,963 3,564,192,696
17.1 Quoted Ordinary Shares
Group
As at 31 March 2012 2011
No. of Cost Market Value No. of Cost Market ValueShares (Rs.) (Rs.) Shares (Rs.) (Rs.)
Amaya Leisure PLC 1,000 132,467 76,000 1,000 132,467 120,100
Abans Electricals PLC 50,000 13,133,972 7,900,000 – – –
Acme Printing & Packaging PLC 575,000 13,373,266 11,212,500 – – –
Asia Capital PLC 40 – 1,500 40 – 3,512
Browns Beach Hotel PLC 412,113 2,712,543 6,119,810 326,622 4,403,226 6,957,048
Cargo Boat Development Company PLC 300 9,801 25,440 300 9,801 43,950
Central Finance PLC 2,583 707,840 442,468 – – –
Ceylon Guardian Investment Trust PLC 19,063 – 4,422,617 3,360 1,239,840 1,241,520
Ceylon Insurance PLC 1,000 553,706 845,000 1,000 553,706 730,000
Ceylon & Foreign Trade PLC – – – 100,600 957,144 814,860
Chemanex PLC 486,905 71,667,488 49,329,208 279,100 46,690,313 37,231,940
Colombo Dockyard PLC 4,110 85,997 945,300 4,110 85,997 1,048,461
Commercial Bank of Ceylon PLC 160,450 16,224,704 16,045,000 151,000 38,478,182 40,135,800
DFCC Bank PLC 19 – 2,140 3,196 3,215 549,073
Dialog Telekom PLC 46,991,400 546,194,121 333,638,940 46,990,600 546,189,177 493,401,300
Distilleries Company of Sri Lanka PLC 43,138 5,370,708 6,575,895 65,938 12,039,602 11,868,840
NOTES TO THE FINANCIAL STATEMENTS

156 LOLC 2011/12 REPORTS & ACCOUNTS
Group
As at 31 March 2012 2011
No. of Cost Market Value No. of Cost Market ValueShares (Rs.) (Rs.) Shares (Rs.) (Rs.)
Environment Resources Investments PLC 18,616 36,708 36,708 18,616 36,708 1,439,017
Expo Lanka PLC 1,000,000 18,000,000 6,200,000 – – –
Grain Elevators PLC – – – 104,200 12,732,485 17,516,020
Hayleys PLC 2,745,024 1,083,315,244 988,244,640 2,043,624 809,747,338 800,715,429
Hatton National Bank PLC 22,186,274 773,036,366 3,394,499,922 13,213,030 338,499,277 5,046,653,078
HDFC Bank PLC 9,707,740 451,700,459 664,009,416 946,174 423,025,112 1,065,297,308
Hemas Holdings PLC 2,008,200 91,074,827 52,815,660 2,022,200 94,938,529 93,021,200
Hapugastenna Plantation PLC 100 1,000 4,050 100 1,000 7,400
John Keells Holdings PLC 205 26,000 42,230 205 26,000 58,548
John Keells Hotels PLC 131,573 378,930 2,249,899 131,573 378,930 2,263,056
Janashakthi Insurance PLC – – – 627,600 10,077,502 10,355,400
Lake House Printers and Publishers PLC 121,000 21,052,762 14,253,800 – – –
Lanka IOC PLC 27,800 750,600 750,600 27,800 750,600 489,280
Lanka Ashok Leyland PLC 100 293,248 206,970 – – –
The Lanka Hospitals Corporation PLC – – – 300 14,560 13,440
The Finance Company PLC 1,250,000 50,000,000 37,500,000 1,250,000 50,000,000 46,250,000
The Lion Brewery (Ceylon) PLC 2,462,400 508,040,042 491,248,800 2,165,800 439,198,032 433,160,000
Laugfs Gas PLC 945,500 52,127,825 24,393,900 1,013,500 56,022,672 44,999,400
Laugfs Gas PLC (Non-Voting) – – – 120,800 5,114,744 4,191,760
Malwatta Valley Plantation PLC 500 11,412 11,412 – – –
Merchant Bank of Sri Lanka PLC 66,000 3,687,847 1,953,600 66,000 3,687,847 3,049,200
Nation Lanka PLC 181,327 919,907 1,831,403 1,000 916,035 11,100
Nations Trust Bank PLC 116,100 10,272,531 6,617,700 116,100 10,272,531 8,858,430
Overseas Reality Ceylon PLC 113,680 1,664,891 1,523,312 113,680 1,664,891 1,705,200
Panasian Power PLC 4,000,000 20,881,458 10,400,000 – – –
PC House PLC 300,000 6,461,589 2,460,000 – – –
People's Merchant Bank – – – 7,380,179 196,315,602 184,504,475
Pelwatte Sugar Industries PLC – – – 104,600 4,230,861 3,336,740
Parquet Ceylon PLC 72,800 2,367,087 1,092,000 758,300 16,592,038 16,000,130
Radient Gem International 31,365 2,280,052 2,261,417 – – –
Raigam Wayamba Salterns PLC 52,400 131,000 162,440 26,200 65,500 117,900
Richard Pieris and Company PLC 1,600,400 23,864,268 12,003,000 1,943,200 28,280,299 26,427,520
Serendib Hotels PLC 30,000 879,744 744,000 – – –
Seylan Bank PLC (Voting) 48,653,939 3,251,388,277 3,026,609,083 24,833,998 2,183,311,137 1,867,516,650
Seylan Bank PLC (Non-Voting) 33,274,622 1,057,666,658 964,964,038 7,424,300 179,264,362 291,774,990
Seirra Cables PLC 29,964,100 186,434,420 107,152,384 30,550,900 205,190,543 164,974,860
Sinhaputha Finance PLC 86,100 9,916,622 7,654,290 – – –
Swisstek (Ceylon) PLC 758,300 16,592,039 11,374,500 – – –
Textured Jersey PLC 1,744,700 26,301,353 12,387,370 – – –
Vallible Finance PLC 33,900 497,200 1,315,320 24,860 248,600 1,230,570
Veyangoda Textiles Mills PLC 10,300 262,060 – 10,300 262,060 –
8,342,481,039 10,286,555,682 5,721,648,465 10,730,084,505
NOTES TO THE FINANCIAL STATEMENTS

LOLC 2011/12 REPORTS & ACCOUNTS 157
Company
As at 31 March 2012 2011
No. of Cost Market Value No. of Cost Market ValueShares (Rs.) (Rs.) Shares (Rs.) (Rs.)
Asia Capital PLC 40 – 1,500 40 – 3,512
Abans Electricals PLC 50,000 13,133,972 7,900,000 – – –
Acme Printing & Packaging PLC 575,000 13,373,266 11,212,500 – – –
Browns Beach Hotel PLC – – – 34,500 802,391 734,850
Central Finance PLC 2,583 707,840 442,468 – – –
Ceylon & Foreign Trade PLC – – – 100,600 957,144 814,860
Ceylon Grain Elevators PLC – – – 104,200 12,732,485 17,516,020
Chemanex PLC 303,605 40,961,213 30,815,908 95,800 15,984,038 12,779,720
Distilleries Company of Sri Lanka PLC 29,000 3,529,088 4,205,000 – – –
Hayleys PLC 2,423,124 952,052,418 872,324,640 2,015,024 798,468,514 769,940,671
HDFC Bank PLC 9,707,740 451,700,459 664,009,416 946,174 423,025,112 1,065,297,307
Hemas Holdings PLC 85,100 4,043,441 2,238,130 250,000 11,846,880 11,500,000
Lake House Printers and Publishers PLC 121,000 21,052,762 14,253,800 – – –
Laugfs Gas PLC 945,500 52,127,825 24,393,900 1,013,500 56,022,672 44,999,400
Laugfs Gas PLC (Non-Voting) – – – 120,800 5,114,744 4,191,760
Panasian Power PLC 4,000,000 20,881,458 10,400,000 – – –
Parquet Ceylon PLC – – – 758,300 16,592,038 16,000,130
PC House PLC 300,000 6,461,589 2,460,000 – – –
Pelwatte Sugar Industries PLC – – – 104,600 4,230,861 3,336,740
People's Merchant Bank PLC – – – 7,380,179 196,315,602 184,504,475
Radient Gem International PLC 31,365 2,280,052 2,261,415 – – –
Seylan Bank PLC (Voting) 88 1,650 5,888 66 – 4,963
Seylan Bank PLC (Non-Voting) 33,274,622 1,057,666,658 964,964,038 5,594,700 111,538,365 219,871,710
Seirra Cables PLC 139,900 707,341 461,670 726,700 3,674,226 3,924,180
Serendib Hotels PLC 30,000 879,744 744,000 – – –
Sinhaputhra Finance PLC 86,100 9,916,622 7,654,290 – – –
Swisstek (Ceylon) PLC 758,300 16,592,039 11,374,500 – – –
The Lion Brewery Ceylon PLC 2,462,400 508,040,042 491,248,800 2,165,800 439,198,032 433,160,000
Veyangoda Textiles Mills PLC 10,300 262,060 – 10,300 262,060 –
3,176,371,532 3,123,371,863 2,096,765,164 2,788,580,298
NOTES TO THE FINANCIAL STATEMENTS

158 LOLC 2011/12 REPORTS & ACCOUNTS
17.2 Non-Quoted Ordinary Shares
Group
As at 31 March 2012 2011
No. of Cost No. of Cost Shares (Rs.) Shares (Rs.)
Badulla Transport and Agency Company (Pvt) Ltd. – – 10,000 100,000
Asia Lanka Ltd. 52,000,000 130,650,000 – –
Browns Capital (Pvt) Ltd. – – 5,000,000 50,000,000
Browns Healthcare (Pvt) Ltd. – – 17,500,000 175,000,000
Browns Hotels Ltd. – – 11,000 110,000
Ceylon Marine & Travel Services (Pvt) Ltd. – – 9,450 73,700
Ceylon Studios Ltd. 500 5,000 500 5,000
Confifi Finance Ltd. 39,100 391,000 39,100 391,000
CT Land Property Ltd. 11,550 1,122,660 – –
Credit Information Bureau 100 203,900 100 203,899
Equity Investments Lanka Ltd. – – 17,250 172,500
Expo Lanka Holdings Ltd. 36,750 367,500 1,000,000 18,000,000
Export International Ltd. 7,500 75,000 7,500 75,000
Hotel Hantana Ltd. 190,000 190,000 – –
Indo-Lanka Steel Ltd. 200,000 6,000,000 200,000 6,000,000
Lanka Glass Manufacturing Ltd. 3,000,000 3,000,000 3,000,000 3,000,000
Magpek Exports Ltd. 250,000 1,000,000 250,000 1,000,000
Malwaththavelley Plantation Ltd. – – 500 11,412
Motor Marvels (Pvt) Ltd. – – 480,000 4,800,000
Polycoat Resins Ltd. – – 400,000 4,000,000
Rainforest Ecology (Pvt) Ltd. – – 17,000 470,000
Taprobane Capital (Pvt) Ltd. – – 4,840,000 48,400,000
Taprobane Holding (Pvt) Ltd. 16,766,667 100,600,002 – –
Vallibel One Ltd. – – 1,568,000 39,287,099
Rain Forest Eco Lodge Ltd. 3,283,688 28,752,634 – –
total 272,357,696 351,099,610
Less: Provision for fall in value
Balance as at the beginning of the period 61,203,121 10,000,000
Provision/(Reversal) made during the year (51,013,121) 51,203,121
Balance as at the end of the period 10,190,000 61,203,121
Carrying amount at the end of the year 262,167,696 289,896,489
NOTES TO THE FINANCIAL STATEMENTS

LOLC 2011/12 REPORTS & ACCOUNTS 159
Company
As at 31 March 2012 2011
No. of Cost No. of Cost Shares (Rs.) Shares (Rs.)
Indo-Lanka Steel Ltd. 200,000 6,000,000 200,000 6,000,000
Lanka Glass Manufacturing Ltd. 3,000,000 3,000,000 3,000,000 3,000,000
Magpek Exports Ltd. 250,000 1,000,000 250,000 1,000,000
Vallibel One Ltd. – – 1,045,000 26,212,099
total 10,000,000 36,212,099
Less: Provision for fall in value
Balance as at the beginning of the period 10,000,000 10,000,000
Provision/(Reversal) made during the year – –
Balance as at the end of the period 10,000,000 10,000,000
Carrying amount at the end of the year – 26,212,099
18 rentALs reCeIvABLe on LeAse Assets, HIre purCHAses And operAtInG LeAses
Group Company
As at 31 March 2012 2011 2012 2011
(Rs.) (Rs.) (Rs.) (Rs.)
18.1 Rentals Receivable on Leased Assets Receivable from one to five years
Rentals receivable 27,977,608,739 14,254,566,569 – 1,184,517,921
Unearned income (5,823,094,901) (3,057,716,858) – (247,133,822)
Provision for doubtful debts (200,744,029) (51,826,440) – (5,257,883)
Deposits received from lessees (4,191,687,939) (1,347,539,014) – (22,591,880)
17,762,081,870 9,797,484,257 – 909,534,336
Receivables within one year
Rentals receivable 17,371,427,532 8,085,804,215 – 624,087,409
Unearned income (5,469,544,617) (2,675,893,458) – (125,568,210)
Provision for doubtful debts (205,145,445) (73,640,308) – (7,917,220)
11,696,737,470 5,336,270,449 – 490,601,979
Overdue rentals receivable
Rentals receivable 590,142,710 370,542,420 – 70,592,215
Earned income in suspense (51,306,771) (38,367,805) – (7,220,079)
Provision for doubtful debts (89,981,899) (101,617,893) – (40,860,232)
448,854,040 230,556,722 – 22,511,904
Total
Rentals receivable 45,939,178,981 22,710,913,204 – 1,879,197,545
Unearned income (11,292,639,518) (5,733,610,316) – (372,702,032)
Earned income in suspense (51,306,771) (38,367,805) – (7,220,079)
Provision for doubtful debts (495,871,373) (227,084,641) – (54,035,335)
Deposits received from lessees (4,191,687,939) (1,347,539,014) – (22,591,880)
Balance as at 31 March 29,907,673,380 15,364,311,428 – 1,422,648,219
NOTES TO THE FINANCIAL STATEMENTS

160 LOLC 2011/12 REPORTS & ACCOUNTS
Group Company
As at 31 March 2012 2011 2012 2011
(Rs.) (Rs.) (Rs.) (Rs.)
18.2 Rentals Receivable on Hire PurchaseReceivable from one to five years
Rentals receivable 7,020,558,206 11,608,365,475 10,474,594 55,504,784
Unearned income (1,234,642,382) (2,624,754,988) (402,284) (4,794,696)
Provision for doubtful debts (78,775,717) (227,364,643) – (1,136,163)
5,707,140,107 8,756,245,844 10,072,310 49,573,925
Receivables within one year
Rentals receivable 6,028,298,715 6,686,782,003 34,027,184 265,897,704
Unearned income (1,603,764,315) (1,965,442,823) 4,031,153 (38,908,315)
Provision for doubtful debts (171,905,699) (163,828,792) (170,746) (6,662,845)
4,252,628,701 4,557,510,388 29,825,285 220,326,544
Overdue rental receivable
Rentals receivable 431,984,939 401,370,647 21,907,874 45,081,233
Earned income in suspense (69,656,024) (50,283,736) (1,447,528) (4,872,911)
Provision for doubtful debts (72,587,025) (99,505,517) (15,943,897) (24,950,547)
289,741,890 251,581,394 4,516,449 15,257,775
Total hire purchase receivables
Rentals receivable 13,480,841,860 18,696,518,125 66,409,652 366,483,721
Unearned income (2,838,406,697) (4,590,197,811) (4,433,437) (43,703,011)
Earned income in suspense (69,656,024) (50,283,736) (1,447,528) (4,872,911)
Provision for doubtful debts (323,268,441) (490,698,952) (16,114,643) (32,749,555)
Balance as at 31 March 10,249,510,698 13,565,337,626 44,414,044 285,158,244
18.3 Rentals Receivable on Operating LeasesRentals receivable 1,128,588,081 1,792,154,119 1,128,588,081 1,789,887,230
Unearned income (1,103,393,975) (1,732,672,533) (1,103,393,975) (1,732,672,533)
Earned income in suspense (41,723,505) (46,820,238) (41,723,505) (46,820,238)
Provision for doubtful debts – (5,553,625) – (5,553,625)
Balance as at 31 March (16,529,399) 7,107,723 (16,529,399) 4,840,834
18.4 Total Rentals Receivable on Leased Assets, Hire Purchases and Operating Leases
Rentals receivable 60,548,608,922 43,199,585,448 1,194,997,733 4,035,568,496
Unearned income (15,234,440,190) (12,056,480,660) (1,107,827,412) (2,149,077,576)
Earned income in suspense (162,686,300) (135,471,779) (43,171,033) (58,913,228)
Provision for doubtful debts (Note 18.5) (819,139,809) (723,337,218) (16,114,642) (92,338,515)
Deposits received from lessees (4,191,687,939) (1,347,539,014) – (22,591,880)
Balance as at 31 March 40,140,654,684 28,936,756,777 27,884,646 1,712,647,297
NOTES TO THE FINANCIAL STATEMENTS

LOLC 2011/12 REPORTS & ACCOUNTS 161
Group Company
As at 31 March 2012 2011 2012 2011
(Rs.) (Rs.) (Rs.) (Rs.)
18.5 Provision for Doubtful Debts
Balance as at 01 April 723,337,218 590,334,116 92,338,515 240,450,879
Provisions made during the year
- Charged against profits 221,515,129 446,403,174 (7,060,344) 85,137,556
- Written-off during the year (125,712,538) (313,400,072) (69,163,529) (233,249,920)
Balance as at 31 March 819,139,809 723,337,218 16,114,642 92,338,515
19 AdvAnCes And otHer LoAns
Rentals receivable on loans to customers 22,275,917,510 17,169,553,043 1,844,117,146 2,865,068,852
Capital outstanding of revolving loans 14,955,013,592 8,058,785,745 3,892,574,785 3,018,555,387
Factoring receivable (Note 19.1) 5,168,221,621 5,690,466,719 – 2,736,752,654
Pawning advances 1,825,622,013 1,180,641,246 – –
Transferred from investment property and other accounts receivable – 281,430,476 – 281,430,476
Overdue loan instalments 915,659,187 922,778,917 527,906,819 551,600,070
Earned income in suspense (251,842,196) (288,571,469) (178,216,399) (186,161,615)
Unearned loan income (4,625,657,796) (4,076,225,062) (393,610,556) (623,782,755)
Provision for doubtful debts (Note 19.2) (315,495,920) (225,291,100) (76,339,070) (88,538,184)
39,947,438,011 28,713,568,515 5,616,432,725 8,554,924,885
19.1 Factoring Receivable
Factoring receivable 5,573,720,413 5,824,454,237 2,736,752,654 2,811,441,884
Transferred to subsidiaries – – (2,736,752,654) –
Provision for doubtful debts (Note 19.1.1) (405,498,792) (133,987,518) – (74,689,230)
Balance as at 31 March 5,168,221,621 5,690,466,719 – 2,736,752,654
Group Company
For the year ended 31 March 2012 2011 2012 2011
(Rs.) (Rs.) (Rs.) (Rs.)
19.1.1 Provision for Doubtful Debts - Factoring
Balance as at 01 April 133,987,518 123,445,560 74,689,230 104,384,093
Transferred to subsidiary – – (74,689,230) –
Provisions made during the year 271,511,274 10,541,958 – (29,694,863)
Balance as at 31 March 405,498,792 133,987,518 – 74,689,230
19.2 Provision for Doubtful Debts
Balance as at 01 April 225,291,100 291,963,558 88,538,184 159,428,465
Provisions made during the year
- Charged against profits 145,767,823 34,924,378 5,434,685 7,069,333
- Written-off during the year (55,563,003) (101,596,836) (17,633,799) (77,959,614)
Balance as at 31 March 315,495,920 225,291,100 76,339,070 88,538,184
NOTES TO THE FINANCIAL STATEMENTS

162 LOLC 2011/12 REPORTS & ACCOUNTS
Group Company
As at 31 March 2012 2011 2012 2011
(Rs.) (Rs.) (Rs.) (Rs.)
20 InstALMent sALes
Rentals receivable on loans to customers 234,047,556 1,116,097,136 234,047,556 1,116,097,136
Overdue loan instalments 11,404,148 28,976,211 11,404,147 28,976,211
Earned income in suspense (212,659) (3,383,217) (212,659) (3,383,217)
Unearned loan income (85,265,457) (350,963,351) (85,265,457) (350,963,351)
Provision for doubtful debts (Note 20.1) (2,654,010) (24,719,656) (2,654,011) (24,719,656)
157,319,578 766,007,123 157,319,576 766,007,123
Group Company
For the year ended 31 March 2012 2011 2012 2011
(Rs.) (Rs.) (Rs.) (Rs.)
20.1 Provision for Doubtful Debts
Balance as at 01 April 24,719,656 44,193,705 24,719,656 44,193,705
Provisions made during the year
- Charged against profits (7,945,667) 35,590,842 (7,945,666) 35,590,842
- Written-off during the year (14,119,979) (55,064,891) (14,119,979) (55,064,891)
Balance as at 31 March 2,654,010 24,719,656 2,654,011 24,719,656
21 preMIuM reCeIvABLes
Group Company
As at 31 March 2012 2011 2012 2011
(Rs.) (Rs.) (Rs.) (Rs.)
Insurance premium receivables 239,616,479 – – –
Less: provision for bad debts – – – –
239,616,479 – – –
NOTES TO THE FINANCIAL STATEMENTS

LOLC 2011/12 REPORTS & ACCOUNTS 163
Group Company
As at 31 March 2012 2011 2012 2011
(Rs.) (Rs.) (Rs.) (Rs.)
22 InventorIesRaw materials 403,756,480 288,407,849 – –
Work-in-progress 44,411,571 31,229,424 – –
Finished goods and trading stocks 2,308,770,751 849,468,207 – –
Input materials 31,842,133 37,633,004 – –
Growing crop nurseries 15,975,922 11,303,473 – –
Harvested crop
- Tea 220,771,854 271,525,801 – –
- Rubber 25,499,507 45,953,245 – –
- Coconut 210,245 1,016,977 – –
Consumables, maintenance and spares 114,463,543 62,528,994 – –
Vehicle stocks 115,476,239 74,018,262 – 1,750,000
Goods in transit 60,517,290 41,738,684 – –
Others 32,229,618 – – –
3,373,925,153 1,714,823,920 – 1,750,000
Less: Provision for slow moving stocks (147,205,782) (115,639,730) – –
3,226,719,371 1,599,184,190 – 1,750,000
23 trAde And otHer Current Assets
Trade receivables 4,017,097,060 1,286,381,347 – –
Amount due from related parties (Note 46.3.1) 705,865,685 101,586,568 10,595,364,318 1,138,017,228
Unamortised finance charges 107,957,618 166,570,895 107,957,618 143,887,712
Tax recoverable (Note 23.1) 1,286,482,652 792,457,486 35,775,218 74,557,824
Loans given to employees (Note 23.2) 267,597,639 194,576,581 144,455,064 124,798,837
Other accounts receivables 3,043,801,848 3,095,509,751 935,856,285 335,654,846
9,428,802,502 5,637,082,628 11,819,408,501 1,816,916,447
23.1 Tax Recoverable
Value Added Tax (VAT) recoverable 1,079,166,924 530,665,710 – –
Advanced Corporate Tax (ACT) recoverable 505,972 651,516 – –
Withholding Tax (WHT) recoverable 89,396,610 67,671,688 – –
Economic Service Charge (ESC) recoverable 117,413,146 193,468,572 35,775,218 74,557,824
1,286,482,652 792,457,486 35,775,218 74,557,824
NOTES TO THE FINANCIAL STATEMENTS

164 LOLC 2011/12 REPORTS & ACCOUNTS
23.2 Loans given to Employees Group Company
For the year ended 31 March 2012 2011 2012 2011
(Rs.) (Rs.) (Rs.) (Rs.)
Balance at 01 April 194,576,581 109,215,678 124,798,837 72,295,067
Acquisition of subsidiaries 698,751 – – –
Granted during the period 154,695,401 152,294,084 73,482,621 94,870,176
Recovered during the period (82,373,094) (66,933,181) (53,826,394) (42,366,406)
267,597,639 194,576,581 144,455,064 124,798,837
24 prepAId LeAse rentALs
Vested Improvements to Vested Mature Immature Land Buildings Machinery Permanent Crop Roads and Other Vested TotalUnimproved Lands Lands Plantations Plantations Plantations Development Water Sanitation Diversification Bridges Assets
(Rs.) (Rs.) (Rs.) (Rs.) (Rs.) (Rs.) (Rs.) (Rs.) (Rs.) (Rs.) (Rs.) (Rs.) (Rs.)
Group
Cost/Valuation
Balance as at 01 April 2011 444,435 3,421,963 2,228,759 298,153,564 123,531 250,390 41,121,598 19,299,170 8,191,521 4,518,883 638,317 107,498,818 485,890,949
Additions – – – – – – – – – – – – –
Balance as at 31 March 2012 444,435 3,421,963 2,228,759 298,153,564 123,531 250,390 41,121,598 19,299,170 8,191,521 4,518,883 638,317 107,498,818 485,890,949
Accumulated Amortisation
Balance as at 01 April 2011 262,369 2,130,252 1,640,466 124,290,570 – 88,686 30,877,250 8,751,361 7,890,706 2,827,604 394,176 1,201,650 180,355,090
Charge for the year 14,815 114,417 52,236 56,564,644 – – 1,644,864 2,180,000 250,417 150,630 19,554 600,652 61,592,229
Balance as at 31 March 2012 277,184 2,244,669 1,692,702 180,855,214 – 88,686 32,522,114 10,931,361 8,141,123 2,978,234 413,730 1,802,302 241,947,319
Carrying Amount
As at 31 March 2012 167,251 1,177,294 536,057 117,298,350 123,531 161,704 8,599,484 8,367,809 50,398 1,540,649 224,587 105,696,516 243,943,630
As at 31 March 2011 182,066 1,291,711 588,293 173,862,994 123,531 161,704 10,244,348 10,547,809 300,815 1,691,279 244,141 106,297,168 305,535,859
NOTES TO THE FINANCIAL STATEMENTS
24.1 Maturata Plantations Ltd. and Pussellawa Plantations Ltd.Lease agreements of all JEDB/SLSPC estates handed over to the Group’s joint ventures namely, Maturata Plantations Ltd. and Pussellawa Plantations Ltd. have been executed to date. All of these leases are retrospective to 15 June 1992, the date of formation of these companies. The leasehold rights to the bare land on all of these estates have been taken into the books of the above companies on 15 June 1992, immediately after formation of these companies, in terms of the ruling obtained from the Urgent Issue Task Force (UITF) of The Institute of Chartered Accountants of Sri Lanka. For this purpose, the Board of the Company’s joint ventures decided at their meetings that leased bare land would be revalued at the value established for this land by Valuation Specialist Dr. Wickramasinghe just prior to the formation of these companies. The leasehold right to bare land of JEDB/SLSPC estates is being amortised by equal amounts over a 53 year period and the unexpired period of the lease as at the Balance Sheet date is 34 years.
Since the fair value of revalued assets differs materially from its carrying amount, the Board of Directors of the Group’s joint venture (namely, Maturata Plantations Ltd.), on 20 December 2005 has decided a further revaluation to be carried out as at 31 December 2005. The net amounts have been restated to the new valuation carried out by an independent and qualified valuer, Mr. K. Arthur Perera. The value of bare land which was not subjected to a land survey has been based on the current freehold bare land value which varies from district to district and estate to estate, depending on demand. The freehold values have been converted into leasehold value depending on the balance period of the lease. The revised UITF Ruling does not permit further revaluation of leasehold land. Maturata Plantations Ltd. has complied with this UITF Ruling.

LOLC 2011/12 REPORTS & ACCOUNTS 165
23.2 Loans given to Employees Group Company
For the year ended 31 March 2012 2011 2012 2011
(Rs.) (Rs.) (Rs.) (Rs.)
Balance at 01 April 194,576,581 109,215,678 124,798,837 72,295,067
Acquisition of subsidiaries 698,751 – – –
Granted during the period 154,695,401 152,294,084 73,482,621 94,870,176
Recovered during the period (82,373,094) (66,933,181) (53,826,394) (42,366,406)
267,597,639 194,576,581 144,455,064 124,798,837
24 prepAId LeAse rentALs
Vested Improvements to Vested Mature Immature Land Buildings Machinery Permanent Crop Roads and Other Vested TotalUnimproved Lands Lands Plantations Plantations Plantations Development Water Sanitation Diversification Bridges Assets
(Rs.) (Rs.) (Rs.) (Rs.) (Rs.) (Rs.) (Rs.) (Rs.) (Rs.) (Rs.) (Rs.) (Rs.) (Rs.)
Group
Cost/Valuation
Balance as at 01 April 2011 444,435 3,421,963 2,228,759 298,153,564 123,531 250,390 41,121,598 19,299,170 8,191,521 4,518,883 638,317 107,498,818 485,890,949
Additions – – – – – – – – – – – – –
Balance as at 31 March 2012 444,435 3,421,963 2,228,759 298,153,564 123,531 250,390 41,121,598 19,299,170 8,191,521 4,518,883 638,317 107,498,818 485,890,949
Accumulated Amortisation
Balance as at 01 April 2011 262,369 2,130,252 1,640,466 124,290,570 – 88,686 30,877,250 8,751,361 7,890,706 2,827,604 394,176 1,201,650 180,355,090
Charge for the year 14,815 114,417 52,236 56,564,644 – – 1,644,864 2,180,000 250,417 150,630 19,554 600,652 61,592,229
Balance as at 31 March 2012 277,184 2,244,669 1,692,702 180,855,214 – 88,686 32,522,114 10,931,361 8,141,123 2,978,234 413,730 1,802,302 241,947,319
Carrying Amount
As at 31 March 2012 167,251 1,177,294 536,057 117,298,350 123,531 161,704 8,599,484 8,367,809 50,398 1,540,649 224,587 105,696,516 243,943,630
As at 31 March 2011 182,066 1,291,711 588,293 173,862,994 123,531 161,704 10,244,348 10,547,809 300,815 1,691,279 244,141 106,297,168 305,535,859
NOTES TO THE FINANCIAL STATEMENTS

166 LOLC 2011/12 REPORTS & ACCOUNTS
25 InvestMent propertIes
Group Company
For the year ended 31 March 2012 2011 2012 2011
(Rs.) (Rs.) (Rs.) (Rs.)
Balance at the beginning of the year 439,649,668 451,743,865 247,500,000 242,274,225
On acquisition of subsidiaries 3,252,409,369 – – –
Additions – – – –
Disposals (6,861,090) – – –
Transfers (to)/from property, plant and equipment (Note 25.1) 409,548,553 1,454,868 165,000,000 –
Change in fair value during the year 251,224,000 (13,549,065) – 5,225,775
Balance at the end of the year 4,345,970,500 439,649,668 412,500,000 247,500,000
Investment property comprises of a number of commercial properties that are leased/rented out to third parties. Each of these leases/rents contains an initial lease period of one year and 32 years for the excel world property. Subsequent renewals are negotiated with the lessee and on average renewal periods are three to five years for the excel world property it is 40 years.
25.1 Transfers from Owner-Occupied PropertiesDuring the financial year Rs. 165,000,000/- worth of property of the Company and Rs. 409,548,553/- worth of properties of the Group have been transferred from property, plant and equipment (Note 33: Property, Plant and Equipment) to investment property, since the property was no longer used by the Group and as such it was decided that these buildings be leased to third parties.
25.2 Details of Investment Properties Group Company
As at 31 March 2012 2011 2012 2011
(Rs.) (Rs.) (Rs.) (Rs.)
Owned properties classified as investments properties 595,970,500 439,649,668 412,500,000 247,500,000
Properties held under operating lease classified as investment properties 3,750,000,000 – – –
4,345,970,500 439,649,668 412,500,000 247,500,000
25.3 Relevant Income and Expenditure Relating to Investment Properties
Group Company
For the year ended 31 March 2012 2011 2012 2011
(Rs.) (Rs.) (Rs.) (Rs.)
Rent income earned 37,215,883 891,993 – –
Maintenance expenses 28,005 – – –
NOTES TO THE FINANCIAL STATEMENTS

LOLC 2011/12 REPORTS & ACCOUNTS 167
25.4 The fair value of investment properties were determined by independent valuers who hold recognised and relevant professional qualifications and have recent experience in the location and category of the investments properties. The method of valuation used is on recent sales prices of comparative properties.
Significant assumptions used in determining the fair value:
1. The property is prime and most suitable for high rise development.
2. Located in a prime commercial area.
3. Discounting factor used for the valuation - 5.5%.
4. Period considered - 32 years.
26 tIMBer And ruBBer stoCKs
Group
For the year ended 31 March 2012 2011
(Rs.) (Rs.)
Balance as at 01 April 3,778,893,130 3,614,748,311
Transfer from immature plantations – (2,915,530)
Additions from new planting 26,162,262 17,496,840
Harvested during the period – –
Gain/(Loss) from valuation (27,384,221) 149,563,509
Balance as at 31 March 3,777,671,171 3,778,893,130
The carrying value of timber as at the year end has been computed as follows: Group
As at 31 March 2012 2011
(Rs.) (Rs.)
Valuation of timber 3,718,948,204 3,721,410,982
Cost of timber plants below three years of age 58,722,967 57,482,148
3,777,671,171 3,778,893,130
The timber stocks of the Group were valued by Mr. K.T.D. Tissera, an independent Chartered Valuation Surveyor on a tree basis. Based on the Valuation Report dated 05 April 2012, the timber trees were valued as at 31 March 2012. The direct cost attributable to new planting has been added to the timber stocks.
Timber trees namely Eucalyptus Torariyana, Albezzia, Graveelia, Eucalyptus Grandis, Astonia, Pinus, Toona, Mahogany, Teak, Jak, Turpentine, Rubber, Nadun, Mango, Pellen, Hora, Domba, Lunumidella, Wal Del and Mara on the plantations have been taken into consideration in this valuation of timber trees.
NOTES TO THE FINANCIAL STATEMENTS

168 LOLC 2011/12 REPORTS & ACCOUNTS
In valuing the timber plantations, undermentioned factors have been taken into consideration.
i. The present age of the tree.
ii. Maturity of the trees are based on variety (species) of the tree.
iii. Annual marginal increase in growth in the timber content according to species and present size of the tree.
iv. The number of years to harvest in case of trees are matured for harvesting (harvesting programmes)
v. Timber content of harvestable trees.
vi. The timber content of immature trees at an estimated future harvestable date.
vii. The current price of species of the timber per cubic foot at the relevant date.
The fair value is determined as being the net present value of expected future cash flows using a discounted rate of 12%. Significant assumption used in the valuation of timber stocks are as follows:
i. Future cash flows are determined by references to current timber prices without considering the inflationary effect.
ii. The ongoing cost of growing the trees which are deducted in determining the net cash flows are constant in real terms.
iii. Timber trees that have not come up to a harvestable size are valued working out the period that would take for those trees to grow up to a harvestable size.
iv. The present value of the tree is worked out based on the projected size and the estimated number of years it would take to reach that size. This is worked out on the basis of an annual marginal increase of timber content which normally ranges from 0.55 to 1.5 cm per year for trees of diameter girth over 10 cm.
v. Trees have been valued as per the current timber prices in the domestic market based on the price list of the State Timber Corporation and price of timber trees sold by estate and price of logs and sawn timber of popular timber traders in Sri Lanka.
vi. The value of each matured species of timber is worked out on the price of a cubic of timber in the market, the species and the available cubic content of timber in the tree.
vii. Due consideration has been given for cost of felling, transport, sawing and cost of sale including obtaining approval for felling.
NOTES TO THE FINANCIAL STATEMENTS
27 MAture And IMMAture pLAntAtIons
Land Development Cost
Immature Plantations Mature Plantations Total
Tea Rubber Coconut Mixed Crops Total Tea Rubber Coconut Mixed Crops Total
(Rs.) (Rs.) (Rs.) (Rs.) (Rs.) (Rs.) (Rs.) (Rs.) (Rs.) (Rs.) (Rs.) (Rs.)
GroupCost/ValuationBalance as at 01 April 2011 29,329,032 196,337,518 708,468,954 3,414,304 2,917,192 911,137,968 502,985,256 413,770,601 10,134,526 1,504,072 928,394,455 1,868,861,455
Additions 912,042 67,474,655 43,644,066 206,422 4,224,201 115,549,344 – – – – – 116,461,386
Transfers – (96,636,672) (65,720,191) (359,484) (245,873) (162,962,220) 96,636,672 65,720,191 359,484 245,873 162,962,220 –
Balance as at 31 March 2012 30,241,074 167,175,501 686,392,829 3,261,242 6,895,520 863,725,092 599,621,928 479,490,792 10,494,010 1,749,945 1,091,356,675 1,985,322,841
Accumulated DepreciationBalance as at 01 April 2011 1,839,632 – – – – – 118,018,715 131,387,228 1,779,978 311,406 251,497,327 253,336,959
Charge for the year 563,078 – – – – – 16,537,573 22,228,035 611,291 45,515 39,422,414 39,985,492
Balance as at 31 March 2012 2,402,710 – – – – – 134,556,288 153,615,263 2,391,269 356,921 290,919,741 293,322,451
Carrying AmountAs at 31 March 2012 27,838,364 167,175,501 686,392,829 3,261,242 6,895,520 863,725,092 465,065,640 325,875,529 8,102,741 1,393,024 800,436,934 1,692,000,390
As at 31 March 2011 27,489,400 196,337,518 708,468,954 3,414,304 2,917,192 911,137,968 384,966,541 282,383,373 8,354,548 1,192,666 676,897,128 1,615,524,496

LOLC 2011/12 REPORTS & ACCOUNTS 169
NOTES TO THE FINANCIAL STATEMENTS
27 MAture And IMMAture pLAntAtIons
Land Development Cost
Immature Plantations Mature Plantations Total
Tea Rubber Coconut Mixed Crops Total Tea Rubber Coconut Mixed Crops Total
(Rs.) (Rs.) (Rs.) (Rs.) (Rs.) (Rs.) (Rs.) (Rs.) (Rs.) (Rs.) (Rs.) (Rs.)
GroupCost/ValuationBalance as at 01 April 2011 29,329,032 196,337,518 708,468,954 3,414,304 2,917,192 911,137,968 502,985,256 413,770,601 10,134,526 1,504,072 928,394,455 1,868,861,455
Additions 912,042 67,474,655 43,644,066 206,422 4,224,201 115,549,344 – – – – – 116,461,386
Transfers – (96,636,672) (65,720,191) (359,484) (245,873) (162,962,220) 96,636,672 65,720,191 359,484 245,873 162,962,220 –
Balance as at 31 March 2012 30,241,074 167,175,501 686,392,829 3,261,242 6,895,520 863,725,092 599,621,928 479,490,792 10,494,010 1,749,945 1,091,356,675 1,985,322,841
Accumulated DepreciationBalance as at 01 April 2011 1,839,632 – – – – – 118,018,715 131,387,228 1,779,978 311,406 251,497,327 253,336,959
Charge for the year 563,078 – – – – – 16,537,573 22,228,035 611,291 45,515 39,422,414 39,985,492
Balance as at 31 March 2012 2,402,710 – – – – – 134,556,288 153,615,263 2,391,269 356,921 290,919,741 293,322,451
Carrying AmountAs at 31 March 2012 27,838,364 167,175,501 686,392,829 3,261,242 6,895,520 863,725,092 465,065,640 325,875,529 8,102,741 1,393,024 800,436,934 1,692,000,390
As at 31 March 2011 27,489,400 196,337,518 708,468,954 3,414,304 2,917,192 911,137,968 384,966,541 282,383,373 8,354,548 1,192,666 676,897,128 1,615,524,496

170 LOLC 2011/12 REPORTS & ACCOUNTS
NOTES TO THE FINANCIAL STATEMENTS
28 InvestMents In JoInt venture CoMpAnIes
No. of Shares Cost Principal Activity
As at 31 March 2012 2011 2012 2011
(Rs.) (Rs.)
Company
Hydro Power Free Lanka PLC 976,700 2,485,400 14,298,187 36,384,471 Hydro Power
Free Lanka Capital Holding PLC – 21,276,596 – 100,000,000 Investing Activities
total 14,298,187 136,384,471
28.1 The following companies have been accounted for as joint ventures of the Group:
Maturata Plantation Ltd. (MPL) Hydro Power Free Lanka 2 (Pvt) Ltd. (HPFL 2)
Free Lanka Plantation Company (FLPC) Hydro Power Free Lanka 3 (Pvt) Ltd. (HPFL 3)
Free Lanka Capital Holding PLC (FLCHP) Free Lanka Power 1 (Pvt) Ltd. (FLP 1)
Free Lanka Power Holding (Pvt) Ltd. (FLPHL) Free Lanka Power 2 (Pvt) Ltd. (FLP 2)
Pussellawa Estates Ltd. (PEL) Free Lanka Power 3 (Pvt) Ltd. (FLP 3)
Free Lanka Capital Properties (Pvt) Ltd. (FLCPL) The Tea Leaf Resort Holding (Pvt) Ltd. (TLRL)
Melfort Green Tea (Pvt) Ltd. (MFGTL) Free Lanka Capital (Pvt) Ltd. (FLCL)
Free Lanka Management Company (FLMC) Free Lanka Estate Bungalows (Pvt) Ltd. (FLEBL)
Hydro Power Free Lanka PLC (HPFLP) Agrisil Holdings Ltd. (AGL)
28.2 The summarised financial information of joint ventures for the year ended 31 March 2012 not adjusted for the percentage of ownership held by the Group:
Entity Principal Activities Total Assets Total Liabilities Equity Income Expenses Profit/(Loss) for the period
(Rs.) (Rs.) (Rs.) (Rs.) (Rs.) (Rs.)
MPL Plantations 4,684,865,114 2,450,753,425 2,234,111,690 1,977,557,360 2,333,542,734 (355,985,374)
FLPC Plantation management 956,929,581 28,359,418 928,570,164 – 22,600,677 (22,600,677)
FLCHP Investing in ventures 2,841,922,000 120,045,000 2,721,877,000 192,882,000 40,636,520 152,245,480
FLPHL Investing in ventures 115,590,477 98,380 115,492,097 16,771,946 202,671 16,569,275
PEL Plantations 9,837,064,877 2,105,674,307 7,731,390,570 3,806,882,907 3,323,329,705 483,553,202
FLCPL Real estate business 346,724,008 7,213,506 339,510,502 – 4,848,685 (4,848,685)
MFGTL Manufacturing green tea 43,469,003 10,305,544 33,163,459 120,280,234 110,916,218 9,364,016
FLMC Investing in ventures 821,781,758 20,420,419 801,361,339 246,297,885 30,898,560 215,399,325
HPFLP Power generation 845,670,559 55,626,709 790,043,851 77,093,449 71,575,116 5,518,333
HPFL 2 Hydro power generation 96,827,648 87,877,794 8,949,854 1,183,426 784,088 399,338
HPFL 3 Hydro power generation 99,214,793 90,086,278 9,128,515 1,058,525 686,034 372,491
FLP 1 Hydro power generation 13,538,858 4,133,873 9,404,985 – 285,951 (285,951)
FLP 2 Hydro power generation 10,111,529 519,729 9,591,800 – 218,662 (218,662)
FLP 3 Hydro power generation 10,400,024 975,776 9,424,248 – 294,224 (294,224)
TLRL Leisure 7,764,070 7,316,673 447,397 13,913 3,150,785 (3,136,872)
FLCL Investing in ventures 748,600,000 664,717,000 83,883,000 – 1,482,000 (1,482,000)
FLEBL Leisure 1,000,000 78,898 921,102 – 78,898 (78,898)
AGL Non-operational 33,600,000 1,276,160 32,323,840 – – –
21,515,074,299 5,655,478,889 15,859,595,413 6,440,021,645 5,945,531,528 494,490,117

LOLC 2011/12 REPORTS & ACCOUNTS 171
NOTES TO THE FINANCIAL STATEMENTS
29 InvestMents In equItY ACCounted Investees
Holding No. of Shares Cost
As at 31 March 2012 2011 2012 2011 2012 2011
(%) (%) (Rs.) (Rs.)
29.1 Company
PRASAC Micro Finance Institution Ltd. (PRASAC) 18.00 18.00 138,626 138,626 106,691,120 108,977,301
Gal Oya Plantation Ltd. (GPL) 23.00 23.00 24,788,235 24,788,235 247,882,353 247,882,353
Sierra Construction (Pvt) Ltd. (SCPL) 10.00 10.00 12,490,250 12,490,250 600,000,000 600,000,000
Sierra Holdings (Pvt) Ltd. (SHL) 10.00 10.00 4,496,492 4,496,492 200,000,000 200,000,000
Agstar Fertilizer PLC (AFPL) 20.00 10.00 60,213,500 1,825,000 390,184,250 54,476,250
total 1,544,757,723 1,211,335,904
Group Holding No. of Shares Value
As at 31 March 2012 2011 2012 2011 2012 2011
(%) (%) (Rs.) (Rs.)
29.2 GroupUnquoted investments
Commercial Insurance Brokers (Pvt) Ltd. (CIB)
Investor Commercial Leasing and Finance Ltd. 40 40 240,000 240,000 800,000 800,000
40 40 240,000 240,000 800,000 800,000
PRASAC Micro Finance Institution Ltd. (PRASAC) (Note 29.5)
Investor Lanka Orix Leasing Company PLC 18 18 138,626 138,626 106,691,120 108,977,301
18 18 138,626 138,626 106,691,120 108,977,301
Associated Battery Manufacturers (Cey.) Ltd. (ABM)
Investor Standard Finance (Pvt) Ltd. 39 39 2,439,355 2,439,355 24,393,550 24,393,550
39 39 2,439,355 2,439,355 24,393,550 24,393,550
Gal Oya Plantations Ltd. (GPL)
Investor Lanka ORIX Leasing Company PLC 23 23 24,788,235 24,788,235 247,882,353 247,882,353
Brown & Company PLC 23 23 22,309,412 22,309,412 248,997,882 248,997,882
46 46 47,097,647 47,097,647 496,880,235 496,880,235
Sierra Construction (Pvt) Ltd. (SCPL) - Group
Investor Lanka ORIX Leasing Company PLC 10 10 12,490,250 12,490,250 600,000,000 600,000,000
Browns Investments PLC 10 10 12,490,253 12,490,253 600,903,926 600,903,926
20 20 24,980,503 24,980,503 1,200,903,926 1,200,903,926
Sierra Holdings (Pvt) Ltd. (SHL) - Group
Investor Lanka ORIX Leasing Company PLC 10 10 4,496,492 4,496,492 200,000,000 200,000,000
Browns Investments PLC 10 10 4,496,492 4,496,492 199,911,042 199,911,042
20 20 8,992,984 8,992,984 399,911,042 399,911,042

172 LOLC 2011/12 REPORTS & ACCOUNTS
Group Holding No. of Shares Value
As at 31 March 2012 2011 2012 2011 2012 2011
(%) (%) (Rs.) (Rs.)
Agstar Fertilizer PLC (AFPL) - Group
Investor Lanka ORIX Leasing Company PLC 20 10 60,213,500 1,825,000 390,184,250 54,476,250
Browns Investments PLC 13 10 39,000,000 1,825,000 273,133,750 54,476,250
Ajax Engineers (Pvt) Ltd. 0.4 – 1,250,000 – 10,000,000 –
33 20 100,463,500 3,650,000 673,318,000 108,952,500
Virginia International Ltd. (VIL)
Investor Browns Investments PLC 45 – 800,000 – 4,000,000 –
45 – 800,000 – 4,000,000 –
Taprobane Plantation Ltd. (TPL)
Investor Browns Investments PLC 45 – 22,500 – 22,500 –
45 – 22,500 – 22,500 –
total cost to the Group 2,906,920,373 2,340,818,554
29.3 Equity Value of Investment in Equity Accounted Investees
As at 31 March 2012
Entity
Equity Value of Investments as at
01 April 2011
Acquisition during
the Year
Share of Profits/(Loss)
Net of Tax
Dividend Received
Equity Value of Investments as at
31 March 2012
(Rs.) (Rs.) (Rs.) (Rs.) (Rs.)
Group
CIB 52,968,268 – 7,327,454 (960,000) 59,335,722
PRASAC 354,757,078 – 173,591,815 – 528,348,893
ABM 191,116,503 – 51,232,553 (43,908,480) 198,440,576
GPL 444,298,650 – (90,402,548) – 353,896,102
SCPL 1,202,386,298 – (5,413,718) – 1,196,972,580
SHL 394,237,951 – 36,842,253 – 431,080,204
AFPLC 119,313,967 564,365,500 92,420,517 – 776,099,984
VIL – 4,000,000 – – 4,000,000
TPL – 22,500 4,360,347 – 4,382,847
total 2,759,078,715 568,388,000 269,958,673 (44,868,480) 3,552,556,908
NOTES TO THE FINANCIAL STATEMENTS

LOLC 2011/12 REPORTS & ACCOUNTS 173
As at 31 March 2011
Entity
Equity Value of Investments as at
01 April 2010
Acquisition during
the Year
Share of Profits/(Loss)
Net of Tax
Dividend Received
Reclassifications/Transfers/Disposals
Equity Value of Investments as at
31 March 2011
(Rs.) (Rs.) (Rs.) (Rs.) (Rs.) (Rs.)
Group
CIB 50,809,436 – 3,118,832 (960,000) – 52,968,268
PRASAC 255,729,271 – 99,027,807 – – 354,757,078
IGBRIL 7,259,080 – (1,377,610) – (5,881,470) –
ABM 169,451,572 – 44,838,911 (23,173,920) – 191,116,563
BDIPL 32,325,750 – 9,821,917 – (42,147,667) –
Seylan 2,519,821,732 – 69,503,118 – (2,589,324,850) –
GPL – 496,880,235 (52,581,586) – – 444,298,649
SCPL – 1,200,903,925 1,482,372 – – 1,202,386,297
SHL – 399,910,984 (5,673,091) – – 394,237,893
AFPLC – 108,952,500 10,361,467 – – 119,313,967
total 3,035,396,841 2,206,647,644 178,522,137 (24,133,920) (2,637,353,987) 2,759,078,715
29.4 The Summarised Financial Information of Equity Accounted Investees for the year ended 31 March 2012 not adjusted for the percentage of ownership held by the Group:
Component Principal Activities Total Assets Total Liabilities Equity Income Expenses Profit/(Loss) for the Period
(Rs.) (Rs.) (Rs.) (Rs.) (Rs.) (Rs.)
CIB Insurance Broking 217,843,129 69,503,825 148,339,304 159,944,670 (141,626,036) 18,318,634
PRASAC Micro Finance 71,763,708,621 55,799,673,191 15,964,035,430 3,585,016,280 (2,607,916,302) 977,099,978
ABM Manufacturing 1,010,198,380 494,768,159 515,430,221 1,852,075,920 (1,719,004,355) 133,071,565
GPL Plantations 1,424,930,228 1,291,754,130 133,176,098 24,434,576 (229,429,015) (204,994,439)
SCPL Construction 10,739,422,760 7,580,596,579 3,158,826,181 5,196,364,982 (5,186,445,274) 9,919,708
SHL Investing 17,111,557,862 11,371,413,299 5,740,144,563 9,561,825,613 (9,186,279,900) 375,545,713
AGFL Fertilizer manufacturing 4,180,206,491 2,313,221,754 1,866,984,737 1,805,149,111 (1,518,678,618) 286,470,493
VIL Non-operational – – – – – –
TPL Plantations 20,862,143 11,335,151 9,526,992 78,966,603 (69,276,945) 9,689,658
106,468,729,614 78,932,266,088 27,536,463,526 22,263,777,755 (20,658,656,445) 1,605,121,310
The Directors’ valuation of investments in equity accounted investees has been done on net assets basis except for the investment in Agstar Fertilizer PLC, for which the market value is considered. Based on this valuation, no adjustments were required for the carrying amounts. Agstar Fertilizer PLC is listed in the Colombo Stock Exchange (CSE). Based on its closing price of Rs. 10.20 at the reporting date, the fair value of the Group’s investment is Rs. 1,024,727,700/-.
29.5 PRASAC Micro Finance Institution Ltd.The Group has less than 20% ownership (18%) over the voting rights. However, the Group is considered to have significant influence over the entity due to the fact that it has Board representation and is providing microfinance-related business services and expertise on a regular basis.
The financial year end of PRASAC is 31 December and the Financial Statements for the year ended 31 December 2011 has been considered for equity accounting purposes.
NOTES TO THE FINANCIAL STATEMENTS
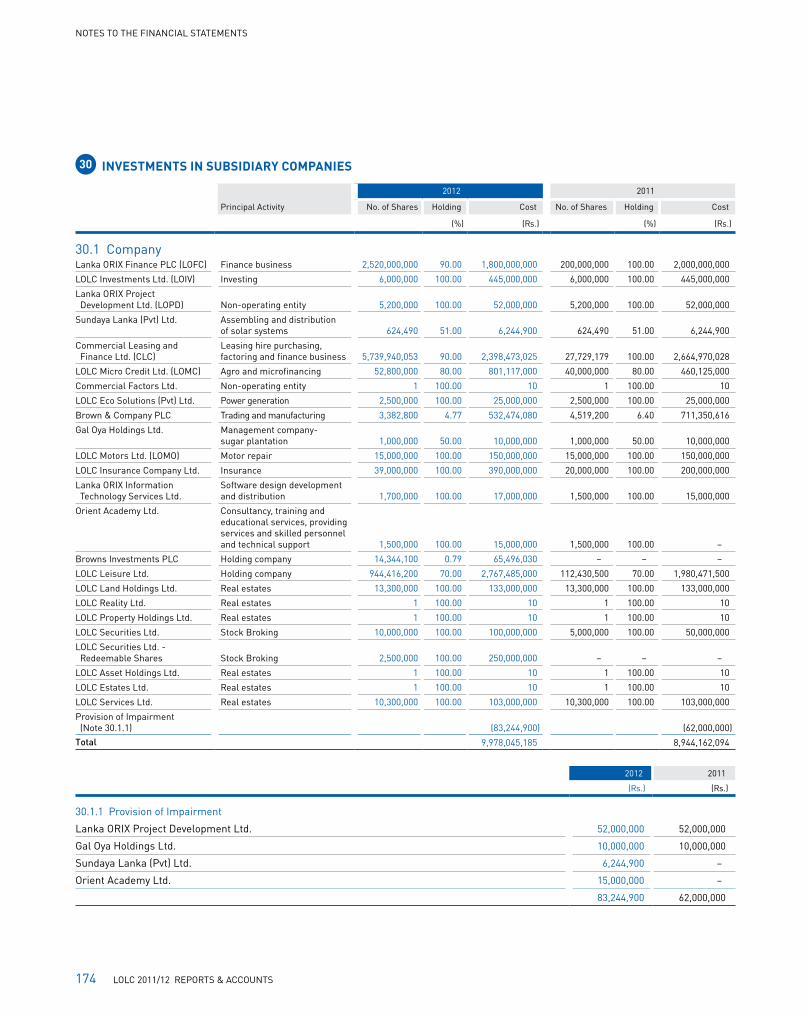
174 LOLC 2011/12 REPORTS & ACCOUNTS
30 InvestMents In suBsIdIArY CoMpAnIes
2012 2011
Principal Activity No. of Shares Holding Cost No. of Shares Holding Cost
(%) (Rs.) (%) (Rs.)
30.1 CompanyLanka ORIX Finance PLC (LOFC) Finance business 2,520,000,000 90.00 1,800,000,000 200,000,000 100.00 2,000,000,000
LOLC Investments Ltd. (LOIV) Investing 6,000,000 100.00 445,000,000 6,000,000 100.00 445,000,000
Lanka ORIX Project Development Ltd. (LOPD) Non-operating entity 5,200,000 100.00 52,000,000 5,200,000 100.00 52,000,000
Sundaya Lanka (Pvt) Ltd. Assembling and distribution of solar systems 624,490 51.00 6,244,900 624,490 51.00 6,244,900
Commercial Leasing and Finance Ltd. (CLC)
Leasing hire purchasing, factoring and finance business 5,739,940,053 90.00 2,398,473,025 27,729,179 100.00 2,664,970,028
LOLC Micro Credit Ltd. (LOMC) Agro and microfinancing 52,800,000 80.00 801,117,000 40,000,000 80.00 460,125,000
Commercial Factors Ltd. Non-operating entity 1 100.00 10 1 100.00 10
LOLC Eco Solutions (Pvt) Ltd. Power generation 2,500,000 100.00 25,000,000 2,500,000 100.00 25,000,000
Brown & Company PLC Trading and manufacturing 3,382,800 4.77 532,474,080 4,519,200 6.40 711,350,616
Gal Oya Holdings Ltd. Management company- sugar plantation 1,000,000 50.00 10,000,000 1,000,000 50.00 10,000,000
LOLC Motors Ltd. (LOMO) Motor repair 15,000,000 100.00 150,000,000 15,000,000 100.00 150,000,000
LOLC Insurance Company Ltd. Insurance 39,000,000 100.00 390,000,000 20,000,000 100.00 200,000,000
Lanka ORIX Information Technology Services Ltd.
Software design development and distribution 1,700,000 100.00 17,000,000 1,500,000 100.00 15,000,000
Orient Academy Ltd. Consultancy, training and educational services, providing services and skilled personnel and technical support 1,500,000 100.00 15,000,000 1,500,000 100.00 –
Browns Investments PLC Holding company 14,344,100 0.79 65,496,030 – – –
LOLC Leisure Ltd. Holding company 944,416,200 70.00 2,767,485,000 112,430,500 70.00 1,980,471,500
LOLC Land Holdings Ltd. Real estates 13,300,000 100.00 133,000,000 13,300,000 100.00 133,000,000
LOLC Reality Ltd. Real estates 1 100.00 10 1 100.00 10
LOLC Property Holdings Ltd. Real estates 1 100.00 10 1 100.00 10
LOLC Securities Ltd. Stock Broking 10,000,000 100.00 100,000,000 5,000,000 100.00 50,000,000
LOLC Securities Ltd. - Redeemable Shares Stock Broking 2,500,000 100.00 250,000,000 – – –
LOLC Asset Holdings Ltd. Real estates 1 100.00 10 1 100.00 10
LOLC Estates Ltd. Real estates 1 100.00 10 1 100.00 10
LOLC Services Ltd. Real estates 10,300,000 100.00 103,000,000 10,300,000 100.00 103,000,000
Provision of Impairment (Note 30.1.1) (83,244,900) (62,000,000)
total 9,978,045,185 8,944,162,094
2012 2011
(Rs.) (Rs.)
30.1.1 Provision of Impairment
Lanka ORIX Project Development Ltd. 52,000,000 52,000,000
Gal Oya Holdings Ltd. 10,000,000 10,000,000
Sundaya Lanka (Pvt) Ltd. 6,244,900 –
Orient Academy Ltd. 15,000,000 –
83,244,900 62,000,000
NOTES TO THE FINANCIAL STATEMENTS

LOLC 2011/12 REPORTS & ACCOUNTS 175
30.2 Group 2012 2011
No. of Shares Control Holding No. of Shares Control Holding
(%) (%)
Ajax Engineers (Pvt) Ltd. 239,694 51.00 – –
B G Air Services (Pvt) Ltd. 50,000 100.00 50,000 100.00
Brown & Company PLC 39,788,976 56.14 39,788,976 56.15
Browns Battery (Pvt ) Ltd. 10,000 100.00 10,000 100.00
Browns Group Industries (Pvt) Ltd. 2,800,000 100.00 2,800,000 100.00
Browns Group Motels Ltd. 399,859 75.97 399,859 75.97
Browns Health Care (Pvt) Ltd. 17,500,000 87.50 – –
Browns Industrial Park Ltd. 15,405,137 100.00 15,405,137 100.00
Browns Investments PLC 773,373,900 42.73 730,000,000 40.33
Browns Motor (Pvt) Ltd. 5,000,000 100.00 5,000,000 100.00
Browns Thermal Engineering (Pvt) Ltd. 824,997 55.00 824,997 55.00
Browns Tours (Pvt) Ltd. 2,030,000 99.99 2,030,000 99.99
Central Services Ltd. 802 100.00 802 100.00
CFT Engineering Ltd. 3,450 95.04 3,450 95.04
Commercial Factors Ltd. 1 100.00 1 100.00
Commercial Leasing & Finance Ltd. 5,739,939,225 90.00 27,729,179 100.00
Dikwella Resort (Pvt) Ltd. 481,665 100.00 – –
Diriya Investments (Pvt) Ltd. 108,053,352 50.00 108,053,352 50.00
Eden Resort & Spa PLC 24,398,472 46.21 24,398,472 46.21
Engineering Services (Pvt) Ltd. 147,502 100.00 147,502 100.00
Excel Global Holding Ltd. 53,448,329 100.00 – –
Fernwood Corporate Services Ltd. 10,204 100.00 – –
Fernwood Lanka Ltd. 800,000 100.00 – –
Gal Oya Holdings Ltd. 2,000,000 100.00 2,000,000 100.00
I.G. Browns Rubber Industries (Pvt) Ltd. 420,000 93.34 420,000 93.34
Klevernberg (Pvt) Ltd. 11,856,000 76.00 3,120,000 60.00
Lanka Decals (Pvt) Ltd. 14,000,000 100.00 – –
Lanka ORIX Finance PLC 2,520,000,000 90.00 200,000,000 100.00
Lanka ORIX Information Technology Services Ltd. 1,500,000 100.00 1,500,000 100.00
LOLC Micro Credit Ltd. 52,800,000 80.00 40,000,000 80.00
Lanka ORIX Project Developers (LOPD) 5,200,000 100.00 5,200,000 100.00
LOLC Asset Holdings Ltd. 1 100.00 1 100.00
LOLC Eco Solutions (Pvt) Ltd. 2,500,000 100.00 2,500,000 100.00
LOLC Estates Ltd. 1 100.00 1 100.00
LOLC Insurance Company Ltd. 39,000,000 100.00 20,000,000 100.00
LOLC Factors Ltd. 1 100.00 1 100.00
LOLC Investments Ltd. 6,000,000 100.00 6,000,000 100.00
LOLC Land Holdings Ltd. 1 100.00 1 100.00
LOLC Leisure Ltd. 1,349,166,000 100.00 160,615,000 100.00
NOTES TO THE FINANCIAL STATEMENTS

176 LOLC 2011/12 REPORTS & ACCOUNTS
2012 2011
No. of Shares Control Holding No. of Shares Control Holding
(%) (%)
LOLC Motors Ltd. 15,000,000 100.00 15,000,000 100.00
LOLC Property Investments Ltd. 1 100.00 1 100.00
LOLC Realty Ltd. 1 100.00 1 100.00
LOLC Securities Ltd. 10,000,000 100.00 5,000,000 100.00
LOLC Services Ltd. 10,300,000 100.00 10,300,000 100.00
Masons Mixture Ltd. 4,289,849 99.66 4,289,849 99.66
Millennium Development Ltd. 44,390,823 100.00 – –
Mutugalla Estates (Pvt) Ltd. 960 80.00 960 80.00
Orient Academy Ltd. 1,500,000 100.00 1,500,000 100.00
Palm Garden Hotels PLC 5,914,169 79.18 5,914,169 79.18
Pathregalla Estates (Pvt) Ltd. 3,831 91.22 3,831 91.22
Riverina Hotel PLC 10,566,107 70.29 10,566,107 70.29
Royal Fernwood Porcelain Ltd. 316,440,611 76.68 – –
Sifang Lanka (Pvt) Ltd. 2,050,000 100.00 2,050,000 100.00
Sifang Lanka Trading (Pvt) Ltd. 3,000,002 100.00 3,000,002 100.00
Snowcem Products Lanka (Pvt) Ltd. 400,000 100.00 400,000 100.00
Southern Cleaners Ltd. 201,267 100.00 201,267 100.00
Speed Italia Ltd. 100,000 100.00 – –
Standard Finance (Pvt) Ltd. 2,700,000 100.00 2,700,000 100.00
Sumudra Beach Resorts (Pvt) Ltd. 1,000,000 100.00 – –
Sundaya Lanka (Pvt) Ltd. 624,490 51.00 624,490 51.00
Taprobane Capital (Pvt) Ltd. 18,200,002 100.00 – –
Taprobane Fund Management Company 15,725,000 62.90 15,725,000 62.90
The Hatton Transport & Agency Company (Pvt) Ltd. 112,000 100.00 112,000 98.34
Tropical Villas (Pvt) Ltd. 10,344,300 100.00 6,206,580 60.00
United Dendro Energy (Pvt ) Ltd. 1,000 75.00 1,000 75.00
Walker & Greig (Pvt ) Ltd. 1 100.00 1 100.00
30.2.1 Diriya Investments (Pvt) Ltd.
Lanka ORIX Investments Ltd. (LOIV) which is a fully-owned subsidiary of LOLC holds 50% of the shares of the aforesaid Company while the rest of the shares are held by a single shareholder. For the purpose of consolidation, Diriya is considered as a subsidiary since LOLC through LOIV exercises control over the operating and financial policies of Diriya, with the concurrence of the other shareholder.
30.2.2 Browns Investments PLC
LOLC directly and through its subsidiaries, including Brown & Company PLC, holds a total of 43% in Browns Investments PLC (BI). Though the percentage held directly and indirectly by LOLC is less than 50%, BI is considered as a subsidiary as a result of an agreement between Taprobane Holdings Ltd. (which holds 26% in BI) and Brown & Company PLC, allowing the latter to exercise voting rights on behalf of the Taprobane Holdings Ltd. The existence of this agreement gives a total voting right of 69% and thus it is considered as a subsidiary of the LOLC Group.
NOTES TO THE FINANCIAL STATEMENTS

LOLC 2011/12 REPORTS & ACCOUNTS 177
30.3 Acquisition of Subsidiaries and Minority Interests During the reporting period, the Group has obtained the control of the following entities:
Acquiree % of Control Holding Acquired Acquisition Date Principal Activities
Taprobane Capital Ltd. 100 January 2012 Investment activities
Royal Fernwood Porcelain Ltd. 76 January 2012 Porcelain production
Fernwood Lanka (Pvt) Ltd. 100 January 2012 Porcelain production
Lanka Decals (Pvt) Ltd. 100 January 2012 Porcelain production
Fernwood Corporate Services Ltd. 100 January 2012 Porcelain production
Samudra Beach Resorts (Pvt) Ltd. 100 April 2011 Hotel services
Ajax Engineers (Pvt) Ltd. 51 February 2012 Steel manufacturing
Excel Global Holding (Pvt) Ltd. 100 July 2011 Investment activities
Millennium Developments (Pvt) Ltd. 100 July 2011 Operating recreational park and renting
Excel Restaurants (Pvt) Ltd. 100 February 2012 Operating restaurants
Dickwella Resort (Pvt) Ltd. 100 December 2011 Hotelier
Speed Italia Ltd. 100 April 2011 FIAT linea vehicle sale Taking control of the above entities will enable the Group to further expand its diversification and meet the strategic business objectives set by the Management. These acquisitions are expected to provide the Group with an increase share of returns on the investments. In the post acquisition period, the acquired entities contributed, revenue of Rs. 735,086,511/- and operating profits of Rs. 244,455,357/- to the Group results.
The following summarises the major classes of consideration transferred, and the recognised amounts of assets acquired and liabilities assumed at the acquisition date:
30.4 Consideration TransferredGroup
For the year ended 31 March 2012
(Rs.)
Cash and cash equivalents paid 2,195,011,478
2,195,011,478
NOTES TO THE FINANCIAL STATEMENTS

178 LOLC 2011/12 REPORTS & ACCOUNTS
30.5 Goodwill on Acquisition/Gain on a Bargain PurchaseGoodwill on Acquisition/Gain on a Bargain Purchase is recognised as a result of the acquisitions as follows:
Group
For the year ended 31 March Note 2012
(Rs.)
Total Consideration paid 30.4 2,195,011,478
(-) Total Identifiable net assets (stated at fair value) 30.8 5,290,281,781
Minority interest acquired (270,647,926)
Parent’s share of net assets acquired (5,019,633,855)
Total resulted goodwill/(Negative goodwill) (2,824,622,377)
Goodwill on acquisition (Note 30.5.1) 32.1 89,914,043
Gains on bargain purchases (Negative goodwill) 11.1 (2,914,536,420)
(2,824,622,377)
30.5.1 The goodwill is mainly attributable to the established business position, and the synergies expected to be achieved from integrating the acquired companies into the Group’s existing business.
30.6 Acquisition of Minority InterestsDuring the current financial period, the Group acquired additional interest of the following controlled entities:
Company Increase in Holding Decrease in Minority Interest Additional Investment Made
%
Tropical Villas (Pvt) Ltd. 40 180,227,608 165,000,000
30.7 Net Cash used in Acquisition
Group
For the year ended 31 March Note 2012
(Rs.)
Purchase consideration paid 30.4 2,195,011,478
(-) Cash and cash equivalents acquired 30.8
Positive cash balances 17,931,395
Bank overdrafts (51,863,863) 33,932,468
(2,228,943,946)
NOTES TO THE FINANCIAL STATEMENTS

LOLC 2011/12 REPORTS & ACCOUNTS 179
30.8 Identifiable Assets Acquired and Liabilities Assumed
Subsidiary Total
Fair Value Adjustments
Total
(Rs.) (Rs.) (Rs.)
Assets
Cash and cash equivalents 17,931,395 – 17,931,395
Investment in term deposits 76,749,268 – 76,749,268
Other investment securities 20,735,072 – 20,735,072
Advances and other loans 60,000,000 – 60,000,000
Inventories 201,695,771 – 201,695,771
Trade and other current assets 426,628,027 – 426,628,026
Leasehold right – 3,252,409,369 3,252,409,369
Investments in associate companies 10,000,000 – 10,000,000
Property, plant and equipment 1,100,396,231 1,378,400,809 2,478,797,040
Total assets 1,914,135,764 4,630,810,178 6,544,945,941
Liabilities and equity
Liabilities
Bank overdrafts 51,863,863 – 51,863,863
Interest-bearing borrowings 573,583,508 – 573,583,508
Provision for taxation 103,983 – 103,983
Trade and other payables 600,777,877 – 600,777,877
Deferred income 1,323,676 – 1,323,676
Retirement benefit obligations 27,011,254 – 27,011,254
Total liabilities 1,254,664,161 – 1,254,664,161
Equity
Stated capital 1,347,328,418 – 1,347,328,418
Reserves 619,164,681 4,630,810,178 5,249,974,859
Retained earnings (1,307,021,496) – (1,307,021,496)
Equity attributable to equity holders of the Company 1,299,921,313 4,630,810,178 5,290,281,781
Total liabilities and equity 2,554,585,474 4,630,810,178 6,544,945,942
NOTES TO THE FINANCIAL STATEMENTS

180 LOLC 2011/12 REPORTS & ACCOUNTS
31 deFerred tAX Assets And LIABILItIes
31.1 Recognised Deferred Tax AssetsDeferred tax assets are attributable to the originations of following temporary differences:
Group Company
As at 31 March 2012 2011 2012 2011
(Rs.) (Rs.) (Rs.) (Rs.)
Property, plant and equipment (419,457,475) (683,946,985) (335,343,033) (626,046,299)
Investment properties (1,224,000) (280,000) – –
Lease receivables (387,210,523) – (387,210,523) –
Unutilised tax losses 1,930,262,894 1,526,320,581 1,163,150,402 1,206,745,572
Employee benefits 162,989,416 128,570,403 85,996,592 80,123,443
General provisions 34,604,368 (994,137) – –
Operating lease assets unamortised VAT (6,201,443) – (6,201,443) –
Net deductible temporary difference 1,313,763,237 969,669,862 520,391,995 660,822,716
Total recognised deferred tax assets 347,479,485 434,654,001 145,709,757 185,030,360
31.2 Movement in Recognised Deferred Tax Assets
Group Company
For the year ended 31 March 2012 2011 2012 2011
(Rs.) (Rs.) (Rs.) (Rs.)
Balance as at the beginning of the period 434,654 ,001 774,243,504 185,030,360 430,784,145
Originations/reversal to the Income Statement (127,939,243) (192,382,879) (39,320,603) (159,596,955)
Directly charged to the equity (Note 31.9) 2,367,008 (28,560) – –
Recognition of previously unrecognised deferred tax (Note 31.7) 40,121,001 – – –
Impact due to rate change (Note 31.8) – (147,178,064) – (86,156,830)
Other adjustments (1,723,282) – – –
Balance as at the end of the period 347,479,485 434,654,001 145,709,757 185,030,360
31.3 Recognised Deferred Tax LiabilitiesDeferred tax liabilities are attributable to the originations of following temporary differences:
Group Company
As at 31 March 2012 2011 2012 2011
(Rs.) (Rs.) (Rs.) (Rs.)
Property, plant and equipment 1,700,141,471 1,873,268,133 – –
Revaluation of properties 753,293,434 399,210,122 – –
Lease recievables 3,904,518,239 2,429,831,009 – –
Unutilised tax losses (1,048,155,795) (674,155,280) – –
Employee benefits (54,928,893) (45,194,289) – –
Forward exchange contracts assets 211,713,264 – – –
Net taxable temporary difference 5,466,581,720 3,982,959,695 – –
Total recognised deferred tax liabilities 1,196,442,542 872,361,434 – –
NOTES TO THE FINANCIAL STATEMENTS

LOLC 2011/12 REPORTS & ACCOUNTS 181
31.4 Movement in Recognised Deferred Tax Liabilities
Group Company
For the year ended 31 March 2012 2011 2012 2011
(Rs.) (Rs.) (Rs.) (Rs.)
Balance as at the beginning of the period 872,361,434 442,464,503 – –
Originations/reversal to the Income Statement 313,348,154 235,282,287 – –
Directly charged to the equity (Note 31.9) (27,879,647) 27,166,205 – –
Impact due to rate change (Note 31.8) – (135,441,952) – –
Other adjustments 38,612,601 302,890,391 – –
Balance as at the end of the period 1,196,442,542 872,361,434 – –
31.5 Deferred Tax Expense Group Company
For the year ended 31 March 2012 2011 2012 2011
(Rs.) (Rs.) (Rs.) (Rs.)
Deferred Tax Assets (Note 31.2)
Originations/reversal during the period 127,939,243 192,382,879 39,320,603 159,596,955
Recognition of previously unrecognised deferred tax (Note 31.7) (40,121,001) – – –
Impact due to rate change – 147,178,064 – 86,156,830
Deferred Tax Liabilities (Note 31.4)
Originations/reversal during the period 313,348,154 235,282,287 – –
Impact due to rate change – (135,441,952) – –
401,166,396 455,403,214 39,320,603 245,753,785
31.6 Unrecognised Deferred Tax Assets for Deferred TaxationDeferred tax assets have not been recognised in respect of these items because it is not probable that future taxable profit will be available against which the Group can utilise the benefits therefrom.
Group Company
As at 31 March 2012 2011 2012 2011
(Rs.) (Rs.) (Rs.) (Rs.)
Deductible temporary differences 1,041,465 781,432 – –
Unutilised tax losses 590,105,985 1,069,283,654 – –
591,147,450 1,070,065,086 – –
NOTES TO THE FINANCIAL STATEMENTS

182 LOLC 2011/12 REPORTS & ACCOUNTS
31.7 Previously Unrecognised Tax LossesIn 2011/12, the following companies have recognised deferred tax assets on previously unrecognised tax losses as management considered it is probable that future taxable profits would be available against which they can be utilised.
Group Company
As at 31 March 2012 2011 2012 2011
(Rs.) (Rs.) (Rs.) (Rs.)
Klevenberg (Pvt) Ltd. 84,398,075 – – –
LOLC Motors Ltd. 98,392,711 – – –
LOLC Insurance Company Ltd. 58,891,215 – – –
241,682,001 – – –
31.8 Impact Due to Corporate Income Tax Rate Change - 2010/11 Financial Period
The corporate income tax rate has been changed to 28%, 12% and 10% from 35% and 15% commencing from year of assessment 2011/12 as per the Budget Proposals for 2011 announced by the Finance Minister, enacted in 2011. Accordingly, in the year of 2010/11 deferred tax asset and liability have been computed based on the revised rates and Rs. 11,736,112/- of the Group and Rs. 86,156,829/- of the Company have been reversed to Income Statement and Statement of Changes in Equity respectively.
31.9 Deferred Tax Charged/Credited Directly to Equity According to Sri Lanka Accounting Standard No. 14 (Revised 2005) - ‘Income Taxes’, deferred tax shall be charged or credited directly to equity if the tax relates to items that are credited or charged, in the same or in a different period. Accordingly, the deferred tax liability arising on revaluation of property, plant and equipment of Rs. 30,246,655/- (2010/11 - Rs. 27,137,645/- charged) of the Group was credited directly to revaluation reserve in the Statement of Changes in Equity in 2011/12.
32 IntAnGIBLe Assets
32.1 Goodwill on Acquisition Group Company
As at 31 March 2012 2011 2012 2011
(Rs.) (Rs.) (Rs.) (Rs.)
Balance at the beginning of the period 331,713,877 151,415,234 – –
Acquisition during the period 89,914,043 180,298,643 – –
421,627,920 331,713,877 – –
During the period goodwill acquired mainly resulted from acquisition of Speed Italia Ltd. (Rs. 59,000,000/-), Excel Restaurant (Pvt) Ltd. (Rs. 20,524,340/-) and Ajex Engineers (Pvt) Ltd. (Rs. 10,389,703/-). Goodwill as at the Balance Sheet date has been tested for impairment and found no impairment for the carrying value.
NOTES TO THE FINANCIAL STATEMENTS

LOLC 2011/12 REPORTS & ACCOUNTS 183
32.2 Other Intangible Assets Group Company
As at 31 March 2012 2011 2012 2011
(Rs.) (Rs.) (Rs.) (Rs.)
Computer software 89,877,232 114,687,349 47,677,489 61,011,327
Licence and fees 27,759,815 – – –
Brand value 75,827,956 85,306,451 – –
Customer base 29,652,989 39,537,319 – –
total 223,117,992 239,531,119 47,677,489 61,011,327
32.3 Other Intangible Assets - GroupComputer Software Licence and Fees Brand Value Customer Base Total
(Rs.) (Rs.) (Rs.) (Rs.) (Rs.)
Cost/Valuation
Balance as at 1 April 2011 196,973,582 – 94,784,946 49,421,649 341,180,177
Additions during the year 9,209,310 28,365,799 – – 37,575,109
Balance as at 31 March 2012 206,182,892 28,365,799 94,784,946 49,421,649 378,755,286
Accumulated Amortisation
Balance as at 1 April 2011 82,286,233 – 9,478,495 9,884,330 101,649,058
Amortisation during the year 34,019,427 605,984 9,478,495 9,884,330 53,988,236
Balance as at 31 March 2012 116,305,660 605,984 18,956,990 19,768,660 155,637,294
Carrying Amount
As at 31 March 2012 89,877,232 27,759,815 75,827,956 29,652,989 223,117,992
As at 31 March 2011 114,687,349 – 85,306,451 39,537,319 239,531,119
32.4 Other Intangible Assets - CompanyComputer Software
For the year ended 31 March 2012 2011
(Rs.) (Rs.)
Cost/Valuation
Balance as at 01 April 113,467,128 99,095,682
Additions during the year 7,664,691 14,371,446
Balance as at 31 March 121,131,819 113,467,128
Amortisation
Balance as at 01 April 52,455,801 34,194,331
Amortisation during the year 20,998,529 18,261,470
Balance as at 31 March 73,454,330 52,455,801
Carrying amount as at 31 March 47,677,489 61,011,327
NOTES TO THE FINANCIAL STATEMENTS

184 LOLC 2011/12 REPORTS & ACCOUNTS
33 propertY, pLAnt And equIpMent
Lands Freehold Buildings Leasehold Buildings
Freehold Motor Vehicles
Leasehold Motor Vehicles
Furniture & Fittings
Office Equipment Computers Freehold Plant & Machinery
Leasehold Machinery
Assets for Operating Leases
Other Tangible Assets
(Note 33.1)
Capital Work-in-Progress (CWIP)
Total
(Rs.) (Rs.) (Rs.) (Rs.) (Rs.) (Rs.) (Rs.) (Rs.) (Rs.) (Rs.) (Rs.) (Rs.) (Rs.) (Rs.)
Group
Cost/Valuation
Balance as at 1 April 2011 6,980,701,474 4,101,962,350 681,873,765 1,508,616,385 419,313,275 810,321,921 538,141,397 306,813,915 696,468,478 49,598,874 1,136,009,576 652,406,285 49,005,457 17,931,233,152
Additions 1,004,300,761 91,563,873 188,596,308 658,169,342 57,572,245 135,611,892 88,500,852 120,171,050 290,496,747 31,726,800 5,508,855 23,050,675 281,289,420 2,976,558,820
Revaluations 629,566,825 (18,106,762) (29,664,315) – – – – – – – – – – 581,795,748
Disposals (132,648,583) (64,310,982) – (222,331,395) (333,902,877) (192,075,126) (87,108,731) (8,003,594) (368,217,433) (2,574,769) (395,931,641) (75,073,027) (591,402) (1,882,769,560)
Transfers (36,742,785) 34,493,935 27,788,110 10,196,668 (10,196,668) 6,600,615 1,670,500 – 12,765,990 (19,765,990) – – (79,360,407) (52,550,032)
Acquisition of subsidiaries & joint ventures 1,224,223,100 1,132,625,961 – 26,518,676 15,942,027 65,066,865 46,941,109 2,161,193 1,242,228,099 – – 7,213,220 760,619 3,763,680,869
Transfer to investment properties (57,802,500) (478,400,850) – – – – – – – – – – – (536,203,350)
Balance as at 31 March 2012 9,611,598,292 4,799,827,525 868,593,868 1,981,169,676 148,728,002 825,526,167 588,145,127 421,142,564 1,873,741,881 58,984,915 745,586,790 607,597,153 251,103,687 22,781,745,647
Accumulated Depreciation
Balance as at 1 April 2011 191,932,534 63,797,520 583,668,522 250,779,567 574,523,374 260,055,904 190,165,418 601,818,759 19,349,200 505,790,691 217,344,713 3,459,226,202
Charge for the year 627,323,153 19,393,196 376,070,067 34,306,216 79,396,510 51,956,308 36,739,022 75,940,504 5,097,631 187,184,865 20,655,888 1,514,063,360
Revaluations (4,707,259) – – – – – – – – – – (4,707,259)
Depreciation on disposals (983,678) – (131,191,751) (210,205,878) (147,221,207) (77,859,165) (2,416,502) (264,564,836) (1,662,872) (278,569,090) (67,327,465) (1,182,002,444)
Depreciation on transfers (836) – 27,266,752 (27,266,752) 10,947 (10,111) – 5,206,627 (7,248,294) – – (2,041,667)
Acquisition of subsidiaries & joint ventures 177,741,073 – 10,950,126 1,985,508 33,619,856 35,388,404 1,644,556 688,324,356 – – 3,298,703 952,952,582
Transfer to Investment Properties (126,654,797) – – – – – – – – – – (126,654,797)
Balance as at 31 March 2012 864,650,190 83,190,716 866,763,716 49,598,661 540,329,480 269,531,340 226,132,494 1,106,725,410 15,535,665 414,406,466 173,971,839 4,610,835,977
Carrying Amount
As at 31 March 2012 9,611,598,292 3,935,177,335 785,403,152 1,114,405,960 99,129,341 285,196,687 318,613,787 195,010,070 767,016,471 43,449,250 331,180,324 433,625,314 251,103,687 18,170,909,670
As at 31 March 2011 6,980,701,474 3,910,029,816 618,076,245 (164,355,247) 559,542,354 235,798,547 278,085,493 116,648,497 94,649,719 30,249,674 630,218,885 435,061,572 49,005,457 14,472,006,950
Footnotes
1. Property, plant and equipment included fully-depreciated assets having a gross amount of Rs. 761,343,795 /- as at 31 March 2012 (2011 - Rs. 964,098,243/-).
2. The capitalised borrowing costs related to the acquisition of Property, plant and equipment during the year is Rs. 9,266,764/- (2010/11 - Rs. 279,734,804/-).
3. The fair value of the revalued properties were determined by independent valuers who hold recognised and relevant professional qualification and
have recent experience in the location and category of the revalued properties.
4. Change in Estimates
During the year the Group conducted an operational efficiency review at its leisure sector properties which resulted in changes in the expected
useful lives of certain items of properties. Certain buildings, which management previously intended to operate in longer term are now expected to
remain in service for 3 years from 01 April 2011. As a result, the expected useful lives of these buildings decreased and their estimated depreciation
values were accelerated in order to reflect the change in estimate of useful lives. The effect of these changes on depreciation expense, recognised
in Income Statement in current and future years is as follows:
For the year ended 31 March 2012 2013 2014 Later
(Rs.) (Rs.) (Rs.) (Rs.)
Increase in depreciation expense 553,893,294 553,893,294 553,893,294 –
NOTES TO THE FINANCIAL STATEMENTS

LOLC 2011/12 REPORTS & ACCOUNTS 185
33 propertY, pLAnt And equIpMent
Lands Freehold Buildings Leasehold Buildings
Freehold Motor Vehicles
Leasehold Motor Vehicles
Furniture & Fittings
Office Equipment Computers Freehold Plant & Machinery
Leasehold Machinery
Assets for Operating Leases
Other Tangible Assets
(Note 33.1)
Capital Work-in-Progress (CWIP)
Total
(Rs.) (Rs.) (Rs.) (Rs.) (Rs.) (Rs.) (Rs.) (Rs.) (Rs.) (Rs.) (Rs.) (Rs.) (Rs.) (Rs.)
Group
Cost/Valuation
Balance as at 1 April 2011 6,980,701,474 4,101,962,350 681,873,765 1,508,616,385 419,313,275 810,321,921 538,141,397 306,813,915 696,468,478 49,598,874 1,136,009,576 652,406,285 49,005,457 17,931,233,152
Additions 1,004,300,761 91,563,873 188,596,308 658,169,342 57,572,245 135,611,892 88,500,852 120,171,050 290,496,747 31,726,800 5,508,855 23,050,675 281,289,420 2,976,558,820
Revaluations 629,566,825 (18,106,762) (29,664,315) – – – – – – – – – – 581,795,748
Disposals (132,648,583) (64,310,982) – (222,331,395) (333,902,877) (192,075,126) (87,108,731) (8,003,594) (368,217,433) (2,574,769) (395,931,641) (75,073,027) (591,402) (1,882,769,560)
Transfers (36,742,785) 34,493,935 27,788,110 10,196,668 (10,196,668) 6,600,615 1,670,500 – 12,765,990 (19,765,990) – – (79,360,407) (52,550,032)
Acquisition of subsidiaries & joint ventures 1,224,223,100 1,132,625,961 – 26,518,676 15,942,027 65,066,865 46,941,109 2,161,193 1,242,228,099 – – 7,213,220 760,619 3,763,680,869
Transfer to investment properties (57,802,500) (478,400,850) – – – – – – – – – – – (536,203,350)
Balance as at 31 March 2012 9,611,598,292 4,799,827,525 868,593,868 1,981,169,676 148,728,002 825,526,167 588,145,127 421,142,564 1,873,741,881 58,984,915 745,586,790 607,597,153 251,103,687 22,781,745,647
Accumulated Depreciation
Balance as at 1 April 2011 191,932,534 63,797,520 583,668,522 250,779,567 574,523,374 260,055,904 190,165,418 601,818,759 19,349,200 505,790,691 217,344,713 3,459,226,202
Charge for the year 627,323,153 19,393,196 376,070,067 34,306,216 79,396,510 51,956,308 36,739,022 75,940,504 5,097,631 187,184,865 20,655,888 1,514,063,360
Revaluations (4,707,259) – – – – – – – – – – (4,707,259)
Depreciation on disposals (983,678) – (131,191,751) (210,205,878) (147,221,207) (77,859,165) (2,416,502) (264,564,836) (1,662,872) (278,569,090) (67,327,465) (1,182,002,444)
Depreciation on transfers (836) – 27,266,752 (27,266,752) 10,947 (10,111) – 5,206,627 (7,248,294) – – (2,041,667)
Acquisition of subsidiaries & joint ventures 177,741,073 – 10,950,126 1,985,508 33,619,856 35,388,404 1,644,556 688,324,356 – – 3,298,703 952,952,582
Transfer to Investment Properties (126,654,797) – – – – – – – – – – (126,654,797)
Balance as at 31 March 2012 864,650,190 83,190,716 866,763,716 49,598,661 540,329,480 269,531,340 226,132,494 1,106,725,410 15,535,665 414,406,466 173,971,839 4,610,835,977
Carrying Amount
As at 31 March 2012 9,611,598,292 3,935,177,335 785,403,152 1,114,405,960 99,129,341 285,196,687 318,613,787 195,010,070 767,016,471 43,449,250 331,180,324 433,625,314 251,103,687 18,170,909,670
As at 31 March 2011 6,980,701,474 3,910,029,816 618,076,245 (164,355,247) 559,542,354 235,798,547 278,085,493 116,648,497 94,649,719 30,249,674 630,218,885 435,061,572 49,005,457 14,472,006,950
NOTES TO THE FINANCIAL STATEMENTS

186 LOLC 2011/12 REPORTS & ACCOUNTS
Lands Freehold Buildings
Freehold Motor Vehicles
Leasehold Motor Vehicles
Furniture & Fittings
Office Equipment Computers Assets for Operating Leases
Capital Work-in-Progress (CWIP)
Total
(Rs.) (Rs.) (Rs.) (Rs.) (Rs.) (Rs.) (Rs.) (Rs.) (Rs.) (Rs.)
Company
Cost/Valuation
Balance as at 1 April 2011 1,185,649,236 322,904,866 1,119,622,132 368,737,044 211,017,099 231,373,336 186,430,587 1,025,739,473 – 4,651,473,773
Additions 203,937,803 30,431,681 510,470,831 22,481,602 21,146,222 42,986,275 68,247,952 31,176 4,025,000 903,758,542
Revaluations – – – – – – – – – –
Disposals (132,648,583) (27,350,417) (200,475,927) (332,510,377) (18,921,526) (42,734,141) (7,924,094) (362,964,348) – (1,125,529,413)
Transfers (36,742,785) 34,493,935 (18,151,506) 18,151,506 2,196,350 52,500 – – – –
Transfer to investment properties (57,802,500) (107,197,500) – – – – – – – (165,000,000)
Balance as at 31 March 2012 1,162,393,171 253,282,565 1,411,465,530 76,859,775 215,438,145 231,677,970 246,754,445 662,806,301 4,025,000 4,264,702,902
Accumulated Depreciation
Balance as at 1 April 2011 794,384 345,360,067 213,609,029 129,347,860 138,578,675 112,137,425 428,149,965 1,367,977,405
Charge for the year 5,369,244 303,355,505 19,430,234 34,768,749 24,240,011 16,060,951 178,751,451 581,976,145
Depreciation on disposals – (113,086,186) (209,416,794) (17,273,018) (39,090,970) (2,361,293) (251,137,198) (632,365,459)
Depreciation on transfers (836) (991,886) 991,886 – 836 – – –
Balance as at 31 March 2012 6,162,792 534,637,500 24,614,355 146,843,591 123,728,552 125,837,083 355,764,218 1,317,588,091
Carrying Amount
As at 31 March 2012 1,162,393,171 247,119,773 876,828,030 52,245,420 68,594,554 107,949,418 120,917,362 307,042,083 4,025,000 2,947,114,811
As at 31 March 2011 1,185,649,236 322,110,482 774,262,065 155,128,015 81,669,239 92,794,661 74,293,162 597,589,508 – 3,283,496,368
Footnotes
1. Property, plant and equipment included fully-depreciated assets having a gross amount of Rs. 246,526,432/- as at 31 March 2012
(2011 - Rs. 239,258,715/-).
2. The carrying amount of land and buildings of the Company, if carried at cost less accumulated depreciation would amount to Rs. 669,162,516/-
as at 31 March 2012 (31 March 2011 - Rs. 755,878,090/-).
NOTES TO THE FINANCIAL STATEMENTS

LOLC 2011/12 REPORTS & ACCOUNTS 187
Lands Freehold Buildings
Freehold Motor Vehicles
Leasehold Motor Vehicles
Furniture & Fittings
Office Equipment Computers Assets for Operating Leases
Capital Work-in-Progress (CWIP)
Total
(Rs.) (Rs.) (Rs.) (Rs.) (Rs.) (Rs.) (Rs.) (Rs.) (Rs.) (Rs.)
Company
Cost/Valuation
Balance as at 1 April 2011 1,185,649,236 322,904,866 1,119,622,132 368,737,044 211,017,099 231,373,336 186,430,587 1,025,739,473 – 4,651,473,773
Additions 203,937,803 30,431,681 510,470,831 22,481,602 21,146,222 42,986,275 68,247,952 31,176 4,025,000 903,758,542
Revaluations – – – – – – – – – –
Disposals (132,648,583) (27,350,417) (200,475,927) (332,510,377) (18,921,526) (42,734,141) (7,924,094) (362,964,348) – (1,125,529,413)
Transfers (36,742,785) 34,493,935 (18,151,506) 18,151,506 2,196,350 52,500 – – – –
Transfer to investment properties (57,802,500) (107,197,500) – – – – – – – (165,000,000)
Balance as at 31 March 2012 1,162,393,171 253,282,565 1,411,465,530 76,859,775 215,438,145 231,677,970 246,754,445 662,806,301 4,025,000 4,264,702,902
Accumulated Depreciation
Balance as at 1 April 2011 794,384 345,360,067 213,609,029 129,347,860 138,578,675 112,137,425 428,149,965 1,367,977,405
Charge for the year 5,369,244 303,355,505 19,430,234 34,768,749 24,240,011 16,060,951 178,751,451 581,976,145
Depreciation on disposals – (113,086,186) (209,416,794) (17,273,018) (39,090,970) (2,361,293) (251,137,198) (632,365,459)
Depreciation on transfers (836) (991,886) 991,886 – 836 – – –
Balance as at 31 March 2012 6,162,792 534,637,500 24,614,355 146,843,591 123,728,552 125,837,083 355,764,218 1,317,588,091
Carrying Amount
As at 31 March 2012 1,162,393,171 247,119,773 876,828,030 52,245,420 68,594,554 107,949,418 120,917,362 307,042,083 4,025,000 2,947,114,811
As at 31 March 2011 1,185,649,236 322,110,482 774,262,065 155,128,015 81,669,239 92,794,661 74,293,162 597,589,508 – 3,283,496,368
NOTES TO THE FINANCIAL STATEMENTS

188 LOLC 2011/12 REPORTS & ACCOUNTS
33.1 Other Tangible Assets - Group
Water Sanitation & Others
Biological Assets
Roads & Bridges
Penstock Pipe Line
Security Fences Cutlery, Crockery & Glassware
Linen & Furnishing
Swimming Pool Bare Lands Others Total
(Rs.) (Rs.) (Rs.) (Rs.) (Rs.) (Rs.) (Rs.) (Rs.) (Rs.) (Rs.) (Rs.)
Group
Cost/Valuation
Balance as at 01 April 2011 22,532,507 82,434 68,790,945 76,000,000 1,380,500 27,864,613 74,641,874 9,911,812 342,390,848 28,810,752 652,406,285
Additions 298,057 – 1,692,393 656,075 7,120,265 2,071,203 9,334,487 1,792,715 – 85,480 23,050,675
Disposals (1,387,589) – – – (1,952,334) (13,005,371) (40,035,040) – – (18,692,693) (75,073,027)
Acquisition of subsidiaries & joint ventures – – – – – – 3,274,242 – – 3,938,978 7,213,220
Balance as at 31 March 2012 21,442,975 82,434 70,483,338 76,656,075 6,548,431 16,930,445 47,215,563 11,704,527 342,390,848 14,142,517 607,597,153
Accumulated Depreciation
Balance as at 01 April 2011 11,158,050 82,434 3,205,740 3,800,000 1,342,128 24,616,901 62,334,876 7,673,627 80,326,299 22,804,658 217,344,713
Charge for the year 1,402,676 – 1,531,581 3,810,935 221,504 1,083,964 2,538,748 609,062 7,664,185 1,793,233 20,655,888
Depreciation on disposals (1,387,589) – – – (173,809) (12,022,369) (36,369,619) (16,674) – (17,357,405) (67,327,465)
Acquisition of subsidiaries & joint ventures – – – – – – 3,124,744 – – 173,959 3,298,703
Balance as at 31 March 2012 11,173,137 82,434 4,737,321 7,610,935 1,389,823 13,678,496 31,628,749 8,266,015 87,990,484 7,414,445 173,971,839
Carrying Amount
As at 31 March 2012 10,269,838 – 65,746,017 69,045,140 5,158,608 3,251,949 15,586,814 3,438,512 254,400,364 6,728,072 433,625,314
As at 31 March 2011 11,374,457 – 65,585,205 72,200,000 38,372 3,247,712 12,306,998 2,238,185 262,064,549 6,006,094 435,061,572
34 deposIts FroM CustoMers
Group Company
As at 31 March 2012 2011 2012 2011
(Rs.) (Rs.) (Rs.) (Rs.)
Deposits maturing within one year 20,780,338,469 12,590,283,288 – –
Deposits maturing after one year 4,416,348,070 3,757,852,235 – –
total 25,196,686,539 16,348,135,523 – –
35 Interest-BeArInG BorrowInGs
Commercial papers & Promissory Notes 3,995,912,204 3,063,700,795 3,676,738,942 2,025,012,091
Short-term loans and others 17,108,560,573 14,574,822,384 4,056,000,000 7,726,250,000
Debentures 5,054,887,500 165,600,000 4,250,000,000 –
Finance lease liabilities (Note 35.1) 535,729,355 369,696,813 363,666,764 182,019,206
Long-term borrowings (Note 35.2) 35,365,434,952 28,610,473,795 9,943,950,649 10,351,562,460
62,060,524,584 46,784,293,787 22,290,356,355 20,284,843,757
NOTES TO THE FINANCIAL STATEMENTS

LOLC 2011/12 REPORTS & ACCOUNTS 189
33.1 Other Tangible Assets - Group
Water Sanitation & Others
Biological Assets
Roads & Bridges
Penstock Pipe Line
Security Fences Cutlery, Crockery & Glassware
Linen & Furnishing
Swimming Pool Bare Lands Others Total
(Rs.) (Rs.) (Rs.) (Rs.) (Rs.) (Rs.) (Rs.) (Rs.) (Rs.) (Rs.) (Rs.)
Group
Cost/Valuation
Balance as at 01 April 2011 22,532,507 82,434 68,790,945 76,000,000 1,380,500 27,864,613 74,641,874 9,911,812 342,390,848 28,810,752 652,406,285
Additions 298,057 – 1,692,393 656,075 7,120,265 2,071,203 9,334,487 1,792,715 – 85,480 23,050,675
Disposals (1,387,589) – – – (1,952,334) (13,005,371) (40,035,040) – – (18,692,693) (75,073,027)
Acquisition of subsidiaries & joint ventures – – – – – – 3,274,242 – – 3,938,978 7,213,220
Balance as at 31 March 2012 21,442,975 82,434 70,483,338 76,656,075 6,548,431 16,930,445 47,215,563 11,704,527 342,390,848 14,142,517 607,597,153
Accumulated Depreciation
Balance as at 01 April 2011 11,158,050 82,434 3,205,740 3,800,000 1,342,128 24,616,901 62,334,876 7,673,627 80,326,299 22,804,658 217,344,713
Charge for the year 1,402,676 – 1,531,581 3,810,935 221,504 1,083,964 2,538,748 609,062 7,664,185 1,793,233 20,655,888
Depreciation on disposals (1,387,589) – – – (173,809) (12,022,369) (36,369,619) (16,674) – (17,357,405) (67,327,465)
Acquisition of subsidiaries & joint ventures – – – – – – 3,124,744 – – 173,959 3,298,703
Balance as at 31 March 2012 11,173,137 82,434 4,737,321 7,610,935 1,389,823 13,678,496 31,628,749 8,266,015 87,990,484 7,414,445 173,971,839
Carrying Amount
As at 31 March 2012 10,269,838 – 65,746,017 69,045,140 5,158,608 3,251,949 15,586,814 3,438,512 254,400,364 6,728,072 433,625,314
As at 31 March 2011 11,374,457 – 65,585,205 72,200,000 38,372 3,247,712 12,306,998 2,238,185 262,064,549 6,006,094 435,061,572
34 deposIts FroM CustoMers
Group Company
As at 31 March 2012 2011 2012 2011
(Rs.) (Rs.) (Rs.) (Rs.)
Deposits maturing within one year 20,780,338,469 12,590,283,288 – –
Deposits maturing after one year 4,416,348,070 3,757,852,235 – –
total 25,196,686,539 16,348,135,523 – –
35 Interest-BeArInG BorrowInGs
Commercial papers & Promissory Notes 3,995,912,204 3,063,700,795 3,676,738,942 2,025,012,091
Short-term loans and others 17,108,560,573 14,574,822,384 4,056,000,000 7,726,250,000
Debentures 5,054,887,500 165,600,000 4,250,000,000 –
Finance lease liabilities (Note 35.1) 535,729,355 369,696,813 363,666,764 182,019,206
Long-term borrowings (Note 35.2) 35,365,434,952 28,610,473,795 9,943,950,649 10,351,562,460
62,060,524,584 46,784,293,787 22,290,356,355 20,284,843,757
NOTES TO THE FINANCIAL STATEMENTS

190 LOLC 2011/12 REPORTS & ACCOUNTS
35.1 Finance Lease Liabilities Group Company
For the year ended 31 March 2012 2011 2012 2011
(Rs.) (Rs.) (Rs.) (Rs.)
Net liability to lessor of JEDB/SLSPC estates (Note 35.1.2) 152,390,073 154,578,922 – –
Other lease liabilities 383,339,282 215,117,891 363,666,764 182,019,206
Total lease liabilities (Note 35.1.1) 535,729,355 369,696,813 363,666,764 182,019,206
35.1.1 Gross lease rentals payable as at 1 April 542,941,585 633,876,495 215,329,321 333,646,526
On acquisition of subsidiaries & joint ventures 8,861,369 – – –
Leases obtained during the year 405,005,772 529,050,726 414,663,360 115,141,675
Lease rentals paid during the year (188,080,791) (619,985,636) (162,983,893) (233,458,880)
Gross lease rentals payable as at 31 March 768,727,935 542,941,585 467,008,788 215,329,321
Less: Interest in suspense (232,998,580) (173,244,772) (103,342,024) (33,310,115)
Net lease liability 535,729,355 369,696,813 363,666,764 182,019,206
Repayable within one year
Gross lease rentals payable 188,386,159 158,434,292 109,311,565 126,448,109
Less: Interest in suspense (71,269,784) (27,251,967) (39,140,818) (16,009,250)
Net lease liability 117,116,375 131,182,325 70,170,747 110,438,859
Repayable after one year before five years
Gross lease rentals payable 344,158,820 139,952,337 357,697,223 88,881,212
Less: Interest in suspense (66,468,283) (45,425,651) (64,201,206) (17,300,865)
Net lease liability 277,690,537 94,526,686 293,496,017 71,580,347
Repayable after five years
Gross lease rentals payable 236,182,956 244,554,956 – –
Less: Interest in suspense (95,260,513) (100,567,154) – –
Net lease liability 140,922,443 143,987,802 – –
total 535,729,355 369,696,813 363,666,764 182,019,206
NOTES TO THE FINANCIAL STATEMENTS

LOLC 2011/12 REPORTS & ACCOUNTS 191
35.1.2 Net Liability to Lessor of JEDB/SLSPC Estates
Group Company
For the year ended 31 March 2012 2011 2012 2011
(Rs.) (Rs.) (Rs.) (Rs.)
Gross Liability
Balance as at 1 April 286,414,956 294,805,885 – –
Repayments (8,372,000) (8,390,929) – –
Balance as at 31 March 278,042,956 286,414,956 – –
Finance costs allocated to future years (125,652,883) (131,836,034) – –
Net liability 152,390,073 154,578,922 – –
Payable within one Year
Gross liability 8,372,000 8,372,000 – –
Finance costs allocated to future years (6,113,920) (6,188,612) – –
Net liability transferred to current liabilities. 2,258,080 2,183,388 – –
Payable within two to five Years
Gross liability 33,488,000 33,488,000 – –
Finance costs allocated to future years (24,278,451) (25,080,269) – –
Net liability 9,209,549 8,407,731 – –
Payable after five years
Gross liability 236,182,956 244,554,956 – –
Finance costs allocated to future years (95,260,513) (100,567,154) – –
Net liability 140,922,443 143,987,802 – –
Pussellawa Plantations Ltd. and Maturata Plantations Ltd.The lease rentals have been amended, with effect from 15 June 1996 to a substantially higher amount than the previous nominal lease rental of Rs. 500/- per estate per annum. The basic rental payable under the revised basis is Rs. 13,607,000/- per annum and this amount is to be inflated annually by the Gross Domestic Production (GDP) Deflator and is in the form contingent lease rental. Consequently, contingent lease rentals charged for the current year in the Income Statement amounts to Rs. 23,006,972/- ( 2010/11 - Rs. 44,638,885/-). This lease agreement was further amended on 15 June 2002, freezing annual lease rental at Rs. 17,940,189/- for a period of six years commencing from 15 June 2002. Hence, the GDP Deflator adjustment has been frozen at Rs. 4,333,189/- per annum until 15 June 2008.
Lease rental has been revised by the Ministry of Finance after the relief period of 2002-2008. The rental has been computed in accordance with Amendment of Leases - (Agreement No. 1560).
Future liability on annual lease payment of Rs. 13,607,000/- would continue until year 2045. The Net Present Value of this liability at 4% discounting rate (as recommended by UITF) would result in a liability of Rs. 152,390,073/- (2010/11 - Rs. 154,578,922/-). The Net Present Value of Rs. 152,390,073/- is presented by gross liability of Rs. 278,042,956/- and interest in suspense of Rs. 125,652,883 /-. The Charge to the Income Statement during the current period is Rs. 6,183,150/-.
NOTES TO THE FINANCIAL STATEMENTS

192 LOLC 2011/12 REPORTS & ACCOUNTS
35.2 Long-Term Borrowings Group Company
For the year ended 31 March 2012 2011 2012 2011
(Rs.) (Rs.) (Rs.) (Rs.)
Balance as at 1 April 28,610,473,795 18,016,249,980 10,351,562,460 11,051,344,585
On acquisition of subsidiaries & joint ventures 254,234,426 1,071,460,000 – –
Received during the year 15,972,695,717 20,374,573,885 2,900,000,000 6,443,121,963
Repaid during the year (9,471,968,986) (10,851,810,070) (3,307,611,811) (7,142,904,088)
Balance as at 31 March 35,365,434,952 28,610,473,795 9,943,950,649 10,351,562,460
Long-term borrowings - current 11,674,511,306 5,737,421,018 3,533,838,752 3,563,534,904
Long-term borrowings - non-current 23,690,923,646 22,873,052,777 6,410,111,897 6,788,027,556
total 35,365,434,952 28,610,473,795 9,943,950,649 10,351,562,460
Analysis of Non-Current Portion of Long-Term Borrowings
Repayable within 3 years 17,385,755,657 17,109,761,985 5,558,515,372 5,648,166,932
Repayable after 3 years 6,305,167,989 5,763,290,792 851,596,525 1,139,860,624
total 23,690,923,646 22,873,052,777 6,410,111,897 6,788,027,556
36 InsurAnCe provIsIon
Group
As at 31 March 2012 2011
(Rs.) (Rs.)
Life Insurance (Note 36.1) 47,570,657 –
General Insurance (Note 36.2) 320,324,550 –
total 367,895,207 –
36.1 Life Insurance Provision
Life fund net assets ( 36.1.1) 47,570,657 –
Transfer to shareholders – –
Insurance provision - Long-term (Post-transfer) – –
47,570,657 –
36.1.1 Life Fund Net Assets
Gross written premium 51,426,839 –
Reinsurance premium (1,108,626) –
Net written premium 50,318,213 –
Net claims and benefits (553,652) –
Operating and administrative expenses (6,188,020) –
Excess from operations 43,576,541 –
Investment income and other income 3,994,116 –
Income tax expenses – –
Life fund net assets - B/F – –
Insurance provision - Long-term (Pre-transfer) 47,570,657 –
NOTES TO THE FINANCIAL STATEMENTS

LOLC 2011/12 REPORTS & ACCOUNTS 193
36.1.2 During the last nine months of operation ending on 31 December 2011, the LOLC Insurance Company Ltd. has sold three single premium term life products viz., Divisaviya, Isuru Sahana and Credit Life Group. All these are single premium term insurance products. As per IBSL’s guidelines, the method of valuation is Net Premium method, using the discounting rate of 5% p.a.; this being the first year of operations of the Company. Mortality table used is A (67-70) ultimate table. Reinsurance has been ignored for computation of solvency margin on a conservative basis. The insurance provision has been established in accordance with the “Solvency Margin (Long-term Insurance) Rules 2002” made by the IBSL, under Section 105 read with Section 26 of the Regulation of Insurance Industry Act No. 43 of 2000. The valuation of the Insurance Provision - long-term insurance business as at 31 December 2011 was made by the Actuary Mr. M.G. Diwan of Messrs K.A. Pandit (Consultant & Actuaries). According to the results of the valuation, provision of LKR 33,703,503/- (2010 - Not Applicable) is adequate to cover the liabilities pertaining to the long-term insurance business. The Board of Directors decided not to transfer any amount from the long-term insurance fund to the shareholders’ fund.
36.2 General Insurance Provision
Group
As at 31 March 2012 2011
(Rs.) (Rs.)
36.2.1 Unearned Premium
Gross premium 300,369,624 –
Reinsurance premium – –
Net premium 300,369,624 –
Deferred acquisition expenses (5,735,518) –
Total unearned premium 294,634,106 –
36.2.2 Gross Claims Reserve
Claims outstanding 22,103,444 –
Claims incurred but not reported (IBNR/IBNER) 3,587,000 –
Total gross claims reserve 25,690,444 –
Total general insurance provision 320,324,550 –
36.2.3 Reconciliation Between Insurance Provision and Technical Reserve
Insurance provision 320,324,550 –
Reinsurance on claims reserves – –
Technical reserve 320,324,550 –
36.2.4 LOLC Insurance Company Ltd. started writing Non-Life motor business in year 2011, the only class of business underwritten till 31 December 2011. A contingency reserve has been set aside to make provision for risks like Catastrophe, IBNR. Market ratios were considered arriving at IBNR figures. Actuary has used an average delay method modified suitably looking at Company’s new business policy and delay pattern observed. IBNR calculated is around 7% of Net Earned Premiums, and is on conservative basis for a start-up company. Actuary believes that over a couple of years, the actuary will be able to use some statistical method as data may be sufficient at that time and the Company also may have ventured into other classes of business. The valuation was done by Actuary Messrs K.A. Pandit - Consultant & Actuaries, 2nd Floor, Churchgate House, Veer Nariman Road, Fort, Mumbai.
NOTES TO THE FINANCIAL STATEMENTS

194 LOLC 2011/12 REPORTS & ACCOUNTS
37 trAde And otHer pAYABLes
Group Company
As at 31 March 2012 2011 2012 2011
(Rs.) (Rs.) (Rs.) (Rs.)
Accounts payable 5,552,748,705 4,691,541,819 728,688,402 789,588,904
Creditors for leased equipment 938,563,331 2,152,267,791 16,226,126 18,599,730
Amount due to related companies (Note 46.3.2) 297,338,524 4,500,000 5,090,362 250,884,814
Other payable 362,339,477 228,551,605 – –
VAT payable 122,905,161 41,175,053 67,546,123 947,162
Other tax payable 223,806,155 213,587,928 82,014,909 110,094,472
Insurance premium payable 30,231,784 18,496,680 – –
Unclaimed dividends 21,461,092 11,310,471 2,769,543 2,717,374
7,549,394,229 7,361,431,347 902,335,465 1,172,832,456
38 deFerred InCoMe
Capital grants (Note 38.1) 291,610,752 284,756,521 – –
Operating lease receivables - PHDT (Note 38.2) 3,584,175 4,120,910 – –
Sponsorships 2,166,667 – – –
Deferred income in respect of transfer of shares (Note 38.3) 30,915,865 – – –
328,277,459 288,877,431 – –
38.1 Capital Grants
Group Company
For the year ended 31 March 2012 2011 2012 2011
(Rs.) (Rs.) (Rs.) (Rs.)
Balance as at the beginning of the period 372,585,642 352,783,979 – –
Capital grants received 15,302,894 19,801,663 – –
Balance as at the end of the period 387,888,536 372,585,642 – –
Amortisation
Balance as at the beginning of the period 87,829,121 83,139,042 – –
Amortised during the period 8,448,663 4,690,079 – –
Balance as at the end of the period 96,277,784 87,829,121 – –
Unamortised capital grants as at 31 March 291,610,752 284,756,521 – –
The above capital grants represents the following:
1. Funds received from the Plantation Housing and Human Development Trust (PHDT), MTIP, MPI for the development of workers welfare facilities and improvements to institutional facilities.
2. Funds received from the Tea Board for the construction of the CTC Tea Factory at Delta Estate.
3. Funds received from the Plantation Reform Project for the development of Forestry Plantations.
4. Subsidies received from the Rubber Controller Department for Rubber Replanting. The amounts spent is capitalised under the relevant classification of property, plant and equipment. The corresponding grant component is reflected under deferred income and is being amortised over the useful life span of the related asset.
NOTES TO THE FINANCIAL STATEMENTS

LOLC 2011/12 REPORTS & ACCOUNTS 195
38.2 Operating Lease Receivables - PHDT Group Company
For the year ended 31 March 2012 2011 2012 2011
(Rs.) (Rs.) (Rs.) (Rs.)
Balance as at the beginning of the period 4,120,910 4,188,003 – –
Amortised during the period (536,735) (67,093) – –
Balance as at the end of the period 3,584,175 4,120,910 – –
38.3 Deferred Income in Respect of Transfer of Shares - Maturata Plantations PLC
Balance as at the beginning of the Period – – – –
Prepayments received 31,996,875 – – –
Amortised during the period (1,081,010) – – –
Balance as at the end of the period 30,915,865 – – –
This represents the value of 6,399,375 number of ordinary shares of Rain Forest Eco Lodge (Pvt) Ltd. received by Maturata Plantations Ltd. at Rs. 10/- each in lieu of releasing the leasehold rights of 488 Hectares in Enselwatte, Deniyaya for Eco Tourism Project. The value of ordinary shares are deferred and amortised over the unexpired balance lease period.
39 retIreMent BeneFIt oBLIGAtIons
Group Company
As at 31 March 2012 2011 2012 2011
(Rs.) (Rs.) (Rs.) (Rs.)
Movement in the Present Value of the Defined Benefit Obligations
Balance as at the beginning of the period 889,356,837 759,559,844 80,123,443 65,638,616
Acquisition of subsidiaries & joint ventures 27,761,037 24,581,716 – 4,167,694
Benefits paid by the plan (97,964,019) (109,855,568) (4,775,626) (2,880,483)
Expenditure recognised in the Income Statement (Note 39.1) 131,332,229 215,070,845 10,648,775 13,197,616
Balance as at the end of the period 950,486,084 889,356,837 85,996,592 80,123,443
39.1 Expense Recognised in the Income Statement
Group Company
For the year ended 31 March 2012 2011 2012 2011
(Rs.) (Rs.) (Rs.) (Rs.)
Current service costs 96,379,684 177,015,763 7,429,063 6,398,398
Interest costs 21,255,801 20,565,888 8,026,320 7,737,491
Curtailment gain – – – 60,206
Actuarial gain/(loss) 13,696,744 17,489,194 – (998,479)
Transfer of expenses – – (4,806,608) –
131,332,229 215,070,845 10,648,775 13,197,616
NOTES TO THE FINANCIAL STATEMENTS

196 LOLC 2011/12 REPORTS & ACCOUNTS
Actuarial Assumptions
Principal actuarial assumptions at the reporting date (expressed as weighted averages).
For the year ended 31 March 2012 2011
Discount rate (%) 10 - 11 9 - 12.35
Future salary increases (%) 5 - 10 8 - 10.75
Staff turnover factor (%) 5 - 10 5 - 10
Retirement age (Yrs.) 55 - 60 55 - 60
40 stAted CApItAL
Group Company
As at 31 March 2012 2011 2012 2011
Issued and fully-paid (Note 40.1) (Rs.) 475,200,000 475,200,000 475,200,000 475,200,000
No. of shares (Note 40.2) 475,200,000 475,200,000 475,200,000 475,200,000
All shares rank equally with regard to the Company’s residual assets. The holders of ordinary shares are entitled to receive dividends as declared from time to time, and are entitled to one vote per share at meetings of the Company.
Group Company
As at 31 March 2012 2011 2012 2011
(Rs.) (Rs.) (Rs.) (Rs.)
40.1 Movement in Stated CapitalBalance at the beginning of the period 475,200,000 475,200,000 475,200,000 475,200,000
Movement during the period – – – –
Balance at the end of the period 475,200,000 475,200,000 475,200,000 475,200,000
40.2 Movement in No. of SharesBalance at the beginning of the period 475,200,000 47,520,000 475,200,000 47,520,000
Sub-division of shares (Note 13.1.2) – 427,680,000 – 427,680,000
Balance at the end of the period 475,200,000 475,200,000 475,200,000 475,200,000
41 reserves
Group Company
As at 31 March 2012 2011 2012 2011
(Rs.) (Rs.) (Rs.) (Rs.)
Revaluation reserve (Note 41.1) 621,620,598 752,412,624 600,886,875 600,886,875
Future taxation reserve (Note 41.2) 205,000,000 205,000,000 205,000,000 205,000,000
Statutory reserve (Note 41.3) 1,102,969,392 732,934,122 272,356,156 290,215,933
Investment fund reserve (Note 41.4) 281,273,872 57,398,922 – –
total 2,210,863,862 1,747,745,668 1,078,243,031 1,096,102,808
NOTES TO THE FINANCIAL STATEMENTS

LOLC 2011/12 REPORTS & ACCOUNTS 197
41.1 Revaluation ReserveThe revaluation reserve relates to the revaluation surplus of property, plant and equipment and long-term investments. Once the respective revalued items have been disposed, the relevant portion of revaluation surplus is transferred to retained earnings.
41.2 Future Taxation ReserveThis reserve was created in order to accommodate the unexpected future tax liabilities arisen and pay off the tax consequences thereon.
41.3 Statutory ReserveThe reserve fund of the Company and subsidiaries (Namely LOLC Micro Credit Ltd.) involved in leasing business was created according to the Direction No. 05 of 2006 issued by the Central Bank of Sri Lanka under the Section 34 of the Finance Leasing Act No. 56 of 2000 which requires the Companies to transfer 5% of their annual profits to this reserve until the sum equals to share capital of those Companies.
The statutory reserves of Lanka Orix Finance PLC and Commercial Leasing and Finance Ltd. were created in accordance with the Finance Companies (Capital Funds) Direction No. 01 of 2003 issued under the Finance Business Act No. 42 of 2011 (which supersedes the Finance Companies Act No. 78 of 1988) which requires the Company to transfer 20% of its annual profit to this reserve.
41.4 Investment Fund ReserveAll companies supplying financial services are liable to pay VAT on financial services as per Section 25 A-G of the Value Added Tax Act No. 14 of 2002 and are required to deposit the respective sums in an Investment Fund Account established by the respective company as per the Central Bank Guidelines under the cover of letter No. 02/17/800/0014/01 dated 29 April 2011. Each company is required to deposit an amount equal to 8% of the value addition (profits) computed for financial VAT purposes on the same date of each month that VAT on financial services is paid and the 5% of the income tax liability on quarter tax payment. This requirement is effective from 1 January 2011.
42 retAIned eArnInGs
Group Company
For the year ended 31 March 2012 2011 2012 2011
(Rs.) (Rs.) (Rs.) (Rs.)
Balance brought forward 10,773,393,641 6,662,696,388 5,877,341,305 4,401,162,084
Transferred to retained earnings – 735,975,206 17,859,777 –
Transfers to statutory reserves (593,910,220) (385,353,847) – (48,326,643)
Net profit for the year 6,259,864,500 3,840,227,908 4,300,966,315 1,523,343,288
Dividend forfeited – 1,162,576 – 1,162,576
Changes in Group holdings 162,707,493 (81,314,590) – –
Balance at the end of the year 16,602,055,414 10,773,393,641 10,196,167,397 5,877,341,305
The carrying amount of the retained earnings represents the undistributed earnings held by the Group and the Company. This could be used to absorb future losses and dividend declaration.
NOTES TO THE FINANCIAL STATEMENTS

198 LOLC 2011/12 REPORTS & ACCOUNTS
43 CoMMItMents And ContInGenCIes
Group Company
As at 31 March 2012 2011 2012 2011
(Rs.) (Rs.) (Rs.) (Rs.)
43.1 Contingent LiabilitiesGuarantees issued to banks and other institutions 1,151,229,151 1,538,987,284 102,317,924 1,500,000,000
Corporate guarantees given to foreign funding agencies to grant loans to microfinance clients 598,533,616 598,547,038 598,533,616 598,547,038
Corporate guarantees given to subsidiary companies to obtain loans 3,767,375,000 – 3,767,375,000 –
Stumpage payables (Note 43.1.1) 50,800,000 – – –
Balance at the end of the year 5,567,937,767 2,137,534,322 4,468,226,540 2,098,547,038
43.1.1 Stumpage Payables - Pussellawa Plantations Ltd.
Forest Department has imposed Rs. 50,800,000/- as the stumpage payable to the Government by Pussellawa Plantations Ltd. for harvesting of Forest Department’s Pinus Trees at Delta Estate by the Timber Lake Company. However, the Company has requested Forest Department to reconsider the sumpage calculation, as the said fee is more than the market value of the timber and is not keeping in line with the Supreme Court Judgement. Therefore, the amount of liability and the date of liability are uncertain and will depend on the response of the Forest Department.
43.2 Commitments Group Company
As at 31 March 2012 2011 2012 2011
(Rs.) (Rs.) (Rs.) (Rs.)
Forward exchange contracts (Note 43.2.1) 18,808,409,121 12,147,143,462 4,279,980,162 5,615,638,725
Capital commitments (Note 43.2.2) 4,640,914,200 133,456,600 – 73,456,600
Letter of credits opened 195,166,239 94,724,861 195,166,239 46,205,504
Facility limits not utilised 1,677,621,760 1,531,604,468 949,885,653 1,194,934,635
Balance at the end of the year 25,322,111,320 13,906,929,391 5,425,032,054 6,930,235,464
43.2.1 On the commitment for forward exchange contracts, the Group will receive US$ 10,785,906, Euro 27,027,168, GBP 1,345,000, AUD 1,965,000 and the Company will receive US$ 17,915,786 and Euro 13,030,000 on the conversion.
43.2.2 Capital Commitments
The Group of Companies entered to following capital commitments as at the Balance Sheet date.
United Dendro Energy (Pvt) Ltd.According to the agreement entered with the Board of Investments (BOI) in Sri Lanka, the Company is committed to invest US$ 6,560,000 or its equivalent in Sri Lankan Rupees in 6 MW biomass power plant at Dodangoda.
Samudra Beach Resorts (Pvt) Ltd.Samudra Beach Resorts (Pvt) Ltd. has entered into an agreement for a contract with Sierra Civil Engineering (Pvt) Ltd. as Designing and Building Contractor to construct a 4-Star Hotel at Kosgoda. The total cost is estimated to be Rs. 1,720,000,000/-.
NOTES TO THE FINANCIAL STATEMENTS

LOLC 2011/12 REPORTS & ACCOUNTS 199
Free Lanka Capital Properties (Pvt) Ltd. (FLCPL)FLCPL has entered into an agreement for a lump sum contract with Sierra Civil Engineering (Pvt) Ltd. as Designing and Building Contractor to construct a multi storied office complex at new assessment No. 19, Dudley Senanayake Mawatha, Colombo 08. The total cost of this project excluding the cost of land which is already acquired for Rs. 181,674,000/- and taxes, is estimated to be Rs. 625,000,000/-.
For the purpose of the aforementioned project FLCPL has entered into an agreement with Board of Investment on 8 March 2012 to obtain financial benefits/concessions under the agreement. Accordingly, FLCPL is required to invest in Fixed Assets not less than US$ 7,000,000 or its equivalent in Sri Lankan Rupees.
Tea Leaf Resort Holdings (Pvt) Ltd. (TLRHL)TLRHL has entered into an agreement with Sierra Construction (Pvt) Ltd. for Rs. 850,000,000/- for the construction of two boutique- style hotels.
Hydro Power Free Lanka 2 (Pvt) Ltd. The Company has entered into various contracts to construct Mini Hydro Power Projects at Thebuwana, Keragala Estate and Kuruwita amount to Rs. 656,600,000/-.
44 events AFter tHe BALAnCe sHeet dAte
Commercial Leasing and Finance Ltd.Subsequent to Balance Sheet date, the Company was floated in Colombo Stock Exchange’s (CSE) Diri Savi Board.
45 Assets pLedGed
Nature of Assets Nature of Liability Group Company
2012 2011 2012 2011
(Rs.) (Rs.) (Rs.) (Rs.)
Foreign currency term deposits Interest-bearing loans and borrowings 177,326,195 2,862,886,491 177,326,195 245,366,725
Government Treasury Bonds
Secured against the REPO instrument borrowings 20,000,000 – 20,000,000 –
Lease, hire purchase and loans receivable Interest-bearing loans and borrowings 30,007,350,918 21,192,989,226 7,459,596,482 8,597,310,764
Marketable shares and loans and buildings
Term loan/bank drafts/short- term loan/field and processing developments 4,355,710,634 3,761,387,771 3,587,746,035 –
Leasehold right Bank overdrafts/term loans/ investments in field development 1,109,426,398 646,803,409 – –
Leasehold property and vehicles Finance lease 474,506,586 205,078,015 52,245,420 155,128,015
Stock and book debts Term loan 913,391,947 940,000,000 – –
37,057,712,678 29,609,144,912 11,296,914,132 8,997,805,504
NOTES TO THE FINANCIAL STATEMENTS

200 LOLC 2011/12 REPORTS & ACCOUNTS
46 reLAted pArtY dIsCLosures
46.1 Transactions with Key Management PersonnelAccording to Sri Lanka Accounting Standard 30 (Revised 2005) ‘Related Party Disclosures’, Key Management Personnel, are those having authority and responsibility for planning, directing and controlling the activities of the entity. Accordingly, the Board of Directors (including Executive and Non-Executive Directors), personnel hold designation of Divisional General Manager and above positions and their immediate family member have been classified as Key Management Personnel of the Company.
The immediate family member is defined as spouse or dependent. Dependent is defined as anyone who depends on the respective Director for more than 50% of his/her financial needs.
Key Management Personnel Compensation
Group Company
For the year ended 31 March 2012 2011 2012 2011
(Rs.) (Rs.) (Rs.) (Rs.)
46.1.1 Short-term employment benefits 300,199,959 213,821,556 222,780,559 174,867,936
Includes
- Fees 53,883,448 40,282,878 46,064,635 38,387,878
- Emoluments 23,535,952 41,093,178 24,699,818 19,396,918
Other short-term benefits 222,780,559 132,445,500 152,016,106 117,083,140
300,199,959 213,821,556 222,780,559 174,867,936
46.1.2 Long-term employment benefits
There are no long-term employment benefits paid to the Key Management Personnel during the year.
46.1.3 Other Transactions with Key Management Personnel
Group Company
For the year ended 31 March 2012 2011 2012 2011
(Rs.) (Rs.) (Rs.) (Rs.)
Advances granted during the period 2,900,000 550,000 – –
Balance outstanding 2,426,998 1,216,866 – –
Operating lease facilities granted 20,324,508 6,111,876 20,324,508 6,111,876
Rentals paid (2,455,832) (691,528) (2,455,832) (691,528)
Balance rentals outstanding – 5,420,348 – 5,420,348
Deposits held 526,243,122 516,251,281 – –
Interest paid/charged 56,767,230 35,749,864 – –
Interest payable 9,143,809 13,483,774 – –
Land and building purchases – 110,000,000 – 110,000,000
NOTES TO THE FINANCIAL STATEMENTS

LOLC 2011/12 REPORTS & ACCOUNTS 201
46.2 Transactions with Related Parties The Company carries out transactions in the ordinary course of its business with parties who are defined as related parties in Sri Lanka Accounting Standard 30 ‘Related Party Disclosures ‘(Revised 2005)’. The Pricing applicable to such transactions are based on the assessment of the risk and pricing model of the Company and is comparable with what is applied to transactions between the Company and its unrelated Customers.
46.2.1 Group
Group’s uneliminated portion of transaction entered with joint ventures and associates; Group
For the year ended 31 March 2012 2011
(Rs.) (Rs.)
Joint Ventures Loans, advances and promissory notes obtained 693,671,718 110,976,404
Interest paid 26,650,339 20,664,903
Repayment of finance leases and loans obtained 152,567,213 43,207,178
Rent and management fee received 2,770,956 167,876,000
Vehicle hire Income 900,000 240,000
Trading transactions – –
- Sales 914,801 183,500
- Purchases 44,660,447 61,800,625
Purchase of land – 80,000,000
Term and savings deposits and commercial papers 1,354,868,525 137,500,000
Deposits interest income 68,353,555 1,977,740
Dividend income 55,090,046 40,569,000
Expenses incurred on behalf of the Company 12,708,311 22,352,500
Other operating expenses 31,570,258 26,545,500
Associates Insurance commission received 6,617,341 6,109,928
Term deposits – 498,815,217
Trading transactions- Sales 2,081,256,307 2,161,016,433
- Purchases 94,735,127 132,841,202
Interest paid 180,114,031 125,630,589
Fund transfers 150,000,001 78,233,663
Loans granted – 761,800,000
Repayment of loans and finance leases obtained 95,093,289 15,564,299
Expenses shared 1,124,523 1,115,741
NOTES TO THE FINANCIAL STATEMENTS

202 LOLC 2011/12 REPORTS & ACCOUNTS
46.2.2 Company
Transactions with Subsidiaries, Associates and Joint Ventures
Company
For the year ended 31 March 2012 2011
(Rs.) (Rs.)
Subsidiaries Fund transfers in 62,855,971,628 31,306,783,120
Fund transfers out 59,181,931,637 34,213,911,311
Expenses shared 5,034,082,411 1,317,147,190
Asset hire income 96,884,565 35,624,049
Debenture interest received 59,752,485 83,579,449
Treasury management fee 370,101,349 300,378,935
Transfer of finance portfolio 1,216,014,768 –
Interest received on fund transfer 816,270,507 119,933,399
Sale of investments 3,114,151,432 –
Transfer of loans 2,100,579,120 –
Shared services 111,707,515 –
Transfer of factoring portfolio 3,663,568,509 –
Reversal of interest-Browns Investments 7,303,638 –
Transfer of subsidiary investments 75,251,732 –
Loan transfer 550,579,120 –
Purchase of assets 259,999,000 252,468,877
Part of consideration of the deed of transfer bearing 10,000,000 –
Restructuring and arrangement fees 400,000,000 –
Rentals paid 4,800,000 –
Assets transferred 270,832 –
Rendering of services received – 94,434,997
Royalty received – 6,415,960
Investment in subsidiary companies 4,357,453,642 3,987,220,040
Treasury Bond transfer – 2,575,252,804
Investment in commercial papers 260,796,050 –
Loans granted – 822,668,356
Loan transfer to subsidiary – 820,968,356
Repayment of finance leases and loans obtained – 148,151
Associates Fund transfers in 78,233,663
Repayments of finance leases and loans obtained 93,841,527 15,564,299
Loans granted – 761,800,000
Interest received 76,345,098 99,752,718
Expenses shared – 1,115,471
Investment in commercial papers 584,942,144 –
Joint Ventures Loans granted 5,250,000 9,219,808
Repayments of finance leases and loans obtained 57,378,815 37,681,632
Interest received 19,510,107 22,755,017
Purchase of commodities – 159,250
Investment in commercial papers 605,169,486 –
Purchase of land – 160,000,000
Balance Outstanding on facilities granted to related parties as at 31 March:
Subsidiaries Finance leases and loans granted 87,460,819 1,551,849
Associates Finance leases and loans granted 955,838,622 796,235,701
Joint Ventures Finance leases and loans granted 118,870,714 135,388,809
NOTES TO THE FINANCIAL STATEMENTS

LOLC 2011/12 REPORTS & ACCOUNTS 203
46.2.3 Transactions with Other Related Parties
Group Company
For the year ended 31 March 2012 2011 2012 2011
(Rs.) (Rs.) (Rs.) (Rs.)
46.2.3.1 Ishara Traders (Pvt) Ltd.
Loans Obtained
Balance as at the beginning of the year 3,858,854,772 1,539,090,987 – 764,708,631
Loan obtained 8,745,691,811 4,300,579,120 2,550,579,120 1,000,000,000
Loan settlements 6,254,016,370 (1,980,815,335) (2,550,579,120) (1,764,708,631)
Balance at the end of the year 6,350,530,213 3,858,854,772 – –
Interest paid 1,023,862,538 422,825,591 101,885,179 104,051,420
Lease vehicles and fixed assets purchased 8,500,000 388,375,000 8,500,000 330,050,000
46.2.3.2 Sathya Capital (Pvt) Ltd.
Loans Obtained
Balance as at the beginning of the year – – – –
Loans obtained during the year 610,000,000 – 610,000,000 –
Loan settled during the year (610,000,000) – (610,000,000) –
Balance at the end of the year – – – –
Interest paid 17,195,459 17,195,459
Sales proceeds from disposal of 126,029,117 CLC Shares 630,145,585 – – –
Loans GrantedBalance as at the beginning of the year – – – –
Loans granted during the year 633,296,313 – – –
Loan recovered during the year – – – –
Balance at the end of the year 633,296,313 – – –
Interest accrued 13,446,703 – – –
46.2.3.3 Saakya Capital (Pvt) Ltd.
Debentures Issued 3,000,000,000 – 3,000,000,000 –
Interest paid 37,873,507 – 37,873,507 –
Sales proceeds from disposal of 140,000,000 CLC Shares 700,000,000 – – –
Loans granted during the period 703,500,000 – – –
Interest accrued 14,937,329 – – –
NOTES TO THE FINANCIAL STATEMENTS

204 LOLC 2011/12 REPORTS & ACCOUNTS
46.3 Related Party Balances Group Company
As at 31 March 2012 2011 2012 2011
(Rs.) (Rs.) (Rs.) (Rs.)
46.3.1 Amounts due from Related Parties
Lanka ORIX Finance PLC – – 792,773,199 644,562,624
Lanka ORIX Information Technology Services Ltd. – – 24,621,697 26,519,579
Sundaya Lanka (Pvt) Ltd. – – 657,388 4,157,388
Commercial Leasing & Finance Ltd. – – 1,315,393,739 278,993,550
LOLC Micro Credit Ltd. – – 977,767,712 145,657,483
LOLC Insurance Company Ltd. – – 73,228,777 4,509,229
LOLC Investments Ltd. – – 438,153,063 –
Browns & Company PLC – – – 7,303,638
United Dendro Energy (Pvt) Ltd. – – 84,935,534 16,304,234
LOLC Securities Ltd. – – 113,440,548 9,514,000
Eden Hotels Lanka PLC – – 234,090 295,503
LOLC Factors Ltd. – – 5,971,710,109 200,000
LOLC Motors Ltd. – – 405,437,356 –
Speed Italia Ltd. – – 47,940,459 –
Lanka ORIX Project Development Ltd. – – 13,623,891 –
Lanka ORIX Securities Ltd. – – 70,812,304 –
Diriya Investments Ltd. – – 198,534 –
LOLC Land Holding Ltd. – – 57,600 –
LOLC Realty Ltd. – – 160,028,990 –
LOLC Leisure Ltd. – – 5,013,096 –
Orient Academy Ltd. – – 60,251,732 –
Dickwella Resort Ltd. – – 75,022,856 –
Riverina Hotels PLC – – 24,041,728 –
Agstra Fertilizer PLC 12,600,000 – – –
Associated Battery Manufacturers (Ceylon) Ltd. 8,150 930,651 – –
Galoya Plantations Ltd. 290,077,825 – 1,115,471 –
Sierra Construction (Pvt) Ltd. 95,324 – – –
Free Lanka Trading Liquor (Pvt) Ltd. 3,238,720 77,149 – –
Browns Properties (Pvt) Ltd. – 250,000 – –
LOLC Property Holding Ltd. – – 12,766,590 –
Lanka ORIX Insurance Brokers Ltd. 13,478 – 13,478 –
Taprobane Holding Ltd. 133,095,305 – – –
Lexinton Holding Ltd. 266,736,883 100,328,768 – –
(-) Provision for impairment – – (73,875,623) –
705,865,685 101,586,568 10,595,364,318 1,138,017,228
NOTES TO THE FINANCIAL STATEMENTS

LOLC 2011/12 REPORTS & ACCOUNTS 205
Group Company
As at 31 March 2012 2011 2012 2011
(Rs.) (Rs.) (Rs.) (Rs.)
46.3.2 Amount due to Related Parties
LOLC Motor Ltd. – – – 30,268,302
LOLC Investments Ltd. – – – 41,160,377
Lanka ORIX Insurance Brokers Ltd. – – – 106,934
Lanka Eco Solutions Ltd. – – 4,819,500 4,875,000
LOLC Leisure Ltd. – – – 160,506,311
LOLC Securities Ltd. – – – 13,963,840
Commercial Factors Ltd. 10 – 10 10
LOLC Land Holdings Ltd. – – – 4,000
LOLC Reality Ltd. – – – 10
LOLC Property Investment Ltd. – – – 10
LOLC Asset Holding Ltd. – – 10 10
LOLC Estate Ltd. – – 10 10
Tropical Villas Ltd. – – 150,000 –
Palm Garden Hotels PLC – – 120,832 –
Associated Battery Manufacturers (Ceylon) Ltd. 72,491,530 – – –
Galoya Plantations Ltd. 50,826,038 – – –
Confifi Management Services Ltd. 306,779 – – –
Free Lanka Trading (Private) Ltd. 1,152,909 – – –
Taprobane Planations Ltd. 7,198,258 4,500,000 – –
Perpetual Holdings Ltd. 165,363,000 – – –
297,338,524 4,500,000 5,090,362 250,884,814
NOTES TO THE FINANCIAL STATEMENTS

206 LOLC 2011/12 REPORTS & ACCOUNTS
47 seGMentAL InForMAtIon
Financial Insurance Trading Leisure Plantation Power & Other TotalServices Energy
(Rs.) (Rs.) (Rs.) (Rs.) (Rs.) (Rs.) (Rs.) (Rs.)
2011/12
Total revenue 20,480,870,689 134,787,359 13,148,085,020 750,290,163 2,976,831,409 49,535,456 275,461,450 37,815,861,546
Net interest cost (7,713,457,336) – (478,145,442) (8,477,046) (91,090,424) (13,636,341) (165,083,851) (8,469,890,440)
Cost of sales – – (10,163,668,119) (162,838,667) (1,333,158,010) (6,093,736) (139,880,159) (11,805,638,691)
Profit before operating activities 12,767,413,353 134,787,359 2,506,271,459 578,974,450 1,552,582,975 29,805,379 (29,502,560) 17,540,332,415
Operating expenses (5,375,220,468) (200,393,839) (1,855,309,626) (1,113,239,112) (1,330,138,174) (91,229,106) (431,944,269) (10,397,474,594)
Results from operating activities 7,392,192,885 (65,606,480) 650,961,833 (534,264,662) 222,444,801 (61,423,727) (461,446,829) 7,142,857,821
Share of profit from associate companies – – – – – – 269,958,673 269,958,673
Negative goodwill – – – 2,873,067,310 – – 41,469,110 2,914,536,420
Profit before taxation 7,392,192,885 (65,606,480) 650,961,833 2,338,802,648 222,444,801 (61,423,727) (150,019,046) 10,327,352,914
2010/11
Total revenue 15,677,183,431 9,701,446 10,318,536,846 1,358,691,213 4,912,776,578 73,854,557 (273,416,610) 32,077,327,461
Net interest cost (5,823,928,960) – (304,426,822) (130,358,841) (169,514,494) (3,293,388) (10,934,617) (6,420,587,888)
Cost of sales – – (7,198,147,586) (256,438,947) (2,337,254,470) – (119,380,895) (9,911,221,898)
Profit before operating expenses 9,853,254,471 9,701,446 2,815,962,438 971,893,425 2,406,007,614 70,561,169 (381,862,888) 15,745,517,675
Operating expenses (4,657,474,878) (4,455,481) (1,708,384,073) (752,915,943) (446,326,281) (50,355,730) (293,678,978) (7,913,591,364)
Results from operating expenses 5,195,779,593 5,245,965 1,107,578,365 218,977,482 1,959,681,333 20,205,439 (675,541,866) 7,831,926,311
Share of profit of associate companies – – – – – – 178,522,137 178,522,137
Negative goodwill – – – – – – 271,910,632 271,910,632
Profit before taxation 5,195,779,593 5,245,965 1,107,578,365 218,977,482 1,959,681,333 20,205,439 (225,109,632) 8,282,359,080
2011/12
Capital expenditure 1,882,094,489 – 464,384,687 143,751,890 96,120,103 138,784,274 915,899,750 3,641,035,194
Depreciation and amortisation 652,892,067 – 126,774,353 625,513,618 170,615,014 24,803,821 69,030,442 1,669,629,316
Provision for bad and doubtful debts 605,145,016 – 476,957 362,795 – 3,074,736 – 609,059,504
Adjustment for change in value of marketable securities 757,562,662 – 235,900,944 3,273,431 – – 490,296,160 1,487,033,197
Retirement benefit obligation 18,160,358 3,601,432 29,905,313 7,282,587 69,385,508 302,351 2,694,680 131,332,229
2010/11
Capital expenditure 1,767,717,265 – 269,417,068 34,400,859 1,133,127,908 24,119,445 13,611,769 3,242,394,314
Depreciation and amortisation 753,926,528 – 60,079,759 108,914,695 90,787,100 13,657,810 47,177,369 1,074,543,261
Provision for bad and doubtful debts 533,393,901 – 1,501,357 6,468,920 – – 5,091,680 546,455,858
Adjustment for change in value of marketable securities (15,263,865) – 1,714,800 – – – – (13,549,065)
Retirement benefit obligation 23,472,136 – 25,992,923 8,237,071 154,366,723 468,443 2,533,549 215,070,845
As at 31 March 2012
Total Assets 104,024,922,002 757,044,299 17,638,008,145 9,771,052,782 8,920,167,914 570,650,336 3,605,893,463 145,287,738,941
Total Liabilities 84,746,992,887 411,879,491 9,081,934,500 1,355,828,942 3,558,015,520 1,087,189,336 1,981,388,795 102,223,229,471
As at 31 March 2011
Total Assets 78,489,561,275 209,393,289 13,397,616,846 4,853,881,167 12,605,687,760 472,059,008 1,785,333,243 111,813,532,588
Total Liabilities 69,022,320,065 1,518,084 2,975,533,954 1,642,877,487 2,124,630,709 85,664,045 1,237,836,758 77,090,381,102
NOTES TO THE FINANCIAL STATEMENTS

ANNEXES

208 LOLC 2011/12 REPORTS & ACCOUNTS
SuStainability RepoRt
intRoduction A commitment to serve the national development agenda implicitly demands a commitment to the
principles of sustainability. When you are building for the future with your right hand, you do not break down and despoil
what you already have with your left. Instead, you work to sustain and preserve.
Our insistence on triple bottom line reporting reflects our ultimate goal as a growing conglomerate: to deliver profit
to our shareholders by investing in and supporting economic and national development, particularly in sectors where
development policy seeks to promote and support growth. We are building for the long-term, serving both our stakeholders
and the nation. By ensuring that we measure and seek to control the impacts of our activities and investments on society
and the environment just as we seek to maximise our economic impact and returns, this reporting approach helps us
achieve our strategic goals.
Making A Promise to the World LOLC is a member of the UN Global Compact (UNGC), a group of responsible bodies
and businesses that have embraced a charter on sustainability in practice. This charter, known as the UNGC principles,
holds members of the Compact to specific commitments in terms of human rights, labour rights, environmental
protection and action against corruption.
pRincipleS of the un Global compact
Human Rights
1. Businesses should support and respect the protection of internationally-proclaimed human rights.
2. Businesses should make sure that they are not complicit in human rights abuses.
Labour
3. Businesses should uphold freedom of association and effective recognition of the right to collective bargaining.
4. Businesses should uphold the elimination of all forms of forced and compulsory labour.
5. Businesses should uphold the effective abolition of child labour.
6. Businesses should uphold the elimination of discrimination in respect of employment and occupation.

LOLC 2011/12 REPORTS & ACCOUNTS 209
Environment
7. Businesses are asked to support a precautionary approach to environmental challenges.
8. Businesses are asked to undertake initiatives to promote greater environmental responsibility.
9. Businesses are asked to encourage the development and diffusion of environmentally-friendly technologies.
Against Corruption
10. Businesses should work against corruption in all its forms, including extortion and bribery.
how lolc GRoup upholdS the unGc pRincipleS Human Rights All Group companies and divisions adhere
to the best principles and practices of human rights. This is of particular importance in the plantation sector, where
historical conditions have resulted in a particular sensitivity to human rights issues. On the Group’s Maturata and
Pussellawa plantations, continuing improvements to worker housing and sanitation facilities, community medical
care access and education for the children of estate families reflect our concern for human rights within a broader
programme of community development, which goes beyond mere rights to the extension of public services and benefits.
Regular community meetings are followed up by management group review to ensure that the human rights regime on
our plantations is exemplary and free from abuses of any kind.
Labour As a conglomerate, LOLC employs a large and varied workforce employed in a diversity of working
environments. Across the Group, our employees enjoy freedom of association and a voice in management deliberations
affecting their careers, pay or working conditions. On our plantations, workers’ committees and collective agreements
determine wages, grievance handling and more. Gender equity, another area of historical concern, is maintained,
with female staff appointed on our estates to oversee women’s issues.
LOLC is an equal opportunity employer, without bias, concerning recruitment, pay and benefits, training and development
opportunities or promotion. Women, for example, serve and have served in the highest positions at LOLC and its
subsidiaries. We simply recruit individuals with the best qualifications, skills, experience and mindset, irrespective of
sex, race or religion.
SUSTAINABILITy REPORT

210 LOLC 2011/12 REPORTS & ACCOUNTS
Our employment policy prohibits the hiring of anyone under 18 years of age. We shun child labour and will brook no
relaxation of this policy. We also insist that all employees undertake to abide by our policy against sexual harassment.
The LOLC Group does not approve of or condone forced or compulsory labour.
In all these matters, we are governed by the law of the land and the terms of employment agreed with our employees.
Human Resources The brilliant performance and relentless contribution by our team of young, competent
and dynamic employees deployed across the country in different business sectors has been the key success factor
towards positioning LOLC as a leading and reputed Group in the country today. With the support and encouragement of
a robust leadership that always works alongside their teams, the Group’s workforce has ensured sustainable growth
year on year.
The financial year 2011/12 posed several challenges in the management and development of the Group’s employees
especially with LOLC’s penetration and startup operations in diverse industries including Hospitality, Motor Engineering,
Plantation, Stock Broking and Insurance. The Group’s HR policies were aligned to cater to the different business
segments and relevant employment practices in each industry, while adhering to the core HR principles and policies of
the Group. This created the need to re-model the HR architecture to cater to a diverse group of employees combined
with several HR requirements of both the Group’s Financial and Non-Financial sectors by identifying different trends,
necessities and interventions within the Sri Lankan context. The business requirements challenged the team of HR
practitioners within the Group to review the core processes and operations of HR, innovate and acquire the needed
knowledge of managing people of different industries. The reorganisation has enabled us to give equal and adequate
focus to both sectors while reaping the economies of scale through the strengthening of a HR-shared services platform
within the LOLC Group.
Our financial services sector expanded its footprint with 31 new branches and service centres. It has created a closer
affinity with our customers and enables our regional teams to build a robust client relationship and to serve and be
recognised in the community. The belief in and sustenance of an inclusive culture within LOLC has been key to delivering
exceptional service to our clientele and key to our organisational well-being.
SUSTAINABILITy REPORT

LOLC 2011/12 REPORTS & ACCOUNTS 211
Growth enabled us to create more opportunities for our existing employees to take up new challenges in newly opened
branches, with enormous possibility for career development. The increasing network of LOLC mini branches paved
way to develop potential leaders in the regions where employees were appointed as Officers-In-Charge of the newly-
opened centres. Growth has brought greater employee mobility within the Group through promotions, transfers,
lateral career moves, etc. which has generated improved employee morale and minimised stagnation in positions
for several years. These opportunities provided to a total of 3,699 employees within the Group a high performance
and rewarding working climate, paving the way for us to be a preferred employer in the financial services sector.
The employee retention rate of 82% within the Group testifies to this fact.
The financial services sector saw a growth of 24% with a total of 449 new employees joining the Group. A retention rate
of 86% was achieved in this sector for the financial year with a 90% + rate being maintained at leadership levels. A total
of 92% have been trained in the financial services sector with an investment of around Rs. 18.5 Mn with a greater part of
overseas programmes being sponsored by funding agencies, etc. The training programmes were designed and selected
not only to enhance the knowledge of the employees but also to enhance their capabilities in relationship building,
negotiation skills, etc., and develop identified individuals to be future leaders who could take up the responsibility of
spearheading the business operations of the Group.
LOLC’s Flagship HR Programme ’From Student To Professional’ (FSTP) initiated in the last financial year created great
enthusiasm among young school leavers with career ambitions to become leading professionals in the financial sector.
The programme exceeded their expectations. The benefits of the programme has resulted in providing on the job
training opportunities for 51 trainees out of whom 16 have already been absorbed to the permanent cadre of the Group.
The programme has benefited us immensely by having readily available, trained and adaptable personnel to be deployed
for job openings within the Group.
With the strategic acquisition of Dickwella Resorts & Spa, around 80 employees were absorbed to the non-financial
sector making the total staff cadre as of end March, 856. The retention rate was 72% which is impressive considering
Hotel Riverina, Tropical Villa and Club Palm Garden being closed for refurbishment.
The team ‘SPIRIT’ dedicated in stimulating the spirit among LOLC employees through numerous recreation initiatives
over and above their routine job scope played a vital role in bringing all the employees of the sectors of the Group together.
SUSTAINABILITy REPORT

212 LOLC 2011/12 REPORTS & ACCOUNTS
Inculcating the values in the hearts of employees, SPIRIT started off the year with a Blood Donation Campaign which
had an overwhelming response, focused towards our employees helping the community. Events such as ‘Peduru Party’
and a Six-a-side Cricket Tournament were organised to bring employees together from all regions/sectors to showcase
their talents. The annual event such as the Pirith Ceremony, LOLC Dinner Dance and the Kiddies Christmas Party were
also organised by the active cross functional team.
The LOLC Basketball team was awarded the Champions Trophy in the Mercantile Basketball Tournament, while the
Badminton team maintained their consistent form in the Championships and became the Runners-up.
The Environment Preserving Sri Lanka’s environmental wealth is a vital element in our policy. It supports, for
example, our investment in tourism, which is critically dependent on the natural beauty and biodiversity of our island.
In a different but not dissimilar way, our interests in renewable energy not only preserve the environment but support
the social goal of universal electrification and literally power national development. In this way, we can often broker a
concurrence between the interests of our customers and shareholders and the interests of the environment.
Our plantations are run using best-in-class agricultural practices in which sustainability is an important consideration.
Many estates rely at least partly on their own hydropower and dendropower resources, and undertake numerous
reforestation and ecology-friendly waste-management programmes.
Group companies conserve vital resources and recycle wherever possible. LOLC Motors harvests rainwater, recycles
waste water using a microbiological system and prevents the leakage of refrigerant from its air conditioning systems
into the environment. The Company’s ‘Green Motor Service Facility’ maximises the use of natural lighting. Meanwhile,
LOLC Micro Credit is taking measures to wean customers off two-stroke vehicles whose emissions reduce air quality.
At its head office in Colombo, LOLC possesses the largest environmentally responsible installation of any commercial
building in this country in the form of a rooftop solar array that generates 15% of daily power requirements - a full 48 kW.
Our green investment policy has seen our interests in the renewable-energy sector intensify in recent years. Hydro
Power Free Lanka, a Group company, is already generating 3.2 MW from its mini-hydro plants, while 7 MW more, now in
various stages of development, will add another 20 MW within the next 5 years at an initial investment of approximately
US$ 30 Mn. These projects are registered to earn carbon credits from the United Nations Framework Convention on
Climate Change (UNFCCC). Several estates of the Maturata and Pussellawa Groups have substituted wood for fossil
SUSTAINABILITy REPORT

LOLC 2011/12 REPORTS & ACCOUNTS 213
fuels for tea drying, with the estates’ own forestry projects supplying the fuel. LOLC Eco Solutions, another subsidiary,
has several biomass-fuelled and hydropower plants and is moving forward with its assessment of potential wind-power
investments.
In addition, our strategic investment in United Dendro Energy (UDE) is showing results as its 6 MW wood-fired power plant
takes shape at Kalutara and its forestry and agricultural programmes and outgrower registrations come on-stream.
The Kalutara plant will be ready for operation by the end of 2013. UDE’s operations will generate thousands of jobs in
the rural sector. Both its power generation and plantation operations will earn UNFCC carbon credits while reducing
the Group’s carbon footprint.
Gal Oya Plantations, operated by LOLC and Brown & Company is a public-private partnership with the Government of
Sri Lanka. The company is just completing a project which includes the revival and refurbishment of the sugar plantation
and power plant, with the factory scheduled to commence operations in July. The project also included the renovation
of the water purification plant, with excess purified water being sold to the National Water Supply and Drainage Board.
The 5,200 ha sugar cane plantation will also support the production of ethanol as a by-product whilst generating 2 MW of
bagasse based clean energy. Benefits to the local community include direct employment for nearly 1,200 persons, and
indirect employment for over 15,000 persons and 5,500 farmer families, thus contributing towards income generation
and improved quality of life.
More broadly, LOLC promotes initiatives such as internal paper recycling and the use of energy-saving light bulbs while
limiting the use of air conditioning, computers and lighting. It is also replacing its fleet of conventional vehicles with new
hybrid motors.
Besides these measures of its own, LOLC also encourages its customers to be more green. Our credit appraisal
process requires the production of an environmental assessment report, with local environmental authority clearance
where applicable. Further along the process, our staff evaluate and report on these businesses with regard to their
environmental friendliness.
The Group’s Code of Conduct demands compliance with rules on sustainability and environmental friendliness with
regard to the development of new products and services.
SUSTAINABILITy REPORT

214 LOLC 2011/12 REPORTS & ACCOUNTS
The Fight Against Corruption LOLC has in place a comprehensive policy and regulatory framework to pre-empt and
guard against any form of corruption. The Group’s anti-money laundering policy commits us to specific, comprehensive
precautions to help prevent the systems and processes of the Group being used for money laundering or the financing
of unlawful activities. Safeguards include customer identification routines and due diligence processes. We maintain
an inclusive, supportive and confidential whistle-blower procedure that frees every employee to make material reports
to Internal Audit and Enterprise Risk Management without risk or fear. LOLC is in compliance with the legislation of
the Government of Sri Lanka in relation to the Convention on Suppression of Terrorist Financing Act No. 25 of 2005,
the Financial Transactions Reporting Act No. 6 of 2006, the Prevention of Money Laundering Act No. 5 of 2006, and all
relevant Acts and Regulations of the Government.
The Group also maintains transparency in all communications with stakeholders including its Annual Report,
announcements made through the Colombo Stock Exchange, press releases and its website.
lolc caRe: StRateGic cSR LOLC Care was created to plan, develop and carry out the corporate social responsibility
initiatives of the Group. Launched in 2009, this operation was created to prioritise diverse CSR initiatives ranging from
workshops in financial management for migrant workers to community awareness programmes on Dengue prevention.
Today, the LOLC Care Committee, in which Board and management across different business units and divisions are
represented, approves and supervises LOLC and Group level CSR.
Since its inception, LOLC Care has collaborated with the National Council for Child & youth Welfare in the renovation and
maintenance of Madiwela Special Education School & Home for Boys, a facility for differently-abled boys and men. In the
first phase, the facility was expanded to accommodate six more residents; the second, will consist of a new building to
house and educate fifty orphaned boys, which will be completed during September 2012. With the active participation of
LOLC staff, customers and other well-wishers, LOLC Care continues to support the Madiwela School & Home, organise
cultural and religious activities for its pupils and help with the supply of educational and vocational training inputs and
facilities. Proceeds from the LOLC Care Fund, in which LOLC matches every Rupee donated by others or raised through
merchandising, etc., are used to finance these activities.
SUSTAINABILITy REPORT

LOLC 2011/12 REPORTS & ACCOUNTS 215
SUSTAINABILITy REPORT
cSR initiativeS by otheR GRoup companieS Gal Oya Plantations: Supporting Rural Community Life On its
7,659 ha of plantation land, Gal Oya Plantations is a central element in the lives of the more than 6,000 rural farming
families to whom land has been allocated for cultivation. The Company strives to be of benefit to this community by
helping raise living standards and underwriting community welfare. Its CSR activities include infrastructure development
and maintenance, healthcare programmes, support for education and for farmers’ representative organisations,
and numerous contributions to community social, cultural and religious life.
Specific recent examples include blood donation campaigns, a health camp, the construction of a children’s park, water
supply and playground maintenance projects for local schools, and the supply of water to certain Buddhist temples in
the area. In addition, the Company maintains 90 km of roads and 140 km or irrigation canals on its property.
LOLC Micro Credit Ltd. LOLC Micro Credit has its own strategic CSR project, the Isuru Diriya Sisu Upahara Grade
5 Scholarship Awards programme. Instituted in 2010, the programme helps deserving pupils prepare for the national
Grade 5 Scholarship Examination. The beneficiaries are gifted children from rural locations around the country,
whose parents have few resources to spend on their education.
Beneficiaries attend preparatory classes, which are held at various locations across the country, and high achievers at
the scholarship exam are felicitated at a ceremony in Colombo. In 2011/12, 230 students nationwide who attended the
course received scholarships, as well as savings passbooks with a Rs. 1,000/- initial deposit from Lanka ORIx Finance.
The Isuru Diriya Sisu Upahara programme forms the central pillar of LOMC’s CSR strategy. In addition, the Company’s
unique ‘credit plus’ approach to microfinance also helps realise its vision for sustainable development. Finally, LOMC
branches carry out various at-need CSR initiatives of their own, based mainly on educational, entrepreneurial and other
socially relevant themes.
Lanka ORIx Finance In addition to supporting LOMC’s Isuru Diriya Sisu Upahara programme by distributing
children’s savings accounts as prizes (see above), LOFC has also co-operated with the Sarvodaya organisation in a
programme to enhance the financial literacy of Sri Lankan migrant workers in Europe and their family members
at home. 20 such workshops were conducted in different parts of the country in the year under review, reaching out to
over 500 beneficiaries.

216 LOLC 2011/12 REPORTS & ACCOUNTS
SUSTAINABILITy REPORT
Going ahead, this initiative will be continued on a larger scale in a partnership with the International Fund for
Agricultural Development that aims to reach 10,400 people in rural areas all over the country, including the North
and East. The project has the support and co-operation of the Ministry of Foreign Affairs and the Sri Lanka Bureau of
Foreign Employment.
In addition to these strategic CSR initiatives, LOFC branches also carry out their own CSR projects, often initiated
and partly funded by employees. Noteworthy projects in 2011/12 included the renovation and resupply of a struggling
pre-school in Mullaitivu attended by 45 toddlers from internally-displaced families in the area (a project funded entirely
by voluntary contributions from employees of LOFC’s Horana branch); blood donation campaigns at Hatton branch
and LOFC’s head office in Colombo; support activities to benefit a school for differently-abled children (organised by
Kurunegala branch staff in memory of a deceased colleague) and the donation of necessary equipment and consumables
to local schools and hospitals by the Badulla, Kurunegala, Nawalapitiya and Ratnapura branches.
LOLC Leisure A broad range of CSR activities were undertaken by businesses within the LOLC leisure portfolio.
Eden Resort & Spa celebrated World Tourism Day in September with an educational programme for pupils of a nearby
school, Moragalla Junior School. Other CSR activities undertaken by this division included the cleaning and maintaining
of a hospital ward at Aluthgama, blood donations, school and library book donations, a Christmas treat for orphans,
a dansala to celebrate Poson festival and alms donations to Buddhist monks.

LOLC 2011/12 REPORTS & ACCOUNTS 217
detailS of fReehold land & buildinG of companyAddress Land Extent Building Cost Accumulated Last Valuation Carrying Amount
Extent Land Building Depreciation Land Building 2012 2011
A-R-P Sq. Ft. (Rs.) (Rs.) (Rs.) (Rs.) (Rs.) (Rs.) (Rs.)
1. No. 100/1, Sri Jayawardenapura Mawatha, Rajagiriya 1A-0R-04.86P 51,800 27,500,000 32,500,000 3,740,345 27,500,000 32,500,000 681,259,655 684,989,780
2. No. 100 A, Sri Jayawardenapura Mawatha, Rajagiriya 0A-2R-20.00P 106,992,500 – – 106,992,500 – 245,000,000 245,000,000
3. No. 25/7, Wimalawatta Road, Mirihana, Nugegoda 0A-0R-33.40P 11,000,000 – – 11,000,000 – 20,000,000 20,000,000
4. No. 103, Sri Jayawardenapura Mawatha, Rajagiriya 0A-1R-12.50P 166,399,000 – – 166,399,000 – 166,399,000 166,399,000
5. No. 28A, Badulla Road, Nuwara Eliya 0A-0R-21.03P 5,426 56,974,000 57,425,000 2,127,872 56,974,000 – 112,271,128 113,706,754
6. No. 52/40, Stanly Road, Jaffna 0A-0R-37.31P 64,630,000 – – 64,630,000 – 64,630,000 64,630,000
7. No. 241 A, Maithreepala Senanayake Mawatha, Anuradhapua 0A-0R-13.01P 18,129,736 – – 18,807,102 – 18,129,736 18,129,736
8. No. 240, Moragahayata, Colombo Road, Ratnapura 0A-0R-15.80P 7,920 20,919,000 8,400,000 294,575 20,919,000 – 29,024,425 29,234,425
9. No. 156, Kolonnawa Road, Gothatuwa 1A-1R-33.71P – – – – – – 164,992,658
Land and building purchased during the year
10. No. 1163/A, Cotta Road, Rajagiriya 0A-0R-08.70P 7,810 34,546,435 38,252,565 – – – 72,799,000 –
Total 507,090,671 136,577,565 6,162,792 473,221,602 32,500,000 1,409,512,944 1,507,082,353
inveStment pRopeRtieS of the companyAddress Land Extent Building Cost Accumulated Last Valuation Carrying Amount
Extent Land Building Depreciation Land Building 2012 2011
A-R-P Sq. Ft. (Rs.) (Rs.) (Rs.) (Rs.) (Rs.) (Rs.) (Rs.)
1. No. 305/5, Rajagiriya Road, Nawala 0A-3R-19.14P – 236,500,000 – – 236,500,000 – 236,500,000 236,500,000
2. No. 246/56, Kandy Road, Eldeniya, Kadawatha 0A-0R-23.37P 1,640 11,000,000 – – 11,000,000 – 11,000,000 11,000,000
3. No. 156, Kolonnawa Road, Gothatuwa 1A-1R-33.71P 69,121 57,802,500 107,197,500 – 57,802,500 107,197,500 165,000,000 –
Total 305,302,500 107,197,500 – 305,302,500 107,197,500 412,500,000 247,500,000
company’S liSted debentuReS During the financial year, the Company issued debentures amounting to Rs. 1.25 Bn (4 years tenure of Rs. 610 Mn at 11.7%, Rs. 500 Mn at 12% and 5 years tenure of Rs. 140 Mn at 11.9%) which are listed in the Colombo Stock Exchange (CSE). The details related to them are as follows:
1. Interest rate of comparable Government Security - Buying and selling prices of Treasury Bonds at the auction held on 30 March 2012
Buying Price Buying yield (%) Selling Price Selling yield (%)
4 year bond 87.17 11.80 87.64 11.65
5 year bond 86.43 11.80 86.92 11.65
2. Debt/equity ratio 2.03
3. Interest cover ratio 2.74
4. Quick asset ratio 1.47
5. Market prices and yield during the year (ex interest)
Market Price Market yeild (%)
Highest price } Not traded during the financial year
610 Mn bond 11.70
Lowest price 500 Mn bond 12.00
Last traded price 140 Mn bond 11.90
6. Current ratings applicable to the entity - BBB+(lka) - Fitch, [SL]A - (Stable) - ICRA
infoRmation on the company’S Real eState poRtfolio and liSted debentuReS

218 LOLC 2011/12 REPORTS & ACCOUNTS
For the year ended 31 March 2003 2004 2005 2006 2007 2008 2009 2010 2011 2012(Rs. ‘000)
GroupOperating Results
Revenue – – – – – – 3,495,607 3,571,367 14,288,492 17,136,314
Cost of sales – – – – – – (2,993,076) (2,869,272) (9,911,222) (11,805,639)
Income 1,284,498 1,695,600 1,930,019 2,586,502 3,950,751 5,934,772 9,843,454 9,941,904 12,150,507 17,312,892
Other income/(expenses) 37,548 78,323 121,410 55,571 207,675 313,376 282,660 1,388,560 5,638,329 3,366,655
Interest costs (537,538) (552,770) (617,597) (895,570) (1,787,751) (3,403,965) (6,441,182) (6,178,137) (6,420,588) (8,469,890)
Profit before operating expenses 784,508 1,221,153 1,433,832 1,746,503 2,370,675 2,844,183 4,187,463 5,854,422 15,745,518 17,540,332
Other operating expenses (494,562) (814,162) (855,600) (1,037,153) (1,372,936) (1,880,700) (3,080,622) (4,386,721) (7,913,592) (10,397,475)
Results from operating activities 289,946 406,991 578,232 709,350 997,739 963,483 1,106,841 1,467,701 7,831,926 7,142,858
Negative goodwill – (4,550) (6,429) – – 131,293 – 1,423,837 271,911 2,914,536
Profit/(loss) on disposal of subsidiaries and associates – – – – – – – (167,088) – –
Share of profit of associate companies – – – – – 88,277 140,458 116,337 178,522 269,959
Profit before tax 289,946 402,441 571,803 709,350 997,739 1,183,053 1,247,299 2,840,787 8,282,359 10,327,353
Income tax expense (11,833) (11,832) 3,553 (20,762) 52,443 160,443 (192,122) (455,382) (1,259,279) (1,390,276)
Net profit after tax 278,113 390,609 575,356 688,588 1,050,182 1,343,496 1,055,177 2,385,405 7,023,080 8,937,077
As at 31 March
Assets
Net lending portfolio 4,668,719 5,853,064 7,173,915 11,123,245 16,103,706 21,434,958 32,697,993 35,084,686 58,416,332 80,245,412
Total assets 7,038,427 8,986,749 10,706,443 16,226,692 24,483,950 32,994,258 46,287,066 75,371,319 111,813,533 145,287,739
Liabilities
Total liabilities 5,272,820 7,063,271 8,342,029 13,295,525 20,659,031 27,816,389 40,195,588 55,631,672 77,090,381 102,223,229
Shareholders’ Funds
Share capital 237,600 475,200 475,200 475,200 475,200 475,200 475,200 475,200 475,200 475,200
Reserves 1,471,054 1,386,382 1,863,134 2,424,847 3,309,657 4,649,019 5,536,270 7,428,554 12,521,139 18,812,919
Minority interest 56,953 61,896 26,080 31,120 40,062 53,650 80,008 11,553,927 21,726,812 23,776,390
Shareholders’ funds 1,765,607 1,923,478 2,364,414 2,931,167 3,824,919 5,177,869 6,091,478 19,457,681 34,723,151 43,064,509
Investor Ratios
Return on assets (%) 4 5 6 5 5 5 3 4 8 7
Return on equity (%) 17 21 27 26 31 30 19 26 37 39
Other Information
No. of branches 9 12 12 16 18 22 26 48 73 80
No. of LIOC/mini branches – – – – – 10 14 13 22 25
No. of service centres – – – – – 11 36 72 87
No. of subsidiary companies 5 6 7 8 8 9 9 41 48 66
No. of associate companies – – – – – 2 2 7 7 9
No. of joint ventures – – – – – 1 1 15 18 18
ten yeaR SummaRy

LOLC 2011/12 REPORTS & ACCOUNTS 219
For the year ended 31 March 2003 2004 2005 2006 2007 2008 2009 2010 2011 2012(Rs. ‘000)
companyOperating Results
Gross income 1,130,880 1,401,776 1,566,952 1,908,291 3,034,110 4,960,979 6,626,308 4,722,479 3,511,733 3,030,395
Other income/(expenses) 32,679 97,806 145,294 93,449 291,840 261,254 71,445 1,022,138 2,832,627 5,679,440
Interest costs (492,557) (493,338) (532,298) (703,399) (1,442,881) (2,972,057) (4,205,474) (3,090,912) (2,384,015) (2,543,318)
Profit before operating expenses 671,002 1,006,244 1,179,948 1,298,341 1,883,069 2,250,176 2,492,279 2,653,705 3,960,346 6,166,517
Other operating expenses (415,469) (588,339) (617,719) (621,628) (972,865) (1,408,840) (1,910,159) (2,162,578) (2,062,356) (1,743,150)
Results from operating activities 255,533 417,905
562,229 676,713 910,204 841,336 582,120 491,127 1,897,989 4,423,367
Profit before tax 255,533 417,905 562,229 676,713 910,204 841,336 582,120 491,127 1,897,989 4,423,367
Income tax expense – – – (12,701) 76,390 217,901 (76,532) (164,187) (374,646) (122,401)
Net profit after tax 255,533 417,905 562,229 664,012 986,594 1,059,237 505,588 326,940 1,523,343 4,300,966
As at 31 March
Assets
Total assets 5,980,825 7,616,680 8,746,741 13,297,988 20,888,694 28,996,068 31,335,180 29,737,969 31,152,727 36,662,047
Liabilities
Total liabilities 4,302,665 5,772,331 6,438,611 10,447,735 17,194,407 24,233,931 26,233,467 24,309,315 23,704,083 24,912,437
Shareholders’ Funds
Share capital and reserves
Share capital 237,600 475,200 475,200 475,200 475,200 475,200 475,200 475,200 475,200 475,200
Reserves 1,440,560 1,369,149 1,832,930 2,375,053 3,219,087 4,286,937 4,626,513 4,953,454 6,973,444 11,274,410
Shareholders’ funds 1,678,160 1,844,349 2,308,130 2,850,253 3,694,287 4,762,137 5,101,713 5,428,654 7,448,644 11,749,610
Investor Ratios
Bonus issues – – – – – – – – – –
Gross dividends 77,220 92,664 110,009 142,560 71,280 106,920 133,056 – – –
Total assets to shareholders’ funds (times) 4 4 4 5 6 6 6 5 4 3
Return on assets (%) 4 6 7 6 6 4 2 1 5 12
Return on equity (%) 16 24 27 26 30 25 10 6 24 32
Other Information
No. of employees 201 259 269 346 414 521 664 787 848 948
TEN yEAR SUMMARy

220 LOLC 2011/12 REPORTS & ACCOUNTS
2011/12 2010/11
companyIncome Statements (Rs.’000)For the 3 months ended 30-June 30-September 31-December 31-March 30-June 30-September 31-December 31-March
Gross Income 578,697 648,946 532,095 1,270,657 965,505 842,464 805,030 898,734
Other income/(expenses) 1,816,869 1,243,815 387,257 2,231,498 711,751 635,358 321,124 1,164,394
Interest costs (450,990) (350,712) (429,848) (1,311,767) (505,958) (578,932) (632,349) (666,776)
Profit before operating expenses 1,944,576 1,542,049 489,504 2,190,388 1,171,298 898,890 493,805 1,396,352
Other operating expenses (521,438) (425,869) (372,000) (423,844) (545,791) (577,463) (431,882) (507,220)
Results from operating activities 1,423,138 1,116,180 117,504 1,766,544 625,507 321,427 61,923 889,132
Income tax expense (60,000) – (92,659) 30,258 (40,800) (40,800) (56,269) (236,777)
Net profit after tax 1,363,138 1,116,180 24,845 1,796,802 584,707 280,627 5,654 652,355
Balance Sheets (Rs.’000)As at 30-June 30-September 31-December 31-March 30-June 30-September 31-December 31-March
Assets 32,942,908 36,540,451 38,009,542 36,662,047 28,744,921 35,001,430 34,901,357 31,152,727
Liabilities 24,131,126 26,612,488 28,056,734 24,912,437 22,731,560 28,707,441 28,601,714 23,704,083
Net assets 8,811,782 9,927,963 9,952,808 11,749,610 6,013,361 6,293,989 6,299,643 7,448,644
Share capital and reserves 8,811,782 9,927,963 9,952,808 11,749,610 6,013,361 6,293,989 6,299,643 7,448,644
Share capital 475,200 475,200 475,200 475,200 475,200 475,200 475,200 475,200
Reserves 8,336,582 9,452,763 9,477,608 11,274,410 5,538,161 5,818,789 5,824,443 6,973,444
Group
Income Statements (Rs.’000)For the 3 months ended 30-June 30-September 31-December 31-March 30-June 30-September 31-December 31-March
Revenue 3,615,680 4,350,519 4,166,625 5,003,490 2,961,378 4,336,940 5,292,002 1,698,172
Cost of sales (2,821,385) (3,348,592) (2,820,054) (2,815,607) (2,256,469) (2,790,898) (3,486,344) (1,377,511)
Income 3,699,562 4,259,072 5,128,071 4,226,187 2,849,441 2,873,526 3,034,545 3,185,788
Other income/(expenses) 1,798,646 446,735 (274,972) 1,396,246 95,049 2,681,963 1,444,327 1,624,197
Interest costs (1,807,944) (1,915,591) (2,435,548) (2,310,809) (1,276,163) (1,812,108) (1,807,290) (1,525,027)
Profit before operating expenses 4,484,559 3,792,143 3,764,122 5,499,508 2,373,236 5,289,423 4,477,240 3,605,619
Other operating expenses (2,421,068) (2,077,706) (2,200,905) (3,697,795) (1,279,525) (1,893,936) (1,903,687) (2,836,443)
Results from operating activities 2,063,491 1,714,437 1,563,217 1,801,713 1,093,711 3,395,487 2,573,553 769,176
Negative goodwill – 2,821,334 93,201 – – – – 271,910
Share of profit of associate companies 46,854 136,840 121,408 (35,143) 57,276 (17,340) 31,461 107,125
Profit before tax 2,110,345 4,672,611 1,777,826 1,766,570 1,150,987 3,378,147 2,605,014 1,148,211
Income tax expense (307,162) (446,517) (642,385) 5,788 (295,211) (379,164) (442,166) (142,738)
Net profit after tax 1,803,183 4,226,094 1,135,441 1,772,358 855,776 2,998,983 2,162,848 1,005,473
Balance Sheets (Rs.’000)As at 30-June 30-September 31-December 31-March 30-June 30-September 31-December 31-March
Assets 123,773,551 137,063,264 147,738,333 145,287,739 81,534,628 98,418,312 107,951,923 111,813,532
Liabilities 86,375,820 95,076,946 104,490,883 102,223,229 59,816,837 73,313,020 80,706,001 77,090,381
Net assets 37,397,731 41,986,318 43,247,450 43,064,509 21,717,791 25,105,292 27,245,922 34,723,151
Share capital, reserves and minority interest 37,397,731 41,986,318 43,247,450 43,064,509 21,717,791 25,105,292 27,245,922 34,723,151
Share capital 475,200 475,200 475,200 475,200 475,200 475,200 475,200 475,200
Reserves 14,304,875 16,258,967 17,172,678 18,812,919 8,174,413 10,103,889 10,838,695 12,521,139
Minority interest 22,617,656 25,252,151 25,599,572 23,776,390 13,068,178 14,526,203 15,932,027 21,726,812
SummaRiSed QuaRteRly StatiSticS

LOLC 2011/12 REPORTS & ACCOUNTS 221
2011/12 2010/11
(Rs.) (%) (Rs.) (%)
Group
Value Added
Income 22,643,567,895 16,527,776,878
Other income 3,366,654,960 5,638,328,685
Cost of borrowings and services (14,494,645,412) (11,784,804,106)
Provisions 609,059,502 546,455,858
Goodwill on consolidation 2,914,536,420 271,910,632
Share of profits of associate companies 269,958,673 178,522,137
Value added tax 1,153,663,591 755,680,247
16,462,795,629 12,133,870,331
Distribution of Value Added
To Employees 3,312,149,808 20 1,985,476,257 16
Remuneration and other benefits 3,312,149,808 1,985,476,257
To Government 2,543,939,406 15 2,014,959,415 17
Indirect taxes 1,153,663,591 755,680,247
Direct taxes 1,390,275,815 1,259,279,168
To Providers of Capital 3,271,122,818 20 3,568,205,851 30
Dividends to shareholders – –
Minority interest 2,677,212,598 3,182,852,004
Reserves 593,910,220 385,353,847
To Expansion and Growth 7,335,583,597 45 4,565,228,008 37
Retained profits 5,665,954,281 3,454,874,061
Depreciation and amortisation 1,669,629,316 1,110,354,747
16,462,795,629 100 12,133,870,331 100
Value addition

222 LOLC 2011/12 REPORTS & ACCOUNTS
2011/12 2010/11
(Rs.) (%) (Rs.) (%)
company
Value Added
Income 3,030,395,171 3,511,733,478
Other income 5,679,439,845 2,832,627,486
Cost of borrowings and services (3,438,695,867) (3,520,578,315)
Provisions 22,839,520 100,485,684
Value added tax 342,495,984 433,689,641
5,636,474,653 3,357,957,974
Distribution of Value Added
To Employees 267,636,548 5 341,104,639 10
Remuneration and other benefits 267,636,548 341,104,639
To Government 464,897,114 8 808,335,813 24
Indirect taxes 342,495,984 433,689,641
Direct taxes 122,401,130 374,646,172
To Providers of Capital – 48,326,643 2
Dividends to shareholders – –
Reserves – 48,326,643
To Expansion and Growth 4,903,940,991 87 2,160,190,879 64
Retained profits 4,300,966,318 1,475,016,645
Depreciation and amortisation 602,974,673 685,174,234
5,636,474,653 100 3,357,957,974 100
VALUE ADDITION

LOLC 2011/12 REPORTS & ACCOUNTS 223
awaRdS
n LOLC was awarded the Most Outstanding Financial Performer 2010/11 in the global ORIx network, by the ORIx Corporation of Japan.
n LOLC won a global Achievement Award from the Open Compliance and Ethics Group (OCEG), USA for good governance, risk management and compliance practices. LOLC is the first Asian business entity to receive this award.
n LOLC Annual Report 2010/11 won Gold at the ARC Awards 2011 and won the Grand Prize in its category.
n LOLC Annual Report 2010/11 won Gold at the League of American Communications Professionals (LACP) Vision Awards 2010 in the ‘Conglomerates and Holding Companies’ category.
n LOLC Annual Report 2010/11 wins the ADFIAP Awards 2012 for ‘Best Annual Report’ in the Special Awards category.
n 2010 Annual Report of Al-Falaah - the Islamic Business Unit of LOFC, won Bronze at the League of American Communications Professionals (LACP) Vision Awards 2011.
n LOLC becomes the Overall Silver Winner; Winner for Best ‘Capacity Builder’; First Runner-up for ‘Extra Large Sector’ and Runners-up for ‘Diversified Group of Companies’ and ‘Excellence in Business and Financial Performance’ at the National Business Excellence Awards 2010/11.
n Eden Resort & Spa of LOLC Leisure Ltd. was awarded Runners-up in the ‘Hospitality’ category at the National Business Excellence Awards 2010/11.
n Eden Resort & Spa won an overall 36 medals at the 14th Culinary Art 2011 organised by the Chefs Guild of Sri Lanka and was also placed 7th in the overall ranking amongst 211 hotels and other catering establishments in Sri Lanka.
n LOLC was awarded one of Business Today’s Top 20 Corporates of Sri Lanka 2011.
n LOLC was placed among the Top 20 Most Respected Entities in Sri Lanka 2010/11.

224 LOLC 2011/12 REPORTS & ACCOUNTS
mileStoneS
1992
n Launched its first subsidiary, LOFAC
1995
n First branch office opened in Kandy
n Negotiated the first long-term Rupee loan from FMO
1996
n The first to extend Dollar denominated leases to BOI companies
1997
n The first to introduce export factoring through LOFAC
n Branch office opened in Matara
1998
Branch offices opened in Badulla and Ratnapura
1999
nLOFAC enters into strategic alliance with Dunn and Bradstreet
nBranch office opened in Anuradhapura
nLaunched its insurance subsidiary, LOIB
2000
n Negotiated the second tranche of long-term Rupee loan from FMO
n Branch office opened in Kochchikade
2001
n Launched its finance subsidiary, LOFC
n Branch offices opened in Kurunegala and Kalutara
2002
n The first leasing company to be recognised as a Participating Financial Institution for the Indian Line of Credit
n Branch office opened in Galle
2003
n Received the first US Dollar long-term loan from OPEC Fund
n The first to win the Leasing Category ‘Award for Excellence in Annual Reports and Accounts’ conducted by The Institute of Chartered Accountants of Sri Lanka
n Negotiated the third tranche of long-term Rupee loan from FMO
n Branch offices opened in Nuwara Eliya and Kiribathgoda
2004
n Entered into stock broking through LOSEC
n Launched LOITS, the Information Technology arm
n The first to win the ‘Non-Banking Sector Award’ at the South Asian Federation of Accountants (SAFA) for Best Presented Accounts Competition
n Branch office opened in Gampaha
2005
n The first Leasing Company to be ranked among the Top 10 Brands by Sting Consultants Brand Power Index
n Launched LOPD, the project development subsidiary
n LOLC cricket team emerged Mercantile ‘C’ Division Champions
n Negotiated the second tranche of long-term US Dollar Loan from OPEC Fund
n Negotiated the fourth tranche of long-term Rupee loan from FMO
n Negotiated the long-term US Dollar Loan from Praparco
n Branch offices opened in Kegalle, Embilipitiya and Polonnaruwa
2006
n Negotiated the long-term US Dollar Loan from DEG
n Negotiated the long-term US Dollar Loan from OPEC Fund
n Branch office opened in Wattala
n The first Regional Expansion to Cambodia through 18% holding of PRASAC
n First to introduce a branded product ‘Guardian’ range from an insurance broker, through LOIB
n Won the Leasing Category ‘Award for Excellence in Annual Reports and Accounts’ conducted by The Institute of Chartered Accountants of Sri Lanka for 2005/06
2007
n Branch offices opened in Chilaw and Mahiyangana
n Ranked among the Top 50 Brands by Super Brands
n Launched the New Strategic Plan for the Company and its Subsidiaries
n Opened the first Hospital Savings Centre in Oasis
n Opened the first Student Savings Centre at Royal College - Polonnaruwa
n LOFC operations expanded to Wattala, Kegalle, Mahiyangana, Mount Lavinia and Chilaw
n LOPD received Cabinet subcommittee approval for the project on Off-Shore Sand Mining, Washing, Sieving and Grading to supply construction and related industries
n Signed up with LIOC to establish LOLC sub-branches at LIOC filling stations
n LIOC Centres opened in Morawaka and Trincomalee

LOLC 2011/12 REPORTS & ACCOUNTS 225
n Set up the Islamic BU with an in-house Shari’ah Supervisory Board
n Dairy farmer loans, cultivation loans, business set up loans and skills enable loans were introduced
n Partnered with GTZ for capacity building of the microfinance staff, setting-up low cost branch network and development of a micro banking system
2008
n Launched a lottery for customers with a house as the prize
n Launched Western Union Money Transfer services at LOLC branches
n Entered into a joint venture agreement with Agri Tec for manufacture of precipitated silica and allied products using rice husk ash
n LIOC Centres opened in Pilimathalawa, Seeduwa, Aluthgama, Kadawatha, Ambalangoda, Debarawewa, Beliatta and Talawakelle
n Won Bronze Award at Effie Awards 2008, in the Financial Services/Products Category
n Spin-off of Microfinance Business Unit as LOLC Micro Credit Ltd. (LOMC) together with FMO
n LOLC Micro Credit Ltd. was appointed as the only representative from the private sector to the Microfinance Steering Committee appointed by the Department of Development Finance attached to Ministry of Finance and Planning
n Won the International Assets and Liability Management competition held by FMO and DEG
n Joined with Sri Lanka Post to open up Isuru Diriya Centres at Post Offices and Sub-Post Offices
2009
n Opened 40 Service Centres in Post Offices around the country consequent to the agreement with Sri Lanka Post, to offer products of LOLC Micro Credit Ltd. to the rural community
n Opened branches in Jaffna, Ampara, Batticaloa, Vavuniya and Trincomalee, thereby making our services available to the Northern and Eastern Regions of the country
n Opened the first dedicated Shari’ah finance branches in Kathankudi, Oddamavadi and Kalmunai.
n Selected as the Winner of the Specialised Banking and Finance Category at the National Business Excellence Awards
n Received BOI status for Lanka ORIx Information Technology Services Ltd. (LOITS - the IT arm)
n IT arm, Lanka ORIx Information Technology Services Ltd. earns ‘ISO/IEC 27001:2005’ certification for its enterprise data and software development functions
n Ranked amongst the Top 20 Brands in Sri Lanka by Brand Finance Lanka
n Won Best Annual Report Award and a Merit Award for Best Website from ADFIAP (Association of Development Finance Institutions in Asia and the Pacific)
n Won the Silver Award at the Sri Lankan HR Awards 2010 organised by the Association of HR Professionals Sri Lanka together with the Hewitt Associates, India
n LOLC Micro Credit Ltd. (LOMC) received a total of $ 14 Mn from Symbiotics and Three Triodos Funds to expand Microfinance Operations in Sri Lanka
n Lanka ORIx Finance Company Ltd. started to transact in international financial markets via SWIFT
n Received a US$ 5.0 Mn guarantee facility from USAID
n Invested in United Dendro Energy (Pvt) Ltd. through LOLC Eco Solutions Ltd.
2010
n Opened 29 Service Centres in Post Offices around the country
n Opened branches in Avissawella, Pettah, Moneragala, Trincomalee, Matugama, Homagama, Nawalapitiya, Kohuwala, Hatton, Ambalangoda and Elpitiya
n Acquisition of Confifi Hotel Holdings PLC, Riverina Hotels PLC and Tropical Villas (Pvt) Ltd.
n National Business Excellence Awards 2010 - conducted by the National Chamber of Commerce, Sri Lanka - Gold Award for ‘Diversified Group of Companies Sector’, Silver Award for Best ‘Capacity Builder’ and Bronze Award for ‘Extra Large Sector’. LOLC Leisure Ltd. was awarded Silver for ‘Hospitality’ for Eden Resorts & Spa.
n IT arm - Lanka ORIx Information Technology Services Ltd. (LOITS) earns re-certification for its conformance with the ISO/IEC 27001:2005, covering ‘The Management of Information Security for Providing IT Services at Enterprise Data Centre’
n LOITS was the only winner in the Category of Programme and Application Security at the ISACA Security Awards last year
n Investments made in Sierra Holdings, Sierra Constructions and Agstar Fertilizers
n Received a long-term loan from Symbiotics
MILESTONES

226 LOLC 2011/12 REPORTS & ACCOUNTS
n Received a long-term loan from Triple Jump
n Received a long-term loan from Minlam
n Received a long-term loan from Praparco
n Received a long-term loan from Triodos
n Most Outstanding Financial Performer 2010/11 in the Global ORIx Network
n Top 20 Most Valuable Stocks in the Colombo Bourse
2011
n Excellent Performance in the Overseas Operations Category for Fy 2012 in the Global ORIx Network
n LOLC won the Achievement Award for Governance, Risk Management and Compliance (GRC) for 2012 from the Open Compliance and Ethics Group (OCEG), USA
n First Money Exchange Outlet opened in Matara
n Launch of eZ pay services
n LOLC Micro Credit (LOMC) became the largest agriculture implement financier in Sri Lanka with an excess of over 100,000 customer base
n Commencement of operations of LOLC Insurance Co. Ltd.
n Formation of LOLC Securities Ltd.
n Formation of LOLC Motors and authorised distributors for FIAT in Sri Lanka
n The LOLC team won the Mercantile Basketball Championship in their respective division
n The LOLC Badminton team were placed second at the Mercantile Badminton Team Championships for 2011.
n LOLC obtained the consent of the Central Bank of Sri Lanka (CBSL) to relinquish its leasing license from April 2011 and LOLC consolidated its position as a Holding Company
n LOFC obtained CBSL approval to list on the CSE and was renamed as Lanka ORIx Finance PLC
n LOLC Leisure acquires 100% ownership of Dickwella Resort & Spa
n LOFC became one of the largest deposit base holders in the Registered Finance Company sector
n LOLC was awarded the Most Outstanding Financial Performer 2010/11 in the global ORIx network, by the ORIx Corporation of Japan
n LOLC Annual Report 2010/11 won Gold at the ARC Awards 2011 and won the Grand Prize in its category
n LOLC Annual Report 2010/11 won Gold at the League of American Communications Professionals (LACP) Vision Awards 2010 in the ‘Conglomerates and Holding Companies’ category
n LOLC Annual Report 2010/11 wins the ADFIAP Awards 2012 for ‘Best Annual Report’ in the Special Awards category
n 2010 Annual Report of Al-Falaah - the Islamic Business Unit of LOFC, won Bronze at the League of American Communications Professionals (LACP) Vision Awards 2011
n LOLC becomes the Overall Silver Winner; Winner for Best ‘Capacity Builder’; First Runner-up for ‘Extra Large Sector’ and Runners-up for ‘Diversified Group of Companies’ and ‘Excellence in Business & Financial Performance’ at the National Business Excellence Awards 2010/11
n Eden Resort & Spa of LOLC Leisure Ltd. was awarded Runners-up in the ‘Hospitality’ category at the National Business Excellence Awards 2010/11
n Eden Resort & Spa won an overall 36 medals at the 14th Culinary Art 2011 organised by the Chefs Guild of Sri Lanka and was also placed 7th in the overall ranking amongst 211 hotels and other catering establishments in Sri Lanka
n Eden Resort & Spa received the ISO 9001:2008+HACCP certificate for an additional period of 3 years, effective from January 2012
n LOLC was ranked among Business Today’s Top 20 Corporates of Sri Lanka 2011
n LOLC’s Brand was listed among the Most Valuable Brands of 2011 by Brand Finance Lanka
n LOLC was ranked among LMD’s Top 50 Listed Companies of Sri Lanka
n LOLC became the Top 20 Most Valuable Stocks/Companies in the Colombo Bourse 2011
n LOLC was placed among the Top 20 Most Respected Entities in Sri Lanka 2010/11
n During the Fy, a total of 36 service points were opened across the island.
MILESTONES

LOLC 2011/12 REPORTS & ACCOUNTS 227
GRoup companieS/diRectoRS
Agrisil Holdings Ltd.
Mrs. R.L. Nanayakkara
Mr. I.C. Nanayakkara
Mr. N.K.S.M.C. Mendis
Mr. G.R. Wellen
Mr. W. Verbrugghe
Associated Battery Manufacturers Ceylon Ltd.
Mr. A.L. Devasurendra
Mr. N.M. Prakash
Mr. S.V. Somasundaram
Mr. P. K. Kataky
Mr. W. Wong
Mr. A.K. Mukherjee
Mr. K. Ganeshan
Mr. S. Amab
Agsta Fertilizers
Mr. N.G.R. Karunaratne
Mr. D.N.N. Lokuge
Mr. W.A.P. Perera
Mr. A.P. Weerasekera
Mr. I.C. Nanayakkara
Mr. D.S.K. Amarasekera
Mr. P.R. Saldin
Mr. H.P.J. De Silva
Mr. A.G. Weerasinghe
Ajax Engineers (Pvt) Ltd.
Mr. S. Karunaratne
Mr. J. Sheriff
Mr. A.P. Weerasekera
Mr. D.S.K. Amarasekera
Mr. R.P. Sugathadasa
Mr. P.R. Saldin
Mr. N.M. Prakash
B G Air Services (Pvt) Ltd.
Mrs. R.L. Nanayakkara
Mr. N.M. Prakash
Mr. S.V. Somasunderam
Mrs. R.N.A. Nanayakkara (Mr. I.C. Nanayakkara is Alternate Director to Mrs. N. Nanayakkara)
Mr. P. Weerasinghe
Brown & Company PLC
Mrs. R.L. Nanayakkara
Mr. A.L. Devasurendra
Mr. N.M. Prakash
Mr. S.V. Somasunderam
Mr. I.C. Nanayakkara
Mr. H.P.J. De Silva
Browns Thermal Engineering (Pvt) Ltd.
Mrs. R.L. Nanayakkara
Mr. S.V. Somasunderam
Mr. N.M. Prakash
Mr. D. Fernando
Mr. A.K.D. Munidasa
Mr. W.M.N.C. Fernando
Browns Group Industries (Pvt) Ltd.
Mrs. R.L. Nanayakkara
Mr. N.M. Prakash
Mr. S.V. Somasunderam
Mrs. R.N.A. Nanayakkara (Mr. I.C. Nanayakkara is Alternate Director to Mrs. N. Nanayakkara)
Mr. W.M.N.C. Fernando
Browns Group Motels Ltd.
Mrs. R.L. Nanayakkara
Mr. N.M. Prakash
Mr. S.V. Somasunderam
Mrs. R.N.A. Nanayakkara (Mr. I.C. Nanayakkara is Alternate Director to Mrs. N. Nanayakkara)
Browns Healthcare (Pvt) Ltd.
Mrs. R.L. Nanayakkara
Mr. N.M. Prakash
Mr. K.S. Narangoda
Mr. S.V. Somasunderam
Browns Investments PLC
Mrs. R.L. Nanayakkara
Mr. N.M. Prakash
Mr. R.P. Sugathadasa
Mr. P.R. Saldin
Mr. D.S.K. Amarasekera
Mr. N. Fernando
Mr. S. Furkhan
Mr. A.G. Weerasinghe
Browns Motors (Pvt) Ltd.
Mrs. R.L. Nanayakkara
Mrs. I. Nanayakkara
Mrs. R.N.A. Nanayakkara (Mr. I.C. Nanayakkara is Alternate Director to Mrs. N. Nanayakkara)
Browns Tours (Pvt) Ltd.
Mrs. R.L. Nanayakkara
Mr. N.M. Prakash
Mr. S.V. Somasunderam
Mr. R.B. Seneviratne
Mrs. R.N.A. Nanayakkara (Mr. I.C. Nanayakkara is Alternate Director to Mrs. N. Nanayakkara)
Mr. P. Weerasinghe
Central Services (Pvt) Ltd.
Mr. K.A.K.P. Gunawardena
Mr. D.S.K. Amarasekera
Mrs. J. Lord
C F T Engineering Ltd.
Mrs. R.L. Nanayakkara
Mr. N.M. Prakash
Mr. S.V. Somasunderam
Mrs. R.N.A. Nanayakkara (Mr. I.C. Nanayakkara is Alternate Director to Mrs. N. Nanayakkara)
Commercial Factors Ltd.
Mr. K.A.K.P. Gunawardena
Mr. D.M.D.K. Thilakaratne
Commercial Insurance Brokers Ltd. (CIB)
Mr. B.R.L. Fernando
Mr. M.P. Jayawardena
Mr. D.M.D.K. Thilakaratne
Mr. R.A.M. Seneviratne
Mr. W.M.R.S. Dias
Commercial Leasing & Finance Ltd. (CLC)
Mrs. R.L. Nanayakkara (Resigned on 31.12.2011)
Mr. I.C. Nanayakkara
Mr. W.D.K. Jayawardena
Mrs. K.U. Amarasinghe
Dr. H. Cabral
Mr. D.M.D.K. Thilakaratne
Mr. P.D.J. Fernando
Diriya Investments (Pvt) Ltd.
Mr. I.C. Nanayakkara
Mr. A.L. Devasurendra
Dickwella Resorts (Pvt) Ltd.
Mr. W.D.K. Jayawardena
Mrs. K.U. Amarasinghe
Browns Industrial Park Ltd.
Mrs. R.L. Nanayakkara
Mr. N.M. Prakash
Mr. S.V. Somasunderam
Mr. W.M.N.C. Fernando
Eden Hotel Lanka PLC
Mr. W.D.K. Jayawardena
Mrs. K.U. Amarasinghe
Mr. D.S.K. Amarasekera
Mr. J.M. Swaminathan
Prof. M.T. A. Furkhan
Mr. S. Furkhan
Mr. R.N. Asirwatham (Resigned on 29.05.2012)
Engineering Services (Pvt) Ltd.
Mrs. R.L. Nanayakkara
Mr. N.M. Prakash
Mr. S.V. Somasunderam
Mrs. R.N.A. Nanayakkara (Mr. I.C. Nanayakkara is Alternate Director to Mrs. N. Nanayakkara
Mr. R.T. Devasurendra (Mr. A.L. Devasurendra is Alternate Director to Mr. R.T. Devasurendra)
Excel Global Holdings (Pvt) Ltd.
Mr. N.M. Prakash
Mr. D.S.K. Amarasekera
Mr. P.R. Saldin
Mr. C. Francis
Excel Restaurants (Pvt) Ltd.
Mr. T. Selliah
Mr. K. Shenoy

228 LOLC 2011/12 REPORTS & ACCOUNTS
Fernwood Lanka (Pvt) Ltd.
Mr. J. Peiris
Mr. K.C. Wijesuriya
Mr. N.M. Prakash
Mr. A. Sugathadasa
Mr. P.R. Saldin
Fernwood Corporate Services Ltd.
Dr. L.J.A. Peiris
Mrs. F.J. Peiris
Free Lanka Capital Holdings PLC
Mr. K. Aloysius
Mr. G.A. Aloysius
Mr. J.M.S. De Mel
Mr. I.C. Nananyakkara
Mr. N.M. Prakash
Mr. P.R. Saldin
Mr. G.J. Aloysius
Mr. D.C. Wimalasena
Mr. A.I. Fernando
Mr. D.S.K. Amarasekera
Free Lanka Capital (Pvt) Ltd.
Mr. K. Aloysius
Mr. G.A. Aloysius
Mr. J.M.S. De Mel
Mr. R.P. Sugathadasa
Mr. P.R. Saldin
Mr. N.M. Prakash
Mr. D.S.K. Amarasekera
Mr. G.J. Aloysius
Free Lanka Capital Properties (Pvt) Ltd.
Mr. G.A. Aloysius
Mr. J.M.S. De Mel
Mr. D.S.K. Amarasekera
Mr. N.M. Prakash
Mr. P.R. Saldin
Free Lanka Management Company (Pvt) Ltd.
Mr. K. Aloysius
Mr. J.M.S. De Mel
Mr. D.S.K. Amarasekera
Mr. C.J. Chaytor
Mr. H. Ramasamy (Alternate Director to Mr. A.J. Chaytor)
Mr. G.A. Aloysius
Mr. G.J. Aloysius
Mr. A.J. Chaytor
Mr. G.D. Seaton
Free Lanka Plantation Company
Mr. K. Aloysius
Mr. G.A. Aloysius
Mr. G.J. Aloysius
Mr. J.M.S. De Mel
Mr. D.S K. Amarasekera
Free Lanka Power 1 (Pvt) Ltd.
Mr. K. Aloysius
Mr. G.A. Aloysius
Mr. G.J. Aloysius
Mr. U.K. Devasurendra
Mr. J.M.S. De Mel
Mr. D.S.K. Amarasekera
Free Lanka Power 2 (Pvt) Ltd.
Mr. K. Aloysius
Mr. G.A. Aloysius
Mr. G.J. Aloysius
Mr. U.K. Devasurendra
Mr. J.M.S. De Mel
Mr. D.S.K. Amarasekera
Free Lanka Power 3 (Pvt) Ltd.
Mr. K. Aloysius
Mr. G.A. Aloysius
Mr. G.J. Aloysius
Mr. U.K. Devasurendra
Mr. J.M.S. De Mel
Mr. D.S.K. Amarasekera
Free Lanka Power Holdings (Pvt) Ltd.
Mr. K. Aloysius
Mr. G.A. Aloysius
Mr. G.J. Aloysius
Mr. J.M.S. De Mel
Mr. D.S.K. Amarasekera
Mr. U.K. Devasurendra
Free Lanka Estates Bungalows (Pvt) Ltd.
Mr. G.J. Aloysius
Mr. D.S.K. Amarasekera
Mr. P.R. Saldin
Mr. J.M.S. De Mel
Galoya Holdings (Pvt) Ltd.
Mr. N.M. Prakash
Mr. W.G.L. Dharmakeerthi
Mr. N.T.K.A. Adikarama
Mr. P.R. Saldin
Mr. R.M.G.K.B. Ratnayake
Mrs. M.A. Nandani
Galoya Plantations (Pvt) Ltd.
Mr. N.T.K.A. Adikarama
Mr. P.R. Saldin
Mr. W.G.L. Dharmakeerthi
Mrs. M.A. Nandani
Mr. S.G. Senarathna
Mr. G.K.A.K. Perera
Mr. G.W. Wijesinghe
Mr. R.A.S.K. De Alwis
Mr. T.P.G.N. De Alwis
Hydro Power Free Lanka (Pvt) Ltd.
Mr. K. Aloysius
Mr. G.J. Aloysius
Mr. G.A. Aloysius
Mr. J.M.S. De Mel
Mr. D.S.K. Amarasekera
Mr. U.K. Devasurendra
Mrs. R.L. Nanayakkara
Mr. N.M. Prakash
Mr. A.U. Weerasinha
Mr. R.M.S. Fernando
Mr. T. Senthilveri
Hydro Power Free Lanka 2 (Pvt) Ltd.
Mr. K. Aloysius
Mr. G.A. Aloysius
Mr. U.K. Devasurendra
Mr. G.J. Alosius
Mr. J.M.S. De Mel
Mr. D.S.K. Amarasekera
Hydro Power Free Lanka 3 (Pvt) Ltd.
Mr. K. Aloysius
Mr. G.A. Aloysius
Mr. G.J. Aloysius
Mr. U.K. Devasurendra
Mr. J.M.S. De Mel
Mr. D.S.K. Amarasekera
I G Browns Rubber Industries (Pvt) Ltd.
Mrs. R.L. Nanayakkara
Mr. N.M. Prakash
Klevenberg (Pvt) Ltd.
Mr. M. Balasubramaniam
Mr. P. Balasubramaniam
Mr. N.M. Prakash
Mr. S.V. Somasunderam
Mrs. R.N.A. Nanayakkara (Mr. I.C. Nanayakkara is Alternate Director to Mrs. N. Nanayakkara)
Mr. R.T. Devasurendra (Mr. A.L. Devasurendra is Alternate Director to Mr. R.T. Devasurendra)
Mr. C. Ediriwickrema
Lanka ORIX Finance PLC
Mrs. R.L. Nanayakkara (Resigned on 31.12.2011)
Mr. I.C. Nanayakkara
Mr. W.D.K. Jayawardena
Mrs. K.U. Amarasinghe
Mr. R.N. Asirwatham (Resigned on 30.06.2012)
Mr. B.C.G. De Zylva
Dr .H. Cabral
Mrs. D.P. Pieris
GROUP COMPANIES/DIRECTORS

LOLC 2011/12 REPORTS & ACCOUNTS 229
Lanka ORIX Information Technology Services Ltd.
Mr. F.K.C.P.N. Dias
Mr. K.A.K.P. Gunawardena
Lanka ORIX Project Development Ltd.
Mrs. R.L. Nanayakkara
Mrs. K.U. Amarasinghe
Mr. K.A.K.P. Gunawardena
Lanka Decals (Pvt) Ltd.
Mr. J. Peiris
Mr. N.M. Prakash
Mr. P.R. Prakash
Mr. P.R. Saldin
Mrs. A. Sugathadasa
LOLC Leisure Ltd.
Mr. W.D.K. Jayawardena
Mrs. K.U. Amarasinghe
LOLC Life Insurance Ltd.
Mr. W.D.K. Jayawardena
Mrs. K.U. Amarasinghe
LOLC General Insurance Ltd.
Mr. W.D.K. Jayawardena
Mrs. K.U. Amarasinghe
LOLC Property Investments Ltd.
Mr. K.A.K.P. Gunawardena
Mrs. J. Lord
LOLC Realty Ltd.
Mr. K.A.K.P. Gunawardena
Mrs. J. Lord
LOLC Asset Holdings Ltd.
Mr. K.A.K.P. Gunawardena
Mrs. J. Lord
LOLC Eco Solutions Ltd.
Mr. K.A.K.P. Gunawardena
Mr. P.D.G. Jayasena
LOLC Estates Ltd.
Mr. K.A.K.P. Gunawardena
Mrs. J. Lord
LOLC Factors Ltd.
Mr. K.A.K.P. Gunawardena
Mr. J.B.W. Kelegama
Mr. F.G.A. Lawrence
LOLC Insurance Company Ltd.
Mr. W.D.K. Jayawardena
Mrs. K.U. Amarasinghe
Mr. J.M. Swaminathan
LOLC Investments Ltd.
Mr. K.A.K.P. Gunawardena
Mr. J.B.W. Kelegama
Mr. P.D.G. Jayasena
LOLC Land Holdings Ltd.
Mr. K.A.K.P. Gunawardena
Mrs. J. Lord
LOLC Micro Credit Ltd.
Mrs. R.L. Nanayakkara
Mr. I.C. Nanayakkara
Mr. W.D.K. Jayawardena
Mrs. K.U. Amarasinghe
Mr. R.D. Tissera
Drs. P. Kooi
LOLC Micro Finance Fund Ltd.
Mr. K.A.K.P. Gunawardena
Mr. R.D. Tissera
LOLC Motors Ltd.
Mr. W.D.K. Jayawardena
Mrs. K.U. Amarasinghe
Mr. K.A.K.P. Gunawardena
LOLC Securities Ltd.
Mr. W.D.K. Jayawardena
Mrs. K.U. Amarasinghe
Mr. S. Gurusinghe
LOLC Services Ltd.
Mr. A.L. Dharmaprema
Mrs. J. Lord
LOLC Technologies Ltd.
Mr. F.K.C.P.N. Dias
Mr. K.A.K.P. Gunawardena
Mr. J.B.W. Kelegama
Masons Mixture Ltd.
Mrs. R.L. Nanayakkara
Mr. N.M. Prakash
Mr. S.V. Somasunderam
Mrs. R.N.A. Nanayakkara (Mr. I.C. Nanayakkara is Alternate Director to Mrs. N. Nanayakkara)
Mr. R.T. Devasurendra (Mr. A.L. Devasurendra is Alternate Director to Mr. R.T. Devasurendra)
Maturata Plantations Ltd.
Mr. K. Aloysius
Mr. G.A. Alosius
Mr. G.J. Aloysius
Mr. J.M.S. De Mel
Mr. D.S.K. Amarasekera
Mr. L.G.D. Premachandra
Melfort Green Tea
Mr. K. Aloysius
Mr. G.A. Alosius
Mr. H.D.A.D. Perera
Mr. L.T.D. Peiris
Mrs. R.V. Perera
Mr. J.M.S. De Mel
Mutugala Estates (Pvt) Ltd.
Mrs. R.L. Nanayakkara
Mr. R.T. Devasurendra (Mr. A.L. Devasurendra is Alternate Director to Mr. R.T. Devasurendra)
Mr. S.V. Somasunderam
Mrs. R.N.A. Nanayakkara (Mr. I.C. Nanayakkara is Alternate Director to Mrs. N. Nanayakkara)
Millennium Development (Pvt) Ltd.
Mr. F. Chokatte
Mr. N.M. Prakash
Mr. P.R. Saldin
Mr. D.S.K. Amarasekera
Orient Academy Ltd.
Mr. F.K.C.P.N. Dias
Mr. K.A.K.P. Gunawardena
Orient Global Technologies Ltd.
Mr. F.K.C.P.N. Dias
Mr. K.A.K.P. Gunawardena
Mr. J.B.W. Kelegama
Palm Garden Hotels PLC
Mr. W.D.K. Jayawardena
Mrs. K.U. Amarasinghe
Mr. D.S.K. Amarasekera
Mr. J.M. Swaminathan
Pathregalla Estates (Pvt) Ltd.
Mrs. R.L. Nanayakkara
Mr. S.V. Somasunderam
Mr. D.A.B. Dassanayake
Mrs. R.N.A. Nanayakkara (Mr. I.C. Nanayakkara is Alternate Director to Mrs. N. Nanayakkara)
Pussellawa Plantations Ltd.
Mr. J.M.S. De Mel
Mr. G.A. Aloysius
Mr. G.D. Seaton
Mr. G.J. Aloysius
Mr. K. Aloysius
Mr. M.P.D.U.K. Mapa Pathirana
PRASAC MFI
Mr. S.A.V. Harpe
Mr. R. Fernando
Mr. H. Halbertsma
Mr. I.C. Nanayakkara
Mr. O.S. Oeun
Mr. P. Touch
GROUP COMPANIES/DIRECTORS

230 LOLC 2011/12 REPORTS & ACCOUNTS
Riverina Hotels PLC
Mr. W.D.K. Jayawardena
Mrs. K.U. Amarasinghe
Mr. D.S.K. Amarasekera
Mr. J.M. Swaminathan
Mr. R.N. Asirwatham (Resigned on 29.05.2012)
Royal Fernwood Porcelain Ltd.
Mr. J. Peiris
Mr. A.L. Devasurendra
Mr. N.M. Prakash
Mr. P.R. Saldin
Mrs. A. Sugathadasa
Samudra Beach Resorts (Pvt) Ltd.
Mrs. R.L. Nanayakkara
Mr. N.M. Prakash
Mr. D.S.K. Amarasekera
Mr. P.R. Saldin
Mr. R.P. Sugathadasa
Sierra Constructions (Pvt) Ltd.
Mr. F.A.W. Irugalbandara
Mr. D.N.N. Lokuge
Mr. W.A.P. Perera
Mr. E.A.D.T.B. Perera
Mr. J.H.P. Ratnayake
Mr. E.M.M. Boyagoda
Mr. I.C. Nanayakkara
Mr. A.L. Devasurendra
Ms. A.C.P. Irugalbandara (Alternate Director to Mr. F.A.W. Irugalbandara)
Ms. K.A. Suraweera (Alternate Director to Mr. E.A.D.T.B. Perera)
Sierra Holdings (Pvt) Ltd.
Mr. D.N.N. Lokuge
Mr. W.A.P. Perera
Mr. F.A.W. Irugalbandara
Mr. E.A.D.T.B. Perera
Mr. D.S.K. Amarasekera
Ms. K.A. Suraweera (Alternate Director to Mr. E.A.D.T.B. Perera)
Sifang Lanka (Pvt) Ltd.
Mrs. R.L. Nanayakkara
Mr. N.M. Prakash
Mr. S.V. Somasunderam
Mrs. R.N.A. Nanayakkara (Mr. I.C. Nanayakkara is Alternate Director to Mrs. N. Nanayakkara)
Mr. C. Ediriwickrema
Mr. Z. Haifeng
Mr. H. yilin
Sifang Lanka Trading (Pvt) Ltd.
Mrs. R.L. Nanayakkara
Mr. N.M. Prakash
Mr. S.V. Somasunderam
Mrs. R.N.A. Nanayakkara (Mr. I.C. Nanayakkara is Alternate Director to Mrs. N. Nanayakkara)
Mr. C. Ediriwickrema
Snowcem Products Lanka (Pvt) Ltd.
Mr. N.M. Prakash
Mr. S.V. Somasunderam
Mrs. R.N.A. Nanayakkara (Mr. I.C. Nanayakkara is Alternate Director to Mrs. N. Nanayakkara)
Mr. C. Ediriwickrema
Southern Cleaners (Pvt) Ltd.
Mr. K.A.K.P. Gunawardena
Mrs. J. Lord
Mr. D.S.K. Amarasekera
Standard Finance (Pvt) Ltd.
Mrs. R.L. Nanayakkara
Mr. N.M. Prakash
Mr. S.V. Somasunderam
Mrs. R.N.A. Nanayakkara (Mr. I.C. Nanayakkara is Alternate Director to Mrs. N. Nanayakkara)
Mr. R.T. Devasurendra (Mr. A.L. Devasurendra is Alternate Director to Mr. R.T. Devasurendra)
Sundaya Lanka (Pvt) Ltd.
Mr. M.R. Adema
Mr. R.D. Tissera
Mr. T.S.R. Visweswaran
Mr. K.A.K.P. Gunawardena
Mr. J.B.W. Kelegama
Speed Italia (Pvt) Ltd.
Mr. W.D.K. Jayawardena
Mrs. K.U. Amarasinghe
Mr. K.A.K.P. Gunawardena
Taprobane Capital (Pvt) Ltd.
Mr. N.M. Prakash
Mr. D.S.K. Amarasekera
Mr. P.R. Saldin
Taprobane Plantations Ltd.
Mr. D.A.B. Dassanayake
Mr. R.P. Sugathadasa
Mr. R.R. Anthony
Taprobane Fund Management Company Ltd.
Mr. A.L. Devasurendra
Mrs. R.L. Nanayakkara
Mr. S. Somasundaram
Tea Leaf Resort
Mr. W.A.P. Perera
Mr. G.A. Aloysius
Mr. D.S. Panditha
Mr. D.S.K. Amarasekera
Mr. J.M.S. De Mel
Mr. N.M. Prakash
Mr. G.J. Aloysius
The Hatton Transport and Agency Company (Pvt) Ltd.
Mrs. R.L. Nanayakkara
Mr. N.M. Prakash
Mr. S.V. Somasunderam
Mrs. R.N.A. Nanayakkara (Mr. I.C. Nanayakkara is Alternate Director to Mrs. N. Nanayakkara)
Tropical Villas (Pvt) Ltd.
Mr. W.D.K. Jayawardena
Mrs. K.U. Amarasinghe
Mr. D.S.K. Amarasekera
United Dendro Energy (Pvt) Ltd.
Mr. W.D.K. Jayawardena
Mrs. K.U. Amarasinghe
Mr. D.T. Karunanayake
Mr. H. Karunanayake
Mr. K.A.K.P. Gunawardena
Mr. P.D.G. Jayasena
Walker & Greig (Pvt) Ltd.
Mrs. R.L. Nanayakkara
Mr. N.M. Prakash
Mr. S.V. Somasunderam
Mrs. R.N.A. Nanayakkara (Mr. I.C. Nanayakkara is Alternate Director to Mrs. N. Nanayakkara)
GROUP COMPANIES/DIRECTORS

LOLC 2011/12 REPORTS & ACCOUNTS 231
ShaRe infoRmation
1. ShaReholdinG
1.1 Shareholding as at 31 March 2012
Range No. of Shareholders
No. ofShares
% ofShares
1 - 1,000 2,767 1,236,693 0.26
1,001 - 10,000 1,295 4,861,277 1.02
10,001 - 100,000 386 12,051,712 2.53
100,001 - 1,000,000 59 15,165,212 3.20
Over 1,000,000 Shares 15 441,885,106 92.99
4,522 475,200,000 100.00
Categories of Shareholders
Local Individuals 4,158 286,400,987 60.27
Local Institutions 301 45,230,566 9.52
Foreign Individuals 57 651,580 0.14
Foreign Institutions 6 142,916,867 30.07
4,522 475,200,000 100.00
1.2 Directors’ Shareholding as at 31 March 2012
(Rs.) (%)
Mr. R.A. Fernando 12,600 0.003
Mr. M.D.D. Pieris – –
Mr. I.C. Nanayakkara (also Alternate to Mr. R.M. Nanayakkara) 59,895,500 12.60
Mrs. K.U. Amarasinghe 52,432,000 11.03
Mrs. R.L. Nanayakkara – –
Mr. R.M. Nanayakkara 141,433,220 29.76
Mr. W.D.K. Jayawardena – –
Mr. H. Ichida – –
Mr. R.N. Asirwatham 5,000 0.00
Mr. M. Kawano – –
Mr. T. yamazaki (Alternate to Mr. M. Kawano and Mr. H. Ichida) – –
1.3 Highest, Lowest and Closing Share Prices as at 31 March 2012
As at 31.03.2012 As at 31.03.2011
(Rs.) (Rs.)
Highest during the year 128.00 1,600.00
Lowest during the year 49.00 114.00
As at end of the year 54.00 119.60

232 LOLC 2011/12 REPORTS & ACCOUNTS
Major Shareholders of the Company as at 31 March 2012
2012
No. of % of IssuedName of Shareholder Shares Capital
1. ORIx Corporation 142,560,000 30.00
2. Mr. R.M. Nanayakkara 141,433,220 29.76
3. Mr. I.C. Nanayakkara 59,895,500 12.60
4. Mrs. K.U. Amarasinghe 52,432,000 11.03
5. Employees’ Provident Fund 14,810,236 3.11
6. Sri Lanka Insurance Corporation Ltd. - Life Fund 10,762,560 2.26
7. Mrs. I. Nanayakkara 5,215,020 1.09
8. Employees’ Trust Fund Board 3,749,950 0.78
9. Mr. G.G. Ponnambalam 2,089,920 0.44
10. HSBC/Charitha Prasanna De Silva 2,000,000 0.42
11. HSBC/Romesh Charitha De Silva 1,800,000 0.37
12. Bank of Ceylon - No. 2 Account 1,546,000 0.32
13. Mr. M. Radhakrishnan 1,500,000 0.31
14. Bank of Ceylon - No. 1 Account 1,083,900 0.22
15. Swastika Mills Ltd. 1,006,800 0.21
16. DPMC Assetline Holdings (Pvt) Ltd. No. 1 Account 866,900 0.18
17. Mrs. S.N. Fernando 818,440 0.17
18. Ms. F.A.J.A. Cader 759,000 0.16
19. HSBC/Chandana Lal De Silva 722,000 0.15
20. Mr. S. Nadesan 660,000 0.13
445,711,446 93.79
Others 29,488,554 6.20
Total 475,200,000 100.00
public holdinG
The percentage of shares held by the public is 15.498%.
SHARE INFORMATION

LOLC 2011/12 REPORTS & ACCOUNTS 233
GloSSaRy
teRmS
a
Accrual Basis Recognising the effects of transactions and events when they occur, without waiting for receipt or payment of cash or cash equivalent.
AmortisationAmortisation is the systematic allocation of the depreciable amount of an intangible asset over its useful life.
AssociateAn associate is an entity, including an unincorporated entity such as a partnership, over which the investor has significant influence and that is neither a subsidiary nor a joint venture.
c
Cash Basis Recognising the effects of transactions and events when receipt or payment of cash or cash equivalent occurs.
Cash Equivalents Short-term highly liquid investments that are readily convertible to known amounts of cash and which are subject to an insignificant risk in change in value.
Consolidated Financial Statements Financial Statements of a Group presented as those of a single company.
Corporate Governance The process by which corporate entities are governed. It covers the way in which power is exercised over the management and direction of entity, the supervision of executive actions and accountability to owners and others.
d
DepreciationDepreciation is the allocation of the depreciable amount of an asset over its estimated useful life. Depreciation for the accounting period is charged to profit or loss for the period either directly or indirectly.
e
ExecutionsAdvances granted to customers under leasing, hire purchase, instalment sales and loan facilities.
Earned PremiumThe proportion of net written premium recognised for accounting purposes as income in a given period.
f
Fair ValueFair value is the amount for which an asset could be exchanged or a liability settled between knowledgeable, willing parties in an arm’s length transaction.
Finance LeaseA lease that transfers substantially all the risks and rewards incidental to ownership of the asset to the lessee. Title may or may not eventually be transferred.
G
GoodwillAny excess of the cost of the acquisition over the acquirer’s interest in the fair value of the identifiable assets and liabilities acquired as at the date of the exchange transaction and is recognised as an asset.
Gross DividendThe proportion of profit distributed to shareholders inclusive of tax withheld.
Gross PortfolioTotal rental instalment receivable of the advances granted to customers under leasing, hire purchase, instalment sales and loan facilities.
h
Hire PurchaseA hire purchase is a contract between hirer and financier where the hirer takes on hire a particular article from the financier, with the option to purchase the article at the conclusion of the agreed rental payments.
i
Insurance ProvisionsAmounts set aside on the basis of actuarial calculations to meet obligations to policyholders.
Intangible AssetAn intangible asset is an identifiable non-monetary asset without physical substance held for use in the production or supply of goods or services, for rental to others, or for administrative purposes.
Interest Cost The sum of monies accrued and payable to the sources of borrowed working capital.
Interest in Suspense Interest income of non-performing portfolio; these interests are accrued but not considered as part of income.
Investment PropertyInvestment property is property (land or a building - or part of a building - or both) held (by the owner or by the lessee under a finance lease) to earn rentals or for capital appreciation or both, rather than for use in the production or supply of goods or services or for administrative purposes; or sale in the ordinary course of business.
J
Joint VentureA joint venture is a contractual arrangement whereby two or more parties undertake an economic activity which is subject to joint control.
l
LeaseA lease is an agreement whereby the lessor conveys to the lessee in return for a payment or series of payments the right to use an asset for an agreed period of time.
m
Minority Interest Part of the net results of operations and of net assets of a subsidiary attributable to interests who are not owned, directly or indirectly through subsidiaries, by the Parent.
n
Negative Goodwill Any excess, as at the date of the exchange transaction, of the acquirer’s interest in the fair values of the identifiable assets and liabilities acquired over the cost of the acquisition and is treated as income in the period it arises.
Net PortfolioTotal rental instalment receivable excluding interest of the advances granted to customers under leasing, hire purchase, instalment sales and loan facilities.

234 LOLC 2011/12 REPORTS & ACCOUNTS
Non-Performing Portfolio Facilities granted to customers who are in default for more than six months.
o
Operating Lease An operating lease is a lease other than a finance lease.
p
Provision Amounts set aside against possible losses on net receivable of facilities granted to customers, as a result of them becoming partly or wholly uncollectible.
R
ReinsuranceAn arrangement whereby Insurers transferring portions of risk portfolios to other parties (Reinsurers) in order to reduce part or all of the liability assumed by the insurer under a policy or policies of insurance.
Related Parties Parties are considered to be related if one party has the ability to control the other party or exercise significant influence over the other party in making financial or operating decisions.
Related Party Transactions A transfer of resources or obligations between related parties, regardless of whether a price is charged.
Residual Value The estimated amount that is currently realisable from disposal of the asset, after deducting estimated costs of disposal, if the asset was already of the age and in the condition expected at the end of its useful life.
Revenue Reserve Reserves set aside for future distribution and reinvestment.
S
Segmental Analysis Analysis of information by segments of an enterprise, specifically the different industries and the different geographical areas in which it operates.
Shareholders’ Funds (Equity) Total of issued and fully-paid ordinary share capital and reserves.
Stated Capital All amounts received by the Company or due and payable to the Company - (a) in respect of the issue of shares, (b) in respect of calls on shares.
Subsidiary Company Subsidiary is a company that is controlled (power to govern the financial and operating policies of an enterprise so as to obtain benefits from its activities) by another company known as the Parent.
Substance Over FormThe consideration that the accounting treatment and the presentation in Financial Statements of transactions and the events should be governed by their substance and financial reality and not merely by legal form.
u
Unearned PremiumPremiums received by an insurer outside the current accounting period (unearned premium). Such premiums are not treated as income until they become earned during the period to which they relate.
v
Value Addition Value of wealth created by providing leasing and other related services considering the cost of providing such services.
RatioSMethod of computation and indicates
c
Cost to Income Ratio Operating expenses excluding provision for bad and doubtful debts as a percentage of total operating income, net of interest cost. Efficiency of cost management in generating income.
d
Debt to Equity (Gearing) Ratio Total debts divided by equity. The extent to which debt contributes to fund total assets, compared to the contribution from equity.
Dividend Cover Profit attributable to ordinary shareholders divided by gross dividends of ordinary shares. Number of times dividend is covered by current year’s distributable profits.
Dividend Per Share (DPS) Value of the dividend proposed and paid out to ordinary shareholders divided by the number of ordinary shares in issue. Share of current year’s dividend distributable to an ordinary share in issue.
e
Earnings Per Share (EPS) Profit attributable to ordinary shareholders divided by the weighted average number of ordinary shares outstanding during the year. Share of current year’s earnings attributable to an ordinary share in issue.
i
Interest Cover Earnings before interest and tax divided by interest charges. Ability to cover or service interest charges of the debtholders.
m
Market Capitalisation Number of ordinary shares in issue multiplied by market value of a share. Total market value of all ordinary shares in issue.
n
Net Asset Value Per Ordinary Share Ordinary shareholders’ funds divided by the number of ordinary shares in issue. Book value of an ordinary share.
Non-Performing Facilities Ratio Total gross non-performing portfolio divided by total gross portfolio. Percentage of total gross non-performing portfolio against the total gross portfolio.
p
Price Earning Ratio (PER Ratio) Market price of a share divided by Earnings Per Share (EPS). Number of years that would be taken to recoup shareholders’ capital outlay in the form of earnings.
R
Return On Assets (ROA) Net profits expressed as a percentage of average total assets. Overall effectiveness in generating profits with available assets; earning power of invested total capital.
Return On Equity (ROE) Net profit, less preference share dividends if any, expressed as a percentage of average ordinary shareholders’ funds. Earning power on shareholders’ book value of investment (equity).
GLOSSARy

LOLC 2011/12 REPORTS & ACCOUNTS 235
notice of meetinG
NOTICE IS HEREBy GIVEN THAT THE THIRTy THIRD ANNUAL GENERAL MEETING of the Company will be held on Tuesday, 18 September 2012 at 10.30 a.m. at the LOLC Auditorium, for the following purposes:
1. To receive and consider the Report of the Directors and Statement of Accounts for the year ended 31 March 2012 with the Report of the Auditors thereon.
2. To re-elect as a Director, Mr. R.A. Fernando who retires by rotation in terms of Article 88 (i) of the Articles of Association of the Company.
3. To re-elect as a Director Mr. M. Kawano who retires by rotation in terms of Article 95 of the Articles of Association of the Company.
4. To re-elect as a Director Mrs. R.L. Nanayakkara, who retires in terms of Sections 210/211 of the Companies Act No. 7 of 2007. Special Notice has been received from a shareholder of the intention to pass a resolution which is set out below in relation to her re-election (see Note 4).
5. To re-elect as a Director Mr. R.M. Nanayakkara, who retires in terms of Sections 210/211 of the Companies Act No. 7 of 2007. Special Notice has been received from a shareholder of the intention to pass a resolution which is set out below in relation to his re-election (see Note 5).
6. To re-elect as a Director Deshamanya M.D.D. Pieris, who retires in terms of Sections 210/211 of the Companies Act No. 7 of 2007. Special Notice has been received from a shareholder of the intention to pass a resolution which is set out below in relation to his re-election (see Note 6).
7. To reappoint as Auditors Messrs Ernst and young, Chartered Accountants at a remuneration to be fixed by the Directors.
8. To authorise the Directors to make donations.
By Order of the Board,
Chrishanthi EmmanuelSecretary
20 August 2012
Rajagiriya (Greater Colombo)
Notes:1. A member entitled to attend and vote at
the Meeting is entitled to appoint a Proxy to attend and vote instead of him/her. A Proxy need not be a member of the Company.
2. The completed Form of Proxy should be deposited at the Registered Office of the Company, No. 100/1, Sri Jayewardenepura Mawatha, Rajagiriya, not later than 10.30 a.m. on Sunday, 16 September 2012.
3. A Form of Proxy accompanies this Notice.
4. Special Notice was received by the Company from a shareholder of the Company giving Notice of intention to move the following Resolution at the above Annual General Meeting:
“Resolved that Mrs. R.L. Nanayakkara who is 76 years be and is hereby re-elected a Director of the Company and it is further specifically declared that the age limit of 70 years referred to in Section 210 of the Companies Act No. 7 of 2007 shall not apply to the said Director, Mrs. R.L. Nanayakkara.”
5. Special Notice was received by the Company from a shareholder of the Company giving Notice of intention to move the following Resolution at the above Annual General Meeting:
“Resolved that Mr. R.M. Nanayakkara who is 72 years be and is hereby re-elected a Director of the Company and it is further specifically declared that the age limit of 70 years referred to in Section 210 of the Companies Act No. 7 of 2007 shall not apply to the said Director, Mr. R.M. Nanayakkara.”
6. Special Notice was received by the Company from a shareholder of the Company giving Notice of intention to move the following Resolution at the above Annual General Meeting:
“Resolved that Deshamanya M.D.D. Pieris who will be 75 years be and is hereby re-elected a Director of the Company and it is further specifically declared that the age limit of 70 years referred to in Section 210 of the Companies Act No. 07 of 2007 shall not apply to the said Director, Deshamanya M.D.D. Pieris.”

236 LOLC 2011/12 REPORTS & ACCOUNTS
coRpoRate infoRmation
Name of the Company
Lanka ORIx Leasing Company PLC
Country of Incorporation
Sri Lanka
Date of Incorporation
14 March 1980
Legal Form
A quoted public company with limited
liability.
Company Registration No.
PQ 70
Stock Exchange Listing
The ordinary shares of the Company are
listed on the Colombo Stock Exchange of
Sri Lanka.
Registered Office
No. 100/1, Sri Jayewardenepura Mawatha,
Rajagiriya, Sri Lanka
Head Office
No. 100/1, Sri Jayewardenepura Mawatha,
Rajagiriya, Sri Lanka
Tel: 011-5880880
Fax: 011-2865606 (Gen.)
Website: www.lolc.com
Directors
Rohini Lettitia Nanayakkara - Non-Executive Chairperson
Ishara Chinthaka Nanayakkara - Executive Deputy Chairman(Also alternate to Mr. R.M. Nanayakkara)
Waduthantri Dharshan Kapila Jayawardena - Group Managing Director/CEO
Kalsha Upeka Amarasinghe - Executive Director
Deshamanya Minuwanpitiyage Dharmasiri Dayananda Pieris - Independent Director
Ravindra Ajith Fernando - Independent Director
Rajanayagam Nalliah Asirwatham - Independent Director (Resigned 10 May 2012)
Rajah Mahinda Nanayakkara - Non-Executive Director
Hideo Ichida - Non-Executive Director
Masaaki Kawano - Non-Executive Director (Appointed 28 September 2011)
Kazunori Okimoto - Non-Executive Director (Resigned 28 September 2011)
Takuma Yamazaki - Non-Executive Director (Alternate to Mr. H. Ichida and Mr. M. Kawano)
Company Secretary
Chrishanthi S. Emmanuel, FCIS, FCCS
Auditors
Ernst & young
Chartered Accountants
Lawyers
Julius & Creasy
Nithya Partners
Registrars
P.W. Corporate Secretarial (Pvt) Ltd.
No. 3/17, Kynsey Road, Colombo 8.
Principal Activities
Monitoring performance of investments in
associate and subsidiary companies and
performing support services.
Bankers
Bank of Ceylon, People’s Bank,
Standard Chartered Bank, Citibank N.A.,
Hatton National Bank PLC, Hongkong &
Shanghai Banking Corporation,
National Savings Bank, Deutsche Bank AG,
Nations Trust Bank PLC, DFCC Vardhana
Bank PLC, Commercial Bank of Ceylon PLC,
NDB Bank PLC, Public Bank of Berhad,
Sampath Bank PLC, Seylan Bank PLC,
Pan Asia Banking Corporation PLC,
Union Bank PLC, ICICI Bank, MCB Bank,
State Bank of India, Indian Overseas Bank,
Indian Bank

LOLC 2011/12 REPORTS & ACCOUNTS 237
foRm of pRoxy
lanka oRix leaSinG company plc
I/We .......................................……….......................................................................................................................................................................... of
.................................................................................................................................................................................... being a member/members of
the Company hereby appoint ..................................................................................................................................................................................of
.............................................................................................................................................................................................................. whom failing
Mrs. R.L. Nanayakkara of Colombo or failing her
Mr. I.C. Nanayakkara of Colombo or failing him
Mr. W.D.K. Jayawardena of Colombo or failing him
Deshamanya M.D.D. Pieris of Colombo or failing him
Mr. R.M. Nanayakkara of Colombo or failing him
Mrs. K.U. Amarasinghe of Colombo or failing her
Mr. R.A. Fernando of Colombo
as my/our proxy to represent me/us and vote on my/our behalf at the Annual General Meeting of the Company to be held on 18 September 2012 and at any adjournment thereof and at every poll which may be taken in consequence of the aforesaid Meeting.
For Against
1. To receive and consider the Report of the Directors and Statement of Accounts for the year ended 31 March 2012 with the Report of the Auditors thereon.
2. To re-elect as a Director, Mr. R.A. Fernando who retires by rotation in terms of Article 88 (i) of the Articles of Association of the Company.
3. To re-elect as a Director, Mr. M. Kawano who retires by rotation in terms of Article 95 of the Articles of Association of the Company.
4. To re-elect as a Director, Mrs. R.L. Nanayakkara, who retires in terms of Section 210/211 of the Companies Act No. 7 of 2007.
5. To re-elect as a Director Mr. R.M. Nanayakkara, who retires in terms of Section 210/211 of the Companies Act No. 7 of 2007.
6. To re-elect as a Director Deshamanya M.D.D. Pieris, who retires in terms of Section 210/211 of the Companies Act No. 7 of 2007.
7. To reappoint as Auditors Messrs Ernst and young, Chartered Accountants at a remuneration to be fixed by the Directors.
8. To authorise the Directors to make donations.
Dated this ……….………………….. day of ……………………, Two Thousand and Twelve.
..................................................... Signature of ShareholderNotes:1. A Proxy need not be a member of the Company.
2. Instructions as to completion appear on the reverse hereof.

238 LOLC 2011/12 REPORTS & ACCOUNTS
inStRuctionS aS to completion
1. Please return the completed Form of Proxy after filling in legibly your full name and address, signing on the space provided and filling in the date of signature.
2. The completed Form of Proxy should be deposited at the Registered Office of the Company, No. 100/1, Sri Jayewardenepura Mawatha, Rajagiriya not less than 48 hours before the time appointed for the holding of the Meeting.
FORM OF PROxy


This Annual Report isCarbon Neutral
This Lanka ORIX Leasing Company PLC Annual Report has been produced by Smart Media The Annual Report Company whose greenhouse gas emissions resulting from the writing, designing, photography, production, project management, usage of paper and other raw materials, printing and transportation are offset using verified carbon offsets.
Financial calendar 2011/121st Quarter Results 2011/12 released on 15 August 2011
2nd Quarter Results 2011/12 released on 15 November 2011
3rd Quarter Results 2011/12 released on 15 February 2012
4th Quarter Results 2011/12 released on 31 May 2012
Annual Report for 2011/12 released on 24 August 2012
33rd Annual General Meeting on 18 September 2012
ProPosed Financial calendar 2012/131st Quarter Results 2012/13 will be released on 15 August 2012
2nd Quarter Results 2012/13 will be released on 15 November 2012
3rd Quarter Results 2012/13 will be released on 15 February 2013
Annual Report for 2012/13 will be released on June 2013
34th Annual General Meeting in June 2013

LOLC 2011/12 REPORTS & ACCOUNTS
LOLC
2011/12 REP
OR
TS & A
CCOU
NTS
No. 100/1 Sri Jayewardenepura Mawatha, Rajagiriya, Sri Lanka.
Tel: +94 11 5880880 Fax: +94 11 2865612 / 2868648
www.lolc.com FiNANCiAl HigHligHTS
For the year ended 31 March 2003 2004 2005 2006 2007 2008 2009 2010 2011 2012
gROUP
Performance Indicators (Rs. Mn)
Profit before tax 290 402 572 709 998 1,183 1,247 2,841 8,282 10,327
Profit after tax 278 391 575 689 1,050 1,343 1,055 2,385 7,023 8,937
Total assets 7,038 8,987 10,706 16,227 24,484 32,994 46,287 75,371 111,813 145,288
New executions 3,189 4,740 5,591 10,064 13,340 14,320 14,906 21,963 47,392 58,233
Gross portfolio (rentals receivable) 6,867 8,517 10,112 14,806 23,057 29,282 44,824 47,351 70,077 98,941
Deposits from customers – 197 716 1,194 1,746 3,340 5,229 10,095 16,348 25,197
Outstanding borrowings 4,615 5,952 6,634 10,475 17,001 22,887 31,764 38,235 50,813 66,075
Non-performing portfolio 815 883 865 113 137 526 1,933 1,431 1,159 1,702
Return on equity (%) 17 21 27 26 31 30 19 26 37 39
Key Indicators (Rs. per share)
Net asset value per share (adjusted) 3.60 3.92 4.92 6.10 7.96 10.78 12.65 16.63 27.35 40.59
Earnings per share (adjusted) 0.57 0.85 1.21 1.44 2.19 2.82 2.22 3.88 8.08 13.17
COmPANy
Performance Indicators (Rs. Mn)
Profit before tax 256 418 562 677 910 841 582 491 1,898 4,423
Profit after tax 256 418 562 664 987 1,059 505 327 1,523 4,301
Total assets 5,981 7,617 8,747 13,298 20,889 28,996 31,335 29,738 31,153 36,662
New executions 3,189 4,427 4,972 8,858 12,068 12,127 12,170 4,569 5,036 3,926
Gross portfolio (rentals receivable) 6,757 8,082 9,144 12,858 19,851 25,056 25,185 17,958 11,897 7,704
Outstanding borrowings 4,113 5,396 6,025 9,824 16,250 22,273 24,850 23,087 22,379 23,894
Non-performing portfolio 815 883 865 113 137 443 538 769 545 500
Key Indicators (Rs. per share)
Dividends per share 0.33 0.19 0.23 0.30 0.15 0.23 0.28 – – –
Market price per share 7.35 6.00 8.50 10.10 10.75 11.78 6.95 16.50 119.60 54.00
Net asset value per share 3.53 3.88 4.86 6.00 7.77 10.02 10.74 11.42 15.67 24.73
(Times)
Debt to equity ratio 2.45 2.93 2.61 3.45 4.40 4.66 4.87 4.25 3.00 2.03
Interest cover 1.52 1.85 2.56 1.96 1.63 1.28 1.14 1.16 1.80 2.74
Dividend cover 3.30 4.50 5.09 4.64 13.86 9.53 3.79 – – –
erThe Diffe nce is...
The Diffe nce is...
er