financial fact data fiscal year ended march 31, 2019
TRANSCRIPT

Copyright(C) 2019MISAWA HOMES CO., LTD. ALL RIGHTS RESERVED.
2019年3月期 決算説明資料
Financial Fact DataFiscal Year Ended March 31, 2019
MISAWA HOMES CO., LTD.

Copyright(C) 2019MISAWA HOMES CO., LTD. ALL RIGHTS RESERVED.
■ 目次 Index
主な財務データ 連結経営指標 ① Consolidated Financial Summary ① 1
Financial Summary 連結経営指標 ② Consolidated Financial Summary ② 2
セグメント別連結業績推移 Consolidated Sales by Business Segment 3
事業の概況 住宅事業の状況 Home Building Operations
Business Overview 新設住宅着工戸数の推移 Housing Starts 4
受注の状況 ① Home Orders Summary ① 5
受注の状況 ② Home Orders Summary ② 6
受注の傾向 ① Profile of Home Orders ① 7
受注の傾向 ② Profile of Home Orders ② 8
リフォーム事業の売上推移 Remodeling Sales 9
決算概要 連結貸借対照表 ① Consolidated Balance Sheets ① 10
Financial Results 連結貸借対照表 ② Consolidated Balance Sheets ② 11
連結損益計算書 Consolidated Statements of Income 12
連結キャッシュ・フロー計算書 Consolidated Statements of Cash Flows 13
有利子負債の推移 Changes in Interest-Bearing Liabilities 14
その他データ 人員の推移 Group Employees 15
Reference Information 株主所有者別統計表 Ownership and Distribution of Shares 16
大株主一覧 Major Shareholders 17
Copyright(C) 2019MISAWA HOMES CO., LTD. ALL RIGHTS RESERVED.
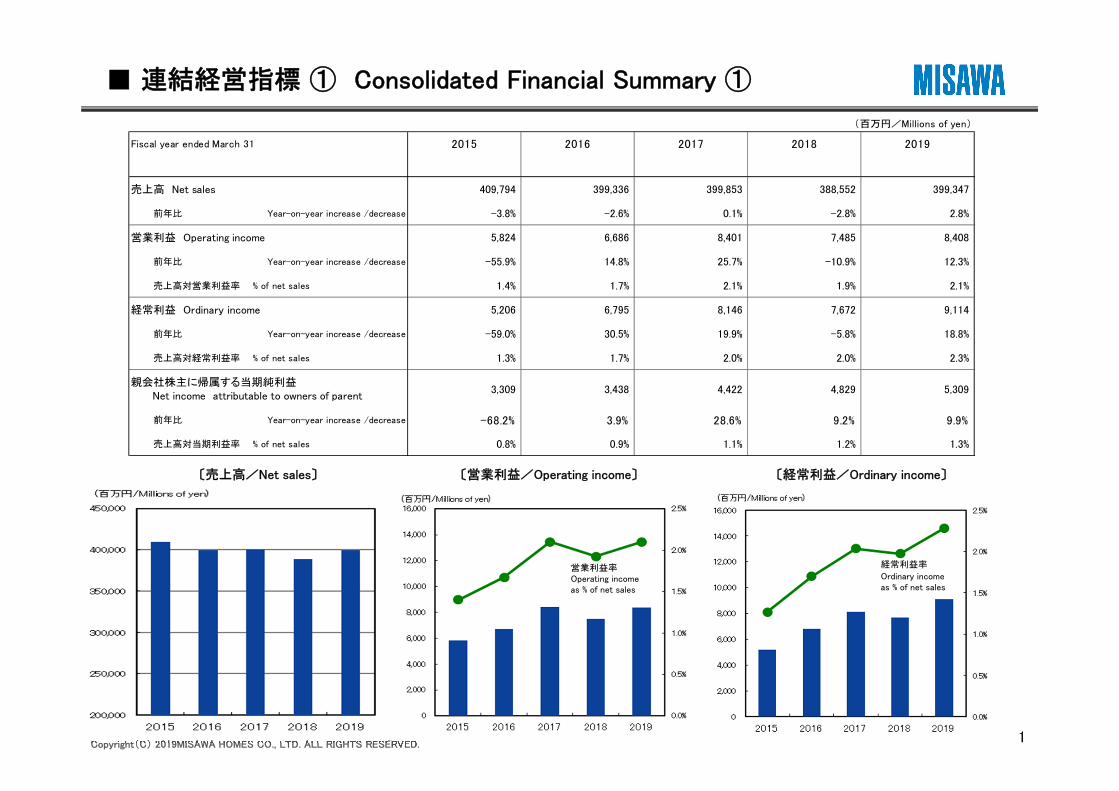
■ 連結経営指標 ① Consolidated Financial Summary ①
〔売上高/Net sales〕 〔営業利益/Operating income〕 〔経常利益/Ordinary income〕
1
経常利益率
Ordinary income as % of net sales
営業利益率Operating income as % of net sales
(百万円/Millions of yen)
Fiscal year ended March 31 2015 2016 2017 2018 2019
売上高 Net sales 409,794 399,336 399,853 388,552 399,347
前年比 Year-on-year increase /decrease -3.8% -2.6% 0.1% -2.8% 2.8%
営業利益 Operating income 5,824 6,686 8,401 7,485 8,408
前年比 Year-on-year increase /decrease -55.9% 14.8% 25.7% -10.9% 12.3%
売上高対営業利益率 % of net sales 1.4% 1.7% 2.1% 1.9% 2.1%
経常利益 Ordinary income 5,206 6,795 8,146 7,672 9,114
前年比 Year-on-year increase /decrease -59.0% 30.5% 19.9% -5.8% 18.8%
売上高対経常利益率 % of net sales 1.3% 1.7% 2.0% 2.0% 2.3%
3,309 3,438 4,422 4,829 5,309
前年比 Year-on-year increase /decrease -68.2% 3.9% 28.6% 9.2% 9.9%
売上高対当期利益率 % of net sales 0.8% 0.9% 1.1% 1.2% 1.3%
親会社株主に帰属する当期純利益 Net income attributable to owners of parent

Copyright(C) 2019MISAWA HOMES CO., LTD. ALL RIGHTS RESERVED.
(百万円/Millions of yen)
Fiscal year ended March 31 2015 2016 2017 2018 2019
総資産 224,617 231,998 247,069 254,410 282,141
Total assets
純資産 42,747 42,845 52,309 57,181 63,574
Net assets
自己資本比率 18.0% 17.5% 20.2% 21.6% 21.1%
Equity ratio
(円/Yen)
1株当たり純資産 1,080.98 1,084.54 1,157.20 1,275.72 1,379.90
Net assets per share
1株当たり当期純利益 88.73 92.05 114.37 112.14 123.31
Net income per share
■ 連結経営指標 ② Consolidated Financial Summary ②
2
Net assets per share Net income per shareShareholders’ equity ratioNet assetsTotal assets
総資産 純資産 自己資本比率 1株当たり純資産 1株当たり当期純利益
Copyright(C) 2019MISAWA HOMES CO., LTD. ALL RIGHTS RESERVED.
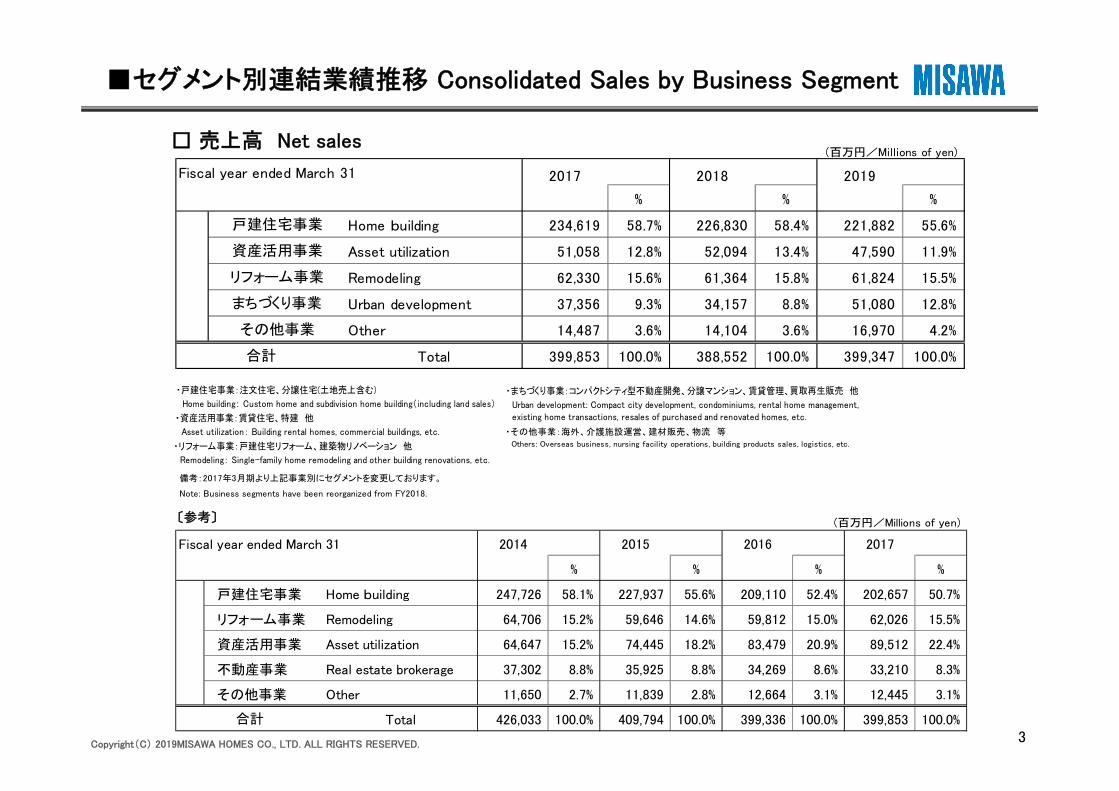
備考:2017年3月期より上記事業別にセグメントを変更しております。
Note: Business segments have been reorganized from FY2018.
・戸建住宅事業:注文住宅、分譲住宅(土地売上含む)
Home building: Custom home and subdivision home building(including land sales)
・資産活用事業:賃貸住宅、特建 他
Asset utilization: Building rental homes, commercial buildings, etc.
・リフォーム事業:戸建住宅リフォーム、建築物リノベーション 他
Remodeling: Single-family home remodeling and other building renovations, etc.
■セグメント別連結業績推移 Consolidated Sales by Business Segment
3
□ 売上高 Net sales
〔参考〕
・まちづくり事業:コンパクトシティ型不動産開発、分譲マンション、賃貸管理、既存住宅仲介、
・その他事業:海外、介護施設運営、建材販売、物流 等
Others: Overseas business, nursing facility operations, building products sales, logistics, etc.
買取再生販売 他
Urban development: Compact city development, condominiums, rental home management, existing home transactions, resales of purchased and renovated homes, etc.
(百万円/Millions of yen)
Fiscal year ended March 31 2014 2015 2016 2017
% % % %
戸建住宅事業 Home building 247,726 58.1% 227,937 55.6% 209,110 52.4% 202,657 50.7%
リフォーム事業 Remodeling 64,706 15.2% 59,646 14.6% 59,812 15.0% 62,026 15.5%
資産活用事業 Asset utilization 64,647 15.2% 74,445 18.2% 83,479 20.9% 89,512 22.4%
不動産事業 Real estate brokerage 37,302 8.8% 35,925 8.8% 34,269 8.6% 33,210 8.3%
その他事業 Other 11,650 2.7% 11,839 2.8% 12,664 3.1% 12,445 3.1%
Total 426,033 100.0% 409,794 100.0% 399,336 100.0% 399,853 100.0%合計
(百万円/Millions of yen)
Fiscal year ended March 31
% % %
Home building 234,619 58.7% 226,830 58.4% 221,882 55.6%
Asset utilization 51,058 12.8% 52,094 13.4% 47,590 11.9%
Remodeling 62,330 15.6% 61,364 15.8% 61,824 15.5%
Urban development 37,356 9.3% 34,157 8.8% 51,080 12.8%
Other 14,487 3.6% 14,104 3.6% 16,970 4.2%
Total 399,853 100.0% 388,552 100.0% 399,347 100.0%
その他事業
2018
合計
戸建住宅事業
資産活用事業
リフォーム事業
まちづくり事業
20192017

Copyright(C) 2019MISAWA HOMES CO., LTD. ALL RIGHTS RESERVED.
□ 新設住宅着工戸数推移 Housing Starts in Japan(戸/Units)
Fiscal year ended March 31 2010 2011 2012 2013 2014 2015 2016 2017 2018 2019
持家 286,993 308,517 304,822 316,532 352,841 278,221 284,441 291,783 282,111 287,710
Owner-occupied homes
貸家 311,463 291,840 289,762 320,891 369,993 358,340 383,678 427,275 410,355 390,093
Rental homes
給与住宅 13,231 6,580 7,576 5,919 5,272 7,867 5,832 5,793 5,435 7,958
Corporate homes
分譲住宅 163,590 212,083 239,086 249,660 259,148 236,042 246,586 249,286 248,495 267,175
Subdivision homes
合計 775,277 819,020 841,246 893,002 987,254 880,470 920,537 974,137 946,396 952,936
Total
□ プレハブ住宅の新設住宅着工戸数推移 Prefabricated Housing Starts in Japan(戸/Units)
Fiscal year ended March 31 2010 2011 2012 2013 2014 2015 2016 2017 2018 2019
持家 51,819 54,715 55,396 55,887 57,422 46,820 45,136 45,974 43,319 43,604
Owner-occupied homes
貸家 67,415 65,952 66,994 72,488 86,028 86,100 91,849 94,966 87,131 80,401
Rental homes
給与住宅 749 533 1,009 373 540 792 534 1,221 795 1,677
Corporate homes
分譲住宅 4,378 4,502 4,817 5,339 5,766 6,445 5,645 5,433 5,000 5,234
Subdivision homes
合計 124,361 125,702 128,216 134,087 149,756 140,157 143,164 147,594 136,245 130,916
Total
出所:国土交通省「住宅着工統計」 Source:Ministry of Land, Infrastructure, Transport and Tourism “Housing Starts Statistics.”
■ 新設住宅着工戸数の推移 Housing Starts
4
Copyright(C) 2019MISAWA HOMES CO., LTD. ALL RIGHTS RESERVED.
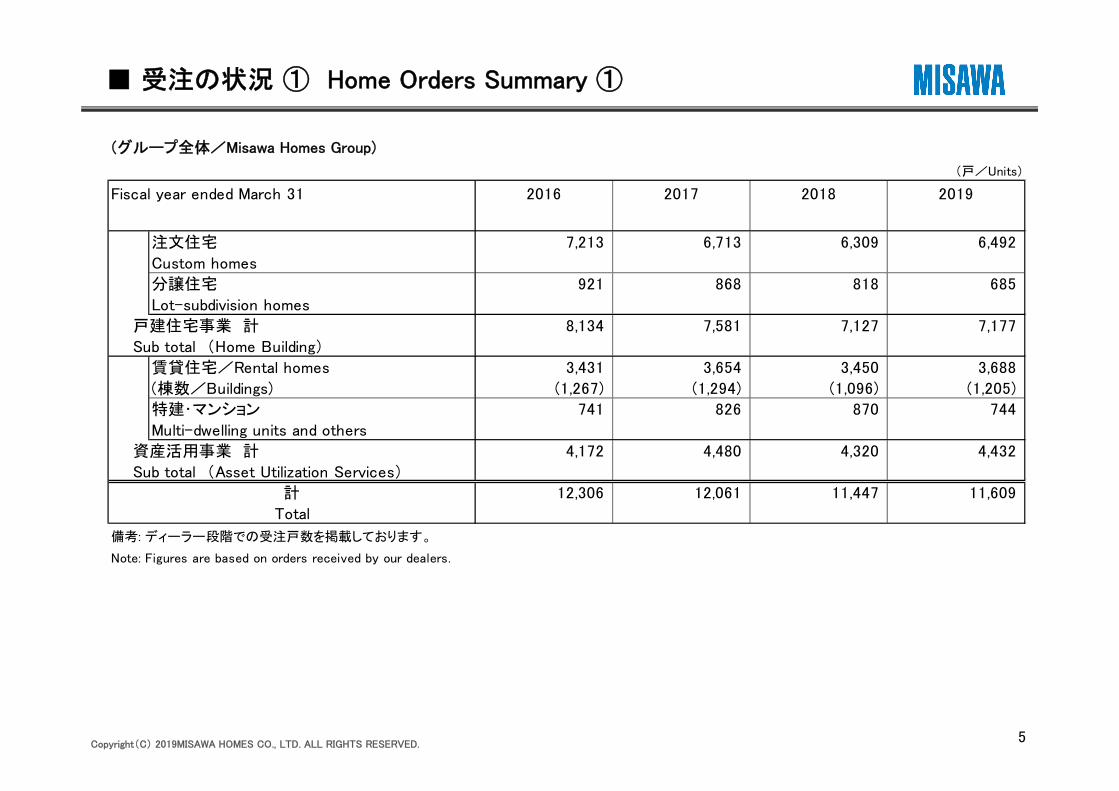
■ 受注の状況 ① Home Orders Summary ①
(グループ全体/Misawa Homes Group)
5
備考: ディーラー段階での受注戸数を掲載しております。
Note: Figures are based on orders received by our dealers.
(戸/Units)
Fiscal year ended March 31 2016 2017 2018 2019
注文住宅 7,213 6,713 6,309 6,492
Custom homes
分譲住宅 921 868 818 685
Lot-subdivision homes
戸建住宅事業 計 8,134 7,581 7,127 7,177
Sub total (Home Building)
賃貸住宅/Rental homes 3,431 3,654 3,450 3,688
(棟数/Buildings) (1,267) (1,294) (1,096) (1,205)
特建・マンション 741 826 870 744
Multi-dwelling units and others
資産活用事業 計 4,172 4,480 4,320 4,432
12,306 12,061 11,447 11,609
Sub total (Asset Utilization Services)
計
Total
Copyright(C) 2019MISAWA HOMES CO., LTD. ALL RIGHTS RESERVED.
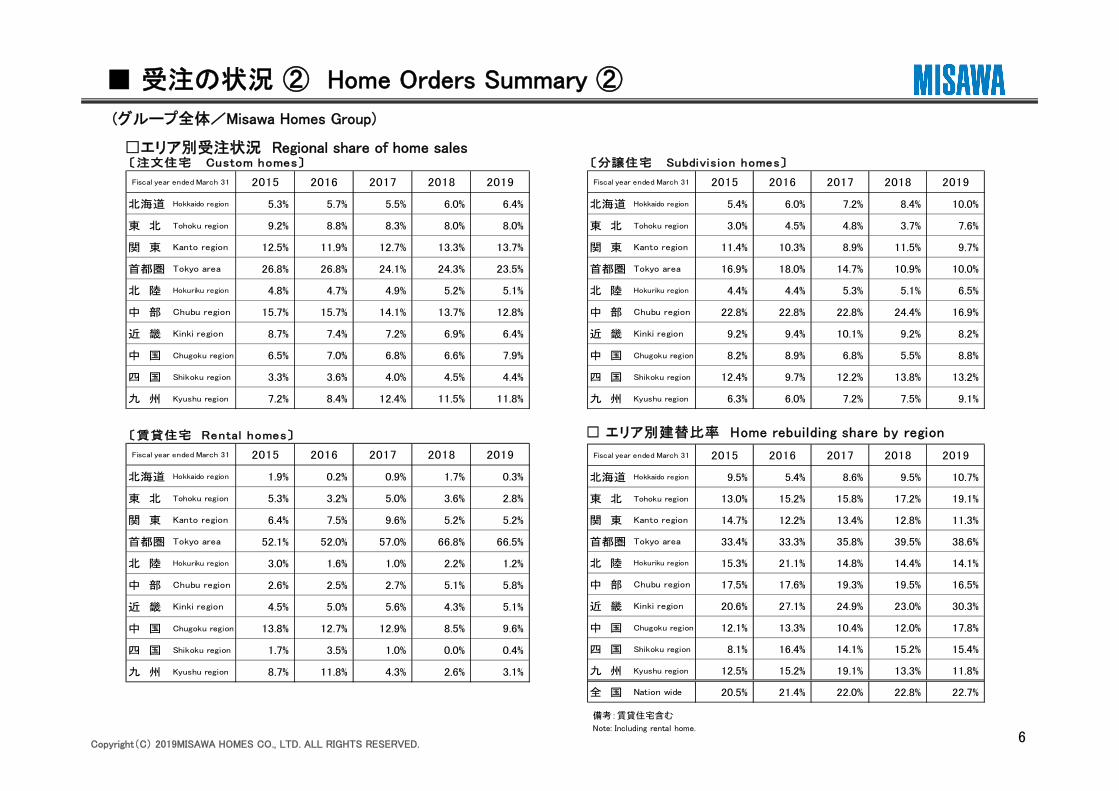
〔分譲住宅 Subdivision homes〕
2015 2016 2017 2018 2019
北海道 Hokkaido region 5.4% 6.0% 7.2% 8.4% 10.0%
東 北 Tohoku region 3.0% 4.5% 4.8% 3.7% 7.6%
関 東 Kanto region 11.4% 10.3% 8.9% 11.5% 9.7%
首都圏 Tokyo area 16.9% 18.0% 14.7% 10.9% 10.0%
北 陸 Hokuriku region 4.4% 4.4% 5.3% 5.1% 6.5%
中 部 Chubu region 22.8% 22.8% 22.8% 24.4% 16.9%
近 畿 Kinki region 9.2% 9.4% 10.1% 9.2% 8.2%
中 国 Chugoku region 8.2% 8.9% 6.8% 5.5% 8.8%
四 国 Shikoku region 12.4% 9.7% 12.2% 13.8% 13.2%
九 州 Kyushu region 6.3% 6.0% 7.2% 7.5% 9.1%
Fiscal year ended March 31
2015 2016 2017 2018 2019
北海道 Hokkaido region 9.5% 5.4% 8.6% 9.5% 10.7%
東 北 Tohoku region 13.0% 15.2% 15.8% 17.2% 19.1%
関 東 Kanto region 14.7% 12.2% 13.4% 12.8% 11.3%
首都圏 Tokyo area 33.4% 33.3% 35.8% 39.5% 38.6%
北 陸 Hokuriku region 15.3% 21.1% 14.8% 14.4% 14.1%
中 部 Chubu region 17.5% 17.6% 19.3% 19.5% 16.5%
近 畿 Kinki region 20.6% 27.1% 24.9% 23.0% 30.3%
中 国 Chugoku region 12.1% 13.3% 10.4% 12.0% 17.8%
四 国 Shikoku region 8.1% 16.4% 14.1% 15.2% 15.4%
九 州 Kyushu region 12.5% 15.2% 19.1% 13.3% 11.8%
全 国 Nation wide 20.5% 21.4% 22.0% 22.8% 22.7%
Fiscal year ended March 31
〔賃貸住宅 Rental homes〕
2015 2016 2017 2018 2019
北海道 Hokkaido region 1.9% 0.2% 0.9% 1.7% 0.3%
東 北 Tohoku region 5.3% 3.2% 5.0% 3.6% 2.8%
関 東 Kanto region 6.4% 7.5% 9.6% 5.2% 5.2%
首都圏 Tokyo area 52.1% 52.0% 57.0% 66.8% 66.5%
北 陸 Hokuriku region 3.0% 1.6% 1.0% 2.2% 1.2%
中 部 Chubu region 2.6% 2.5% 2.7% 5.1% 5.8%
近 畿 Kinki region 4.5% 5.0% 5.6% 4.3% 5.1%
中 国 Chugoku region 13.8% 12.7% 12.9% 8.5% 9.6%
四 国 Shikoku region 1.7% 3.5% 1.0% 0.0% 0.4%
九 州 Kyushu region 8.7% 11.8% 4.3% 2.6% 3.1%
Fiscal year ended March 31
〔注文住宅 Custom homes〕
2015 2016 2017 2018 2019
北海道 Hokkaido region 5.3% 5.7% 5.5% 6.0% 6.4%
東 北 Tohoku region 9.2% 8.8% 8.3% 8.0% 8.0%
関 東 Kanto region 12.5% 11.9% 12.7% 13.3% 13.7%
首都圏 Tokyo area 26.8% 26.8% 24.1% 24.3% 23.5%
北 陸 Hokuriku region 4.8% 4.7% 4.9% 5.2% 5.1%
中 部 Chubu region 15.7% 15.7% 14.1% 13.7% 12.8%
近 畿 Kinki region 8.7% 7.4% 7.2% 6.9% 6.4%
中 国 Chugoku region 6.5% 7.0% 6.8% 6.6% 7.9%
四 国 Shikoku region 3.3% 3.6% 4.0% 4.5% 4.4%
九 州 Kyushu region 7.2% 8.4% 12.4% 11.5% 11.8%
Fiscal year ended March 31
■ 受注の状況 ② Home Orders Summary ②
6
☐エリア別受注状況 Regional share of home sales
(グループ全体/Misawa Homes Group)
備考:賃貸住宅含む
Note: Including rental home.
☐ エリア別建替比率 Home rebuilding share by region
Copyright(C) 2019MISAWA HOMES CO., LTD. ALL RIGHTS RESERVED.
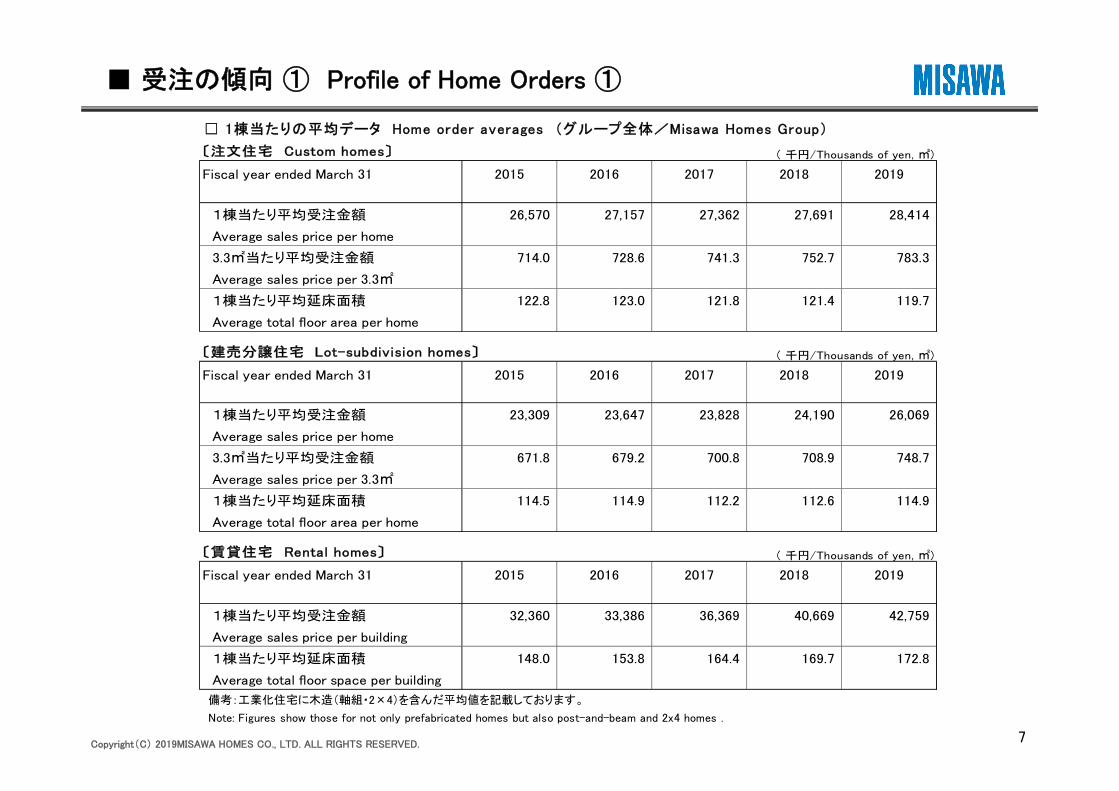
〔注文住宅 Custom homes〕
Fiscal year ended March 31 2015 2016 2017 2018 2019
1棟当たり平均受注金額 26,570 27,157 27,362 27,691 28,414
Average sales price per home
3.3㎡当たり平均受注金額 714.0 728.6 741.3 752.7 783.3
Average sales price per 3.3㎡
1棟当たり平均延床面積 122.8 123.0 121.8 121.4 119.7
Average total floor area per home
〔建売分譲住宅 Lot-subdivision homes〕 ( 千円/Thousands of yen, ㎡)
Fiscal year ended March 31 2015 2016 2017 2018 2019
1棟当たり平均受注金額 23,309 23,647 23,828 24,190 26,069
Average sales price per home
3.3㎡当たり平均受注金額 671.8 679.2 700.8 708.9 748.7
Average sales price per 3.3㎡
1棟当たり平均延床面積 114.5 114.9 112.2 112.6 114.9
Average total floor area per home
〔賃貸住宅 Rental homes〕 ( 千円/Thousands of yen, ㎡)
Fiscal year ended March 31 2015 2016 2017 2018 2019
1棟当たり平均受注金額 32,360 33,386 36,369 40,669 42,759
Average sales price per building
1棟当たり平均延床面積 148.0 153.8 164.4 169.7 172.8
Average total floor space per building
( 千円/Thousands of yen, ㎡)
■ 受注の傾向 ① Profile of Home Orders ①
7
☐ 1棟当たりの平均データ Home order averages (グループ全体/Misawa Homes Group)
備考:工業化住宅に木造(軸組・2×4)を含んだ平均値を記載しております。
Note: Figures show those for not only prefabricated homes but also post-and-beam and 2x4 homes .

Copyright(C) 2019MISAWA HOMES CO., LTD. ALL RIGHTS RESERVED.
Fiscal year ended March 31 2015 2016 2017 2018 2019
展示場 41.5% 43.0% 41.5% 42.5% 39.8%
Model homes
イベント 4.7% 3.9% 4.1% 3.4% 3.0%
Promotional events
紹介・再受注 42.9% 42.5% 44.0% 43.3% 45.3%
Referrals or repeat orders
広告 2.4% 2.2% 2.0% 1.9% 2.4%
Ads in mass media
ホームページ 5.0% 4.9% 5.2% 6.0% 6.8%
Home page
その他 3.5% 3.5% 3.2% 2.8% 2.7%
Other
■ 受注の傾向 ② Profile of Home Orders ②
8
☐ 顧客平均年齢推移 Average age of home buyers (グループ全体/Misawa Homes Group)
☐ 受注経路 How our customers find us (グループ全体/Misawa Homes Group)
(歳/Years old)
Fiscal years ended March 31 2015 2016 2017 2018 2019
注文住宅 39.6 39.5 39.4 39.1 39.2
Custom homes
建売分譲住宅 37.6 36.7 36.9 36.3 36.4
Subdivision homes
賃貸住宅 59.4 59.8 62.5 64.1 66.1
Rental homes
平均 42.8 42.4 42.3 41.8 42.6
Average

Copyright(C) 2019MISAWA HOMES CO., LTD. ALL RIGHTS RESERVED.
■ リフォーム事業の売上推移 Remodeling Sales
〔連結/Consolidated〕 〔グループ全体/Misawa Homes Group〕
9
(百万円/Millions of yen)
Fiscal year ended March 31 2015 2016 2017 2018 2019
連結 59,646 59,811 62,330 61,364 61,824
Consolidated 102% 100% 104% 98% 101%
グループ全体 64,370 64,904 66,754 66,389 67,153
Misawa Homes Group 99% 101% 103% 99% 101%

Copyright(C) 2019MISAWA HOMES CO., LTD. ALL RIGHTS RESERVED.
【資産の部 Assets】 (百万円/Millions of yen)
2015 2016 2017 2018 2019
流動資産 Current assets 149,836 158,771 167,717 167,646 186,036
現金及び預金 Cash and time deposits 45,547 47,717 55,003 59,583 49,753
受取手形及び売掛金 Notes and accounts receivable-trade 7,150 7,921 8,138 8,548 11,513
たな卸資産 Inventories 83,498 83,378 84,049 78,322 101,288
販売用不動産 Developed land and finished homes 48,264 47,410 46,197 38,292 53,236
未成工事支出金 Land and housing projects in progress 31,131 32,821 34,778 36,955 44,880
その他 Other 4,102 3,146 3,073 3,074 3,171
繰延税金資産 Deferred tax assets 4,417 4,173 4,220 4,402 -
その他 Other current assets 9,578 15,751 16,502 16,969 23,621
貸倒引当金 Allowance for doubtful accounts -356 -170 -197 -180 -140
固定資産 Non-current assets 74,780 73,226 79,352 86,763 96,105
有形固定資産 Tangible fixed assets 48,437 48,952 56,104 62,333 59,742
建物及び構築物 Buildings and structures 18,208 18,647 21,834 25,637 24,079
機械装置及び運搬具 Machinery and equipment 2,931 2,615 2,195 2,020 1,840
土地 Land 24,636 25,390 29,694 31,950 30,459
その他 Other tangible fixed assets 2,660 2,299 2,378 2,724 3,363
無形固定資産 Intangible fixed assets 8,986 9,330 9,065 8,381 12,987
投資その他の資産 Investments and other assets 17,356 14,943 14,182 16,048 23,375
投資有価証券 Investment securities 2,561 1,388 1,474 1,528 4,560
繰延税金資産 Defferred tax assets 3,516 2,221 1,986 1,559 3,981
その他 Other 12,899 13,031 12,379 14,619 16,463
貸倒引当金 Allowance for doubtful accounts -1,621 -1,697 -1,658 -1,658 -1,630
資産合計 Total 224,617 231,998 247,069 254,410 282,141
Fiscal year ended March 31
■ 連結貸借対照表 ① Consolidated Balance Sheets ①
10

Copyright(C) 2019MISAWA HOMES CO., LTD. ALL RIGHTS RESERVED.
【負債及び純資産の部 Liabilities and Net assets】 (百万円/Millions of yen)
2015 2016 2017 2018 2019
負債の部 Liabilities 181,869 189,152 194,759 197,228 218,567
流動負債 Current liabilities 138,628 140,865 138,733 136,961 156,002
支払手形及び買掛金 Notes and accounts payable-trade 48,404 44,402 42,429 37,341 39,971
短期借入金 Short-term bank loans 29,631 38,281 36,227 38,933 51,542
賞与引当金 Accrued bonuses 5,512 5,511 5,890 5,809 5,936
未払金 Accounts payable 9,321 7,968 7,506 8,475 8,780
未成工事受入金 Advances received from customers 32,140 29,525 30,671 30,056 31,891
預り金 deposits 5,639 6,237 6,083 6,009 6,220
その他 Other current liabilities 7,978 8,938 9,924 10,334 11,658
固定負債 Long-term liabilities 43,241 48,286 56,026 60,267 62,564
社債 Bonds payable 150 1,000 1,000 1,000 1,000
長期借入金 Long-term bank loans 28,214 34,835 44,124 47,732 51,223
退職給付に係る負債 Net defined benefit liabilities 2,856 3,032 2,213 2,196 2,401
Asset retirement obligations 1,223 1,321 1,305 1,329 1,615
その他 Other long-term bank loans 10,798 8,097 7,382 8,008 6,324
純資産の部 Net assets 42,747 42,845 52,309 57,181 63,574
株主資本 Shareholders' equity 38,082 40,759 49,433 53,179 57,988
資本金 Common stock 10,000 10,000 11,892 11,892 11,892
資本剰余金 Capital surplus 3,203 3,199 2,877 2,877 2,878
利益剰余金 Retained earnings 28,306 30,988 34,664 38,417 43,226
自己株式 Treasury stock -3,427 -3,429 -8 -9
その他の包括利益累計額 Valuation and translation adjustments 2,295 -251 405 1,755 1,430
その他有価証券評価差額金 Unrealized gain on available-for-sale securities 750 321 357 424 282
土地再評価差額金 Land revaluation difference -448 -440 -440 -440 -440
為替換算調整勘定 Foreign currency translation adjustments 63 29 -16 36 -93
退職給付に係る調整累計額 Remeasurements of defined benefit plans 1,930 -162 504 1,735 1,682
非支配株主持分 Minority interest in subsidiaries 2,369 2,337 2,470 2,246 4,154
負債純資産合計 Total liabilities and net assets 224,617 231,998 247,069 254,410 282,141
Fiscal year ended March 31
資産除去債務
-0
■ 連結貸借対照表 ② Consolidated Balance Sheets ②
11

Copyright(C) 2019MISAWA HOMES CO., LTD. ALL RIGHTS RESERVED.
■ 連結損益計算書 Consolidated Statements of Income
12
(百万円/Millions of yen)
Fiscal year ended March 31 2015 2016 2017 2018 2019
売上高 Net sales 409,794 399,336 399,853 388,552 399,347
前年比 Year-on-year increase/decrease -3.8% -2.6% 0.1% -2.8% 2.8%
売上総利益 Gross profit 88,307 84,991 86,224 84,662 86,273
前年比 Year-on-year increase/decrease -9.7% -3.8% 1.5% -1.8% 1.9%
売上比 % of net sales 21.5% 21.3% 21.6% 21.8% 21.6%
販売費及び一般管理費 Selling, general and administrative expenses 82,482 78,304 77,823 77,177 77,865
前年比 Year-on-year increase/decrease -2.5% -5.1% -0.6% -0.8% 0.9%
売上比 % of net sales 20.1% 19.6% 19.5% 19.9% 19.5%
営業利益 Operating income 5,824 6,686 8,401 7,485 8,408
前年比 Year-on-year increase/decrease -55.9% 14.8% 25.7% -10.9% 12.3%
売上比 % of net sales 1.4% 1.7% 2.1% 1.9% 2.1%
営業外損益 Non-operating income/expenses -618 109 -255 186 705
前年比 Year-on-year increase/decrease ― ― ― ― 277.4%
売上比 % of net sales -0.2% 0.0% -0.1% 0.0% 0.2%
営業外収益 Non-operating income 1,114 1,340 1,300 1,287 1,544
営業外費用 Non-operating expenses 1,733 1,231 1,555 1,100 838
経常利益 Ordinary income 5,206 6,795 8,146 7,672 9,114
前年比 Year-on-year increase/decrease -59.0% 30.5% 19.9% -5.8% 18.8%
売上比 % of net sales 1.3% 1.7% 2.0% 2.0% 2.3%
特別損益 Extraordinary income/loss -1,244 -695 -2,077 -1,503 -1,525
前年比 Year-on-year increase/decrease ― ― ― ― ―
売上比 % of net sales -0.3% -0.2% -0.5% -0.4% -0.4%
特別利益 Extraordinary income 184 589 51 29 5
特別損失 Extraordinary loss 1,429 1,284 2,128 1,532 1,530
税金等調整前当期純利益 Income before income taxes 3,962 6,100 6,069 6,168 7,588
前年比 Year-on-year increase/decrease -66.6% 54.0% -0.5% 1.6% 23.0%
売上比 % of net sales 1.0% 1.5% 1.5% 1.6% 1.9%
親会社株主に帰属する当期純利益 Net income attributable to owners of parent 3,309 3,438 4,422 4,829 5,309
前年比 Year-on-year increase/decrease -68.2% 3.9% 28.6% 9.2% 9.9%
売上比 % of net sales 0.8% 0.9% 1.1% 1.2% 1.3%
Copyright(C) 2019MISAWA HOMES CO., LTD. ALL RIGHTS RESERVED.
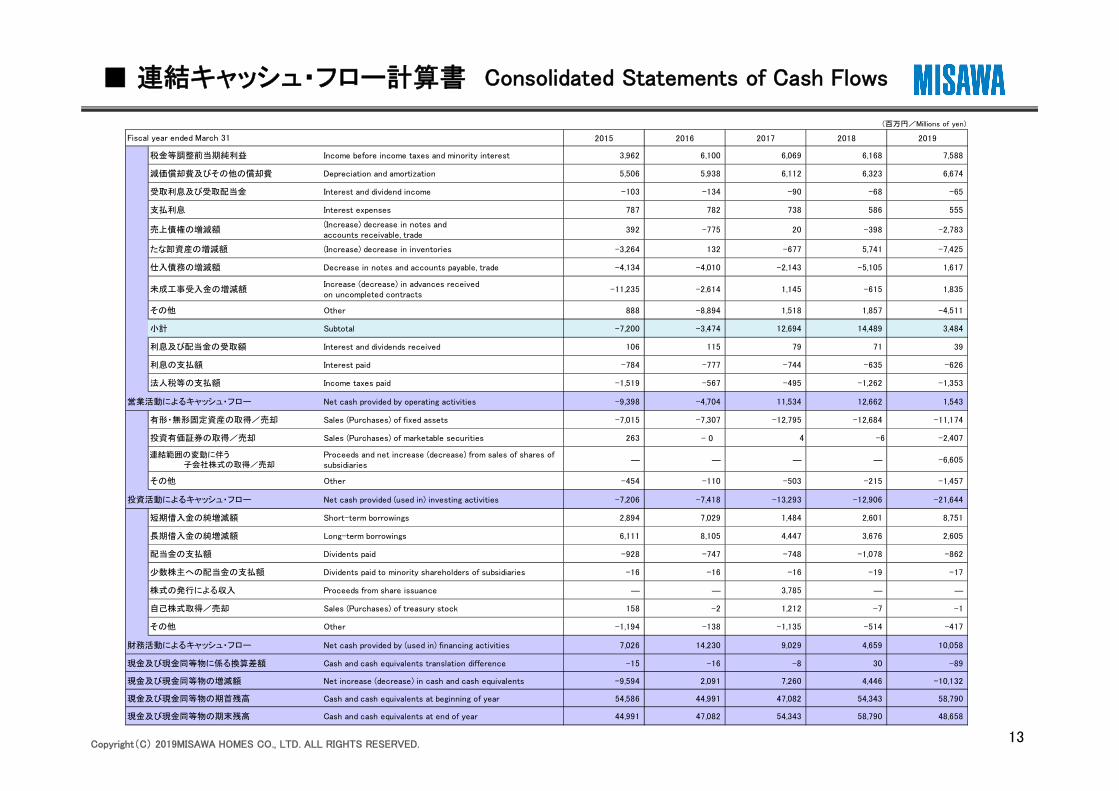
■ 連結キャッシュ・フロー計算書 Consolidated Statements of Cash Flows
13
(百万円/Millions of yen)
2015 2016 2017 2018 2019
税金等調整前当期純利益 Income before income taxes and minority interest 3,962 6,100 6,069 6,168 7,588
減価償却費及びその他の償却費 Depreciation and amortization 5,506 5,938 6,112 6,323 6,674
受取利息及び受取配当金 Interest and dividend income -103 -134 -90 -68 -65
支払利息 Interest expenses 787 782 738 586 555
売上債権の増減額(Increase) decrease in notes andaccounts receivable, trade
392 -775 20 -398 -2,783
たな卸資産の増減額 (Increase) decrease in inventories -3,264 132 -677 5,741 -7,425
仕入債務の増減額 Decrease in notes and accounts payable, trade -4,134 -4,010 -2,143 -5,105 1,617
未成工事受入金の増減額Increase (decrease) in advances receivedon uncompleted contracts
-11,235 -2,614 1,145 -615 1,835
その他 Other 888 -8,894 1,518 1,857 -4,511
小計 Subtotal -7,200 -3,474 12,694 14,489 3,484
利息及び配当金の受取額 Interest and dividends received 106 115 79 71 39
利息の支払額 Interest paid -784 -777 -744 -635 -626
法人税等の支払額 Income taxes paid -1,519 -567 -495 -1,262 -1,353
営業活動によるキャッシュ・フロー Net cash provided by operating activities -9,398 -4,704 11,534 12,662 1,543
有形・無形固定資産の取得/売却 Sales (Purchases) of fixed assets -7,015 -7,307 -12,795 -12,684 -11,174
投資有価証券の取得/売却 Sales (Purchases) of marketable securities 263 4 -6 -2,407
連結範囲の変動に伴う 子会社株式の取得/売却
Proceeds and net increase (decrease) from sales of shares ofsubsidiaries
― ― ― ― -6,605
その他 Other -454 -110 -503 -215 -1,457
投資活動によるキャッシュ・フロー Net cash provided (used in) investing activities -7,206 -7,418 -13,293 -12,906 -21,644
短期借入金の純増減額 Short-term borrowings 2,894 7,029 1,484 2,601 8,751
長期借入金の純増減額 Long-term borrowings 6,111 8,105 4,447 3,676 2,605
配当金の支払額 Dividents paid -928 -747 -748 -1,078 -862
少数株主への配当金の支払額 Dividents paid to minority shareholders of subsidiaries -16 -16 -16 -19 -17
株式の発行による収入 Proceeds from share issuance ― ― 3,785 ― ―
自己株式取得/売却 Sales (Purchases) of treasury stock 158 -2 1,212 -7 -1
その他 Other -1,194 -138 -1,135 -514 -417
財務活動によるキャッシュ・フロー Net cash provided by (used in) financing activities 7,026 14,230 9,029 4,659 10,058
現金及び現金同等物に係る換算差額 Cash and cash equivalents translation difference -15 -16 -8 30 -89
現金及び現金同等物の増減額 Net increase (decrease) in cash and cash equivalents -9,594 2,091 7,260 4,446 -10,132
現金及び現金同等物の期首残高 Cash and cash equivalents at beginning of year 54,586 44,991 47,082 54,343 58,790
現金及び現金同等物の期末残高 Cash and cash equivalents at end of year 44,991 47,082 54,343 58,790 48,658
Fiscal year ended March 31
- 0

Copyright(C) 2019MISAWA HOMES CO., LTD. ALL RIGHTS RESERVED.
Fiscal year ended March 31 2015 2016 2017 2018 2019
有利子負債の残高 (百万円) 61,609 77,269 83,601 89,646 105,412
Interest-bearing liabilities (Millions of yen)
キャッシュ・フロー対有利子負債比率 (年) ― ― 7.2 7.1 68.3
Interest-bearing liabilities/Net cash provided by operating activities (Years)
インタレスト・カバレッジ・レシオ (倍) ― ― 15.5 19.9 2.5
Net cash provided by operating activities/Interest
■ 有利子負債の推移 Changes in Interest-Bearing Liabilities
(連結/Consolidated)
14
Interest-bearing liabilities
Cash and time deposits
備考:2015年3月期及び2016年3月期は営業キャッシュ・フローがマイナスのため、キャッシュ・フロー対有利子負債比率およびインタレスト・カバレッジ・レシオは記載しておりません。
Note:Figures of Interest-bearing liabilities / Net cash provided by operating activities and Net cash provided by operating activities / Interest
for FY2015 and FY2016 are not provided since the operating cash flow is negative.
(百万円/Millions of yen)

Copyright(C) 2019MISAWA HOMES CO., LTD. ALL RIGHTS RESERVED.
■人員の推移 Group Employees
15
□ 従業員数 Breakdown of employees (連結/Consolidated) (人/People)
Fiscal year ended March 31 2015 2016 2017 2018 2019
ミサワホーム Misawa Homes 704 2,325 2,582 2,544 2,605
ディーラー Dealers 7,152 5,074 4,505 4,441 4,364
工場 Factories 900 777 746 740 678
関連会社 Other affiliates 631 1,002 1,084 1,134 1,248
計 Total 9,387 9,178 8,917 8,859 8,895
☐ 営業人員数 Employees in sales (連結/Consolidated) (人/People)
Fiscal year ended March 31 2015 2016 2017 2018 2019
戸建住宅・賃貸住宅 New homes 1,901 1,981 1,799 1,685 1,640
リフォーム Remodeling 996 980 937 907 898
計 Total 2,897 2,961 2,736 2,592 2,538
(人/People)
Fiscal year ended March 31 2015 2016 2017 2018 2019
戸建住宅・賃貸住宅 New homes 2,062 2,118 1,914 1,807 1,758
リフォーム Remodeling 1,064 1,038 1,002 964 953
計 Total 3,126 3,156 2,916 2,771 2,711
備考:契約社員、嘱託社員を含めた数値を掲載しております。
Note: Numbers include contract employees (“Keiyaku shain”) and employees on a yearly contact basis (“ Shokutaku shain”).
☐ 営業人員数 Employees in sales (グループ全体/Misawa Homes Group)

Copyright(C) 2019MISAWA HOMES CO., LTD. ALL RIGHTS RESERVED.
株主数 株式数 出資比率 株主数 株式数 出資比率
No. of shareholders No. of shares % No. of shareholders No. of shares %
名 株 % 名 株 %
個人・その他 Individuals and others 20,002 8,412,061 19.5% 20,763 8,368,552 19.5%
金融機関 Financial institutions 36 7,265,077 16.9% 37 6,823,877 15.8%
銀行・信託銀行 Banks and trust banks 21 4,486,292 10.4% 21 4,106,992 9.5%
生命保険会社 Life insurance companies 8 879,233 2.0% 9 859,433 2.0%
損害保険会社 Nonlife insurance companies 5 1,797,052 4.1% 5 1,797,052 4.1%
その他金融 Other financial institutions 2 102,500 0.2% 2 60,400 0.1%
その他国内法人 Other Japanese companies 510 22,818,623 53.0% 519 22,839,615 53.0%
外国人 Foreigners 148 4,347,448 10.1% 149 4,782,329 11.1%
個人 Individuals 17 2,058 0.0% 17 2,058 0.0%
法人 Companies 131 4,345,390 10.1% 132 4,780,271 11.1%
金融商品取引業者 Financial instruments firms 33 216,028 0.5% 36 245,585 0.6%
保管振替機構名義株式 Shares held by Japan Securities Depository Cent 1 1,210 0.0% 1 1,210 0.0%
自己名義株式 Treasury stock 1 9,716 0.0% 1 8,995 0.0%
計 Total 20,731 43,070,163 100% 21,506 43,070,163 100%
2019年3月31日 2018年9月30日
As of March 31, 2019 As of September 30, 2018
■株式所有者別統計表 Ownership and Distribution of Shares
16

Copyright(C) 2019MISAWA HOMES CO., LTD. ALL RIGHTS RESERVED.
【 2019年3月31日現在 As of March 31, 2019 】
株式数 出資比率
No. of shares %
トヨタホーム株式会社 21,965,898 51.0%
Toyota Housing Corporation
あいおいニッセイ同和損害保険株式会社 1,485,727 3.4%
Aioi Nissay Dowa Insurance Co., Ltd.
日本マスタートラスト信託銀行株式会社(信託口) 1,120,400 2.6%
The Master Trust Bank of Japan, Ltd. (Trust A/C)
MG従業員持株会 973,739 2.2%
Misawa Homes Group Employee Shareholders Association
日本トラスティ・サービス信託銀行株式会社(信託口) 719,100 1.6%
Japan Trustee Services Bank, Ltd. (Trust A/C)
日本生命保険相互会社 609,053 1.4%
Nippon Life Insurance Company
株式会社三菱UFJ銀行 559,912 1.3%
MUFG Bank, Ltd.
DFA INTL SMALL CAP VALUE PORTFOLIO 544,300 1.2%
日本トラスティ・サービス信託銀行株式会社(信託口9) 527,000 1.2%
Japan Trustee Services Bank, Ltd. (Trust A/C9)
GOVERNMENT OF NORWAY 490,200 1.1%
1
2
3
4
5
9
10
8
6
7
株主名Shareholdres
【 2018年9月30日現在 As of September 30, 2018 】
株式数 出資比率
No. of shares %
21,965,898 51.0%
1,485,727 3.4%
917,129 2.1%
841,000 1.9%
611,800 1.4%
609,053 1.4%
559,912 1.2%
527,000 1.2%
490,200 1.1%
449,700 1.0%
トヨタホーム株式会社
Toyota Housing Corporation
あいおいニッセイ同和損害保険株式会社
Aioi Nissay Dowa Insurance Co., Ltd.
MG従業員持株会
DFA INTL SMALL CAP VALUE PORTFOLIO
日本トラスティ・サービス信託銀行株式会社(信託口9)
Japan Trustee Services Bank, Ltd. (Trust A/C9)
日本生命保険相互会社
Nippon Life Insurance Company
株式会社三菱UFJ銀行
MUFG Bank, Ltd.
GOVERNMENT OF NORWAY
Misawa Homes Group Employee Shareholders Association
日本マスタートラスト信託銀行株式会社(信託口)
The Master Trust Bank of Japan, Ltd. (Trust A/C)
日本トラスティ・サービス信託銀行株式会社(信託口)
Japan Trustee Services Bank, Ltd. (Trust A/C)
1
2
3
4
5
9
10
8
株主名Shareholdres
6
7
■大株主一覧 Major Shareholders
17