financial distress prediction based on or-cbr in the principle of k-nearest neighbors
TRANSCRIPT

Available online at www.sciencedirect.com
www.elsevier.com/locate/eswa
Expert Systems with Applications 36 (2009) 643–659
Expert Systemswith Applications
Financial distress prediction based on OR-CBR in the principleof k-nearest neighbors
Hui Li, Jie Sun *, Bo-Liang Sun
School of Business Administration, Zhejiang Normal University, sub-mailbox 91# in P.O. Box 62# at YingBinDaDao 688#,
Jinhua 321004, Zhejiang Province, PR China
Abstract
Financial distress prediction including bankruptcy prediction has called broad attention since 1960s. Various techniques have beenemployed in this area, ranging from statistical ones such as multiple discriminate analysis (MDA), Logit, etc. to machine learning oneslike neural networks (NN), support vector machine (SVM), etc. Case-based reasoning (CBR), which is one of the key methodologies forproblem-solving, has not won enough focus in financial distress prediction since 1996. In this study, outranking relations (OR), includingstrict difference, weak difference, and indifference, between cases on each feature are introduced to build up a new feature-based similaritymeasure mechanism in the principle of k-nearest neighbors. It is different from traditional distance-based similarity mechanisms andthose based on NN, fuzzy set theory, decision tree (DT), etc. Accuracy of the CBR prediction method based on OR, which is calledas OR-CBR, is determined directly by such four types of parameters as difference parameter, indifference parameter, veto parameter,and neighbor parameter. It is described in detail that what the model of OR-CBR is from various aspects such as its developed back-ground, formalization of the specific model, and implementation of corresponding algorithm. With three year’s real-world data fromChinese listed companies, experimental results indicate that OR-CBR outperforms MDA, Logit, NN, SVM, DT, Basic CBR, and GreyCBR in financial distress prediction, under the assessment of leave-one-out cross-validation and the process of Max normalization. Itmeans that OR-CBR may be a preferred model dealing with financial distress prediction in China.� 2007 Elsevier Ltd. All rights reserved.
Keywords: Financial distress prediction; Case-based reasoning; Outranking relations; k-nearest neighbors
1. Introduction
With the development of Chinese economy and its impacton globalization of economy, Chinese listed companies haveentered into lots of global supply chains. To control the costof the whole supply chain, lots of notable internationalenterprises, such as General Motor, Volkswagen, Dell,Cisco, Hitachi, Sony, etc. have also set up factories in China.While, enterprises that fail to struggle in the competitivebusiness environment might run into bankrupt. It not onlybrings individual loss to its stockholders, creditors, manag-ers, employees, etc., but also shocks the whole country’s,even the world’s, economic development, if lots of enter-
0957-4174/$ - see front matter � 2007 Elsevier Ltd. All rights reserved.
doi:10.1016/j.eswa.2007.09.038
* Corresponding author. Tel.: +86 134 5494 2829.E-mail addresses: [email protected] (H. Li), [email protected] (J. Sun).
prises fall into bankrupt at one time. Hence, it is a valuableand applicable area to research how to control bankruptcy.
While, bankruptcy is not just happened by accident buta continuously developed process that covers a period oftime. Most enterprises that ran into bankruptcy had expe-rienced financial distress, which usually have some symp-toms indicated by company’s account items. It issignificant to explore effective financial distress predictionmodels with various classification and prediction tech-niques. There exist lots of literatures on bankruptcy andfinancial distress prediction with research methodologytypically ranging from statistical ones such as multiple dis-criminate analysis (MDA) (Altman, 1968; Taffler, 1982;Altman, Marco, & Varetto, 1994), Logit (Martin, 1977;Ohlson, 1980; Andres, Landajo, & Lorca, 2005), etc., tomachine learning methods such as neural networks (NN)(Odom & Sharda, 1990; Tam & Kiang, 1992; Altman

644 H. Li et al. / Expert Systems with Applications 36 (2009) 643–659
et al., 1994; Boritz & Kennedy, 1995; Barniv, Anurag, &Leach, 1997; Ahn, Cho, & Kim, 2000; Liang & Wu,2005), support vector machine (SVM) (Shin, Lee, & Kim,2005; Min & Lee, 2005; Min, Lee, & Han, 2006; Hui &Sun, 2006; Wu, Tzeng, & Goo, 2007; Hua, Wang, & Xu,2007; Ding, Song, & Zen, 2007), decision tree (DT) (Fryd-man, Altman, & Kao, 1985; Sun & Li, 2007a), etc., and tomulti-classifier models by combining different classifiers (Jo& Han, 1996; Lin & McClean, 2001; Sun & Li, 2007b).
Case-based reasoning (CBR) was demonstrated to beone of the key methodologies employed in the developmentof knowledge-based systems in the last decade (Liao, 2005).Such knowledge-based systems are human-centered com-puter programs by emulating the problem-solving behav-iors of experts (Humphreys, McIvor, & Chan, 2003; Pal& Shiu, 2004). Capturing experts’ knowledge and theirproblem-solving logics in the real-world problems is oneof the key contents involved. The basic idea of CBR is toutilize solutions of previous problems to solve new prob-lems (Schank, 1982; Waheed & Adeli, 2005; Schmidt &Vorobieva, 2006). In CBR, experts’ knowledge is storedin case library in the form of cases for users to call onfor specific advice as needed. Experts’ knowledge is alwaysqualitative and even quantification value of experts’ knowl-edge is subject to imprecision, uncertainty and inconsis-tency. Hence, when structuring the unstructured experts’knowledge into the form of cases and storing them in caselibrary, experts’ knowledge hides in the corresponding rela-tionships between cases and their results, which are classeswhen employing CBR in financial distress prediction whichbelongs to the problem of classification.
While, comparing with abundant literatures focusing onfinancial distress prediction based on MDA, Logit, SVM,NN, etc. (Kumar & Ravi, 2007), there are a few studies (Jo& Han, 1996; Bryant, 1997; Jo, Han, & Lee, 1997; Park &Han, 2002; Yip, 2004) that have paid attention to CBR-based classification in financial distress prediction. Andalmost all the foregoing research employed traditional fea-ture-based similarity measure mechanism of CBR based onEuclidean distance, which is named as Basic CBR in thisresearch. CBR was outperformed by or outperformed theother models they used with data they collected. Lately,Sun and Hui (2006) refocused on employing CBR in finan-cial distress prediction with data from Chinese listed compa-nies using an improved similarity measure mechanism. Theyintegrated CBR with weighted voting on the basis of a simi-larity measure mechanism by way of introducing grey rela-tionship degrees into the Euclidean distance metric.Experimental research with data from Chinese listed compa-nies comparing the new proposed model with MDA, Logit,NN, and SVM, demonstrates that Grey CBR in the principleof k-nearest neighbors they proposed is more applicable inthe prediction for enterprises which might probably run intofinancial distress in less than two years.
In this research, outranking relations are introduced toimprove similarity measure mechanism of CBR, and a newCBR-based classifier based on outranking relations, which
is named as OR-CBR, is built up to predict financial distress.Experimental results indicate that OR-CBR is more accu-rate when dealing with financial data set from Chinese listedcompanies comparing with MDA, Logit, NN, SVM, DT,Basic CBR, and Grey CBR, under the assessment of leave-one-out cross-validation and the process of Max normaliza-tion. The breakdown of this research is divided into five sec-tion. Section 2 is a description on research background.Section 3 builds up the model of OR-CBR in the principleof k-nearest neighbors. And an empirical experiment carrieson with data from Chinese listed companies to make a com-parative analysis between OR-CBR and other predictionmodels in Section 4. Section 5 makes conclusions.
2. Research background
2.1. Basic mechanism of similarity measure
Case retrieval process is a major step researched in CBRcycle (Aamodt & Plaza, 1994; Finnie & Sun, 2003), inwhich similarity measure mechanism among cases is itscore. Similarity measure mechanism greatly influencesretrieval performance in the process. The basic assumptionof similarity is that target case is dealt with by resorting toa previous situation with common conceptual features(Smyth & Keane, 1998; Pal & Shiu, 2004). A CBR systemdescribes a concept C implicitly by a pair (CB, sim), inwhich the concept of similarity plays a pivotal role. Tver-sky (1977) firstly defined the degree of similarity betweencase a and b as a ratio, whose numerator is the numberof common features between a and b, and whose denomi-nator is the total number of features. It denotes as follows:
SIMða; bÞ
¼ common features between a and bcommon and different features between a and b
ð1Þ
Assumptions of the definition are as follows:
• Memberships of features are bivalent.• Features are taken as equal importance.
With the development of CBR, the most common usedmethod nowadays in computing relatedness among cases isweighted feature-based similarity. Given a target case a,weight for the kth feature can be denoted as wk. Similaritybetween target case a and stored case b can be computed bythe following mechanism.
SIMðwÞða; bÞ ¼Xm
k¼1
wk � simðak; bkÞ ð2Þ
where m is the number of features, ak is the value of kthfeature for target case, bk is the value of kth feature forstored case. And the similarity on feature k between thetwo cases can be defined as follows:

simðak; bkÞ ¼
0 if the kth feature
is symbolic=qualitative and ak – bk
1 if the kth feature
is symbolic=qualitative and ak ¼ bk
1� jnormðakÞ � normðbkÞj if the kth feature is continuous
8>>>>>><>>>>>>:
ð3Þ
H. Li et al. / Expert Systems with Applications 36 (2009) 643–659 645
where norm(ak) and norm(bk) represent the normalized fea-ture values of ak and bk. Similarity value of two cases is al-ways becoming bigger with distance value between thembecoming smaller. In Formula (3), similarity value of twocases is defined as distance value subtracted by 1. Andthe distance mechanism employed is called Manhattan dis-tance. Of course, there are some other similarity computingmechanisms such as distance value divided by 1 usingEuclidean distance. While, the disposal approach is similar.The similarity mechanism based on weighted Euclideandistance is shown as follows:
SIMða; bÞ ¼X
simðwÞðak; bkÞ
¼ 1
1þ aðP
w2 � jnormðakÞ � normðakÞj2Þ0:5ð4Þ
The ratio proposed by Tversky (1977) is a particularinstance of weighted feature-based similarity of commonused mechanism. When taking distance measure,dis(ak,bk) = j norm(ak) � norm(bk)j, into considerationdirectly, the distance measure for the kth feature has thefollowing properties.
• dis(ak,bk) = 0 if and only if ak = bk.• dis(ak,bk) = dis(bk,ak).• dis(ak,ck) 6 dis(ak,bk) + dis(bk,ck).
On the foundation of the mechanism of weighed feature-based similarity, the principle of k-nearest-neighbor and itsderivatives, the most commonly used retrieval technique byfar, have been developed.
When carrying out further research on similarity mea-sure mechanism or even on CBR, whether CBR is a tech-nology like rule-based reasoning, NN or it is betterdescribed as a methodology for problem-solving had bet-ter be made clear. Because it determines what is beingresearched and how the research can be carried on.Kolodner (1993) first proposed the question and believedthat CBR is both a cognitive model and a method ofbuilding intelligent systems. After describing four applica-tions of CBR, which variously use the technology of near-est neighbor (Price & Pegler, 1995), induction such as ID3(Heider, 1996), fuzzy logic (Leake, 1996), and databasetechnology (Cheetham & Graf, 1997), Watson (1999)educed the conclusion that CBR is a methodology andnot a technology.
Because there are no technologies in CBR, any technol-ogies or approaches can be introduced into the CBR life-
cycle. Pal and Shiu (2004) believed that it was hard toachieve a quantum jump in CBR by just using traditionalcomputing and reasoning methods. In fact, the technologyaggregate of soft computing (Zadeh, 1965, 1994), includingNN, genetic algorithm, fuzzy set theory, etc., has alreadybeen introduced into it to accelerate the development ofCBR. Hence, the stage of soft CBR (SCBR) has alreadycome (Pal & Shiu, 2004). Soft computing techniques helpCBR systems to reasoning with uncertainty and impreci-sion, which are very useful to enhance its problem-solvingability. As a matter of fact, there may be some other tech-nologies and approaches that can urge the development ofCBR, such as outranking relations (Roy, 1971; Roy &Vincke, 1984; Roy, 1991; Roy, 1996; Roy & Słowinski,2007). In this research, we deal with how outranking rela-tions can be used to extend traditional weighted feature-based similarity computation in the principle of k-nearestneighbors.
At the same time, there are some other similarity mea-sure mechanisms like fuzzy similarity by introducing fuzzyset theory into case matching, DT mechanism, NN mecha-nism, etc. (Pal & Shiu, 2004). While, the fuzzy similaritymechanism is to handle linguistic memberships as low,me-
dium and high of features. The object of this research is stillnumerical memberships of features. Thus, discussion aboutthe similarity measure mechanism of fuzzy similarity isbeyond this research. For the other similarity mechanismsby introducing DT and NN, we will carry on an experimentto compare prediction accuracies of OR-CBR and predic-tive models directly developed by DT and NN.
2.2. Outranking relations
Outranking relation methods, which are called ELEC-TRE and others, in which an outranking relation betweenalternatives is constructed from pseudo-criteria, have beendeveloped so far. In order to deal with conflicting multi-cri-teria in complex systems and numerical values of alterna-tive of some criteria subject to imprecision, uncertainty,and incompleteness, Roy et al. (Roy, 1971; Roy & Vincke,1984; Roy, 1991; Roy, 1996; Roy & Słowinski, 2007) devel-oped the concept of pseudo-criterion and its indifference,preference, and veto thresholds.
Considering two alternatives a and b, and m criteria gk
(k = 1,2, . . .,m), Let gk(a) and gk(b), respectively denotethe kth criteria value of alternative a and b. It is assumedthat larger value is preferred to smaller one. Consideringthe assertion that b is outranked by a. gk (a) > gk(b)

646 H. Li et al. / Expert Systems with Applications 36 (2009) 643–659
expresses that a is preferred to b according to the kth crite-ria, and gk(a) = gk(b) expresses that a is indifferent to b
according to the kth criteria. Then, gk is called as a truecriteria.
In presence of impression, uncertainty, and so on, it isreasonable to admit that if gk(a) � gk(b) is small enough,a and b can be regarded as indifferent. By introducing anindifference threshold qk, gk(a) � gk(b) > qk expresses thata is preferred to b, and gk(a) � gk(b) 6 qk expresses that a
is indifferent to b. Thus, gk is called a semi-criteria.To avoid an abrupt change from strict preference to
indifference, a preference threshold pk (pk > qk) is intro-duced. If gk(a) – gk(b) 6 qk, a and b are considered indiffer-ence. If gk(a) � gk(b) > pk, a is considered strict preferred tob. The case qk < gk(a) � gk(b) 6 pk is then considered as ahesitation between indifference and preference, which iscalled weak preference. Then, gk is called a pseudo-criteria.
Considering the same assertion ‘b is outranked by a’, foreach pseudo-criterion gk, an outranking relation index ofck(a, b) is defined as follows:
ckða; bÞ ¼ 1; if gkðaÞ � gkðbÞ > pk ð5Þckða; bÞ ¼ 0; if jgkðaÞ � gkðbÞj 6 qk ð6ÞOtherwise; ckða; bÞ 2 ½0; 1Þ ð7Þ
Thus the concordance index of a outranks b is defined asfollows:
Cða; bÞ ¼ Rwk � ckða; bÞ ð8Þ
On the other hand, by introducing a veto threshold vk
for each criterion gk, a discordance index dk(a, b) whichrejects the assertion’a outranks b’ is defined as follows:
dkða; bÞ ¼ 1; if gkðbÞ � gkðaÞ > vk ð9Þdkða; bÞ ¼ 0; if gkðbÞ � gkðaÞ 6 pk ð10ÞOtherwise; dkða; bÞ 2 ð0; 1� ð11Þ
The degree of credibility of ’b is outranked by a’ isdefined as follows:
Sða; bÞ ¼ Cða; bÞ ¼ Rwk � ckða; bÞ ifdkða; bÞ 6 Cða; bÞ8k:ð12Þ
Sða; bÞ ¼ Cða; bÞ Pk2Kða;bÞ
1� dkða; bÞ1� Cða; bÞ ð13Þ
where K(a, b) is the set of criteria for which dk(a, b) >C(a, b).
3. Prediction model of OR-CBR
There are three steps when employing CBR into predic-tion, which are listed as follows:
• Identifying significant features to describe a case.• Collecting similar cases in case library to target case
grounded on significant features.• Predicting the class of target case based on classes of
similar cases.
This process of prediction is often called as forecasting-by-analogy (Jo & Han, 1996). It can be found that similar-ity measure mechanism is the foundation of such CBR-based classification as financial distress prediction. And itis the core of Sun and Hui’s (2006) research when buildinga new model of similarity weighted voting CBR for finan-cial distress prediction by introducing grey relationshipdegrees. Reasoning structure of the model of OR-CBR infinancial distress prediction is shown as Fig. 1. The coreof OR-CBR in financial distress prediction is matchingsimilar cases to target case. By introducing outranking rela-tions into weighted feature-based similarity measure mech-anism, similarity measuring matrix is transformed intoconcordance indices matrix and discordance indicesmatrix, based on which case matching carries on.
For such CBR-based classification problems as financialdistress prediction, cases are divided as at least two classes,which can be denoted as t (t 2 N, t P 1). The aim of CBR-based classifier is to predict which class the target casebelongs to. Prediction of OR-CBR is on the foundationof distance measure that is based on the location of objectsin Manhattan space. It can be expressed in the followingmanner. Let CB = {(c1, t1), (c2, t2), . . ., (cn, tn)} denote a caselibrary having n cases. Each case can be identified by a setof corresponding features, which can be expressed asF = {Fk} (k = 1,2, . . .,m). The ith case ci in case base canbe represented as an m-dimensional vector, ci = (xi1, xi2,. . ., xi m), where xi k corresponds to the value of featureFk (1 6 k 6 m) of case ci. Let the weight of each featureFk be expressed as wk (wk 2 [0, 1]). When the technologyof outranking relations is introduced to improve similaritycomputation in the building-up of OR-CBR, the main dif-ference between OR-CBR and Basic CBR is the mecha-nism in dealing with distance computation.
3.1. OR-CBR in the principle of nearest neighbor
When introducing outranking relations into CBR tobuild up a new similarity measure mechanism, the assertionthat a is indifferent to b is employed because similarityoften means that there are little difference between twoentities. The main definitions of nearest-neighbor OR-CBR classifier are as follows:
Definition 1 (Standardization). That means to standardizeinput data of the OR-CBR classifier into the range of [0,1]or [�1,1]. " target case c0, " ci 2 CB, " Fk 2 F, $ x0k 2 c0,$ xik 2 ci. It can be supposed that value is more preferred ifit is bigger. The standardization process for the range of[�1,1] can be denoted as
xik ¼xik
maxkjxikjði ¼ 0; 1; 2; � � � ; n; k ¼ 1; 2; � � � ;mÞ ð14Þ
where, maxk xik represents the maximum value of featureFk among all stored cases and target question case. xik de-notes the value of case ci at feature Fk. So after standardi-zation, it is clear that xik 2 [�1, 1].
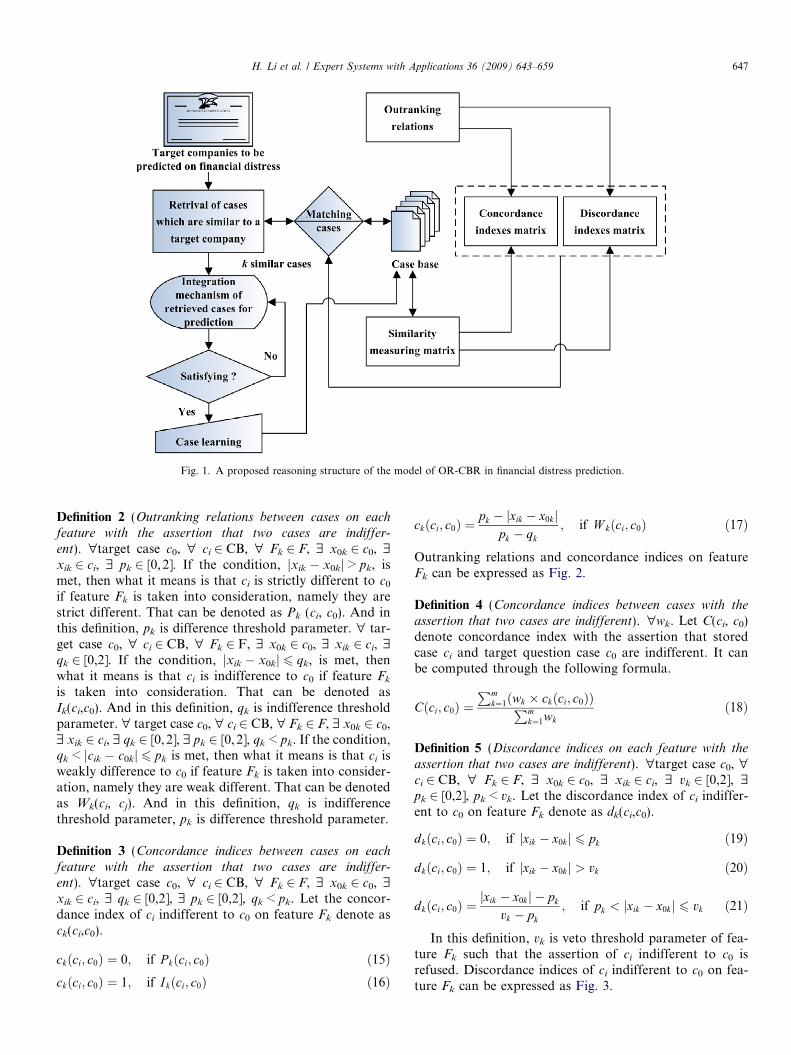
Fig. 1. A proposed reasoning structure of the model of OR-CBR in financial distress prediction.
H. Li et al. / Expert Systems with Applications 36 (2009) 643–659 647
Definition 2 (Outranking relations between cases on each
feature with the assertion that two cases are indiffer-
ent). "target case c0, " ci 2 CB, " Fk 2 F, $ x0k 2 c0, $xik 2 ci, $ pk 2 [0,2]. If the condition, jxik � x0kj > pk, ismet, then what it means is that ci is strictly different to c0
if feature Fk is taken into consideration, namely they arestrict different. That can be denoted as Pk (ci, c0). And inthis definition, pk is difference threshold parameter. " tar-get case c0, " ci 2 CB, " Fk 2 F, $ x0k 2 c0, $ xik 2 ci, $qk 2 [0,2]. If the condition, jxik � x0kj 6 qk, is met, thenwhat it means is that ci is indifference to c0 if feature Fk
is taken into consideration. That can be denoted asIk(ci,c0). And in this definition, qk is indifference thresholdparameter. " target case c0, " ci 2 CB, " Fk 2 F, $ x0k 2 c0,$ xik 2 ci, $ qk 2 [0,2], $ pk 2 [0, 2], qk < pk. If the condition,qk < jcik � c0kj 6 pk is met, then what it means is that ci isweakly difference to c0 if feature Fk is taken into consider-ation, namely they are weak different. That can be denotedas Wk(ci, cj). And in this definition, qk is indifferencethreshold parameter, pk is difference threshold parameter.
Definition 3 (Concordance indices between cases on each
feature with the assertion that two cases are indiffer-ent). "target case c0, " ci 2 CB, " Fk 2 F, $ x0k 2 c0, $xik 2 ci, $ qk 2 [0,2], $ pk 2 [0,2], qk < pk. Let the concor-dance index of ci indifferent to c0 on feature Fk denote asck(ci,c0).
ckðci; c0Þ ¼ 0; if P kðci; c0Þ ð15Þckðci; c0Þ ¼ 1; if Ikðci; c0Þ ð16Þ
ckðci; c0Þ ¼pk � jxik � x0kj
pk � qk
; if W kðci; c0Þ ð17Þ
Outranking relations and concordance indices on featureFk can be expressed as Fig. 2.
Definition 4 (Concordance indices between cases with the
assertion that two cases are indifferent). "wk. Let C(ci, c0)denote concordance index with the assertion that storedcase ci and target question case c0 are indifferent. It canbe computed through the following formula.
Cðci; c0Þ ¼Pm
k¼1ðwk � ckðci; c0ÞÞPmk¼1wk
ð18Þ
Definition 5 (Discordance indices on each feature with the
assertion that two cases are indifferent). "target case c0, "ci 2 CB, " Fk 2 F, $ x0k 2 c0, $ xik 2 ci, $ vk 2 [0,2], $pk 2 [0,2], pk < vk. Let the discordance index of ci indiffer-ent to c0 on feature Fk denote as dk(ci,c0).
dkðci; c0Þ ¼ 0; if jxik � x0kj 6 pk ð19Þ
dkðci; c0Þ ¼ 1; if jxik � x0kj > vk ð20Þ
dkðci; c0Þ ¼jxik � x0kj � pk
vk � pk
; if pk < jxik � x0kj 6 vk ð21Þ
In this definition, vk is veto threshold parameter of fea-ture Fk such that the assertion of ci indifferent to c0 isrefused. Discordance indices of ci indifferent to c0 on fea-ture Fk can be expressed as Fig. 3.

Fig. 2. Outranking relations and indifference concordance indices of c to c on feature F .
648 H. Li et al. / Expert Systems with Applications 36 (2009) 643–659
Definition 6 (Similarity between cases on the basis of con-
cordance indices and discordance indices). " target case c0," ci 2 CB, " Fk 2 F. Based on concordance indices and dis-cordance indices on each feature, similarity measurebetween stored case ci and target case c0 is defined as thecredibility degree of indifference between them based onELECTRE.
SIMðwÞi;0 ¼ SIMðwÞðci; c0Þ ¼ Cðci; c0Þ if dkðci; c0Þ
6 Cðci; c0Þ8k ð22Þ
SIMðwÞi;0 ¼ SIMðwÞðci; c0Þ ¼ Cðci; c0Þ P
k2Kðci ;c0Þ
1� dkðci; c0Þ1� Cðci; c0Þ
ð23Þ
where K(ci,c0) is the set of criteria for which dk(ci,c0) >C(ci,c0).
There are three characteristics, which the similaritymeasure mechanism based on outranking relations meets,shown as follows:
• SIMðwÞi;0 P 0.
Proof
[{] ck(ci,c0) P 0;[)] Based on Formula(18), C(ci, c0) P 0;[)] Based on Formula(22), SIM
ðwÞi;0 P 0;
[)] 1 P ck(ci,c0) P 0 and 0 P dk(ci,c0) P 0;[)] Based on Formula(23), SIMðwÞ
i;0 P 0.
i 0 k
• SIMi;i P SIMi;0 .
ðwÞ ðwÞProof
[{] ck(ci, ci) = 1 and dk(ci, ci) = 0;
[)] Based on Formula(18), C(ci, ci) = 1; Based onFormula(22), SIMðwÞ
i;i ¼ 1.[)] 1 P ck(ci,c0) P 0 and 0 P dk(ci,c0) P 0;
[)] Based on Formula(18), 0 6 C(ci, ci)6 1;
[)] Based on Formula(22), 0 6 SIMðwÞi;0 6 1;
[)] In Formula(23), dk(ci,c0) > C(ci,c0);
[)] 0 6 (1-dk(ci,c0))/(1-C(ci,c0)) < 1;[)] Based on Formula(23), 0 6 SIMðwÞ
i;0 6 1;[)] SIM
ðwÞi;i P SIM
ðwÞi;0 .
• SIMðwÞi;0 ¼ SIMðwÞ
0;i .
Proof
[{] Pk(ci, c0) = Pk (c0, ci), Ik(ci, c0) = Ik (c0, ci), andWk (ci, c0) =Wk (c0, ci);[)] ck(ci, c0) = ck(c0,ci) and dk(ci,c0) = dk(c0,ci);[)] Whether in Formula(22) or in Formula(23),SIM ðwÞ
i;0 ¼ SIM ðwÞ0;i .
Definition 7 (Predicting the class of target case in the
principle of nearest neighbor). Suppose that c* denotes thenearest neighbor case, whose corresponding value of classis represented as t*. Then the class value of the nearestneighbor case is taken as predicted class value of targetcase, i.e. t0 = t*.

Fig. 3. Discordance indices of ci indifferent to cj on feature Fk.
H. Li et al. / Expert Systems with Applications 36 (2009) 643–659 649
3.2. OR-CBR in the principle of k-nearest neighbors
When the principle of k-nearest neighbors is employed,the class values of the k-nearest neighbor cases are inte-grated to predict the class value of target case by similarityweighted voting technology. It means that there is a differ-ent prediction mechanism employed than that of Definition7.
Definition 8 (Predicting the class of target case in the
principle of k-nearest neighbors). Given the neighborparameter denoted as per, similarity threshold T isoften set as the neighbor parameter per multiplies themaximum similarity between target case and all storedcases.
T ¼ per �maxðSIMðwÞi;0 Þ ð24Þ
Suppose ci* denotes one of the k-nearest neighbor cases,according to k-nearest neighbors principle, stored caseswhose similarity value with target case are bigger than orequal to T constitute a case set ofk-nearest neighbors totarget case, denoted by C*.
C� ¼ fci�jSIMðwÞi�;0 P Tg ði� ¼ 1; 2; . . . ; kÞ ð25Þ
In classification problem, the class value of target case c0
is predicted by those of the k most similar cases. Supposecorresponding class value of ci* is represented as ti*, andits similarity with target case c0 is represented as SIM
ðwÞi�;0.
The similarity weighted voting probability of target casec0 belonging to the class tl is defined as prob(tl).
probðtlÞ ¼P
ti�¼tlSIMðwÞ
i�;0Pki�¼1SIMðwÞ
i�;0ðl ¼ 1; 2; . . . ; LÞ ð26Þ
In which, the denominator is the sum of similarity betweentarget case c0 and all k-nearest neighbor cases. The numer-ator is the sum of similarity between target case c0 andthose k-nearest neighbor cases whose class values equalto tl. Let the class value of target case c0 denote as t0.According to the combination principle of formula (28),the final value of t0 is the class t*, whose similarity weightedvoting probability is the biggest among all classes.
t0 ¼ t� if probðt�Þ ¼ maxL
l¼1ðprobðtlÞÞ ð27Þ
When there are only two classes, the mechanism can besimplified as the following formula.
t0 ¼t1 if probðt1ÞP probðt2Þt2 if probðt2ÞP probðt1Þ
�ð28Þ
3.3. Algorithm description of OR-CBR in financial distress
prediction
The main difference between similarity measuring mech-anism of OR-CBR and other feature-weighted ones such asBasic CBR and Grey CBR is shown as Fig. 4.
In Basic CBR, similarity is computed directly throughdistance matrix between memberships of target case andstored cases on each feature. The most widely used is Ham-ming distance and Euclidean distance. In Grey CBR, grey
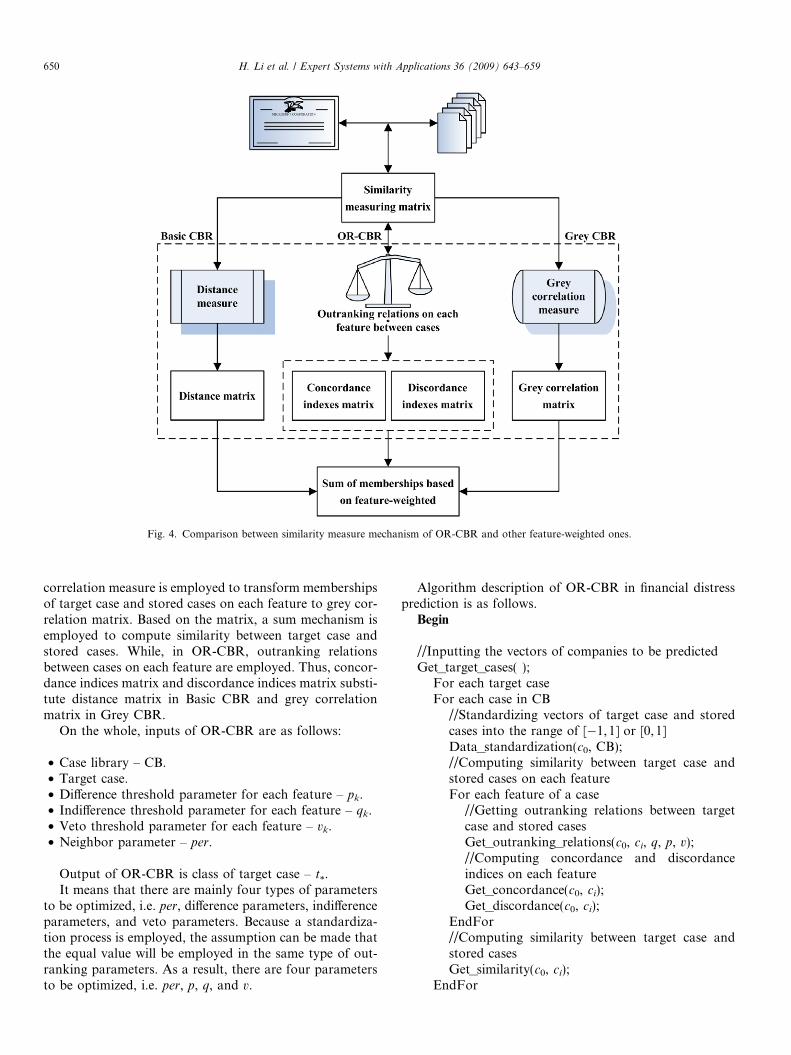
Fig. 4. Comparison between similarity measure mechanism of OR-CBR and other feature-weighted ones.
650 H. Li et al. / Expert Systems with Applications 36 (2009) 643–659
correlation measure is employed to transform membershipsof target case and stored cases on each feature to grey cor-relation matrix. Based on the matrix, a sum mechanism isemployed to compute similarity between target case andstored cases. While, in OR-CBR, outranking relationsbetween cases on each feature are employed. Thus, concor-dance indices matrix and discordance indices matrix substi-tute distance matrix in Basic CBR and grey correlationmatrix in Grey CBR.
On the whole, inputs of OR-CBR are as follows:
• Case library – CB.• Target case.• Difference threshold parameter for each feature – pk.• Indifference threshold parameter for each feature – qk.• Veto threshold parameter for each feature – vk.• Neighbor parameter – per.
Output of OR-CBR is class of target case – t*.It means that there are mainly four types of parameters
to be optimized, i.e. per, difference parameters, indifferenceparameters, and veto parameters. Because a standardiza-tion process is employed, the assumption can be made thatthe equal value will be employed in the same type of out-ranking parameters. As a result, there are four parametersto be optimized, i.e. per, p, q, and v.
Algorithm description of OR-CBR in financial distressprediction is as follows.
Begin
//Inputting the vectors of companies to be predictedGet_target_cases( );
For each target case
For each case in CB//Standardizing vectors of target case and storedcases into the range of [�1,1] or [0,1]Data_standardization(c0, CB);//Computing similarity between target case andstored cases on each featureFor each feature of a case
//Getting outranking relations between targetcase and stored casesGet_outranking_relations(c0, ci, q, p, v);//Computing concordance and discordanceindices on each featureGet_concordance(c0, ci);Get_discordance(c0, ci);
EndFor//Computing similarity between target case andstored casesGet_similarity(c0, ci);
EndFor

H. Li et al. / Expert Systems with Applications 36 (2009) 643–659 651
//Searching k nearest neighbors, which companies aresimilar to the target case on features employed, in CB
Get k casesðper;maxðSIMðwÞi;0 ÞÞ;
//Predicting class of target company based on votingmechanism of the k-nearest neighborsPrediction([ci]);
EndFor
End
Because there are four parameters in OR-CBR, i.e. q,p, v, and per, they have to be optimized before carryingon prediction. On the basis of the R4 model of CBR(Aamodt & Plaza, 1994; Finnie & Sun, 2003; Pal & Shiu,2004), working flows of OR-CBR prediction and parame-ters optimization are shown in Fig. 5. Firstly, parametersof OR-CBR should be optimized to assure a more accu-rate prediction. In the parameters optimization process,cross validation is utilized. Cases in case library aredivided into several shares. Each time taking out oneshare as target cases, and the rest act as case base. Inthe retrieval process of CBR, outranking parameters, i.e.q, p, and v, and neighbor parameter per are inputted into
Fig. 5. Working flow of OR-CBR pred
OR-CBR. Based on final feature sets employed, similari-ties are computed and the k-nearest neighbors areretrieved. In the reuse process of CBR, class values ofthe k-nearest neighbors are used to predict class value ofa target case, which is the suggested class value of a targetcase. In the revision process of CBR, real class value ofthe target case is utilized to evaluate the prediction accu-racy. It is circulated till the optimal parameters have beensearched. Then, the new company can be predicted withoptimal parameters. In retrieval process, k-nearest neigh-bors are retrieved from case library. In the reuse process,class values of the cases retrieved are employed to predictclass value of target company, and a suggested class valueof target company is obtained. If the new case should bestored in case library, then the process of retaining carrieson.
4. Experiment with real-world data
There are a set of in-order approaches carried out, i.e.data collection, data preprocessing, feature extraction,modeling, and assessment. The framework of the experi-ment is shown as Fig. 6.
iction and parameters optimization.

652 H. Li et al. / Expert Systems with Applications 36 (2009) 643–659
4.1. Data collection
The data sample consists of financial data from Chineselisted companies. The companies are grouped into twotypes: specially treated (ST) companies and normal ones.A company is specially treated in China because it hashad negative net profit in continuous two years or for someother reasons. In this research, all the data samples of STcollected are those for negative net profit in continuoustwo years. Companies’ financial state are divided intotwo classes according to whether the company is speciallytreated or not. They are as follows:
• Normal company.• Distressed company.
Companies that never be specially treated are regardedhealthy and ST companies are regarded financial distress.Sample data, whether they are distressed or not, arethose listed companies on the Shanghai Stock Exchangeand Shenzhen Stock Exchange. While the distressed com-panies in this study are of those 1, 2, 3 year prior to runinto distress. That is to say, three scheduling datasets are
Fig. 6. Framework of the
employed in the research. Let the year when a companyis specially treated because of negligible value be denotedas the year t, then, t-1 represent one year prior ST, t-2represent two years prior ST, and t-3 represent threeyears prior ST. In OR-CBR, the three datasets are trea-ted as three case libraries. Data were collected from 135pairs of listed companies over the span of 2000–2005.Features employed are account items from both balancesheet and income statement. The 35 initial features coverprofitability, activity ability, debt ability and growthability.
4.2. Data preprocessing
The main function of data preprocessing approach, is toeliminate missing data and outliers of the three data sets.Operation principle are listed as follows:
• Transforming the three data sets into three tables, whichtake the role of case libraries.
• Filtering out duplicated data.• Eliminating samples that missing at least one feature
data.
empirical experiment.

Table 3Statistic characteristics of the three sample data sets
X Mean(normal)
S.D.(normal)
Mean(distress)
S.D.(distress)
t-statistic
Significance(two-tailed)
X11 0.2745 0.4003 0.6033 0.2055 �6.420 0.000c
X12 0.6804 0.1594 0.4296 0.1598 9.531 0.000c
X13 �0.1064 0.2681 0.1452 0.1828 �6.550 0.000c
X14 �0.6008 0.2637 0.1201 0.5175 �10.397 0.000c
H. Li et al. / Expert Systems with Applications 36 (2009) 643–659 653
• Excluding samples with feature data deviating from themean no less than three times of standard deviation.
• Excluding samples with feature data that are obviouslyoutliers.
After the approach of data preprocessing, details ofsample data sets are shown in Table 1.
X21 �0.0594 0.0499 0.0251 0.0815 �9.044 0.000c
X22 �0.1018 0.1651 0.0656 0.1790 �7.008 0.000c
X23 �0.1510 0.1044 0.0477 0.2558 �7.358 0.000c
X24 6.3643 20.8226 13.1412 10.4627 �2.957 0.004c
X25 0.5271 0.8272 1.2155 0.4841 �7.307 0.000c
X26 1.8974 7.4806 3.5390 2.9056 �2.079 0.040b
X27 0.5533 0.1427 0.4160 0.1496 6.773 0.000c
X31 0.5990 0.7774 1.1298 0.4063 5.676 0.000c
X32 2.4380 7.5598 3.9247 3.6994 1.670 0.095a
X33 0.0220 0.3048 0.2060 0.1735 4.922 0.000c
X34 0.4803 0.1439 0.3921 0.1512 �3.965 0.000c
X35 0.9231 0.1481 0.8828 0.1081 �1.690 0.091a
a Significant at the level of 10%.b Significant at the level of 5%.c Significant at the level of 1%.
Table 4Evolvement of feature sets for financial distress prediction with time goingon
Concept Meaning t-3year
t-2year
t-1year
4.3. Feature extraction and selection
The main purpose of feature extraction and selection isto reduce the number of dimension to be employed in mod-eling. Till now, there no completed theory of corporate fail-ure (Lin & McClean, 2001). Hence, statistical analysismethod rather than feature selection based on human deci-sion-making was used in this research. Because there aredifferent symptoms indicated by different account itemsfor distressed companies at the different stages prior finan-cial distress. Each year’s features employed were selectedseparately from 35 original account items through the sta-tistical method of stepwise discriminant analysis. Final fea-ture sets employed in this research are listed in Table 2.Statistic characteristics of sample data sets and accountitems’ mean comparison between distressed companiesand normal ones are shown in Table 3. It shows that thereexits significant difference between distressed companiesand normal ones at all final features at the level of at least
Table 1Details of the three data sets
Data sample Number ofnormal companies
Number ofdistressed companies
Timespan
t-1 82 71 2000–2005t-2 106 110 2000–2005t-3 90 92 2000–2005
Table 2Final feature sets employed in the three sample data sets
Data sample Variables Meaning
t-1 X11 Total asset turnoverX12 Asset-liability ratioX13 Total asset growth rateX14 Earning per share
t-2 X21 Return on total assetX22 Return on current assetX23 Return on equityX24 Account payable turnoverX25 Current asset turnoverX26 Fixed asset turnoverX27 Asset-liability ratio
t-3 X31 Current asset turnoverX32 Fixed asset turnoverX33 The ratio of cash to current liabilityX34 Asset-liability ratioX35 The proportion of current liability
Profitability Return on total asset YReturn on current asset YReturn on equity Y
Short-time liabiltiy The ratio of cash tocurrent liability
Y
Long-time liability Asset-liability ratio Y Y YActivity Current asset turnover Y Y
Total asset turnover YAccount payable turnover YFixed asset turnover Y Y
Structural ratios The proportion of currentliability
Y
Growth ratios Total asset growth rate YPer share items and
yieldsEarning per share Y
10%. Evolvement of the three feature sets from the year oft-3 to the year of t-1 is shown in Table 4.
4.4. Modeling
4.4.1. Standard for assessment
There are usually three standards employed to assess aclassification model, i.e. prediction accuracy, computa-tional complexity, and succinctness in model description.Prediction accuracy is the most important standard infinancial distress prediction, which was adopted as anexamination on performance when comparing different
0.04
0.05
0.06
0.4
0.6
0.8
10
0.2
0.4
0.6
0.8
1
Parameter qParameter p
Par
amet
er p
er
Fig. 7. Parameter values of per, p and q searched in the first step at year (t-1).
00.01
0.020.03
0.04
0.20.4
0.60.8
10
0.2
0.4
0.6
0.8
1
Parameter qParameter p
Pa
ram
eter
per
Fig. 8. Parameter values of per, p and q searched in the first step at year (t-2).
0.020.03
0.040.05
0.06
0.40.5
0.60.7
0.80
0.2
0.4
0.6
0.8
1
Parameter qParameter p
Pa
ram
eter
pe
r
Fig. 9. Parameter values of per, p and q searched in the first step at year (t-3).
654 H. Li et al. / Expert Systems with Applications 36 (2009) 643–659
models in this research. Cross-validation is a widely usedstatistical technique to determine the robustness of models.
Prediction accuracy of CBR system is directly deter-mined by the number of stored cases in CB, because themechanism of CBR system in prediction is the integrationof class value of k-nearest neighbor cases in CB. If thestrategy of 10-fold or 5-fold cross-validation is used, pre-diction accuracy of CBR system may be underestimatedbecause of smaller case number in CB. Hence, in thisresearch, the cross-validation strategy of leave-one-outwas employed to validate the model of OR-CBR and oth-ers in financial distress prediction with data from Chineselisted companies. Each time one distinct sample is takenout to act as a target case, while the rest consist of CB.The predicted result is compared with its true financialclass. Finally, leave-one-out accuracies of OR-CBR andother models can be figured out. It means that there are,respectively 153, 216, and 182 data sets for the year of t-1, t-2, and t-3 employed in this experiment. The final accu-racy of each model is the average value of hundreds ofexperiments. The bigger the number of leave-one-out accu-racy is, the more generalization capability the model has,and the more suitably the model is applied into the real-world problem.
There are some researches (Wu et al., 2007) that distin-guished Type I and Type II errors. Type I error refers topredict distressed company as normal one, while Type IIerror refers to predict normal company as distressed one.This thought derives directly from traditional pattern rec-ognition problems such as cancer prediction. In these kindsof problems, it is more cautious to predict normal cells ascancer ones than to predict cancer cells as normal ones.While, in the application of classification into the area offinancial distress prediction, it is hard to say which typeof error will take less cost sometimes. Hence, Type I andType II errors were treated equally in this research.
4.4.2. Parameter optimization
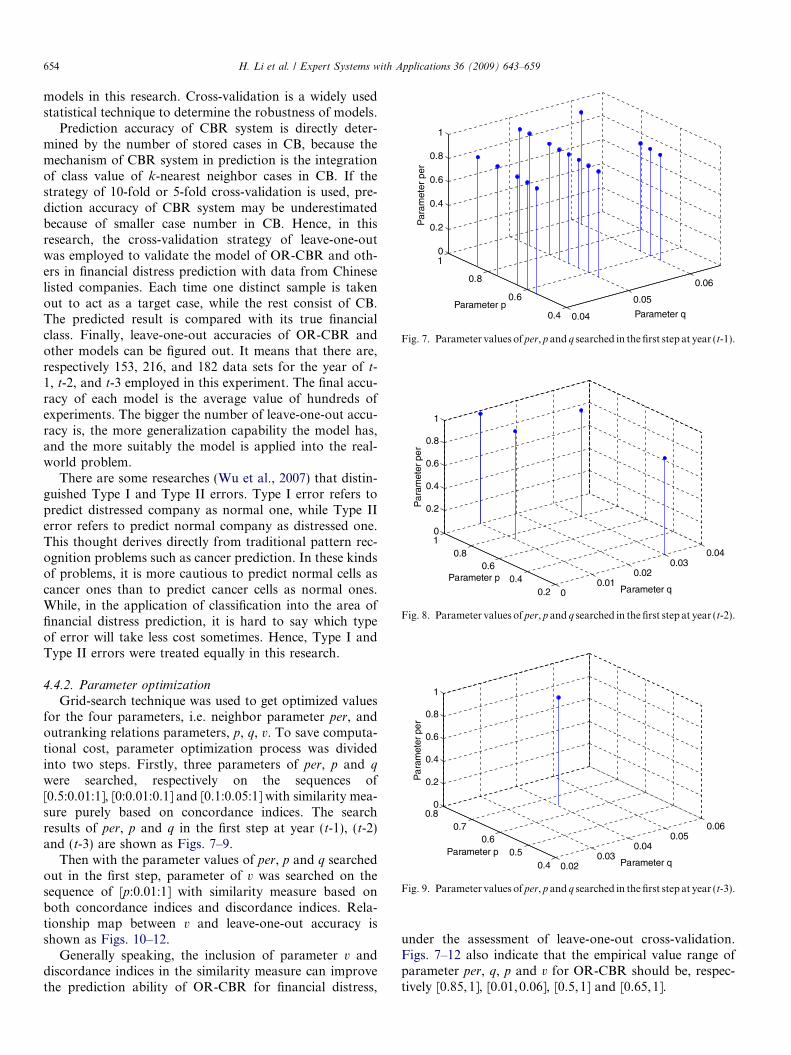
Grid-search technique was used to get optimized valuesfor the four parameters, i.e. neighbor parameter per, andoutranking relations parameters, p, q, v. To save computa-tional cost, parameter optimization process was dividedinto two steps. Firstly, three parameters of per, p and q
were searched, respectively on the sequences of[0.5:0.01:1], [0:0.01:0.1] and [0.1:0.05:1] with similarity mea-sure purely based on concordance indices. The searchresults of per, p and q in the first step at year (t-1), (t-2)and (t-3) are shown as Figs. 7–9.
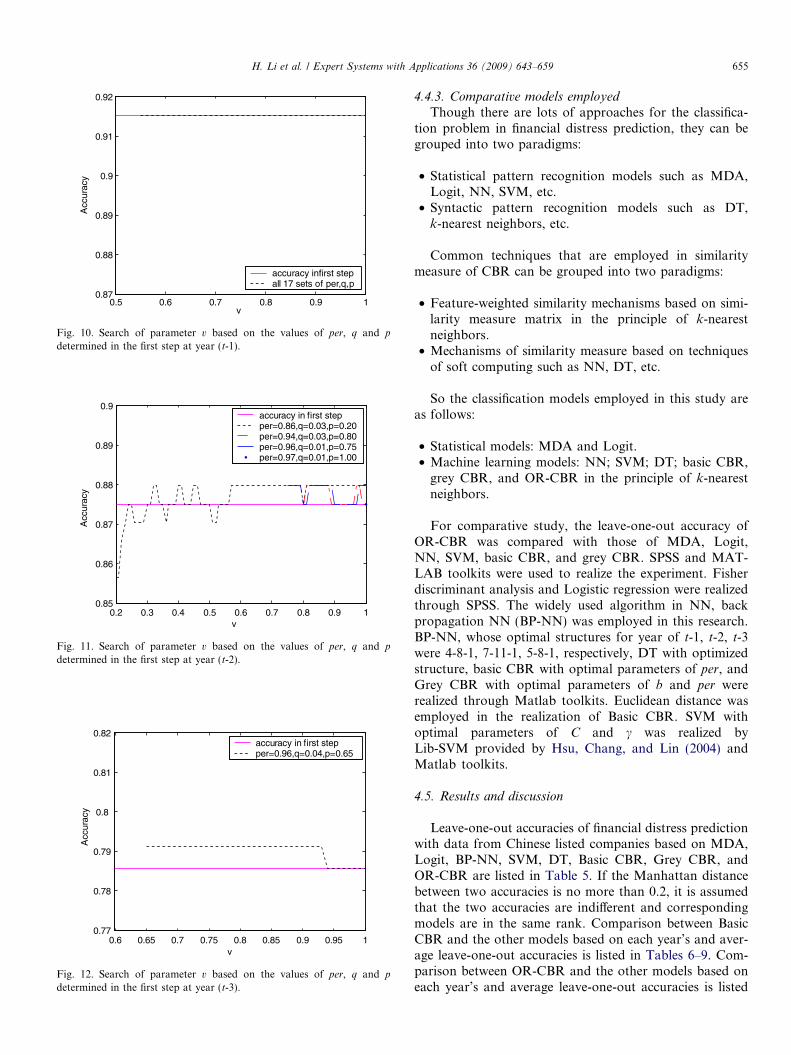
Then with the parameter values of per, p and q searchedout in the first step, parameter of v was searched on thesequence of [p:0.01:1] with similarity measure based onboth concordance indices and discordance indices. Rela-tionship map between v and leave-one-out accuracy isshown as Figs. 10–12.
Generally speaking, the inclusion of parameter v anddiscordance indices in the similarity measure can improvethe prediction ability of OR-CBR for financial distress,
under the assessment of leave-one-out cross-validation.Figs. 7–12 also indicate that the empirical value range ofparameter per, q, p and v for OR-CBR should be, respec-tively [0.85,1], [0.01,0.06], [0.5,1] and [0.65,1].
0.5 0.6 0.7 0.8 0.9 10.87
0.88
0.89
0.9
0.91
0.92
v
Acc
urac
y
accuracy infirst stepall 17 sets of per,q,p
Fig. 10. Search of parameter v based on the values of per, q and p
determined in the first step at year (t-1).
0.2 0.3 0.4 0.5 0.6 0.7 0.8 0.9 10.85
0.86
0.87
0.88
0.89
0.9
v
Acc
urac
y
accuracy in first stepper=0.86,q=0.03,p=0.20per=0.94,q=0.03,p=0.80per=0.96,q=0.01,p=0.75per=0.97,q=0.01,p=1.00
Fig. 11. Search of parameter v based on the values of per, q and p
determined in the first step at year (t-2).
0.6 0.65 0.7 0.75 0.8 0.85 0.9 0.95 10.77
0.78
0.79
0.8
0.81
0.82
v
Acc
urac
y
accuracy in first stepper=0.96,q=0.04,p=0.65
Fig. 12. Search of parameter v based on the values of per, q and p
determined in the first step at year (t-3).
H. Li et al. / Expert Systems with Applications 36 (2009) 643–659 655
4.4.3. Comparative models employed
Though there are lots of approaches for the classifica-tion problem in financial distress prediction, they can begrouped into two paradigms:
• Statistical pattern recognition models such as MDA,Logit, NN, SVM, etc.
• Syntactic pattern recognition models such as DT,k-nearest neighbors, etc.
Common techniques that are employed in similaritymeasure of CBR can be grouped into two paradigms:
• Feature-weighted similarity mechanisms based on simi-larity measure matrix in the principle of k-nearestneighbors.
• Mechanisms of similarity measure based on techniquesof soft computing such as NN, DT, etc.
So the classification models employed in this study areas follows:
• Statistical models: MDA and Logit.• Machine learning models: NN; SVM; DT; basic CBR,
grey CBR, and OR-CBR in the principle of k-nearestneighbors.
For comparative study, the leave-one-out accuracy ofOR-CBR was compared with those of MDA, Logit,NN, SVM, basic CBR, and grey CBR. SPSS and MAT-LAB toolkits were used to realize the experiment. Fisherdiscriminant analysis and Logistic regression were realizedthrough SPSS. The widely used algorithm in NN, backpropagation NN (BP-NN) was employed in this research.BP-NN, whose optimal structures for year of t-1, t-2, t-3were 4-8-1, 7-11-1, 5-8-1, respectively, DT with optimizedstructure, basic CBR with optimal parameters of per, andGrey CBR with optimal parameters of b and per wererealized through Matlab toolkits. Euclidean distance wasemployed in the realization of Basic CBR. SVM withoptimal parameters of C and c was realized byLib-SVM provided by Hsu, Chang, and Lin (2004) andMatlab toolkits.
4.5. Results and discussion
Leave-one-out accuracies of financial distress predictionwith data from Chinese listed companies based on MDA,Logit, BP-NN, SVM, DT, Basic CBR, Grey CBR, andOR-CBR are listed in Table 5. If the Manhattan distancebetween two accuracies is no more than 0.2, it is assumedthat the two accuracies are indifferent and correspondingmodels are in the same rank. Comparison between BasicCBR and the other models based on each year’s and aver-age leave-one-out accuracies is listed in Tables 6–9. Com-parison between OR-CBR and the other models based oneach year’s and average leave-one-out accuracies is listed

Table 5Leave-one-out accuracies of different models at different years
Modelsyear
MDA(%)
Logit(%)
BP-NN(%)
SVM(%)
DT(%)
BasicCBR(%)
GreyCBR(%)
OR-CBR(%)
Mean(%)
t-1 88.2 86.9 88.2 88.9 86.9 90.2 91.5 91.5 89.0t-2 85.2 84.7 84.3 85.6 79.2 85.7 87.0 88.0 85.0t-3 75.3 77.5 74.2 78.6 58.8 73.6 74.2 79.1 74.0Mean 82.9 83.0 82.2 84.4 75.0 83.2 84.2 86.2 –
Table 6Comparison between basic CBR and the other models based on leave-one-out accuracies at year t-1
Models rank MDA Logit BP-NN SVM DT Basic CBR
Best YSecond best YThird best Y Y
Table 7Comparison between basic CBR and the other models based on leave-one-out accuracies at year t-2
Models rank MDA Logit BP-NN SVM DT Basic CBR
Best Y YSecond best YThird best Y
Table 8Comparison between basic CBR and the other models based on leave-one-out accuracies at year t-3
Models rank MDA Logit BP-NN SVM DT Basic CBR
Best YSecond best YThird best Y
Table 9Comparison between basic CBR and the other models based on averageleave-one-out accuracies
Models rank MDA Logit BP-NN SVM DT Basic CBR
Best YSecond best Y YThird best Y
Table 10Comparison between OR-CBR and the other models based on leave-one-out accuracies at year t-1
Models rank MDA Logit BP-NN SVM DT OR- CBR
Best YSecond best YThird best Y Y
Table 11Comparison between OR-CBR and the other models based on leave-one-out accuracies at year t-2
Models rank MDA Logit BP-NN SVM DT OR-CBR
Best YSecond best YThird best Y
Table 12Comparison between OR-CBR and the other models based on leave-one-out accuracies at year t-3
Models rank MDA Logit BP-NN SVM DT OR-CBR
Best YSecond best YThird best Y Y
Table 13Comparison between OR-CBR and the other models based on averageleave-one-out accuracies
Models rank MDA Logit BP-NN SVM DT OR-CBR
Best YSecond best YThird best Y Y
Table 14Comparison inside CBR based on leave-one-out accuracies at year t-1
Models rank Basic CBR Grey CBR OR-CBR
Best Y YSecond best YThird best
Table 15Comparison inside CBR based on leave-one-out accuracies at year t-2
Models rank Basic CBR Grey CBR OR-CBR
Best YSecond best YThird best Y
656 H. Li et al. / Expert Systems with Applications 36 (2009) 643–659
in Tables 10–13. Comparison inside CBR based on eachyear’s and average leave-one-out accuracies is listed in
Tables 14–17. Corresponding discussions are described asfollows.
• Leave-one-out accuracies decline with year going away.As Table 5 shows, the average leave-one-out accuraciesof all models are 89.0%, 85.0%, and 74.0% for the yearof t-1, t-2, and year t-3, respectively. The leave-one-outaccuracies of OR-CBR are 91.5%, 88.0%, and 79.1%for the year of t-1, t-2, and year t-3, respectively.whether average leave-one-out accuracy of all modelsor leave-one-out accuracy of each model decline withyear going away. It means that predictive ability ofOR-CBR model declines from year (t-1) to year (t-3),just the same as the other models. It indicates that the

Table 16Comparison inside CBR based on leave-one-out accuracies at year t-3
Models rank Basic CBR Grey CBR OR-CBR
Best YSecond best YThird best Y
Table 17Comparison inside CBR based on average leave-one-out accuracies
Models rank Basic CBR Grey CBR OR-CBR
Best YSecond best YThird best Y
H. Li et al. / Expert Systems with Applications 36 (2009) 643–659 657
nearer to the time when financial distress breaks out, themore information content the financial items contain,and the more strong predictive ability each model has.
• In general, machine learning models like SVM, BasicCBR, Grey CBR, and OR-CBR outperform statisticalones, as shown in Tables 6–13. Average leave-one-outaccuracies of the four machine learning models are84.4%, 83.3%, 84.2%, and 86.2%, respectively, and thoseof statistical ones are 82.9%, and 83.0%, respectively.But machine learning is a time-consuming process byadjusting models’ parameters. In the experiment, humanlabor and time spent on these types of models aregreater than that for statistical models. On the whole,traditional statistical models are time-saving ones withacceptable generalization capacity when applied intothe area of financial distress prediction with data fromChinese listed companies. While, machine learning mod-els can achieve more accuracy by consuming more time.
• As shown in Tables 6–9, when carrying on the compar-ison between Basic CBR and the other models based onleave-one-out accuracy with data from Chinese listedcompanies, Basic CBR outperforms MDA, Logit, BP-NN, DT, SVM at the year t-1, outperforms MDA,Logit, BP-NN, DT, and equals to SVM at the year oft-2, and is outperformed by all the other models exceptfor DT at the year of t-3. Leave-one-out accuracies ofBasic CBR are both the highest in the first two years,and the second lowest in the third year. This may indi-cate that the financial distress prediction model basedon CBR has very good predictive ability for enterpriseswhich might probably run into financial distress in lessthan two years. It is more suitable to predict enterprises’financial distress in short-term. This is consistent withSun and Hui’s (2006) research when comparing GreyCBR with MDA, Logit, BP-NN, and SVM with datafrom Chinese listed companies.
• As shown in Tables 10–13, when carrying on the compar-ison between OR-CBR and the other models based onleave-one-out accuracy with data from Chinese listedcompanies, accuracies of OR-CBR is 91.5%, 88.0%,and 79.1%, respectively for the three years, which outper-form those of MDA, Logit, BP-NN, DT, SVM at all the
three years. It indicates that the new model of OR-CBRproposed in this research is very suitable for financial dis-tress prediction with data from Chinese listed companies.There may be more confused information in the sampledata set of year t-3, but OR-CBR can handle the infor-mation effectively than other models by the mechanismof indifference, weak difference, and strict difference.
• As shown in Tables 14–17, when comparison is madeinside CBR based on leave-one-out accuracy with datafrom Chinese listed companies, accuracies of OR-CBRare 91.5%, 88.0%, and 79.1%, respectively for the threeyears, which outperform Basic CBR and Grey CBRexcept for an equal accuracy as Grey CBR at the yearof t-1. It may indicate that 91.5% may be the upper limitwhen employ the mechanism of CBR in financial dis-tress prediction for the data sets used, because the infor-mation contained in the sample data set of year t-1 islimited. And OR-CBR also greatly increases the accu-racy of the year t-3 to 79.1%, which is 74.2% of GreyCBR and 73.6% of Basic CBR. It means that the modelof OR-CBR fetches up shortcomings of Grey CBR andBasic CBR in the prediction of year t-3. Thus, CBR is nomore a model just suitable for short-term financial dis-tress prediction as was demonstrated by Sun and Hui(2006), but also suitable for financial distress predictionbefore the third year. While, inferior position of OR-CBR is also obvious. There are only one parameter,per, in Basic CBR, and two parameters, b and per, inGrey CBR. But there are four parameters, q, p, v, andper, in OR-CBR. The higher accuracy of OR-CBR isobtained through more computation cost.
• At the same time, it can be observed that SVM is justoutperformed by OR-CBR at all the three years, outper-formed by Grey CBR at the year of t-1 and t-2, and out-performed by Basic CBR at the year of t-1 based onleave-one-out accuracy. Otherwise, it outperforms allthe other models at all the other years. That may rooton the complete theory developed by Vapnik (1998)and his cooperators. It also indicates that SVM is a veryapplicable model in financial distress prediction withdata form Chinese listed companies, too.
5. Conclusion
When CBR is employed into the area of financial distressprediction, the traditional feature-based similarity measuremechanism based on distance matrix is always used. In thisstudy, we tried to improve the similarity measure mecha-nism in order to get a higher prediction capacity of CBRsystem in financial distress prediction. Outranking relationswere introduced into the area of CBR to build up a newmodel named OR-CBR for financial distress prediction.The accuracy of OR-CBR in financial distress predictionis directly determined by the four types of parameters, i.e.indifference parameter q, difference parameter p, voteparameter v, and neighbor parameter per. In the empiricalexperiment, three years’ data of 135 pairs of Chinese listed

658 H. Li et al. / Expert Systems with Applications 36 (2009) 643–659
companies were collected as initial sample data, the cross-validation of leave-one-out was utilized to assess models,the method of stepwise discriminant analysis was used toselect features, and grid-search technique was used to getoptimized model parameters. Comparisons on accuraciesof various models such as MDA, Logit, NN, SVM, DT,Basic CBR, Grey CBR, and OR-CBR were carried on inthe experiment, with the results that OR-CBR outperformall the others with data from Chinese listed companies.
Acknowledgement
This research is partially supported by the NationalNatural Science Foundation of China (#70801055) andthe Zhejiang Provincial Natural Science Foundation ofChina (#Y607011). The authors gratefully thank anony-mous referees for their useful comments and editors fortheir work.
References
Aamodt, A., & Plaza, E. (1994). Case-based reasoning: Foundationalissues, methodological variations, and system approaches. AI Com-
munications, 7(1), 39–59.Ahn, B. A., Cho, S. S., & Kim, C. Y. (2000). The integrated methodology
of rough set theory and artificial neural network for business failureprediction. Expert Systems with Applications, 18(2), 65–74.
Altman, E. I. (1968). Financial ratios discriminant analysis and theprediction of corporate bankruptcy. Journal of Finance, 23(4), 589–609.
Altman, E. I., Marco, G., & Varetto, F. (1994). Corporate distressdiagnosis: Comparisons using linear discriminant analysis and neuralnetworks (the Italian experience). Journal of Banking and Finance, 18,505–529.
Andres, J. D., Landajo, M., & Lorca, P. (2005). Forecasting businessprofitability by using classification techniques: A comparative analysisbased on a Spanish case. European Journal of Operational Research,
167(2), 518–542.Barniv, R., Anurag, A., & Leach, R. (1997). Predicting the out come
following bankruptcy filing: A three state classification using NN.International Journal of Intelligent Systems in Accounting, Finance and
Management, 6, 177–194.Boritz, J. E., & Kennedy, D. B. (1995). Effectiveness of neural network
types for prediction of business failure. Expert Systems with Applica-
tions, 9(4), 503–512.Bryant, S. M. (1997). A case-based reasoning approach to bankruptcy
prediction modeling. International Journal of Intelligent Systems in
Accounting, Finance and Management, 6(3), 195–214.Cheetham, W., & Graf, J. (1997). Case-based reasoning in color matching.
Lecture Notes in Computer Science, 1266, 1–12.Ding, Y.-S., Song, X.-P., & Zen, Y.-M. (2007). Forecasting financial
condition of Chinese listed companies based on support vectormachine. Expert Systems with Applications. in press, doi:10.1016/j.eswa.2007.06.037.
Finnie, G., & Sun, Z. (2003). R5 model for case-based reasoning.Knowledge-Based Systems, 16(1), 59–65.
Frydman, H., Altman, E. I., & Kao, D. (1985). Introducing recursivepartitioning for financial classification: The case of financial distress.Journal of Finance, 40(1), 269–291.
Heider, R. (1996). Troubleshooting CFM 56-3 engines for the Boeing 737using CBR and data-mining. Lecture Notes in Computer Science, 1168,513–516.
Hsu, C.-W., Chang,C.-C., & Lin, C.-J. (2004). A practical guide tosupport vector classification. Technical report, Department of Com-
puter Science and Information Engineering, National Taiwan univer-sity. http://www.csie.ntu.edu.tw/~cjlin/papers/guide/guide.pdf.
Hua, Z.-S., Wang, Y., Xu, X.-Y., et al. (2007). Predicting corporatefinancial distress based on integration of support vector machine andlogistic regression. Expert Systems with Applications, 33, 434–440.
Hui, X.-F., & Sun, J. (2006). An application of support vector machine tocompanies’ financial distress prediction. Lecture Notes in Artificial
Intelligence, 3885, 274–282.Humphreys, P., McIvor, R., & Chan, F. (2003). Using case-based
reasoning to evaluate supplier environmental management perfor-mance. Expert Systems with Applications, 25(2), 141–153.
Jo, H., & Han, I. (1996). Integration of case-based forecasting, neuralnetwork, and discriminant analysis for bankruptcy prediction. Expert
Systems with Applications, 11(4), 415–422.Jo, H., Han, I., & Lee, H. (1997). Bankruptcy prediction using case-based
reasoning, neural networks, and discriminant analysis. Expert Systems
with Applications, 13(2), 97–108.Kolodner, J. L. (1993). Case-based reasoning. San Francisco: Morgan
Kaufman.Kumar, P. R., & Ravi, V. (2007). Bankruptcy prediction in banks and
firms via statistical and intelligent techniques – A review. European
Journal of Operational Research, 180, 1–28.Leake, D. B. (1996). Case-based reasoning: Experiences, lessons, and future
directions. Menlo Park: AAAI Press.Liang, L., & Wu, D.-S. (2005). An application of pattern recognition on
scoring Chinese corporations financial conditions based on backpropagation neural network. Computers & Operations Research, 32(5),1115–1129.
Liao, S.-H. (2005). Expert system methodologies and applications – Adecade review from 1995 to 2004. Expert Systems with Applications,
28(1), 93–103.Lin, F.-Y., & McClean, S. (2001). A data mining approach to the
prediction of corporate failure. Knowledge-Based Systems, 14(3–4),189–195.
Martin, D. (1977). Early warning of bank failure: A logit regressionapproach. Journal of Banking and Finance, 1, 249–276.
Min, J.-H., & Lee, Y.-C. (2005). Bankruptcy prediction using supportvector machine with optimal choice of kernel function parameters.Expert Systems with Applications, 28, 603–614.
Min, S.-H., Lee, J.-M., & Han, I. (2006). Hybrid genetic algorithms andsupport vector machines for bankruptcy prediction. Expert Systems
with Applications, 31, 652–660.Odom, M., & Sharda, R. (1990). A neural networks model for bankruptcy
prediction. In Proceedings of international joint conference on neural
networks (pp. 163–168). San Diego, CA.Ohlson, J. A. (1980). Financial ratios and probabilistic prediction of
bankruptcy. Journal of Accounting Research, 18(1), 109–131.Pal, S. K., & Shiu, S. (2004). Foundations of soft case-based reasoning. New
Jersey: Wiley.Park, C.-S., & Han, I. (2002). A case-based reasoning with the feature
weights derived by analytic hierarchy process for bankruptcy predic-tion. Expert Systems with Applications, 23(3), 255–264.
Price, C. J., & Pegler, I. (1995). Deciding parameter values with case-basedreasoning. Lecture Notes in Computer Science, 1020, 121–133.
Roy, B. (1971). Problems and methods with multiple objective functions.Mathematical Programming, 1, 239–266.
Roy, B. (1991). The outranking approach and the foundations ofELECTRE methods. Theory and Decision, 31(1), 49–73.
Roy, B. (1996). Multicriteria methodology for decision aiding. Dordrecht:Kluwer Academic Publishers.
Roy, B., & Słowinski, R. (2007). Handling effects of reinforced preferenceand counter-veto in credibility of outranking. European Journal of
Operational Research. doi:10.1016/j.ejor.2007.04.00.Roy, B., & Vincke, P. (1984). Relational systems of preference with one or
more pseudo-criteria: Some new concepts and results. Management
Science, 30(11), 1323–1335.Schank, R. (1982). Dynamic memory: A theory of learning in computers and
people. New York: Cambridge University Press.

H. Li et al. / Expert Systems with Applications 36 (2009) 643–659 659
Schmidt, R., & Vorobieva, O. (2006). Case-based reasoning investigationof therapy inefficacy. Knowledge-Based Systems, 19(5), 333–340.
Shin, K.-S., Lee, T.-S., & Kim, H.-J. (2005). An application of supportvector machines in bankruptcy prediction model. Expert Systems with
Applications, 28(1), 127–135.Smyth, B., & Keane, M. T. (1998). Adaptation-guided retrieval: Question
the similarity assumption in reasoning. Artificial Intelligence, 102(2),249–293.
Sun, J., & Hui, X.-F. (2006). Financial distress prediction based onsimilarity weighted voting CBR. Lecture Notes in Artificial Intelligence,
4093, 947–958.Sun, J., & Li, H. (2007). Listed companies’ financial distress prediction
based on weighted majority voting combination of multiple classifiers.Expert Systems with Application. doi:10.1016/j.eswa.2007.07.04.
Sun, J., & Li, H. (2008). Data mining method for listed companies’financial distress prediction. Knowledge-Based Systems, 21(1), 1–5.
Taffler, R. J. (1982). Forecasting company failure in the UK usingdiscriminant analysis and financial data. Journal of Royal Statistics
Society A, 124(Part 3), 342–358.
Tam, K. Y., & Kiang, M. (1992). Predicting bank failures: A neuralnetwork approach. Decision Sciences, 23, 926–947.
Tversky, A. (1977). Features of similarity. Psychological Review, 84(4),327–352.
Vapnik, V. N. (1998). Statistical learning theory. New York: Wiley.Waheed, A., & Adeli, H. (2005). Case-based reasoning in steel bridge
engineering. Knowledge-Based Systems, 18(1), 37–46.Watson, I. (1999). Case-based reasoning is methodology, not a technol-
ogy. Knowledge-Based Systems, 12(5–6), 303–308.Wu, C.-H., Tzeng, G.-H., Goo, Y.-J., et al. (2007). A real-valued genetic
algorithm to optimize the parameters of support vector machine forpredicting bankruptcy. Expert Systems with Applications, 32(2),397–408.
Yip, A. Y. N. (2004). Predicting business failure with a case-basedreasoning approach. Lecture Notes in Computer Science, 3215,20–25.
Zadeh, L. A. (1965). Fuzzy sets. Information and Control, 8(3), 338–353.Zadeh, L. A. (1994). Soft computing and fuzzy logic. IEEE Software,
11(6), 48–56.