financial distress - eur
TRANSCRIPT

FINANCIAL DISTRESSA MEASURE OF FINANCIAL DISTRESS BETWEEN PUBLICLY-TRADED
AND PRIVATELY-HELD FIRMS IN THE EU DURING TIMES OF
ECONOMIC CRISIS.
Erasmus University RotterdamErasmus School of EconomicsDepartment of Business EconomicsSection FinanceInstructor: Dr. M.B.J. SchautenAugust 2009
Name: N. AouakiExam number: 281472E-mail: [email protected]
Name: J.P. den HeijerExam number: 280551E-mail: [email protected]

2
Version 1.2

3
Acknowledgements
Firstly, we would like to thank our instructor, Dr. M.B.J. Schauten for his directions
and wise words when we managed to get ourselves stuck – and his ability to forgive
our lack of decency for barging into his office without appointment on many
occasions. A special thanks goes out to all our family and friends who gave us the
mental support – and coffee – when we needed it most.

4
Index
Acknowledgements 3
Index 4
Abstract 6
1. Introduction 8
2. Theoretical framework 11
2.1 Introduction 11
2.2 The capital structure of the firm 12
2.3 Information asymmetry 13
2.4 Implications of financial distress 14
2.5 Theoretical implications 16
2.6 Summary 19
3. Data – sample and sample description 20
3.1 Introduction 20
3.2 Data 20
3.3 Summary 22
4. Methodology 23
4.1 Introduction 23
4.2 Research setup 23
4.3 Preliminary statistics 29
4.4 Summary 32
5. Results 33
5.1 Introduction 33
5.2 Working capital ratio 34
5.3 Retained earnings ratio 35

5
5.4 Earnings ratio 36
5.5 Equity ratio 37
5.6 Sales ratio 38
5.7 Z-score 39
5.8 Summary 39
6. Discussion 41
6.1 Introduction 41
6.2 Findings 41
6.3 Summary 43
7. Conclusion 44
7.1 Introduction 44
7.2 Implications 44
7.3 Recommendations 45
7.4 Conclusion 45
7.5 Summary 46
Reference List 48
Literature 48
Online resources 50
Newspapers 50
Appendix 51
Appendix 1 51
Appendix 2 52
Appendix 3 53
Appendix 4 54
Appendix 5 58

6
Abstract
This thesis before you attempts to investigate whether there is a structural difference
between privately-held firms and publicly-traded firms with respect to financial
distress during the economic crisis of 2007 to 2008 in the European Union. Firstly, we
clarify our research question by discussing various relevant theories such as the
information-asymmetry theory which argues that there is a difference between
investors outside of the firm and management inside the firm respectively. According
to this theory, management exploits this difference in information to obtain
advantages when attempting to acquire financing for the firm’s investment projects.
We can combine said information-asymmetry theory with the agency theory which
argues that privately-held firms have less influential stakeholders than do publicly-
held firms. Additionally, when either firm type acquires debt, the debt holders are an
additional stakeholder to be considered in the investment choices and capital structure
of either firm type.
Secondly, we discuss relevant reference researches done by others and compare these
amongst each other and with our own research, respectively. Then we discuss our
methodology on how we relate aforementioned theories with the data we have
acquired for this research. We will briefly take a look at some basic statistical
information – as we only have a limited amount of observations due to data
limitations. Although we find that we lack sufficient observations to function as any
hard evidence, we do find indications that the quality of our dataset suffices to find
that there is indeed a slight discrepancy between privately-held and publicly-traded
firms in times of economic turmoil.
We have employed Altman’s (2000) Z-score and its underlying financial ratios to
analyze our data. In order to keep a respectable overview of these ratios and the Z-
score respectively, we have added an appendix to this report containing tabular and
graphical overviews of our analysis – these overviews will be directed towards
throughout this report. We find that the majority of said underlying financial ratios are
statistically insignificant between privately-held and publicly-owned firms, therefore
proving no statistically significant difference in company performance between said

7
two parties. On the contrary, the actual Z-score proves to be significant, therefore
concluding that during times of economic crisis, privately-held firms tend to perform
slightly better than do publicly-traded firms within the same industry. Throughout this
report we will link to a variety of similar researches done by others who have found
similar conclusions with respect to aforementioned research question.

8
1. Introduction
During Fall of 2008, one of the worst financial crisis struck the continent of Europe1.
Originally coming from the United States, Europe got involved less than a year later.
At the time of this writing, this economic crisis is considered the worst since the Great
Depression of the 20's and 30's2. Although this economic phenomenon must be highly
frustrating for many business owners, it is however an excellent - and dare I say,
unique - opportunity for Finance students such as ourselves to take advantage of from
an educational perspective. As such we have decided to take a research subject for
this thesis which is directly linked to the effects of this global economic crisis. Since
one of the authors has majored in Entrepreneurship3, the other in Corporate Finance4,
we decided to take a research question which covers both specializations. As such we
have come to formulate a research question which attempts to clarify a (possible)
difference between publicly-traded and privately-held firms.
The scope of our research will be limited to the European Union, with its member-
states as it was on January 1st, 2004. This limitation is applied because within the
science of Corporate Finance it has been obvious that some findings in say, the United
States are not always applicable globally - even under the same circumstances, other
variables, including those not directly related to the science of Corporate Finance
might be of influence on what we try to examine. Henceforth it is logical to imply that
our findings within the European Union might not be applicable globally as well.
With this setting it allows us to gather data for five consecutive years on both
privately-held and publicly-traded firms, thus giving a reliable overview of the
condition of privately-held firms within the European Union while suffering from the
current economic crisis in comparison to their publicly-traded counterparts.
The social and scientific relevance of this study has been covered in various forms of
theoretical and empirical research. From these reference papers we have concluded
1 Landler (2008)2 Hilsenrath et al. (2008)3 Naoual Aouaki graduated in her major Entrepreneurship at Erasmus University, Rotterdam, the Netherlands in 2009.4 Johan den Heijer graduated in his major Corporate Finance at Erasmus University, Rotterdam, the Netherlands in 2009.

9
that there is no straightforward method to measure or predict financial distress or its
likelihood of occurring. We wish to note however that there is a huge volume of
research papers regarding the subject of which the vast majority employs the same
underlying variables within their models. We will discuss two of the referenced
research papers to illustrate said variety in methods.
Pindado et al. (2008) has introduced an advanced econometrical prediction model to
forecast financial distress. They employ a logistic regression model which allows for
a dynamic dimension within said model. The dynamic aspect comes from the fact
they employ the stock price of the researched firm before and after it encounters
financial distress. They construct this dynamic by assuming that a firm which is in
financial distress will be negatively valued on the stock exchange and will therefore
experience a fall in its stock price. The then obvious advantage of the model is that it
is more accurate than any of its predecessors. However, its accuracy comes at the
price of requiring one to know a sufficient degree of math to employ it – a skill which
is not always prevalent within research subjects in practice, such as business
managers. Besides said math requirement, the model is suited for large datasets
specifically.
On the contrary, Altman (1968 and 2000) introduced the Z-score model which is
based upon a variety of underlying financial ratios assembled together in a multiple
discriminant analysis model. When the value of the dependent variable (thus the Z-
score) is low, the firm in question is expected to experience financial distress within
the coming two years – this with approximately 80% accuracy, see Altman (1968).
Therefore, the higher the value of the dependent variable, the less unlikely a firm is to
experience financial distress. The value criteria will be further elaborated upon in our
Methodology chapter.
The advantage of the Z-score model is that it eliminates the statistical biases which
normally occur when making comparisons between firms – these biases are usually
caused by the wide variety in firm sizes, measured in total net sales. The
aforementioned financial ratios underlying said model are commonly known by
finance professionals and as such this model is widely used in practice by said
financial professionals and other related professions for several decades. In Altman

10
(2000) the traditional Z-score model is adjusted to have become suitable for
employment with privately-held firms and non-manufacturing firms – in the
traditional model, one of the financial ratios required the market value of equity for
example, which is non-existent for privately-held firms. A similar manner of
execution can be found in Chaitanya (2005), who employs the Z-score model in a
similar fashion to determine financial distress in the Indian banking sector.
The social relevance of this study is obvious from our research question, which is
formulated as follows:
Q: Do privately-held firms experience a different degree of financial (not economical)
distress than do their publicly-traded comparables during the economic of 2007 and
2008?
Within our research we wish to incorporate several facets of both corporate finance
and entrepreneurship. Not only will we apply existing theories regarding financial
distress, but also the effects of information asymmetry with respect to the capital
structure and debt financing. Lastly we will discuss agency-problems which may be
of influence on either privately-held or publicly-traded firms. We believe this is of
critical importance to our research question as the literature states that privately-
owned firms tend to finance their firm with debt significantly more often than do
publicly-owned firms, see Brav (2009).
The remainder of this thesis is divided as follows: first we will define our research
questions and discuss aforementioned relevant theories with respect to our research
question. The third chapter of the thesis will elaborate on our research methodology,
the data which we acquired, together with a sample description and some basic
statistical information. The fourth chapter will display our analytical results from said
data followed by our interpretation and a discussion of the empirical findings. Then
lastly we will draw a conclusion based on the discussed theories in combination with
our empirical findings.

11
2. Theoretical framework
2.1 Introduction
To the surprise of finance professionals, Modigliani and Miller (1958) theorized that
the capital structure of the firm, i.e. its total debt in relation with its equity, is of no
relevance with respect to its valuation - assuming perfect capital markets. However,
Modigliani and Miller had such strict assumptions which cannot be held true to be
empirically tested. For example, in practice capital markets have proven many times
throughout modern history that they are far from perfect. Phenomena such as
information asymmetry, agency problems, transaction costs, taxes and the like all add
up to its imperfections.
Therefore, the contrary seemed to be dominating practice: the capital structure of the
firm did influence a firm’s performance. As such, the capital structure of the firm is
influenced by the type of firm in question – be this a privately-held or publicly-traded
firm. Some of the relevant research which has been done in this field bases its
findings on questionnaires sent out to privately-held and publicly-traded firms5. Both
types of firms have certain distinct features which are subject to information
asymmetry, a potential cause of financial distress, and therefore agency costs as
theorized by the well-known agency theory, this in respect to said capital structure.
Because publicly-traded firms suffer from control issues – the top managers of said
firm type are not always the (full) owners of such firm – it is important for them to
attract debt in order to become an unattractive takeover candidate5. Secondly, the top
management of publicly-traded firms is elected by the board of commissioners of
such firm. These commissioners in turn are elected by the shareholders. Then it is
logical to see that for publicly-traded firms there are several more parties involved in
investment decisions – including the choice whether to finance through equity or debt
– than there is with privately-held firms. In contrast, privately-held firms are directly
controlled and owned by its shareholders. The equity of such firm is divided amongst
that same management.
5 Brounen et al. (2005)

12
This chapter will discuss the relevant financial theories concerning our research
question. In the coming paragraph we will discuss the capital structure of the firm,
followed by information-asymmetry, then we will turn to the theoretical implications
of financial distress and finally a summary of our theoretical framework.
2.2 The capital structure of the firm
Graham and Harvey (2001) find evidence that firms keep a certain degree of financial
flexibility regarding their capital structure. This supports the assumption that firms
apply the static trade-off theory6. The study of Brounen et al (2005) confirms that the
same findings apply to European firms. Brounen et al (2005) also finds that publicly-
traded firms consider the tax benefits of debt issuance – this in the shape of a tax
shield. In contrast, privately-held firms do not consider such benefits. This might
imply that publicly-traded firms finance themselves through debt easier than do
privately-held firms.
The above however is in contrast with the research done by Brav (2009). In that
research paper Brav calls upon the fact that publicly-traded firms in the United
Kingdom have easier access to public capital markets than do privately-held firms. He
therefore theorizes that based on this fact, privately-held firms are more inclined to
finance themselves through debt, such as bank debt and the like, as they have no such
access to capital markets – or at least, at a significantly higher cost than do their
publicly-traded counterparts. Although there are not many studies in which publicly-
traded and privately-held firms are compared empirically with respect to their capital
structure, what we want to research might just add a little to this poorly explored
terrain in the economical sciences.
6 The static trade-off theory assumes a trade-off between the tax benefits through a tax shield and the potential costs of financial distress which may occur due to the acquisition of corporate debt. According to this theory, firms balance the benefits with the costs in their capital structure.

13
As such our first hypothesis is the following:
H1: privately-held firms are more inclined to employ debt financing than do their
publicly-traded counterparts, this due to poor or no access to the capital markets.
Therefore the equity to total liabilities ratio from publicly-traded firms will be higher
than that of privately-held firms.
2.3 Information asymmetry
Privately-held firm’s behavior towards attracting debt differs from publicly-traded
firms. Where privately-held firms prefer to acquire debt from informal sources as
alternatives to the capital market, publicly-traded firms utilize aforementioned capital
market. However, such privately-held firms are subject to information-asymmetric
problems (Carey et al. (1993), Kwan and Carleton (2004) and Denis and Mihov
(2003)).
This is because the information known to employees and the firm’s management –
known as inside information – is not known to the public at the same time. As such,
said inside information regarding the financial health of privately-held firms is
generally not available to (potential) providers of debt. These insiders then, have a
tendency to exploit this information advantage: when they have evidence that, say, in
the near future the firm will perform less, they will be inclined to acquire as much
debt as possible against the current interest rate, see Chandra et al (2008). The
argument of acquiring this debt is usually covered by a need to restructure the firm’s
organization or some vague argument as such. The actual purpose of acquiring excess
liquid assets is done to get the best possible debt contracts against the most favorable
interest rates before said inside information becomes public knowledge, thus causing
the current interest rate to go up.
The reverse is true for when the firm has positive news as inside information: it will
delay acquiring debt until such inside information has become common knowledge to
the public. Logically, a firm’s management will be more inclined to quickly publish
positive inside information and to delay negative inside information as to maximize
its own advantage. Figure 1 below broadly summarizes this theory.

14
Negative Insider Information Becoming Publicly Known
0
2
4
6
8
10
1 2 3 4 5 6 7 8 9 10
time (years)
inte
rest
rat
e (i
%)
interest rate on debt
Positive Insider Information Becoming Publicly Known
0
2
4
6
8
10
1 2 3 4 5 6 7 8 9 10
time (years)
inte
rest
rat
e (i
%)
interest rate on debt
Figure 1: in the left graph we can see that in the fourth year negative insider information becomes
publicly known, causing the interest rate on debt for the firm to go up significantly due to increased
risk. In the right graph we can see the opposite happening: here, in the fourth year positive insider
information is immediately made publicly known, allowing the firm from then on to acquire debt
against a more favorable interest rate.
The motivation to delay negative news and to acquire debt can be found in the study
by Chandra and Nayer (2008). They find that the interest rates on debt are contracted
for duration of 7 to 15 years on average. As such, the interest advantage the privately-
held firm gains through delaying said negative inside information becoming public is
of significant size, ceteris paribus. From the point of view of the debt holders, they
will experience a higher degree of systematic risk on the issued debt prior to the
publication of negative insider information.
In contrast, publicly-traded firms are legally required to submit annual financial
statements, making them more transparent as a business in respect to their investors.
Privately-held firms however are generally not legally required to submit said
financial statements, therefore making them seem more opaque towards outsiders. As
such, Wittenberg-Moerman (2006) finds that information-asymmetry is larger with
privately-held firms than it is with publicly-traded firms.
2.4 Implications of financial distress
When a firm is no longer able to meet its financial obligations (towards its debt
holders, to be specific) it will experience financial distress. Because a firm has a
relative amount of liabilities compared to its total equity, the capital structure of such
firm would become rather complex to manage – especially when a firm has an array

15
of debt holders. A consequence of debt financing is that it could trigger a conflict of
interests between the shareholders on the one hand and the debt holders on the other
hand, this causing the gap between the management and shareholders to widen.
For example, debt holders would be inclined to prefer that the firm finances projects
containing as little financial risk as possible to ensure that they will be able to receive
their interest payments in the future. This is in contrast with the shareholders as they
would prefer that the firm engages in riskier projects in order to acquire a higher yield
on their respective investments.
Naturally there are costs linked to financial distress. These costs can be divided into
direct and indirect costs. The direct costs of financial distress are related to the costs
made when the firm files for Chapter 11. Such costs can contain administrative costs,
legal costs and the like. We would like to note however that the direct costs of
financial distress are rather limited while the indirect costs of financial distress
however are not. They tend to linger long after the firm has steered itself away from
financial distress.
The indirect costs of financial distress influence the behavior of various sections
within and around a firm; this because the rules of the game have changed as can be
found in the agency theory. Clients to a financially distressed firm will be more
cautious with placing orders with said firm as they are not certain whether the firm
will be operational for a sufficiently continued time to complete the requested order.
A similar line of thought applies to suppliers of the respective firm. Suppliers prefer
to supply firms of which they are certain they are able to pay for the delivered goods
or services.
Employees within a financially distressed firm still have to receive their wages
regardless of the situation said firm is in. Employees who can be fired to cut costs
generally will be fired by the management in an attempt to save the firm. An indirect
cost of this is that it causes a loss of human capital for such firm.
Lastly, because a financially distressed firm cannot meet its obligations to its debt
holders, it is forced to sell its assets at distressed prices in order to generate sufficient

16
cash flow to meet short-term financial requirements. Another immaterial, indirect
problem caused by financial distress is that the firm in question will take a reputation
hit and a loss in credibility to its suppliers, when its distress becomes public
knowledge.
2.5 Theoretical implications
The consequence of aforementioned theoretical findings is that privately-held firms
henceforth pay a higher interest percentage on their loans to compensate its investors
for the increased risks – caused by this information asymmetry between the firm and
its debt holders – than do publicly-traded firms, ceteris paribus – see Brav (2009).
Due to higher interest payments, the overall cost of capital for privately-held firms is
considered to be higher than that of publicly-traded firms. A consequence of this
statement is that privately-held firms are less flexible in restructuring the capital
structure of their firm than are publicly-traded firms, see Brav (2009). The latter
generally utilizes the capital market in order to acquire better loans – it is common
knowledge that in times of economical crisis, interest percentages drop. Therefore it
has become attractive to review outstanding debts in order to exchange these debts for
loans with a lower interest percentage, if it is legally permittable.
Secondly, there is equity to consider besides debt financing for both privately-held
and publicly-traded firms. Brav (2009) classifies this as the level effect. He finds that
the relative costs of debt financing are lower than the relative costs of equity financing
for privately-held firms due to differences in transaction costs between debt and
equity issuance. Therefore said firms will prefer debt financing over equity financing,
something which is in agreement with the static trade-off theory7. In contrast, because
publicly-traded firms have better access to capital markets than do privately-held
firms, the contrary applies to publicly-traded firms: the relative cost of equity for them
is lower than the relative cost of debt.
Because privately-held firms do not suffer from agency problems caused by top
management as do publicly-traded firms with respect to the capital structure, we can
now add our second hypothesis: 7 The static trade-off theory basically states that firms will prefer debt over equity until the cost of marginal debt has become equal to the cost of equity.

17
H2: publicly-traded firms have a lower Z-score as they are affected by agency
problems while privately-held do not.
Our motivation for above hypothesis is because publicly-traded firms suffer from
agency problems, they will perform less on an overall scale than do privately-held
firms within the same industry. Recall that a low Z-score indicates that the firm will
experience financial distress within the coming two years. Managers of publicly-
traded firms will be easier inclined to execute their own agenda for their own personal
gain – this because they are not the (full) owners of the firm in question. Such threat is
negligible in privately-held firms as the managers of such firm are its owners as well.
Lastly, we would like to add a few assumptions with respect to our empirical analysis,
either based on arguments of aforementioned theories or they will be argued upon
after they have been displayed below.
A1: the financial crisis occurred in 2007 in the United States8 and manifested itself
into a global economical crisis during the course of 2008.
We add this assumption to allow ourselves to draw a line after we have analyzed the
data from whereon the financial crisis may have affected the firms in our dataset. As
such, any statistical differences found outside the observed years of 2007 and 2008
are accounted to individual firm achievements or industry-specific influences.
Therefore our second assumption:
A2: Any statistical deviations in our dataset, after analysis, which are not in the years
2007 or 2008 are accounted to individual firm achievements or industry-specific
influences.
8 A few newspaper articles showing that over time the financial crisis in the United States manifested itself into a global economical crisis over time:Rutenberg, Jim, Peter Baker, Vill Vlasic. 2009. “Early Resolve: Obama Stands in Auto Crisis.” The New York Times, April 29, A1Goldman, David. 2009. “Bank bailout: What’s in the plan.” CNNMoney.com, February 10, http://money.cnn.com/2009/02/10/news/economy/bank_bailout_overhaul/index.htm (downloaded April 30, 2009)Pugh, Tony. 2009. “Businesses struggle as bank loans remain elusive.” The News & Observer, May 14, politics sectionLeow, Jason. 2009. “China Loans Hard to Get – Smaller Enterprises Left Dry as Bulk of Lending Goes to Big Projects.” The Wall Street Journal, May 14, Asia section

18
It is generally considered difficult to link financial distress with a firm’s performance.
It is either the chicken or the egg that came first: did poor performance cause the firm
to experience financial distress or did the effects of financial distress cause the firm to
perform poorly?9 For our analysis of the years 2007 and 2008 we assume:
A3: When a privately-held firm performs poorly in comparison to its publicly-traded
comparables, we assume the firm experiences financial distress10. Vice versa applies
for publicly-traded firms’ performance with respect to privately-held firms.
The positive approach for A3 holds true as well: if we do not find any financial
distress, we accredit this to proper management as seen in Whitaker (1999).
9 Andrade et al. (1998)10 Asquith (1994)

19
2.6 Summary
In this chapter we have discussed information asymmetry, agency problems and the
capital structure of the firm. We have put aforementioned three theoretical
frameworks in perspective with respect to privately-held and publicly-traded
companies. With this, we were able to derive our main research question and to define
both the direct and indirect effects of financial distress. For the sake of simplicity, we
have added three assumptions to allow ourselves to ignore any discrepancies we may
find in our dataset which are not related to the determination of financial distress
during the economic crisis of 2007 and 2008, respectively.
Figure 2 below displays an overview of the capital structure and its effects on both
privately-held and publicly-traded firms.
Figure 2: an overview of the theoretical effects of capital structure on both privately-held and publicly-
traded firms.
Type of firmPrivately-held Publicly-traded
- not legally mandatory to publish annual reports and financial statements
- legally obligated to publish annual reports and financial statements
- seems opaque to outsiders - seems transparant to outsiders
- information-asymmetry between insiders and outsiders of the firm
- information-asymmetry between insiders and outsiders, although to a lesser degree than is the case with privately-held firms
- pays higher interest rates on debt due to risk caused by information-asymmetry - pays market-based interest rates on debt- inflexible capital structure - flexible capital structure
- no or poor access to capital markets
- access to capital markets, renegotiates debt contracts in times of crisis to acquire lower interest rates on its debt
Capital structure of privately-held and publicly-traded firms

20
3. Data - Sample and Sample Description
3.1 Introduction
Our research question requires us to acquire a dataset which contains privately-owned
firms which are operational on the market of the European Union. Besides these
privately-owned firms, we require publicly-traded, comparable firms to determine
whether aforementioned privately-owned firms indeed experience no, less or a lesser
degree of financial distress than do their publicly-traded counterparts - thus
effectively answering our research question.
3.2 Data
We have decided to acquire said data from an established databank. Our choice
therefore has been Thomson ONE Banker11, more specifically the Worldscope
databank. We managed to secure our dataset by filtering the aforementioned databank
by issuing the following criteria12:
The firm had or has to be operational within one of the fifteen member states
of the European Union as per January 1st, 2004 during the time period January
1st, 2004 until December 31st, 2008 as displayed in table 1 below.
The firm has to be privately-owned
Working capital, total assets, retained earnings, earnings before interest and
taxes (EBIT), total common equity, total liabilities and total net sales has to be
known for said time period.
The firm must not be part of any of the following categories based on SIC
coding13, those being 60 till 65 and 67, thus effectively leaving the firms in the
financial sector out of the database as they have their own valuation criteria.
11 http://banker.thomsonib.com/12 Please view Appendix 5 in the back of this report for the variables and codes inserted in WorldScope to acquire our dataset.13 http://www.sec.gov/info/edgar/siccodes.htm

21
Table 1: breakdown of the number of privately-held firms in each of the member states
of the European Union as per January 1st, 2004.
Upon inserting above criteria in Worldscope, we obtain a total of 29 firms matching
aforementioned criteria. Now, from these 29 firms we need to find comparable firms
who match above financial criteria, as well as the following additional three
requirements:
The comparable firm must be publicly traded
The comparable firm's net sales must be ranked five places above or below the
privately-owned firm with which it is compared. This allows us to scale the
comparable sets based on the net sales criteria, thus allowing for fair
comparables and possibly eliminating any irregularities.
The comparable firm is operational in the same industry as that of the
privately-owned firm
After matching these 29 privately-owned firms with their comparables, we remain
with a total of 28 privately-owned firms - one privately-owned firm did not have any
publicly-traded comparables and is therefore no longer suitable to be in our dataset
and thus removed14. The remaining 28 firms, with their publicly-traded comparables,
are then considered our workable dataset. Although we must make note that some 14 Ober, located in France has been removed.
Country No. of privately-held firms PercentageAustria 0 0.00%Belgium 1 3.57%Denmark 1 3.57%Finland 0 0.00%France 4 14.29%Germany 11 39.29%Greece 0 0.00%Ireland 1 3.57%Italy 1 3.57%Luxembourg 0 0.00%Netherlands 2 7.14%Portugal 1 3.57%Spain 0 0.00%Sweden 0 0.00%United Kingdom 6 21.43%
Total privately-held firms: 28 100.00%
EU member states as per January 1st, 2004

22
publicly-traded comparables did not fully meet all of aforementioned criteria: for
certain years not all financial data was available. We deem this to be a slight issue
however as it will decrease the value of any comparison made between privately-
owned and publicly-traded firms.
As becomes clear from table 1 above, not all European member states are equally
represented in our analysis. Unfortunately due to aforementioned data limitations
from privately-held firms, there are several European countries which are not
represented at all. While on the other hand the three largest economies – those being
Germany (almost 40%), France (about 14%) and the United Kingdom (21%) – are
overrepresented. However, upon having SPSS perform a PP-plot to determine the
normality of the data, it appears – after applying a natural log transformation – that
the data is distributed normally within reason15. Although we must make note that
with a mere 28 observations divided over 15 EU countries, our dataset is rather on the
slim side. Therefore we will limit ourselves by applying our statistical findings to the
European Union as a whole rather than making any specific remarks per country per
se.
3.3 Summary
Within this chapter we have made the decision to acquire our dataset from
WorldScope. Next, we have defined the limitations and argued said limitations in
order to acquire the relevant data from said databank. From this dataset we have
presented the distribution of privately-held of firms over the member states of the
European Union as of January 1st, 2004. Lastly, we have made some final remarks
regarding the overall quality of the data based on statistical explorative study.
15 We employ a PP-plot in our statistical software package to determine the normality of our data. We believe this is of importance as normally distributed data is assumed to be representative towards the population as a whole and therefore allowing us to make stronger statements with respect to our findings further onward in this thesis.

23
4. Methodology
4.1 Introduction
After we have successfully acquired our dataset from WorldScope, we believe it is
appropriate to further elaborate upon the method of our choice in which we analyze
said dataset. We have studied various research papers to which we have referred in
the Introduction section, and have concluded that using financial ratios would be most
appropriate to analyze our data and henceforth to answer our research question. In this
chapter we will discuss our research setup and our exploratory findings acquired from
our dataset.
4.2 Research setup16
We are aware that there are superior econometric methods17 available at this time of
writing to analyze financial distress. However, as we are limited by the availability of
data from relevant privately-owned firms, such advanced models would yield
inaccurate results. As for Altman's Z-score (see Altman (1968) and the reviewed Z-
score in Altman (2000)), we analyze the underlying financial ratios separately rather
than using the Z-score exclusively. Reason for this is that we are comparing privately-
owned with publicly-traded firms in order to determine financial distress. The Z-score
merely measures bankruptcy – which is an extreme form of financial distress
however. Therefore we will be having a closer look at the underlying ratios to
determine whether privately-owned firms are leveraged more than their publicly-
traded comparables.
Furthermore we wish to define the financial ratios used in our analysis to measure the
degree of financial distress amongst privately-owned and publicly-traded firms.
Various studies consider the use of financial ratios as good predictors of bankruptcy18
- which can be an eventual result of financial distress, however extreme. Following
said studies; we will analyze our data based on financial ratios measuring
profitability, solvency and liquidity. We measure said criteria by using the following
16 We would like to note that Appendix 5 supplies an overview of the codings employed in the WorldScope database which we inserted in order to acquire our respective dataset.17 Recall Pindado et al. (2008).18 Deakin (1972), Altman (2000).

24
ratios:
Working capital ratio
The formula for the working capital ratio is defined as:
(1) Working capital ratio = WC / TA
Where:
WC = working capital
TA = total assets
According to previously mentioned studies in this paragraph, this is widely
considered the most significant financial ratio to measure financial distress.
This solvency ratio is more reliable than similar ratios such as the quick ratio
and the current ratio, as these are subject to manipulation through balance
accounts, see Altman (2000). Working capital is defined as the balance
difference between current assets and current liabilities. This allows us to
measure the liquidity of a firm. Recall from the theory chapter that a lack of
liquid assets can be a quick cause of financial distress for any firm.
Retained earnings ratio
The formula for the retained earnings ratio is defined as:
(2) Retained earnings ratio = RE / TA
Where:
RE = retained earnings
TA = total assets
This financial ratio partially measures the leverage of the firm. Firms with a
low leverage have financed themselves through retention of profits rather than
using debt-financing. Therefore we expect this profitability ratio of privately-
owned firms to be higher than that of publicly-traded firms as the latter

25
generally finances themselves with assets acquired from its owners while the
former has easier access to the capital market and therefore will have easier
access to equity. Retained earnings are defined as the total reinvested earnings
of a firm over its lifetime. Unfortunately this account is subject to
manipulation through stock dividend declarations and reorganizations. Altman
(2000) states that Retained Earnings is logically biased against younger firms
as they had less time than established firms to build up their earnings. As such
this rating would suggest that a younger firm would be in financial distress
quicker than it would for the established firms. This is exactly what occurs in
practice: 50% of the younger firms fail in the first five years (Dun &
Bradstreet, 1994).
Earnings ratio
The formula for the earnings ratio is defined as:
(3) Earnings ratio = EBIT / TA
Where:
EBIT = earnings before interest and taxes
TA = total assets
The level of solvency is measured by this financial ratio: if the liabilities
exceed the firm's assets (valued by its earning power), the firm will be likely
to suffer financial distress in the near future. Earnings before interest and taxes
are defined as what it says on the tin: it measures the total earnings of the firm
prior to taxation and interest payments. Therefore it measures the earning
power of the firm's assets, i.e. its true productivity. Henceforth we expect this
ratio to be higher for privately-owned firms than for publicly-traded firms, this
based on the same argument as mentioned previously.

26
Equity ratio
The formula for the equity ratio is defined as:
(4) Equity ratio = E / TL
Where:
E = market value or book value of equity19
TL = total liabilities
This financial ratio is another ratio to measure solvency. Essentially, it
measures to what degree the market value of equity may drop until the total
sum of liabilities exceed said equity, hence resulting in insolvency. Equity is
measured as the total sum held by investors in the firm in the shape of stock -
whether this is preferred or common. Fisher (1959) used this ratio in a study of
yield-spread differentials on corporate bonds, proving it a good predictor of
bankruptcy and thus financial distress.
Sales ratio
The formula for the sales ratio is defined as:
(5) Sales ratio = TNS / TA
Where:
TNS = total net sales
TA = total assets
In practice, this ratio is considered of little purpose. Regardless, this liquidity
ratio measures how much turnover a firm generates, thus indicating how well
the firm is able to handle a competitive market. As we are comparing
privately-held firms with publicly-traded firms within the same industry, we
deem this financial ratio relevant to consider in our analysis.
19 We employ the book value of equity for privately-held firms following Altman (2000) as their equity is not publicly traded and therefore has no visible or measurable market value.

27
The dataset contains comparables which are in the same industry as the privately-
owned firm. We do not need to express any concern towards differences in size of
firms in said database. Reason for this is that we use financial ratios which tend to
deflate any size-effects significantly and preserve the homogeneity of the data.
Secondly, as mentioned among the three requirements for comparables, the net sales
volume for said comparables lies closely to the net sales volumes of the privately-held
firms.
After we have processed the missing data in SPSS we have inserted the previously
mentioned five financial ratios. Lastly, we have added the following two formulae to
determine the Z-score for privately-owned firms and of publicly-traded firms. The Z-
score for privately-owned firms is an adjusted multiple discriminatory regression
formula of the traditional Z-score formula. Reason for this is that the original formula
was exclusively suited to determine financial distress (as in predicting bankruptcy
within the next two years) of publicly-traded firms only. The adjusted formula,
notated as Z’ is however used for privately held firms. Altman (2000) finds that
privately held firms have different weights attached to aforementioned five financial
ratios than do their publicly-traded comparables. The following two formulae are
taken from Altman (2000).
Altman’s Z-score for publicly-traded firms:
(6) Z = 1,2 X1 + 1,4 X2 + 3,3 X3 + 0,6 X4 + 0,999 X5
Altman’s Z-score for privately-owned firms:
(7) Z’ = 0,717 X1 + 0,847 X2 + 3,107 X3 + 0,42 X4 + 0,998 X5
Where:
Z = the Z-score for publicly-traded firms
Z’ = the Z-score for privately-held firms
X1 = (current assets – current liabilities) / total assets
X2 = retained earnings / total assets
X3 = earnings before interest and taxes (EBIT) / total assets

28
X4 = equity / total liabilities
X5 = sales / total assets
To recall for convenience, our research setup is displayed summarized in figure 3
below.
Figure 3: the research setup of our thesis summarized. We select a privately-owned firm and match it with a set of publicly-traded
firms based on the criteria mentioned above. We then calculate the working capital ratio, equity to total liabilities, earnings before
interest and taxes (EBIT) to total assets, retained earnings to total assets and finally the Z-score of both the privately-owned and the
publicly-traded firms. We then take the average of the publicly-traded comparables to compensate for outliers and incidental profits
or losses for individual companies – example: the sale of a division of a firm. Then finally we compare the comparison group with the
individual privately-held firm.
Privately-owned firm Publicly-traded firm Publicly-traded firm … Publicly-traded firm
working capital ratio working capital ratio working capital ratio … working capital ratio
equity to total liabilities equity to total liabilities equity to total liabilities … equity to total liabilities
EBIT to total assets EBIT to total assets EBIT to total assets … EBIT to total assets
retained earnings to total assets retained earnings to total assets retained earnings to total assets … retained earnings to total assets
Z-score Z-score Z-score … Z-score
<-------------------------------------------- COMPARISON GROUP -------------------------------------------->

29
4.3 Preliminary statistics
Furthermore, we wish to supply a breakdown of the sample distribution. As
mentioned amongst the requirements, we have left out the financial and insurance
sector as they have a different method of asset valuation therefore making an
objective comparison between said sector and others difficult.
2004 private firm
comparables2005 private firm
comparables
2006 private firmcomparables
2007 private firmcomparables
2008 private firmcomparables
Total
117
28
117
28
Number of observations
116
28
116
28
Sample information
28
117
723
Table 2: sample overview of the number of observations per type of firm, per year. Only in
2004 and 2005 we have two instances with a missing value.
In table 2 we find a breakdown of our dataset sorted by the number of observations
per firm type, per year. We have a total of 723 observations; therefore we experience
missing values in our dataset in 2004 and 2005, this for publicly-traded firms
exclusively. On average we have a scale of one privately-held firm versus four
publicly-traded comparable firms, this with a minimum of a one-on-one comparison
set and a maximum of a one-on-eight comparison set.
30
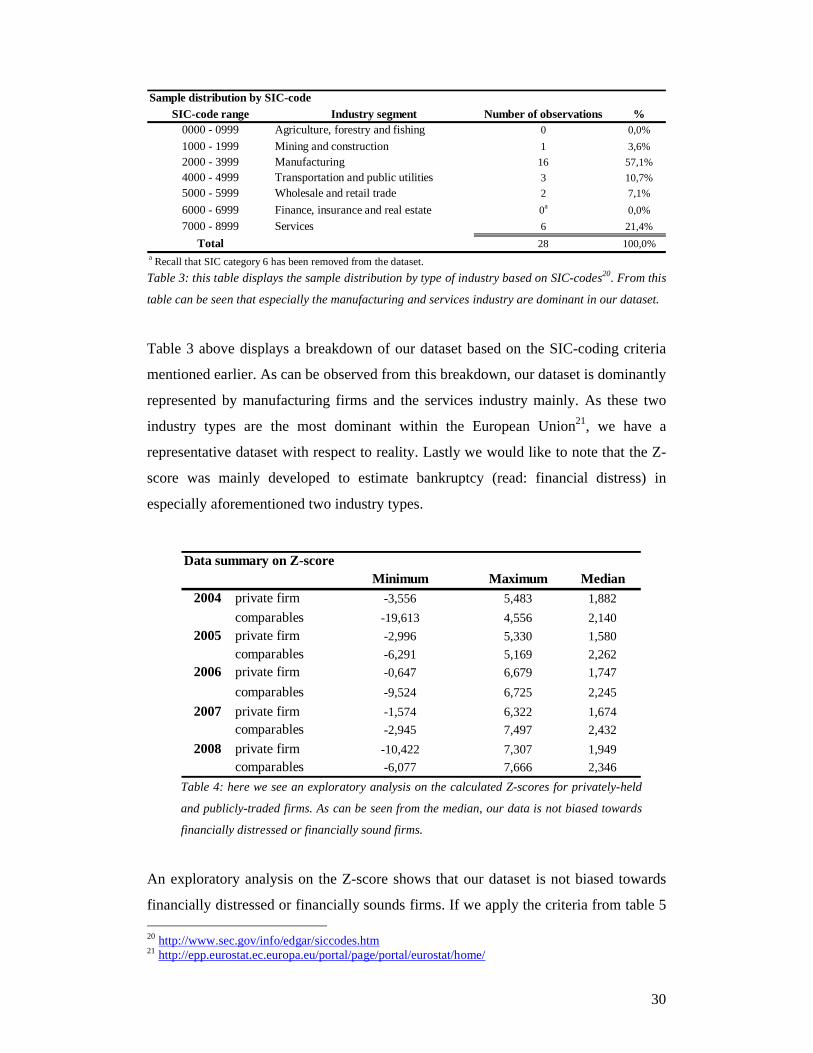
Table 3: this table displays the sample distribution by type of industry based on SIC-codes20. From this
table can be seen that especially the manufacturing and services industry are dominant in our dataset.
Table 3 above displays a breakdown of our dataset based on the SIC-coding criteria
mentioned earlier. As can be observed from this breakdown, our dataset is dominantly
represented by manufacturing firms and the services industry mainly. As these two
industry types are the most dominant within the European Union21, we have a
representative dataset with respect to reality. Lastly we would like to note that the Z-
score was mainly developed to estimate bankruptcy (read: financial distress) in
especially aforementioned two industry types.
Table 4: here we see an exploratory analysis on the calculated Z-scores for privately-held
and publicly-traded firms. As can be seen from the median, our data is not biased towards
financially distressed or financially sound firms.
An exploratory analysis on the Z-score shows that our dataset is not biased towards
financially distressed or financially sounds firms. If we apply the criteria from table 5 20 http://www.sec.gov/info/edgar/siccodes.htm21 http://epp.eurostat.ec.europa.eu/portal/page/portal/eurostat/home/
Minimum Maximum Median
2004 private firm -3,556 5,483 1,882
comparables -19,613 4,556 2,140
2005 private firm -2,996 5,330 1,580
comparables -6,291 5,169 2,262
2006 private firm -0,647 6,679 1,747
comparables -9,524 6,725 2,245
2007 private firm -1,574 6,322 1,674
comparables -2,945 7,497 2,432
2008 private firm -10,422 7,307 1,949
comparables -6,077 7,666 2,346
Data summary on Z-score
%0,0%
3,6%
57,1%
10,7%
7,1%
0,0%
21,4%
100,0%
2
0a
28
6
Wholesale and retail trade
Finance, insurance and real estate
Services
0
1
16
3
Agriculture, forestry and fishing
Mining and constructionManufacturingTransportation and public utilities
5000 - 5999
6000 - 6999
7000 - 8999
Total
0000 - 0999
1000 - 19992000 - 39994000 - 4999
Sample distribution by SIC-code
SIC-code range Industry segment Number of observations
a Recall that SIC category 6 has been removed from the dataset.
31
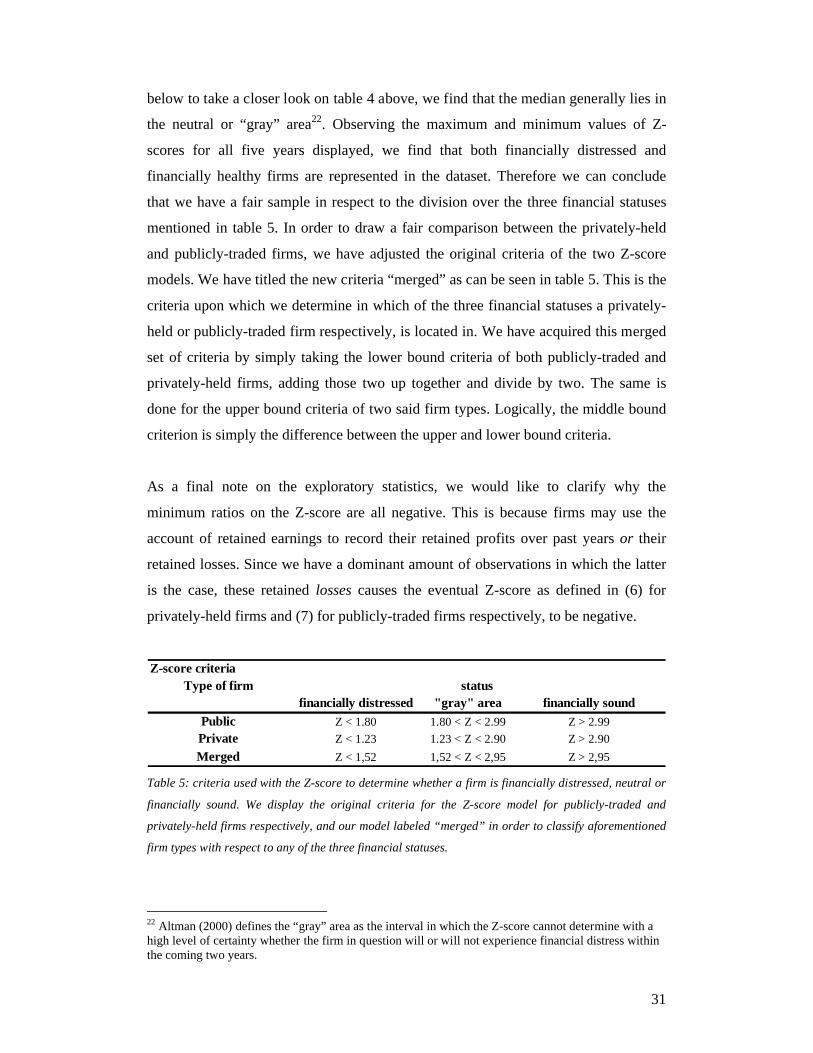
below to take a closer look on table 4 above, we find that the median generally lies in
the neutral or “gray” area22. Observing the maximum and minimum values of Z-
scores for all five years displayed, we find that both financially distressed and
financially healthy firms are represented in the dataset. Therefore we can conclude
that we have a fair sample in respect to the division over the three financial statuses
mentioned in table 5. In order to draw a fair comparison between the privately-held
and publicly-traded firms, we have adjusted the original criteria of the two Z-score
models. We have titled the new criteria “merged” as can be seen in table 5. This is the
criteria upon which we determine in which of the three financial statuses a privately-
held or publicly-traded firm respectively, is located in. We have acquired this merged
set of criteria by simply taking the lower bound criteria of both publicly-traded and
privately-held firms, adding those two up together and divide by two. The same is
done for the upper bound criteria of two said firm types. Logically, the middle bound
criterion is simply the difference between the upper and lower bound criteria.
As a final note on the exploratory statistics, we would like to clarify why the
minimum ratios on the Z-score are all negative. This is because firms may use the
account of retained earnings to record their retained profits over past years or their
retained losses. Since we have a dominant amount of observations in which the latter
is the case, these retained losses causes the eventual Z-score as defined in (6) for
privately-held firms and (7) for publicly-traded firms respectively, to be negative.
financially distressed "gray" area
Z < 1.80 1.80 < Z < 2.99
Z < 1.23 1.23 < Z < 2.90
Z < 1,52 1,52 < Z < 2,95Merged Z > 2,95
Z-score criteriaType of firm status
PublicPrivate
Z > 2.99
financially sound
Z > 2.90
Table 5: criteria used with the Z-score to determine whether a firm is financially distressed, neutral or
financially sound. We display the original criteria for the Z-score model for publicly-traded and
privately-held firms respectively, and our model labeled “merged” in order to classify aforementioned
firm types with respect to any of the three financial statuses.
22 Altman (2000) defines the “gray” area as the interval in which the Z-score cannot determine with a high level of certainty whether the firm in question will or will not experience financial distress within the coming two years.

32
4.4 Summary
Our methodology chapter argues to relate our dataset to our theoretical framework in
its research setup. It does so by combining our research question with the available
data, and Altman’s Z-score. The Z-score is based on five financial ratios, which are
then separately discussed and defined.
Secondly, we take a look at the preliminary statistics from our dataset. From here we
learn that our dataset is not specifically biased towards financially sound, neutral or
financially distressed firms – be this privately-held or publicly-traded firms. Instead,
we find that all three groups are represented in our dataset. To illustrate the purpose of
our utilization of Altman’s Z-score, we have inserted a table with the original criteria
for privately-held and publicly-traded firms, and a “merged” group which is used
throughout the remainder of this report to measure financial distress within
comparison sets.

33
5. Results
5.1 Introduction
Due to the large amount of tables and other graphical overviews available upon data
analysis, we limit ourselves here to the most prominent of said tables. The remaining
graphs not displayed here can be found in the Appendix and will be directed to
throughout the next chapter.
Since we have made 28 sets of comparables, this being one privately-held firm versus
a set of publicly-traded comparable firms – recall that this is based on net sales to
compensate for industry size - we therefore have a preselected dataset. As such we
have employed a paired samples t-test using SPSS. A requirement for executing such
test is that the used data is normally distributed – or at least within reason of a normal
distribution. Upon executing a PP-plot to determine whether our dataset is normally
distributed, we have found that our dataset matches normal distribution within reason.
Although we appear to lack in the quantity of observations, the quality of the
observations we have managed to secure within our dataset appear to compensate for
it. Nonetheless, as we only have a limited amount of observations, we will apply a
10% critical value rather than the traditional 5% to compensate for said data
limitation. As SPSS created an enormous amount of output, we have decided to limit
our statistical output to the most relevant tables and graphs with respect to the
research question.
Recall that we use the Z-score to analyze the firm’s performance during times of
economic crisis. We have made the assumption in a previous chapter that the
economic crisis started in 2007 and manifested itself globally during the course of
2008. We therefore expect to see statistical variations between privately-held and
publicly-traded firms during these two years specifically. Another assumption we
added is that any other anomalies in the statistical output can be clarified by market-
and industry influences. In order to thoroughly assess the statistical output, we will
discuss the statistical analysis of all five statistical ratios separately first. Finally, we
will assess the statistical output of the Z-score.

34
For each of the tables in this chapter, a pair refers to the comparison made between
privately-held and publicly-traded firms, in which the former is inserted first.
Therefore a positive t-value implies that privately-held firms have a higher value for
that respective observation than do publicly-traded firms. The opposite holds true if a
t-value is negative.
5.2 Working capital ratio
Table 6: this table displays the working capital ratio between privately-held and publicly-
traded firms. Only the observations from 2004 prove to be statistically significant; therefore
we assume no significant difference in working capital between publicly-traded and privately-
held firms.
Recall that the working capital ratio is one of the prominent determinants of financial
distress. From table 6 we find that there is no statistically significant difference in
working capital ratios between privately-held and publicly-traded firms. In Brav
(2009) we find that the capital structure of privately-held firms is less flexible than
those of publicly-traded firms. This is caused due to poor or no access to the capital
markets of the former mentioned firm type.
Regardless of their access to capital markets, it appears that privately-held firms are
then just as able to keep a sufficient level of liquid assets to prevent an occurrence of
financial distress. On the one hand, for all observations except 2004 prove to be
statistically insignificant, therefore we have to conclude that there is no significant
difference in working capital between privately-held and publicly-traded firms. On
the other hand we wish to recall that we are working with a very limited dataset. It
could be that we lack a sufficient number of observations to make any solid
conclusions on this financial ratio.
alpha = 10% Year t-value SignificancePair 1 2004 1,843 0,038
Pair 2 2005 0,421 0,338
Pair 3 2006 -0,753 0,229
Pair 4 2007 -0,408 0,343
Pair 5 2008 0,043 0,483
Working capital to total assets

35
5.3 Retained earnings ratio
Table 7: this table displays the retained earnings ratio between privately-held and publicly-
traded firms. We find that only our observations for 2004 and 2007 are statistically
significant at the 10% threshold.
The retained earnings ratio measures the leverage within a firm. A firm with a low
retained earnings rating is suspected to finance itself through debt rather than retained
profits over past years, thus effectively leading to unsustainable growth. From table 7
we find a mixed result: only 2004 and 2007 appear to be statistically significant
against the 10% critical value. For 2004 we can state that the observed publicly-traded
comparables have better retained earnings ratios than do their privately-held
counterparts. The opposite is true for 2007.
What we found in studies mentioned in the theoretical chapters of this thesis with
respect to the retained earnings ratio is that privately-held firms lack access to the
capital markets; they are more inclined to retain their profits from past years in order
to finance their projects to ensure sustainable business growth in the future. This
would confirm our observation for the year 2007, in which we effectively observe that
during years of economic crisis, privately-held firms retain a larger share of the profits
from former years to survive the economic crisis than do publicly-traded firms. The
latter group will be more inclined to restructure its debt through the capital markets
during an economic crisis to take advantage of the favorable interest rates, see Brav
(2009). What goes for the working capital ratio applies to the retained earnings ratio
as well: we believe a more sizeable analysis is needed to confirm our findings and
those of the references mentioned.
alpha = 10% Year t-value Significance
Pair 1 2004 1,538 0,068
Pair 2 2005 0,120 0,523
Pair 3 2006 -0,182 0,428
Pair 4 2007 -1,563 0,065
Pair 5 2008 -0,946 0,176
Retained earnings to total assets

36
5.4 Earnings ratio
Table 8: here we find an overview of the earnings before interest and taxes (EBIT) divided by
the total assets of the firm. Here we find that none of our observations are considered
statistically significant, therefore concluding that there is no significant difference in earnings
ratio between privately-held and publicly-traded firms.
The ratio of earnings before interest and taxes (EBIT) to total assets measures the
solvency of the firm. It does so by showing the amount of revenue a firm generates in
relation to its total assets. Or to use the American expression: it shows how much
“bang for your buck” an investor may gain through investing in the firm in question.
From table 8 we may conclude that none of the observed years is statistically
significant. Henceforth we may logically state that there is no statistically significant
difference in earnings ratio between publicly-traded and privately-held firms, whether
this be in times of economic crisis or otherwise.
The implication of this finding is that the assets of privately-held firms have similar
yields compared to the assets of publicly-traded firms. This while our theoretical
framework back in this report stated that privately-held firms have a higher degree of
risk as they are more opaque to outsiders. A suggestive research question which
comes to mind here then is whether investors get compensated for this additional risk
by investing in such privately-held firms – if this would be practically viable, that is.
alpha = 10% Year t-value Significance
Pair 1 2004 1,029 0,156
Pair 2 2005 0,408 0,343
Pair 3 2006 0,800 0,215
Pair 4 2007 -0,720 0,239
Pair 5 2008 -0,523 0,303
Earnings before interest and taxes (EBIT) to total assets

37
5.5 Equity ratio
Table 9: in this table we find the equity displayed against the total liabilities of the firm.
Again the t-values are negative implying that privately-held firms have better equity to total
liability ratios than do publicly-traded firms. Note however that this statement is barely
relevant as only our observations from 2007 are statistically significant– assuming a 10%
threshold.
In contrast with our hypothesis, we find evidence for 2007 that the privately-held
firms have better equity to total liabilities ratios than do their publicly-traded
comparables as seen in table 9 above23. For all other years however we find no
statistical evidence that there is any significant difference in equity ratio between
publicly-traded and privately-held firms. We believe that the explanation of this
finding can be found in Chandra and Nayar (2008). They find that privately-held
firms have liabilities which indeed might be larger expressed as a percentage of total
equity, but are smaller in absolute numbers than those of publicly-traded firms. This
same finding however violates most of our theoretical framework stating that
privately-held firms are more inclined to employ debt financing. We suggest an
analysis on a larger scale ought to be executed to verify our findings.
23 This because the t-value for 2007 is negative, thus implying that the group which we inserted first in SPSS has a higher value on the equity ratio than does the second group. Typically, for each table we inserted the privately-held firms as the first group.
alpha = 10% Year t-value Significance
Pair 1 2004 -1,119 0,137
Pair 2 2005 -1,179 0,125
Pair 3 2006 -0,330 0,372
Pair 4 2007 -1,311 0,100
Pair 5 2008 -0,511 0,307
Equity to total liabilities

38
5.6 Sales ratio
Table 10: this table displays the net sales of the firm in relation to the total assets. As all five
observations are statistically insignificant, we may conclude that there is no significant
difference in net sales to total assets between privately-held and publicly-traded firms.
Recall that the net sales to total assets ratio was inserted to ensure that the publicly-
traded comparables were suitable for comparison with the privately-held firms. The
second function of this ratio is to show to what degree a firm can handle itself in the
face of competition. As said ratio is not statistically significant as seen in table 10,
privately-held firms have similar net sales to total assets ratios as those of publicly-
traded firms.
In our theory chapter we however state that privately-held firms are generally more
leveraged than are publicly-traded firms. We can clarify these by referring back to the
agency-theory mentioned previously in the theory chapter of this thesis – as such we
may assume we lack statistically sufficient observations to confirm said theories.
Although the management of privately-held firms is usually in control of the firm,
having leverage within their firm discourages them to shirk or to take on negative
NPV projects, see Whitaker (1999) and Brav (2009). They have to save their short-
term assets in order to pay off their debt holders or make interest payments to such
debt holders. Examples of failing to be an effective manager can be found in the 90’s:
in the United States corporate raiders bought up firms which were run by a sub-
optimal management in order to restructure its capital structure, thereby forcing
management to be more effective with the firm’s cash flows.
alpha = 10% Year t-value Significance
Pair 1 2004 0,883 0,193
Pair 2 2005 -0,448 0,329
Pair 3 2006 0,428 0,336
Pair 4 2007 0,464 0,323
Pair 5 2008 0,482 0,317
Net sales to total assets

39
5.7 Z-score
Table 11: The overall results of the five financial ratios statistically analyzed are displayed in
the above table. In years of economic crisis (those being 2007 and 2008), privately-held firms
have a significantly better overall Z-score than do publicly-traded firms. This is statistically
significant at the 10% threshold as well as the traditional 5% threshold.
Finally, we have table 11 with the Z-score of privately-held and publicly-traded firms.
Recall that the Z-score is a multiple discriminatory formula based upon the five
financial ratios we just discussed. From table 11 above, we can conclude that
privately-held firms have significantly better Z-scores than do publicly-traded firms –
this being statistically significant for the years 2007 and 2008 at both the 5% and the
10% threshold.
This confirms our hypothesis that publicly-traded firms, which are generally
controlled by a management which does not (fully) own the firm, are more inclined to
shirk on their responsibilities and perform sub-optimally. This is however in contrast
with privately-held firms which are directly owned by its management. The
implication of this result with respect to our theoretical framework is that publicly-
traded firms indeed experience agency costs caused by information-asymmetry in the
shape of sub-optimal performance caused by management shirking or employing
negative NPV projects.
5.8 Summary
Our results in this chapter have proven to be statistically insignificant for all five of
the financial ratios discussed. Therefore we may conclude that, based on these five
financial ratios individually, that there is no statistically significant difference
between privately-held firms and publicly-traded firms during times of economic
crisis. However, the Z-score is significant during the years of economic crisis, thus
allowing us to conclude that if we consider aforementioned five financial ratios as a
alpha = 10% Year t-value SignificancePair 1 2004 0,867 0,197
Pair 2 2005 -0,621 0,270
Pair 3 2006 -0,184 0,428
Pair 4 2007 -2,837 0,004
Pair 5 2008 -1,701 0,050
Z-score

40
whole – which is what the Z-score is – we find that there is indeed a statistically
significant difference between privately-held and publicly-traded firms. We find it
worth to note that a duplicate research with a larger amount of observations is
recommended in order to confirm our findings till thus far.

41
6. Discussion
6.1 Introduction
Aside from the statistical analysis which has been discussed in the previous chapter,
we have also added graphical displays of each of the 28 comparison sets. These can
be found in the Appendix chapter and will be discussed further in this chapter.
Secondly, we will discuss tabular overviews which will allow us to get a closer look
to the actual dataset employed for this analysis as a statistical analysis does not
always classify actual differences in data as statistically significant.
6.2 Findings
In appendix 2 we have added an overview of the Z-scores as found in our dataset. As
can be observed from this appendix, the number of comparables in each set varies
from one-on-one comparisons up to one-on-eight comparisons. Logically, the more
comparable firms in a set, the more accurate – i.e. the least biased towards a specific
firm in such comparables set - the average of such set is. We also observe that in
comparison set 6 there are two missing values present for 2004 and 2005 respectively.
Furthermore, appendix 3 is derived from the results found in appendix 2. If we
consider the overview of firm performance displayed in appendix 3 in combination
with the Z-score criteria displayed in table 5, then we are able to produce table 12
below. We have defined the criteria as follows:
Far better performance / far worse performance
A privately-held firm performs far better or far worse when in appendix 3 the
“X” marking lies two columns away from the “X” marking of the publicly-
traded firm.
Better performance / worse performance
A privately-held firm performs better or worse when in appendix 3 the “X”
marking lies one column away from the “X” marking of the publicly-traded
firm.

42
Same performance
A privately-held firm is considered to have the same level of performance
when the “X” marking lies in the same column as that of the publicly-traded
average.
Level of performance no. of private firms percentageFar better performance 1 3.57%
Better performance 2 7.14%
Same performance 18 64.29%
Worse performance 5 17.86%
Far worse performance 2 7.14%
Total 28 100.00%
Percentage overview of privately-held firms performance in comparison with publicly-traded firms in 2008
Table 12: an overview of the performance of privately-held firms set out on a
five point scale in comparison with publicly-traded firms. From the table we
can clearly see that based on our observations, privately-held firms on overall
perform slightly worse than do publicly-traded firms in the same sector.
If we consider the information displayed in table 12, we can conclude on the overall
that 25% of the privately-held firms in our dataset perform worse than do publicly-
traded firms. This does not come as a surprise however as our theoretical framework
argues that since privately-held firms have a less flexible capital structure and tend to
prefer debt financing over equity financing24, that we suggested that such privately-
held firms would achieve lesser performances than their less-leveraged publicly-
traded comparables. Regardless, as could be seen from table 11, this has no
statistically significant effect on the overall Z-score of the 28 comparison sets.
As the results displayed in table 12 appear not to be statistically significant, we may
account the actual difference between the privately-held and publicly-traded firms to
coincidence within the dataset rather than a structural difference between two said
parties. It would be likely that if a larger examination was performed, that either the
analytical results would be statistically significant, or we would not find such
differences as displayed in table 12.
24 Recall Brav’s level effect.
43
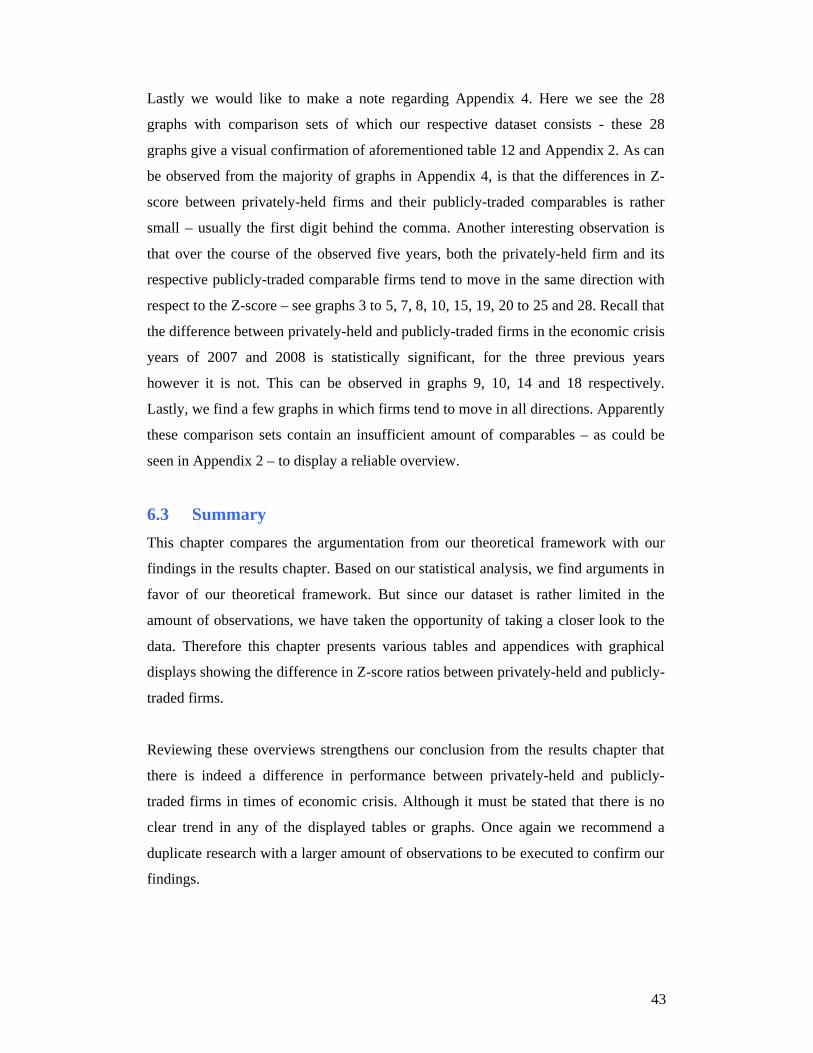
Lastly we would like to make a note regarding Appendix 4. Here we see the 28
graphs with comparison sets of which our respective dataset consists - these 28
graphs give a visual confirmation of aforementioned table 12 and Appendix 2. As can
be observed from the majority of graphs in Appendix 4, is that the differences in Z-
score between privately-held firms and their publicly-traded comparables is rather
small – usually the first digit behind the comma. Another interesting observation is
that over the course of the observed five years, both the privately-held firm and its
respective publicly-traded comparable firms tend to move in the same direction with
respect to the Z-score – see graphs 3 to 5, 7, 8, 10, 15, 19, 20 to 25 and 28. Recall that
the difference between privately-held and publicly-traded firms in the economic crisis
years of 2007 and 2008 is statistically significant, for the three previous years
however it is not. This can be observed in graphs 9, 10, 14 and 18 respectively.
Lastly, we find a few graphs in which firms tend to move in all directions. Apparently
these comparison sets contain an insufficient amount of comparables – as could be
seen in Appendix 2 – to display a reliable overview.
6.3 Summary
This chapter compares the argumentation from our theoretical framework with our
findings in the results chapter. Based on our statistical analysis, we find arguments in
favor of our theoretical framework. But since our dataset is rather limited in the
amount of observations, we have taken the opportunity of taking a closer look to the
data. Therefore this chapter presents various tables and appendices with graphical
displays showing the difference in Z-score ratios between privately-held and publicly-
traded firms.
Reviewing these overviews strengthens our conclusion from the results chapter that
there is indeed a difference in performance between privately-held and publicly-
traded firms in times of economic crisis. Although it must be stated that there is no
clear trend in any of the displayed tables or graphs. Once again we recommend a
duplicate research with a larger amount of observations to be executed to confirm our
findings.

44
7. Conclusion
7.1 Introduction
Using a dataset containing a total of 28 privately-held firms we have analyzed to
determine whether there is a statistically significant difference between privately-held
firms and publicly-traded firms with respect to financial distress during the economic
crisis of 2007 and 2008, respectively. Our hypothesis in this thesis is that privately-
held firms are more inclined to employ debt financing than do their publicly-traded
counterparts, this due to poor or no access to the capital markets. Therefore the equity
to total liabilities ratio from publicly-traded firms will be higher than that of privately-
held firms.
As described in our methodology section, we have acquired a dataset from
WorldScope containing the relevant data of both privately-held and publicly traded
firms. This combined with the Z-score from Altman (2000), and the underlying five
financial ratios, those being the working capital ratio, the retained earnings ratio, the
net sales ratio, the earnings ratio and the equity ratio we are able to find a statistically
significant difference in Z-scoring between the privately-held and publicly-traded
firms, this in favor of the former mentioned.
Below you will find the implication of our research, our recommendations for further
research and finally our conclusion.
7.2 Implications
Unfortunately we were restricted by data limitations, therefore limiting ourselves to
merely making comments regarding our findings applicable to the European Union as
a whole rather than to each specific member state as of January 1st, 2004. We believe
this research topic can be of significant value to the European Union as it has
relatively more privately-held firms than does the United States for example – as a
consequence any American research findings do not have to be applicable in the
European Union and vice versa, per se.

45
Our report finds that privately-held firms perform significantly better in times of
economic crisis than do publicly-traded25. Even though theory suggests that the
former tends to employ debt financing more frequently than does the latter, similar
theories suggest that privately-held firms tend to retain more of their profits to see
through economic turmoil than do publicly-traded firms. We also noted that this is
true in relative numbers with respect to total equity, but does not necessarily hold
when compared in absolute numbers.
7.3 Recommendations
Admittedly, we have only had the chance to take a slight peek at this research topic.
Regardless, we believe that the European government(s)26 would consider this report
a subject of further interest. If it is really true that privately-held firms indeed perform
better than do publicly-traded firms in economic crises, the government(s) would do
good by reviewing their tax policies to determine whether a similar result could be
encouraged amongst publicly-traded firms, therefore benefitting the European
economy as a whole.
As has been noted throughout this report, we recommend a similar research is to be
executed with respect to our research question, but with a larger amount of
observations in order to review our findings. Another point of interest would be to
verify – also with a larger dataset – whether privately-held firms indeed differ
significantly from publicly-traded firms with respect to their capital structure and
financing decisions.
7.4 Conclusion
Based on our analysis we have found that none of the five financial ratios, those being
the working capital ratio, earnings ratio, equity ratio, net sales ratio and the retained
earnings ratio appear to be statistically significant. However, after processing these
aforementioned five financial ratios into Altman’s Z-score model for privately-held
firms and publicly-traded firms, respectively, we do find a statistically significant
25 This exclusively for the Z-scores measured between privately-held and publicly-traded firms however. We have found no statistically significant evidence that there is any difference in the five underlying financial ratios.26 Let this be the government from each member state separately or the European government in Brussels.

46
difference between the two aforementioned stakeholders0 – this in favor of the
privately-held firms.
As such our conclusion is that privately-held firms indeed do perform better than do
their publicly-traded comparables. The former experiences a lesser degree of agency
problems as fewer parties are involved in the decision making with respect to the
capital structure of the firm or its investment decisions. Although these same
privately-held firms seem more opaque to outsiders as they are not legally obligated
to publish their financial records, they are suspected of having a more committed
management – committed as in to the firm rather than the managers’ perks and
luxuries – than do publicly-traded firms.
Secondly, reference studies find that privately-held firms tend to employ debt
financing more frequently, which is in line with the pecking-order theory and to some
degree with the trade-off theory with respect to capital structure. We have however
found no such evidence in our dataset due to lack of sufficient observations. On the
other hand, we have found statistical evidence that privately-held firms indeed have
significantly higher retained earnings than do publicly-traded firms. On the overall,
utilizing the aforementioned Z-score, privately-held firms only significantly
outperform publicly-traded firms in times of economic turmoil. Outside of such harsh
times, we have found no evidence that the aforementioned two firm types outperform
one another.
7.5 Summary
In this report we have issued the research question asking ourselves whether there is a
difference in performance between privately-held and publicly-traded firms during
the economic crisis of 2007 and 2008 in the European Union. To shape our research
question, we have argued the possible effects based on the agency theory, the capital
structure of the firm and information asymmetry.
Then we discuss the utilization of five financial ratios and the use of Altman’s Z-
score model. We argue its validity based on various similar researches done by other

47
authors with respect to financial distress. Next we have explored our dataset to
determine the nature of the data we have acquired through WorldScope.
Our results chapter then finds that there is no statistically significant difference in
performance between privately-held and publicly-traded firms during times of
economic crisis. Our side note is that our data is rather limited by the number of
observations. This note is reinforced by the fact that we find a statistical significant
difference in performance between privately-held firms and publicly-traded during
times of economic crisis based on Altman’s Z-score. This difference in performance
is in favor of the privately-held firms.
Lastly, we take a closer look at our data by the means of tabular and graphical
displays. Although we are unable to find a clear trend in either of the tabular or
graphical displays, we can safely conclude that during times of economic crisis,
privately-held firms perform slightly better than do publicly-traded firms.

48
Reference list
Literature
Altman, Edward I. 2000. Predicting Financial Distress of Companies: Revisiting the
Z-Score and Zeta® Models, Journal of Banking & Finance No. 1, (1977,
forthcoming)
Andrade, Gregor, Steven N. Kaplan. 1998. How Costly is Financial (Not Economic)
Distress? Evidence from Highly Leveraged Transactions that Became Distressed, The
Journal of Finance, Vol. 53, No. 5, October
Asquith, Paul. 1994. Anatomy of Financial Distress: An Examination of Junk-Bond
Issuers, Quarterly Journal of Economics, No. 109, p. 625-658
Aziz, M. Adnan, Humayon A. Dar. 2004. Predicting Corporate Financial Distress:
Whither do We Stand? Loughborough University, UK, White Paper, March
Berk, Jonathan, Peter DeMarzo. 2007. Corporate Finance, 1st ed., p. 491-523
Brav, Omer. 2009. Access to Capital, Capital Structure, and the Funding of the Firm,
The Journal of Finance, Vol. 64, No. 1, p. 263-308
Brounen, Dirk, Abe de Jong, and Kees Koedijk. 2005. Capital Structure Policies in
Europe: Survey Evidence, ERIM Report Series Research in Management
Burgstahler, David, Luzi Hail and Christian Leuz. 2004. The Importance of Reporting
Incentives: Earnings Management in European Private and Public Firms, The
Wharton Financial Institutions Center, working paper 04-07, February
Chandra, Uday, Nandkumar Nayar. 2008. The Information Content of Private Debt
Placements, Journal of Business Finance & Accounting, Vol. 35 (9 and 10), p. 1164-
1195, November / December

49
Chaitanya, Kirshna V. 2005. Measuring Financial Distress of IDBI Using Altman Z-
Score Model, Journal of Bank Management, Vol. 3, p. 7-17, August
Collins, James Charles. 2001. Good to Great: Why Some Companies Make the
Leap…and Others Don’t, 1st ed., p. 23-24, 33, 149
Distinguin, Isabelle, Philippe Rous, and Amine Tarazi. 2006. Market Discipline and
the Use of Stock Market Data to Predict Bank Financial Distress, Journal of Finance
No. 30, p. 151-176
Kahl, Matthias. 2002. Economic Distress, Financial Distress and Dynamic
Liquidation, The Journal of Finance, Vol. 62, No. 1, February
Kalckreuth, Ulf von. 2005. A “wreckers theory” of financial distress, Deutsche
Bundesbank, Discussion Paper Series 1: Economic Studies, No. 40
Modigliani, Franco, Merton H. Miller. 1958. The Cost of Capital, Corporation
Finance and the Theory of Investment, The American Economic Review, Vol. 43, No.
3, June
Pindado, Julio, Luis Rodrigues. 2005. Determinants of Financial Distress Costs, Swiss
Society for Financial Market Research – Financial Markets and Portfolio
Management, Vol. 19, No. 4, p. 343-359
Pindado, Julio, Luis Rodrigues and Chabela de la Torre. 2008. Estimating Financial
Distress Likelihood, Journal of Business Research Vol. 61, p. 995-1003
Whitaker, Richard. 1999. The Early Stages of Financial Distress, Journal of
Economics and Finance, Vol. 23, No. 2, p. 123-133
Wittenberg-Moerman, Regina. 2008. The role of information asymmetry and financial
reporting quality in debt trading: Evidence from the secondary loan market, Journal
of Accounting and Economics, No. 46, p. 240-260

50
Online resources
Thomson ONE Banker, WorldScope databank: http://banker.thomsonib.com/
SIC Coding categories index: http://www.sec.gov/info/edgar/siccodes.htm
Eurostat database: http://epp.eurostat.ec.europa.eu/portal/page/portal/eurostat/home/
Newspapers
Goldman, David. 2009. “Bank bailout: What’s in the plan.” CNNMoney.com,
February 10,
http://money.cnn.com/2009/02/10/news/economy/bank_bailout_overhaul/index.htm
(downloaded April 30, 2009)
Hilsenrath, Jon, Serena Ng, and Damian Paletta. 2008. “Worst Crisis Since ‘30s, With
No End Yet in Sight.” The Wall Street Journal, September 18, A1
Landler, Mark. 2008. “The U.S. Financial Crisis Is Spreading to Europe” The New
York Times, September 30, C1.
Leow, Jason. 2009. “China Loans Hard to Get – Smaller Enterprises Left Dry as Bulk
of Lending Goes to Big Projects.” The Wall Street Journal, May 14, Asia section
Pugh, Tony. 2009. “Businesses struggle as bank loans remain elusive.” The News &
Observer, May 14, politics section
Rutenberg, Jim, Peter Baker, Vill Vlasic. 2009. “Early Resolve: Obama Stands in
Auto Crisis.” The New York Times, April 29, A1

51
Appendix
Appendix 1
List of definitions used in this report accompanied by a brief description.
Term Definition
(a) comparableA firm which is in the same industry and approximately of the same size (usually measured in net sales volume) as the firm to which it is compared.
comparables set A group of comparable firmsEBIT Abbrevation for earnings before interest and taxes .
economical distress
The definition of this term is when a firm or economy is structurally shrinking rather than growing. If this remains for a sufficient time with a firm, it may eventually lead to bankrupcy.
financial distressA term for the situation in which a firm can no longer comply with its agreements to debt holders.
financial ratioRatios used in the science of corporate finance to determine certain aspects deemed significant to any firm. Such aspects include solvency, liquidity and profitability.
privately-held firm A firm of which the equity is not publicly traded or listed on any stock exchange.publicly-traded firm A firm of which the equity is publicly traded and listed on any stock exchange.
Z-score
Altman's Z-score is based on five statistically significant financial ratios, those being working capital ratio, retained earnings ratio, EBIT to total assets ratio, equity to total liabilities ratio and net sales to total assets ratio. The Z-score is to determine whether the firm in question will experience financial distress within the coming two years (with approximately 80% reliability in its predictions).
List of definitions used throughout this report
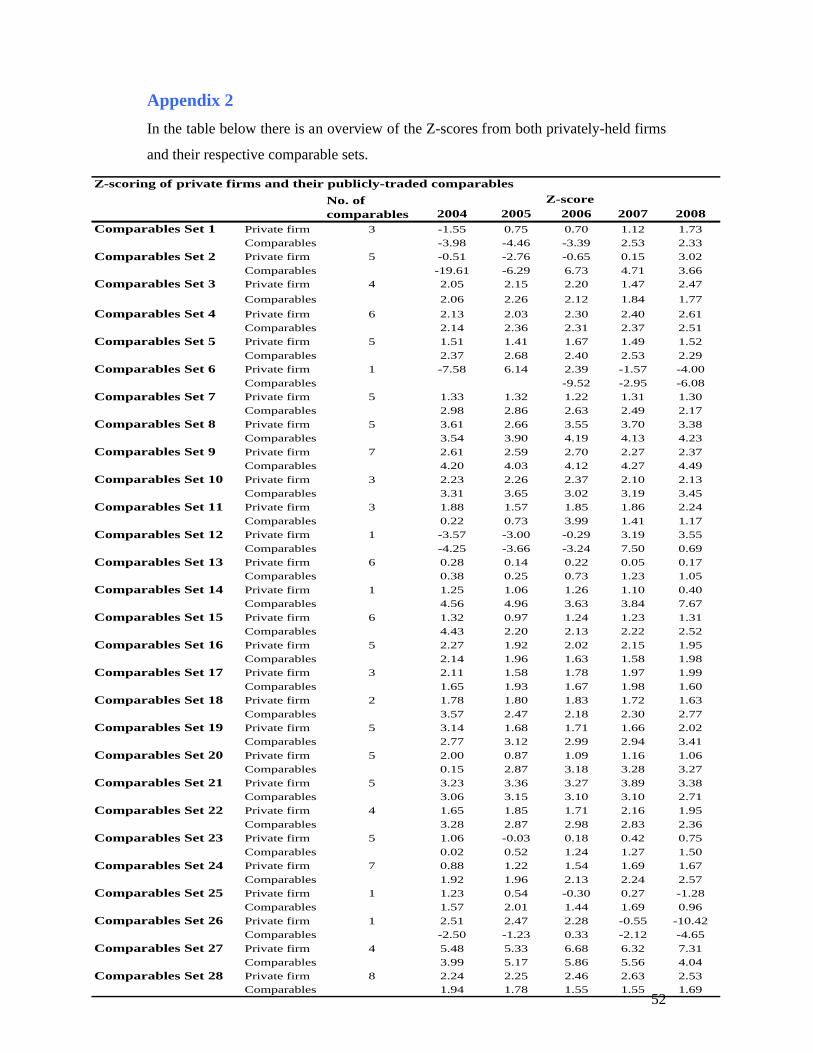
52
2004 2005 2006 2007 2008Comparables Set 1 Private firm 3 -1.55 0.75 0.70 1.12 1.73
Comparables -3.98 -4.46 -3.39 2.53 2.33
Comparables Set 2 Private firm 5 -0.51 -2.76 -0.65 0.15 3.02
Comparables -19.61 -6.29 6.73 4.71 3.66Comparables Set 3 Private firm 4 2.05 2.15 2.20 1.47 2.47
Comparables 2.06 2.26 2.12 1.84 1.77
Comparables Set 4 Private firm 6 2.13 2.03 2.30 2.40 2.61Comparables 2.14 2.36 2.31 2.37 2.51
Comparables Set 5 Private firm 5 1.51 1.41 1.67 1.49 1.52
Comparables 2.37 2.68 2.40 2.53 2.29
Comparables Set 6 Private firm 1 -7.58 6.14 2.39 -1.57 -4.00
Comparables -9.52 -2.95 -6.08
Comparables Set 7 Private firm 5 1.33 1.32 1.22 1.31 1.30Comparables 2.98 2.86 2.63 2.49 2.17
Comparables Set 8 Private firm 5 3.61 2.66 3.55 3.70 3.38Comparables 3.54 3.90 4.19 4.13 4.23
Comparables Set 9 Private firm 7 2.61 2.59 2.70 2.27 2.37Comparables 4.20 4.03 4.12 4.27 4.49
Comparables Set 10 Private firm 3 2.23 2.26 2.37 2.10 2.13Comparables 3.31 3.65 3.02 3.19 3.45
Comparables Set 11 Private firm 3 1.88 1.57 1.85 1.86 2.24
Comparables 0.22 0.73 3.99 1.41 1.17
Comparables Set 12 Private firm 1 -3.57 -3.00 -0.29 3.19 3.55
Comparables -4.25 -3.66 -3.24 7.50 0.69
Comparables Set 13 Private firm 6 0.28 0.14 0.22 0.05 0.17Comparables 0.38 0.25 0.73 1.23 1.05
Comparables Set 14 Private firm 1 1.25 1.06 1.26 1.10 0.40Comparables 4.56 4.96 3.63 3.84 7.67
Comparables Set 15 Private firm 6 1.32 0.97 1.24 1.23 1.31Comparables 4.43 2.20 2.13 2.22 2.52
Comparables Set 16 Private firm 5 2.27 1.92 2.02 2.15 1.95Comparables 2.14 1.96 1.63 1.58 1.98
Comparables Set 17 Private firm 3 2.11 1.58 1.78 1.97 1.99
Comparables 1.65 1.93 1.67 1.98 1.60
Comparables Set 18 Private firm 2 1.78 1.80 1.83 1.72 1.63
Comparables 3.57 2.47 2.18 2.30 2.77Comparables Set 19 Private firm 5 3.14 1.68 1.71 1.66 2.02
Comparables 2.77 3.12 2.99 2.94 3.41
Comparables Set 20 Private firm 5 2.00 0.87 1.09 1.16 1.06Comparables 0.15 2.87 3.18 3.28 3.27
Comparables Set 21 Private firm 5 3.23 3.36 3.27 3.89 3.38Comparables 3.06 3.15 3.10 3.10 2.71
Comparables Set 22 Private firm 4 1.65 1.85 1.71 2.16 1.95
Comparables 3.28 2.87 2.98 2.83 2.36
Comparables Set 23 Private firm 5 1.06 -0.03 0.18 0.42 0.75
Comparables 0.02 0.52 1.24 1.27 1.50
Comparables Set 24 Private firm 7 0.88 1.22 1.54 1.69 1.67
Comparables 1.92 1.96 2.13 2.24 2.57Comparables Set 25 Private firm 1 1.23 0.54 -0.30 0.27 -1.28
Comparables 1.57 2.01 1.44 1.69 0.96
Comparables Set 26 Private firm 1 2.51 2.47 2.28 -0.55 -10.42Comparables -2.50 -1.23 0.33 -2.12 -4.65
Comparables Set 27 Private firm 4 5.48 5.33 6.68 6.32 7.31Comparables 3.99 5.17 5.86 5.56 4.04
Comparables Set 28 Private firm 8 2.24 2.25 2.46 2.63 2.53Comparables 1.94 1.78 1.55 1.55 1.69
Z-score
Z-scoring of private firms and their publicly-traded comparables
No. of comparables
Appendix 2
In the table below there is an overview of the Z-scores from both privately-held firms
and their respective comparable sets.

53
Appendix 3
Classification of Z-score results as displayed in Appendix 2, with the criteria used
from table 5.
Distress "gray" area Healthy
Comparables Set 1 Private firm X
Comparables X
Comparables Set 2 Private firm X
Comparables X
Comparables Set 3 Private firm X
Comparables X
Comparables Set 4 Private firm X
Comparables XComparables Set 5 Private firm X
Comparables XComparables Set 6 Private firm X
Comparables XComparables Set 7 Private firm X
Comparables XComparables Set 8 Private firm X
Comparables XComparables Set 9 Private firm X
Comparables XComparables Set 10 Private firm X
Comparables X
Comparables Set 11 Private firm XComparables X
Comparables Set 12 Private firm XComparables X
Comparables Set 13 Private firm X
Comparables XComparables Set 14 Private firm X
Comparables XComparables Set 15 Private firm X
Comparables XComparables Set 16 Private firm X
Comparables XComparables Set 17 Private firm X
Comparables XComparables Set 18 Private firm X
Comparables X
Comparables Set 19 Private firm X
Comparables X
Comparables Set 20 Private firm XComparables X
Comparables Set 21 Private firm XComparables X
Comparables Set 22 Private firm X
Comparables XComparables Set 23 Private firm X
Comparables XComparables Set 24 Private firm X
Comparables XComparables Set 25 Private firm X
Comparables X
Comparables Set 26 Private firm X
Comparables XComparables Set 27 Private firm X
Comparables XComparables Set 28 Private firm X
Comparables X
Z-score result Status

54
Appendix 4
The 28 graphical displays of the Z-score over the time period 2004 – 2008. Legend - firm typeprivately-heldpublicly-traded
Z-score - Comparison Set 1
-6.00
-4.00
-2.00
0.00
2.00
4.00
2004 2005 2006 2007 2008
time (years)
rati
o
Z-score - Comparison Set 2
-30.00
-20.00
-10.00
0.00
10.00
2004 2005 2006 2007 2008
time (years)ra
tio
Z-score - Comparison Set 3
0.00
0.50
1.00
1.50
2.00
2.50
3.00
2004 2005 2006 2007 2008
time (years)
rati
o
Z-score - Comparison Set 4
0.00
0.50
1.00
1.50
2.00
2.50
3.00
2004 2005 2006 2007 2008
time (years)
rati
o
Z-score - Comparison Set 5
0.000.501.001.502.002.503.00
2004 2005 2006 2007 2008
time (years)
rati
o
Z-score - Comparison Set 6
-15.00
-10.00
-5.00
0.00
5.00
2006 2007 2008
time (years)
rati
o

55
Z-score - Comparison Set 7
0.00
1.00
2.00
3.00
4.00
2004 2005 2006 2007 2008
time (years)
rati
oZ-score - Comparison Set 8
0.00
1.00
2.00
3.00
4.00
5.00
2004 2005 2006 2007 2008
time (years)
rati
o
Z-score - Comparison Set 9
0.00
1.00
2.00
3.00
4.00
5.00
2004 2005 2006 2007 2008
time (years)
rati
o
Z-score - Comparison Set 10
0.00
1.00
2.00
3.00
4.00
2004 2005 2006 2007 2008
time (years)
rati
o
Z-score - Comparison Set 11
0.001.002.003.004.005.00
2004 2005 2006 2007 2008
time (years)
rati
o
Z-score - Comparison Set 12
-6.00
-4.00
-2.00
0.00
2.00
4.00
6.00
8.00
10.00
2004 2005 2006 2007 2008
time (years)
rati
o
Z-score - Comparison Set 13
0.00
0.20
0.40
0.60
0.80
1.00
1.20
1.40
2004 2005 2006 2007 2008
time (years)
rati
o
Z-score - Comparison Set 14
0.00
2.00
4.00
6.00
8.00
10.00
2004 2005 2006 2007 2008
time (years)
rati
o
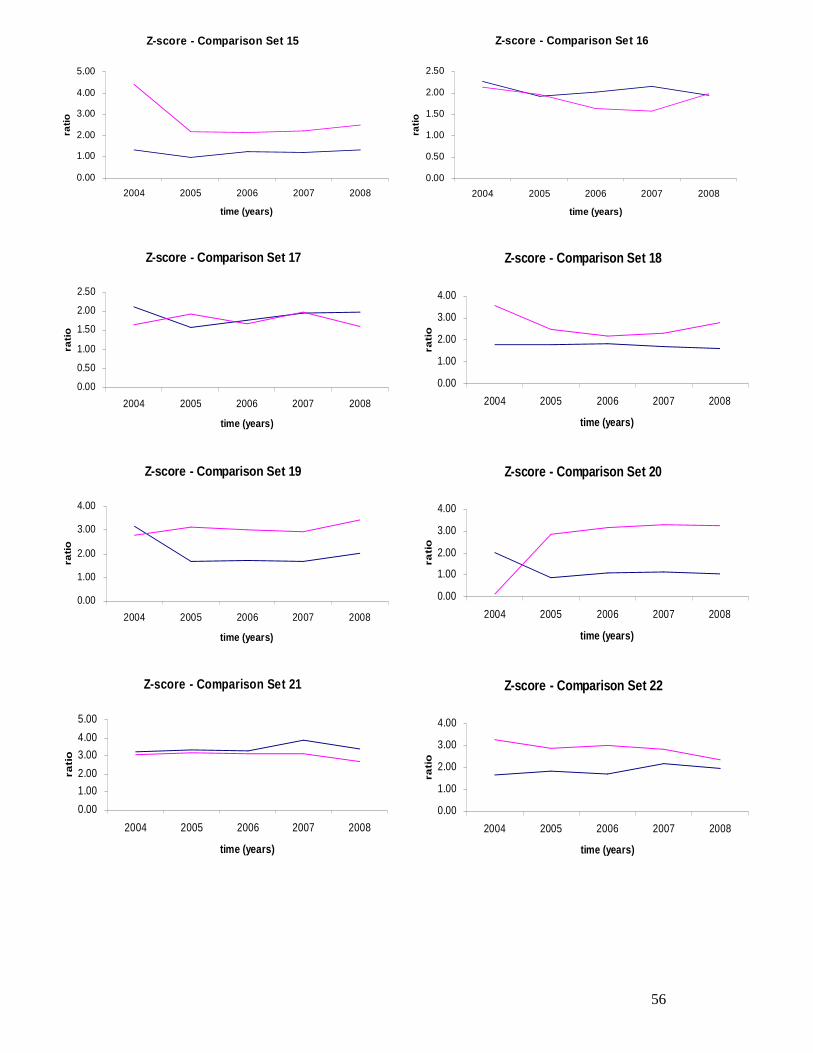
56
Z-score - Comparison Set 15
0.00
1.00
2.00
3.00
4.00
5.00
2004 2005 2006 2007 2008
time (years)
rati
o
Z-score - Comparison Set 16
0.00
0.50
1.00
1.50
2.00
2.50
2004 2005 2006 2007 2008
time (years)
rati
o
Z-score - Comparison Set 17
0.00
0.50
1.00
1.50
2.00
2.50
2004 2005 2006 2007 2008
time (years)
rati
o
Z-score - Comparison Set 18
0.00
1.00
2.00
3.00
4.00
2004 2005 2006 2007 2008
time (years)ra
tio
Z-score - Comparison Set 19
0.00
1.00
2.00
3.00
4.00
2004 2005 2006 2007 2008
time (years)
rati
o
Z-score - Comparison Set 20
0.00
1.00
2.00
3.00
4.00
2004 2005 2006 2007 2008
time (years)
rati
o
Z-score - Comparison Set 21
0.00
1.00
2.00
3.00
4.00
5.00
2004 2005 2006 2007 2008
time (years)
rati
o
Z-score - Comparison Set 22
0.00
1.00
2.00
3.00
4.00
2004 2005 2006 2007 2008
time (years)
rati
o
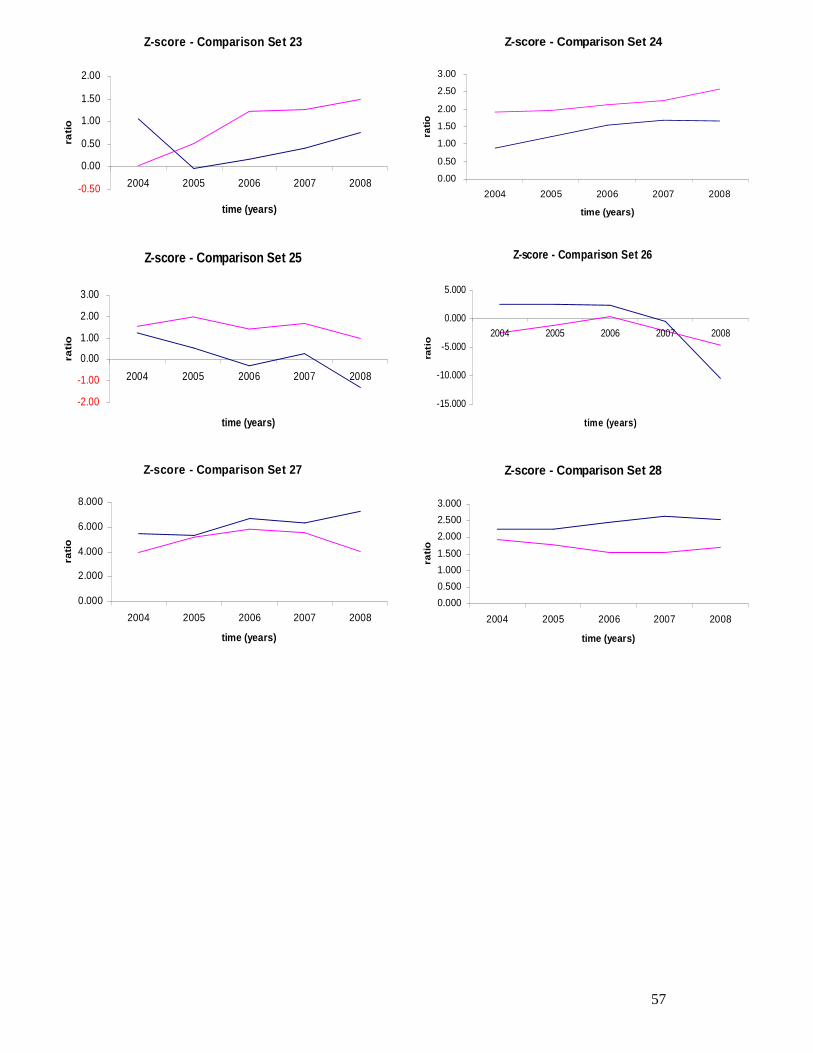
57
Z-score - Comparison Set 23
-0.50
0.00
0.50
1.00
1.50
2.00
2004 2005 2006 2007 2008
time (years)
rati
o
Z-score - Comparison Set 24
0.00
0.50
1.00
1.50
2.00
2.50
3.00
2004 2005 2006 2007 2008
time (years)
rati
o
Z-score - Comparison Set 25
-2.00
-1.00
0.00
1.00
2.00
3.00
2004 2005 2006 2007 2008
time (years)
rati
o
Z-score - Comparison Set 26
-15.000
-10.000
-5.000
0.000
5.000
2004 2005 2006 2007 2008
time (years)ra
tio
Z-score - Comparison Set 27
0.000
2.000
4.000
6.000
8.000
2004 2005 2006 2007 2008
time (years)
rati
o
Z-score - Comparison Set 28
0.000
0.500
1.000
1.500
2.000
2.500
3.000
2004 2005 2006 2007 2008
time (years)
rati
o

58
Appendix 527
This appendix supplies an overview of the coding used by the WorldScope database
of the variables used throughout this thesis.
27 We would like to note that all financial data acquired from WorldScope is measured in millions of fixed Euro’s.
Variable name WorldScope item name WorldScope source code WorldScope definitionTotal Assets TOTAL ASSETS 02999
Retained Earnings RETAINED EARNINGS 03495
EARNINGS BEFORE INTEREST AND TAXES (EBIT) 18191
Equity COMMON EQUITY 03501COMMON EQUITY represents common shareholders' investment in a company. It includes:
Total Liabilities TOTAL LIABILITIES 03351
(Net) Sales NET SALES OR REVENUES 01001, 19101, 19102, 19103, 19104
NET SALES OR REVENUES represent gross sales and other operating revenue less discounts, returns and allowances.
SIC Code SIC CODES
Total Current AssetsCURRENT ASSETS - TOTAL 02201
Total Current LiabilitiesCURRENT LIABILITIES - TOTAL 03101
TOTAL CURRENT LIABILITIES represent debt or other obligations that the company expects to satisfy within one year.
07021, 07022, 07023, 07024, 07025, 07026, 07027, 07028
Earnings Before Interest and Taxes
Overview of WorldScope variables
TOTAL ASSETS represent the sum of total current assets, long term receivables, investment in unconsolidated subsidiaries, other investments, net property plant and equipment and other assets.
RETAINED EARNINGS represent the accumulated after tax earnings of the company which have not been distributed as dividends to shareholders or allocated to a reserve account. Excess involuntary liquidation value over stated value of preferred stock is deducted if there is an insufficient amount in the capital surplus account.
EARNINGS BEFORE INTEREST AND TAXES (EBIT) represent the earnings of a company before interest expense and income taxes. It is calculated by taking the pretax income and adding back interest expense on debt and subtracting interest capitalized.
TOTAL LIABILITIES represent all short and long term obligations expected to be satisfied by the company. It includes:
SIC CODES were developed by the U.S. government to provide a standard industry classification which covers all the economic activities of the United States. They are derived from the 1987 edition of the Standard Industrial Classification Manual compiled by the Executive Office of the President of the United States, Office of Management and Budget. These SIC codes are assigned to both U.S. and
TOTAL CURRENT ASSETS represents cash and other assets that are reasonably expected to be realized in cash, sold or consumed within one year or one operating cycle. Generally, it is the sum of cash and equivalents, receivables, inventories, prepaid expenses and other current assets. For non-U.S. corporations, long term receivables are excluded from current assets even though included in net receivables.

59