financial conduct authority conduct authority occasional paper 32 april 2018 now you see it: drawing...
TRANSCRIPT

Financial Conduct Authority
Occasional Paper 32 April 2018
Now you see it: drawing attention to
charges in the asset management
industry
Lucy Hayes, William Lee and Anish Thakrar

Now you see it: drawing attention to charges in the asset management industry
April 2018 1
The FCA occasional papers
The FCA is committed to encouraging debate on all aspects of financial regulation and to
creating rigorous evidence to support its decision-making. To facilitate this, we publish a
series of Occasional Papers, extending across economics and other disciplines.
The main factor in accepting papers is that they should make substantial contributions to
knowledge and understanding of financial regulation. If you want to contribute to this
series or comment on these papers, please contact Karen Croxson at
Disclaimer
Occasional Papers contribute to the work of the FCA by providing rigorous research
results and stimulating debate. While they may not necessarily represent the position of
the FCA, they are one source of evidence that the FCA may use while discharging its
functions and to inform its views. The FCA endeavours to ensure that research outputs
are correct, through checks including independent referee reports, but the nature of such
research and choice of research methods is a matter for the authors using their expert
judgement. To the extent that Occasional Papers contain any errors or omissions, they
should be attributed to the individual authors, rather than to the FCA.
Authors
Anish Thakrar and William Lee work in the Competition & Economics Division of the
Financial Conduct Authority. Lucy Hayes works in the Behavioural Economics and Data
Science Unit of the Financial Conduct Authority.
Acknowledgements
We are grateful to Hailey Badger for her assistance throughout the project. We would like
to thank John Beshears, Pete Lunn, Michael Collins, Robin Finer, Jeroen Nieboer, Laura
Smart and Becky Young for their helpful suggestions on the design of the experiment.
We are also grateful to Paul Adams, Stefan Hunt, Sarah McKenzie and Pasquale Schiraldi
for their comments and critique.
We thank James Suter, Dr Charlotte Duke and Dr Annette Cerulli-Harms from London
Economics, and Olivia Joyner from YouGov for their contributions to designing and
carrying out this research.
All our publications are available to download from www.fca.org.uk. If you would like to
receive this paper in an alternative format, please call 020 7066 9644 or email
[email protected] or write to Editorial and Digital Department, Financial
Conduct Authority, 25 The North Colonnade, Canary Wharf, London E14 5HS.
FCA occasional papers in financial regulation
Now you see it: drawing attention to charges in the asset management industry
April 2018 2
1 Executive summary 3
What was our approach? 3
What did we find? 4
What did we learn? 6
What are the implications for the FCA’s policy approach? 7
2 Research context 8
Market context 8
Why do charges matter? 8
Do investors pay enough attention to charges? 9
Why might investors not pay enough attention to charges? 9
Experiments as a remedy tool 10
3 Research design 11
Sample selection 11
Experimental environment 11
Experimental task 12
Fund selection 13
Treatments 14
Survey 17
4 Results 18
Impact on decision-making 18
Impact on awareness and understanding 21
Impact on importance placed on fund characteristics 22
Impact on different groups of participants 23
5 Conclusions and implications 26
Overview 26
What did we find? 26
How can we interpret these results? 27
Annex 1: Tables 28
Annex 2 - References 32
Contents

Now you see it: drawing attention to charges in the asset management industry
April 2018 3
The UK’s asset management industry is the second largest in the world and manages
around £8.1 trillion of assets, which includes over £1 trillion in retail investment
products.1 In 2017, the Financial Conduct Authority (FCA) assessed whether the industry
is working well and found weak price competition in a number of areas.2 It found that
some charges might not always be visible to retail investors and, even when they were,
investors might not pay sufficient attention to charges or understand their impact on
investment returns. The low visibility of charges and lack of understanding can create
harm in two ways: directly by causing investors to hold poor value for money products,
and indirectly through reducing competition between asset managers to lower charges
over time.
New European regulatory requirements mean that, as of the beginning of this year, asset
managers and other investment firms now need to give more information, including a
single charge figure in pounds and pence. However, making information available does
not necessarily mean that investors will take notice of or understand it. Previous research
has shown that the way information is presented can affect how consumers access,
assess or act on it. 3
Before making any further policy interventions, we wanted to test the impact of different
ways of presenting charges (our ‘treatments’) on investors’ decision-making and their
understanding and awareness of charges. We carried out an experiment which simulated
an online investment platform and recruited over one thousand non-advised investors to
participate in the research. Drawing on the relevant behavioural literature as well as our
own qualitative research we developed four treatments to test.
In summary, all of our treatments increased the proportion of investors choosing a
cheaper fund and some of the effects were sizable. However, the increased focus on
charges did not seem to reduce the importance that participants placed on other fund
characteristics such as performance or risk. A warning message appeared to improve
decision-making, particularly when it was coupled with a chart showing the impact of
charges or a screen providing a summary of charges just before an investor purchased a
fund. The treatments which were most impactful were also prominently positioned on
pages which all investors had to view.
What was our approach?
The experiment presented the investors with a choice of six actively managed UK equity
funds and asked them to select the one they would invest in. Each fund was part of a
pair of funds which were broadly the same, except one fund was cheaper than the other.
1 HM Treasury, The UK Investment Management Strategy II (December 2017).
2 www.fca.org.uk/publication/market-studies/ms15-02-1.pdf 3 For example, information located on the top of a page is likely to be more effective than that at the bottom of a page
(Bergstrom & Schall, 2014). In addition, presenting information using simple language or images and graphics can help
consumers to understand the information (Pinker,1990 and Bhargava & Loewenstein, 2015).
1 Executive summary
Now you see it: drawing attention to charges in the asset management industry
April 2018 4
Individuals were randomly assigned to see one of four treatments that provided
additional information about charges, or to be in the control group designed to mimic
current disclosure in the market. For each treatment and the control, we also provided all
fund charges in pounds and pence, as well as a percentage.
To evaluate the quality of investors’ decision-making and the effect of our treatments,
the main outcome we measured was the percentage of participants selecting one of the
cheaper funds within each pair. Our set-up meant that a participant selecting a fund
randomly would have a 50% chance of selecting a cheaper fund. Each participant
repeated this choice task three times, under the same treatment, before answering a
number of survey questions. These questions tested their understanding and awareness
of charges, asked about the factors they considered in their decision and asked whether
they would have invested in their chosen funds in reality. We selected participants who
were the main financial decision-maker in their households, had invested in an actively
managed fund before and had more than £10,000 of investable assets.
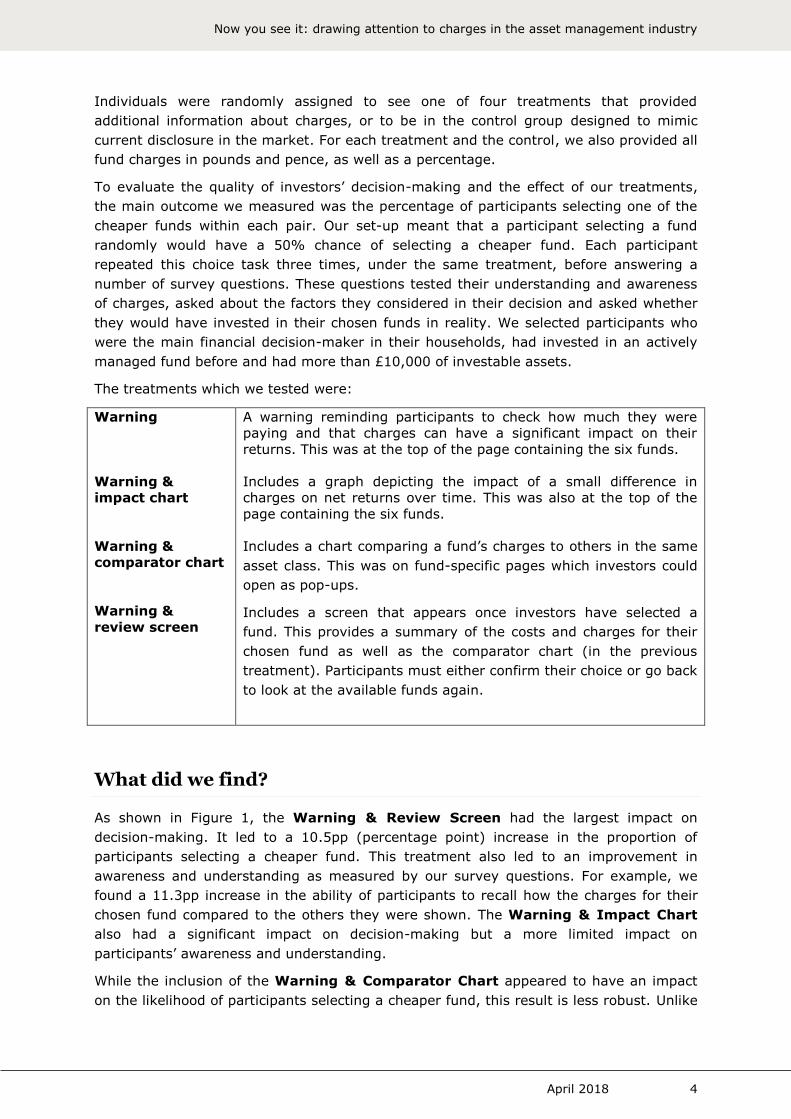
The treatments which we tested were:
Warning
Warning &
impact chart
Warning &
comparator chart
Warning &
review screen
A warning reminding participants to check how much they were
paying and that charges can have a significant impact on their
returns. This was at the top of the page containing the six funds.
Includes a graph depicting the impact of a small difference in
charges on net returns over time. This was also at the top of the
page containing the six funds.
Includes a chart comparing a fund’s charges to others in the same
asset class. This was on fund-specific pages which investors could
open as pop-ups.
Includes a screen that appears once investors have selected a
fund. This provides a summary of the costs and charges for their
chosen fund as well as the comparator chart (in the previous
treatment). Participants must either confirm their choice or go back
to look at the available funds again.
What did we find?
As shown in Figure 1, the Warning & Review Screen had the largest impact on
decision-making. It led to a 10.5pp (percentage point) increase in the proportion of
participants selecting a cheaper fund. This treatment also led to an improvement in
awareness and understanding as measured by our survey questions. For example, we
found a 11.3pp increase in the ability of participants to recall how the charges for their
chosen fund compared to the others they were shown. The Warning & Impact Chart
also had a significant impact on decision-making but a more limited impact on
participants’ awareness and understanding.
While the inclusion of the Warning & Comparator Chart appeared to have an impact
on the likelihood of participants selecting a cheaper fund, this result is less robust. Unlike

Now you see it: drawing attention to charges in the asset management industry
April 2018 5
other treatments, as the comparator chart contained information about one particular
fund, we placed this on the fund specific pages which participants could choose to open
in a pop-up window. In 54% of choices for this treatment group, participants did not click
on any of these pages. In contrast the review screen treatment, which also contained the
comparator chart and which all participants had to view, had a larger effect.
We found some evidence the Warning had an impact on decision-making but there is
some evidence to suggest it was more effective when combined with either the review
screen or the impact chart.
Figure 1 – Percentage of participants selecting one of the cheaper funds by treatment and
associated treatment effects
Note: Total N=3,147 (3 choices each by 1,049 participants). Unweighted treatment effects are presented. ***/**/* signifies
statistical significance at 1/5/10 % level. Treatment effects in bold are both statistically significant at least at the 5% level and
are robust to weightings being applied.
We wanted to estimate the average impact on the population of UK non-advised
investors. However, as we were unable to achieve our exact target sample, we applied
weights to approximate these population effects.4 When we did this, we found that the
Warning & Review Screen and Warning & Impact Chart continued to be statistically
significant. However, we cannot be confident that the Warning & Comparator Chart
and Warning had a robust impact on the population of non-advised investors.
Although some of our treatments led to participants selecting cheaper funds, it appears
they did not change the attention they placed on other fund characteristics including
performance and risk. As shown in Figure 2, the proportion of participants selecting high
performing funds in any treatment group was not statistically significantly different to the
control group. We also found similar results for low and medium performing funds. When
we asked what factor was most important in their decisions, the difference in
participants’ responses between the control and treatment groups were not statistically
significant.
4 Full details of our approach to weighting are in Annex 7 of the technical report (London Economics, 2018).
72.8%
10.5pp***
7.8pp***
8.4pp***
6.2pp**
0% 20% 40% 60% 80% 100%
Warning & Review Screen
Warning & Impact Chart
Warning & Comparator Chart
Warning
Control Group
Random
selection
Now you see it: drawing attention to charges in the asset management industry
April 2018 6
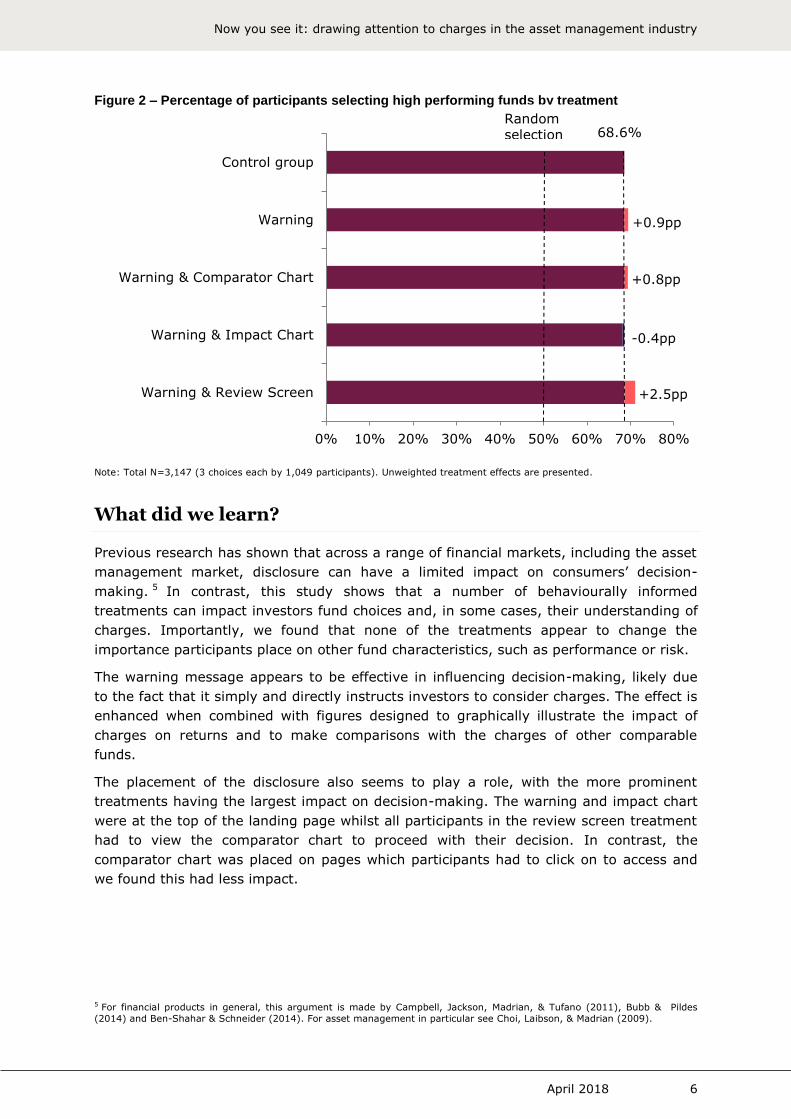
Figure 2 – Percentage of participants selecting high performing funds by treatment
Note: Total N=3,147 (3 choices each by 1,049 participants). Unweighted treatment effects are presented.
What did we learn?
Previous research has shown that across a range of financial markets, including the asset
management market, disclosure can have a limited impact on consumers’ decision-
making. 5 In contrast, this study shows that a number of behaviourally informed
treatments can impact investors fund choices and, in some cases, their understanding of
charges. Importantly, we found that none of the treatments appear to change the
importance participants place on other fund characteristics, such as performance or risk.
The warning message appears to be effective in influencing decision-making, likely due
to the fact that it simply and directly instructs investors to consider charges. The effect is
enhanced when combined with figures designed to graphically illustrate the impact of
charges on returns and to make comparisons with the charges of other comparable
funds.
The placement of the disclosure also seems to play a role, with the more prominent
treatments having the largest impact on decision-making. The warning and impact chart
were at the top of the landing page whilst all participants in the review screen treatment
had to view the comparator chart to proceed with their decision. In contrast, the
comparator chart was placed on pages which participants had to click on to access and
we found this had less impact.
5 For financial products in general, this argument is made by Campbell, Jackson, Madrian, & Tufano (2011), Bubb & Pildes
(2014) and Ben-Shahar & Schneider (2014). For asset management in particular see Choi, Laibson, & Madrian (2009).
0% 10% 20% 30% 40% 50% 60% 70% 80%
Warning & Review Screen
Warning & Impact Chart
Warning & Comparator Chart
Warning
Control group
68.6%
+0.9pp
+0.8pp
-0.4pp
+2.5pp
Random selection
Now you see it: drawing attention to charges in the asset management industry
April 2018 7
What are the implications for the FCA’s policy approach?
The Asset Management Market Study highlighted the importance of clear disclosure of
what asset management services cost through the presentation of a single charge. The
recast Markets in Financial Instruments Directive (MiFID II) and the Packaged Retail and
Insurance-based Investment Products (PRIIPs) Regulation have recently introduced
greater disclosure of all costs and charges, including transaction costs. Consumers should
now see the full costs and charges, expressed as a single fee, for most transactions in
investment products, and on an ongoing basis.
This is a significant step forward but how this information is presented will be important if
it is to help consumers make more informed choices. We believe that the findings from
this research on the importance of disclosing costs and charges in a clear and meaningful
way are consistent with a significant body of previous work. The FCA has stated that
firms should consider these results when thinking about how their disclosures are
working. The FCA will consider changing rules and guidance to mandate certain forms of
disclosure in light of the outcome of the Investment Platforms Market Study.6
6 www.fca.org.uk/publications/market-studies/ms17-1-investment-platforms-market-study

Now you see it: drawing attention to charges in the asset management industry
April 2018 8
Market context
The UK’s asset management industry is the second largest in the world and manages
around £8.1 trillion of assets, which includes over £1 trillion in retail investment
products.7 Investment platforms, or fund supermarkets, are an increasingly important
part of the retail distribution landscape. The platform sector has steadily grown over the
last eight years, with assets under administration (AUA) increasing from £108 billion in
2008 to £592 billion in 2016.8 Investors are increasingly selecting their own investments
without advice. In 2016 approximately £170bn was invested through direct to consumer
(D2C) platforms which allow investors to access information and tools to inform their
investment choices and to execute, review and potentially change their investments
without advice.9
Why do charges matter?
It is important that investors take charges information into account when selecting funds.
Charges act as a drag on performance and impact the return which investors actually
receive. While performance is volatile and the consensus is that past performance is not
a good indicator of future performance, investors will always incur charges.10 Due to
compounding, over time, a seemingly small difference in charges can have a significant
impact on returns.
Some investors might choose to invest in funds with higher charges in the expectation of
achieving higher returns. However, research from the US has suggested that cheaper
active funds deliver higher returns than more expensive funds in the same investment
category.11 Analysis undertaken by the FCA as part of the Asset Management Market
Study found no clear relationship between charges and gross performance for retail
active funds in the UK. There was some evidence of a negative relationship once charges
are taken into account. 12 This suggests that when choosing between active funds
investors paying higher prices for funds, on average, do not necessarily achieve better
net returns.
The FCA’s market study concluded that there was evidence of weak price competition in a
number of areas of the asset management industry. The FCA’s analysis showed that
there were high levels of profitability across the sample of firms and considerable price
clustering for active funds. There was little evidence that firms compete on the basis of
price. This suggests that drawing attention to charges, alongside other factors such as
7 HM Treasury, The UK Investment Management Strategy II (December 2017).
8 Platforum UK Adviser Platform Guide Issue 29, Figure 10 (March 2017). 9 Platforum UK Adviser Platform Guide Issue 29, Figure 10 (March 2017).
10 See Quigley & Sinquefield (2000) and Fletcher & Forbes (2002).
11 Gil-Bazo & Ruiz-Verdu (2008), Gil-Bazo & Ruiz-Verdu (2009), Carhart (1997) and Morningstar (2016).
12 www.fca.org.uk/publication/market-studies/ms15-2-3-annex-4.pdf .
2 Research context
Now you see it: drawing attention to charges in the asset management industry
April 2018 9
performance and service, might allow investors to drive more effective competition
between asset managers.
Do investors pay enough attention to charges?
Consumer research undertaken as part of the FCA’s market study revealed that investors’
awareness and focus on charges is mixed. The research found a significant number of
investors were unaware that they were even paying for their asset management
services.13 Furthermore, the FCA’s analysis of browsing data from an online investment
platform found that few investors seek out charges information. Of all the visits to the
website to look at funds, fewer than 9% of visitors looked for charges information.14
Academic research has indicated that investors do not tend to make decisions that
minimise the charges they pay.15
The market study also identified some specific examples of people investing in products
which were unlikely to deliver good value for money. This included £109bn in active
funds which closely mirror the performance of the market but are considerably more
expensive than passive funds.16 Similarly, academic research has shown that there are
considerable numbers of investors selecting passive funds with high charges, where
cheaper alternatives are available which are almost certain to generate higher returns
(Hortacsu & Syverson, 2004).
This suggests that some investors might not be paying sufficient attention to charges in
their decision-making.
Why might investors not pay enough attention to charges?
There are a number of potential behavioural explanations for why investors might not
pay enough attention to charges.
Firstly, we know that investors have limited attention spans when making investment
decisions. The prominence that information is given can have a significant impact on how
much investors focus on it. For example, information located on the top of a page is
likely to be more effective than that at the bottom of a page (Bergstrom & Schall, 2014).
In the asset management market, research has found that making charges information
easier to find may have a limited impact on investors choosing cheaper funds (Choi,
Laibson, & Madrian, 2009; Fisch & Wilkinson-Ryan, 2014). Carlin (2009) finds that firms
might have an incentive to make their charges more complex or less transparent to
reduce competitive pressure. Similarly, fund advertising could play an important role.
Cronqvist (2005) claims that only a small fraction of fund advertising is informative about
important characteristics, such as fund fees.
Secondly, investors might find it difficult to understand and compare information on
charges. When faced with complicated decisions and lots of information, consumers often
use simplified decision-making mechanisms to make choices.17 So more information will
13 www.fca.org.uk/sites/default/files/publications/market-studies/ms15-2-2-annex-3.pdf. 14 www.fca.org.uk/publication/market-studies/ms15-2-3.pdf.
15 See Choi, Laibson & Madrian (2009).
16 www.fca.org.uk/sites/default/files/publications/market-studies/ms15-2-2-interim-report.pdf.
17 www.fca.org.uk/publication/occasional-papers/occasional-paper-1.pdf.
Now you see it: drawing attention to charges in the asset management industry
April 2018 10
not necessarily lead to better decisions. The format in which charges information is
provided can affect how likely it is that investors will pay attention to and understand the
information.18 Chater, Huck, & Inderst (2010) and Hastings & Tejeda-Ashton (2008) have
shown that investors can make better investment decisions when presented with charges
in pounds and pence rather than as a percentage. Expressing information in simple
language can help consumers to understand the information as can presenting
information in images or graphs alongside text.19
Thirdly, investors might mistakenly consider small differences in charges to be
unimportant when making investments. We know that due to compounding, over time,
even a small difference in charges can have a significant impact on net returns. It has
been well documented that investors might struggle with even basic financial calculations
(Lusardi & Mitchell, 2009) so they might not appreciate the impact of charges on returns
over time (Choi, Laibson, & Madrian, 2006).
Finally, we know that many investors pay attention to past performance (which is net of
charges) when selecting a fund. There is evidence that some investors may focus more
on past performance than charges when selecting funds, believing that funds which have
performed well in the past will perform well in the future.20 This belief is not supported by
UK academic analysis, which has found that the majority of funds with historical
outperformance do not continue to outperform the relevant market index or peer group
for more than a few years.21 This suggests that some investors could incorrectly assume
that past performance will continue (this is known as extrapolation bias). They may pay
too much attention to past performance, possibly at the expense of other important
factors such as charges.
Experiments as a remedy tool
We used an online experiment to test the effect of different disclosure measures relating
to how charges are presented to investors. Experiments help us to make sure that any
remedies we are thinking about introducing are likely to address the concerns we have
identified. The methodology involves assigning participants to different treatments, and
comparing the outcomes of each group to a control group. As outlined in Iscenko, Duke,
Huck & Wallace (2014), the principal benefit of experiments over other methodologies is
that they offer control over the experiment setting. This allows the effect of specific
changes to be isolated. Where it is appropriate and proportionate to do so, the FCA has
increasingly been using experiments in both hypothetical and real world settings, to test
the potential effects of specific remedies. This study contributes to this body of work.
The paper is organised as follows. The second section briefly explains the research design
we used, the third section presents the results from the study and the final section
discusses these. The full technical report by London Economics on the research,
containing a more detailed discussion of the methodology, the analysis and findings, is
available as a separate online appendix to this paper.22
18 See Bettman, Payne & Staelin (1986) and Paredes (2003). 19 See The Behavioural Insights Team (2012), Pinker (1990) and Bhargava & Loewenstein (2015). 20 See Neil Weinberg, Fund Managers Know Best: As Corporations are Fessing Up to Investors, Mutual Funds Still Gloss Over
Costs, Forbes Mag., Oct. 14, 2002, at 220. 21 See Quigley & Sinquefield (2000) and Fletcher & Forbes (2002).
22 https://www.fca.org.uk/publication/research/asset-management-market-study-behavioural-research.pdf.
Now you see it: drawing attention to charges in the asset management industry
April 2018 11
This section describes our methodology including the sample we used, the experiment
environment and how we constructed the funds. It then presents details of the
treatments we tested and the survey.
To inform the design of the experiment and help us interpret the findings, we undertook
a number of pieces of qualitative research:
Three preparatory focus groups with investors: these were held before the
experiment and informed the development of the experiment environment and
the treatments.
Four focus groups with advisers: whilst our treatments were mainly designed
for non-advised investors we wanted to understand whether they might also have
an impact on those who invest after seeking advice.
Twelve in-depth interviews: these were telephone interviews with participants
after they had undertaken the experiment. They allowed us to gain further
insights into participants’ decision-making process and the impact of the
treatments on this. We also discussed the extent to which their decisions might
differ in a real-life context.
Ahead of undertaking the fieldwork, we also piloted the experiment and survey with 100
participants.
Sample selection
We selected a sample of 1,049 participants who were financial decision-makers in their
households, had invested in an active fund before and had at least £10,000 of investable
assets. We wanted our sample to be representative of the population of UK non-advised
investors based on previous research undertaken as part of the Asset Management
Market Study.23 However in practice it was not possible to achieve this (see Table A.1 in
Annex for details of the target and attained populations). For all the analysis we
therefore estimated treatment effects for our sample as well as for the population of
interest in terms of age, region, gender, total investable assets and social grades (the
‘weighted’ results).
Experimental environment
The experiment simulated an online investment platform. It focused on the point in the
decision-making journey where an investor had already narrowed down their choice of
funds to a small set.
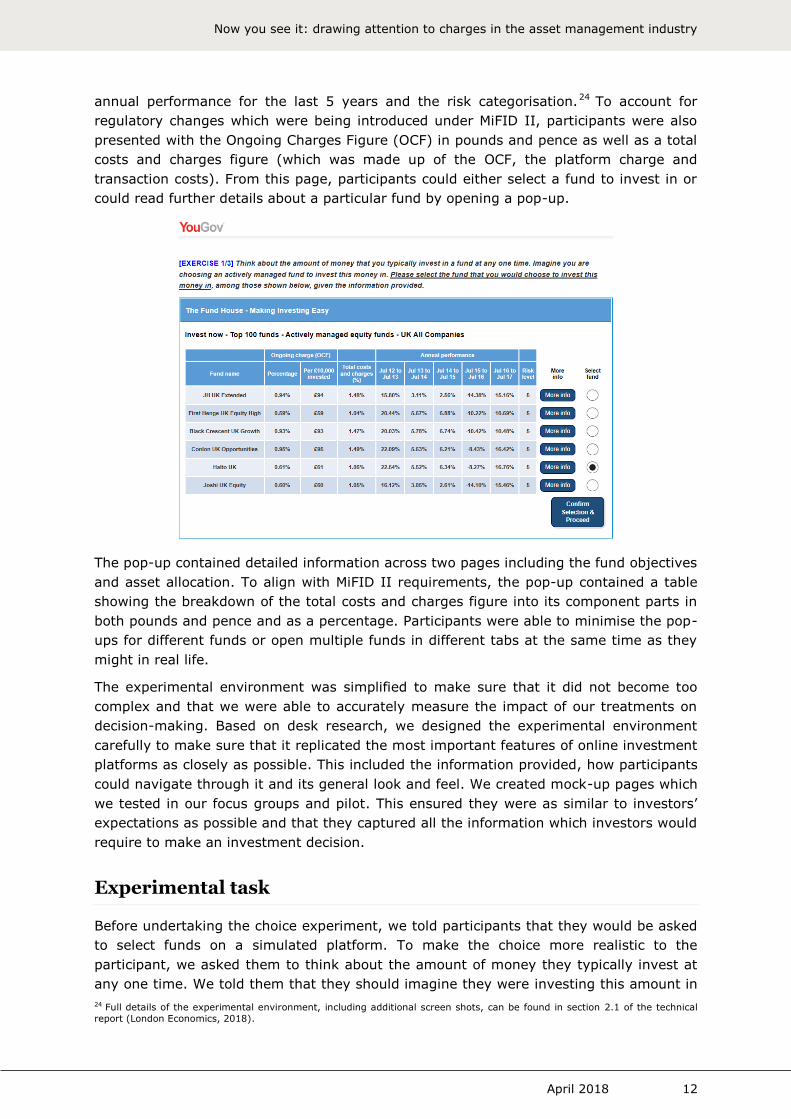
Participants all initially saw a landing page (as shown overleaf) containing a table of six
fictional funds. This listed information about each fund including the fund name, its
23 Full details of our approach to sampling and weighting are in Annex 7 of the technical report (London Economics, 2018).
3 Research design
Now you see it: drawing attention to charges in the asset management industry
April 2018 12
annual performance for the last 5 years and the risk categorisation.24 To account for
regulatory changes which were being introduced under MiFID II, participants were also
presented with the Ongoing Charges Figure (OCF) in pounds and pence as well as a total
costs and charges figure (which was made up of the OCF, the platform charge and
transaction costs). From this page, participants could either select a fund to invest in or
could read further details about a particular fund by opening a pop-up.
The pop-up contained detailed information across two pages including the fund objectives
and asset allocation. To align with MiFID II requirements, the pop-up contained a table
showing the breakdown of the total costs and charges figure into its component parts in
both pounds and pence and as a percentage. Participants were able to minimise the pop-
ups for different funds or open multiple funds in different tabs at the same time as they
might in real life.
The experimental environment was simplified to make sure that it did not become too
complex and that we were able to accurately measure the impact of our treatments on
decision-making. Based on desk research, we designed the experimental environment
carefully to make sure that it replicated the most important features of online investment
platforms as closely as possible. This included the information provided, how participants
could navigate through it and its general look and feel. We created mock-up pages which
we tested in our focus groups and pilot. This ensured they were as similar to investors’
expectations as possible and that they captured all the information which investors would
require to make an investment decision.
Experimental task
Before undertaking the choice experiment, we told participants that they would be asked
to select funds on a simulated platform. To make the choice more realistic to the
participant, we asked them to think about the amount of money they typically invest at
any one time. We told them that they should imagine they were investing this amount in
24 Full details of the experimental environment, including additional screen shots, can be found in section 2.1 of the technical
report (London Economics, 2018).

Now you see it: drawing attention to charges in the asset management industry
April 2018 13
an actively managed fund. The introduction encouraged them to select the fund they
would choose to invest this money in, given the information provided. They were told
that there were no right or wrong decisions and reminded to behave as they would in
real life. In addition, we showed participants a screen explaining the elements and
functionality of the platform to make sure that they were aware of how they could
interact with the simulated platform.
While we provided participants with an incentive to participate in the experiment and
survey, we decided not to reward participants who chose one of the cheaper funds in the
experiment. While this could have incentivised participants to pay more attention to the
choice task, there was a risk that they would behave as they thought they should -
rather than how they would in real life. Although investors were required to select a
single fund, in reality we acknowledge that investors might have invested in more than
one, or even none, of the funds shown or might have focused on a different set of funds
altogether.
Fund selection
We presented each participant with a set of six funds, and asked them to select one. This
exercise was repeated three times per participant. To allow us to measure the impact of
our treatments on participants’ decision-making, we constructed the fund sets in a
specific and systematic way:
As presented below, each fund set was made up of three pairs.25
We varied charges within a pair so that each pair contained a fund with a low
charge and one with a high charge.26
We also varied performance so that each pair either had a low, medium or high
past performance level.
All the other fund characteristics (for example asset allocation, risk-level and fund
objectives) either had no, or very minimal, differences across funds.27
Charge level Past performance
Fund 1 Low Low
Fund 2 High Low
Fund 3 Low Medium
Fund 4 High Medium
Fund 5 Low High
Fund 6 High High
25 We used 6 funds (i.e. 3 fund pairs), rather than a single fund pair, for a number of reasons: 1) we understand from
consumer research undertaken as part of the Asset Management Market Study that investors typically consider 2-5 funds
before making their investment decision, 2) having 6 funds with randomised ordering means participants are less likely to
notice that funds are constructed with minimal variations in a number of features, and paired in the way described, and
therefore offer a more realistic experience, and 3) allowing for funds with varying performance levels within a fund choice set
allowed us to assess whether the treatments have any impact on investors’ sensitivity to past performance. 26 We set the charges such that the OCF and the total costs and charges figure were always proportionate to each other. The
platform charge was also always constant between and across fund sets.
27 Qualitative fund characteristics, such as a fund’s name, were randomised, so we would not expect to see a systematic effect
from qualitative characteristics. The small variations within quantitative fund features were also randomised.
Now you see it: drawing attention to charges in the asset management industry
April 2018 14
We systematically varied the average charge levels and the differential between pairs
(i.e. the difference between the low charge and the high charge) across fund sets. This
allowed us to see the impact of our treatments across different fee levels and fee
differentials. In total we created 90 fund sets which participants were randomly allocated
to in each of the three choice experiment rounds.28 The order of the funds was also
randomised to prevent participants being able to identify any patterns and to control for
any ordering effects. We also used fictitious fund names to avoid associations with
popular brands and randomly allocated these to funds.
The only systematic difference within a pair of funds was the level of charges. It was not
revealed to the participants that there were pairs of funds in each set, and this design
was solely to allow us to measure the proportion of participants selecting the cheaper
funds and to observe how this varied by treatments. We note that we would expect
participants selecting a fund randomly to choose one of the cheaper funds 50% of the
time. We interpret the difference between treatments for this outcome as the treatment
effect on sensitivity to charges. We varied performance levels across fund pairs which
allowed us to observe whether our treatments affected the degree to which investors
considered past performance in their decision-making.
In our experiment participants were faced with a relatively similar set of funds. In reality
investors would have access to a greater diversity of funds but this set-up was necessary
to enable us to understand the impact of our treatments on decision-making.
Treatments
We tested the impact of four different treatments which presented charges information to
investors in different ways. We compared these to a control group which did not contain
any treatments and was designed to reflect current market practice as well as regulatory
changes which have recently been introduced by MiFID II. Participants were randomly
allocated to one of the treatments or the control group.
Since participants were asked to make three consecutive decisions under similar decision
environments, the risk of an investment decision being contaminated by a previous
treatment was high. We therefore assigned each participant to a single treatment group
for all three decisions and made sure that the profile of subjects across observable
characteristics, namely age, gender, region, investible assets and social grade, was
broadly similar in different treatment groups.29
We designed our treatments using insights from the existing behavioural literature.
The treatments which we tested were:
28 Across all fund sets and pairs, the ongoing charges of the funds ranged from 0.60% to 1.20%, which respectively reflected
the 5th and 95th percentiles of the OCFs of UK equity funds found on the investment platform Hargreaves Lansdown. The
average level of the charges of the funds in a particular fund set ranged from 0.69% to 1.11%. The difference between the
ongoing charges of the high charge fund and the low charge fund in each fund pair was varied over three levels (17bp, 26bp and 34bp).
29 For very large sample sizes, we could rely on randomisation to limit the differences between participants across different
treatment groups. However, given the limited size of our sample, we used stratified sub-samples to control for demographic
differences across treatment groups.

Now you see it: drawing attention to charges in the asset management industry
April 2018 15
Warning
The warning was designed to draw investors’ attention to the importance of charges. To
make the warning as impactful as possible, we made sure that it was worded in a simple
and actionable way. Research has shown that this can make it easier for people to
understand and process (Kahneman, 2011). In addition, we designed it to be noticeable,
using colour and bold text to make it stand out from the background and placed it
prominently at the top of the landing page. We also explicitly used the word ‘Warning’ as
research has shown that this is a ‘signal word’ which can be useful in getting people’s
attention (Braun & Silver, 1995).
The following three treatments were combined with the warning:
Impact chart
The impact of compounding of fees over time is an important factor which many
investors may not understand or consider in their investment decisions (Eisenstein &
Hock, 2007, Stango & Zinman 2009). We know that images and graphics can be used to
simplify complex concepts and can attract more attention than text (Pieters, Rosbergen &
Hartog, 1996). And so, we designed this treatment to graphically illustrate the impact of
fees on returns over time. We explicitly drew attention to the relative loss from the
higher charge over time expressed in pound terms as we know that losses often resonate
more with people than gains (Kahneman & Tversky, 1991). The chart was displayed on
the landing page alongside the warning.
Now you see it: drawing attention to charges in the asset management industry
April 2018 16
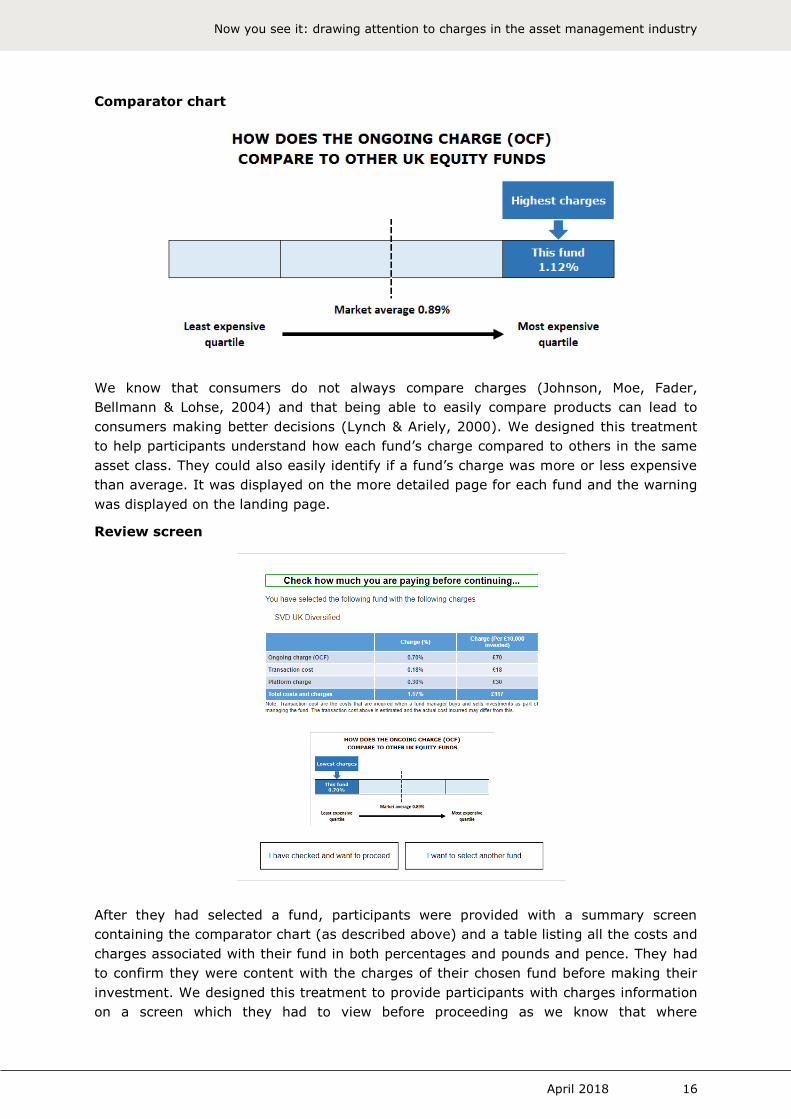
Comparator chart
We know that consumers do not always compare charges (Johnson, Moe, Fader,
Bellmann & Lohse, 2004) and that being able to easily compare products can lead to
consumers making better decisions (Lynch & Ariely, 2000). We designed this treatment
to help participants understand how each fund’s charge compared to others in the same
asset class. They could also easily identify if a fund’s charge was more or less expensive
than average. It was displayed on the more detailed page for each fund and the warning
was displayed on the landing page.
Review screen
After they had selected a fund, participants were provided with a summary screen
containing the comparator chart (as described above) and a table listing all the costs and
charges associated with their fund in both percentages and pounds and pence. They had
to confirm they were content with the charges of their chosen fund before making their
investment. We designed this treatment to provide participants with charges information
on a screen which they had to view before proceeding as we know that where

Now you see it: drawing attention to charges in the asset management industry
April 2018 17
information is provided can have a significant impact on the attention consumers give it.
This treatment also provided participants who might not have considered their initial
decision carefully enough with an opportunity to make a more considered decision. This
is similar to the way in which cooling-off periods have been shown to work in other
markets (Camerer, Issacharoff, Loewenstein, O'Donoghue, & Rabin, 2003). Once again,
the warning was also provided on the landing page.
The impact chart, comparator chart and the review screen were combined with the
warning. This is because we thought that these would be more effective when used
together. Our approach allowed us to measure the impact of these combinations by
comparing the outcome for participants in each treatment to those in the control group.
We could also estimate the incremental effect of the impact of charges chart, comparator
chart and the review screen on top of the warning by comparing them to the impact of
the warning alone. This design does not allow us to measure the standalone treatment
effects of the impact of charges chart, comparator chart, and the review screen, without
the warning. This is because testing the impact of each individual component both on its
own and then in combination would have required a far larger sample size, or testing
fewer treatments, which we did not feel was proportionate.
Survey
After participants had carried out the choice task they were asked a series of survey
questions.30 There were a number of types of questions designed to:
Assess the impact of our treatments on participants’ understanding and
awareness of charges: participants were asked about the fund they selected in
the final choice task. This included whether they recalled it had a charge and, if
so, what range the charge was in, as well as questions about the different
components of charges.
Allow us to gain a deeper insight into the impact of our treatments on
decision-making: for example participants were asked to rank the factors which
were most important to them in making their fund choices and whether they
thought brand names would have had an impact on their behaviour.
Allow us to understand how participants made their decision, including
whether they would have actually invested in their chosen fund in reality.
Assess the financial literacy of participants.
Using the results of a pilot with 100 participants, we made sure that the survey was
clear, minimised the risk of priming and was the right length to avoid respondent fatigue.
30 The full set of questions can be found in Annex 3 of the technical report (London Economics, 2018).
Now you see it: drawing attention to charges in the asset management industry
April 2018 18
This section presents our findings. For all the analysis we estimate treatment effects for
our sample (the ‘unweighted’ results). We also provide treatment effects for the
population of interest in terms of age, region, gender, total investable assets and social
grades (the ‘weighted’ results).31 This population was identified at the outset and was
based on previous research conducted to inform the Asset Management Market Study
undertaken for the FCA by NMG consulting in 2016. 32 In this section we present
unweighted results, but we highlight the results that are statistically significant both with
and without the weights in bold. The weighted results can be found in Tables A.2 and A.3
of Annex 1.
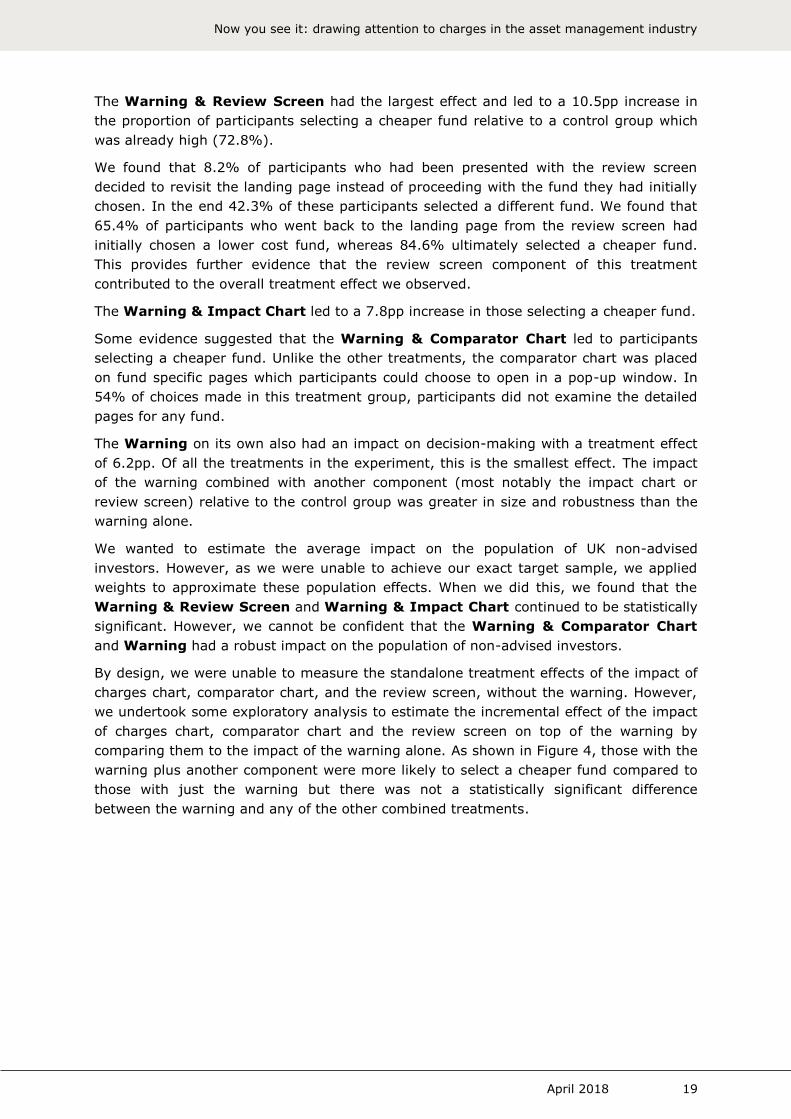
Impact on decision-making
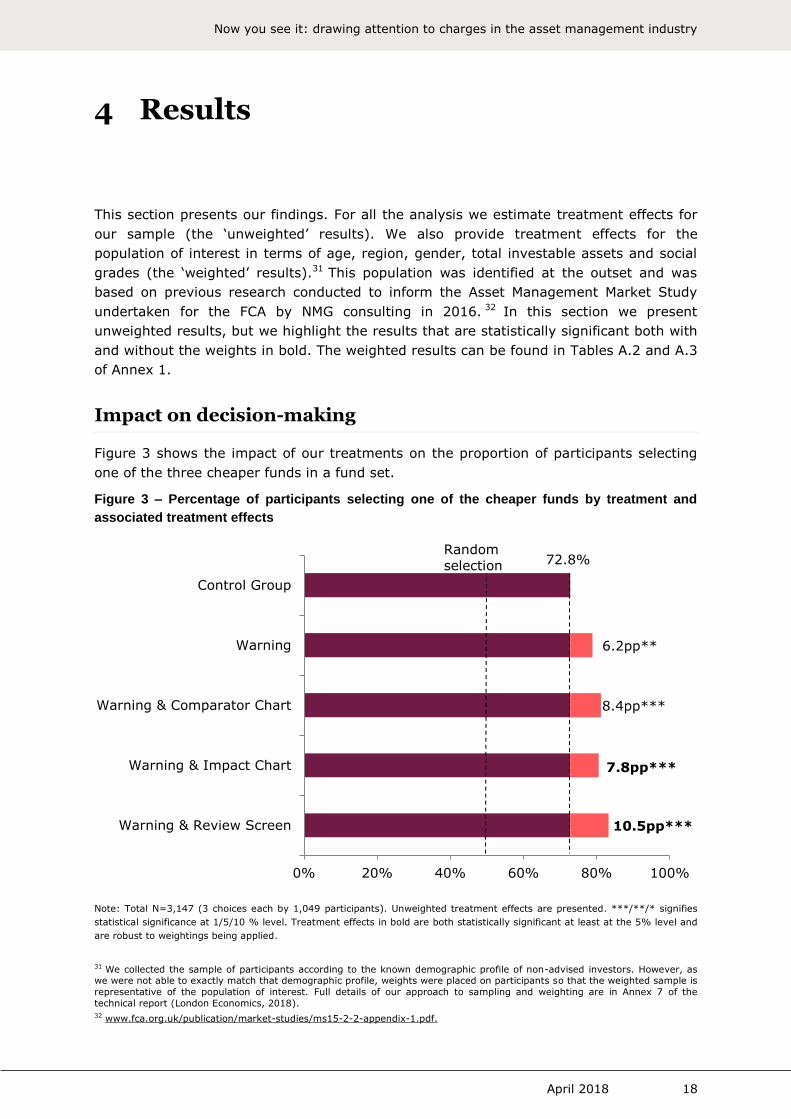
Figure 3 shows the impact of our treatments on the proportion of participants selecting
one of the three cheaper funds in a fund set.
Figure 3 – Percentage of participants selecting one of the cheaper funds by treatment and
associated treatment effects
Note: Total N=3,147 (3 choices each by 1,049 participants). Unweighted treatment effects are presented. ***/**/* signifies
statistical significance at 1/5/10 % level. Treatment effects in bold are both statistically significant at least at the 5% level and
are robust to weightings being applied.
31 We collected the sample of participants according to the known demographic profile of non-advised investors. However, as we were not able to exactly match that demographic profile, weights were placed on participants so that the weighted sample is
representative of the population of interest. Full details of our approach to sampling and weighting are in Annex 7 of the
technical report (London Economics, 2018).
32 www.fca.org.uk/publication/market-studies/ms15-2-2-appendix-1.pdf.
72.8%
10.5pp***
7.8pp***
8.4pp***
6.2pp**
0% 20% 40% 60% 80% 100%
Warning & Review Screen
Warning & Impact Chart
Warning & Comparator Chart
Warning
Control Group
Random
selection
4 Results
Now you see it: drawing attention to charges in the asset management industry
April 2018 19
The Warning & Review Screen had the largest effect and led to a 10.5pp increase in
the proportion of participants selecting a cheaper fund relative to a control group which
was already high (72.8%).
We found that 8.2% of participants who had been presented with the review screen
decided to revisit the landing page instead of proceeding with the fund they had initially
chosen. In the end 42.3% of these participants selected a different fund. We found that
65.4% of participants who went back to the landing page from the review screen had
initially chosen a lower cost fund, whereas 84.6% ultimately selected a cheaper fund.
This provides further evidence that the review screen component of this treatment
contributed to the overall treatment effect we observed.
The Warning & Impact Chart led to a 7.8pp increase in those selecting a cheaper fund.
Some evidence suggested that the Warning & Comparator Chart led to participants
selecting a cheaper fund. Unlike the other treatments, the comparator chart was placed
on fund specific pages which participants could choose to open in a pop-up window. In
54% of choices made in this treatment group, participants did not examine the detailed
pages for any fund.
The Warning on its own also had an impact on decision-making with a treatment effect
of 6.2pp. Of all the treatments in the experiment, this is the smallest effect. The impact
of the warning combined with another component (most notably the impact chart or
review screen) relative to the control group was greater in size and robustness than the
warning alone.
We wanted to estimate the average impact on the population of UK non-advised
investors. However, as we were unable to achieve our exact target sample, we applied
weights to approximate these population effects. When we did this, we found that the
Warning & Review Screen and Warning & Impact Chart continued to be statistically
significant. However, we cannot be confident that the Warning & Comparator Chart
and Warning had a robust impact on the population of non-advised investors.
By design, we were unable to measure the standalone treatment effects of the impact of
charges chart, comparator chart, and the review screen, without the warning. However,
we undertook some exploratory analysis to estimate the incremental effect of the impact
of charges chart, comparator chart and the review screen on top of the warning by
comparing them to the impact of the warning alone. As shown in Figure 4, those with the
warning plus another component were more likely to select a cheaper fund compared to
those with just the warning but there was not a statistically significant difference
between the warning and any of the other combined treatments.
Now you see it: drawing attention to charges in the asset management industry
April 2018 20
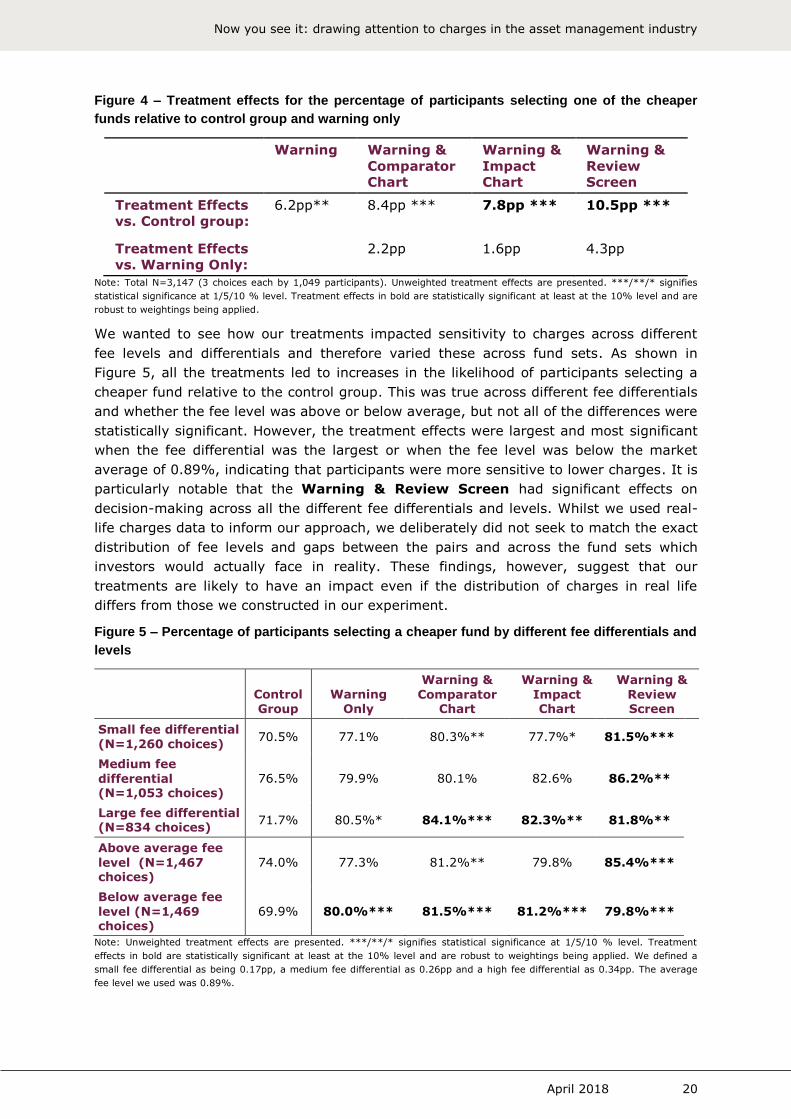
Figure 4 – Treatment effects for the percentage of participants selecting one of the cheaper
funds relative to control group and warning only
Warning Warning &
Comparator Chart
Warning &
Impact Chart
Warning &
Review Screen
Treatment Effects
vs. Control group:
6.2pp** 8.4pp *** 7.8pp *** 10.5pp ***
Treatment Effects
vs. Warning Only:
2.2pp 1.6pp 4.3pp
Note: Total N=3,147 (3 choices each by 1,049 participants). Unweighted treatment effects are presented. ***/**/* signifies
statistical significance at 1/5/10 % level. Treatment effects in bold are statistically significant at least at the 10% level and are
robust to weightings being applied.
We wanted to see how our treatments impacted sensitivity to charges across different
fee levels and differentials and therefore varied these across fund sets. As shown in
Figure 5, all the treatments led to increases in the likelihood of participants selecting a
cheaper fund relative to the control group. This was true across different fee differentials
and whether the fee level was above or below average, but not all of the differences were
statistically significant. However, the treatment effects were largest and most significant
when the fee differential was the largest or when the fee level was below the market
average of 0.89%, indicating that participants were more sensitive to lower charges. It is
particularly notable that the Warning & Review Screen had significant effects on
decision-making across all the different fee differentials and levels. Whilst we used real-
life charges data to inform our approach, we deliberately did not seek to match the exact
distribution of fee levels and gaps between the pairs and across the fund sets which
investors would actually face in reality. These findings, however, suggest that our
treatments are likely to have an impact even if the distribution of charges in real life
differs from those we constructed in our experiment.
Figure 5 – Percentage of participants selecting a cheaper fund by different fee differentials and
levels
Control Group
Warning Only
Warning &
Comparator Chart
Warning &
Impact Chart
Warning &
Review Screen
Small fee differential
(N=1,260 choices) 70.5% 77.1% 80.3%** 77.7%* 81.5%***
Medium fee
differential (N=1,053 choices)
76.5% 79.9% 80.1% 82.6% 86.2%**
Large fee differential (N=834 choices)
71.7% 80.5%* 84.1%*** 82.3%** 81.8%**
Above average fee
level (N=1,467 choices)
74.0% 77.3% 81.2%** 79.8% 85.4%***
Below average fee
level (N=1,469 choices)
69.9% 80.0%*** 81.5%*** 81.2%*** 79.8%***
Note: Unweighted treatment effects are presented. ***/**/* signifies statistical significance at 1/5/10 % level. Treatment
effects in bold are statistically significant at least at the 10% level and are robust to weightings being applied. We defined a
small fee differential as being 0.17pp, a medium fee differential as 0.26pp and a high fee differential as 0.34pp. The average
fee level we used was 0.89%.
Now you see it: drawing attention to charges in the asset management industry
April 2018 21
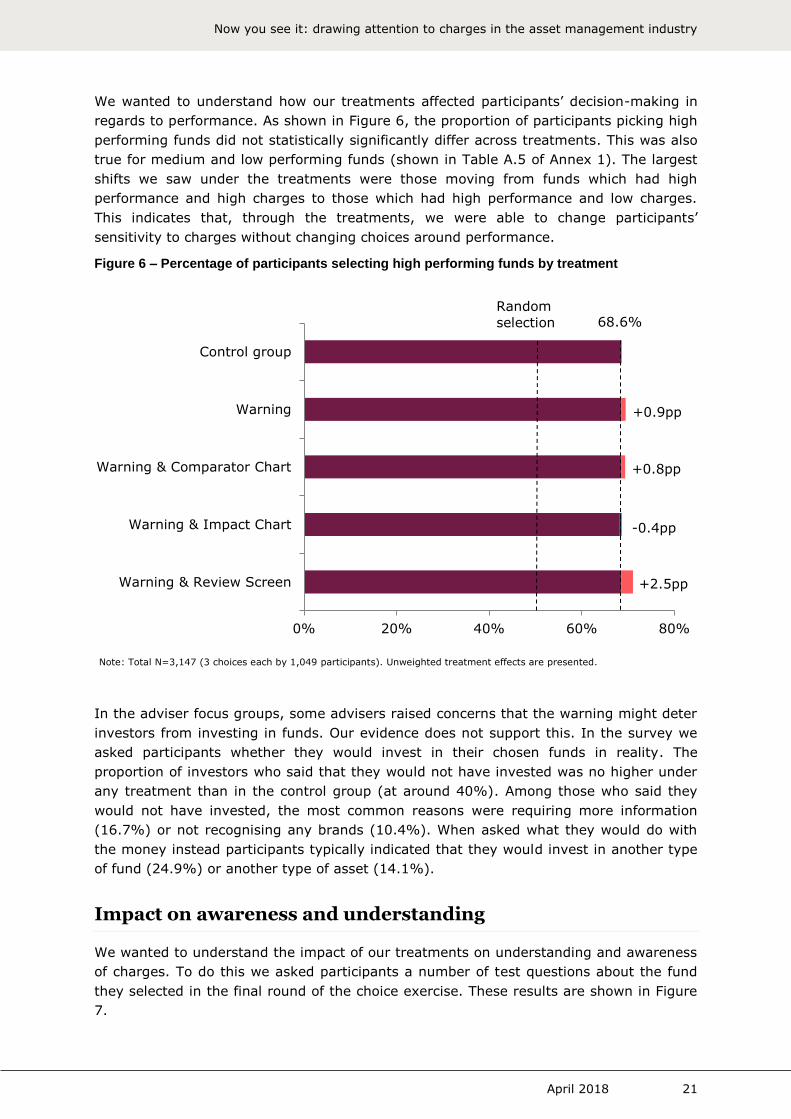
We wanted to understand how our treatments affected participants’ decision-making in
regards to performance. As shown in Figure 6, the proportion of participants picking high
performing funds did not statistically significantly differ across treatments. This was also
true for medium and low performing funds (shown in Table A.5 of Annex 1). The largest
shifts we saw under the treatments were those moving from funds which had high
performance and high charges to those which had high performance and low charges.
This indicates that, through the treatments, we were able to change participants’
sensitivity to charges without changing choices around performance.
Figure 6 – Percentage of participants selecting high performing funds by treatment
Note: Total N=3,147 (3 choices each by 1,049 participants). Unweighted treatment effects are presented.
In the adviser focus groups, some advisers raised concerns that the warning might deter
investors from investing in funds. Our evidence does not support this. In the survey we
asked participants whether they would invest in their chosen funds in reality. The
proportion of investors who said that they would not have invested was no higher under
any treatment than in the control group (at around 40%). Among those who said they
would not have invested, the most common reasons were requiring more information
(16.7%) or not recognising any brands (10.4%). When asked what they would do with
the money instead participants typically indicated that they would invest in another type
of fund (24.9%) or another type of asset (14.1%).
Impact on awareness and understanding
We wanted to understand the impact of our treatments on understanding and awareness
of charges. To do this we asked participants a number of test questions about the fund
they selected in the final round of the choice exercise. These results are shown in Figure
7.
0% 20% 40% 60% 80%
Warning & Review Screen
Warning & Impact Chart
Warning & Comparator Chart
Warning
Control group
68.6%
+0.9pp
+0.8pp
-0.4pp
+2.5pp
Random
selection

Now you see it: drawing attention to charges in the asset management industry
April 2018 22
Figure 7 – Percentage of participants answering understanding and awareness questions
about their chosen fund correctly
For their chosen fund, they correctly identified:
Control group
Warning Warning & Comparator
Chart
Warning & Impact Chart
Warning & Review Screen
It had a charge 88.9% 88.6% 92.3% 91.5% 91.5%
It had an OCF 58.5% 57.7% 63.3% 65.0% 68.2%**
All the types of fees
they incurred 4.8% 7.5% 6.8% 12.6%*** 10.0%**
The OCF range this
fell in 35.3% 34.3% 42.5% 45.7%** 45.0%**
How the OCF compared to those in
fund set
27.5% 37.8%** 37.2%** 34.1% 38.9%**
How the OCF compared to market average
23.7% 24.4% 29.0% 24.7% 49.8%***
Note: Total N=1,049. Unweighted treatment effects are presented. ***/**/* signifies statistical significance at 1/5/10 % level.
Treatment effects in bold are statistically significant at the 10% level and are robust to weightings being applied.
The Warning & Review Screen led to improvements in participants’ overall
understanding and awareness of charges in almost all aspects. It improved participants’
ability to identify all the types of charges they incurred and how the level of charges
compared with those in the fund set. It increased the ability of participants to recall how
the OCF of their chosen fund compared to the average for funds in the same asset class.
This treatment effect of 26.1pp was the largest within the experiment and is notable
because the market average figure was provided on the comparator chart. This suggests
that participants took on board the information contained within it.
More participants in the Warning & Impact Chart treatment were able to correctly
recall all the types of charges they were incurring. This treatment effect of 7.7pp relative
to the control group was statistically significant. This treatment led to a 10.5pp increase
in the proportion of participants who were able to identify the level of the OCF for their
chosen fund. This was only statistically significant when the data were unweighted.
We do not find any evidence of the Warning on its own or the Warning & Comparator
Chart having a statistically significant impact on understanding and awareness.
Impact on importance placed on fund characteristics
We wanted to understand the impact of our treatments on the importance which
participants place on various characteristics of the fund, including charges, past
performance and risk.
After they had conducted the choice exercise, we asked participants to identify the top
three fund characteristics they considered in their decision. The majority of participants
said that performance was the most important factor (about 60%), followed by charges
(around 20%) and then risk (around 8%), as shown in Figure 8. No treatment had a
statistically significant effect on these proportions. We also found the fund characteristics
they ranked as being among the top two or top three most important were fairly constant

Now you see it: drawing attention to charges in the asset management industry
April 2018 23
across the treatments with only a few statistically significant differences between
treatments and the control group (see Table A.4 in Annex 1 for more details).
Figure 8 – Factor which participants stated was most important to them in their decision-
making
Note: Total N=1,019. Unweighted results are presented.
This suggests that our treatments only had a limited impact on the importance
participants said they placed on different fund characteristics, but that they simply chose
cheaper funds.
Our experiment did not capture all the fund characteristics which would be present in
real-life. Brand is an important consideration to investors when selecting a fund.
Although we included fictitious fund names, for legal reasons, we could not include
brands in the experiment. We know that investors typically report brand and reputation
as being factors they would consider when selecting funds. 33 In our survey, 21% of
participants stated that seeing a particular brand would have affected their choice of
fund. We recognise that the omission of brands is a limitation of the experiment. This
might mean that the treatment effects which we see in the experiment might be more
limited in a real-life setting.
Impact on different groups of participants
We conducted some exploratory analysis comparing how our treatments affected
different groups of participants and, in particular, by considering education and financial
literacy. We believed that these factors were likely to have an impact on the likelihood of
a participant selecting a cheaper fund. While the results appear to be interesting it should
be noted the experiment was not designed to allow us to draw robust inferences from
different segments. Care should be taken when interpreting these results due to the
small sample sizes for some subgroups.
As shown in Figure 9, we found that in the control group, the proportion of participants
choosing a cheaper fund does not significantly differ between those with or without a
33 www.fca.org.uk/sites/default/files/publications/market-studies/ms15-2-2-annex-3.pdf.
0%
10%
20%
30%
40%
50%
60%
70%
Charges of the funds Performance of thefunds
Riskiness of the funds Other
Control group Warning Warning & Comparator Chart
Warning & Impact Chart Warning & Review Screen
Now you see it: drawing attention to charges in the asset management industry
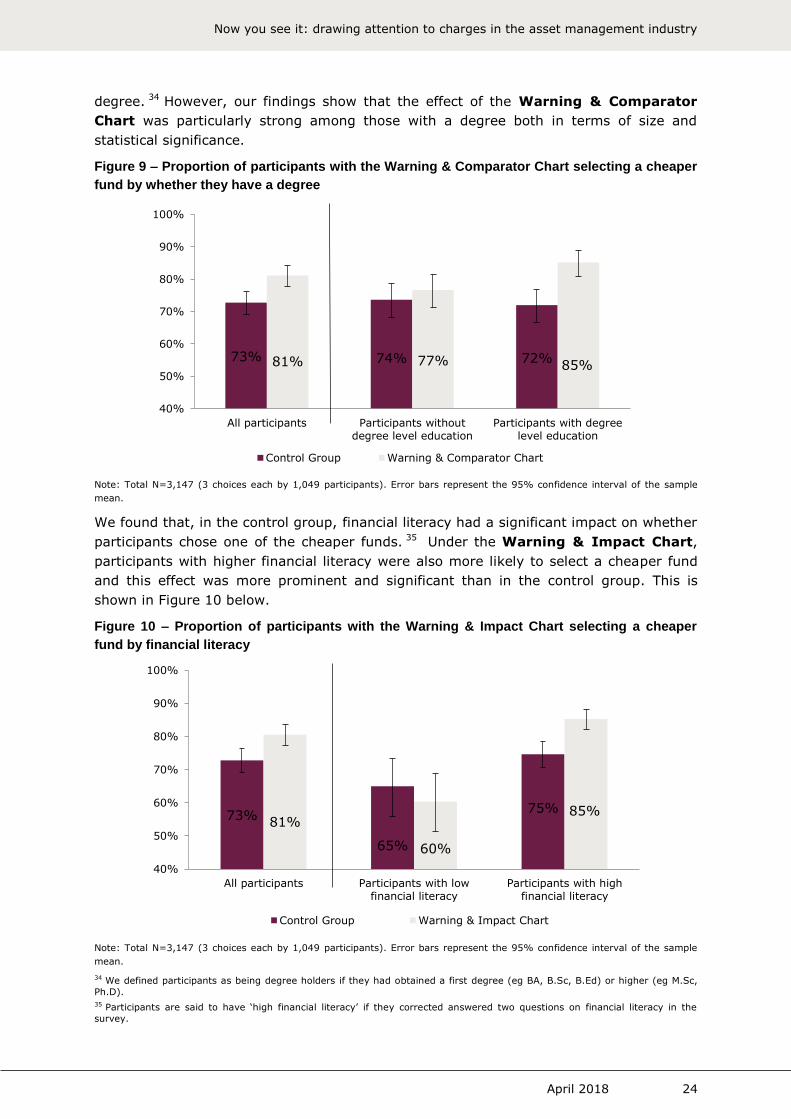
April 2018 24
degree. 34 However, our findings show that the effect of the Warning & Comparator
Chart was particularly strong among those with a degree both in terms of size and
statistical significance.
Figure 9 – Proportion of participants with the Warning & Comparator Chart selecting a cheaper
fund by whether they have a degree
Note: Total N=3,147 (3 choices each by 1,049 participants). Error bars represent the 95% confidence interval of the sample
mean.
We found that, in the control group, financial literacy had a significant impact on whether
participants chose one of the cheaper funds. 35 Under the Warning & Impact Chart,
participants with higher financial literacy were also more likely to select a cheaper fund
and this effect was more prominent and significant than in the control group. This is
shown in Figure 10 below.
Figure 10 – Proportion of participants with the Warning & Impact Chart selecting a cheaper
fund by financial literacy
Note: Total N=3,147 (3 choices each by 1,049 participants). Error bars represent the 95% confidence interval of the sample
mean.
34 We defined participants as being degree holders if they had obtained a first degree (eg BA, B.Sc, B.Ed) or higher (eg M.Sc,
Ph.D).
35 Participants are said to have ‘high financial literacy’ if they corrected answered two questions on financial literacy in the
survey.
73% 74% 72% 81% 77% 85%
40%
50%
60%
70%
80%
90%
100%
All participants Participants withoutdegree level education
Participants with degreelevel education
Control Group Warning & Comparator Chart
73%
65%
75% 81%
60%
85%
40%
50%
60%
70%
80%
90%
100%
All participants Participants with lowfinancial literacy
Participants with highfinancial literacy
Control Group Warning & Impact Chart

Now you see it: drawing attention to charges in the asset management industry
April 2018 25
While these results provide interesting indications of the effect of our treatments, we
recognise that the analysis is underpowered due to the relatively small sub-sample
sizes. 36 Detailed regression output on the interaction between various participant
characteristics and treatments are reported in Table A.6 of Annex 1, but these should be
treated with caution.
36 The sub-sample sizes of participants with/without degrees or with/without large investable assets, in each treatment group,
are around 300.
Now you see it: drawing attention to charges in the asset management industry
April 2018 26
Overview
We tested multiple disclosure designs and found that these changed the decisions
participants made and, in some cases, increased their understanding and awareness of
charges. Participants were more likely to choose a cheaper fund when presented with any
one of the treatments, relative to a control intended to mimic current disclosure in the
market.
The most effective treatment highlighted the impact of charges on returns through a
warning and provided summary information about the charges associated with a fund
just before an investor made a purchase. This treatment led participants to choose
cheaper equivalent funds and increased their subsequent awareness of fund charges. Our
other treatments, including visual information on the impact of charges, and how the
charges compared to other funds, also helped participants choose cheaper equivalent
funds but did not have any effect on awareness. The treatments did not appear to
change the attention participants placed on other fund characteristics, such as risk and
brand.
There have been relatively few empirical studies testing the impact of the disclosure of
charges in the asset management industry. Our research uses a large, policy relevant
sample of investors, a realistic decision setting and tests feasible policy options. It
combines several stages of qualitative research which informs and complements the
experiment. We therefore believe this research offers new insights into the disclosure of
charges information that can be helpful for investors.
What did we find?
All of our treatments increased the proportion of investors choosing a cheaper fund.
While the warning on its own had some impact on decision-making, the effects were
larger and more robust when it was coupled with another component, notably the review
screen or the impact chart. While these differences were not statistically significant, our
findings suggest that these additional components contributed to the overall effects. Most
notably, the inclusion of the review screen alongside the warning led to improvements in
understanding and awareness. Our analysis of how people interacted with the review
screen showed that a large proportion of those who revisited their decisions chose
cheaper funds. The scale of these effects is sizeable, particularly as the proportion of
investors choosing a cheaper product in the control group was relatively high.
We acknowledge that our experiment was a necessary simplification of real-life, and that
small changes in context may impact on real life decisions. However, as there is around
£170bn invested through direct to consumer (D2C) platforms, we believe that even if the
5 Conclusions and implications
Now you see it: drawing attention to charges in the asset management industry
April 2018 27
effects were smaller in reality, over time due to compounding they would still have an
economically meaningful impact on investor returns.
Previous research has shown that some investors might not pay significant attention to
charges, but that other factors such as fund objectives, risk, asset allocation,
performance and brand might be important to them in their decision-making. 37 The
proportion of participants selecting high, medium or low performance funds did not
change as a result of our treatments, nor did the factors which participants reported as
being most important in their decisions. Our results suggest that the treatments we
tested led investors to pay more attention to charges, without apparently altering the
importance they placed on other fund characteristics. This is an important finding, and
could have wider applications for how we think about disclosure in other complex
decision-making contexts. In particular if there are situations where a better outcome or
result could be achieved by encouraging consumers to focus attention on one dimension
of a decision without affecting the attention they place on other features.
How can we interpret these results?
There is evidence from other markets and other contexts that disclosures can have a
limited impact on consumers’ financial decision-making. And the FCA’s own research has
shown limited effects of disclosure for ongoing product choices across a range of financial
products. 38 Choi, Laibson, & Madrian (2009) show that enhanced disclosure of fund
charges has a limited impact on investor decision-making. However, in contrast to Choi,
Laibson, & Madrian, the treatments we tested contained simple and short messages. The
warning gave investors a clear and relatively strong instruction to consider fees and
contributed significantly to our treatment effects. It is possible that this treatment
required very little interpretation or thought by the participants in order to change their
behaviour. For the other treatments, our results support other evidence that suggests
that using colour, graphics and plain language can make information more noticeable and
more likely to be acted upon. Our results also support a growing body of evidence that
shows that where information is located can have an impact on how consumers engage
with it. 39 The treatments which had the biggest impact on decision-making were
prominently positioned; the warning and impact chart were at the top of the landing
page whilst all participants in the review screen treatment had to view the comparator
chart to proceed with their decision.
These results highlight that simply providing consumers with information does not
guarantee that they will use it in their decision-making. However, clearly presenting
understandable and engaging information in a prominent way can increase the
effectiveness of disclosures.
37 See, for example, www.fca.org.uk/sites/default/files/publications/market-studies/ms15-2-2-annex-3.pdf 38 See Hunt, Kelly and Garavito (2015) and Smart (2016).
39 For example, information located on the top of a page is likely to be more effective than that at the bottom of a page
(Bergstrom and Schall, 2014) and providing customers with information on page they have to click on to access can lead to
poorer decisions (Smart, 2016).
Now you see it: drawing attention to charges in the asset management industry
April 2018 28
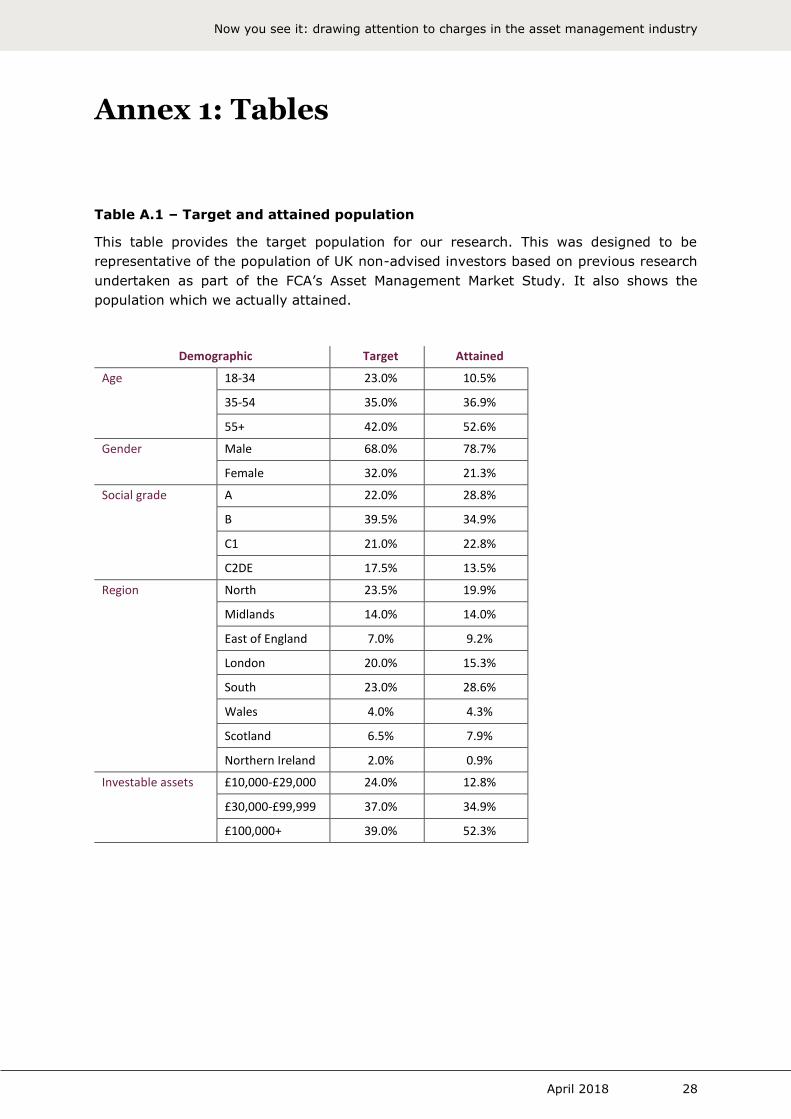
Table A.1 – Target and attained population
This table provides the target population for our research. This was designed to be
representative of the population of UK non-advised investors based on previous research
undertaken as part of the FCA’s Asset Management Market Study. It also shows the
population which we actually attained.
Demographic Target Attained
Age
18-34 23.0% 10.5%
35-54 35.0% 36.9%
55+ 42.0% 52.6%
Gender
Male 68.0% 78.7%
Female 32.0% 21.3%
Social grade
A 22.0% 28.8%
B 39.5% 34.9%
C1 21.0% 22.8%
C2DE 17.5% 13.5%
Region
North 23.5% 19.9%
Midlands 14.0% 14.0%
East of England 7.0% 9.2%
London 20.0% 15.3%
South 23.0% 28.6%
Wales 4.0% 4.3%
Scotland 6.5% 7.9%
Northern Ireland 2.0% 0.9%
Investable assets
£10,000-£29,000 24.0% 12.8%
£30,000-£99,999 37.0% 34.9%
£100,000+ 39.0% 52.3%
Annex 1: Tables

Now you see it: drawing attention to charges in the asset management industry
April 2018 29
Table A.2 – Effect of treatments on decision-making
This table reports the weighted and unweighted results for the percentage of participants
selecting one of the cheaper funds by treatment and associated treatment effects.
Control group Warning
Warning & Comparator
Chart
Warning & Impact Chart
Warning & Review Screen
Unweighted
Selected a lower cost fund
72.8% 78.9% 81.2% 80.6% 83.3%
Treatment effect versus control
group
6.2pp** 8.4pp*** 7.8pp*** 10.5pp***
Treatment effect versus Warning
Only
2.2pp 1.6pp 4.3pp
Weighted
Selected a lower cost fund
72.9% 78.2% 77.1% 80.3% 82.5%
Treatment effect versus control group
5.3pp 4.2pp 7.4pp** 9.6pp***
Treatment effect versus Warning Only
-1.1pp 2.2pp 4.3pp
Note: Total N=3,147 (3 choices each by 1,049 participants). ***/**/* signifies statistical significance at 1/5/10 % level.
Table A.3 – Weighted results for effect of treatments on understanding and
awareness
This table reports the weighted results for percentage of participants answering
understanding and awareness questions about their chosen fund correctly by the
different treatments.
For their chosen fund, they correctly
identified:
Control group
Warning Warning & Comparator
Chart
Warning & Impact Chart
Warning & Review
Screen
It had a charge 89.4% 87.4% 87.5% 88.9% 89.4%
It had an OCF 58.1% 56.4% 58.0% 61.7% 63.6%
All the types of fees they incurred
3.4% 7.5% 6.1% 13.8%*** 8.8%**
The OCF range this fell in
37.7% 36.3% 40.7% 42.0% 44.4%
How the OCF compared to those in fund set
29.9% 39.1% 34.2% 32.7% 40.3%*
How the OCF compared to market
average
24.9% 21.0% 28.4% 22.5% 45.1%***
Note: Total N=1,049. ***/**/* signifies statistical significance at 1/5/10 % level.
Now you see it: drawing attention to charges in the asset management industry
April 2018 30
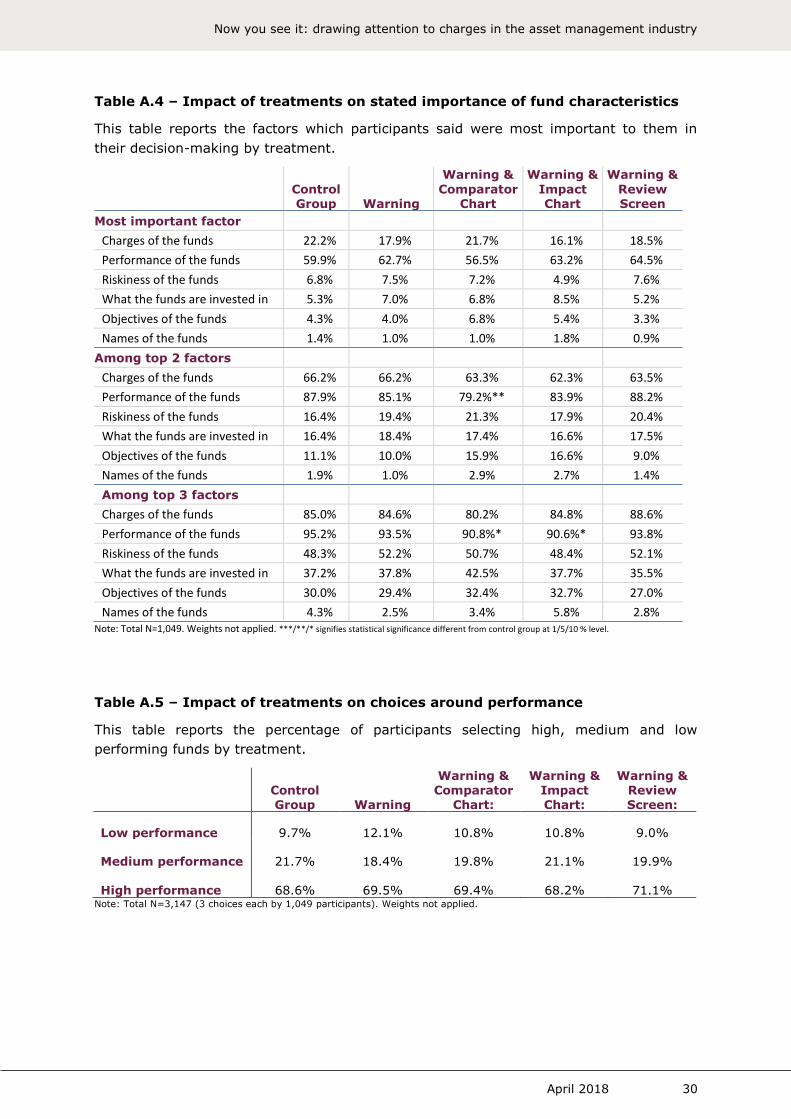
Table A.4 – Impact of treatments on stated importance of fund characteristics
This table reports the factors which participants said were most important to them in
their decision-making by treatment.
Control Group Warning
Warning &
Comparator Chart
Warning &
Impact Chart
Warning &
Review Screen
Most important factor
Charges of the funds 22.2% 17.9% 21.7% 16.1% 18.5%
Performance of the funds 59.9% 62.7% 56.5% 63.2% 64.5%
Riskiness of the funds 6.8% 7.5% 7.2% 4.9% 7.6%
What the funds are invested in 5.3% 7.0% 6.8% 8.5% 5.2%
Objectives of the funds 4.3% 4.0% 6.8% 5.4% 3.3%
Names of the funds 1.4% 1.0% 1.0% 1.8% 0.9%
Among top 2 factors
Charges of the funds 66.2% 66.2% 63.3% 62.3% 63.5%
Performance of the funds 87.9% 85.1% 79.2%** 83.9% 88.2%
Riskiness of the funds 16.4% 19.4% 21.3% 17.9% 20.4%
What the funds are invested in 16.4% 18.4% 17.4% 16.6% 17.5%
Objectives of the funds 11.1% 10.0% 15.9% 16.6% 9.0%
Names of the funds 1.9% 1.0% 2.9% 2.7% 1.4%
Among top 3 factors
Charges of the funds 85.0% 84.6% 80.2% 84.8% 88.6%
Performance of the funds 95.2% 93.5% 90.8%* 90.6%* 93.8%
Riskiness of the funds 48.3% 52.2% 50.7% 48.4% 52.1%
What the funds are invested in 37.2% 37.8% 42.5% 37.7% 35.5%
Objectives of the funds 30.0% 29.4% 32.4% 32.7% 27.0%
Names of the funds 4.3% 2.5% 3.4% 5.8% 2.8% Note: Total N=1,049. Weights not applied. ***/**/* signifies statistical significance different from control group at 1/5/10 % level.
Table A.5 – Impact of treatments on choices around performance
This table reports the percentage of participants selecting high, medium and low
performing funds by treatment.
Control Group Warning
Warning & Comparator
Chart:
Warning & Impact Chart:
Warning & Review Screen:
Low performance 9.7% 12.1% 10.8% 10.8% 9.0%
Medium performance 21.7% 18.4% 19.8% 21.1% 19.9%
High performance 68.6% 69.5% 69.4% 68.2% 71.1% Note: Total N=3,147 (3 choices each by 1,049 participants). Weights not applied.
Now you see it: drawing attention to charges in the asset management industry
April 2018 31
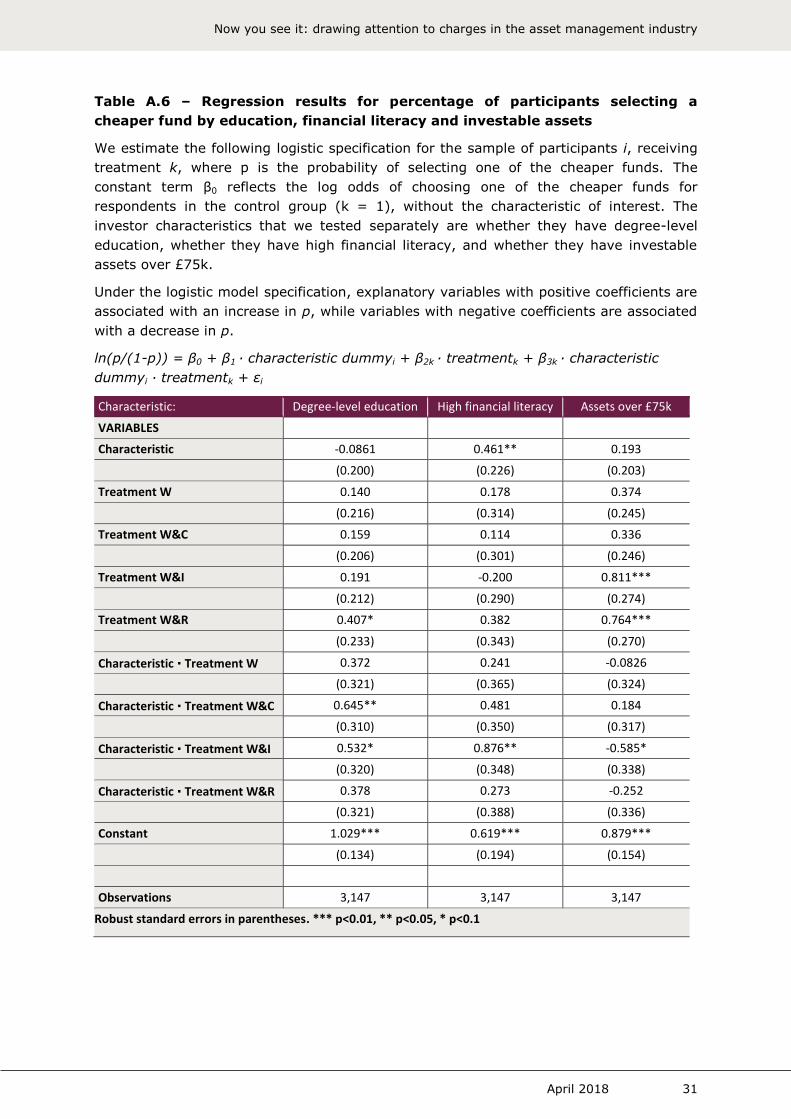
Table A.6 – Regression results for percentage of participants selecting a
cheaper fund by education, financial literacy and investable assets
We estimate the following logistic specification for the sample of participants i, receiving
treatment k, where p is the probability of selecting one of the cheaper funds. The
constant term β0 reflects the log odds of choosing one of the cheaper funds for
respondents in the control group (k = 1), without the characteristic of interest. The
investor characteristics that we tested separately are whether they have degree-level
education, whether they have high financial literacy, and whether they have investable
assets over £75k.
Under the logistic model specification, explanatory variables with positive coefficients are
associated with an increase in p, while variables with negative coefficients are associated
with a decrease in p.
ln(p/(1-p)) = β0 + β1 ∙ characteristic dummyi + β2k ∙ treatmentk + β3k ∙ characteristic
dummyi ∙ treatmentk + εi
Characteristic: Degree-level education High financial literacy Assets over £75k
VARIABLES
Characteristic -0.0861 0.461** 0.193
(0.200) (0.226) (0.203)
Treatment W 0.140 0.178 0.374
(0.216) (0.314) (0.245)
Treatment W&C 0.159 0.114 0.336
(0.206) (0.301) (0.246)
Treatment W&I 0.191 -0.200 0.811***
(0.212) (0.290) (0.274)
Treatment W&R 0.407* 0.382 0.764***
(0.233) (0.343) (0.270)
Characteristic ∙ Treatment W 0.372 0.241 -0.0826
(0.321) (0.365) (0.324)
Characteristic ∙ Treatment W&C 0.645** 0.481 0.184
(0.310) (0.350) (0.317)
Characteristic ∙ Treatment W&I 0.532* 0.876** -0.585*
(0.320) (0.348) (0.338)
Characteristic ∙ Treatment W&R 0.378 0.273 -0.252
(0.321) (0.388) (0.336)
Constant 1.029*** 0.619*** 0.879***
(0.134) (0.194) (0.154)
Observations 3,147 3,147 3,147
Robust standard errors in parentheses. *** p<0.01, ** p<0.05, * p<0.1
Now you see it: drawing attention to charges in the asset management industry
April 2018 32
Ben-Shahar, O., & Schneider, C. E. (2014). More than you wanted to know: The Failure
of Mandated Disclosure. Princeton University Press.
Bergstrom, J. R., & Schall, A.J. (2014). Eye tracking in user experience design. Elsevier.
Bettman, J. R., Payne, J. W., & Staelin, R. (1986). Cognitive considerations in designing
effective labels for presenting risk information. Journal of Public Policy & Marketing, 1-28.
Bhargava, S. and Loewenstein, G. (2015). Behavioural economics and public policy 102:
Beyond nudging. American Economic Review, 105(5), 396-401.
Braun, C. C., & Silver, N. C. (1995). Interaction of signal word and colour on warning
labels: differences in perceived hazard and behavioural compliance. Ergonomics, 38(11),
2207-2220.
Bubb, R., & Pildes, R. H. (2014). How behavioural economics trims its sails and why.
Harvard Law Review, 127, 1593.
Camerer, C., Issacharoff, S., Loewenstein, G., O'Donoghue, T., & Rabin, M. (2003).
Regulation for Conservatives: Behavioural Economics and the Case for "Asymmetric
Paternalism". University of Pennsylvania Law Review, 151(3), 1211-1254.
Campbell, J. Y., Jackson, H. E., Madrian, B. C., & Tufano, P. (2011). Consumer financial
protection. Journal of Economic Perspectives, 25(1), 91-114.
Carhart, M. M. (1997). On persistence in mutual fund performance. The Journal of
Finance, 52(1), 57-82.
Carlin, B. I. (2009). Strategic price complexity in retail financial markets. Journal of
Financial Economics, 91(3), 278-287.
Chater, N., Huck, S., & Inderst, R. (2010). Consumer decision-making in retail
investment services: A behavioural economics perspective. Report to the European
Commission/SANCO.
Choi, J., Laibson, D., & Madrian, B. (2006). Reducing the Complexity Costs of 401 (k)
Participation Through Quick Enrolment (TM) (No. w11979). National Bureau of Economic
Research.
Choi, J. J., Laibson, D., & Madrian, B. C. (2009). Why does the law of one price fail? An
experiment on index mutual funds. The Review of Financial Studies, 23(4), 1405-1432.
Cronqvist, H. (2005). Advertising and Portfolio Choice (No. 44). Centre for Research on
Pensions and Welfare Policies, Turin (Italy).
Eisenstein, E. M., & Hoch, S. J. (2007). Intuitive compounding: Framing, temporal
perspective, and expertise.
Fisch, J. E., & Wilkinson-Ryan, T. (2014). Why do retail investors make costly mistakes?
An experiment on mutual fund choice. University of Pennsylvania Law Review, 162(3),
605-647.
Annex 2 - References

Now you see it: drawing attention to charges in the asset management industry
April 2018 33
Fletcher, J., & Forbes, D. (2002). An exploration of the persistence of UK unit trust
performance. Journal of Empirical Finance, 9(5), 475-493.
Gil-Bazo, J., & Ruiz-Verdu, P. (2008). When cheaper is better: Fee determination in the
market for equity mutual funds. Journal of Economic Behaviour & Organization, 67(3-4),
871-885.
Gil-Bazo, J., & Ruiz-Verdu, P. (2009). The relation between price and performance in the
mutual fund industry. The Journal of Finance, 64(5), 2153-2183.
Hastings, J. S., & Tejeda-Ashton, L. (2008). Financial literacy, information, and demand
elasticity: survey and experimental evidence from Mexico (No. w14538). National Bureau
of Economic Research.
Hortacsu, A., & Syverson, C. (2004). Product differentiation, search costs, and
competition in the mutual fund industry: A case study of S&P 500 index funds. The
Quarterly Journal of Economics, 119(2), 403-456.
Hunt, S., Kelly, D., & Garavito, F. (2015). Message Received? The Impact of Annual
Summaries, Text Alerts and Mobile Apps on Consumer Banking Behaviour. FCA
Iscenko, Z., Duke, C., Huck, S., & Wallace, B. (2014). How Does Selling Insurance As an
Add-On Affect Consumer Decisions? FCA.
Johnson, E. J., Moe, W. W., Fader, P. S., Bellman, S., & Lohse, G. L. (2004). On the
depth and dynamics of online search behaviour. Management Science, 50(3), 299-308.
Kahneman, D. (2011). Thinking, fast and slow. Macmillan.
Kahneman, D., & Tversky, A. (1991). Loss aversion in riskless choice: A reference-
dependent model. The Quarterly Journal of Economics, 106(4), 1039-1061.
Lusardi, A., & Mitchell, O. S. (2009). How ordinary consumers make complex economic
decisions: Financial literacy and retirement readiness (No. w15350). National Bureau of
Economic Research.
Lynch Jr, J. G., & Ariely, D. (2000). Wine online: Search costs affect competition on
price, quality, and distribution. Marketing Science, 19(1), 83-103.
Morningstar (2016). How fund fees are the best predictor of returns. Retrieved from
www.morningstar.co.uk/uk/news/149421/how‑fund‑fees‑are‑the‑best‑predictor‑of‑
returns.aspx.
Paredes, T. A. (2003). Blinded by the light: Information overload and its consequences
for securities regulation. Washington University Law Review, 81, 417.
Pieters, R. G. M., Rosbergen, E. & Hartog, M. (1996). Visual attention to advertising: The
impact of motivation and repetition. Advances in Consumer Research, 23, 242-248.
Pinker, S. (1990). A theory of graph comprehension. Artificial Intelligence and the Future
of Testing, 73-126.
Quigley, G., & Sinquefield, R. A. (2000). Performance of UK equity unit trusts. Journal of
Asset Management, 1(1), 72-92.
Smart, L. (2016). Full Disclosure: A Round-Up of FCA Experimental Research into Giving
Information. FCA.

Now you see it: drawing attention to charges in the asset management industry
April 2018 34
Stango, V., & Zinman, J. (2009). Exponential growth bias and household finance. The
Journal of Finance, 64(6), 2807-2849.
The Behavioural Insights Team (2012). Applying behavioural insights to reduce fraud,
error and debt.

© Financial Conduct Authority 2017
25 The North Colonnade, Canary Wharf, London E14 5HS Telephone: +44 (0)20 7066 1000 Website: www.fca.org.uk
All rights reserved