financial characteristics sept16 - agecon...
TRANSCRIPT

Agribusiness & Applied Economics Report No. 756 September 2016
Financial Characteristics of North Dakota Farms
2006-2015
Andrew L. Swenson
Department of Agribusiness and Applied Economics Agricultural Experiment Station North Dakota State University
Fargo, ND 58108-6050

Contact Information
The author extends appreciation to Tim Petry and Richard Taylor for their constructive comments and suggestions. North Dakota State University does not discriminate on the basis of age, color, disability, gender expression/identity, genetic information, marital status, national origin, public assistance status, race, religion, sex, sexual orientation, or status as a U.S. veteran. This publication is available electronically at this web site: http://agecon.lib.umn.edu/. Please address your inquiries regarding this publication to: Department of Agribusiness & Applied Economics, P.O. Box 6050, Fargo, ND 58108-6050, Phone: 701-231-7441, Fax: 701-231-7400, Email: [email protected]. NDSU is an equal opportunity institution. NOTICE: The analyses and views reported in this paper are those of the author(s). They are not necessarily endorsed by the Department of Agribusiness and Applied Economics or by North Dakota State University. Copyright 2016© by Swenson. All rights reserved. Readers may make verbatim copies of this document for non-commercial purposes by any means, provided that this copyright notice appears on all such copies.

i
Table of Contents
List of Tables ............................................................................................................................................... ii
List of Figures ............................................................................................................................................. iii
Abstract ....................................................................................................................................................... iv
Introduction ................................................................................................................................................... 1
Source of Data .............................................................................................................................................. 1
Interpretation of Results ............................................................................................................................... 2
Farm Classifications and Highlights ............................................................................................................ 4
All Farms ........................................................................................................................................ 4
Region ............................................................................................................................................. 6
Farm Enterprise ................................................................................................................................ 7
Farm Sales ....................................................................................................................................... 9
Farm Size ...................................................................................................................................... 11
Cropland Tenure ........................................................................................................................... 12
Net Farm Income .......................................................................................................................... 14
Debt-to-Asset Ratio ...................................................................................................................... 15
Farmer Age ................................................................................................................................... 16
Appendix: Definition of Financial Measures ............................................................................................. 27
References .................................................................................................................................................. 31

ii
List of Tables
Table 1. Median farm size, farm operator age, and financial factors of farms participating in the North Dakota Farm Business Management Education Program, 2006-2015 ................... 3
Table 2. Farm classifications and percent distribution of farm types within regions, North
Dakota Farm Business Management Education Program, 2015 ................................................ 5 Table 3. Current assets and current liabilities, quartile values for 2015, median values for
2014, and 5-year average, 2010-2014, of median values, North Dakota Farm Business Management Education Program participants ........................................................... 18
Table 4. Liquidity measures, quartile values for 2015, median values for 2014, and 5-year
average, 2010-2014, of median values, North Dakota Farm Business Management Education Program participants ............................................................................................... 19
Table 5. Total assets and total liabilities, quartile values for 2015, median values for 2014
and 5-year average, 2010-2014, of median values, North Dakota Farm Business Management Education Program participants ......................................................................... 20
Table 6. Solvency measures, quartile values for 2015, median values for 2014, and 5-year
average, 2010-2014, of median values, North Dakota Farm Business Management Education Program participants .............................................................................................. 21
Table 7. Rate of return on assets and rate of return on equity profitability measures, quartile
values for 2015, median values for 2014, and 5-year average, 2010-2014, of median values, North Dakota Farm Business Management Education Program participants .............. 22
Table 8. Operating profit margin and net farm income profitability measures, quartile values
for 2015, median values for 2014, and 5-year average, 2010-2014, of median values, North Dakota Farm Business Management Education Program participants .......................... 23
Table 9. Repayment capacity measures, quartile values for 2015, median values for 2014,
and 5-year average, 2010-2014, of median values, North Dakota Farm Business Management Education Program participants ......................................................................... 24
Table 10. Asset turnover, and operating expense and depreciation expense efficiency
measures (as a percentage of gross farm income), quartile values for 2015, median values for 2014, and 5-year average, 2010-2014, of median values, North Dakota Farm Business Management Education Program participants .................................... 25
Table 11. Interest expense and farm income efficiency measures (as a percentage of gross
farm income), quartile values for 2015, median values for 2014, and 5-year average, 2010-2014, of median values, North Dakota Farm Business Management Education Program participants ......................................................................... 26

iii
List of Figures Figure 1. Median total farm assets and liabilities by farm type, 2015, N.D. Farm Mgt. Program ......... 8
Figure 2. Median net farm income by farm type, 2006-2015, N.D. Farm Mgt. Program ...................... 8
Figure 3. Median rate of return on assets by farm type, 2006-2015, N.D. Farm Mgt. Program ............. 8
Figure 4. Median asset turnover ratio by farm type, 2006-2015, N.D. Farm Mgt. Program ................. 8
Figure 5. Median total farm assets and liabilities by farm sales, 2015, N.D. Farm Mgt. Program ...... 10
Figure 6. Median net farm income by farm sales, 2006-2015, N.D. Farm Mgt. Program ................... 10
Figure 7. Median term debt coverage ratio by farm sales, 2006-2015, N.D. Farm Mgt. Program ...... 10
Figure 8. Median interest expense as a percent of gross revenue, by farm sales, 2006-2015, N.D. Farm Mgt. Program ...................................................................................................... 10
Figure 9. Median net farm income by crop land tenure, 2006-2015, N.D. Farm Mgt. Program ......... 13
Figure 10. Median asset turnover ratio by crop land tenure, 2006-2015, N.D. Farm Mgt. Program ..... 13
Figure 11. Median net farm income by debt-to-asset group, 2006-2015, N.D. Farm Mgt. Program ..... 13
Figure 12. Median net farm income as a percent of gross revenue by debt-to-asset group, 2006-2015, N.D. Farm Mgt. Program ................................................................................... 13
Figure 13. Median total farm assets and liabilities by farmer age, 2015, N.D. Farm Mgt. Program ..... 17
Figure 14. Median net farm income by farmer age, 2006-2015, N.D. Farm Mgt. Program .................. 17
Figure 15. Median term debt coverage ratio by farmer age, 2006-2015, N.D. Farm Mgt. Program ..... 17
Figure 16. Median net farm income as a percent of gross revenue, by farmer age, 2006-2015, N.D. Farm Mgt. Program ...................................................................................................... 17

iv
Abstract
The performance of over 500 North Dakota farms, 2006-2015, is summarized using 16 financial measures. Farms are categorized by geographic region, farm type, farm size, gross cash sales, farm tenure, net farm income, debt-to-asset, and age of farmer to analyze relationships between financial performance and farm characteristics. Five-year averages, 2010-2014, are also presented. In 2015, median and average acreage per farm was 1,847 and 2,371, respectively. Median and average cash farm revenue was $499,756 and $687,287, respectively. Over 70% of farms were crop farms and 50 percent of farms had gross sales exceeding $500,000. Median age of farm operators was 48. Median net farm income in 2015 declined to $18,982, the lowest since 1997, from $54,543 in 2014. The 10 year high was $238,054 in 2012. Financial measures for 2012, 2011, 2010, 2008 and 2007 were much superior to those in other years for the 2006-2015 period. The Red River Valley and crop farms typically had stronger profitability, solvency, and repayment capacity than other regions and farm types, respectively, but not in 2013 and 2014. Median net farm income of livestock farms decreased to $18,999 in 2015 from a ten year high of $95,130 in 2014. Median term debt coverage ratio was 0.69 in 2015 compared to a 2010-2014 average of 2.75. Farms with sales less than $500,000 were nearly twice as likely to have debt-to-asset higher than 70 percent as farms with sales greater than $500,000. Farms that own some crop land, but less than 40 percent of the land they operate were more likely to be crop farms, farm more acreage, have larger sales, and be more profitable. As expected, solvency and percent of crop land owned increased with farmer age. Median net farm income as a percent of gross revenue was the lowest in the decade in 2015, at 5.1%, and the highest in 2012, at 36.8%. Keywords: Farm financial management, farm management, farm income, liquidity, solvency, profitability, repayment capacity, financial efficiency, financial benchmarks, tenure, North Dakota.
1
Introduction Financial statements such as the balance sheet and income statement provide a structured format to summarize financial information so it is more manageable for decision making. It is helpful to further simplify or summarize information contained in financial statements into key measures of financial performance. However, the calculation of a financial measure can be fruitless unless there is a meaningful basis of comparison to evaluate the number. Two methods of comparison are:
1. Past performance. The progress of a business can be monitored by constructing financial measures on a periodic basis and comparing present to past performance.
2. Industry benchmarks. The average or median of a financial measure from several similar businesses provides a good point of reference. There are statewide farm record programs in some states, including North Dakota. Each farm has its own unique aspects, so the most appropriate comparison would be farms that have similar enterprises and resources.
Whatever method of comparison is used, it is imperative that the procedures for construction of financial statements and performance measures are consistent over time and between farms to ensure an "apples-to-apples" comparison.
The Farm Financial Standards Task Force (FFSTF), which was formed by the American Bankers Association in 1989, has provided recommendations of standards for financial statement construction and the calculation measures of financial performance. Sixteen of these measures are the basis for the benchmarks presented in this publication. The Appendix has an explanation of the financial measures used in this study.
The purpose of this study is to provide information to producers, lenders, educators, and others on the financial performance of a sample of North Dakota farms. Table 1 lists the median operator age, farm size and selected financial factors, 2006-2015. The data are from financial summaries of farms participating in the North Dakota Farm Business Management Education program. In this study, the median and upper and lower quartiles of 16 financial performance measures are presented for all farms in the data set and for groupings of farms by characteristic such as farm type, farm size, and age of producer. The results can be used by producers and lenders to evaluate the financial performance of a farm. Also, trends can be identified and relationships between farm characteristics and financial measures can be analyzed. However because of the small number of farms in this study, the results should be used cautiously and only be considered guidelines.
Source of Data
About 700 farms are enrolled in the North Dakota Farm Business Management Education program. Instructors educate and assist producers in record keeping and review data for completeness and accuracy. Instructors use the Finpack farm financial management software program to generate financial summaries. From 2006-2015, the financial summaries of over 500 farms each year were considered usable for this study.
About 85 percent of the total farms repeat from one year to the next. Annual turnover occurs from changes in farm management program enrollment and the level of farms completing their records by a cutoff date.
The farms in this study are larger and the age of the farm operators younger than the state average. In 2015, there were 30,000 farms in North Dakota with agricultural production of at least $1,000. Only 8,200, or 27%, had gross receipts greater than $500,000, whereas 50% of the 525 farms in 2015 for this study exceed that sales volume (median gross sales was $499,756). The farms in the study are more representative of operations that provide the primary source of net family income. The average age of farm operators in this study is 46 compared to 57 for the state average.

2
Interpretation of Results
Each financial measure was calculated for each farm. Refer to the Appendix for definitions of the financial measures and an explanation of asset valuation and accrual adjustments.
Farms were grouped by characteristics such as region, type of farm, and size and were sorted in order from strongest to weakest by each of the 16 financial measures. The median is the midpoint value of the financial measure: one-half of the farms in the category had a higher value and one-half had a lower value than the median. The upper quartile is the value that was exceeded by one-fourth of the farms, and the lower quartile is the value that was exceeded by three-fourths of the farms. (Another definition of lower quartile is the value for which one-quarter of the farms in the category had a weaker value.)
Individual farm operators and lenders can use this study for benchmarks of comparison if their financial measures are calculated similarly. For example, a farm operator 30 years of age may compare his/her profitability and financial efficiency with those of other young operators. Or, a lender may compare the solvency and repayment capacity of producers who rent all their crop land. This study also can be used to look at relationships and trends. What is the relationship between age of farmer and rate of return on equity? How has operating profit margin of livestock farms changed over time?
One ratio is not sufficient to make conclusions about the overall financial performance of a farm business. For example, a crop farm may have a debt-to-asset ratio of 50%, which is worse than the median value of 45.2% (shown on table 6) for the crop farm enterprise category. However, other factors such as profitability, total assets, and age of operator should also be considered.
Also, a farm can be adversely affected by extraordinary circumstances. Profitability in the low quartile may not be reflective of management capability if the farm had localized bad weather that was not experienced by many other producers in the farm category.
Caution must be used when analyzing the tables because a small number of farms increases the possibility that results may not be representative of a farm category. In this study for 2015, there are only 49 farms with $200,000 or greater net farm income and 49 farms with net farm income of $100,000 to $200,000. There were 62 mixed livestock-crop enterprise farms, 79 farms in the west region, 79 farms with net farm income of $100,000 to $200,000, and 85 farms with operators 40 to 50 years of age.
Performance of the Red River Valley region may not be representative of the central or northern areas of the Red River Valley because nearly all valley farms in the study are from the south. Also, there was a lack of farms in the northern portion of the west region. Lastly, the livestock farm type is dominated by the beef cow-calf enterprise.
There are some strong correlations between two or more classifications, so it is difficult to associate a financial measure with an individual farm characteristic. For example, the profitability of livestock, in comparison to crop farming, is reflected in farm categories that had a disproportionate number of livestock farms, such as the west region, farms with less than $250,000 sales, and farms with greater than 70% debt-to-asset. Also, comparison of farms by enterprise type, farm size and gross sales can be affected by regional performance. The Red River Valley has the highest proportion, relative to other regions, of crop farms, farms of less than 2,000 acres, and farms with gross income greater than $500,000.
Table 1 shows the 10-year trends in financial performance and farm characteristics. Table 2 lists the farm characteristics and percentage distribution for 2015 and the breakout of these characteristics by region of North Dakota. Tables 3 through 11 display the median and quartiles of 16 financial measures by farm characteristics. Figures 1 through 16 display relationships between selected farm characteristics and financial measures. A summary of highlights by farm characteristics is also presented.

TABLE 1. MEDIAN FARM SIZE, FARM OPERATOR AGE, AND FINANCIAL FACTORS OF FARMS PARTICIPATING IN THE NORTH DAKOTA FARM BUSINESS MANAGEMENT EDUCATION PROGRAM, 2006-2015.
2015 2014 2013 2012 2011 2010 2009 2008 2007 2006
Number of Farms 525 518 527 537 551 543 537 532 531 509
-------------------------------------------------------------------------------- Median-------------------------------------------------------------------------------
Age of Operator 48 48 48 47 48 47 47 47 47 46
Farm Size (acres) 1,847 1,847 1,865 1,932 1,968 2,010 1,995 2,001 2,000 1,966
Gross Cash Revenue 499,756 531,374 606,730 585,143 569,268 469,023 430,321 464,464 353,252 281,751
Total Farm Assets 1,482,932 1,614,430 1,497,426 1,463,890 1,171,781 1,124,263 1,019,147 995,609 810,426 688,802
Total Farm Liabilities 603,538 622,633 514,407 500,161 442,159 441,482 444,169 419,979 371,180 348,102
Current Ratio 1.3 1.6 1.9 2.3 2.0 1.9 1.4 1.8 1.7 1.2
Working Capital 61,285 117,283 139,950 256,110 157,751 151,933 72,683 128,854 103,063 20,660
Debt-to-Asset (%) 46.5 44.7 41.8 40.6 43.7 46.7 51.2 48.4 50.0 57.5
Rate of Return on Farm Assets (%) 0.4 2.8 4.7 16.2 10.5 14.9 4.0 10.6 15.7 4.7
Rate of Return on Farm Equity (%) -1.6 2.1 5.3 24.8 15.4 23.6 3.0 15.8 25.3 2.4
Operating Profit Margin (%) 1.3 8.8 13.6 32.4 24.0 29.8 9.7 20.8 29.3 12.2
Net Farm Income 18,982 54,543 90,629 238,054 144,414 174,010 47,547 114,520 127,791 35,980
Term Debt Coverage Ratio 0.69 1.08 1.50 4.64 2.86 3.7 1.2 2.7 3.3 1.2
Term Debt & Capital Repayment Margin ($) -16,382 3,556 25,849 185,291 90,286 119,428 6,360 67,276 86,825 5,378
Asset Turnover Ratio .30 .34 .35 .50 .45 .48 .40 .52 .56 .38
Operating Expense Ratio (%) 80.2 75.2 71.5 55.4 62.7 57.5 75.6 66.9 58.2 72.5
Depreciation Expense Ratio (%) 8.8 7.3 5.9 4.2 4.8 4.2 5.2 4.1 4.3 5.6
Interest Expense Ratio (%) 4.3 3.5 3.5 2.8 3.4 3.7 4.9 4.4 5.2 7.2
Net Farm Income Ratio (%) 5.1 12.5 17.9 36.8 27.5 33.1 13.4 24.2 30.6 14.2
3

4
FARM CLASSIFICATION AND HIGHLIGHTS
ALL FARMS
Highlights Over the past ten years, 2006-2015, median acreage of farms enrolled in the North Dakota Farm
Business Management Education Program has been relatively stable, but farms have become larger as measured by median gross revenue which has nearly doubled, and by median farm assets and liabilities, which increased 115% and 73%, to $1,482,932 and $603,538, respectively.
There was a significant decline in financial performance the past three years, 2013-2015, despite record wheat yields and beef prices, because of sharply lower grain prices. North Dakota corn prices declined one-half, soybeans by 40% and wheat by 44% over this three year period. Median net farm income dropped to $18,982 in 2015 compared to $54,543, $92,629 and $238,054 in 2014, 2013 and 2012, respectively. During the 2006 to 2015 period, nearly all financial measures were the strongest in 2012. In 2012, record crop prices more than offset an increase of costs and there were surprisingly strong yields because stored soil moisture from a wet 2011 sustained crops over the dry summer.
In 2011, below average yields and high costs were offset by high grain prices. Crop insurance indemnities were profitable on the nearly one-fourth of cropland prevented from planting because of strong prices used for insurance. In 2010, corn and sugar beets were record yields and barley, canola, and spring wheat were second highest in history. Grain prices increased to very high levels and costs were flat to down. Federal disaster payments for the 2008 crop year were paid in 2010.
In 2009, lower crop prices, high costs and low livestock profit resulted in sharply lower financial performance despite record yields for spring wheat, durum, barley, canola, and field peas. Financial performance in 2007 and 2008 was outstanding because of high crop prices. In 2006 there was a severe drought in the west and portions of central North Dakota.
Median current ratio dropped to 1.3 in 2015, the lowest since 1.2 in 2006. It was highest, 2.3, in 2012, 2.0 in 2011, 1.9 in 2013 and 2010, 1.8 in 2008, 1.7 in 2007 and 1.6 in 2014. Median debt-to-asset was 46.5% in 2015, 44.7% in 2014 and 41.8% in 2013 compared to 40.6% in 2012, and 43.7% in 2011. It was 51.2% in 2009, 48.4% in 2008, 50% in 2007, and 57.5% in 2006 which was the worst during the past 10 years.
In 2015, median rates of return on assets and equity were the lowest in the past ten years at 0.4% and -1.6%, respectively, compared to 16.2% and 24.8%, respectively, in 2012. ROE was less than ROA, which indicated that debt capital was not employed profitably, in 2005, 2006, 2009, 2014, and 2015.
The median term debt coverage ratio, 0.69, and term debt and capital repayment margin, -$16,382, of 2015 were ten-year lows, down from the highs in 2012, of 4.6 and $185,291, respectively.
Interest expense as a percent of gross revenue was 4.3% in 2015 compared to 3.5% in 2013 and 2014. It was 2.8% in 2012 after a general improvement since 2006 because of lower interest rates and stronger gross revenue.

5
Median net farm income as a percent of gross revenue was the lowest of the ten-year period, 5.1% in 2015 compared to the highest 36.8% in 2012. Also, the financial efficiency measures of asset turnover, operating expense as a percent of gross revenue, and depreciation expense as percent of gross revenue were the worst in ten years.
Table 2. Farm Classifications and Percent Distribution of Farm Types within Regions, North Dakota Farm Business Management Education Program, 2015.
Farm Group Category Breakout by Region
Farm Category Group Number of
Farms (525) Percentage Red River
Valley North
Central South
Central
West Region 113 179 154 79 Red River Valley 113 22 North Central 179 34 South Central 154 29 West 79 15 Farm Enterprise -----------------------percentage----------------------- Crop 368 70 96 75 63 34 Livestock 95 18 1 15 21 44 Mixed 62 12 3 10 16 22 Farm Sales $249,999 or less 122 23 14 26 24 28 $250,000 - $499,999 141 27 27 23 25 37 $500,000 - $999,999 163 31 35 35 27 24 $1,000,000 or more 99 19 24 15 23 11 Farm Size 1,999 acres or less 282 54 79 46 54 34 2,000 acres or more 243 46 21 54 46 66 Cropland Tenure Full tenant 137 26 29 26 28 24 1-20 percent owned 105 20 27 22 13 24 21-40 percent owned 110 21 25 22 24 11 41 percent or more owned 159 30 19 30 36 41 Farm Income $49,999 or less 352 67 58 70 70 67 $50,000 - $99,999 79 15 16 14 14 18 $100,000 - $199,999 49 9 16 7 8 6 $200,000 or more 45 9 11 8 7 9 Debt-to-asset Ratio 0 – 40 percent 223 42 50 39 45 34 41 – 70 percent 195 37 42 33 38 37 71 percent or more 107 20 7 28 17 29 Farmer Age 39 years or younger 196 37 32 39 34 48 40 – 49 years 85 16 15 19 16 13 50 years or older 244 46 53 42 51 39

6
Region
Farms are classified in one of four geographic regions in North Dakota, based on the location of their Farm Business Management program. However, farms enrolled in the Bismarck program are classified as "west or "south central" according to which side of the Missouri River the farm is located. Also, some farms that are enrolled in the Fargo and Wahpeton programs are not in the Red River Valley and are classified as south-central. The southern area of the "west" region is better represented than the northern area. The northern area of the Red River Valley has little representation. Locations of North Dakota Farm Business Management programs that participated in the 2015 summaries are:
Red River Valley: Wahpeton, Fargo, and Northwood North Central: Bottineau, Devils Lake, Langdon, Minot, and Rugby South Central: Bismarck, Carrington, Jamestown, and Oakes West: Bismarck, Dickinson, and Glen Ullin
Highlights
In 2015 the median farm size increased from the Red River Valley (1,280 acres, all crop land) to the west region (2,859 acres, including pasture). Median farm size was 2,136 acres (1,872 crop acres) in the north central region and 1,902 acres (1,351 crop acres) for the south central region. The average size was larger: the Red River Valley, north central, south central and west regions were, 1,435, 2,273, 2,769, and 3,159 acres per farm, respectively.
Several farm characteristics are strongly related to region. Red River Valley farms are more likely to be crop farms and typically have smaller total acreage (crop land and pasture) but larger total farm sales, assets, and liabilities than farms in other regions.
Typically the Red River Valley has the best financial performance, but not in 2013 or 2014 because profit of its dominant enterprises, soybeans, corn and sugarbeets suffered.
In 2015, the incidence of livestock and mixed enterprise farms ranged from only 4% in the Red River Valley to 66% in the west.
The median net farm income in 2012 was the highest in the decade for all regions and 2014 was the only year it was higher in the west than other regions. From 2012 to 2015 it decreased 92% to $32,675 in the Red River Valley, 94% to $12,166 in the north central region, 92% to $18,228 in the south central region, and 84% to $17,154 in the west.
In 2006, the west region had the lowest median net farm income, $689, of any region over the past 10 years. The west had drought in 2006 and 2008 and livestock profit was low in 2006-2009.
In 2015 the median current ratio was 1.5 in the Red River Valley, 1.3 in the south central and west regions and 1.2 in the north central region. The five year average, 2010-2014, median current ratio by region ranged from 1.7 in the west region to 2.4 in the Red River Valley.
In 2012, median debt-to-asset for all regions were the best over the 2006 to 2015 period, ranging from 34.9% in the Red River Valley to 50.5% in the west. In 2015 it was 39.7% in the Red River Valley, 44.0% in the south central region, 50.9% in the north central region, and 58.6% in the west.
In 2015, the median term debt coverage ratio decreased in all regions except the Red River Valley, at 0.92. It was 0.73 in the south central, 0.69 in the west and 0.55 in the north central region.

7
The only year in which all regions had median operating expense (all expenses except depreciation and interest) as a percent of gross revenue greater than 75% was 2015, ranging from 76.4% in the west to 81% in the central regions. The only years any regions achieved less than 60% in the past 10 years were in 2012, 2010 and 2007.
Farm Enterprise
Farms were classified as “crop” if 70% or more of total sales were from crops, and “livestock” if livestock sales accounted for 70% or more of total sales. The remaining farms were classified as “mixed”. The “livestock” farm type is dominated by the beef cow-calf enterprise. Highlights
From 2007 to 2015, about 70 to 75% of all farms were classified as crop, compared to about 64% from 2002 to 2006.
In 2015, 66% of farms were classified as livestock or mixed enterprise in the west region compared to 4% in the Red River Valley, 25% in the north central and 37% in the south central regions.
The best performance, by farm type, for nearly every financial measure over the 2006-2015 period was achieved by crop farms in 2012. Livestock farms had their best financial performance relative to other farm types in 2014.
Every year, 2006-2015, crop farms were larger than livestock and mixed enterprise farms in median total assets, total liabilities, and gross income. The only year in which median net farm income of both livestock and mixed enterprise farms exceeded that of crop farms was 2014. In 2015, median net farm income decreased 80% to $18,999 for livestock farms, 36% to $20,748 for crop farms and 84% to $10,057 for mixed enterprise farms.
In 2015, the only farm type with a positive median rate of return on equity was livestock farms at 1.0%. It was historically high for livestock farms, 22.8% in 2014.
In 2014, the median asset turnover ratio was 0.34 for all farm types. However, typically it is higher for crop farms. In 2015 it was 0.34 for crop farms, 0.27 for mixed enterprise farms, and 0.22 for livestock farms (predominantly beef cow-calf farms).
In 2015, crop farms had a median term debt coverage ratio of 0.65, compared to 5.60 in 2012. It was 1.09 for livestock farms, and 0.48 for mixed enterprise farms. The five year average, 2010-2014, was 2.95 for crop farms, 2.45 for livestock farms, and 2.15 for mixed enterprise farms.
In 2015, median interest expense as a percent of gross revenue was 3.8% for crop farms, 5.8% for livestock farms and 5.9% for mixed enterprise farms. Each farm type had its best measure in 2012. Typically, 2006-2015, crop farms had a lower interest expense ratio than other farm types.
Over the past ten years, the best performance in converting gross income into net income was 39.5% by crop farms in 2012 and 38.4% by livestock farms in 2014. Crop farms had their ten year low, 4.7% in 2015 compared to 15.5% for livestock farms.

8
9
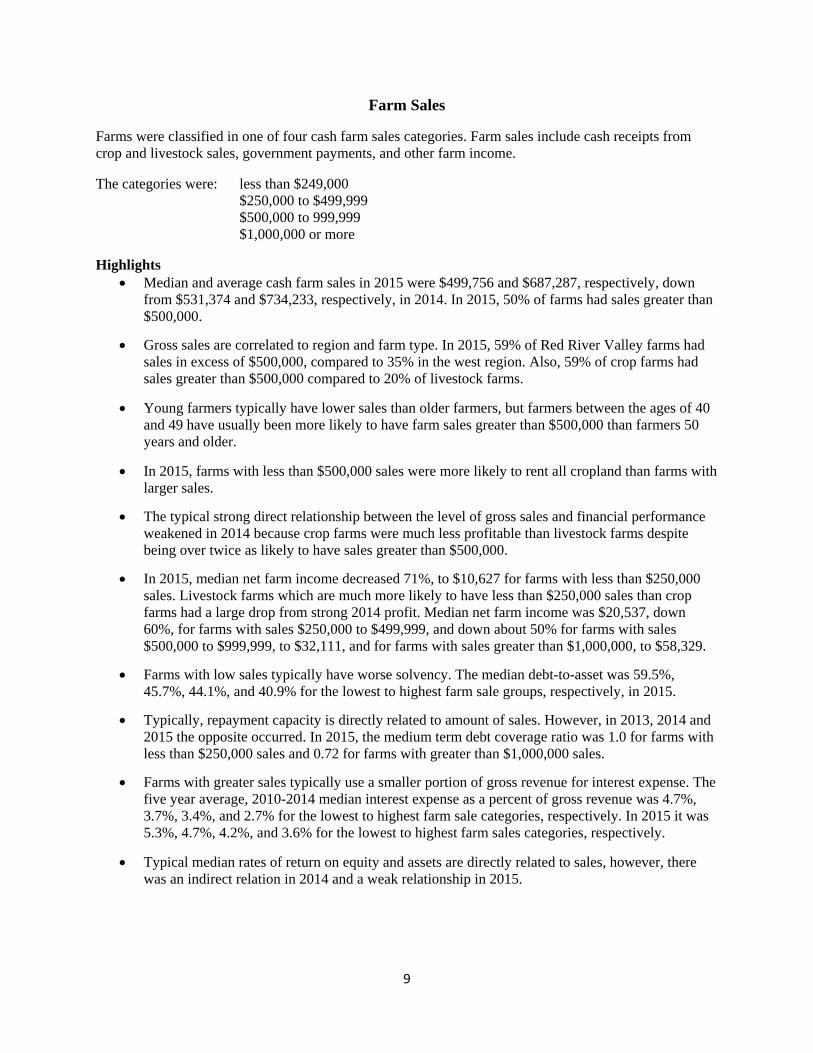
Farm Sales
Farms were classified in one of four cash farm sales categories. Farm sales include cash receipts from crop and livestock sales, government payments, and other farm income. The categories were: less than $249,000
$250,000 to $499,999 $500,000 to 999,999 $1,000,000 or more
Highlights
Median and average cash farm sales in 2015 were $499,756 and $687,287, respectively, down from $531,374 and $734,233, respectively, in 2014. In 2015, 50% of farms had sales greater than $500,000.
Gross sales are correlated to region and farm type. In 2015, 59% of Red River Valley farms had sales in excess of $500,000, compared to 35% in the west region. Also, 59% of crop farms had sales greater than $500,000 compared to 20% of livestock farms.
Young farmers typically have lower sales than older farmers, but farmers between the ages of 40 and 49 have usually been more likely to have farm sales greater than $500,000 than farmers 50 years and older.
In 2015, farms with less than $500,000 sales were more likely to rent all cropland than farms with larger sales.
The typical strong direct relationship between the level of gross sales and financial performance weakened in 2014 because crop farms were much less profitable than livestock farms despite being over twice as likely to have sales greater than $500,000.
In 2015, median net farm income decreased 71%, to $10,627 for farms with less than $250,000 sales. Livestock farms which are much more likely to have less than $250,000 sales than crop farms had a large drop from strong 2014 profit. Median net farm income was $20,537, down 60%, for farms with sales $250,000 to $499,999, and down about 50% for farms with sales $500,000 to $999,999, to $32,111, and for farms with sales greater than $1,000,000, to $58,329.
Farms with low sales typically have worse solvency. The median debt-to-asset was 59.5%, 45.7%, 44.1%, and 40.9% for the lowest to highest farm sale groups, respectively, in 2015.
Typically, repayment capacity is directly related to amount of sales. However, in 2013, 2014 and 2015 the opposite occurred. In 2015, the medium term debt coverage ratio was 1.0 for farms with less than $250,000 sales and 0.72 for farms with greater than $1,000,000 sales.
Farms with greater sales typically use a smaller portion of gross revenue for interest expense. The five year average, 2010-2014 median interest expense as a percent of gross revenue was 4.7%, 3.7%, 3.4%, and 2.7% for the lowest to highest farm sale categories, respectively. In 2015 it was 5.3%, 4.7%, 4.2%, and 3.6% for the lowest to highest farm sales categories, respectively.
Typical median rates of return on equity and assets are directly related to sales, however, there was an indirect relation in 2014 and a weak relationship in 2015.

10

11
Farm Size
Both crop and pasture acres were included in determining farm size. Farm size categories were: 1,999 acres or less
2,000 acres or more
Highlights Because of little pasture land and more productive and expensive crop land, only about one-fifth
of the Red River Valley farms were larger than 2,000 acres, compared to two-thirds of west region farms and about one-half of farms in the central regions.
From 2006 to 2015, mixed enterprise farms have typically been more likely to be larger than 2,000 acres than were crop or livestock farms. In 2015, 61% of mixed enterprise farms were larger than 2,000 acres compared to 46% of crop farms and 39% of livestock farms.
In 2006 through 2015, less than one-third of farmers under 40 years old operated more than 2,000 acres compared to about 60% of farmers between 40 and 49 years old and over one-half of farmers 50 years or older.
As expected, farms with greater than 2,000 acres have greater assets, liabilities, sales and profitability than smaller farms. Larger farms also have better solvency. In 2015, median debt-to-asset was 50.2% for farms less than 2,000 acres and 45.6% for larger sized farms.
In 2015, median net farm income decreased 58%, to $17,246 for farms with less than 2,000 acres and 67%, to $31,278 for farms with more than 2,000 acres. Historically, farms with more than 2,000 acres have over twice the net farm income of the small farm group. The five-year average, 2010-2014, median net farm income was $93,449 for farms less than 2,000 acres and $226,307 for farms with greater than 2,000 acres.
Median current ratio in 2015 was 1.4 for farms with less than 2,000 acres and 1.3 for larger farms. The five year average, 2010-2014, median current ratio was 2.0 for farms with less than 2000 acres and 1.9 for farms larger than 2000 acres.
From 2006 to 2015, median term debt coverage ratio was better for farms with less than 2,000 acres than for larger farms in only three years: 2012, 2013, and 2015.
In 2015, median operating expense (excluding depreciation and interest) as a percent of gross revenue was 79.2% for farms with less than 2,000 acres and 81.6% for farms with greater than 2,000 acres. Financial efficiency measures of farm size groups are typically similar. This indicates that greater profitability of farms larger than 2,000 acres is due to larger sales volume and/or greater operator-labor efficiencies, not lower operating expenses per dollar of sales.

12
Cropland Tenure
This is a classification of the portion of crop land that is rented. Four categories were used.
Full tenant 1-20 percent owned 21-40 percent owned 41 percent or over owned
Highlights
Substantial ownership of crop land is less likely in the Red River Valley. About one out of five Red River Valley farms owned more than 40% of the crop land they operated, compared to one-third of farms in other regions.
Crop land ownership increases with age. Farmers 50 years or older were over three times more likely to own more than 40% of their crop land than young farmers. Four of ten young farmers rented all of their crop land, compared to one of ten farmers 50 years or older.
Operators of livestock and mixed enterprise farms own a greater portion of their crop land than crop farms. Nearly one-half of livestock and mixed enterprise farms owned more than 40% of the crop land that they operate, compared to one-fourth of crop farms.
In 2015, small farms (less than 2,000 acres) were much more likely than large farms (more than 2,000 acres) to own no crop land. However, both farm size groups were as likely to own over 40% of their crop land. Large farms were twice as likely to own between 1 and 40% of crop land as smaller farms.
Typically, farms that own some land, but less than 40%, are the most profitable, and are more likely to be crop farms, farm more acreage, and have larger sales.
Farms with greater than 40% crop land ownership are typically lower profit than farms with 1 to 40% crop land ownership probably because these farms are more likely to be in the livestock and low sales farm categories and are less likely to be in the Red River Valley Region. However, in 2014 profit was high for livestock farms and low for crop and Red River Valley farms.
Last year, 2015, was the only year in the 2006-2015 period when farms that rented all cropland had greater median net farm income, $20,739, than farms that owned more than 40% of cropland, $10,847.
In the past ten years farms that owned greater than 40% of their crop land typically have a slightly higher current ratio. In 2015, farms with greater than 40% crop land ownership had a median current ratio of 1.4 compared to 1.2 to 1.3 for the other tenure groups.
Farms with greater crop land ownership typically have better solvency. In 2015, median debt-to-asset ratio was 56.2% for farms with no crop land ownership, 46.2% for farms with 1-20% crop land ownership, 44.0% for farms with 21-40% crop land ownership, and 41.3% for farms with crop land ownership greater than 40%. One reason could be that older, more established farmers own a greater portion of their crop land.
Farms with a smaller proportion of crop land ownership have fewer land assets and land interest costs and therefore have substantially higher asset turnover ratios and lower interest expense as a percent of gross revenue.

13

14
Net Farm Income
Four levels of net farm income were used to group farms.
$49,999 or less $50,000 - $99,999 $100,000 - $199,999 $200,000 or more
Highlights
Farm profit is volatile. Year-to-year changes in median net farm income within regions and farm types averaged over 80% the past 10 years, except for mixed enterprise farms which averaged 68%. The largest change occurred in 2010. Statewide, median net farm income decreased 65% in 2015, 40% in 2014, and 62% in 2013. It increased 65% in 2012, decreased 17% in 2011, increased 266% in 2010, and decreased 58% in 2009 and 10% in 2008, after increasing 255% in 2007.
Median net farm income was $18,982 in 2015 down from $54,543 in 2014, and $90,529 in 2013. The five highest median net farm income years in the 2006-2015 period were $238,054 in 2012, $174,010 in 2010, $144,414 in 2011, $127,791 in 2007, and $114,520 in 2008. It was $47,547 in 2009 and $35,980 in 2006.
The Red River Valley had the highest median net farm income six out of ten years from 2006 to 2015 and the north central region was the highest in three years. The west region farms had the lowest median net farm income seven of the ten years, but the highest in 2014.
Typically, crop farms have been more profitable than livestock farms. An exception was 2014. In 2015 and 2014, median net farm income was $18,999 and $95,130 for livestock farms and $20,748 and $32,347 for crop farms, respectively. The five year average, 2010-2014, median net farm income was $177,604 for crop farms and $57,075 for livestock farms.
As expected, net farm income is strongly associated with farm sales and farm size. In 2015, 16% of farms with sales greater than $500,000 had net farm income greater than $200,000, compared to 2% of farms with less than $500,000 sales. Farms larger than 2,000 acres were over five times more likely to have net farm income greater than $200,000 than were smaller farms.
In all but five years from 2006 to 2015, farmers 40 to 49 years old had higher median net farm income than farmers that were younger or older. The exceptions were older farmers in 2006, 2009, 2011, and 2013, and younger farmers in 2015.
Solvency, liquidity, repayment capacity, and financial efficiency were strongly correlated with net farm income.
Low-debt farms (less than 40% debt-to-asset) are typically three to four times more likely to have net farm income in excess of $100,000 than high-debt farms (greater than 70% debt).

15
Debt-to-asset Ratio
Three ranges of debt-to-asset ratio were used to group farms.
0 - 40 percent 41 - 70 percent 71 percent or more
Highlights The median debt-to-asset of all farms increased from 53.3% to 57.5% between the years 2002 to
2006 and then generally improved until 2012, to 40.6%. It has increased each year since 2012 and was 46.5% in 2015.
The median debt-to-asset of farms in the north central region was the best in 2013 and 2007 through 2009 compared to other regions. However, the Red River Valley had the best solvency in all other years during the 2006-2015 period.
Crop farms had the best solvency (lowest debt-to-asset) among farm types during the past ten years, 2006-2015.
Large farms (greater than 2,000 acres) and farms with sales greater than $500,000 always had lower median debt-to-asset than other farm size and farm sales groups, respectively, during the 2006-2015 period.
There is a strong inverse relationship between level of debt and liquidity, repayment capacity, profitability and financial efficiency measures. As debt-to-asset increases, these measures deteriorate.
In 2015, farms in the low, medium and high debt-to-asset categories had median current ratios of 2.9, 1.2 and 0.8; term debt coverage ratios of 0.98, 0.73, and 0.00; interest expense as a percent of gross revenue of 2.3, 5.7, and 7.7; and net farm income as percent of gross revenue of 6.9, 6.3, and -6.1, respectively.
In 2015, farms with sales less than $250,000 were three times more likely to be in the high debt group than farms with sales greater than $1,000,000.
As expected, percent debt-to-asset tended to decrease as age of farmer increased. In 2015, median debt-to-asset was 60.8% for farmers younger than 40 years, 51.7% for farmers 40-49 years and 36.2% for farmers 50 years or older.
In 2015, median net farm income decreased to $27,883 for the low debt-to-asset category, and to $22,400 and -$11,381 for the medium and high debt-to-asset categories, respectively.
In 2015, 10% of farms with low debt had net farm income greater than $200,000, compared to 4% of high-debt farms.

16
Farmer Age
Three groups were used to classify farms by age of operator:
39 years or less 40 - 49 years 50 years or older
Highlights
In 2015, 37% of farm operators were under 40 years old, 16% were 40 to 49 years old, and 46% were 50 and older.
The age distribution of farm operators has been similar across regions during the 2006-2013 period. In 2014 and 2015, farmers in the west were slightly more likely to be younger than 40 years old than in other regions.
Farms in the middle age group typically have more liabilities, higher gross sales, larger farms and been more profitable than the younger or older age groups. However, median net farm income was highest for farmers older than 50 years in 2006, 2009, 2011, and 2013, and for farmers less than 40 years old in 2015.
For each age group, the years 2012, 2011, 2010, 2008 and 2007 had much higher median net farm income than other years during the 2006-2015 period. In 2015 median net farm income was the highest, $22,357, for farmers under 40 years old, and the lowest, $7,587, for farmers 40-49 years old. It was $15,386 for farmers 50 years and older.
Median total assets are lowest for farm operators less than 40 years old. Median total assets of farmers between 40 and 49 years old and the older age group of farmers (50 years and older) were similar in 2006-2010, but greater for older farmers since 2010.
As expected, there is a higher percent of crop land owned, and the percent of farm debt tends to decrease as the age of the farm operator increases. In 2015, median debt-to-asset was 60.8% for farmers less than 40 years old, 51.7% for farmers in the 40 to 49 age group and 36.2% for farmers 50 or older.
From 2007 through 2015, median current ratio improved with farmer age. However, prior to 2007 there was not a clear relationship between median current ratio and age groups.
The only years in the 2006-2015 period that farmers older than 50 years had term debt coverage ratio less than 1.0, and a ratio which was lower than the other age groups were in 2014, at 0.86, and in 2015, at 0.59.
In each year, 2006-2015, the young age group of farmers employed assets more efficiently than farmers 50 and older. The young group had much fewer total assets and higher debt-to-asset, but achieved better median rates of return on assets and equity, and asset turnover.

17

Table 3. Current Assets and Current Liabilities, Quartile Values for 2015, Median Values for 2014, and 5-Year Average, 2010-2014, of Median Values, North Dakota Farm Business Management Education Program Participants.
Farm Group
2015
2014 Median
Average of 2010-2014
Medians
2015
2014 Median
Average of 2010-2014
Medians Upper
Quartile Lower
Quartile
Median Upper
Quartile Lower
Quartile
Median
Current Farm Assets ($) Current Farm Liabilities ($) All Farms 712,447 181,045 387,912 418,171 421,618 74,946 508,831 234,343 249,002 182,395 Region Red River Valley 828,456 252,875 490,402 466,686 537,644 73,231 542,183 264,966 249,501 209,624 North Central 637,987 171,305 358,395 418,126 402,299 72,049 476,291 245,267 259,925 177,669 South Central 721,454 182,808 410,982 398,438 409,964 80,635 585,852 221,385 202,933 176,549 West 620,202 147,979 295,166 435,898 361,602 88,150 384,286 169,848 238,580 171,657 Farm Enterprise Crop 797,136 240,946 459,408 481,164 512,245 97,483 558,059 286,875 308,022 227,598 Livestock 373,458 76,686 178,506 233,715 155,845 28,318 186,677 86,677 72,653 63,299 Mixed 524,385 237,100 366,844 391,099 299,245 122,965 393,723 268,267 222,699 169,847 Farm Sales $249,999 or less 165,736 32,122 80,593 121,211 103,941 23,166 107,136 51,494 55,739 46,816 $250,000-$499,999 409,011 196,800 311,930 300,593 287,715 89,288 299,769 174,050 162,508 138,270 $500,000-$999,999 719,169 403,691 543,621 563,354 545,567 200,593 562,661 376,436 370,282 256,482 $1,000,000 or more 1,751,894 879,146 1,167,804 1,197,413 1,162,269 470,018 1,163,313 710,125 679,158 495,563 Farm Size 1,999 acres or less 418,434 88,796 236,986 251,883 243,811 36,977 267,085 120,169 120,334 96,109 2,000 acres or more 1,075,001 395,940 638,476 728,495 711,618 229,465 697,211 454,701 443,553 328,943 Cropland Tenure Full tenant 457,046 72,490 227,437 236,304 232,535 32,466 291,731 139,413 120,792 90,696 1-20 percent owned 996,313 334,890 567,452 554,641 624,755 238,390 657,370 398,539 371,783 289,900 21-40 percent owned 890,493 309,452 520,485 556,451 548,213 171,839 662,568 388,696 379,757 263,729 41 percent or more owned 620,240 174,901 379,571 437,199 401,092 75,070 372,564 170,017 175,819 143,454 Net Farm Income $49,999 or less 548,608 132,992 294,612 328,528 164,079 60,849 456,332 200,473 281,787 109,092 $50,000-$99,999 672,183 279,453 414,377 305,661 221,108 97,460 421,737 240,087 139,107 106,109 $100,000-$199,999 900,331 404,668 618,970 512,572 395,267 111,310 637,504 280,337 225,197 175,532 $200,000 or more 1,566,846 712,447 1,034,005 898,704 860,678 309,725 846,560 558,698 399,600 310,037 Debt-to-Asset Ratio 0-40 percent 890,494 273,463 503,617 557,814 581,507 43,699 372,734 136,234 146,181 128,987 41-70 percent 711,954 177,264 368,213 374,571 377,731 131,265 640,095 303,087 349,868 261,294 71 percent or more 432,838 94,103 237,629 241,803 188,398 114,310 552,554 291,731 312,171 200,050 Farmer Age 39 years or younger 400,457 82,231 220,496 241,680 217,679 50,665 308,369 133,753 135,535 105,112 40-49 years 726,258 315,413 479,845 531,872 521,065 153,751 596,073 397,503 357,501 262,064 50 years or older 965,991 289,377 527,113 556,968 557,539 112,683 587,305 295,756 306,993 223,189
18
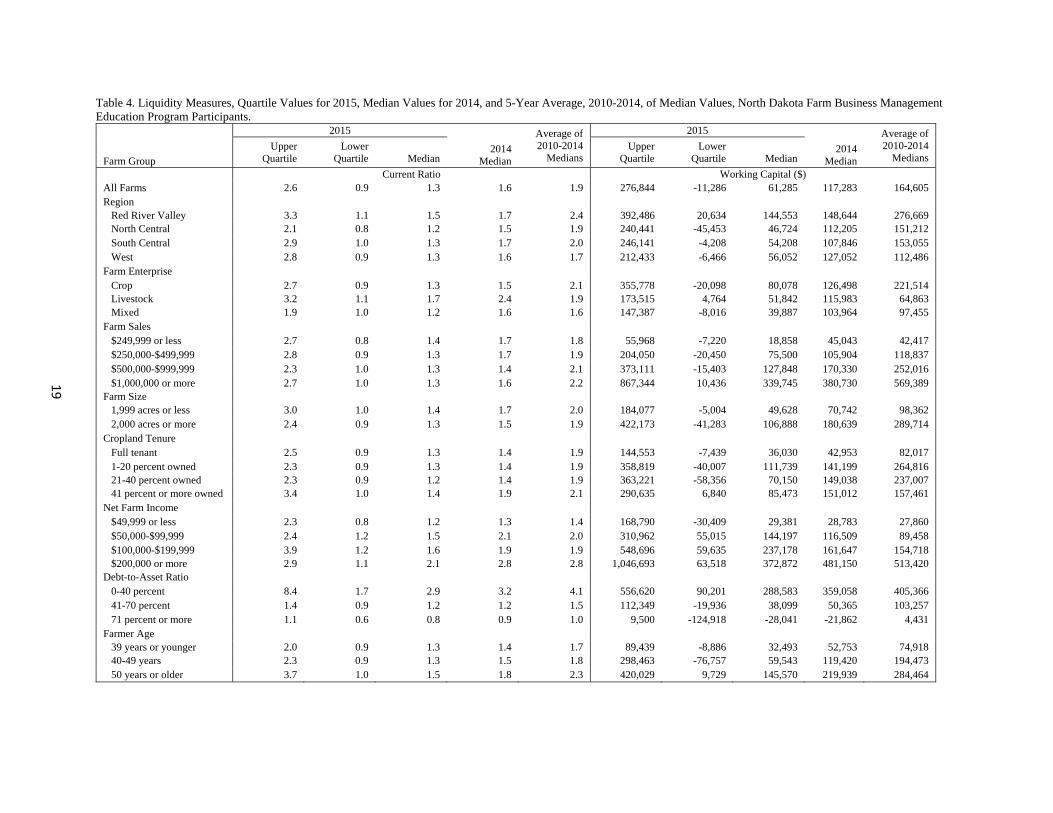
Table 4. Liquidity Measures, Quartile Values for 2015, Median Values for 2014, and 5-Year Average, 2010-2014, of Median Values, North Dakota Farm Business Management Education Program Participants.
Farm Group
2015
2014 Median
Average of 2010-2014
Medians
2015
2014 Median
Average of 2010-2014
Medians Upper
Quartile Lower
Quartile
Median Upper
Quartile Lower
Quartile
Median
Current Ratio Working Capital ($) All Farms 2.6 0.9 1.3 1.6 1.9 276,844 -11,286 61,285 117,283 164,605 Region Red River Valley 3.3 1.1 1.5 1.7 2.4 392,486 20,634 144,553 148,644 276,669 North Central 2.1 0.8 1.2 1.5 1.9 240,441 -45,453 46,724 112,205 151,212 South Central 2.9 1.0 1.3 1.7 2.0 246,141 -4,208 54,208 107,846 153,055 West 2.8 0.9 1.3 1.6 1.7 212,433 -6,466 56,052 127,052 112,486 Farm Enterprise Crop 2.7 0.9 1.3 1.5 2.1 355,778 -20,098 80,078 126,498 221,514 Livestock 3.2 1.1 1.7 2.4 1.9 173,515 4,764 51,842 115,983 64,863 Mixed 1.9 1.0 1.2 1.6 1.6 147,387 -8,016 39,887 103,964 97,455 Farm Sales $249,999 or less 2.7 0.8 1.4 1.7 1.8 55,968 -7,220 18,858 45,043 42,417 $250,000-$499,999 2.8 0.9 1.3 1.7 1.9 204,050 -20,450 75,500 105,904 118,837 $500,000-$999,999 2.3 1.0 1.3 1.4 2.1 373,111 -15,403 127,848 170,330 252,016 $1,000,000 or more 2.7 1.0 1.3 1.6 2.2 867,344 10,436 339,745 380,730 569,389 Farm Size 1,999 acres or less 3.0 1.0 1.4 1.7 2.0 184,077 -5,004 49,628 70,742 98,362 2,000 acres or more 2.4 0.9 1.3 1.5 1.9 422,173 -41,283 106,888 180,639 289,714 Cropland Tenure Full tenant 2.5 0.9 1.3 1.4 1.9 144,553 -7,439 36,030 42,953 82,017 1-20 percent owned 2.3 0.9 1.3 1.4 1.9 358,819 -40,007 111,739 141,199 264,816 21-40 percent owned 2.3 0.9 1.2 1.4 1.9 363,221 -58,356 70,150 149,038 237,007 41 percent or more owned 3.4 1.0 1.4 1.9 2.1 290,635 6,840 85,473 151,012 157,461 Net Farm Income $49,999 or less 2.3 0.8 1.2 1.3 1.4 168,790 -30,409 29,381 28,783 27,860 $50,000-$99,999 2.4 1.2 1.5 2.1 2.0 310,962 55,015 144,197 116,509 89,458 $100,000-$199,999 3.9 1.2 1.6 1.9 1.9 548,696 59,635 237,178 161,647 154,718 $200,000 or more 2.9 1.1 2.1 2.8 2.8 1,046,693 63,518 372,872 481,150 513,420 Debt-to-Asset Ratio 0-40 percent 8.4 1.7 2.9 3.2 4.1 556,620 90,201 288,583 359,058 405,366 41-70 percent 1.4 0.9 1.2 1.2 1.5 112,349 -19,936 38,099 50,365 103,257 71 percent or more 1.1 0.6 0.8 0.9 1.0 9,500 -124,918 -28,041 -21,862 4,431 Farmer Age 39 years or younger 2.0 0.9 1.3 1.4 1.7 89,439 -8,886 32,493 52,753 74,918 40-49 years 2.3 0.9 1.3 1.5 1.8 298,463 -76,757 59,543 119,420 194,473 50 years or older 3.7 1.0 1.5 1.8 2.3 420,029 9,729 145,570 219,939 284,464
19

Table 5. Total Assets and Total Liabilities, Quartile Values for 2015, Median Values for 2014, and 5-year Average, 2010-2014, of Median Values, North Dakota Farm Business Management Education Program Participants.
Farm Group
2015
2014 Median
Average of 2010-2014
Medians
2015
2014 Median
Average of 2010-2014
Medians Upper
Quartile Lower
Quartile
Median Upper
Quartile Lower
Quartile
Median Total Farm Assets ($) Total Farm Liabilities ($)
All Farms 2,766,657 703,989 1,482,932 1,614,430 1,374,358 248,428 1,138,620 603,538 622,633 504,168 Region Red River Valley 3,402,047 904,064 1,878,818 1,808,948 1,657,962 238,743 1,209,139 671,477 653,505 614,271 North Central 2,369,686 666,910 1,391,138 1,616,725 1,308,681 235,763 1,058,957 594,845 604,817 470,241 South Central 3,089,865 804,420 1,716,992 1,652,804 1,427,068 237,582 1,233,526 622,775 573,073 483,304 West 2,113,181 605,009 1,034,238 1,439,926 1,135,830 289,651 1,028,755 504,142 588,732 518,794 Farm Enterprise Crop 3,050,134 893,368 1,837,635 1,934,268 1,661,426 263,957 1,243,010 677,553 679,747 579,304 Livestock 1,494,280 384,725 734,991 824,237 649,418 156,713 612,287 298,592 353,828 316,345 Mixed 2,059,571 964,710 1,405,653 1,418,200 1,134,030 299,659 1,005,041 675,892 593,009 452,969 Farm Sales $249,999 or less 627,387 162,408 401,040 458,727 449,835 64,234 368,407 220,674 206,348 196,088 $250,000-$499,999 1,451,486 759,082 1,111,922 1,051,257 926,197 251,674 696,043 470,545 475,501 404,708 $500,000-$999,999 2,775,825 1,582,159 2,130,177 2,168,539 1,771,837 465,921 1,265,221 892,377 838,634 632,031 $1,000,000 or more 5,978,643 3,427,330 4,351,455 4,361,448 3,509,751 981,117 2,405,105 1,502,225 1,517,736 1,178,827 Farm Size 1,999 acres or less 1,609,307 418,671 847,034 984,693 789,938 131,783 699,389 321,777 357,205 319,228 2,000 acres or more 3,868,338 1,519,669 2,449,411 2,605,436 2,244,154 550,609 1,505,618 1,001,815 1,006,584 813,996 Cropland Tenure Full tenant 1,321,307 245,442 613,796 691,158 594,660 102,475 670,409 269,078 269,061 251,305 1-20 percent owned 3,053,300 1,156,218 1,919,352 1,940,680 1,769,001 482,878 1,381,427 848,319 762,821 690,273 21-40 percent owned 3,547,004 1,310,839 2,066,771 2,097,986 1,858,719 529,904 1,386,172 890,226 849,859 714,892 41 percent or more owned 2,790,154 910,653 1,823,540 1,818,359 1,524,787 267,494 1,093,970 570,473 593,656 481,933 Net Farm Income $49,999 or less 2,252,229 579,515 1,199,080 1,339,171 706,187 220,989 1,013,457 514,084 628,053 352,749 $50,000-$99,999 2,699,309 868,397 1,666,410 1,116,303 820,163 304,059 1,052,600 539,342 436,002 368,593 $100,000-$199,999 3,885,300 1,324,468 2,233,882 1,833,379 1,274,284 285,126 1,362,402 757,370 662,903 478,941 $200,000 or more 5,107,754 2,394,232 3,402,047 3,253,610 2,732,541 838,227 1,671,735 1,203,734 849,859 796,609 Debt-to-Asset Ratio 0-40 percent 3,409,519 1,065,322 1,967,013 2,080,400 1,848,692 132,395 773,783 360,398 385,558 345,659 41-70 percent 2,641,351 633,842 1,374,989 1,456,786 1,258,487 376,523 1,375,494 762,730 769,036 664,157 71 percent or more 1,664,477 512,553 937,103 1,027,618 736,293 442,319 1,421,159 757,405 843,724 622,152 Farmer Age 39 years or younger 1,439,600 326,980 744,064 787,159 693,407 181,542 785,167 433,354 472,594 389,410 40-49 years 2,673,671 1,172,448 1,756,675 1,819,690 1,606,600 408,627 1,352,697 892,407 777,420 668,176 50 years or older 3,575,908 1,247,985 2,237,987 2,221,479 1,914,542 267,105 1,244,390 671,423 649,845 543,412
20

Table 6. Solvency Measures, Quartile Values for 2015, Median Values for 2014, and 5-year Average, 2010-2014, of Median Values, North Dakota Farm Business Management Education Program Participants.
Farm Group
2015
2014Median
Average of2010-2014
Medians
2015
2014 Median
Average of2010-2014
Medians
2015
2014Median
Average of
Upper Quartile
Lower Quartile Median
Upper Quartile
Lower Quartile Median
Upper Quartile
Lower Quartile Median
2010-2014Medians
Debt-to-Asset (%) Equity-to-Asset (%) Debt-to-Equity All Farms 27.1 66.5 46.5 44.7 43.5 72.9 33.5 53.5 55.3 56.5 0.4 2.0 0.9 0.8 0.8Region Red River Valley 18.6 55.3 39.7 40.0 39.1 81.4 44.7 60.3 60.0 60.9 0.2 1.2 0.7 0.7 0.6 North Central 28.6 72.7 50.9 44.3 40.8 71.4 27.3 49.1 55.7 59.2 0.4 2.7 1.0 0.8 0.7 South Central 23.7 62.9 44.0 43.6 43.4 76.3 37.1 56.0 56.4 56.6 0.3 1.7 0.8 0.8 0.8 West 33.2 72.8 58.6 54.5 54.1 66.8 27.2 41.4 45.5 45.9 0.5 2.7 1.4 1.2 1.2Farm Enterprise Crop 23.8 64.3 45.2 43.6 40.1 76.2 35.7 54.8 56.4 59.9 0.3 1.8 0.8 0.8 0.7 Livestock 36.8 71.4 55.9 50.5 54.4 63.2 28.6 44.1 49.5 45.6 0.6 2.5 1.3 1.0 1.2 Mixed 36.1 69.4 46.2 44.3 48.4 63.9 30.6 53.8 55.7 51.6 0.6 2.3 0.9 0.8 0.9Farm Sales $249,999 or less 39.1 75.2 59.5 51.3 52.7 60.9 24.8 40.5 48.7 47.3 0.6 3.0 1.5 1.1 1.1 $250,000-$499,999 22.1 67.7 45.7 44.4 46.7 77.9 32.3 54.3 55.6 53.3 0.3 2.1 0.8 0.8 0.9 $500,000-$999,999 24.2 63.3 44.1 43.2 39.7 75.8 36.7 55.9 56.8 60.3 0.3 1.7 0.8 0.8 0.7 $1,000,000 or more 24.4 56.2 40.9 40.4 36.9 75.6 43.8 59.1 59.6 63.1 0.3 1.3 0.7 0.7 0.6Farm Size 1,999 acres or less 27.5 68.7 50.2 46.1 45.8 72.5 31.3 49.8 53.9 54.0 0.4 2.2 1.0 0.9 0.8 2,000 acres or more 27.1 63.5 45.6 43.6 41.3 72.9 36.5 54.4 56.4 58.7 0.4 1.7 0.8 0.8 0.7Cropland Tenure Full tenant 34.7 71.8 56.2 51.6 48.5 65.3 28.2 43.8 48.4 51.5 0.5 2.5 1.3 1.1 0.9 1-20 percent owned 27.1 65.2 46.2 44.9 41.6 72.9 34.8 53.8 55.1 58.4 0.4 1.9 0.9 0.8 0.7 21-40 percent owned 28.4 60.6 44.0 43.6 42.5 71.6 39.4 56.0 56.4 57.5 0.4 1.5 0.8 0.8 0.7 41 percent or more owned 19.3 63.7 41.3 39.1 40.3 80.7 36.3 58.7 60.9 59.7 0.2 1.8 0.7 0.6 0.7Net Farm Income $49,999 or less 30.1 71.9 51.1 49.5 57.6 69.9 28.1 48.9 50.5 42.4 0.4 2.6 1.0 1.0 1.4 $50,000-$99,999 24.4 57.6 42.9 43.6 50.6 75.6 42.4 57.1 56.4 49.4 0.3 1.4 0.8 0.8 1.0 $100,000-$199,999 17.4 54.7 43.3 43.2 44.6 82.6 45.3 56.7 56.8 55.4 0.2 1.2 0.8 0.8 0.8 $200,000 or more 24.8 57.6 37.0 27.8 31.6 75.2 42.4 63.0 72.2 68.4 0.3 1.4 0.6 0.4 0.5Debt-to-Asset Ratio 0-40 percent 11.1 33.3 21.8 22.6 22.9 88.9 66.7 78.2 77.4 77.1 0.1 0.5 0.3 0.3 0.3 41-70 percent 47.9 62.7 55.3 53.2 52.9 52.1 37.3 44.7 46.8 47.1 0.9 1.7 1.2 1.1 1.1 71 percent or more 75.5 93.5 81.4 79.7 80.1 24.5 6.5 18.6 20.3 19.9 3.1 14.4 4.4 3.9 4.0Farmer Age 39 years or younger 41.0 75.0 60.8 57.9 55.7 59.0 25.0 39.2 42.1 44.3 0.7 3.0 1.6 1.4 1.3 40-49 years 27.1 67.7 51.7 43.2 44.2 72.9 32.3 48.3 56.8 55.8 0.4 2.1 1.1 0.8 0.8 50 years or older 17.2 52.7 36.2 34.8 33.6 82.8 47.3 63.8 65.2 66.4 0.2 1.1 0.6 0.5 0.5
21

Table 7. Rate of Return on Assets and Rate of Return on Equity Profitability Measures, Quartile Values for 2015, Median Values for 2014, and 5-year Average, 2010-2014, of Median Values, North Dakota Farm Business Management Education Program Participants.
2015
2014 Median
Average of 2010-2014
Medians
2015
2014 Median
Average of 2010-2014
Medians
Farm Group
Upper Quartile
Lower Quartile
Median
Upper Quartile
Lower Quartile
Median
Return on Farm Assets (%) Return on Farm Equity (%)
All Farms 3.8 3.0 0.4 2.8 9.8 4.0 -9.5 -1.6 2.1 14.2 Region Red River Valley 4.2 -2.0 1.4 -0.9 11.0 4.5 -5.6 -0.2 -3.5 15.6 North Central 3.5 -4.0 -0.4 3.3 10.7 3.3 -17.7 -2.7 2.6 14.9 South Central 3.9 -2.6 0.5 3.9 9.9 3.9 -6.7 -1.7 3.9 14.8 West 4.2 -2.5 0.1 6.1 7.4 4.1 -15.0 -2.3 8.3 10.5 Farm Enterprise Crop 3.6 -3.2 0.2 1.3 11.0 3.1 -9.5 -1.6 0.0 16.2 Livestock 6.0 -2.0 1.9 11.1 7.4 8.4 -7.8 1.0 22.8 11.9 Mixed 3.3 -3.2 -0.4 5.0 6.8 1.7 -10.1 -3.7 5.2 9.2 Farm Sales $249,999 or less 5.8 -4.2 0.6 5.6 6.7 7.0 -18.2 -1.8 7.3 9.1 $250,000-$499,999 4.1 -2.9 -0.1 2.6 9.8 4.1 -10.2 -2.3 1.8 15.7 $500,000-$999,999 3.2 -2.8 0.2 2.5 10.2 2.6 -7.1 -1.0 1.4 14.4 $1,000,000 or more 3.8 -2.6 0.7 1.6 11.4 3.9 -6.4 -1.3 1.2 16.3 Farm Size 1,999 acres or less 4.2 -3.0 0.7 2.9 9.9 4.7 -9.0 -1.2 1.9 15.5 2,000 acres or more 3.3 -3.1 0.2 2.7 10.0 3.2 -9.5 -2.0 2.4 13.7 Cropland Tenure Full tenant 7.6 -4.6 1.7 3.7 13.3 9.7 -11.5 0.0 2.4 21.6 1-20 percent owned 3.5 -3.3 0.0 2.2 11.8 3.3 -12.4 -2.4 0.8 18.3 21-40 percent owned 3.0 -2.6 0.3 2.4 10.0 2.4 -7.9 -2.5 1.7 14.1 41 percent or more owned 2.6 -2.3 0.1 3.6 7.7 2.1 -6.7 -1.6 2.4 9.7 Net Farm Income $49,999 or less 0.6 -4.7 -1.9 -1.7 1.0 -1.3 -17.6 -5.5 -5.6 -2.0 $50,000-$99,999 6.7 1.6 3.2 5.6 7.6 9.2 0.8 2.5 6.2 11.4 $100,000-$199,999 8.6 3.2 5.3 6.7 10.7 12.3 3.1 5.4 9.6 17.5 $200,000 or more 11.5 4.9 7.8 8.4 14.2 19.7 6.0 9.9 10.6 20.8 Debt-to-Asset Ratio 0-40 percent 3.5 -2.5 0.5 3.4 10.8 3.3 -4.2 -0.7 3.3 13.1 41-70 percent 5.7 -2.1 1.4 2.7 10.0 8.0 -9.7 -1.0 1.8 17.2 71 percent or more 2.6 -7.3 -2.2 2.2 5.9 0.0 -52.8 -21.1 0.0 13.1 Farmer Age 39 years or younger 8.6 -2.2 1.7 5.7 12.1 12.3 -11.0 0.0 8.6 22.1 40-49 years 2.9 -3.7 -0.4 2.3 10.4 1.8 -17.1 -3.9 1.0 14.9 50 years or older 2.6 -3.1 -0.5 1.8 8.7 1.8 -6.8 -2.2 0.9 11.0
22
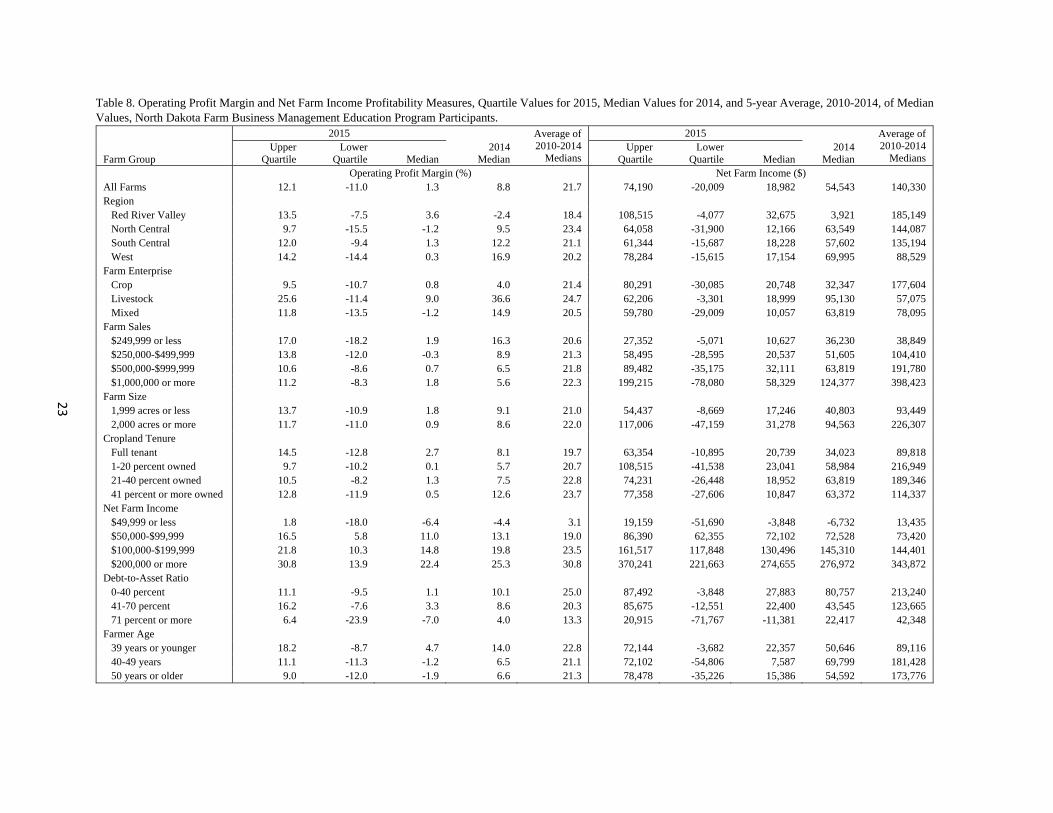
Table 8. Operating Profit Margin and Net Farm Income Profitability Measures, Quartile Values for 2015, Median Values for 2014, and 5-year Average, 2010-2014, of Median Values, North Dakota Farm Business Management Education Program Participants.
2015 2014
Median
Average of 2010-2014
Medians
2015 2014
Median
Average of 2010-2014
Medians
Farm Group Upper
Quartile Lower
Quartile
Median Upper
Quartile Lower
Quartile
Median Operating Profit Margin (%) Net Farm Income ($) All Farms 12.1 -11.0 1.3 8.8 21.7 74,190 -20,009 18,982 54,543 140,330 Region Red River Valley 13.5 -7.5 3.6 -2.4 18.4 108,515 -4,077 32,675 3,921 185,149 North Central 9.7 -15.5 -1.2 9.5 23.4 64,058 -31,900 12,166 63,549 144,087 South Central 12.0 -9.4 1.3 12.2 21.1 61,344 -15,687 18,228 57,602 135,194 West 14.2 -14.4 0.3 16.9 20.2 78,284 -15,615 17,154 69,995 88,529 Farm Enterprise Crop 9.5 -10.7 0.8 4.0 21.4 80,291 -30,085 20,748 32,347 177,604 Livestock 25.6 -11.4 9.0 36.6 24.7 62,206 -3,301 18,999 95,130 57,075 Mixed 11.8 -13.5 -1.2 14.9 20.5 59,780 -29,009 10,057 63,819 78,095 Farm Sales $249,999 or less 17.0 -18.2 1.9 16.3 20.6 27,352 -5,071 10,627 36,230 38,849 $250,000-$499,999 13.8 -12.0 -0.3 8.9 21.3 58,495 -28,595 20,537 51,605 104,410 $500,000-$999,999 10.6 -8.6 0.7 6.5 21.8 89,482 -35,175 32,111 63,819 191,780 $1,000,000 or more 11.2 -8.3 1.8 5.6 22.3 199,215 -78,080 58,329 124,377 398,423 Farm Size 1,999 acres or less 13.7 -10.9 1.8 9.1 21.0 54,437 -8,669 17,246 40,803 93,449 2,000 acres or more 11.7 -11.0 0.9 8.6 22.0 117,006 -47,159 31,278 94,563 226,307 Cropland Tenure Full tenant 14.5 -12.8 2.7 8.1 19.7 63,354 -10,895 20,739 34,023 89,818 1-20 percent owned 9.7 -10.2 0.1 5.7 20.7 108,515 -41,538 23,041 58,984 216,949 21-40 percent owned 10.5 -8.2 1.3 7.5 22.8 74,231 -26,448 18,952 63,819 189,346 41 percent or more owned 12.8 -11.9 0.5 12.6 23.7 77,358 -27,606 10,847 63,372 114,337 Net Farm Income $49,999 or less 1.8 -18.0 -6.4 -4.4 3.1 19,159 -51,690 -3,848 -6,732 13,435 $50,000-$99,999 16.5 5.8 11.0 13.1 19.0 86,390 62,355 72,102 72,528 73,420 $100,000-$199,999 21.8 10.3 14.8 19.8 23.5 161,517 117,848 130,496 145,310 144,401 $200,000 or more 30.8 13.9 22.4 25.3 30.8 370,241 221,663 274,655 276,972 343,872 Debt-to-Asset Ratio 0-40 percent 11.1 -9.5 1.1 10.1 25.0 87,492 -3,848 27,883 80,757 213,240 41-70 percent 16.2 -7.6 3.3 8.6 20.3 85,675 -12,551 22,400 43,545 123,665 71 percent or more 6.4 -23.9 -7.0 4.0 13.3 20,915 -71,767 -11,381 22,417 42,348 Farmer Age 39 years or younger 18.2 -8.7 4.7 14.0 22.8 72,144 -3,682 22,357 50,646 89,116 40-49 years 11.1 -11.3 -1.2 6.5 21.1 72,102 -54,806 7,587 69,799 181,428 50 years or older 9.0 -12.0 -1.9 6.6 21.3 78,478 -35,226 15,386 54,592 173,776
23
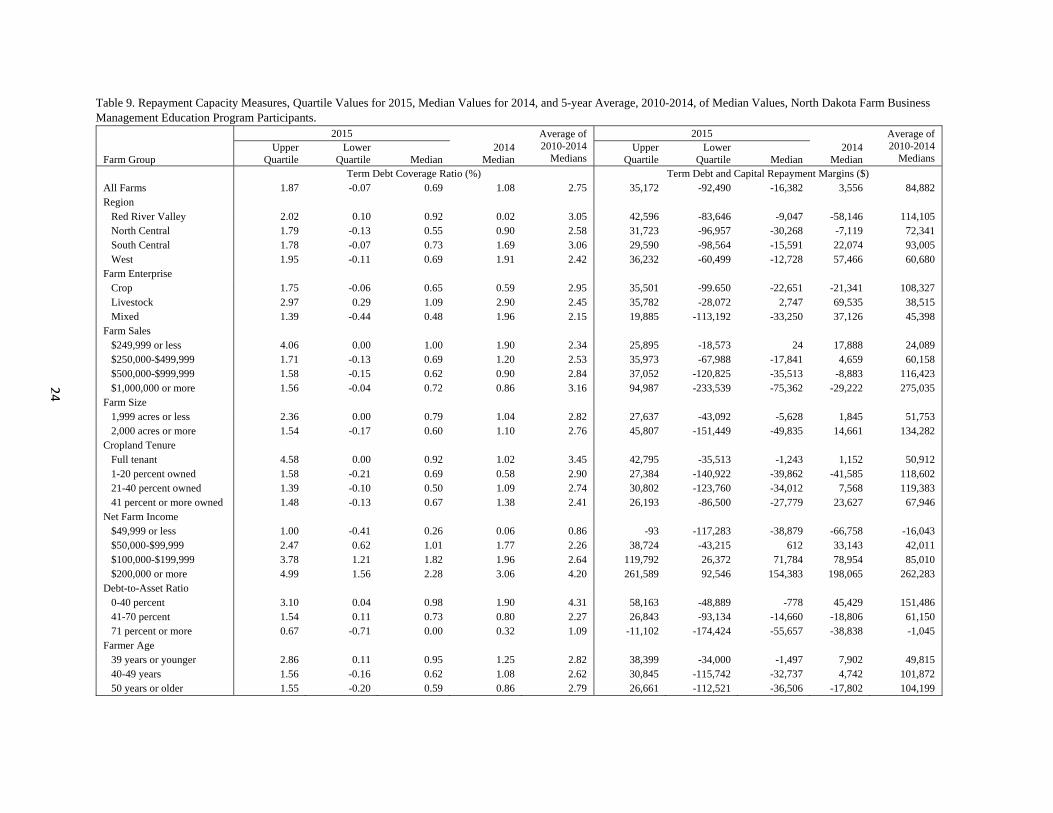
Table 9. Repayment Capacity Measures, Quartile Values for 2015, Median Values for 2014, and 5-year Average, 2010-2014, of Median Values, North Dakota Farm Business Management Education Program Participants.
2015 2014
Median
Average of 2010-2014
Medians
2015 2014
Median
Average of 2010-2014
Medians
Farm Group Upper
Quartile Lower
Quartile
Median Upper
Quartile Lower
Quartile
Median Term Debt Coverage Ratio (%) Term Debt and Capital Repayment Margins ($) All Farms 1.87 -0.07 0.69 1.08 2.75 35,172 -92,490 -16,382 3,556 84,882 Region Red River Valley 2.02 0.10 0.92 0.02 3.05 42,596 -83,646 -9,047 -58,146 114,105 North Central 1.79 -0.13 0.55 0.90 2.58 31,723 -96,957 -30,268 -7,119 72,341 South Central 1.78 -0.07 0.73 1.69 3.06 29,590 -98,564 -15,591 22,074 93,005 West 1.95 -0.11 0.69 1.91 2.42 36,232 -60,499 -12,728 57,466 60,680 Farm Enterprise Crop 1.75 -0.06 0.65 0.59 2.95 35,501 -99.650 -22,651 -21,341 108,327 Livestock 2.97 0.29 1.09 2.90 2.45 35,782 -28,072 2,747 69,535 38,515 Mixed 1.39 -0.44 0.48 1.96 2.15 19,885 -113,192 -33,250 37,126 45,398 Farm Sales $249,999 or less 4.06 0.00 1.00 1.90 2.34 25,895 -18,573 24 17,888 24,089 $250,000-$499,999 1.71 -0.13 0.69 1.20 2.53 35,973 -67,988 -17,841 4,659 60,158 $500,000-$999,999 1.58 -0.15 0.62 0.90 2.84 37,052 -120,825 -35,513 -8,883 116,423 $1,000,000 or more 1.56 -0.04 0.72 0.86 3.16 94,987 -233,539 -75,362 -29,222 275,035 Farm Size 1,999 acres or less 2.36 0.00 0.79 1.04 2.82 27,637 -43,092 -5,628 1,845 51,753 2,000 acres or more 1.54 -0.17 0.60 1.10 2.76 45,807 -151,449 -49,835 14,661 134,282 Cropland Tenure Full tenant 4.58 0.00 0.92 1.02 3.45 42,795 -35,513 -1,243 1,152 50,912 1-20 percent owned 1.58 -0.21 0.69 0.58 2.90 27,384 -140,922 -39,862 -41,585 118,602 21-40 percent owned 1.39 -0.10 0.50 1.09 2.74 30,802 -123,760 -34,012 7,568 119,383 41 percent or more owned 1.48 -0.13 0.67 1.38 2.41 26,193 -86,500 -27,779 23,627 67,946 Net Farm Income $49,999 or less 1.00 -0.41 0.26 0.06 0.86 -93 -117,283 -38,879 -66,758 -16,043 $50,000-$99,999 2.47 0.62 1.01 1.77 2.26 38,724 -43,215 612 33,143 42,011 $100,000-$199,999 3.78 1.21 1.82 1.96 2.64 119,792 26,372 71,784 78,954 85,010 $200,000 or more 4.99 1.56 2.28 3.06 4.20 261,589 92,546 154,383 198,065 262,283 Debt-to-Asset Ratio 0-40 percent 3.10 0.04 0.98 1.90 4.31 58,163 -48,889 -778 45,429 151,486 41-70 percent 1.54 0.11 0.73 0.80 2.27 26,843 -93,134 -14,660 -18,806 61,150 71 percent or more 0.67 -0.71 0.00 0.32 1.09 -11,102 -174,424 -55,657 -38,838 -1,045 Farmer Age 39 years or younger 2.86 0.11 0.95 1.25 2.82 38,399 -34,000 -1,497 7,902 49,815 40-49 years 1.56 -0.16 0.62 1.08 2.62 30,845 -115,742 -32,737 4,742 101,872 50 years or older 1.55 -0.20 0.59 0.86 2.79 26,661 -112,521 -36,506 -17,802 104,199
24

Table 10. Asset Turnover and Operating Expense and Depreciation Expense Efficiency Measures (as a Percentage of Gross Farm Income), Quartile Values for 2015, Median Values for 2014, and 5-year Average, 2010-2014, of Median Values, North Dakota Farm Business Management Education Program Participants.
2015 2014
Median
Average of 2010-2014 Medians
2015 2014
Median
Average of 2010-2014 Medians
2015 2014
Median
Average of 2010-2014 Medians
Farm Group
Upper Quartile
Lower Quartile Median
Upper Quartile
Lower Quartile
Median
Upper Quartile
Lower Quartile Median
Asset Turnover Operating Expense (%) Depreciation Expense (%) All Farms .43 .23 .30 .34 0.42 70.0 90.7 80.2 75.2 64.5 5.7 12.8 8.8 7.3 5.3Region Red River Valley .51 .26 .36 .33 0.49 70.0 88.6 79.3 84.6 67.4 6.4 12.2 8.8 9.2 6.3 North Central .47 .24 .30 .35 0.44 71.9 91.1 81.1 74.9 62.9 5.8 13.7 9.1 6.5 4.4 South Central .39 .20 .27 .33 0.41 70.8 92.5 81.3 72.3 63.3 5.7 12.4 8.7 7.9 6.0 West .38 .20 .28 .35 0.37 66.8 90.5 76.4 68.7 64.8 5.6 12.3 8.0 6.3 4.9Farm Enterprise Crop .50 .25 .34 .34 0.48 72.9 90.8 81.3 78.6 64.7 6.5 13.5 9.6 8.4 5.6 Livestock .30 .15 .22 .34 0.29 56.7 88.5 71.0 52.0 60.8 3.6 9.4 6.0 4.3 4.4 Mixed .34 .21 .27 .34 0.33 70.7 92.2 83.2 68.6 65.4 6.0 12.6 8.2 6.4 4.9Farm Sales $249,999 or less .71 .18 .28 .35 0.32 61.6 93.2 76.3 64.7 60.1 3.3 10.3 6.1 4.4 4.2 $250,000-$499,999 .44 .23 .30 .35 0.45 69.4 91.1 81.7 75.2 65.1 5.6 11.8 8.6 6.7 4.4 $500,000-$999,999 .39 .24 .30 .33 0.43 72.9 89.4 80.5 76.7 64.8 6.7 13.7 9.6 7.9 5.6 $1,000,000 or more .44 .24 .30 .34 0.46 73.9 90.4 82.4 80.3 65.9 7.6 13.9 10.9 8.9 6.3Farm Size 1,999 acres or less .50 .21 .31 .34 0.44 68.0 90.8 79.2 74.8 63.8 4.2 11.2 7.4 6.6 4.9 2,000 acres or more .39 .24 .29 .34 0.41 72.8 90.6 81.6 75.7 65.1 7.1 13.7 10.2 7.9 5.6Cropland Tenure Full tenant .84 .32 .50 .54 0.67 70.0 93.3 79.6 76.1 66.3 2.9 10.7 7.1 6.3 4.6 1-20 percent owned .46 .29 .37 .37 0.52 74.1 91.3 83.2 79.4 67.0 6.4 13.4 9.6 8.0 5.2 21-40 percent owned .36 .24 .30 .33 0.42 73.9 89.7 81.4 77.3 63.7 6.6 13.2 10.1 8.2 5.5 41 percent or more owned .27 .17 .22 .27 0.31 67.3 89.6 77.2 70.1 61.5 6.1 13.2 9.6 7.3 5.8Net Farm Income $49,999 or less .41 .21 .29 .33 0.31 77.5 95.9 86.3 87.0 78.3 6.1 13.6 9.5 8.5 5.6 $50,000-$99,999 .43 .24 .30 .35 0.39 65.6 78.2 72.7 71.5 65.6 5.5 11.0 8.1 6.2 4.7 $100,000-$199,999 .47 .28 .38 .35 0.45 63.3 74.3 70.7 66.2 63.6 4.5 12.2 7.7 6.6 4.6 $200,000 or more .47 .25 .36 .35 0.46 56.6 72.9 65.0 61.4 57.1 5.4 11.1 8.3 6.5 5.5Debt-to-Asset Ratio 0-40 percent .36 .22 .26 .31 0.40 69.4 88.3 78.2 73.2 60.7 7.0 14.9 10.9 8.4 6.0 41-70 percent .46 .26 .34 .35 0.46 68.0 88.9 78.2 76.2 66.9 5.0 11.3 7.7 6.7 5.0 71 percent or more .55 .20 .33 .40 0.41 76.2 102.7 87.5 79.2 72.3 4.8 10.3 7.6 5.9 4.1Farmer Age 39 years or younger .65 .24 .38 .42 0.51 65.6 87.4 76.8 72.2 63.5 3.5 10.2 6.7 5.0 4.0 40-49 years .43 .24 .33 .36 0.47 73.4 90.7 83.9 77.8 66.0 7.1 12.4 9.5 8.0 5.6 50 years or older .35 .22 .26 .30 0.38 72.4 92.7 82.5 76.8 64.2 7.0 14.3 10.6 8.5 6.1
25

Table 11. Interest Expense and Farm Income Efficiency Measures (as a Percentage of Gross Farm Income), Quartile Values for 2015, Median Values for 2014, and 5-year Average, 2010-2014, of Median Values, North Dakota Farm Business Management Education Program Participants.
2015 2014
Median
Average of 2010-2014
Medians
2015 2014
Median
Average of 2010-2014
Medians
Farm Group Upper
Quartile Lower
Quartile
Median Upper
Quartile Lower
Quartile
Median Interest Expense (%) Net Farm Income (%) All Farms 2.2 7.3 4.3 3.5 3.4 17.4 -6.2 5.1 12.5 25.6 Region Red River Valley 1.7 5.9 3.8 3.4 2.7 17.9 -1.5 6.9 1.2 22.6 North Central 2.2 7.5 4.3 3.5 3.4 16.3 -10.6 4.4 15.1 28.4 South Central 1.9 6.9 4.5 3.2 3.3 16.7 -4.2 4.9 16.0 26.0 West 3.1 9.3 6.2 5.0 5.0 19.9 -12.9 5.0 19.0 23.0 Farm Enterprise Crop 1.8 6.7 3.8 3.4 3.0 14.0 -6.3 4.7 8.4 25.6 Livestock 3.5 9.2 5.8 3.3 4.9 28.2 -2.9 15.5 38.4 27.7 Mixed 3.2 9.6 5.9 4.1 4.9 16.6 -10.3 1.9 18.0 23.3 Farm Sales $249,999 or less 2.0 9.6 5.3 3.3 4.7 24.7 -10.1 8.5 23.9 29.4 $250,000-$499,999 2.2 7.3 4.7 3.8 3.7 18.0 -7.2 5.7 12.9 26.3 $500,000-$999,999 2.3 7.1 4.2 3.6 3.4 13.9 -5.2 4.4 10.3 25.1 $1,000,000 or more 2.0 5.8 3.6 3.2 2.7 12.8 -5.3 3.3 6.8 24.2 Farm Size 1,999 acres or less 1.8 7.3 4.2 3.4 3.4 18.9 -4.4 6.9 14.5 26.3 2,000 acres or more 2.6 7.4 4.5 3.6 3.4 14.1 -7.5 3.0 11.1 25.0 Cropland Tenure Full tenant 1.5 5.0 3.0 2.4 2.4 20.0 -6.1 9.5 14.3 26.5 1-20 percent owned 2.5 6.5 3.9 3.5 3.2 13.5 -7.0 2.9 9.4 24.0 21-40 percent owned 3.0 7.6 4.7 4.2 3.9 12.7 -4.2 4.3 10.2 25.6 41 percent or more owned 3.0 9.3 6.4 4.7 4.5 15.6 -7.9 4.2 16.7 27.3 Net Farm Income $49,999 or less 2.4 8.3 5.4 4.6 5.7 6.5 -13.3 -1.3 -1.3 8.2 $50,000-$99,999 2.3 5.7 3.9 3.2 4.2 19.9 9.7 14.9 17.5 24.1 $100,000-$199,999 1.5 5.3 2.9 3.4 3.4 26.4 12.5 18.7 23.8 27.7 $200,000 or more 1.9 4.2 3.2 2.2 2.4 30.3 17.4 25.0 26.9 33.7 Debt-to-Asset Ratio 0-40 percent 1.0 3.9 2.3 2.0 1.9 18.0 -1.3 6.9 16.7 30.7 41-70 percent 3.8 7.8 5.7 5.0 4.7 18.6 -3.3 6.3 10.4 22.6 71 percent or more 5.0 11.7 7.7 6.3 6.6 8.3 -21.4 -6.1 6.3 15.4 Farmer Age 39 years or younger 2.3 7.7 4.5 3.9 3.6 23.5 -1.4 9.6 17.5 27.7 40-49 years 2.7 8.4 5.1 3.3 3.5 14.3 -9.6 2.5 11.3 24.5 50 years or older 1.6 6.7 4.0 3.4 3.2 12.8 -6.9 2.3 10.1 25.2
26

27
Appendix
DEFINITION OF FINANCIAL MEASURES
Sixteen measures of financial performance were calculated for each farm in this study. The recommendations of the Farm Financial Standards Council for calculating the ratios were followed as closely as possible, from the Finpack data.
The Farm Financial Standards Council stated that a more meaningful comparison between farms is achieved with market valuation of assets, but due to fluctuations in market values the cost method (acquisition cost less accumulated depreciation) is superior for comparisons over time for an individual farm operation. In fact, a dual column balance sheet is recommended: one column to value assets by the cost approach and a second column for market valuation of assets.
The valuation method used for current assets of farms in this study depended on what was most relevant and reliable. For example, current market value was used for grain and market livestock inventories, but prepaid expenses and supplies were listed at purchase cost.
Non-current asset valuation was:
Machinery was valued at cost minus accumulated depreciation. Annual depreciation was 10 percent of un-depreciated value.
Purchased breeding livestock was valued at cost. Raised replacement animals were valued at a conservative market value when they enter the breeding herd. This value remains constant until the animal leaves the herd.
Generally, land was valued at cost. However, when a farmer enrolls in the farm business program there may be a one-time revaluing of land to a conservative market value.
Assets and liabilities not associated with the farm business are excluded from the calculation of farm financial performance measures. Accrued liabilities were included on the balance sheets but deferred tax liabilities were not.
The calculations of all financial measures, unless otherwise noted, are accrual adjusted. Examples are:
Gross farm revenue is gross cash revenue plus the changes in crop and market livestock inventories and accounts receivable.
Interest expense is cash interest plus the change in accrued interest.
Liquidity
Current Ratio
Computation: Current assets divided by current liabilities.
Interpretation: This ratio measures the extent current assets will cover liabilities that are due during the next 12 months. The higher the ratio the more cushion the business has to meet short-run obligations without disrupting normal business operations. The current ratio's limitation as a measure of liquidity is that it does not match the timing of financial obligations with the liquidation of current assets, nor does it consider any new debt incurred or assets that may be generated during the 12 months after the balance sheet date.

28
Working Capital
Computation: Current assets minus current liabilities.
Interpretation: This measure shows the dollar amount that current assets can or cannot cover current liabilities. The amount of working capital necessary to provide an adequate cushion for meeting debt obligations must be related to the size of the business. Working capital as a measure of liquidity has similar limitations as the current ratio.
Solvency
Debt-to-Asset
Computation: Total liabilities divided by total assets.
Interpretation: This ratio shows the proportion of assets owed to creditors. The lower the debt-to-asset ratio the higher the solvency of the business. Solvency is a measure of risk exposure. As solvency decreases, the owner has less equity relative to debt, the ability to procure additional financing may decrease, and the business's ability to survive adverse outcomes is diminished. However, solvency should be viewed in connection with profitability. A low solvency position may be desirable if debt capital provides returns in excess of its cost.
Equity-to-Asset
Computation: Owner equity divided by total assets.
Interpretation: This ratio shows the portion of total assets represented by owner equity. It is another way of expressing solvency.
Debt-to-Equity
Computation: Total liabilities divided by owner equity.
Interpretation: This ratio shows the extent to which debt capital is combined with equity capital. It is another way of expressing solvency.
Profitability
Rate of Return on Assets (ROA)
Computation: Net farm income plus interest expense minus a charge for unpaid operator labor and management, divided by average total assets.
Interpretation: This ratio measures the pre-tax rate of return on farm assets and is used to evaluate whether assets are employed profitability in the business. Two important factors affecting this measure are valuation of assets and the charge for unpaid operator labor and management. Five percent of gross revenue plus a $20,000 charge per full time operator was used.
Rate of Return on Equity (ROE)
Computation: Net farm income minus a charge for unpaid operator labor and management, divided by average owner equity.
Interpretation: This ratio measures the pre-tax rate of return on equity capital employed in the business. Two important factors affecting this measure are valuation of assets and the charge for unpaid operator labor and management. Five percent of gross revenue plus a $20,000 charge per full time operator was used. This ratio should be evaluated carefully and used in conjunction with other ratios when analyzing a farm business. If ROE is greater than ROA, debt capital is being employed profitably—it is earning more

29
than it costs in interest. A high ratio may indicate an undercapitalized or highly leveraged business, and a low ratio may indicate a more conservative, high equity business.
Operating Profit Margin
Computation: Net farm income plus interest expense minus a charge for unpaid operator labor and management, divided by the value of farm production. Value of farm production is gross farm revenue less purchase of market livestock and feed.
Interpretation: This ratio measures net farm income per dollar of farm production. It is a pre-tax measure of profit margin from the employment of assets. An important factor is the charge for unpaid operator labor and management. There is a relationship between operating profit margin, asset turnover rate, and ROA. Operating profit margin multiplied by asset turnover rate equals ROA.
Net Farm Income
Computation: Net farm income is total revenue earned minus the costs incurred to generate those revenues. It is cash revenue less cash expense and depreciation plus capital adjustments (gain or loss from sale of capital assets). Accrual adjustments for changes in inventories are included to properly match revenues and expenses to the time period for which net farm income is being measured.
Interpretation: Net farm income is the return to the operator for unpaid labor and management and equity capital used in the farm business. Net farm income is an absolute amount and it is difficult to assign a standard to all farms because of differences in the amount of unpaid operator labor and equity used.
Repayment Capacity
Term Debt Coverage Ratio
Calculation: Net farm income plus depreciation and other capital adjustments plus non-farm income plus scheduled interest on term debt minus family living expense and income taxes, divided by scheduled term debt principal and interest payments.
Interpretation: This ratio measures the capacity of the borrower to cover all term debt payments. The more the ratio exceeds 1, the greater the margin to cover term debt payments. The business may have sufficient earnings but the timing of cash flows may not be adequate to make the payments on a timely basis. Also, the ratio does not contain any provision for replacement of capital assets.
Capital Replacement and Term Debt Repayment Margin
Calculation: Net farm income plus depreciation and other capital adjustments plus non-farm income minus family living expense, income taxes, and scheduled term debt principal payments.
Interpretation: This is a measure of the business’ ability to make payments on term debt. A positive margin indicates the amount available, after making term debt payments, for acquiring capital assets or servicing additional debt. The capital replacement and term debt repayment margin is a dollar amount, so it is impossible to establish a standard for all farm businesses.
Financial Efficiency
Asset Turnover
Calculation: Value of farm production divided by average total assets. Value of farm production is gross farm revenue less purchase of market livestock and feed.

30
Interpretation: This is a measure of how efficiently assets are used in the business. The higher the number, the more production is created per dollar of assets. Asset turnover can vary significantly by type of farm and by asset base. For example, dairy and hog farms will typically have higher asset turnovers than cow-calf or cash grain operations. Asset turnover will probably be higher if capital assets, such as machinery and land, are rented instead of owned.
Operating Expense Ratio
Calculation: Total expense less interest and depreciation and capital adjustment divided by gross farm revenue.
Interpretation: This ratio measures how efficiently operating expenses are managed to generate gross farm revenue. The operating expense ratio will typically vary by farm type.
Depreciation Expense Ratio
Calculation: Depreciation and capital adjustments divided by gross farm revenue.
Interpretation: This ratio expresses depreciation and capital adjustment relative to gross farm revenue. It will vary by farm type and from year to year. Caution must be used when evaluating this ratio. It does not comply with the farm financial standards because the Finpack program, used to generate the farm financial summaries, calculates depreciation and capital adjustment as one number (ending inventory plus capital sales less the sum of beginning inventory and capital purchases). Therefore depreciation cannot be isolated.
Interest Expense Ratio
Calculation: Interest expense divided by gross farm revenue.
Interpretation: This ratio shows the portion of gross farm revenue necessary to cover interest expense. It is often used as a measure of financial risk.
Net Farm Income Ratio
Calculation: Net farm income divided by gross farm revenue.
Interpretation: This is a measure of how efficient the farm business is at generating net income from gross revenue. It is the portion of gross farm revenue left after operating expense, depreciation and capital adjustment, and interest expense have been removed.

31
REFERENCES
Farm Financial Standards Task Force. 1991. Financial Guidelines for Agricultural Producers: Recommendations of the Farm Financial Standards Task Force. American Bankers Association, Agricultural Bankers Division, Washington, DC.
Swenson, Andrew L. 2015. Financial Characteristics of North Dakota Farms, 2005-2014.
Agribusiness and Applied Economics Report No. 744, Department of Agribusiness and Applied Economics, North Dakota State University, Fargo, Website http://agecon.lib.umn.edu/
North Dakota Agricultural Statistics Service. 2015. North Dakota Agricultural Statistics. North
Dakota State University, Fargo, and U.S. Department of Agriculture, Washington, DC.