financial capability technical model - amazon web services
TRANSCRIPT

Thoresen Review, GFA Page 1 of 19 January 2008
Experian Report
Thoresen Review, Generic Financial Advice
Target Market and Infrastructure Mapping
Experian Report, January 2008
Thoresen Review, GFA Page 2 of 19 January 2008
Experian Report
Contents 1. Introduction Page 3 2. Supply Mapping Page 4 3. Demand Mapping Page 7 4. Mismatch Analysis Page 11 5. Pen Portraits Page 13 6. Experian Contacts Page 14 Annex A – Demand Mapping Page 15 Annex B – Mismatch Analysis Page 18
� Appendix One – Supply at Local Authority Level
� Appendix Two – Example Maps of Supply
� Appendix Three – Demand at Local Authority Level
� Appendix Four – Example Maps of Demand
� Appendix Five – Mismatch Scores at Local Authority Level
� Appendix Six – Example Maps of Mismatch
� Appendix Seven – GFA Segments 6-11 Pen Portraits

Thoresen Review, GFA Page 3 of 19 January 2008
Experian Report
1. Introduction 1.1 Context The Thoresen Review commissioned Experian with objectives to;
a) Geographically map commercial and not-for-profit organisations providing elements of Generic Financial Advice (GFA). Additionally map the location of potential outlets that could be used to provide elements of GFA based on the feedback from consumer research.
b) Geographically map the location of adults in the UK according to those who
could benefit the most from GFA.
c) Compare in high-lever terms, the disparity between demand for GFA and supply in the form of existing and potential outlets for GFA.
d) Deepen and extend the understanding of the 19 or so million who could
benefit the most from GFA by identifying factors such as how they live, their aspirations and their affinity to brands.
These objectives build upon the analysis of existing landscape and UK adult population as discussed in the Thoresen Review interim report. All work covers the four areas of England, Scotland, Wales and Northern Ireland. The findings of this work will help inform and prioritise the next phase of piloting and role-out activity. A greater understanding of those who would benefit the most will be invaluable to devising engagement strategies. 1.2 Key Findings A number of key findings have been identified;
� Third sector provision is not available everywhere and there is no one existing supplier that could geographically provide comprehensive, national GFA service.
� The supply of potential GFA outlets, in particular commercial outlets, tends to be concentrated in the larger, urban areas.
� Engaging with retail brands and public services that display a more community-based focus, such as post offices, libraries, community centres and the Co-op, may provide enhanced coverage opportunities.
� Some relatively sparse areas of the UK have a high proportion of people who would benefit from GFA, however, the raw number may be greater in areas with a lower proportion but greater population density.
� Example Local Authorities (LA’s) that display a high number of the more financially vulnerable segments include Birmingham, Manchester, Newham and Sheffield. By contrast, example LA’s with a high concentration of financially vulnerable adults include Hackney, Southwark, Kingston upon Hull and Liverpool.
� Priority LA’s, those with the greatest disparity between potential demand for GFA and supply infrastructure, include Brent, Dundee, Ealing, Greenwich, South Tyneside, Walsall, Wigan and Stoke-on-Trent.
� Pen portraits for GFA segments with a significant need have been created, thereby bringing these target individuals ‘to life’.

Thoresen Review, GFA Page 4 of 19 January 2008
Experian Report
2. Supply Mapping 2.1 Introduction Organisations that currently provide elements of GFA were identified in the Thoresen Review interim report; these include banks, building societies, Citizen Advice Bureaux, Independent Financial Advisors (IFA’s), Credit Unions and advice centres that are members of Advice UK. Other organisations were identified by consumers as potentially having a GFA role; these include Post Offices and Supermarkets. The geographic location for each outlet within these broad categories has been mapped and the volume of provision summed-up to provide a picture at both Ward and LA levels. 2.2 Mapping of Supply The national distribution of provision is displayed through a series of maps and spreadsheets within the appendices, with examples provided below; UK distribution of potential supply outlets:

Thoresen Review, GFA Page 5 of 19 January 2008
Experian Report
Mapped potential supply outlets across London (excluding Post Offices):
St Helens distribution of potential supply outlets (excluding supermarkets):

Thoresen Review, GFA Page 6 of 19 January 2008
Experian Report
2.3 Assumptions of Supply Within this supply mapping it is worth noting that individual organisations may vary enormously in terms of capability, willingness and reach of delivering GFA services. As such, a number of key assumptions and limitations have been highlighted;
� All Post Offices have been mapped, although it is not possible to differentiate between Post Office size and type, services offered and opening hours – all of which will inevitably affect the ability to provide GFA.
� Similarly, for IFA’s we have been unable to distinguish by type, size and specialism of services on offer.
� The Advice UK database lists all members by organisation name and not necessarily by a topic of focus, such as a particular ethnic, geo-demographic, religious or sexual-orientation group. Based upon the advice centre’s name Experian have attempted to group the organisations.
� Credit Union coverage is taken from Experian datasets that map the Common Bond for each organisation. Although only Credit Unions with a residential focus have been used, the capability and willingness to provide GFA will vary.
� Only the larger supermarket brands and their bigger retail units have been used; this includes Asda, Tesco, Sainsbury’s, Co-op, Morrison’s and Waitrose and excludes for example Tesco Metro, Sainsbury’s Central and petrol forecourts.
� Certain supermarket brands have a geographic distribution that reflects their expansion out of a traditional ‘heartland’– for example, Waitrose in London and the Home Counties and Morrison’s from around Yorkshire.
� The demographic orientation of supermarket brands does vary, plus we cannot assume there is a willingness from supermarkets to be involved in delivering GFA services and whether citizens would feel comfortable with receiving GFA from such commercial organisations.
2.4 Summary of Findings The supply mapping workstream has identified a national, regional and local picture of outlets that could potential be involved in providing GFA. This mapping is a snapshot in time and reflects current provision and assumptions, as such has not considered the viability of engaging with other partner outlets, which could include libraries, GP practices, community centres, public houses and village halls. In addition to identifying how provision varies across the UK, a number of key summary points are identified;
� Third sector provision is not available everywhere and there is no one potential supplier that could geographically provide a comprehensive, national GFA service.
� The supply of potential GFA outlets, in particular commercial outlets, tends to be concentrated in the larger, urban areas.
� Engaging with retail brands and public services that display a more community-based focus, such as post offices, libraries, community centres and the Co-op, may provide enhanced coverage opportunities.

Thoresen Review, GFA Page 7 of 19 January 2008
Experian Report
3. Demand Mapping 3.1 Introduction Experian has built a model based upon the profiling of UK adult population against financial vulnerability carried-out for the Thoresen Review interim report. Full details of the methodology employed are provided in Annex 1.
Profiling the groups according to their causes of vulnerability allows us to isolate four clusters of people who can be differentiated by their demographics and potential GFA needs. For example, those with scores of 9 points or more, as expected, share multiple drivers of vulnerability and can be therefore be described as the group with “high vulnerability”. They lack access to commercial providers, have limited savings or protection products and run into difficulties making ends meet. Less than 20 per cent own their own home and 50 per cent live in areas with high levels of multiple deprivation. The next cluster, those with 6–8 points, can be differentiated from the most vulnerable group because they are generally good at keeping track of money and many have savings. More than 50 per cent of this group own their own home and less than 20 per cent live in areas with high levels of multiple deprivation. 3.2 Geographic Mapping of Demand Once the UK adult population has been assigned with a 0-11 segment it is possible to understand the geographic distribution and under/over-representation of the segments across Wards and LA’s. At LA level, the larger, metropolitan-oriented places such as Leeds, Birmingham, Manchester and Glasgow will high a high representation of all the 12 segments. For example, of the 742,000 adults in Birmingham, segment 3 is 49,000, segment 7 52,000 and segment 10 110,000. By contrast, when assessing the proportion, or percentage mix, of the segments, it is often the smaller and more demographically skewed LA’s that rank the highest.
Thoresen Review, GFA Page 8 of 19 January 2008
Experian Report
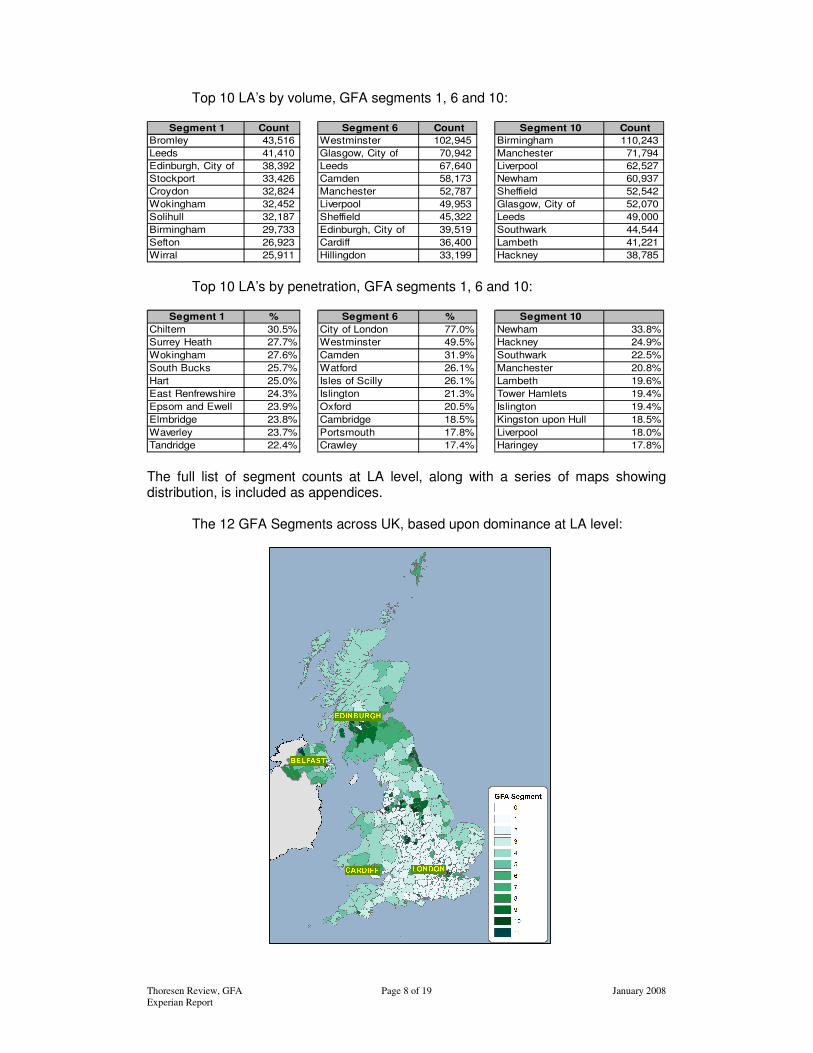
Top 10 LA’s by volume, GFA segments 1, 6 and 10:
Segment 1 Count Segment 6 Count Segment 10 Count
Bromley 43,516 Westminster 102,945 Birmingham 110,243
Leeds 41,410 Glasgow, City of 70,942 Manchester 71,794
Edinburgh, City of 38,392 Leeds 67,640 Liverpool 62,527
Stockport 33,426 Camden 58,173 Newham 60,937
Croydon 32,824 Manchester 52,787 Sheffield 52,542
Wokingham 32,452 Liverpool 49,953 Glasgow, City of 52,070
Solihull 32,187 Sheffield 45,322 Leeds 49,000
Birmingham 29,733 Edinburgh, City of 39,519 Southwark 44,544
Sefton 26,923 Cardiff 36,400 Lambeth 41,221
Wirral 25,911 Hillingdon 33,199 Hackney 38,785 Top 10 LA’s by penetration, GFA segments 1, 6 and 10:
Segment 1 % Segment 6 % Segment 10
Chiltern 30.5% City of London 77.0% Newham 33.8%
Surrey Heath 27.7% Westminster 49.5% Hackney 24.9%
Wokingham 27.6% Camden 31.9% Southwark 22.5%
South Bucks 25.7% Watford 26.1% Manchester 20.8%
Hart 25.0% Isles of Scilly 26.1% Lambeth 19.6%
East Renfrewshire 24.3% Islington 21.3% Tower Hamlets 19.4%
Epsom and Ewell 23.9% Oxford 20.5% Islington 19.4%
Elmbridge 23.8% Cambridge 18.5% Kingston upon Hull 18.5%
Waverley 23.7% Portsmouth 17.8% Liverpool 18.0%
Tandridge 22.4% Crawley 17.4% Haringey 17.8% The full list of segment counts at LA level, along with a series of maps showing distribution, is included as appendices. The 12 GFA Segments across UK, based upon dominance at LA level:

Thoresen Review, GFA Page 9 of 19 January 2008
Experian Report
Segment 11 banded, mapped across NW at LA and Ward level:
The 12 GFA segments mapped across London, based upon LA dominance:

Thoresen Review, GFA Page 10 of 19 January 2008
Experian Report
3.3 Summary of Findings The approach adopted to map likely GFA demand, through regression-based analysis of the 12 Thoresen segments is statistically valid and has drawn a number of key conclusions;
� The volume and penetration of the 12 GFA segments varies considerably across the United Kingdom, there is not an even distribution.
� Highest overall demand inevitably tends to be found in the larger metropolitan areas, in such places you are likely to find lots of all the segments. Example LA’s which display a high volume of the more financially vulnerable segments include Birmingham, Manchester, Newham and Sheffield.
� Equally, a high proportion of a particular segment may be a useful indicator in determining service delivery prioritisation. Example LA’s with this high concentration of financially vulnerable adults include Hackney, Southwark, Kingston upon Hull and Liverpool.
� It is important to acknowledge the difference between high volume and high penetration of a target segment within a geographic brick – volume may just be an indicator of lots of people whilst percentage may mask a very lowly populated area. As such, volumes of GFA segments need to be considered within the context of percentage mix, and vice versa.

Thoresen Review, GFA Page 11 of 19 January 2008
Experian Report
4. Mismatch Analysis 4.1 Introduction Supply and demand analysis has created a national picture, the further objective is to understand the disparity between these two within the context of LA geography. LA’s were ranked and allocated to deciles based upon their likely overall demand for GFA, taking into consideration both volume and percentage. This was matched to supply-side ranking and deciles, based upon outlet provision in the context of LA population size. Once combined, these two rankings identified LA’s ranking high in both likely GFA requirement and lack of provision. Full details of the methodology employed are provided in Annex 2. 4.2 Findings A full list of LA’s with their supply and demand scores, plus maps showing geographic distribution, is provided as appendices; Red and Amber areas include;
� Red Priority Areas: Brent, Dundee, Barking & Dagenham, Greenwich, Hull, South Tyneside, Salford, Stoke-on-Trent, Plymouth, Rochdale, Wakefield, Wandsworth and Croydon (total of 25 LA’s).
� Amber Priority Areas: Derby, Manchester, Derry, Oldham, Cardiff, Hounslow, West Lothian, Southampton, Rotherham, Northampton, Mansfield, Halton, Easington, Doncaster and Blackpool (total of 38 LA’s).
Lincolnshire, Humberside and Yorkshire, Red and Amber Areas LA’s:

Thoresen Review, GFA Page 12 of 19 January 2008
Experian Report
4.3 Summary The mismatch analysis, of disparity between likely high requirement and low in provision, has identified a high-level account of target locations.
� Red and Amber LA’s are those locations that score high in terms of likely GFA requirement yet have a comparatively low provision of potential GFA outlets.
� The assumptions and limitations expressed in the supply section, such as the varying quality and scale of provision of such outlets, is still valid.
� Top disparity locations include LA’s such as Brent, Dundee, Hull, Barking & Dagenham, Greenwich, South Tyneside and Stoke-on-Trent. This list of Red LA’s could be considered as those to focus on – although it should be remembered that nationally very few places provide all elements of GFA and there is a challenge in mapping infrastructure to perceived GFA demand.
� This disparity analysis is a useful high-level indicator, although it is equally important to focus on particular problem areas (Wards) within all LA’s.

Thoresen Review, GFA Page 13 of 19 January 2008
Experian Report
5. Pen Portraits 5.1 Context A key element of the demand mapping exercise is to deepen and extend the understanding of the 19 or so million who could benefit the most from GFA by identifying factors such as how they live, their use of the internet, their aspirations, financial behaviour and their affinity to brands. Pen portraits have been used to assist in bringing these individuals ‘to life’, focussing on GFA segments 6-11. 5.2 Approach Each respondent on the FSA survey has been identified through Experian’s comprehensive view of the UK adult population. A database of over 400 variables relating to demographics, socio-economics and consumer behaviour have contributed towards further understanding the GFA segments, thereby providing significant lifestage and lifestyle citizen insight;
� Lifestage (including household structure, children, age, length of residency, property type and tenure, location, council tax, employment status).
� Lifestyle (including financial situation, products holding, home computing, media and channel communication).
Within the context of the UK adult population, this information firstly helps to distinguish between the different GFA segments and secondly helps to determine the key attributes, attitudes and behaviours of that segment. 5.3 Output A 2-page A4 pen-portrait for GFA segments 6-11 has been produced. These are all included as appendices and are intended to indicate the type of individual likely to be seen in each of these GFA segments. The intention of the pen-portraits is to bring each of the segments ‘to life’, through describing them in terms of key lifestage and lifestyle attributes – plus allude to likely GFA requirements through describing possible financial situation, trigger points and communication and channel interaction from a social marketing perspective.

Thoresen Review, GFA Page 14 of 19 January 2008
Experian Report
6. Experian Contacts Peter Cummings, Director of Public Sector Insight, Experian’s Business Strategies Division: [email protected] 07885 675038 Patrick Gray, Consultant Project Manager, Public Sector Insight Team: [email protected] 07967 342713

Thoresen Review, GFA Page 15 of 19 January 2008
Experian Report
Annex A - Demand Mapping 1.1 Introduction Experian has adopted a regression-based approach to predict likely need for GFA, based upon the 12 Thoresen Segments, thereby enabling these segments to be rolled-out and quantified across all UK adults. The driving factors in this model are a measure of relative poverty, a measure of financial instability, the presence of children/families and the level of investments – other factors were considered for inclusion in building the regression model, however, added no extra insight nor statistical value. The model has been calibrated against the existing 12 Thoresen Segments, and then applied to the UK adult population. Furthermore, final results have been tested against the original base sample to verify that it’s representative of the population. 1.2 Context The 12 Thoresen segments were developed from a base research sample of in the region of 5,300. Whilst numerically these were extrapolated to the UK population, the results could not identify the geographic distribution and dispersion of each of the 12 segments across the UK. Experian holds a wide range of real, inferred and modelled information about every UK adult. The purpose of the statistical modelling exercise was to determine, on the base sample, relationships between the Experian data and the Thoresen Segments. Such relationships would then be used to assign all UK adults to one of the 12 segments and hence enable the roll-out and quantification of the segments. 1.3 Approach An approach of this nature typically produces results that, whilst statistically sound, display a number of caveats worth noting;
� The Experian data, which is mainly demographically-based around people, their home lives and their living arrangements, is being used to predict segments which are more broadly aligned on behaviours and attitudes.
� If the size of one segment is larger than another then any statistical model will put all marginal cases into the larger segment through natural probabilities.
� With large numbers of segments, in this case 12, the random chance of incorrect allocation is significantly bigger than correct allocation. A good model will reduce this imbalance, and hence potentially allocate segments to ‘close’ peer segments.
1.4 The Solution To mitigate any potential concerns with the solution, Experian took advantage of the construction of the Thoresen segments. Individuals had been placed into segments based on the number of criteria that were felt to indicate a need for GFA, thus could be viewed in part as a continuous distribution, (i.e. the higher the segment number the higher the criteria, and hence the greater the need). Therefore, a single regression-based model that predicts this single value has been adopted, an approach used extensively on many other successful segmentation assignments undertaken by Experian.

Thoresen Review, GFA Page 16 of 19 January 2008
Experian Report
The advantages of this approach are;
� We are predicting a single value for which the demographic indicators are likely to be stronger.
� Crucially, any error is likely to place an individual into a segment of similar need, and at the very least into the same of 1-4 ‘grouped’ segments.
� Errors from the modelling process should be normally distributed, so in any geographic area the under and over estimates are likely to balance out, giving a fair indication of overall need by geographic bricks.
1.5 The Model The final model, after much iteration, contained 4 distinct dimensions. These dimensions were derived using principle components analysis from the datasets used to create Experian’s Mosaic Public Sector and Financial Strategy Segments classification systems. These dimensions are;
� Wealth to Poverty (greater poverty = greater need for GFA). � Financial Stability to Instability (greater instability = greater need). � Investments (fewer investments = greater need). � Children to Elderly (more children = greater need).
1.6 Calibration The statistical model is strong, so is an effective way of ranking the entire base sample in terms of need for GFA, and hence of determining those in most and least need. However, the nature of regression means that fewer people are allocated to the extreme segments and more to the middle-ranking segments, which generates the classic ‘bell-shaped’ distribution. It is necessary to re-calibrate the distribution in order to clearly distinguish the outer extremes of the ‘bell’ distribution. The base sample has therefore been ranked according to need, then cut-off points identified to ensure that the proportion in each segment matches that in each of the original 12 Thoresen Segments. 1.7 Performance Overall, 15% are allocated to the correct segment, 41% within +/- 1 segment, and 62% within +/- 2 segments. Assuming a random allocation, this would’ve been no better than 8%, experience suggests this is a robust and accurate model. The following table (see next page) provides full cross-tabulation between Thoresen and predicted segments – for example, 16% of Thoresen segment 11 are correctly predicted by Experian, 14% from segment 10 and 11% from segment 9.

Thoresen Review, GFA Page 17 of 19 January 2008
Experian Report
1.8 Validation of Thoresen Segments The Experian model has been used to assign all UK adults to a single Thoresen segment, through assigning this ‘need’ score to the UK population and ranking an applying similar cut-off points. The distribution of the 12 segments has been determined and compared to the distribution of the extrapolated initial research. The distributions are broadly similar, which indicates that the original base sample is representative of the UK population and the methodology and approach adopted is valid. The following chart shows the comparison in distribution:
GFA - UK Adults Distribution
0.0%
2.0%
4.0%
6.0%
8.0%
10.0%
12.0%
14.0%
0 1 2 3 4 5 6 7 8 9 10 11
Segments 0-11
% o
f U
K A
du
lts
Thoresen - UK Distribution
Experian - UK Distribution
Thoresen Review, GFA Page 18 of 19 January 2008
Experian Report
Annex B - Mismatch Analysis 2.1 Approach Population counts for each GFA segment are available for each LA. Subsequently, LA’s were ranked based on 4 separate approaches;
� Count of GFA segments 6-11 � Count of GFA segments 10 and 11 � Percentage of total population that is GFA segments 6-11 � Percentage of total population that is GFA segments 10 and 11
These segments were selected on the assumption they would benefit the most from receiving GFA. These 4 separate rankings were allocated into deciles, of which the deciles were summed-up to provide an overall score – with a score of 4 (i.e. top decile for each of the 4 demand rankings) suggesting greatest demand, whilst a score of 40 (lowest decile for each of the 4) indicates those LA’s with the lowest overall requirement for GFA. Example LA’s that scored 4 points include Belfast, Camden, Hackney, Leicester, Lewisham, Sandwell, Sunderland and Wolverhampton. By contrast, example LA’s that scored 40 points include Tandridge, Purbeck, Hart and Ribble Valley. Counts of outlets of the potential GFA providers are available for each LA. Subsequently, LA’s were ranked based on 6 separate approaches;
� ‘Free banking’ outlets as a proportion of total population (defined as banks, Post Offices and building societies).
� ‘Free banking’ outlets as a proportion of total GFA segments 6-11. � ‘Free advice’ outlets as a proportion of total population (defined as C.A.B. and
Advice UK members). � ‘Free advice’ outlets as a proportion of total GFA segments 6-11. � Number of Credit Unions as a proportion of total population (based upon
coverage as defined through their ‘common bond’ catchment area). � Number of Credit Unions as a proportion of total GFA segments 6-11.
These 6 separate rankings were allocated into deciles, of which the deciles were summed-up to provide an overall score – with a score of 6 suggesting the lowest levels of supply and 60 indicating those LA’s with the highest overall provision rating. Example LA’s that scored the lowest points include Crawley, Wandsworth, Brent, Gosport, Chelmsford and Corby – in some cases, a C.A.B. and/or free advice outlet were not identified in that LA, plus a high population per free banking outlet. By contrast, example LA’s which benefited from good coverage, such as having a number of Credit Unions and a low population per outlet ratio, include Powys, West Devon, City of London, Eden, Teesdale and Torridge – invariably, these tend to be the more rural, lower population density LA’s (albeit City of London, skewed by being a major financial hub with relatively low residential population).
Thoresen Review, GFA Page 19 of 19 January 2008
Experian Report
2.2 Linking Supply with Demand These supply and demand overall rankings were allocated into deciles, which subsequently were compared to provide the disparity indicator – i.e. the highest GFA demand is decile 1 and the lowest GFA supply is decile 1.
� Number of LA’s in demand 1 and supply 1 = 8 � Number of LA’s in demand 1 and supply 2 = 11 � Number of LA’s in demand 1 and supply 3 = 7 � Number of LA’s in demand 2 and supply 1 = 6 � Number of LA’s in demand 2 and supply 2 = 10
Those LA’s which displayed the greatest disparity were allocated as either Red or Amber Priority area categories, based on the following rule-set: Red areas were defined as LA’s in demand decile 1 and supply decile 1 or 2, plus LA’s in demand decile 2 and supply decile 1. Following a similar logic, Amber areas were defined as LA’s in demand decile 1 and supply decile 3 or 4, plus LA’s in demand decile 2 and supply decile 2 or 3. The full list of LA allocations for supply and demand is provided within the appendices.