financial bankruptcy across european countries
TRANSCRIPT

International Journal of Economics and Finance; Vol. 9, No. 7; 2017
ISSN 1916-971X E-ISSN 1916-9728
Published by Canadian Center of Science and Education
132
Financial Bankruptcy across European Countries
Marianna Succurro1
1 Department of Economics, Statistics and Finance, “Giovanni Anania”, University of Calabria, Rende, Italy
Correspondence: Marianna Succurro, Department of Economics, Statistics and Finance, “Giovanni Anania”,
University of Calabria. Ponte Pietro Bucci - Cubo 0/C, 87036 Arcavacata di Rende (CS), Italy. Tel.
390-984-492-445. E-mail: [email protected]
Received: May 2, 2017 Accepted: May 19, 2017 Online Published: June 15, 2017
doi:10.5539/ijef.v9n7p132 URL: https://doi.org/10.5539/ijef.v9n7p132
Abstract
The aim of this research is to describe corporate bankruptcy across Western European countries and propose a
simple and reliable default prediction model for private manufacturing firms in six EU member states. Using
firm-level accounting data taken from the Orbis-Europe Database, published by Bureau Van Dijk, we first
propose a simple Indebtedness index which considers the multifaceted aspects of debt and allows to make
interesting comparison among firms, countries, industrial sectors and over time. Second, we estimate a logit
model, based on both the first step computed Indebtedness score and additional non-financial firms‟
characteristics, which allows to compute firms‟ predicted probabilities of default in each country. The empirical
findings show that the Indebtedness score is statistically significant in explaining bankruptcy and it enters all the
regressions with the highest coefficient and level of significance. However, while the indebtedness score is a
valuable bankruptcy predictor for Italy, Germany, Portugal and Spain, which are bank-based economies, it is
relatively less important for France and UK, being countries more strongly oriented toward the financial market.
The overall evidence highlights a good reliability of our multi-country model for the prediction of corporate
bankruptcies across Europe.
Keywords: indebtedness, bankruptcy, default prediction, logit, European countries
1. Introduction
The aim of this research is to describe financial bankruptcy across Western European countries and illustrate a
bankruptcy prediction model that can be easily used in practice to analyze and signal the risk of failure of a firm.
Due to the international financial crisis, indeed, both the number and the average size of bankrupt firms have
increased dramatically with the consequent greater interest from governments, financial institutions and
regulatory agencies. Even though economic recovery has been resumed recently, Europe has not really come to
rest. Despite the appreciable improvements in firms‟ financial health, the volume of insolvencies in Western
Europe remains higher than it was before the financial crisis (Creditreform, 2016).
Hence, a correct measure of firms‟ insolvency risk is very important both for internal monitoring purpose and for
investors, stockholders, actual or potential firm‟s competitors. Especially after the recent international financial
crisis, there has been a general need to predict insolvency and financial failure on-time in order to take corrective
and remedial measures for protecting business from the problem of bankruptcy. Coherently, the purpose of this
study is to propose a bankruptcy prediction model which can be easily applied in the spirit of firm rehabilitation
and going-concern considerations. Indeed, even if some countries have complex insolvency systems while others
have simple liquidation procedure (Succurro, 2012), the principal focus of modern insolvency legislation and
business debt restructuring practices no longer rests on the liquidation of insolvent firms but on the remodeling
of the financial and organizational structure of debtors experiencing financial distress, so as to permit the
rehabilitation and continuation of their business.
Actually, as it has been argued by Aziz and Dar (2006), Balcaen and Ooghe (2006), Bellovary et al. (2007), Ravi
Kumar and Ravi (2007) and Dimitras et al. (1996), bankruptcy prediction has been the subject of numerous
studies already in the past and, increasingly, over recent years. Researchers have investigated both the causes and
the legislative and financial tools available to start a process of recovery/rehabilitation of the firm. Prior to the
development of quantitative measures of company performance, agencies were established to supply qualitative
information assessing the creditworthiness of the firms. During the 1930s many models were developed to help
ijef.ccsenet.org International Journal of Economics and Finance Vol. 9, No. 7; 2017
133
banks decide whether or not to approve credit requests (Ramser & Foster, 1931; Smith & Winakor, 1935; Wall,
1936). Bellovary et al. (2007) traced a brief historical summary of the early studies (1930 to 1965) concerning
ratio analysis for bankruptcy prediction that laid the groundwork for the studies that followed. At the end of the
1960s, several applications of univariate and multivariate statistical methods were developed. One of the classic
works in the area of ratio analysis and bankruptcy classification was performed by Beaver (1967). Altman (1968)
and Deakin (1972) applied multivariate analysis and, after their seminal study, the linear discriminant analysis
has been intensively used in practice mainly because of the simplicity of its application.
As highlighted by Sensini (2015), a relevant problem for the analysts who aim at forecasting firms‟ risk of failure
is to identify the optimal subset of predictive variables. Several theoretical and empirical studies have attempted
to identify the best predictors among the large number of financial indicators suitable for predicting firms‟
insolvency and default (see, among others, Cultrera & Bauweraerts, 2017; Sensini, 2016; Sensini, 2015;
Amendola et al., 2015; Jackson & Wood, 2013; Altman, 2000; Zmijewski, 1984). Sensini (2015), in particular,
shows that the performance of default risk models in terms of forecast accuracy is mainly related to the selection
of the best set of predictors. Apart from variable selection, these papers have also analyzed additional
methodological issues related to the estimation of default prediction models, such as the structure of the
data-base, the sampling procedure and the choice of the optimization criteria.
Several studies have tried to improve the predictive power of the models (Jackson & Wood, 2013). Numerous
authors have used logit and probit models depending on whether the residuals follow a logistic or normal
distribution (Amendola et al., 2012). Similar methodologies – like duration models – have been developed in
order to consider several periods in the analysis (Shumway, 2001; Duffie et al., 2007). While previous studies
have been mainly focused on financial ratios, the recent empirical works incorporate nonfinancial information
(management, ownership structure, employees, clients, industry, etc.) in failure prediction models. Nevertheless,
only few papers explicitly use non-financial variables to predict failure (Grunert et al., 2004; Xie et al., 2008;
Zeitun, 2009; Berk et al., 2010; Pervan & Kuvek, 2013).
More recently, some authors have resorted to artificially intelligence expert system (AIES) models for
bankruptcy prediction. Several types of AIES models have been implemented such as recursively partitioned
decision trees, known as “random forest” approach (Behr & Weinblat, 2016), case-based reasoning models
(Kolodner, 1993), neural networks (Odom & Sharda, 1990; Kim & Kang, 2010), genetic algorithms (Varetto,
1998; Shin & Lee, 2002) or rough sets model (Dimitras et al., 1999). As argued by Jones et al. (2017), these
more advanced techniques would lightly outperform discriminant and logistic analysis but at the cost of artificial
balancing of the data set with respect to the insolvency status, which would suggest some caution with the
interpretability of the results.
Note that while empirical studies focus on firms‟ symptoms of failure and are mainly drawn from company
accounts, theoretical models, on the contrary, focus on the causes of bankruptcy and are drawn mainly from
information that could satisfy the proposed theory. See Aziz and Dar (2006) for a clear description of the
different types of theoretical models and their main characteristics.
On the whole, there have been many empirical applications of the bankruptcy prediction models and, despite the
differences in the methodologies applied, they show high predictive power. However, to determine the reliability
of default prediction and whether the underlying patterns are country specific, multi-country studies are required
(Altman et al., 2016). Therefore, based on accounting data from 114,484 defaulting and 1,033,661
non-defaulting manufacturing firms from six Western European countries in 2015, we provide evidence on the
country-specific default prediction. Specifically, after dealing with missing data, our final database includes both
active and inactive manufacturing firms in France, Germany, Italy, Portugal, Spain and United Kingdom.
Knowledge of the heterogeneity in default patterns in different EU member states is relevant for financial
supervision. The Basel II framework forces banks to use an internal rating to assess failure probabilities of its
business clients (Benli, 2010). While market based measures or hazard models have been the focus of empirical
research on quoted firms, accounting-based risk assessment still represents an essential tool, considered that
most of banks‟ business clients are non-publicly traded firms (Agarwal & Taffler, 2008). In this context, since
most of the firms we analyze are not quoted and accounting data usually are the only publicly available
information, the proposed approach acquires high practical importance.
Moreover, despite its relevance, cross-national empirical evidence on default prediction is scarce. The works by
Nanni and Lumini (2009), Amendola et al. (2013), Altman et al. (2016), Succurro and Mannarino (2014),
Andreeva et al. (2016), Behr and Weinblat (2016), Rommer (2005), are some exceptions. Succurro and
Mannarino (2014), in particular, investigate the impact of financial structure on firms‟ probability of bankruptcy
ijef.ccsenet.org International Journal of Economics and Finance Vol. 9, No. 7; 2017
134
in Western Europe convergence regions. Their empirical evidence shows that the financial structure is a key
factor explaining firms‟ bankruptcy, but important differences arise when the countries are considered separately:
while debt and cash flow ratios are significant for bank based economies, they are not significant for market
oriented countries. This study contributes to this branch of literature by modelling the default prediction of
private manufacturing firms for six EU member states using firm-level accounting data taken from the
Orbis-Europe Database, published by Bureau Van Dijk.
The methodology proposed in paragraph 2 includes a simple tool to evaluate firms‟ indebtedness and an
econometric model aimed at estimating firms‟ default risk. Paragraph 3 consists of a descriptive analysis of
bankruptcies in selected member states, while paragraph 4 shows the main country-specific empirical findings.
Section 5 concludes the work.
2. Methodology
2.1 Evaluation of Firm Indebtedness
This paragraph proposes a simple tool to evaluate firms‟ financial health before or separately from the estimation
of default probabilities.
The financial and accounting literature suggests that a firm‟s financial condition is better evaluated by
considering several aspects of the indebtedness phenomenon (leverage, indebtedness capacity, form of the
financial debt, net financial position, etc.) than by using a single financial ratio. In their seminal works, Beaver
(1967) and Altman (1968) argue that, although a failure may be caused by several circumstances, the
development of some financial ratios can be a signal of the firm‟s financial health. In particular, several previous
studies indicate that, with various financial ratios, corporate bankruptcy can be predicted with success for at least
five years before failure. The choice of the best predictors among the large number of financial indicators
suitable for predicting firms‟ insolvency and bankruptcy has been guided by theoretical background, personal
judgment, statistical methods and empirical findings obtained in previous studies (see, among others, Cultrera &
Bauweraerts, 2017; Sensini, 2016; Sensini, 2015; Amendola et al., 2015; Jackson & Wood, 2013; Altman, 2000;
Zmijewski, 1984). More specifically, the financial ratios considered in the analysis have been chosen on the basis
of a few different criteria, that is they have a relevant financial meaning in a failure context, have been
commonly used in failure predictions literature and also the information needed to calculate these ratios is
available (Sensini, 2015). Following this approach, we define an Indebtedness Index which considers the
multifaceted aspects of debt. More precisely, we assume:
𝐼𝑁𝐷𝐸𝐵𝑇𝐼𝑁𝐷𝐸𝑋=𝛼1𝐹𝐷
𝑁+ 𝛼2
𝐶𝐿
𝐹𝐷+ 𝛼3
𝐹𝐷
𝐶𝐹+ 𝛼4
𝐶𝐿
𝐶𝐴+ 𝛼5
𝑁𝑇𝐶𝐴
𝑁+ 𝛼6
𝑇𝐹𝐴
𝐿𝑇𝐷+𝑁+ 𝛼7
𝐼𝑃
𝐸𝐵𝐼𝑇 (1)
𝛼𝑖 ∊ R; 𝑖 = 1,2, … ,7
FD/N is the ratio between Total Financial Debt (sum of non-current liabilities and current liabilities) and
Shareholders Funds; it is the inverse of the capitalization degree and signals the indebtedness capacity of the firm.
CL/FD is the ratio between Current Liabilities and Total Financial Debt and gives information on the form of
financing of the firm; it indicates what percentage of a firm‟s debt is due soon (a high percentage may indicate
future liquidity problems). FD/CF, the ratio between Total Financial Debt and Cash-Flow, indicates how many
years a firm needs to repay its debts by internal financing (high values may indicate financial problems). CL/CA
is a structure ratio and it is given by Current Liabilities over Current Assets (high values indicate an unbalanced
financial structure). NTCA/N is the ratio between Net Technical Assets (given by Intangible Fixed Assets +
Tangible Fixed Assets – Depreciation) and Shareholders Funds; it indicates the inverse of the capitalization rate
of technical assets; TFA/(LTD+N) is Total Fixed Assets over the sum of Long-Term Debt and Shareholders
Funds and signals the inverse of the capitalization rate of total fixed assets. Finally, IP/EBIT indicates the ratio
between the Interest Paid and the Earnings Before Interest and Taxes. Indeed, an important factor for the
assessment of the sustainability of debt is the debt service burden of firms, which indicates the proportion of
their income needed for servicing debt.
We use a linear combination of these variables in order to produce a synthetic index of firm indebtedness which
can be used in a descriptive analysis across firms, sectors, countries and over time. The indebtedness score can
also be used as explanatory variable of ex-post firm default.
Since financial data are often characterized by asymmetric distribution, the traditional multivariate statistical
models are not the proper methods to treat such data. In order to robustly estimate the α coefficients of the
Indebtedness Index, we apply a Robust Principal Component Analysis (RPCA) technique suggested by Hubert et
al. (2009). As in the classical case, the Principal Components PCs are linear combinations of the original
variables, they are uncorrelated and maximize the explained variance. The number of extractable PCs is equal to

ijef.ccsenet.org International Journal of Economics and Finance Vol. 9, No. 7; 2017
135
the number of original variables, but the first principal component explains a percentage of variance greater than
the second one and so on. When the original variables have a good degree of correlation, the first principal
component (PC1) is usually considered a good approximation of the data matrix X and a percentage of 50-60 %
of variance explained by the first principal component is considered a good value of summary power. Since
accounting data tend to move in the same direction, and more or less proportionately, the first PC1 of the
financial ratios usually explains a proper percentage of variability. Hence, the Indebtedness Index can be
properly estimated with the coefficients given by the eigenvector defining the first robust principal component
(RPC1) of the firm‟s financial ratios data matrix.
As mentioned above, the final indebtedness score obtained through this statistical procedure is a signal of firms‟
creditworthiness and allows to easily compare different firms and to evaluate firm‟s financial health across
countries and over time. Note, however, the two contrasting results that firm indebtedness can have on risk of
failure. As clearly argued by Behr and Weinblat (2016), on the one hand, financial debt and a certain interest rate
have to be repaid regardless of a firm‟s current economic state. Therefore, a high indebtedness score would
imply a high default risk. On the other hand, a high indebtedness level enables a firm to benefit from the
leverage effect. Thus, we do not know - a priori – the final effect on firm default. This justifies our next
paragraph in which the indebtedness score is used as predictor variable of firm failure.
2.2 Estimation of Probability of Default
The estimation of default probabilities based on balance-sheet and profit-and-loss data is an important task for
banks as well as for regulatory authorities. Our assessment of probability of default is carried out on accounting
data and income statements over the years 2012-2014 in order to analyze the characteristics of firms affecting
their probability of default in 2015.
To estimate a default prediction model and to evaluate its performance, the information on firm‟s solvency status
is crucial. For this reason, an important issue concerns the definition of firm default. We consider the group
membership in 2015, during which some firms failed or were subject to liquidation procedure. Specifically, we
focus on companies that have undertaken the juridical procedure of bankruptcy because of permanent financial
distress. Therefore, a firm is considered to have defaulted if it is under bankruptcy procedure, if it has filed for
bankruptcy or it is in liquidation; we exclude firms with temporary financial problems or companies which have
voluntary chosen liquidation for economic opportunity, mergers or acquisition.
As mentioned above, recent artificially intelligence expert system models would lightly outperform discriminant
and logistic analysis (see, among others, Behr & Weinblat, 2016; Jones et al., 2017) but they are based on very
complex underlying model structures; moreover, because of the strong imbalance of the data sets with regard to
the bankruptcy status, standard implementations have to be modified to allow the estimation of realistic default
propensities. Therefore, more advanced techniques would lightly outperform at the cost of artificial balancing of
the data set with respect to the insolvency status, which would suggest some caution with the interpretability of
the results. For this reason, and because of its relative ease of application, we apply a logistic regression
technique to estimate firms‟ probability of default. Hence, the dependent variable is a dichotomous variable that
takes value 1 for defaulting firms (the firm is under bankruptcy procedure, it has filed for bankruptcy or it is
subject to liquidation in 2015), 0 otherwise (the firm is still active in 2015). In formal terms:
𝑝𝑖,𝑡 = 𝑃𝑟(𝑌𝑖,𝑡 = 1) = 𝐹(𝑥𝑖,𝑡−𝑛𝛽) (2)
where pi,t is the probability that the dependent variable Y=1 for individual firm at time t=2015, F(_) is the
logistic cumulative distribution function, xi,t-n is the set of explanatory variables thought to affect pi,t with n=1, …,
N years; β are the regression coefficients. The explanatory variables are expressed as follows:
Pr(𝑌𝑖,𝑡 = 1) = 𝐹(𝛽0 + 𝛽1𝐼𝑁𝐷𝐸𝐵𝑇𝑖,𝑡−𝑛 + 𝛽2𝑆𝐼𝑍𝐸𝑖,𝑡−𝑛 + 𝛽3𝐴𝐺𝐸𝑖,𝑡−𝑛 + 𝛽4𝐷𝑜𝑤𝑛𝑖,𝑡−𝑛+ 𝛽5𝐷𝑚𝑢𝑙𝑡 𝑖,𝑡−𝑛
+
𝛽6𝑃𝑅𝑂𝐷𝑖,𝑡−𝑛 + 𝛽7𝑋_𝑟𝑒𝑔𝑖𝑜𝑛𝑖,𝑡−𝑛 + 𝛽8𝑌_𝑠𝑒𝑐𝑡𝑜𝑟𝑖,𝑡−𝑛) (3)
i = 1… m where i is the ith firm. Note that, in our analysis, the explanatory variables are evaluated as average
values over the 2012-2014 years. Moreover, we opt for country-specific model specifications which enable better
results than estimating one mutual model for all countries and provide additional information about the
importance of individual predictors across the selected EU member states. Hence, model (3) is estimated for
each country separately.
With regard to predictor variables, in accordance with the general literature on bankruptcy, the model considers
the financial structure of the firm. The first explanatory variable, given by the Indebtedness score computed in
the first step of the analysis, takes into account the financial health of the firm. Several works find a significant

ijef.ccsenet.org International Journal of Economics and Finance Vol. 9, No. 7; 2017
136
relation between the financial structure of the firms and their probability of default or exit from the market (see,
among others, Molina, 2005; Hovakimian et al., 2012; Graham et al., 2011; Succurro & Mannarino, 2014;
Bonaccorsi di Patti et al., 2014; Behr & Weinblat, 2016).
The model includes other regressors in order to control for additional non-financial characteristics of the firms,
expected to be relevant in determining their probability of default. Both the theoretical and empirical literature
suggests that age and size of the firms impact significantly on their performance. More recent studies also
analyze the effects of productivity, industrial organization and ownership structure on firm performance
performance (for a review, see Klepper & Thompson, 2006).
Therefore, equation (3) includes additional nonfinancial variables reported hereafter.
The variable SIZEi is computed in terms of a firm‟s annual turnover and measured in hundred thousands of
Euros.
The variable AGEi is the age of a firm since its foundation.
D_owni is a dummy variable equal to 1 for fully concentrated ownership (unique partner), 0 otherwise
(fragmented ownership, several partners). It is included as signal of corporate governance.
D_multi is a dummy variable equal to 1 for multinational firms, 0 otherwise. Multinational firms have been
identified through the analysis of ownership data, by selecting companies owning foreign subsidiaries
(ownership share equals 51% by default).
The variable PRODi indicates labor productivity and it is given by value added per employee.
Finally, to take into account the characteristics of the institutional and financial environment in which the firms
operate and the specificities of the industrial sectors, we consider both regional dummies and sector dummies as
explanatory variables, included in the vectors X and Y respectively. The manufacturing sectors are defined to
include firms in the NACE Rev.2 primary codes 10-32, hence the model includes 23 sector dummies. First-level
administrative regional dummies have also been included for each country. They are 18 in France, 16 in
Germany, 20 in Italy, 18 in Portugal, 17 in Spain and 35 in United Kingdom (9 in England, 6 in Northern Ireland,
15 in Scotland and 5 in Wales).
3. Bankruptcies in Western EU: A Descriptive Analysis
Aggregate data show that, even though economic recovery has been resumed recently, Europe has not really
come to rest and the number of corporate insolvencies has increased over the past decade. Despite some positive
signals of economic upturn across the world, the volume of insolvencies in Western Europe remains higher than
it was before the financial crisis (Creditreform, 2016).
The international comparison highlights significant differences among European countries in terms of corporate
insolvencies. Data indicate that, mainly due to its weak economy, France exhibits a relatively high number of
corporate insolvencies in absolute terms over the whole 2011-2015 period (61379 in 2015), followed by
Germany (23180 in 2015) and United Kingdom (15952 in 2015) where, however, the situation has developed
quite differently. Indeed, as signal of economic upturn, data show a systematic reduction in the contribution
made by the last two countries. More fluctuating values are registered in Italy, Spain and Portugal.
To better understand the development of corporate insolvencies in selected countries, Table 1 illustrates the
percentage changes over previous year. Due to significant differences in firms‟ financial structure and taking into
consideration that insolvency procedures and judicial efficiency vary significantly across countries (Succurro,
2012), the effects of the recent international financial crisis on firms‟ bankruptcy have been more relevant in
some countries than in others, as shown by year-on-year percentage variation illustrated in Table 1. Specifically,
only Germany and United Kingdom have been always characterized by negative percent change in failures over
previous year since 2011, while the strongest fall in 2015 has been registered in Spain, with -25.11%. In Italy the
number of corporate insolvencies has in fact increased since 2011 and, in spite of the economic recovery
throughout Europe, the number of corporate insolvencies is still relatively high; a modest reduction has been
registered in 2015 (-0.53%). Two countries still post year-on-year increases in 2015: France (+0.86 percent) and,
with a substantial change, Portugal (+7.60 percent).

ijef.ccsenet.org International Journal of Economics and Finance Vol. 9, No. 7; 2017
137
Table 1. Corporate insolvencies, % variation over previous year
2012/2011 2013/2012 2014/2013 2015/2014
France 20.30 2.39 -0.21 0.86
Germany -4.65 -9.05 -8.00 -3.54
Italy 13.53 15.93 12.82 -0.53
Portugal 27.74 4.74 -16.70 7.60
Spain 31.96 14.55 -26.53 -25.11
UK -4.16 -10.90 -6.73 -9.67
Source: own elaborations on Creditreform data.
It is interesting to observe the trend of the Insolvency Ratio (IR) over time and across the selected countries. The
Insolvency Ratio measures the frequency of defaults, that is the number of corporate bankruptcies per 10,000
active companies.
Figure 1 illustrates the evolution of the Insolvency Ratio over the 2011-2015 years. Bearing in mind the
differences in insolvency legislation and industrial structures in the analyzed Western European countries, the
insolvency rates reveal a greater susceptibility to insolvency on the part of companies in France, while the lowest
values are registered in Spain. Germany and UK register a constant reduction in insolvency ratios, while Italy
and Portugal are characterized by an “inverted-U” trend in frequency of defaults.
Interestingly, data show a decrease of total number of insolvencies per 10,000 companies in the last two years in
all the analyzed countries. Spain registers the highest reduction in 2015 (-37.21%), followed by Germany
(-24.92%), UK (-18.32%), Portugal (-15.65%), France (-15.27%) and Italy (-13.99%).
Hence, although the overall level of insolvencies in Europe is more than twice as high as before the financial
crisis (Creditreform, 2016), a look at aggregate bankruptcy development over time reveals an optimistic
downward trend over recent years.
Figure 1. Insolvency ratio, years 2011-2015
Source: own elaborations on Eurostat data.
Note that corporate insolvencies do not correspond to the total number of business liquidations. There are
differences in the way in which different status of a firm or bankruptcies of self-employed people are handled in
insolvency statistics. Moreover, in many countries, insolvent micro-enterprises are often closed down without
any regular insolvency proceeding. Hence, aggregate data on bankruptcy have to be interpreted with caution.
Despite the differences regarding the country-specific reporting procedures, the Orbis-Europe Database,
published by Bureau Van Dijk, allows international comparison through the harmonization of accounting data.
Hence, our empirical analysis, based on accounting data taken from the Orbis database, is carried out on the
balance sheets and income statements over the years 2012-2014 in order to analyze the characteristics of
0.00
50.00
100.00
150.00
200.00
250.00
2011 2012 2013 2014 2015
Germany Spain France Italy Portugal UK

ijef.ccsenet.org International Journal of Economics and Finance Vol. 9, No. 7; 2017
138
manufacturing firms affecting their probability of default in 2015. Moreover, since small sample size appears to
be a limitation and any model should be as relevant as possible to the population to which it will eventually be
applied (Altman et al., 1977), we consider the manufacturing companies as a whole and include micro, small,
medium and large firms in a very large industry sample built across Western European countries. After dealing
with numerous missing data, financial statement information and accounting data availability, we build up an
appropriate database including both active and inactive manufacturing firms in the following countries: France,
Germany, Italy, Portugal, Spain and United Kingdom.
Table 2 gives an overview of the total number of bankruptcies and the share of defaulting firms in manufacturing
sectors by country in 2015. The share of defaults is very country-specific and changes from one year to another.
Since inactive firms are erased from the Orbis database two years after bankruptcy, it is possible to compute and
illustrate the bankruptcy rate just for the last available year. The final 2015 sample includes 114,484 defaulting
firms and 1,033,661 non-defaulting firms. The highest bankruptcy share can be found in France and Italy,
followed by Spain; relatively lower values are registered in Germany, UK and Portugal.
The relative frequencies in our data are comparable to those found in other empirical studies (see, for example,
Behr & Weinblat, 2016). Some potential differences are attributable to different definition of defaulting firm.
Table 2. Bankruptcies in manufacturing sectors, year 2015
Defaulting Firms Non-defaulting firms Total Bankruptcy share (%)
France 23,225 118,595 141,820 16.38
Germany 3,815 196,281 200,096 1.91
Italy 54,446 307,008 361,454 15.06
Portugal 2,270 41,869 44,139 5.14
Spain 23,338 161,648 184,986 12.62
UK 7,390 208,260 215,650 3.43
Total 114,484 1,033,661 1,148,145 9.97
Source: own elaborations on Orbis-Europe database.
The European manufacturing firms included in the sample operate in different sectors and they significantly
differ in size, measured in terms of annual turnover according to the European Union classification (Commission
Recommendation 96/280/EC, updated in 2003/361/EC of May 6, 2003). In particular, we can consider four
groups of firms on the basis of their relative size: micro firms (turnover<€2 mln); small firms (€2 mln
<turnover<€10 mln); medium-sized firms (€10 mln <turnover<€50 mln); large firms (turnover>€50 mln).
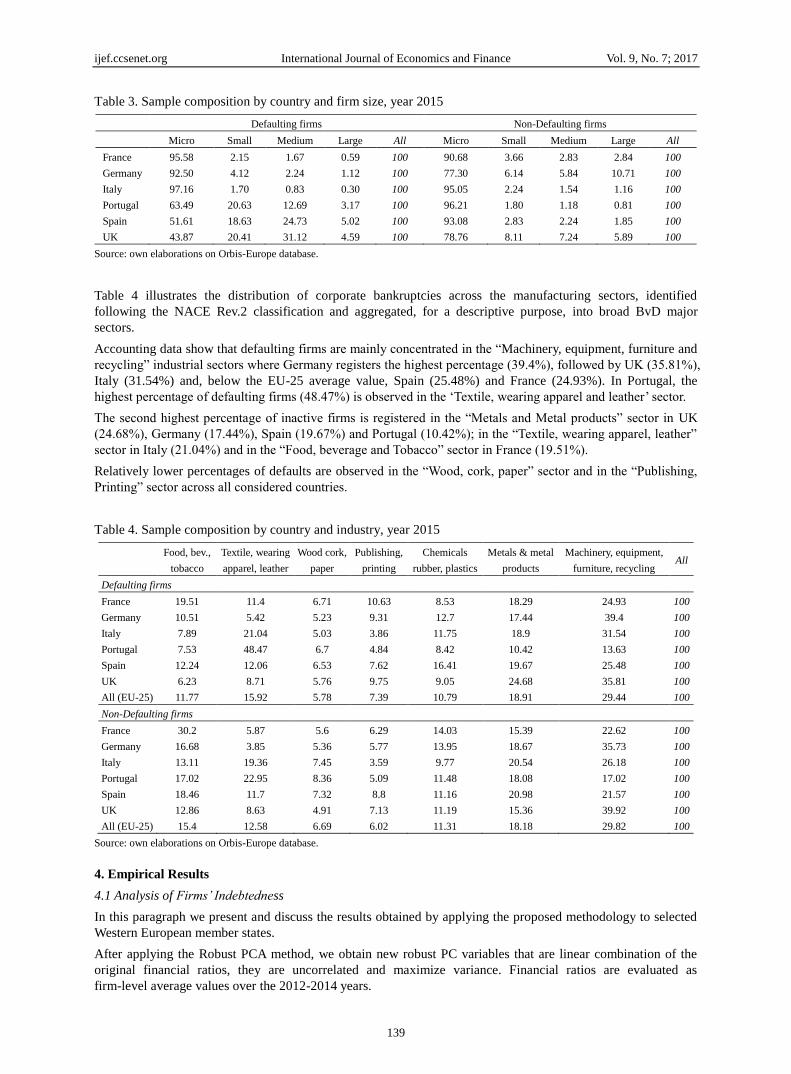
The composition of the sample by country and firm size is provided in Table 3. Data show that micro and small
firms are particularly susceptible to bankruptcy, while there would be a lower concentration of bankruptcies
among large firms. More specifically, the percentage of defaulting micro firms is relatively higher than the
percentage of non-defaulting micro enterprises in France (with a difference of 4.9 percentage points), Germany
(with a difference of 15.2 percentage points) and Italy (with a difference of 2.11 percentage points). Analogously,
the percentage of defaulting small firms is relatively higher than that of non-defaulting small enterprises in
Portugal, Spain and UK, with an even larger difference between the two groups of inactive and active companies
in these countries.
Notice that, looking at the active firms, all the countries show a similar sample composition by size, that is the
percentage of companies decreases as the firm size increases, with a significant role played by small and micro
enterprises. With the exception of Germany, the selected European countries are characterized by a traditional
dichotomous structure, with a very large number of small and micro firms and a very small number of large
firms.
Looking at the inactive firms, on the contrary, we find a more heterogeneous sample composition by firm size.
While Portugal, Spain and UK register a relevant number of bankruptcies also among medium size firms and
large companies, France, Germany and Italy post relatively lower default ratios among larger companies, despite
significant differences in their industrial structure and insolvency legislation (Succurro, 2012).
ijef.ccsenet.org International Journal of Economics and Finance Vol. 9, No. 7; 2017
139
Table 3. Sample composition by country and firm size, year 2015
Defaulting firms Non-Defaulting firms
Micro Small Medium Large All Micro Small Medium Large All
France 95.58 2.15 1.67 0.59 100 90.68 3.66 2.83 2.84 100
Germany 92.50 4.12 2.24 1.12 100 77.30 6.14 5.84 10.71 100
Italy 97.16 1.70 0.83 0.30 100 95.05 2.24 1.54 1.16 100
Portugal 63.49 20.63 12.69 3.17 100 96.21 1.80 1.18 0.81 100
Spain 51.61 18.63 24.73 5.02 100 93.08 2.83 2.24 1.85 100
UK 43.87 20.41 31.12 4.59 100 78.76 8.11 7.24 5.89 100
Source: own elaborations on Orbis-Europe database.
Table 4 illustrates the distribution of corporate bankruptcies across the manufacturing sectors, identified
following the NACE Rev.2 classification and aggregated, for a descriptive purpose, into broad BvD major
sectors.
Accounting data show that defaulting firms are mainly concentrated in the “Machinery, equipment, furniture and
recycling” industrial sectors where Germany registers the highest percentage (39.4%), followed by UK (35.81%),
Italy (31.54%) and, below the EU-25 average value, Spain (25.48%) and France (24.93%). In Portugal, the
highest percentage of defaulting firms (48.47%) is observed in the „Textile, wearing apparel and leather‟ sector.
The second highest percentage of inactive firms is registered in the “Metals and Metal products” sector in UK
(24.68%), Germany (17.44%), Spain (19.67%) and Portugal (10.42%); in the “Textile, wearing apparel, leather”
sector in Italy (21.04%) and in the “Food, beverage and Tobacco” sector in France (19.51%).
Relatively lower percentages of defaults are observed in the “Wood, cork, paper” sector and in the “Publishing,
Printing” sector across all considered countries.
Table 4. Sample composition by country and industry, year 2015
Food, bev.,
tobacco
Textile, wearing
apparel, leather
Wood cork,
paper
Publishing,
printing
Chemicals
rubber, plastics
Metals & metal
products
Machinery, equipment,
furniture, recycling All
Defaulting firms
France 19.51 11.4 6.71 10.63 8.53 18.29 24.93 100
Germany 10.51 5.42 5.23 9.31 12.7 17.44 39.4 100
Italy 7.89 21.04 5.03 3.86 11.75 18.9 31.54 100
Portugal 7.53 48.47 6.7 4.84 8.42 10.42 13.63 100
Spain 12.24 12.06 6.53 7.62 16.41 19.67 25.48 100
UK 6.23 8.71 5.76 9.75 9.05 24.68 35.81 100
All (EU-25) 11.77 15.92 5.78 7.39 10.79 18.91 29.44 100
Non-Defaulting firms
France 30.2 5.87 5.6 6.29 14.03 15.39 22.62 100
Germany 16.68 3.85 5.36 5.77 13.95 18.67 35.73 100
Italy 13.11 19.36 7.45 3.59 9.77 20.54 26.18 100
Portugal 17.02 22.95 8.36 5.09 11.48 18.08 17.02 100
Spain 18.46 11.7 7.32 8.8 11.16 20.98 21.57 100
UK 12.86 8.63 4.91 7.13 11.19 15.36 39.92 100
All (EU-25) 15.4 12.58 6.69 6.02 11.31 18.18 29.82 100
Source: own elaborations on Orbis-Europe database.
4. Empirical Results
4.1 Analysis of Firms’ Indebtedness
In this paragraph we present and discuss the results obtained by applying the proposed methodology to selected
Western European member states.
After applying the Robust PCA method, we obtain new robust PC variables that are linear combination of the
original financial ratios, they are uncorrelated and maximize variance. Financial ratios are evaluated as
firm-level average values over the 2012-2014 years.

ijef.ccsenet.org International Journal of Economics and Finance Vol. 9, No. 7; 2017
140
The percentage of variance explained by each Robust PC is computable from the robust eigenvalues given by the
Robust PCA algorithm. As expected, for all the countries the first robust principal component represents the most
important dimension in explaining changes of financial conditions since it explains 82.5% of the total variance.
Thus, we employ RPC1 to estimate the coefficients 𝛼𝑖 of the proposed Indebtedness Index (1), reported in Table
5.
The multi-country analysis indicates the relatively greater importance of the indebtedness capacity of the firm,
given by the ratio FD/N, which reports the highest estimated coefficient in all the selected countries, followed by
the ratio between Interest Paid and EBIT.
Table 5. Indebtedness index - principal component analysis by country
France
INDEBTINDEX = 0.641𝐹𝐷
𝑁+ 0.061
𝐶𝐿
𝐹𝐷+ 0.004
𝐹𝐷
𝐶𝐹+ 0.026
𝐶𝐿
𝐶𝐴+ 0.045
𝑁𝑇𝐶𝐴
𝑁+ 0.076
𝑇𝐹𝐴
𝐿𝑇𝐷+𝑁+ 0.186
𝐼𝑃
𝐸𝐵𝐼𝑇
𝛼𝑖 ∊ R; 𝑖 = 1,2, … ,7
Germany
INDEBTINDEX = 0.881𝐹𝐷
𝑁+ 0.042
𝐶𝐿
𝐹𝐷+ 0.008
𝐹𝐷
𝐶𝐹+ 0.032
𝐶𝐿
𝐶𝐴+ 0.033
𝑁𝑇𝐶𝐴
𝑁+ 0.055
𝑇𝐹𝐴
𝐿𝑇𝐷+𝑁+ 0.198
𝐼𝑃
𝐸𝐵𝐼𝑇
𝛼𝑖 ∊ R; 𝑖 = 1,2, … ,7
Italy
INDEBTINDEX = 0.921𝐹𝐷
𝑁+ 0.071
𝐶𝐿
𝐹𝐷+ 0.012
𝐹𝐷
𝐶𝐹+ 0.046
𝐶𝐿
𝐶𝐴+ 0.025
𝑁𝑇𝐶𝐴
𝑁+ 0.065
𝑇𝐹𝐴
𝐿𝑇𝐷+𝑁+ 0.206
𝐼𝑃
𝐸𝐵𝐼𝑇
𝛼𝑖 ∊ R; 𝑖 = 1,2, … ,7
Portugal
INDEBTINDEX = 0.746𝐹𝐷
𝑁+ 0.081
𝐶𝐿
𝐹𝐷+ 0.006
𝐹𝐷
𝐶𝐹+ 0.022
𝐶𝐿
𝐶𝐴+ 0.037
𝑁𝑇𝐶𝐴
𝑁+ 0.009
𝑇𝐹𝐴
𝐿𝑇𝐷+𝑁+ 0.123
𝐼𝑃
𝐸𝐵𝐼𝑇
𝛼𝑖 ∊ R; 𝑖 = 1,2, … ,7
Spain
INDEBTINDEX = 0.842𝐹𝐷
𝑁+ 0.071
𝐶𝐿
𝐹𝐷+ 0.011
𝐹𝐷
𝐶𝐹+ 0.021
𝐶𝐿
𝐶𝐴+ 0.032
𝑁𝑇𝐶𝐴
𝑁+ 0.059
𝑇𝐹𝐴
𝐿𝑇𝐷+𝑁+ 0.201
𝐼𝑃
𝐸𝐵𝐼𝑇
𝛼𝑖 ∊ R; 𝑖 = 1,2, … ,7
UK
INDEBTINDEX = 0.652𝐹𝐷
𝑁+ 0.058
𝐶𝐿
𝐹𝐷+ 0.009
𝐹𝐷
𝐶𝐹+ 0.030
𝐶𝐿
𝐶𝐴+ 0.044
𝑁𝑇𝐶𝐴
𝑁+ 0.066
𝑇𝐹𝐴
𝐿𝑇𝐷+𝑁+ 0.179
𝐼𝑃
𝐸𝐵𝐼𝑇
𝛼𝑖 ∊ R; 𝑖 = 1,2, … ,7
Source: own elaborations on Orbis-Europe database.
Figure 2 illustrates the average value of the Indebtedness index over the 2012-2014 period by country. In each
sub-sample we distinguish between defaulting and non-defaulting firms (with the status of the firm evaluated in
2015).
Accounting data show a relatively larger accumulation of financial debt by defaulting firms - especially in the
form of bank loans – than by active firms. This holds for all the selected countries. Hence, the comparative
analysis would signal that, in the run-up to the financial bankruptcy, (ex-post) defaulting firms significantly
increase their indebtedness in absolute terms, therefore becoming more vulnerable to bankruptcy.
Aggregate firm level data also show some differences among countries. Interestingly, the percentage difference
in the Indebtedness score between defaulting and non-defaulting firms is systematically larger in bank-based
economies (0.39% in Germany, 0.35% in Italy, followed by 0.25% in Spain and 0.24% in Portugal) than in
market-based economies (0.20% in UK and 0.16% in France).

ijef.ccsenet.org International Journal of Economics and Finance Vol. 9, No. 7; 2017
141
Figure 2. Indebtedness score by country - average values, years 2012-2014
Source: own elaborations on Orbis-Europe database.
4.2 Econometric Results
Table 6 shows country-specific logit estimates of model (3) for selected Western European countries.
By applying the default definition provided in paragraph 2.2, the work focuses on two groups of firms,
defaulting firms and non-defaulting firms, representing 9.97% and 90.03% of the whole sample respectively.
Given the non-linearity of the first-order conditions with respect to parameters, a solution of numerical
approximation is adopted that reaches the convergence after five reiterations for France, Italy and Spain; after
four reiterations for Germany, Portugal and UK. Table 6 reports the maximized value of the log-likelihood
function for all the regressions.
Our empirical findings show that the Indebtedness score is statistically significant at 1% level with a positive
sign. Hence, an increase in firm‟s debt level and/or in its unsustainability significantly increases the probability
of default. Interestingly, the indebtedness score enters all the regressions with the highest coefficient and level of
significance.
However, while the indebtedness score is a valuable bankruptcy predictor for Italy, Germany, Portugal and Spain,
which are bank-based economies, it is relatively less important for France and UK, being countries more
strongly oriented toward the financial market. This result is in line with Succurro and Mannarino (2014).
Table 6 also reports the odds ratios of the logistic regression, which coincide with the exponential value of the
estimated parameters. Considering Italy, for example, for a unit increase in the Indebtedness score, the odds of
bankruptcy increases by 48%, holding the other variables constant. In other words, firms that are exposed to high
debt are more than 1.48 times (e0.398
) likely to fail than the other firms in Italy, 1.35 times in Spain, 1.30 in
Germany and in Portugal, while they are more than 1.20 times and 1.17 times likely to fail than the other firms in
France and UK respectively.
In this context, the monitoring of the indebtedness score could be used as an early warning signal of default risk
and it could assume a pivotal role in the adoption of effective reorganization procedures, coherently with the
bankruptcy law and procedures adopted in each country.
With reference to the other explanatory variables, firm size enters with negative sign at 10% level of significance
for Italy and Spain, therefore larger companies would face lower probability of default in these countries. It is
argued that large companies are less prone to fail because of easier access to the credit market (Succurro &
Mannarino, 2014); on the contrary, smaller firms are expected to have less possibilities to react to a financial
crisis. Firm size would not be significant in explaining bankruptcy in the other analyzed countries. Hence, the
empirical findings on the impact of firm size on failure are contrasting.
Age enters at 1% level with negative sign, suggesting that younger firms are more likely to go to bankruptcy
0
1
2
3
4
5
6
7
France Germany Italy Portugal Spain UK
Defaulting firms Non-Defaulting firms

ijef.ccsenet.org International Journal of Economics and Finance Vol. 9, No. 7; 2017
142
than older companies and this result, valid across countries, confirms previous empirical findings on the impact
of age on firm performance (Hurst & Pugsley, 2011; Haltiwanger, 2013; Fort et al., 2013; Ferretti et al., 2016).
Empirical studies on developed economies generally find negative correlation between bankruptcy and age.
Possible reasons are a higher experience of the management and longer and stable relationships with clients and
investors characterizing older firms.
The results on the effect of ownership concentration and labor productivity on firm failure suggest that these
variables would not be significant in explaining firm default across countries. On the contrary, being a
multinational firm would impact significantly and negatively on the probability of bankruptcy in all the
regressions, presumably due to the diversification of risk among different markets worldwide.
Table 6. Probability of default: Logit estimates
France Germany Italy Spain Portugal UK
Coeff. β Odds
Ratio eβ Coeff. β
Odds
Ratio eβ Coeff. β
Odds
Ratio eβ Coeff. β
Odds
Ratio eβ Coeff. β
Odds
Ratio eβ Coeff. β
Odds
Ratio eβ
INDEBT 0.186***
(0.038)
1.204***
(0.052)
0.264***
(0.042)
1.302***
(0.055)
0.398***
(0.057)
1.488***
(0.083)
0.301***
(0.038)
1.351***
(0.045)
0.266***
(0.037)
1.304***
(0.049)
0.164***
(0.042)
1.178***
(0.053)
SIZE 0.123
(0.034)
1.130
(0.046)
0.075
(0.041)
1.077
(0.054)
-0.134*
(0.065)
0.874*
(0.057)
-0.065*
(0.042)
0.937*
(0.064)
0.013
(0.044)
1.013
(0.045)
0.095
(0.061)
1.099
(0.064)
AGE -0.172***
(0.034)
0.841***
(0.022)
-0.082*
(0.044)
0.921*
(0.042)
-0.262***
(0.066)
0.769***
(0.050)
-0.183*
(0.036)
0.832*
(0.044)
-0.186***
(0.044)
0.830***
(0.037)
-0.060*
(0.044)
0.941*
(0.042)
D_own 0.138
(0.106)
1.147
(0.092)
0.234
(0.087)
1.263
(0.124)
-0.034
(0.150)
0.965
(0.145)
0.144
(0.082)
1.154
(0.134)
0.157
(0.104)
1.169
(0.122)
0.244
(0.097)
1.276
(0.134)
D_mult -0.151***
(0.106)
0.859***
(0.059)
-0.149***
(0.084)
0.861***
(0.064)
-0.258*
(0.141)
0.772*
(0.109)
-0.249**
(0.064)
0.779**
(0.055)
-0.179***
(0.106)
0.836***
(0.059)
-0.147**
(0.094)
0.863**
(0.051)
PROD -0.092
(0.062)
0.912
(0.059)
-0.127
(0.086)
0.880
(0.076)
0.074
(0.124)
1.077
(0.134)
-0.118
(0.086)
0.888
(0.076)
-0.032
(0.082)
0.967
(0.079)
-0.107
(0.083)
0.898
(0.056)
Regional dummies included included included included included included included included included included included included
Sector dummies included included included included included included included included included included included included
Constant -2.040***
(0.606)
-2.462***
(0.762)
-3.415**
(1.258)
-2.101***
(0.562)
-2.846***
(0.946)
-3.280***
(0.791)
N of obs. 68633 96835 174924 89523 21360 104341
Log-likelih. -36690.83 -51775.08 -93529.44 -47866.48 -12093.08 -55785.06
Pseudo R2 19.84 16.31 19.77 18.08 17.38 15.31
LR Chi-square(n) 1649.93 1566.08 1730.06 1586.04 1608.24 1989.07
Prob>Chi-sq 0.000 0.000 0.000 0.000 0.000 0.000
Note. All variables in logs. Standard errors in parenthesis. Significance levels: *10%; **5%; ***1%.
To have a complete picture, we have also estimated the predicted default probability by country assuming similar
conditions to those prevailing in the analysed period.
Table 7 shows the predicted default probabilities for the representative firm in selected member states where the
representative firm is identified, in each country, by considering all explanatory variables at their mean values.
With the necessary caution in the interpretation of results due to firm heterogeneity as well as differences in
bankruptcy systems across countries, the empirical findings would suggest a higher failure risk among firms
operating in Italy (4.7%), France (4%) and Spain (3.6%), somehow confirming the data on bankruptcy shares
reported in Table 2. Germany and Portugal follow with a predicted default probability equal to 3.4% and 2.8%
respectively. The lowest probability is registered in UK (1.6%).
Table 7. Predicted default probabilities – representative firm
France Germany Italy Spain Portugal UK
Pr(yi=1) 0.040 0.034 0.047 0.036 0.028 0.016
Source: own calculations on Orbis-Europe database.

ijef.ccsenet.org International Journal of Economics and Finance Vol. 9, No. 7; 2017
143
We have further evaluated the reliability of the proposed model. We have first computed the percentage of
overall correct classifications, which gives us the percent of correct predicted probabilities of our model, and it
varies between 92.4% for UK and 97.24% for Italy.
We have assessed the model‟s ability to accurately classify observations using a receiver operating characteristic
(ROC) curve. A ROC curve is constructed by generating several classification tables for cutoff values ranging
from 0 to 1 and calculating the sensitivity and specificity for each value. Sensitivity is plotted against 1, to make
a ROC curve. The area under the ROC curve (AUC) is a measure of discrimination; a model with a high area
under the ROC curve suggests that the model can accurately predict the value of an observation‟s response. Our
model provides outstanding discrimination since the AUC for France, Germany, Italy, Portugal, Spain and UK is
0.83, 0.79, 0.89, 0.72, 0.81 and 0.78 respectively (Note 1).
Finally, to test the model fit, Hosmer and Lemeshow‟s test was evaluated. A good fit will yield a large p-value.
With a p-value of 0.63, our model fits the data well.
In brief, the overall evidence highlights a good reliability of our model for the prediction of corporate
bankruptcies across Europe.
5. Conclusions
The recent international financial crisis has highlighted a general need to predict insolvency and financial failure
on-time in order to take corrective and remedial measures for protecting business from the problem of
bankruptcy. Coherently, the aim of this research is to describe corporate bankruptcy across Western European
countries and propose a simple but reliable default prediction model for private manufacturing firms in six EU
member states. The research is based on firm-level accounting data taken from the Orbis-Europe Database,
published by Bureau Van Dijk.
The proposed model can be easily used in practice and is consistent with the spirit of firm rehabilitation and
going-concern considerations. Indeed, despite several differences across countries‟ bankruptcy systems, the
principal focus of modern insolvency legislation and business debt restructuring practices rests on the
remodeling of the financial and organizational structure of debtors experiencing financial distress, so as to permit
the rehabilitation of their firms.
Several studies show that a firm‟s financial condition is better evaluated by considering several aspects of the
indebtedness phenomenon than by using a single financial ratio. The choice of the best predictors among the
large number of financial indicators suitable for predicting firms‟ bankruptcy has been guided by theoretical
background, personal judgment, statistical methods and empirical findings obtained in previous studies.
Following this approach, we first propose a simple Indebtedness index which considers the multifaceted aspects
of debt. Since financial data are often characterized by asymmetric distribution, we apply a Robust Principal
Component Analysis (RPCA) technique to treat such data. The final indebtedness score obtained through this
statistical procedure is a signal of firms‟ creditworthiness and allows to easily evaluate and compare firm‟s
financial health across countries, industrial sectors and over time. An interesting finding, valid across countries,
is the relatively larger accumulation of financial debt by defaulting firms than by active firms. Moreover, the
percentage difference in the Indebtedness score between defaulting and non-defaulting firms is systematically
larger in bank-based economies than in market-based economies.
Second, we estimate a logit model, based on both the first step computed indebtedness score and additional
non-financial firms‟ characteristics, which allows to compute specific predicted probabilities of default in each
country. The work is carried out on the balance sheets and income statements over the 2012-2014 period in order
to analyze the characteristics of the firms affecting their probability of default in 2015. We opt for
country-specific model specifications which enable better results than estimating one mutual model for all
countries and provide additional information about the importance of individual predictors across the selected
EU member states. Our empirical findings show that the Indebtedness score is statistically significant in
explaining bankruptcy, it enters all the regressions with the highest coefficient and level of significance. As it is
expected, an increase in firm‟s debt level significantly increases the probability of default. However, while the
indebtedness score is a valuable bankruptcy predictor for Italy, Germany, Portugal and Spain, which are
bank-based economies, it is relatively less important for France and UK, being countries more strongly oriented
toward the financial market. In this context, the monitoring of the indebtedness score could be used as an early
warning signal of default risk and it could assume a pivotal role in the adoption of effective reorganization
procedures, coherently with the bankruptcy law and procedures adopted in each country.
With reference to the other econometric results, larger companies would face lower probability of default in Italy
ijef.ccsenet.org International Journal of Economics and Finance Vol. 9, No. 7; 2017
144
and Spain, presumably because of easier access to the credit market in these countries, while size is not
significant in explaining firm default in other countries. We also find a negative correlation between bankruptcy
and age, possible reasons being a higher experience of the management and longer and stable relationships with
clients and investors characterizing older firms. Ownership concentration and labor productivity would not be
significant in explaining firm default across countries, while being a multinational firm would impact
significantly and negatively on the probability of bankruptcy in all the regressions, presumably due to the
diversification of risk among different markets worldwide.
The overall evidence highlights a good reliability of our multi-country model for the prediction of corporate
bankruptcies across Western Europe. It would be interesting to evaluate to what extent the proposed model can
be enlarged to Eastern European countries or to other non EU-countries. The practical use of this research
extension would be valuable for scholars, entrepreneurs, managers, financiers and regulatory agencies.
References
Agarwal, V., & Taffler, R. (2008). Comparing the Performance of Market-based and Accounting based
Bankruptcy Prediction Models. Journal of Banking and Finance, 32(8), 1541-1551.
http://dx.doi.org/10.1016/j.jbankfin.2007.07.014
Altman, E. (1968). Financial ratios, discriminant analysis & the prediction of corporate bankruptcy. The Journal
of Finance, 23(4), 589-609. https://doi.org/10.1111/j.1540-6261.1968.tb00843.x
Altman, E. I. (2000). Predicting financial distress of companies: Revisiting the Z-score and ZTM model. Working
Paper, New York University.
Altman, E. I., Haldeman, R., & Narayanan, P. (1977). ZETA analysis: A new model to identify bankruptcy risk
of corporations. Journal of Banking and Finance, 10, 29-54. https://doi.org/10.1016/0378-4266(77)90017-6
Altman, E. I., Malgorzata, I. D., Erkki, K. L., & Arto, S. (2016). Distressed Firm and Bankruptcy Prediction in
an International Context: A Review and Empirical Analysis of Altman‟s Z-Score Model. Journal of
International Financial Management & Accounting.
Amendola, A., Pellecchia, A., Restaino, M., & Sensini, L. (2012). Corporate financial distress in the European
construction industry: A logit approach. 5th Annual Euromed Conference of the Euromed Academy of
Business, Montreaux, Switzerland.
Amendola, A., Restaino, M., & Sensini L. (2013). Corporate Financial Distress And Bankruptcy: A Comparative
Analysis In France, Italy and Spain. Global Economic Observer, 1, 131-142
Amendola, A., Restaino, S., & Sensini L. (2015). An analysis of the determinants of financial distress in Italy: A
competing risks approach. International Review of Economics and Finance, 37, 33-41.
https://doi.org/10.1016/j.iref.2014.10.012
Andreeva, G., Calabrese, R., & Osmetti, S.A. (2016). A Comparative Analysis of the UK and Italian Small
Businesses Using Generalised Extreme Value Models. European Journal of Operational Research, 249(2),
506-516. https://doi.org/10.1016/j.ejor.2015.07.062
Aziz, M. A., & Dar, H. A. (2006). Predicting corporate bankruptcy: Where we stand? Corporate Governance,
6(1), 18-33. DOI: http://dx.doi.org/10.1108/14720700610649436
Balcaen, S., & Ooghe, H. (2006). 35 years of studies on business failure: An overview of the classical statistical
methodologies and their related problems. The British Accounting Review, 38(1), 63-93.
https://doi.org/10.1016/j.bar.2005.09.001
Beaver, W. (1967). Financial ratios as predictors of failures. Journal of Accounting Research, 71-111.
https://doi.org/10.2307/2490171
Behr, A., & Weinblat, J. (2016). Default Patterns in Seven EU Countries: A Random Forest Approach.
International Journal of the Economics of Business. https://doi.org/10.1080/13571516.2016.1252532
Bellovary, J., Giacomino, D., & Akers, M. (2007). A review of bankruptcy prediction studies: 1930 to present.
Journal of Financial Education, 33(5), 1-42.
Benli, V. F. (2010). A Critical Assessment of Basel II, Internal Rating Based Approach: Implementation in
Emerging Markets: The Case of Turkey. Bern: Haupt Verlag AG.
Berk, J., Stanton, R., & Zechner, J. (2010). Human capital, bankruptcy, and capital structure. Journal of Finance,
65(3), 891-926. https://doi.org/10.1111/j.1540-6261.2010.01556.x

ijef.ccsenet.org International Journal of Economics and Finance Vol. 9, No. 7; 2017
145
Bonaccorsi di Patti, E., D‟Ignazio, A., Gallo, M., & Micucci, G. (2014). The role of leverage in firm solvency:
Evidence from bank loans. Questioni di Economia e Finanza, 244.
Creditreform. (2016). Corporate insolvencies in Europe. 2015/2016.
Cultrera, L., & Bauweraerts, J. (2017). Exploring Corporate Bankruptcy in Belgian Private Firms. International
Journal of Economics and Finance, 3, 2017. https://doi.org/10.5539/ijef.v9n3p108
Deakin E.B. (1972). A Discriminant Analysis of Predictors of Business Failure. Journal of Accounting Research,
10(1), 167-179. https://doi.org/10.2307/2490225
Dimitras, A. I., Slowinski, R., Susmaga, R., & Zopounides, C. (1999). Business failure prediction using rough
sets. European Journal of Operational Research, 114(2), 263-280.
https://doi.org/10.1016/S0377-2217(98)00255-0
Dimitras, A. I., Zanakis, S. H., & Zopoudinis, C. (1996). A survey of business failures with an emphasis on
failure prediction methods and industrial applications. European Journal of Operational Research, 90(3),
487-513. http://dx.doi.org/10.1016/0377-2217(95)00070-4
Duffie, D., Saita, L., & Wang, K. (2007). Multi-period corporate default prediction with stochastic covariates.
Journal of Financial Economics, 83(3), 635-665. https://doi.org/10.1016/j.jfineco.2005.10.011
Ferretti, S., Filippone, A., & Micucci, G. (2016). Le imprese uscite dal mercato nel corso della crisi. Banca
d’Italia Occasional Papers, n.317.
Fort, T. C., Haltiwanger, J., Jarmin, R. S., & Miranda, J. (2013). How Firms respond to Business Cycles: The
Role of Firm Age and Firm Size. NBER Working Papers, 19134.
Graham J., Hazarika, S., & Narasimhan, K. (2011). Financial Distress in the Great Depression. NBER Working
Papers, 17388. https://doi.org/10.1111/j.1755-053x.2011.01163.x
Grunert, J., Norden, L., & Weber, M. (2004). The Role of Nonfinancial Factors in Internal Credit ratings.
Journal of Banking and Finance, 29(2), 509-531. https://doi.org/10.1016/j.jbankfin.2004.05.017
Haltiwanger, J. (2013). What is the Contribution of Entrepreneurs to Jobs and Productivity? mimeo.
Hovakimian, A., Kayan, A., & Titman, S. (2011). Are Corporate Default Probabilities Consistent with the Static
Trade-off Theory? The Review of Financial Studies, 25(2), 315-40. https://doi.org/10.1093/rfs/hhr101
Hubert, M., Rousseeuw, P., & Verdonck, T. (2009). Robust PCA for Skewed data and its outlier map.
Computational Statistics and Data Analysis, 53, 2264-2274. https://doi.org/10.1016/j.csda.2008.05.027.
Hurst, E., & Pugsley, B. (2011). What do Small Business do?. Brooking Papers on Economic Activity, 43(2),
73-142. https://doi.org/10.1353/eca.2011.0017
Jackson, R. H. G., & Wood, A. (2013). The Performance of Insolvency Prediction and Credit Risk Models in the
U.K: A Comparative Study. The British Accounting Review, 45(3), 183-202.
http://dx.doi.org/10.1016/j.bar.2013.06.009.
Jones, S., Johnstone, D., & Wilson, R. (2017). Predicting Corporate Bankruptcy: An Evaluation of Alternative
Statistical Frameworks. Journal of Business Finance and Accounting, 44(1), 3-33.
https://doi.org/10.1111/jbfa.12218
Kim, M. J., & Kang, D. K. (2010). Ensemble with neural networks for bankruptcy prediction. Expert Systems
with Applications, 37(4), 3373-3379. https://doi.org/10.1016/j.eswa.2009.10.012
Klepper, S., & Thompson, P. (2006). Submarkets and the Evolution of Market Structure. The RAND Journal of
Economics, 37, 861-86. https://doi.org/10.1111/j.1756-2171.2006.tb00061.x
Kolodner, J. (1993). Case-Based Reasoning. San Mateo, CA: Morgan Kaufmann Publishers Inc.
https://doi.org/10.1016/b978-1-55860-237-3.50005-4
Molina, C. A. (2005). Are Firms Underleveraged? An Examination of the Effect of Leverage on Default
Probabilities. Journal of Finance, LV(3), 1427-59. https://doi.org/10.1111/j.1540-6261.2005.00766.x
Nanni, L., & Lumini, A. (2009). An Experimental Comparison of Ensemble of Classifiers for Bankruptcy
Prediction and Credit Scoring. Expert Systems with Applications, 36(2), 3028-3033.
https://doi.org/10.1016/j.eswa.2008.01.018
Odom, M., & Sharda, R. (1990). A neural network model for bankruptcy prediction. Proceedings of the IEEE
International Conference on Neural Network, 2, 163-168. https://doi.org/10.1109/ijcnn.1990.137710

ijef.ccsenet.org International Journal of Economics and Finance Vol. 9, No. 7; 2017
146
Pervan, I., & Kuvek, T. (2013). The relative importance of financial ratios and nonfinancial variables in
predicting of insolvency. Croatian Operational Research Review, 4, 187-198.
Ramser, J.R.. & Foster, L.O.. (1931). A Demonstration of Ratio Analysis. Bureau of Business Research Bulletin,
40, University of Illinois.
Ravi Kumar, P., & Ravi, V. (2007). Bankruptcy prediction in banks and firms via statistical and intelligent
techniques – A review. European Journal of Operational Research, 180, 1-28.
https://doi.org/10.1016/j.ejor.2006.08.043.
Rommer, A. D. (2005). A comparative analysis of the determinants of financial distress in French, Italian and
Spanish firms. Danmarks Nationalbank Working paper n.26., 1-76.
Sensini, L. (2015). Selection of determinants in Corporate Financial Distress. European Journal of Business and
Management, 7(2), 73-82.
Sensini, L. (2016). An empirical analysis of Financially Distressed Italian Companies. International Business
Research, 9(10), 75-85. https://doi.org/10.5539/ibr.v9n10p75
Shin, K. S., & Lee, Y. J. (2002). A genetic algorithm application in bankruptcy prediction modeling. System
Experts with Applications, 23(3), 637-646. https://doi.org/10.1016/S0957-4174(02)00051-9
Shumway, T. (2001). Forecasting bankruptcy more accurately: A simple hazard model. Journal of Business,
74(1), 101-124. http://dx.doi.org/10.1086/209665
Smith, F.R.. & Winakor, A.H.. (1935). Changes in Financial Structure of Unsuccessful Corporations. Bureau of
Business Research, 31.
Succurro, M. & Mannarino, L. (2014). The Impact of Financial Structure on Firms‟ Probability of Bankruptcy: A
Comparison across Western Europe Convergence Regions. Eers. Estudios Económicos Regionales y
Sectoriales, 14(1), 81-94.
Succurro, M. (2012). Bankruptcy Systems and Economic Performance across Countries: Some empirical
evidence. European Journal of Law and Economics, 33, 101-126.
https://doi.org/10.1007/s10657-009-9138-2
Varetto, F. (1998). Genetic algorithms applications in the analysis of insolvency risk. Journal of Banking and
Finance, 22, 1421-39. https://doi.org/10.1016/S0378-4266(98)00059-4
Wall, A. (1936). How to evaluate financial statements. Harper. New York.
Xie, Y. A., Shi, J., & Wu, C. (2008). Do macroeconomic variables matter for pricing default risk. International
Review of Economics and Finance, 17, 279-291. https://doi.org/10.1016/j.iref.2006.08.006
Zeitun, R. (2009). Ownership structure, corporate performance and failure: Evidence from panel data of
emerging market: The case of Jordan. Corporate Ownership and Control, 6(4), 96-114.
https://doi.org/10.22495/cocv6i4p10
Zmijewski, M. E. (1984). Methodological issues related to the estimation of financial distress prediction models.
Journal of Accounting Research, 22, 59-82. http://dx.doi.org/10.2307/2490859
Note
Note 1. All the ROC curves are available upon request.
Copyrights
Copyright for this article is retained by the author(s), with first publication rights granted to the journal.
This is an open-access article distributed under the terms and conditions of the Creative Commons Attribution
license (http://creativecommons.org/licenses/by/4.0/).