financial analysts’ trip – india 2011 thierry prévot · financial analysts’ trip ... bcg...
TRANSCRIPT

Financial Analysts’ Trip – India 2011
Thierry PrévotGeneral Manager Financial Communications
& Strategic Prospective Analysis

Economy & Prospects1
L’Oréal’s positions3
Agenda
The Asian cosmetics market2
From Shanghai to Mumbai4
- 2 -

- 3 -
- 3 -
Economy
& Prospects
0%
20%
40%
60%
80%
100%
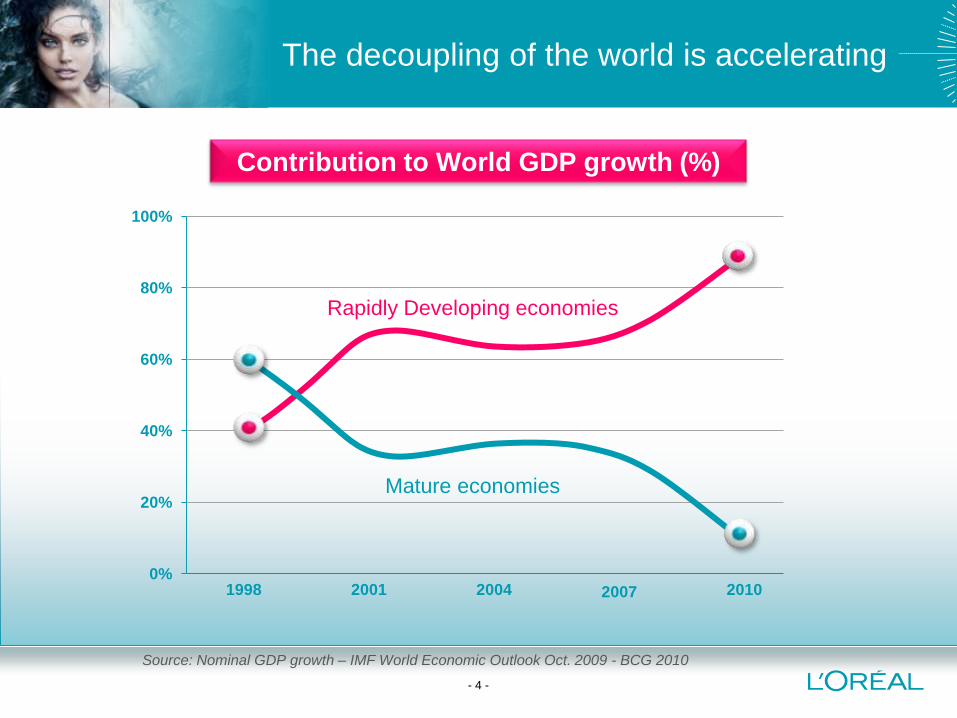
The decoupling of the world is accelerating
- 4 -
1998 2001 2004 2007 2010
Source: Nominal GDP growth – IMF World Economic Outlook Oct. 2009 - BCG 2010
Rapidly Developing economies
Mature economies
Contribution to World GDP growth (%)

The World’s Economic Center of Gravity:
from New York to Shanghai and New-Delhi?
Source: Wolfensohn Center for Development – The Emerging Middle Class in Developing Countries (Homi Kharas) March 2010
- 5 -
Economic Center of Gravity
21st
Century
will be Asian
again
19st
Century
has been
European
20th
Century
has been
American

Asian economies
Key economic indicators (2010)
- 6 -
JapanSouth
KoreaChina Hong Kong Taiwan Singapour India Thailand Indonesia Philippines Vietnam
GDP growth
2009-2010
(%)4.0 6.2 10.3 6.8 11.0 14.5 10.4 7.8 6.1 7.3 6.8
GDP growth
2010-2011
( %)1.4 4.5 9.6 5.4 5.4 5.2 8.2 4.0 6.2 5.0 6.3
Inflation rate
%
(2010)-0.7 3.0 3.3 2.4 1.0 2.8 12.1 3.3 5.1 3.8 9.2
Investments
2011
% GDP21.9 29.1 48.6 24.7 22.4 25.9 39.2 27.9 33.5 15.7 36.4
Trade
balance 2010
(US$ bn)84 48 169 -42 10 45 -110 15 23 -4 -12
Total GDP: IMF, International Financial Statistics. At constant prices, in € at fixed 2010 exchange rates, year-on-year growth
Inflation: IMF, International Financial Statistics. % growth.
Investment: IMF, International Financial Statistics, % of GDP
Trade Balance: The Economist, $US Billion

Total GDP by country (2006-2050)Ranking in terms of total GDP at current exchange rates up to 2010
- 7 -
USA
USA
China
China
Europe G8
Europe G8
India
India
Japan
Japan
2006 2010 2015 2020 2025 2030 2035 2040 2045 2050
N 1 N 1
N 2N 2
N 3 N 3
N 4 N 4
N 8 N 8
Rank 2006 Rank 2050
Source: PwC Research, « The World in 2050 »
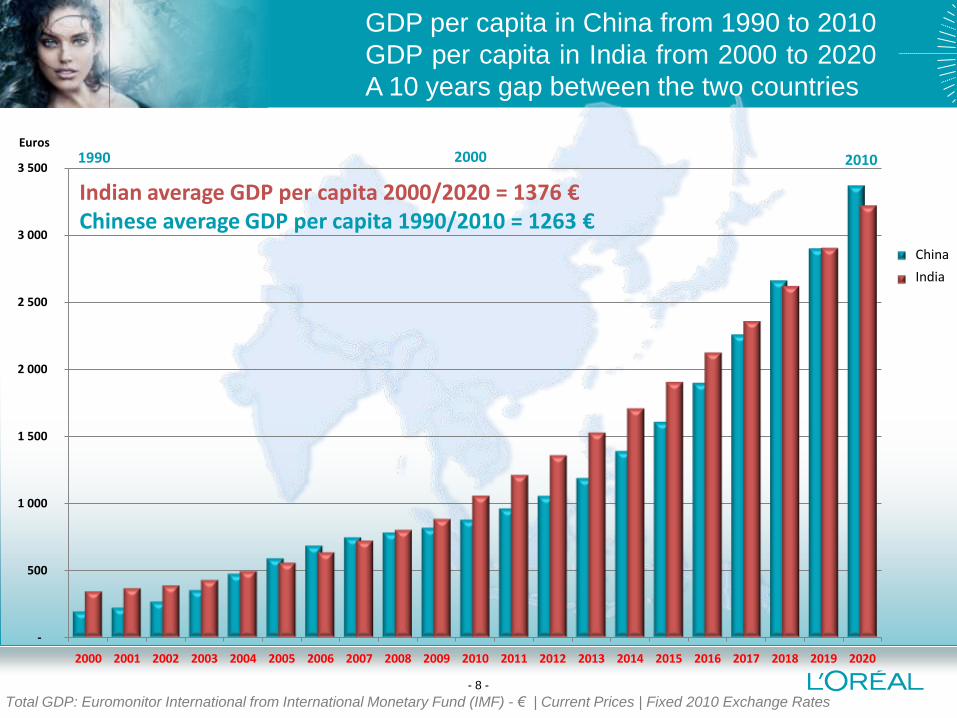
GDP per capita in China from 1990 to 2010
GDP per capita in India from 2000 to 2020
A 10 years gap between the two countries
- 8 -
1990 20102000
-
500
1 000
1 500
2 000
2 500
3 000
3 500
2000 2001 2002 2003 2004 2005 2006 2007 2008 2009 2010 2011 2012 2013 2014 2015 2016 2017 2018 2019 2020
Chine
Inde
Indian average GDP per capita 2000/2020 = 1376 €Chinese average GDP per capita 1990/2010 = 1263 €
Total GDP: Euromonitor International from International Monetary Fund (IMF) - € | Current Prices | Fixed 2010 Exchange Rates
China
India
Euros

Economy & Prospects1
L’Oréal’s positions3
Agenda
The Asian cosmetics market2
From Shanghai to Mumbai4
- 9 -

The Asiancosmetics
market
- 10 -

A dynamic and resilient global cosmetics market*
(annual growth rate, 1995-2010)
- 11 -
*Source: L’Oréal estimates - Excluding soaps and toothpastes. Excluding exchange rate impact
€144bn
+4.2%
20081996 1997 1998 1999 2000 2001 200320021995 2004 20062005 2007 2009 2010
+5.3%+5.4% +5.5%
+5.3%
+4.9%
+4.3%+4.6%
+3.0 %
+3.4%

Worldwide Cosmetics Market* in 2010 (in billion euros)
* excluding soaps , razors, blades and toothpaste
L’Oréal Estimates – On a 2010 higher revised basis.
Translated into euros at foreign exchange rates of 12.31.2010
Europe 5 = France, Germany, UK, Italy & Spain
Next 15 = Argentina, South Africa, Colombia, Thailand, Indonesia, Ukraine, Poland, Saudi Arabia, Egypt, Nigeria, Philippines, Vietnam, Pakistan, Kazakhstan, Turkey
USA
27
Japan
19
China
9
Brazil
9
Europe 5
27
Russia
6.3
India 1.7Mexico 2.7
Next 15
12
- 12 -
80% of the worldwide market in 27 countries

- 13 -
The Asian Cosmetics Market* in 2010 (in billion euros)
Japan
19
Greater China
11.2
India
1.7
South Korea
3.1
ASEAN**
5.2
+1.3%
+7.8%
+8.1%
+16.2%
+8.5%
* excluding soaps , razors, blades and toothpaste
L’Oréal Estimates– On a 2010 higher revised basis.
Translated into euros at foreign exchange rates of 12.31.2010
**ASEAN : including here only Thailand, Indonesia, Malaysia, Philippines, Vietnam and Singapore.
94% of the Asia Pacific market in 5 “clusters”

Yearly cosmetics consumption
in the Asian markets (in euros per capita)
Excluding soaps, toothpastes and razors
L’Oréal estimates – 2010 Net manufacturing prices
Exchange rates at December 31st, 2010
France: €104.2
United States: €88.7
- 14 -
€1.4
€62.9
€6.7
€148.1
IndiaKoreaJapan China
€10.9
Philippines
€20.1
Thailand
€4.3
Vietnam
€5.4
Indonesia
€24.5
Malaysia
€88.6
Singapore

58,066,5
84,9
57,5
6,7
4,8
7,8
4,2
11,7
14,0
1,7
10,2
1,6
0,2
3,2
23,6
13,15,2
24,9
0
10
20
30
40
50
60
70
80
90
100
Japan China India Thailand
Direct sales
Pharmacies
Selective
Hair salon
Mass-Market
- 15 -
Source: L’Oréal estimates - Excluding soaps and toothpastes
Great diversity of the Asian cosmetics markets
in terms of retailing
%

6,1 2,7
13,8
3,7
21,3 29,4
27,8
19,4
18,7 10,6
6,9
14,9
39,2 44,9 31,7
32,2
3,75,2
6,3
12,8
3,7
5,3
8,6 13,21,2
1,9 4,9 3,86,1
0
10
20
30
40
50
60
70
80
90
100
Japan China India Thailand
Others
Fragrances
Hygiene
Body care
Face care
Make up
Hair care
Hair color
- 16 -
%
Great diversity of the Asian cosmetics markets
in terms of categories
Source: L’Oréal estimates - Excluding soaps and toothpastes

- 17 -
The New Countries
Sources of Growth in the Asia-Pacific Zone
Market Growth (2010-2015)
Countries
Market Size in Billion Euros
Growth Factor
2010 2015*
Japan 29.4 29.8 X 1.01
China 14.8 24.1 X 1.63
South Korea 4.8 6.3 X 1.32
India 2.9 5.9 X 2.04
Australia 3.3 3.9 X 1.17
Thailand 2.3 3.5 X 1.49
Indonesia 1.5 3.0 X 1.94
Philippines 1.5 2.1 X 1.43
Total Market 60.5 78.5 X 1.30
Source: Euromonitor (sell out) - *estimates.

Once fundamental needs have been met,
per capita cosmetics consumption grows rapidly
- 18 -
Sources: L’Oréal estimates – IMF World Economic Outlook
United Nations, Department of Economic and Social Affairs, Population Division (2008)
* Cosmetics consumption revised with sanitary equipment rate.
GDP/inhab.
Cosmetics
consumption/inhab*.
GDP growth and per capita cosmetics consumption
150
100
50
01 10 100
Japan
China
INDIA Indonesia
Vietnam
Philippines
Thaïland
South Korea
Per capita GDP (In thousands of US dollars) Per capita cosmetics consumption (US dollars)

A 12 years gap between the
Indian and the Chinese cosmetics market
- 19 -
20151997 2003
Source: Euromonitor – Manufacturing prices- Euros
€ million
0
2000
4000
6000
8000
10000
12000
14000
16000
1997 2000 2005 2010 2015
Chine
Inde
China
India

Asia in the Worldwide Cosmetics Market
From 2005 to 2020 (possible scenarii*)
- 20 -
€144bn€95bn
2020 scenario*20102005
Japan
11.6%
Asia excl. Japan
15.8%Japan
12.9%
Asia excl. Japan
16.9%
Japan
Asia excl. Japan
Sources: L’Oréal estimates
*L’Oréal possible scenario for 2020 – Excluding soaps, razors and toothpastes.
At current exchange rates.(2005-2010)

The new middle-class is now
having access to modern cosmetics
- 21 -
From the top of the Pyramid…
Middle
classes
Wealthy
classes
Popular
classes
World 2010: 6 billion people

World 2025: 8 billion people
….toward the new middle classes
The new middle-class is now
having access to modern cosmetics
- 22 -
Middle
classes
Wealthy
classes
Popular
classes
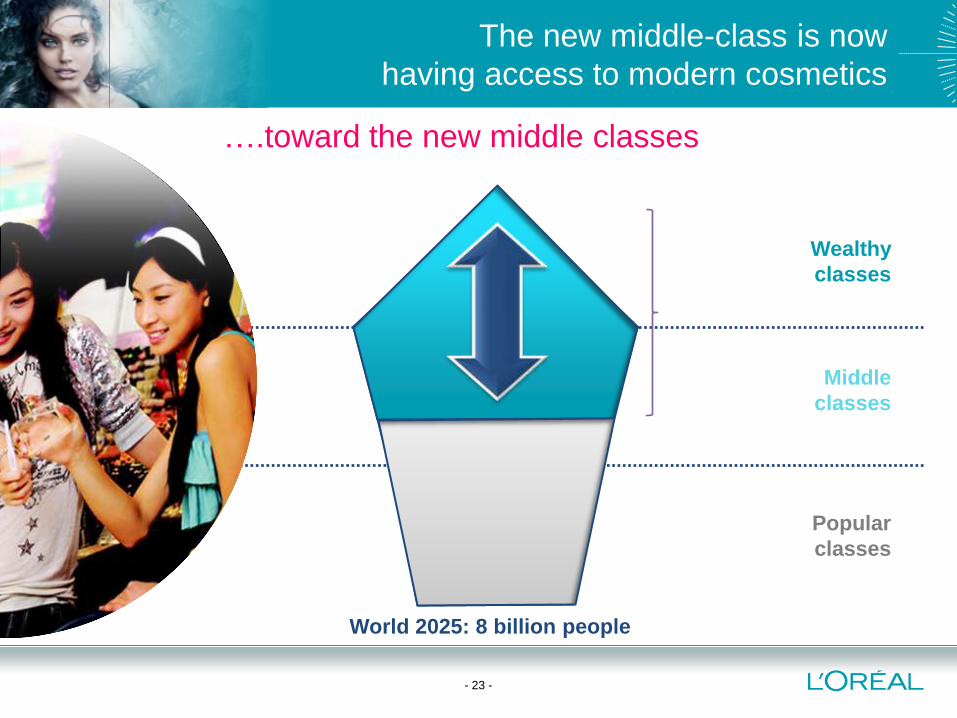
World 2025: 8 billion people
….toward the new middle classes
The new middle-class is now
having access to modern cosmetics
- 23 -
Middle
classes
Wealthy
classes
Popular
classes

Income projections for 2025: more and more consuming and
aspiring social classes, less struggling poor households
- 24 -
Global
Consuming
Aspiring
Struggling
Income segment
per capita ($ PPP)
100,000+
70,000-100,000
35,000-70,000
20,000-35,000
10,000-20,000
7,500-10,000
5,000-7,500
2,000-5,000
1,000-2,000
< 1,000
Number of households
(as a %)
2025
1
19
60
20
0
2007
0
4
32
61
3
Source: McKinsey Research – “Urban World” – 2011

China and India:
the rise of the middle-classes
- 25 -
Affluent
Upper Middle
Mid Middle
Lower middle
Income segment
per capita ($ PPP)
$ 20 per
person a day
$10-$20 per
person a day
$4 to $10 per
person a day
$2 to $4 per
person a day
Source: “The Rise of Asia’s Middle Class”, Asian Development Bank (August 2010)
Estimates based on 2007 data.
Poor< $2 per person
a day
Number of people
Urban+Rural
(as a %)
China
4
19
48
23
6
India
3
4
12
22
59

The privilege of late birth to modernity
● 2010: 89% of urban Chinese have a
mobile phone, 19% have 2 mobile
phones**
● China: 711 million Internet users
in 2020, 419 million today*
● India: 75 million Internet users in
2010*
● Indonesia 2010: 2nd “Facebook
country”**
- 26 -
Sources: * Euromonitor International 2010 / ** Forrester International research.

Economy & Prospects1
L’Oréal’s positions3
Agenda
The Asian cosmetics market2
From Shanghai to Mumbai4
- 27 -

and ?positions
- 28 -

N 8Japan2.6%
N 2China12%
L’Oréal’s market shares in Asia-Pacific Zone (2010)*based on L’Oréal’s evaluation of the global cosmetics market
L’Oréal World: 13.2%
Mature Markets: 16.9%
New Markets: 8.8%
L’Oréal Asia-Pacific: 7.3%excl. Japan: 11.0%
- 29 -
Excluding soaps and toothpastes – source: L’Oréal estimates
N 3India10%
(8% incl. hair oils) Thaïland10%
Philippines3%
Indonesia6%
Vietnam3%
Korea6%
Australia17%
N 2
N 3
N 1
N 3
N 3 N 9

Source: Euromonitor 2011 – Beauty market (excluding soaps, razors & oral care)
L’Oréal’s market share
in Asia-Pacific including Japan: 2001-2010
2.9
7.0
2001 2002 2003 2004 2005 2006 2007 2008 2009 2010
L'Oréal Groupe
%
%
%
%
%
%
%
- 30 -
Source: Euromonitor
L’Oréal
%

Source: Euromonitor 2011 – Beauty market (excluding soaps, razors & oral care)
5.0%
11.0%
0%
2%
4%
6%
8%
10%
12%
2001 2002 2003 2004 2005 2006 2007 2008 2009 2010
L'Oréal
L’Oréal’s market share
in Asia-Pacific excluding Japan: 2001-2010
- 31 -
Source: Euromonitor

Top competitors by region, in Asia (2010)
- 32 -
Market Leaders in Asia Pacific Sub Zones
Asia-Pacific North Asia Greater China India + ASEAN Pacific
1 Shiseido Kao P & G Unilever L'Oréal
2 Kao Shiseido L'Oréal P & G P & G
3 P & G Kose Shiseido L'Oréal Unilever
4 L'Oréal P & G Unilever Johnson & Johnson Estée Lauder
5 Unilever LG Avon Beiersdorf Revlon
8 L'Oréal
Source: Euromonitor 2010

Economy & Prospects1
L’Oréal’s positions3
Agenda
The Asian cosmetics market2
From Shanghai to Mumbai4
- 33 -

- 34 -
From
Shanghaito Mumbai
- 34 -

A New Era
Universalisation and beauty for everyone
- 35 -

Sources:
* IFOP Nov-Dec. 2009 – Lancôme ”Preferred brand for face care” ; Maybelline “Preferred brand for make-up”
** TNS Sofres Brand image women – 2008 - China
Brand strategy
In China: Lancôme, L’Oréal Paris and Maybelline
LANCÔME
The favourite face care brand*
L’OREAL PARIS
The best brand image**
1 2MAYBELLINE
The preferred make-up brand*
3
- 36 -

GARNIER
The preferred brand of Indian women*
Brand strategy
Garnier, in close relationship with Indian consumers
* TNS Brand image & awareness – 2008- urban women aged 18-45 .
- 37 -

1
2
3
Adapting our product offer:
Accessible innovation and the “Trading Right”
- 38 -
TRADING RIGHT
1. Less ”niche” innovations
2. Highest innovation degree
at the heart of each market
3. A product offer completed
by entry-level products/formats

- 39 -
L’Oréal has 8 R&I centers in Asia
Evaluation centers
Research centers
MUMBAI
THAILAND
SHANGHAI
TOKYOKAWASAKIPUDONG
R&Icenters8
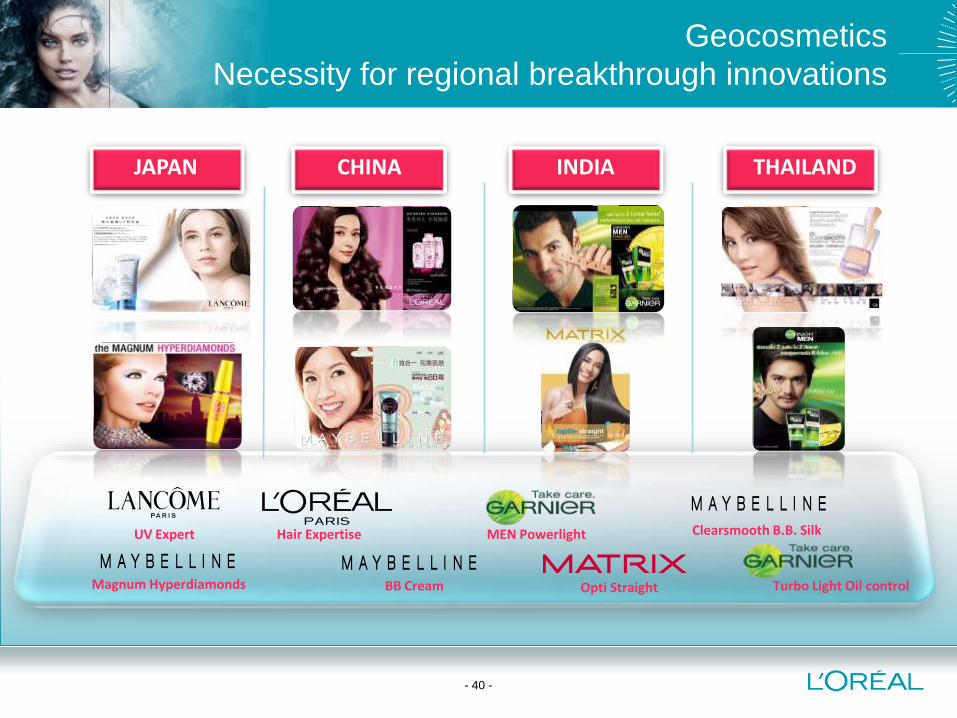
Hair Expertise
BB Cream Opti Straight
UV Expert MEN Powerlight
Turbo Light Oil control
Clearsmooth B.B. Silk
JAPAN CHINA INDIA THAILAND
Magnum Hyperdiamonds
Geocosmetics
Necessity for regional breakthrough innovations
- 40 -

INDIA (Pune)
- 41 -
L’Oréal has 5 factories in Asia
INDONESIA
Consumer Products
Luxury Products
factories5CHINA
JAPAN

Extending to new product categories
Latin America Eastern EuropeEastern Europe
Men cosmetics: Garnier and L’Oréal Paris Men Expert
L’OREAL PARIS MEN EXPERTN 1 in China
N 1 in Western Europe
GARNIER MENIndia, Southern Asia, China
- 42 -

0
200
400
600
800
1000
1200
1995 1996 1997 1998 1999 2000 2001 2002 2003 2004 2005 2006 2007 2008 2009 2010
Chine
Inde
L’Oréal sales in China and in India:
Heading for € 1 billion L’Oréal sales in India
- 43 -
Source: L’Oréal – Manufacturing prices- Euros
1997 2010€ million
L’Oréal heading for
€1bn sales
in India ?
China
India

-------------------------Avertissement / Disclaimer -------------------------« Ce document ne constitue pas une offre de vente ou la sollicitation d’une offre d’achat de titres L’Oréal. Si vous souhaitez obtenir des informations plus complètes concernant L’Oréal, nous vousinvitons à vous reporter aux documents publics déposés en France auprès de l’Autorité des Marchés Financiers (également disponibles en version anglaise sur notre site Internet www.loreal-finance.com).Ce document peut contenir certaines déclarations de nature prévisionnelle. Bien que la Société estime que ces déclarations reposent sur des hypothèses raisonnables à la date depublication du présent communiqué, elles sont par nature soumises à des risques et incertitudes pouvant donner lieu à un écart entre les chiffres réels et ceux indiqués ou induits dans cesdéclarations.»
"This document does not constitute an offer to sell, or a solicitation of an offer to buy, L’Oréal shares. If you wish to obtainmore comprehensive information about L’Oréal, please refer to the publicdocuments registered in France with the Autorité des Marchés Financiers (which are also available in English on our Internet site: www.loreal-finance.com).This document may contain some forward-looking statements. Although the Company considers that these statements are based on reasonable hypotheses at the date of publication of this release, they are by their nature subject to risks anduncertainties which could cause actual results to differ materially from those indicated or projected in these statements."
Thierry PrévotGroup General Manager, Financial Communicationsand Strategic Prospective AnalysisTel. : + 33 1 47 56 86 22Fax : + 33 1 47 56 74 93email : [email protected]
Françoise LauvinHead of Investors Relations
Tel. : + 33 1 47 56 86 82Fax : + 33 1 47 56 74 93email : [email protected]
- 45 -