financial analysis of ntpc and tata power
TRANSCRIPT
Management,Accounting,–,1
Term,Project
Financial , analysis , for , Power , Sector (NTPC,and,TATA,Power)
Group,2
Hitesh,Yeolekar,(09P84)Ayushi,Agrawal,(09P71),,,Rinshul,Pruthi,(09P110),,,Omkar,Parnandiwar,(09P97)
Management,Development,Institute
PGPM 2009-11, Section B, Group 2 Page 1
CONTENTS
TITLE PAGE,NO.OVERVIEW,OF,POWER,SECTOR 3NTPC,AND,TATA,POWER–,COMPANY,OVERVIEW
9
COMMON,SIZE,ANALYSIS 16RATIO,ANALYSIS 23DU,PONT,ANALYSIS 34CASH,FLOW,POSITION 35REFERNCES 37ANNEXURE 38
PGPM 2009-11, Section B, Group 2 Page 2
Overview,of,Indian,Power,Sector
Power,is,one,of,the,important,sectors,of,any,economy,which,define,its,growth.,In,India,the,powe
r,sector,has,shown,a,significant,growth,since,the,process,of,planned,development,of,the,econo
my,began,in,1950.,Hydro-
power,and,coal,based,thermal,power,have,been,the,main,sources,of,generation,of,electricity.,N
uclear,power,development,is,at,slower,pace,which,was,introduced,in,late,sixties.,The,concept,of
,operating,power,systems,on,a,regional,basis,crossing,the,political,boundaries,of,states,was,intr
oduced,in,the,early,sixties.,In,spite,of,the,overall,development,that,has,taken,place,,the,gap,bet
ween,supply,and,demand,still,remains,huge,due,to,growth,in,demand,for,power,,outstripping,th
e,growth,in,generation,and,generating,capacity,addition.
.The,installed,generation,capacity,in,the,Power,Utilities,in,the,country,as,on,30.06.2009,was,150
323.41,MW.,Region-wise,and,Category-wise,break-up,of,installed,capacity,is,given,below:
(All,figures,in,MW)
S.,NO. Region Hydro,(Renewable) Thermal Nuclear R.E.S.,@,(MNRE) Total
1 Northern 13425.15 22351.68 1180.00 1766.37 38723.20
2 Western 7448.50 33718.20 1840.00 4023.62 47030.32
3 Southern 10993.18 22072.02 1100.00 7047.90 41213.10
4 Eastern 3933.93 16863.58 0.00 227.41 21024.92
5 N.,Eastern 1116.00 968.74 0.00 171.00 2255.74
6 Island 0.00 70.02 0.00 6.11 76.13
7 All,India 36916.76 96044.24 4120.00 13242.41 150323.41
@,=,Renewable,Energy,Sources,(RES),includes,Small,Hydro,Project,(SHP),,Biomass,Gas,
(BG),,Biomass,Power,(BP),,Urban,&,Industrial,waste,Power,(U&l),and,Wind,Energy,
PGPM 2009-11, Section B, Group 2 Page 3
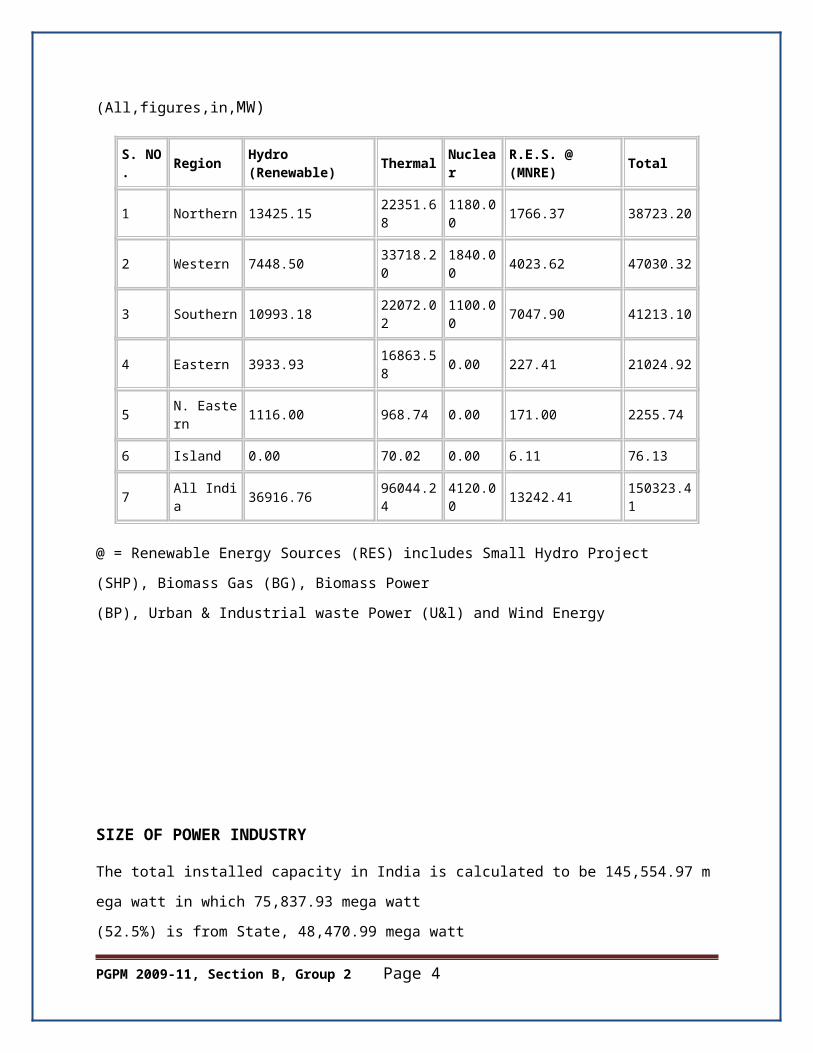
SIZE,OF,POWER,INDUSTRY
The,total,installed,capacity,in,India,is,calculated,to,be,145,554.97,mega,watt,in,which,75,837.93
,mega,watt,(52.5%),is,from,State,,48,470.99,mega,watt,
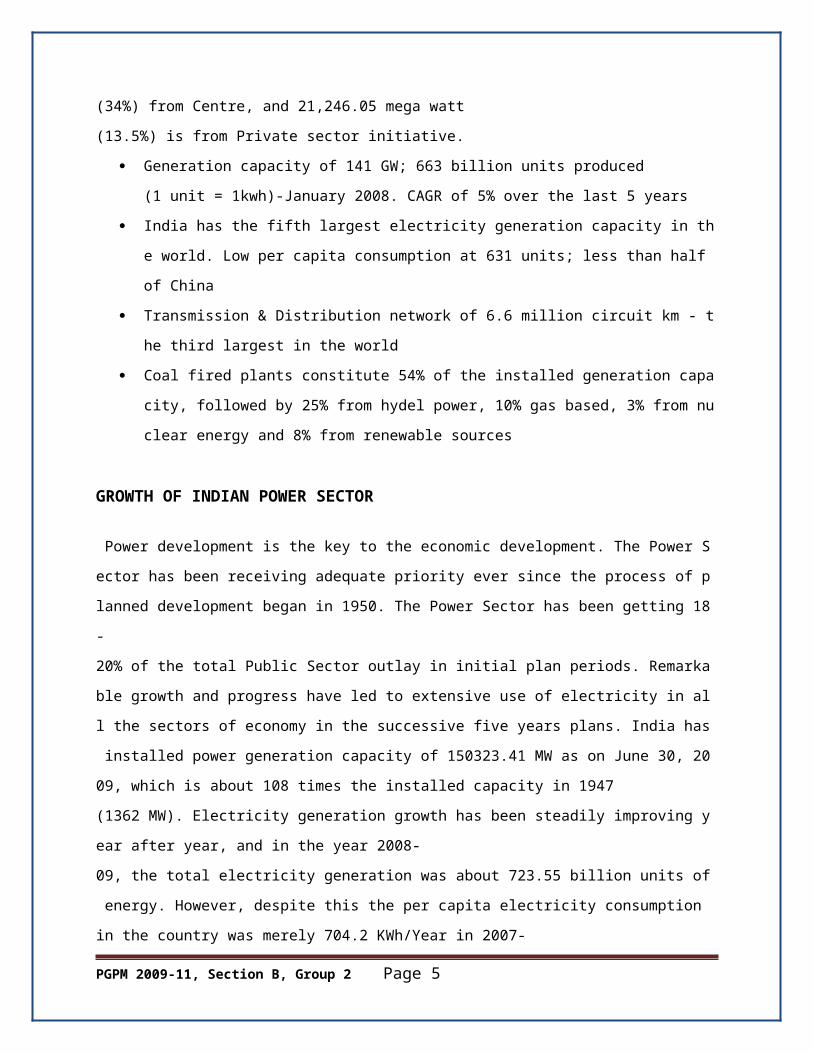
(34%),from,Centre,,and,21,246.05,mega,watt,(13.5%),is,from,Private,sector,initiative.
Generation,capacity,of,141,GW;,663,billion,units,produced,(1,unit,=,1kwh)-
January,2008.,CAGR,of,5%,over,the,last,5,years
India,has,the,fifth,largest,electricity,generation,capacity,in,the,world.,Low,per,capita,cons
umption,at,631,units;,less,than,half,of,China
Transmission,&,Distribution,network,of,6.6,million,circuit,km,-,the,third,largest,in,the,worl
d
Coal,fired,plants,constitute,54%,of,the,installed,generation,capacity,,followed,by,25%,fro
m,hydel,power,,10%,gas,based,,3%,from,nuclear,energy,and,8%,from,renewable,source
s,
GROWTH,OF,INDIAN,POWER,SECTOR
,Power,development,is,the,key,to,the,economic,development.,The,Power,Sector,has,been,recei
ving,adequate,priority,ever,since,the,process,of,planned,development,began,in,1950.,The,Powe
r,Sector,has,been,getting,18-
20%,of,the,total,Public,Sector,outlay,in,initial,plan,periods.,Remarkable,growth,and,progress,ha
ve,led,to,extensive,use,of,electricity,in,all,the,sectors,of,economy,in,the,successive,five,years,pl
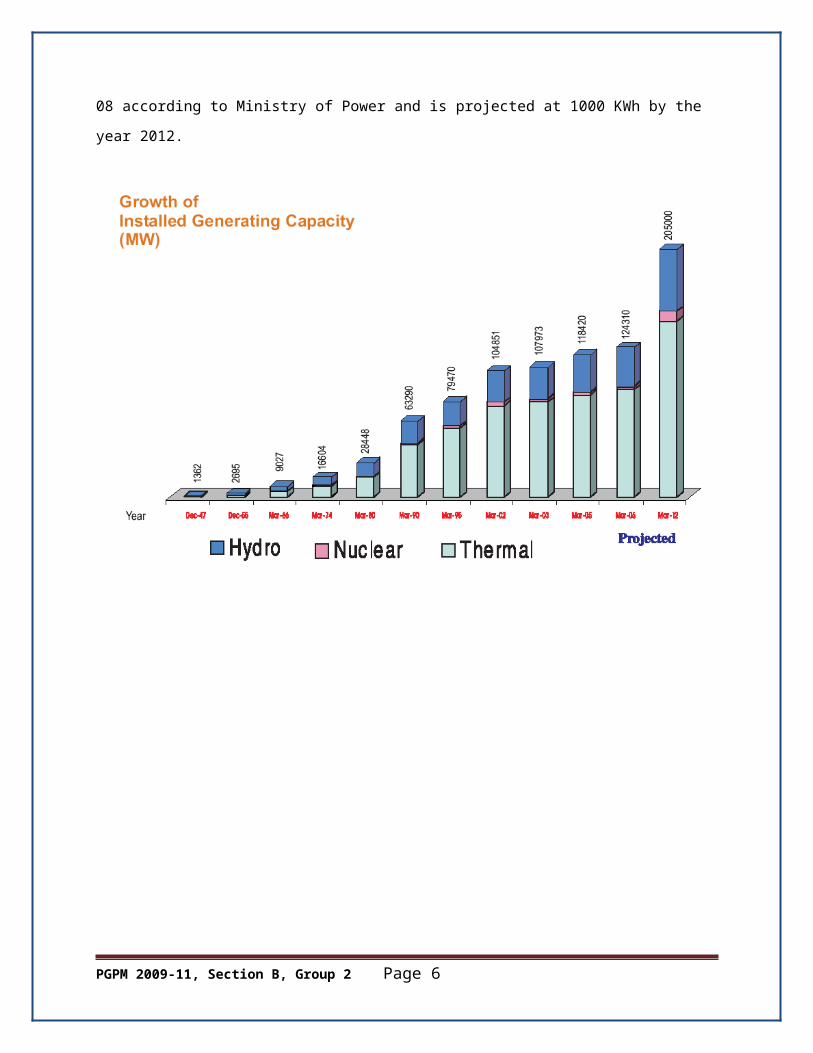
ans.,India,has,installed,power,generation,capacity,of,150323.41,MW,as,on,June,30,,2009,,whic
h,is,about,108,times,the,installed,capacity,in,1947,
(1362,MW).,Electricity,generation,growth,has,been,steadily,improving,year,after,year,,and,in,the
,year,2008-
09,,the,total,electricity,generation,was,about,723.55,billion,units,of,energy.,However,,despite,thi
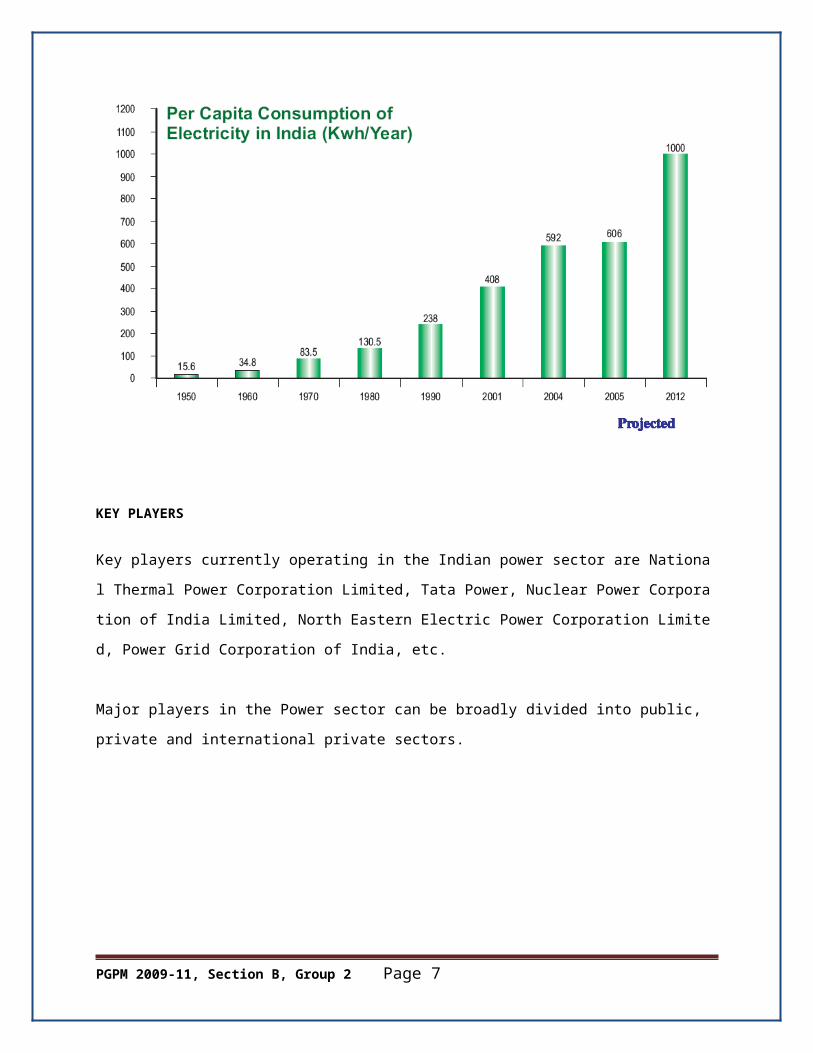
s,the,per,capita,electricity,consumption,in,the,country,was,merely,704.2,KWh/Year,in,2007-
08,according,to,Ministry,of,Power,and,is,projected,at,1000,KWh,by,the,year,2012.
PGPM 2009-11, Section B, Group 2 Page 4
PGPM 2009-11, Section B, Group 2 Page 5
KEY,PLAYERS,
Key,players,currently,operating,in,the,Indian,power,sector,are,National,Thermal,Power,Corporat
ion,Limited,,Tata,Power,,Nuclear,Power,Corporation,of,India,Limited,,North,Eastern,Electric,Po
wer,Corporation,Limited,,Power,Grid,Corporation,of,India,,etc.
,
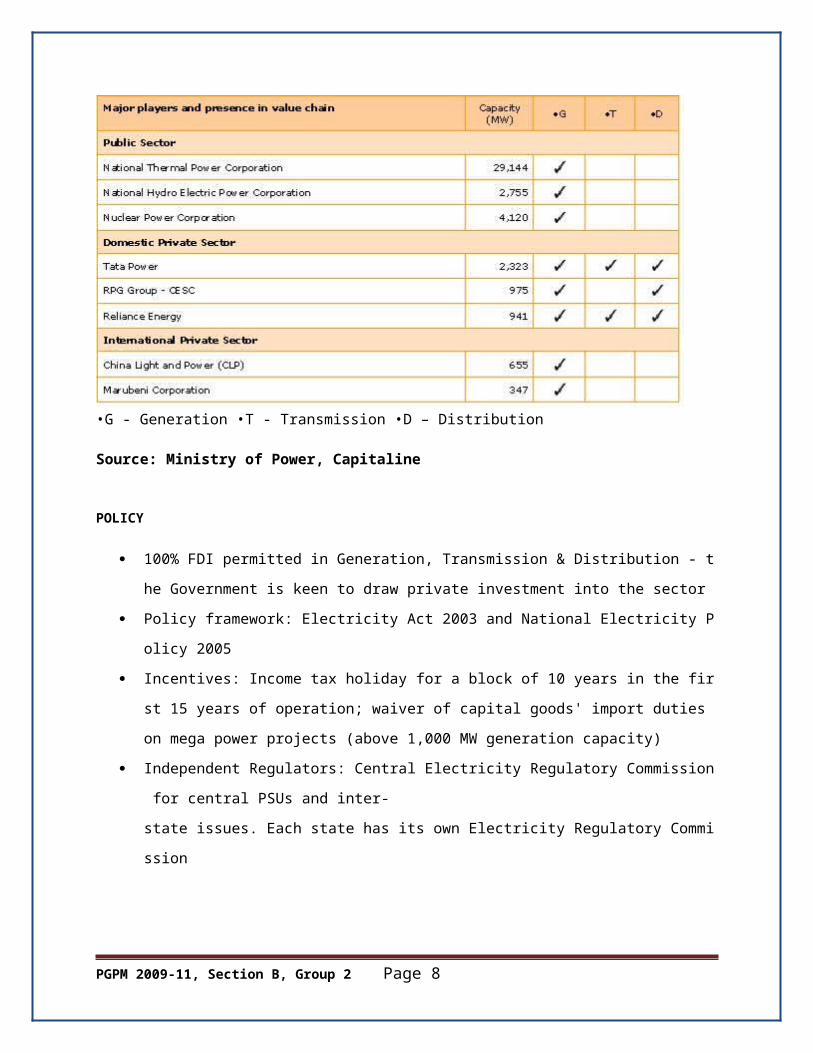
Major,players,in,the,Power,sector,can,be,broadly,divided,into,public,,private,and,international,pri
vate,sectors.
•G,-,Generation,•T,-,Transmission,•D,–,Distribution
Source:,Ministry,of,Power,,Capitaline
POLICY
100%,FDI,permitted,in,Generation,,Transmission,&,Distribution,-,the,Government,is,kee
n,to,draw,private,investment,into,the,sector
Policy,framework:,Electricity,Act,2003,and,National,Electricity,Policy,2005
Incentives:,Income,tax,holiday,for,a,block,of,10,years,in,the,first,15,years,of,operation;,w
aiver,of,capital,goods',import,duties,on,mega,power,projects,
(above,1,000,MW,generation,capacity)
Independent,Regulators:,Central,Electricity,Regulatory,Commission,for,central,PSUs,an
d,inter-state,issues.,Each,state,has,its,own,Electricity,Regulatory,Commission
PGPM 2009-11, Section B, Group 2 Page 6
BLUEPRINT,OF,MINISTRY
The,Ministry,of,Power,has,set,a,goal,-,Mission,2012:,Power,for,All.
A,comprehensive,Blueprint,for,Power,Sector,development,has,been,prepared,encompassing,an
,integrated,strategy,for,the,sector,development,with,following,objectives:-
Sufficient,power,to,achieve,GDP,growth,rate,of,8%
Reliable,of,power
Quality,power
Optimum,power,cost
Commercial,viability,of,power,industry
Power,for,all
Strategies,To,Achieve,The,Objectives:,
Power,Generation,Strategy,with,focus,on,low,cost,generation,,optimization,of,capacity,utilization
,,controlling,the,input,cost,,optimisation,of,fuel,mix,,Technology,up,gradation,and,utilization,of,N
on,Conventional,energy,sources,
Transmission,Strategy,with,focus,on,development,of,National,Grid,including,Interstate,connec
tions,,Technology,up,gradation,&,optimization,of,transmission,cost.
Distribution,strategy,to,achieve,Distribution,Reforms,with,focus,on,System,up,gradation,,loss,r
eduction,,theft,control,,consumer,service,orientation,,quality,power,supply,commercialization,,D
ecentralized,distributed,generation,and,supply,for,rural,areas
Regulation,Strategy,aimed,at,protecting,Consumer,interests,and,making,the,sector,commercia
lly,viable
Financing,Strategy,to,generate,resources,for,required,growth,of,the,power,sector,Conservatio
n,Strategy,to,optimise,the,utilization,of,electricity,with,focus,on,Demand,Side,management,,Loa
d,management,and,Technology,up,gradation,to,provide,energy,efficient,equipment,/,gadgets.
PGPM 2009-11, Section B, Group 2 Page 7
Communication,Strategy,for,political,consensus,with,media,support,to,enhance,the,general,pu
blic,awareness.
Roadblocks , in , Power , Sector , Development
1. Absence,of,a,clear,cut,policy,and,focus:,The,government,took,initiatives,like,mega,proje
cts,,naptha,etc,but,these,were,not,taken,to,the,end,and,implemented,completely.,This,w
as,due,to,lack,of,focus,on,part,of,the,government.,
2. Poor,financial,health,of,the,State,Electricity,Boards,and,their,inexperience,to,operate,in,t
he,changed,market,environment:,Most,of,the,State,Electricity,boards,today,are,in,poor,fi
nancial,condition,and,hence,not,fit,to,handle,the,power,requirements,of,the,country.,
3. Unavailability,of,fuel:,It,is,one,of,the,major,roadblocks,in,the,development,of,power,secto
r,in,India.,Fuel,is,not,easily,available,and,in,India,it,is,scarcer.,Hence,the,unavailability,is,
a,major,concern
4. Delay,in,land,acquisition,,environmental,clearances,and,other,approvals,are,an,area,of,c
oncern,when,the,private,companies,are,concerned.,The,bureaucracy,brings,another,maj
or,roadblock,for,any,private,company,entering,any,sector,,not,just,power,sector.
5. ,More,dependence,on,imported,coal,due,to,low,growth,in,domestic,coal,mining.,In,India,t
he,majority,of,power,is,still,generated,by,coal.,With,low,growth,in,coal,mining,in,the,coun
try,,the,thermal,power,plants,are,depending,more,on,imported,coal,which,the,companies
,can,be,vary,of.
6. Slow,pace,of,opening,up,of,the,distribution,activities,to,private,sector.,Although,the,gove
rnment,has,shown,and,taken,initiatives,for,opening,up,the,sector,for,the,private,players.,
For,example:,the,opening,up,of,distribution,sector,is,being,taken,up,slowly,by,the,govern
ment.,Also,the,privatization,in,the,transmission,sector,needs,to,be,increased,to,nurture,
more,growth,in,the,sector.
The,two,companies,chosen,by,us,for,our,assignment,are,NTPC,which,is,the,benchmark,
company,in,the,Power,sector,reporting,the,highest,turnover,year,on,year,and,TATA,Power,Limit
ed,,another,major,player,in,power,production,and,transmission.,
PGPM 2009-11, Section B, Group 2 Page 8
NTPC,–,Company,Overview
NTPC,Ltd,(NTPC),,a,Navratna,company,,was,incorporated,in,1975.,The,company’s,principal
business,comprises,generation,and,sale,of,bulk,power.,
Its,other,lines,of,business,include,consultancy,services,in,engineering,,project,management,,
construction,management,,operation,,and,maintenance,of,power,plants.,It,is,also,engaged,in,oil,
and,gas,exploration,,and,coal,mining.
NTPC,generates,power,through,15,coal-based,power,plants,with,22,895,MW,capacity,,7,gas-
based,power,plants,with,3,955,MW,capacity,,and,4,JV,projects,with,1,054,MW,capacity.,It,sells,
power,to,bulk,consumers,,mainly,SEBs.
The,salient,features,of,NTPC’s,depreciation,policy,are,as,follows:
(i),Depreciation,is,charged,on,straight,line,method,at,the,rates,specified,in,Schedule,XIV,of,th
e,Companies,Act,,1956,except,for,the,following,assets,at,the,rates,mentioned,below:
a),Kutcha,Roads,47.50,%
b),Personal,computers,and,Laptops,including,peripherals,
c),Photocopiers,and,Fax,Machines,
d),Air,conditioners,,Water,coolers,and,Refrigerators,
Depreciation,on,additions,to/deductions,from,fixed,assets,during,the,year,is,charged,on,pro-
rata,basis,from/up,to,the,month,in,which,the,asset,is,available,for,use/disposal.
1. Assets,costing,up,to,Rs.5000/-,are,fully,depreciated,in,the,year,of,acquisition.
2. Cost,of,software,recognized,as,intangible,asset,,is,amortised,on,straight,line,method,
over,a,period,of,legal,right,to,use,or,3,years,,whichever,is,earlier.
3. Where,the,cost,of,depreciable,assets,has,undergone,a,change,during,the,year,due,to,in
crease/decrease,in,long,term,liabilities,on,account,of,exchange,fluctuation,,price,adjust-
ment,,change,in,duties,or,similar,factors,,the,unamortised,balance,of,such,asset,is,
PGPM 2009-11, Section B, Group 2 Page 9
charged,prospectively,over,the,residual,life,determined,on,the,basis,of,the,rate,of,
depreciation.
Analysis,of,depreciation,policy
i. The,depreciation,has,been,sufficient,enough,for,replacement,of,the,asset.,Looking,at,the
,annual,report,we,find,that,the,rate,of,depreciation,is,sufficient,enough,to,cover,the,value
,of,the,asset,over,its,useful,life.,
ii. Depreciation,has,been,charged,largely,through,SLM.,As,a,result,of,this,the,company,is,a
ble,to,report,higher,profits,then,what,would,otherwise,have,been,had,it,used,WDV,metho
d.,
iii. The,depreciation,method,used,by,the,company,for,different,assets,has,remained,consist
ent,over,the,observed,period,of,5,years.,
iv. There,is,a,significant,difference,in,depreciation,rates,used,by,company,
(prescribed,by,companies,act),and,the,rates,prescribed,by,the,IT,act,for,tax,purposes.,T
his,can,be,seen,in,the,deferred,tax,liability,amount,of,Rs.,513.5,Crores.
,
TATA,POWER,–,Company,Overview
The,Tata,Power,Company,Ltd,(Tata,Power),was,incorporated,in,1919.,
In,2000,,The,Andhra,Valley,Power,Supply,Co,and,The,Tata,HydroElectric,Power,Co,Ltd,
merged,with,Tata,Power.,
Tata,Power’s,core,business,is,to,generate,,distribute,,and,transmit,electricity.
Tata,Power,is,engaged,in,generation,,distribution,,and,transmission,of,power,,operating,in
Maharashtra,,Karnataka,,and,Jharkhand.,
The,salient,features,of,Tata,Power’s,depreciation,policy,are,as,follows:
PGPM 2009-11, Section B, Group 2 Page 10
(i),Depreciation,for,the,year,in,respect,of,assets,relating,to,the,electricity,business,of,the,
Company,as,Licensee,has,been,provided,on,straight,line,method,in,terms,of,the,repealed,
Electricity,(Supply),Act,,1948,on,the,basis,of,central,government,notification,,except,that,
computers,acquired,on,or,after,1st,April,,1998,are,depreciated,at,the,rate,of,33.40%,p.a.,on,the,
basis,of,approval,obtained,from,the,State,Government,.
(ii),In,respect,of,assets,relating,to,the,other,business,of,the,Company,,depreciation,has,been,
provided,for,on,written,down,value,basis,at,the,rates,and,in,the,manner,prescribed,in,Schedule,
XIV,to,the,Companies,Act,,1956,,except,in,the,case,of,technical,knowhow,which,is,written,off,on
,a,straight,line,basis,over,a,period,of,six,years.
(iii),Assets,costing,less,than,Rs.,5,000/-,are,depreciated,at,the,rate,of,100%.
(iv),Leasehold,Land,is,amortised,over,the,period,of,the,lease.
(v),Depreciation,on,additions/deletions,of,assets,is,provided,on,pro-rata,basis.
Analysis,of,depreciation,policy
i. The,depreciation,has,been,sufficient,enough,for,replacement,of,the,asset.,Looking,at,the
,annual,report,we,find,that,the,rate,of,depreciation,is,sufficient,enough,to,cover,the,value
,of,the,asset,over,its,useful,life.,
ii. For,assets,relating,to,the,electricity,business,company,has,charged,depreciation,on,a,
straight,line,basis,whereas,for,assets,pertaining,to,other,businesses,the,company,has,
charged,depreciation,at,the,written,down,value,method.,,Since,large,amount,of,
depreciation,is,being,charged,through,SLM,it,is,able,to,report,greater,profits,then,if,the,
company,was,WDV,method.,
iii. The,depreciation,method,used,by,the,company,for,different,assets,has,remained,
consistent,over,the,observed,period,of,5,years.,
iv. There,is,a,significant,difference,in,depreciation,rates,used,by,company,(prescribed,by,
companies,act),and,the,rates,prescribed,by,the,IT,act,for,tax,purposes.,This,can,be,seen
,in,the,deferred,tax,liability,amount,of,Rs.,113.59,Crores.
PGPM 2009-11, Section B, Group 2 Page 11
Method,of,inventory,valuation,followed,by,the,company
Tata,Power
i. Inventories,of,stores,,spare,parts,,fuel,and,loose,tools,are,valued,at,or,below,cost.,Cost,is,ascertained,on,weighted,average,basis.,
ii. Workinprogress,and,property,under,development,are,valued,at,lower,of,cost,and,net, realizable, value.,Cost,includes,cost,of,land,,material,,labour,,manufacturing,and,other,overheads.
There,has,been,no,significant,in,the,inventory,valuations,methods,followed,by,the,company,in, the,past,few,years.
,
NTPC
i. Inventories,are,valued,at,the,lower,of,cost,,determined,on,weighted,average,basis,,and,net,realizable,value.,
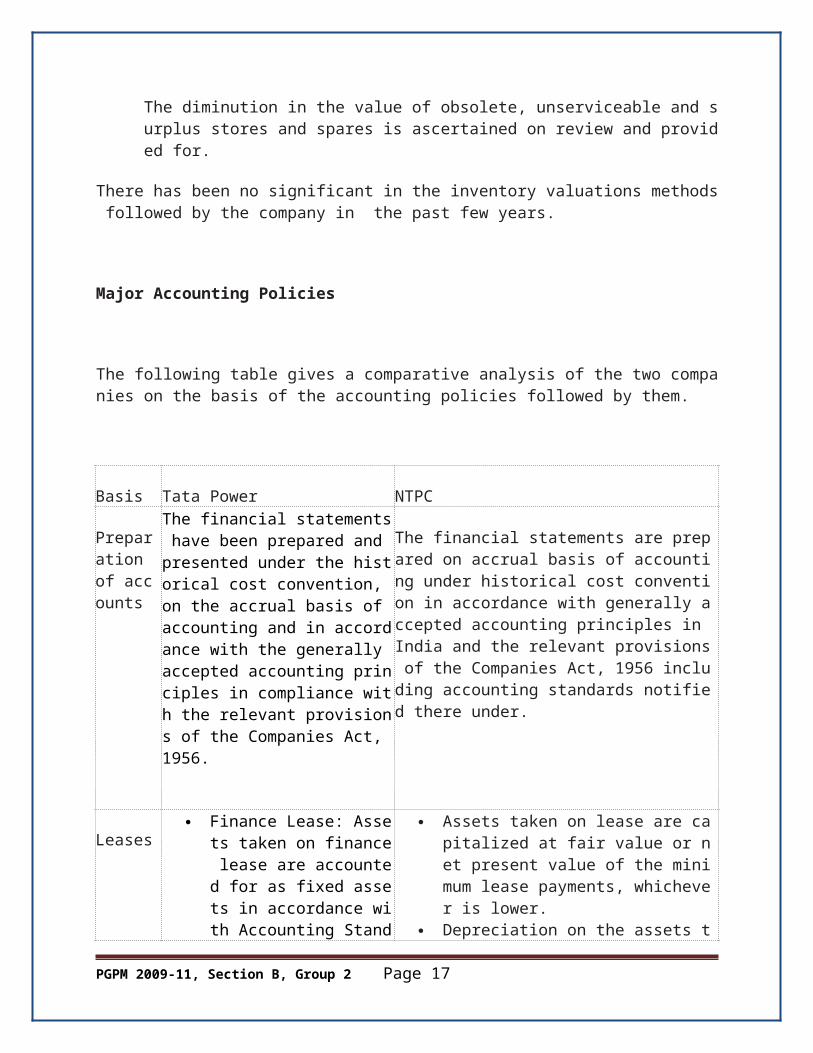
ii. The,diminution,in,the,value,of,obsolete,,unserviceable,and,surplus,stores,and,spares,is,ascertained,on,review,and,provided,for.
There,has,been,no,significant,in,the,inventory,valuations,methods,followed,by,the,company,in, the,past,few,years.
,
Major,Accounting,Policies
,
The,following,table,gives,a,comparative,analysis,of,the,two,companies,on,the,basis,of,the,accounting,policies,followed,by,them.
,
Basis Tata,Power NTPC
PreparatioThe,financial,statements,have,been,prepared,and,presented,under,the,hi The,financial,statements,are,prepared,on,accrual,b
PGPM 2009-11, Section B, Group 2 Page 12
n,of,accounts
storical,cost,convention,,on,the,accrual,basis,of,accounting,and,in,accordance,with,the,generally,accepted,accounting,principles,in,compliance,with,the,relevant,provisions,of,the,Companies,Act,,1956.
asis,of,accounting,under,historical,cost,convention,in,accordance,with,generally,accepted,accounting,principles,in,India,and,the,relevant,provisions,of,the,Companies,Act,,1956,including,accounting,standards,notified,there,under.
Leases Finance,Lease:,Assets,taken,
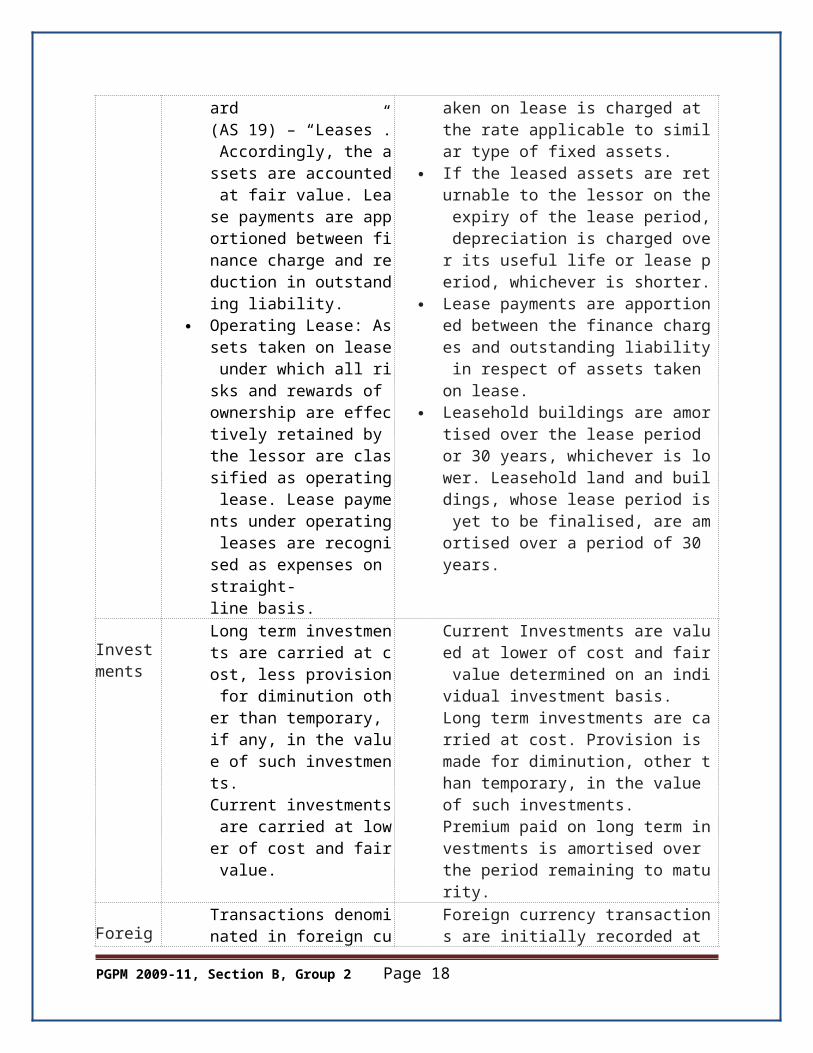
on,finance,lease,are,accounted,for,as,fixed,assets,in,accordance,with,Accounting,Standard,(AS,19),–,“Leases”.,Accordingly,,the,assets,are,accounted,at,fair,value.,Lease,payments,are,apportioned,between,finance,charge,and,reduction,in,outstanding,liability.
Operating,Lease:,Assets,taken,on,lease,under,which,all,risks,and,rewards,of,ownership,are,effectively,retained,by,the,lessor,are,classified,as,operating,lease.,Lease,payments,under,operating,leases,are,recognised,as,expenses,on,straight-line,basis.
Assets,taken,on,lease,are,capitalized,at,fair,value,or,net,present,value,of,the,minimum,lease,payments,,whichever,is,lower.
Depreciation,on,the,assets,taken,on,lease,is,charged,at,the,rate,applicable,to,similar,type,of,fixed,assets.
If,the,leased,assets,are,returnable,to,the,lessor,on,the,expiry,of,the,lease,period,,depreciation,is,charged,over,its,useful,life,or,lease,period,,whichever,is,shorter.
Lease,payments,are,apportioned,between,the,finance,charges,and,outstanding,liability,in,respect,of,assets,taken,on,lease.
Leasehold,buildings,are,amortised,over,the,lease,period,or,30,years,,whichever,is,lower.,Leasehold,land,and,buildings,,whose,lease,period,is,yet,to,be,finalised,,are,amortised,over,a,period,of,30,years.
Investments
Long,term,investments,are,carried,at,cost,,less,provision,for,diminution,other,than,temporary,,if,any,,in,the,value,of,such,investments.,
Current,investments,are,carried,at,lower,of,cost,and,fair,value.
Current,Investments,are,valued,at,lower,of,cost,and,fair,value,determined,on,an,individual,investment,basis.,
Long,term,investments,are,carried,at,cost.,Provision,is,made,for,diminution,,other,than,temporary,,in,the,value,of,such,investments.,
Premium,paid,on,long,term,investments,is,amortised,over,the,period,remaining,to,maturity.
Foreign,Exchange,Transactions
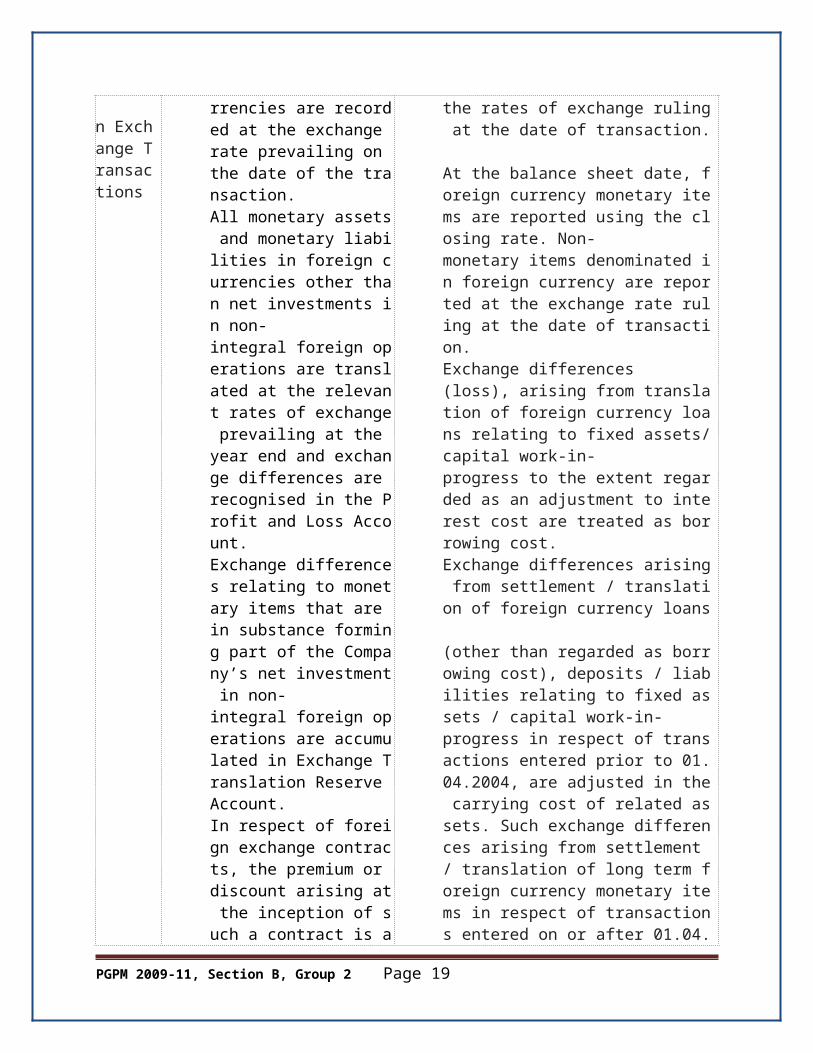
Transactions,denominated,in,foreign,currencies,are,recorded,at,the,exchange,rate,prevailing,on,the,date,of,the,transaction.,
All,monetary,assets,and,monetary,liabilities,in,foreign,currencies,other,than,net,inve
Foreign,currency,transactions,are,initially,recorded,at,the,rates,of,exchange,ruling,at,the,date,of,transaction.,
At,the,balance,sheet,date,,foreign,currency,monetary,items,are,reported,using,the,closing,rate.,Non-monetary,items,denominated,in,foreign,currency,are,reported,at,the,exchange,rate,ruli
PGPM 2009-11, Section B, Group 2 Page 13
stments,in,non-integral,foreign,operations,are,translated,at,the,relevant,rates,of,exchange,prevailing,at,the,year,end,and,exchange,differences,are,recognised,in,the,Profit,and,Loss,Account.,
Exchange,differences,relating,to,monetary,items,that,are,in,substance,forming,part,of,the,Company’s,net,investment,in,non-integral,foreign,operations,are,accumulated,in,Exchange,Translation,Reserve,Account.,
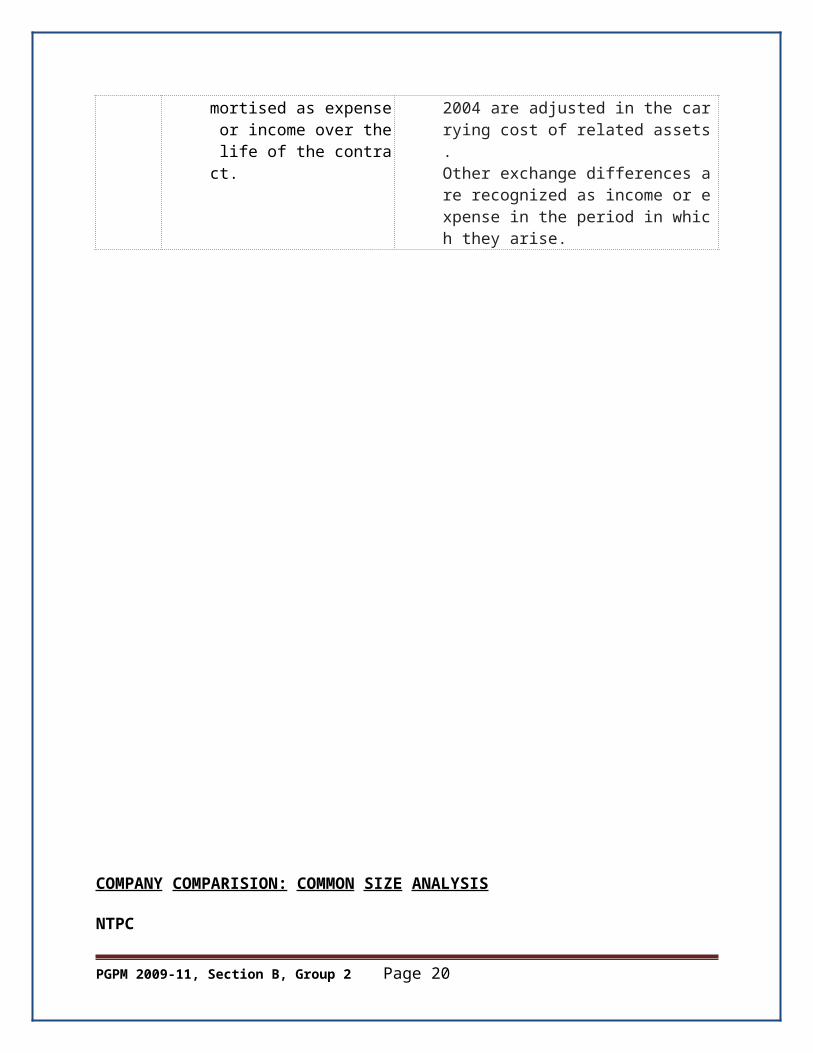
In,respect,of,foreign,exchange,contracts,,the,premium,or,discount,arising,at,the,inception,of,such,a,contract,is,amortised,as,expense,or,income,over,the,life,of,the,contract.
ng,at,the,date,of,transaction., Exchange,differences,
(loss),,arising,from,translation,of,foreign,currency,loans,relating,to,fixed,assets/capital,work-in-progress,to,the,extent,regarded,as,an,adjustment,to,interest,cost,are,treated,as,borrowing,cost.,
Exchange,differences,arising,from,settlement,/,translation,of,foreign,currency,loans,(other,than,regarded,as,borrowing,cost),,deposits,/,liabilities,relating,to,fixed,assets,/,capital,work-in-progress,in,respect,of,transactions,entered,prior,to,01.04.2004,,are,adjusted,in,the,carrying,cost,of,related,assets.,Such,exchange,differences,arising,from,settlement,/,translation,of,long,term,foreign,currency,monetary,items,in,respect,of,transactions,entered,on,or,after,01.04.2004,are,adjusted,in,the,carrying,cost,of,related,assets.,
Other,exchange,differences,are,recognized,as,income,or,expense,in,the,period,in,which,they,arise.
,
,
PGPM 2009-11, Section B, Group 2 Page 14
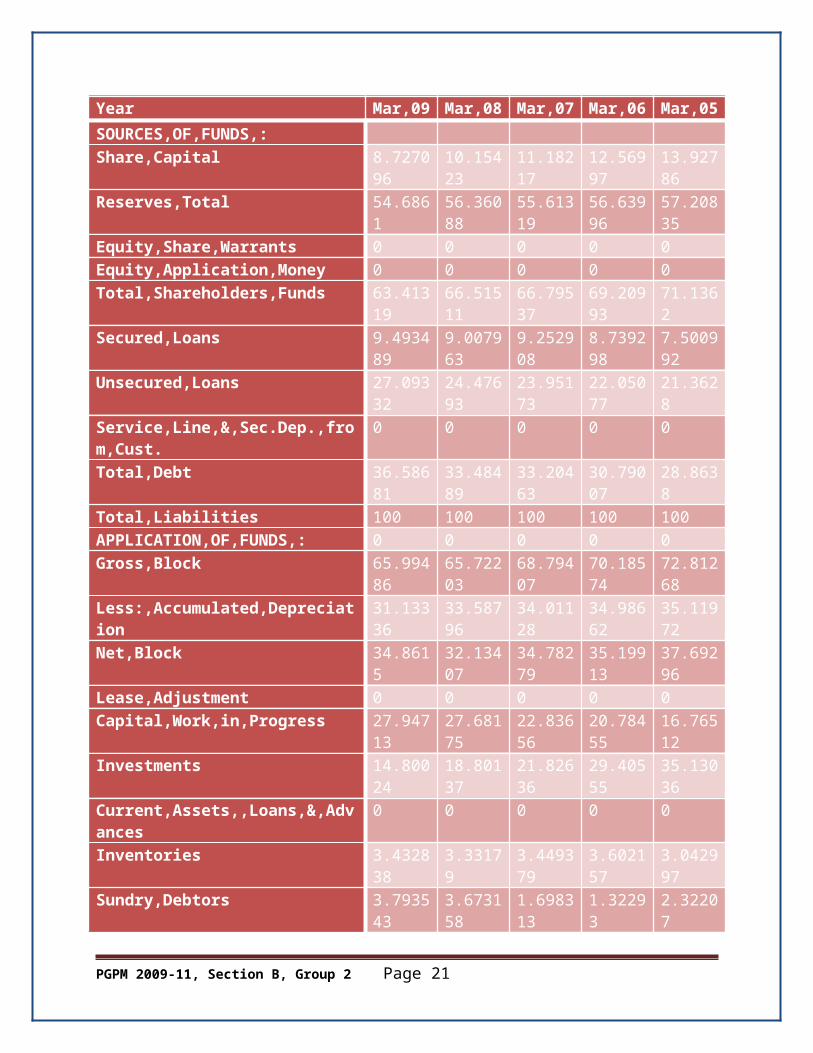
COMPANY , COMPARISION: , COMMON , SIZE , ANALYSIS
NTPC ,,,,,,,,,,
Year Mar,09 Mar,08 Mar,07 Mar,06 Mar,05
SOURCES,OF,FUNDS,:Share,Capital 8.72709
610.15423
11.18217
12.56997
13.92786
Reserves,Total 54.6861 56.36088
55.61319
56.63996
57.20835
Equity,Share,Warrants 0 0 0 0 0Equity,Application,Money 0 0 0 0 0Total,Shareholders,Funds 63.4131
966.51511
66.79537
69.20993
71.1362
Secured,Loans 9.493489
9.007963
9.252908
8.739298
7.500992
Unsecured,Loans 27.09332
24.47693
23.95173
22.05077
21.3628
Service,Line,&,Sec.Dep.,from,Cust. 0 0 0 0 0Total,Debt 36.5868
133.48489
33.20463
30.79007
28.8638
Total,Liabilities 100 100 100 100 100APPLICATION,OF,FUNDS,: 0 0 0 0 0Gross,Block 65.9948
665.72203
68.79407
70.18574
72.81268
Less:,Accumulated,Depreciation 31.13336
33.58796
34.01128
34.98662
35.11972
Net,Block 34.8615 32.13407
34.78279
35.19913
37.69296
Lease,Adjustment 0 0 0 0 0Capital,Work,in,Progress 27.9471
327.68175
22.83656
20.78455
16.76512
Investments 14.80024
18.80137
21.82636
29.40555
35.13036
Current,Assets,,Loans,&,Advances 0 0 0 0 0Inventories 3.43283
83.33179 3.44937
93.602157
3.042997
PGPM 2009-11, Section B, Group 2 Page 15
Sundry,Debtors 3.793543
3.673158
1.698313
1.32293 2.32207
Cash,and,Bank 17.22198
18.39005
18.05666
12.91435
10.26714
Loans,and,Advances 9.313454
6.104731
11.95586
10.02488
8.169219
Total,Current,Assets 33.76181
31.49973
35.16021
27.86432
23.80142
Less:,Current,Liabilities,and,Provisions
0 0 0 0 0
Current,Liabilities 7.93128 7.147185
7.21949 7.485426
8.835249
Provisions 3.439294
2.969609
7.386297
5.767964
4.554445
Total,Current,Liabilities 11.37057
10.11679
14.60579
13.25339
13.38969
Net,Current,Assets 22.39124
21.38294
20.55442
14.61093
10.41173
Miscellaneous,Expenses,not,written,off
0 0 0 0 0
Deferred,Tax,Assets 1.978692
1.849941
1.435083
1.437875
1.104533
Deferred,Tax,Liability 1.978798
1.850064
1.435219
1.438027
1.104702
Net,Deferred,Tax -0.00011 -0.00012 -0.00014 -0.00015 -0.00017Total,Assets 100 100 100 100 100Contingent,Liabilities 8.28764
56.461246
5.786034
4.82676 3.322213
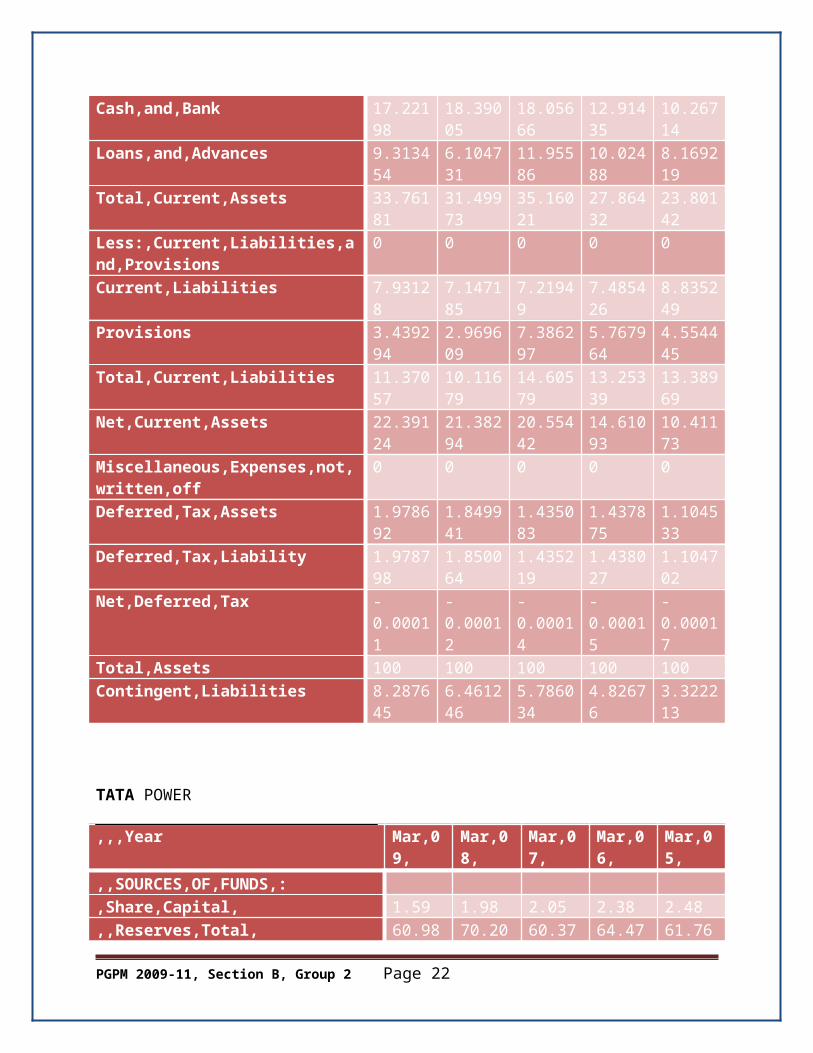
TATA,POWER
,,,Year Mar,09,
Mar,08,
Mar,07,
Mar,06,
Mar,05,
,,SOURCES,OF,FUNDS,:,Share,Capital, 1.59 1.98 2.05 2.38 2.48,,Reserves,Total, 60.98 70.20 60.37 64.47 61.76,,Equity,Share,Warrants 0 0.55 0 0 0,,,Equity,Application,Money 0 0 0 0 0,,Total,Shareholders,Funds 62.58 72.73 62.41 66.85 64.23,,Secured,Loans, 28.30 20.93 14.01 11.38 13.24,Unsecured,Loans, 9.12 6.34 23.58 21.77 22.52,,,Service,Line,&,Sec.Dep.,from,Cust. 0 0 0 0 0
PGPM 2009-11, Section B, Group 2 Page 16
,,Total,Debt 37.42 27.27 37.59 33.15 35.77,,Total,Liabilities, 100.00 100.00 100.00 100.00 100.00,,APPLICATION,OF,FUNDS,: 0 0 0 0 0,Gross,Block, 64.69 58.21 64.45 71.29 68.35,,Less:,Accumulated,Depreciation, 27.32 31.22 33.10 35.16 33.23,Net,Block, 37.37 26.99 31.35 36.13 35.12,,,Lease,Adjustment 0 0 0 0 0,Capital,Work,in,Progress 5.48 15.10 8.08 2.55 5.47,,Investments, 39.19 39.78 36.93 41.06 43.81,,Current,Assets,,Loans,&,Advances 0 0 0 0 0,Inventories, 4.64 4.25 4.1 5.32 3.71,,Sundry,Debtors, 11.43 12.70 15.28 12.73 8.71,Cash,and,Bank 0.33 0.26 14.15 11.92 12.25,,Loans,and,Advances, 17.30 17.59 8.29 5.8 6.88,,Total,Current,Assets 33.70 34.80 41.82 35.77 31.56,,,Less:,Current,Liabilities,and,Provisions
0 0 0 0 0
,,Current,Liabilities, 10.22 11.26 11.65 8.81 8.84,Provisions, 4.69 5.26 6.53 7.09 7.26,,,Total,Current,Liabilities 14.91 16.52 18.18 15.90 16.10,,Net,Current,Assets 18.79 18.28 23.63 19.88 15.46,,Miscellaneous,Expenses,not,written,off, 0 0.02 0.06 0.19 0.28,,Deferred,Tax,Assets 0.66 0.73 0.65 0.75 0.66,,,Deferred,Tax,Liability 1.48 0.9 0.71 0.56 0.8,,Net,Deferred,Tax -0.82 -0.17 -0.06 0.19 -0.14,,,Total,Assets 100.00 100.00 100.00 100.00 100.00,Contingent,Liabilities 73.47 75.87 14.05 18.58 3.48
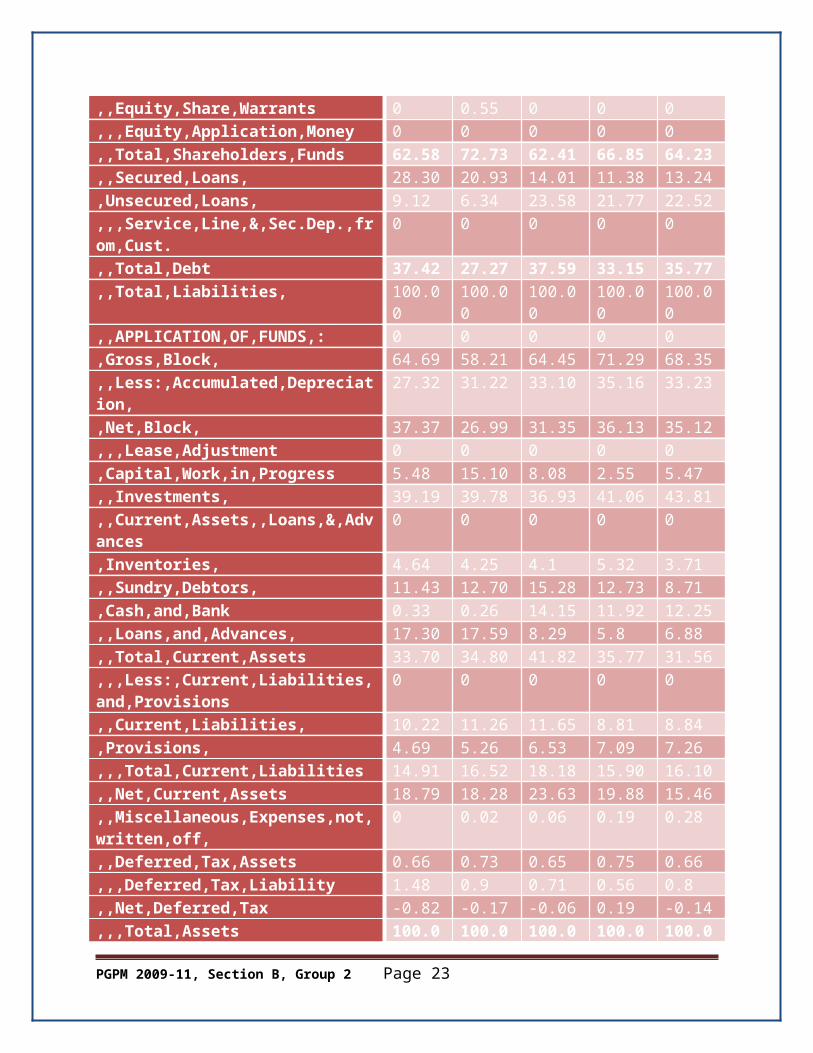
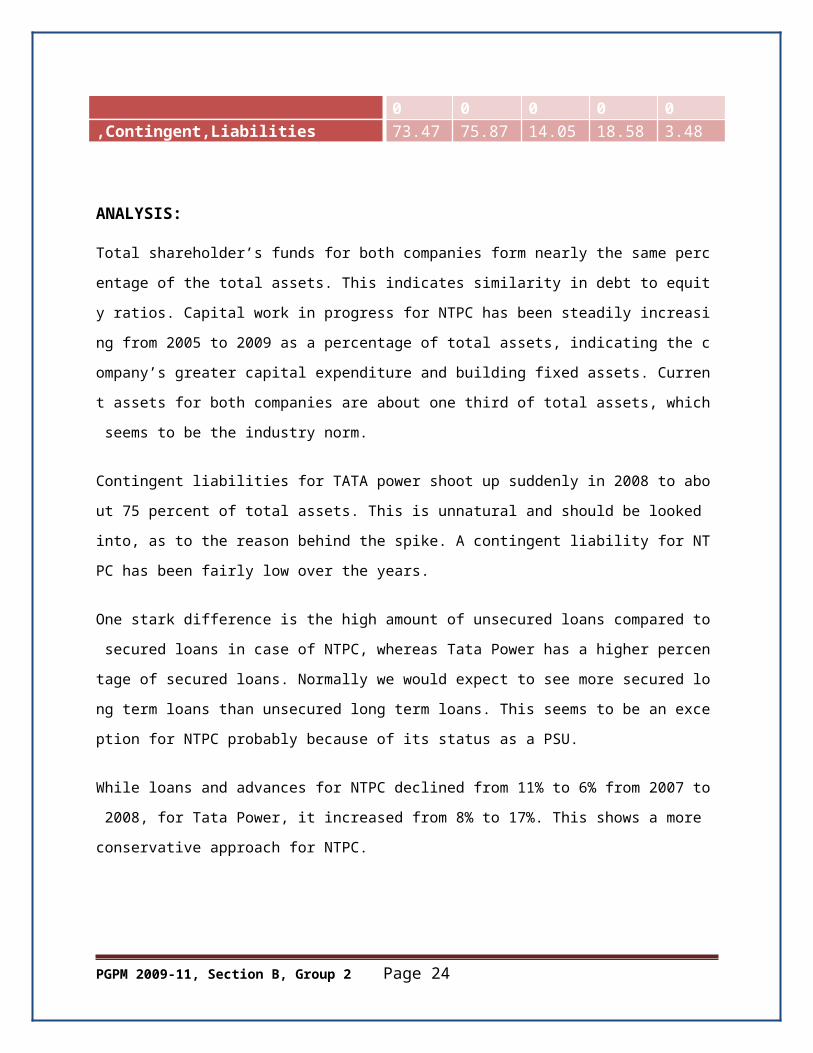
ANALYSIS:
Total,shareholder’s,funds,for,both,companies,form,nearly,the,same,percentage,of,the,total,asse
ts.,This,indicates,similarity,in,debt,to,equity,ratios.,Capital,work,in,progress,for,NTPC,has,been,
steadily,increasing,from,2005,to,2009,as,a,percentage,of,total,assets,,indicating,the,company’s,
greater,capital,expenditure,and,building,fixed,assets.,Current,assets,for,both,companies,are,ab
out,one,third,of,total,assets,,which,seems,to,be,the,industry,norm.
Contingent,liabilities,for,TATA,power,shoot,up,suddenly,in,2008,to,about,75,percent,of,total,ass
ets.,This,is,unnatural,and,should,be,looked,into,,as,to,the,reason,behind,the,spike.,A,contingent
,liability,for,NTPC,has,been,fairly,low,over,the,years.,
PGPM 2009-11, Section B, Group 2 Page 17
One,stark,difference,is,the,high,amount,of,unsecured,loans,compared,to,secured,loans,in,case,
of,NTPC,,whereas,Tata,Power,has,a,higher,percentage,of,secured,loans.,Normally,we,would,ex
pect,to,see,more,secured,long,term,loans,than,unsecured,long,term,loans.,This,seems,to,be,an,
exception,for,NTPC,probably,because,of,its,status,as,a,PSU.,
While,loans,and,advances,for,NTPC,declined,from,11%,to,6%,from,2007,to,2008,,for,Tata,Pow
er,,it,increased,from,8%,to,17%.,This,shows,a,more,conservative,approach,for,NTPC.
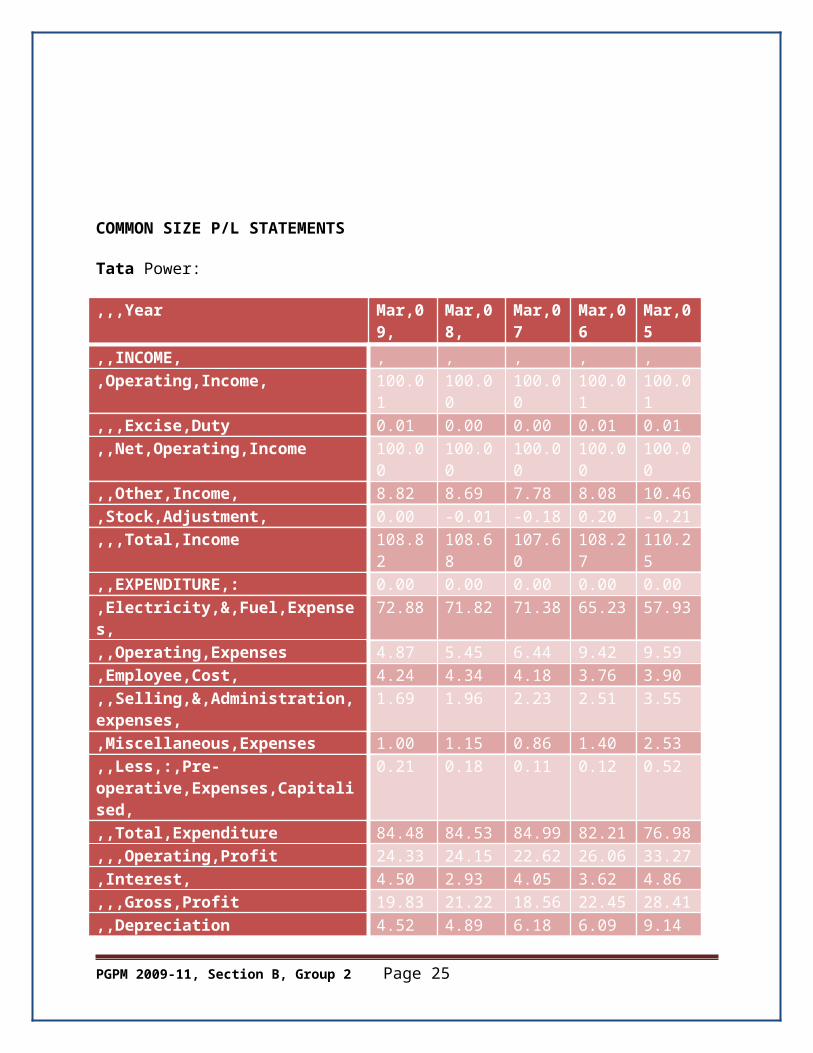
COMMON,SIZE,P/L,STATEMENTS
Tata,Power:
,,,Year Mar,09, Mar,08, Mar,07 Mar,06 Mar,05
,,INCOME, , , , , ,,Operating,Income, 100.01 100.00 100.00 100.01 100.01,,,Excise,Duty 0.01 0.00 0.00 0.01 0.01,,Net,Operating,Income 100.00 100.00 100.00 100.00 100.00,,Other,Income, 8.82 8.69 7.78 8.08 10.46,Stock,Adjustment, 0.00 -0.01 -0.18 0.20 -0.21,,,Total,Income 108.82 108.68 107.60 108.27 110.25,,EXPENDITURE,: 0.00 0.00 0.00 0.00 0.00,Electricity,&,Fuel,Expenses, 72.88 71.82 71.38 65.23 57.93,,Operating,Expenses 4.87 5.45 6.44 9.42 9.59,Employee,Cost, 4.24 4.34 4.18 3.76 3.90,,Selling,&,Administration,expenses, 1.69 1.96 2.23 2.51 3.55,Miscellaneous,Expenses 1.00 1.15 0.86 1.40 2.53,,Less,:,Pre-operative,Expenses,Capitalised,
0.21 0.18 0.11 0.12 0.52
,,Total,Expenditure 84.48 84.53 84.99 82.21 76.98,,,Operating,Profit 24.33 24.15 22.62 26.06 33.27,Interest, 4.50 2.93 4.05 3.62 4.86,,,Gross,Profit 19.83 21.22 18.56 22.45 28.41
PGPM 2009-11, Section B, Group 2 Page 18
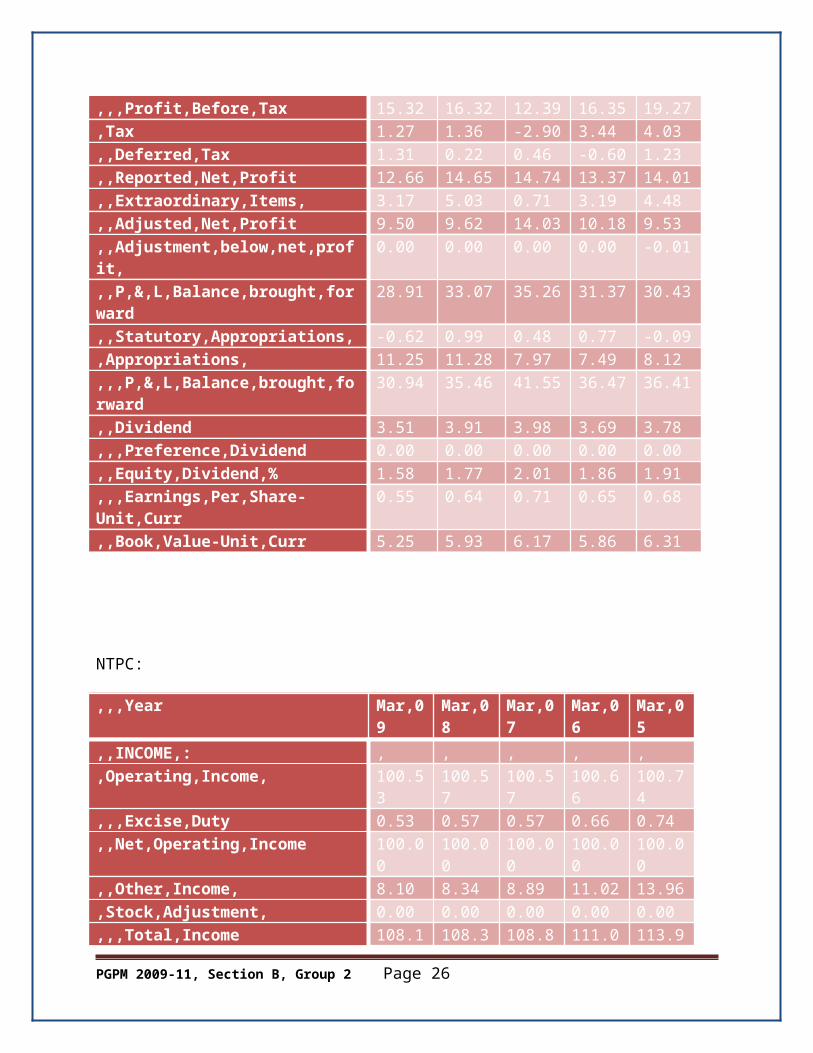
,,Depreciation 4.52 4.89 6.18 6.09 9.14,,,Profit,Before,Tax 15.32 16.32 12.39 16.35 19.27,Tax 1.27 1.36 -2.90 3.44 4.03,,Deferred,Tax 1.31 0.22 0.46 -0.60 1.23,,Reported,Net,Profit 12.66 14.65 14.74 13.37 14.01,,Extraordinary,Items, 3.17 5.03 0.71 3.19 4.48,,Adjusted,Net,Profit 9.50 9.62 14.03 10.18 9.53,,Adjustment,below,net,profit, 0.00 0.00 0.00 0.00 -0.01,,P,&,L,Balance,brought,forward 28.91 33.07 35.26 31.37 30.43,,Statutory,Appropriations, -0.62 0.99 0.48 0.77 -0.09,Appropriations, 11.25 11.28 7.97 7.49 8.12,,,P,&,L,Balance,brought,forward 30.94 35.46 41.55 36.47 36.41,,Dividend 3.51 3.91 3.98 3.69 3.78,,,Preference,Dividend 0.00 0.00 0.00 0.00 0.00,,Equity,Dividend,% 1.58 1.77 2.01 1.86 1.91,,,Earnings,Per,Share-Unit,Curr 0.55 0.64 0.71 0.65 0.68,,Book,Value-Unit,Curr 5.25 5.93 6.17 5.86 6.31
NTPC:
,,,Year Mar,09 Mar,08 Mar,07 Mar,06 Mar,05
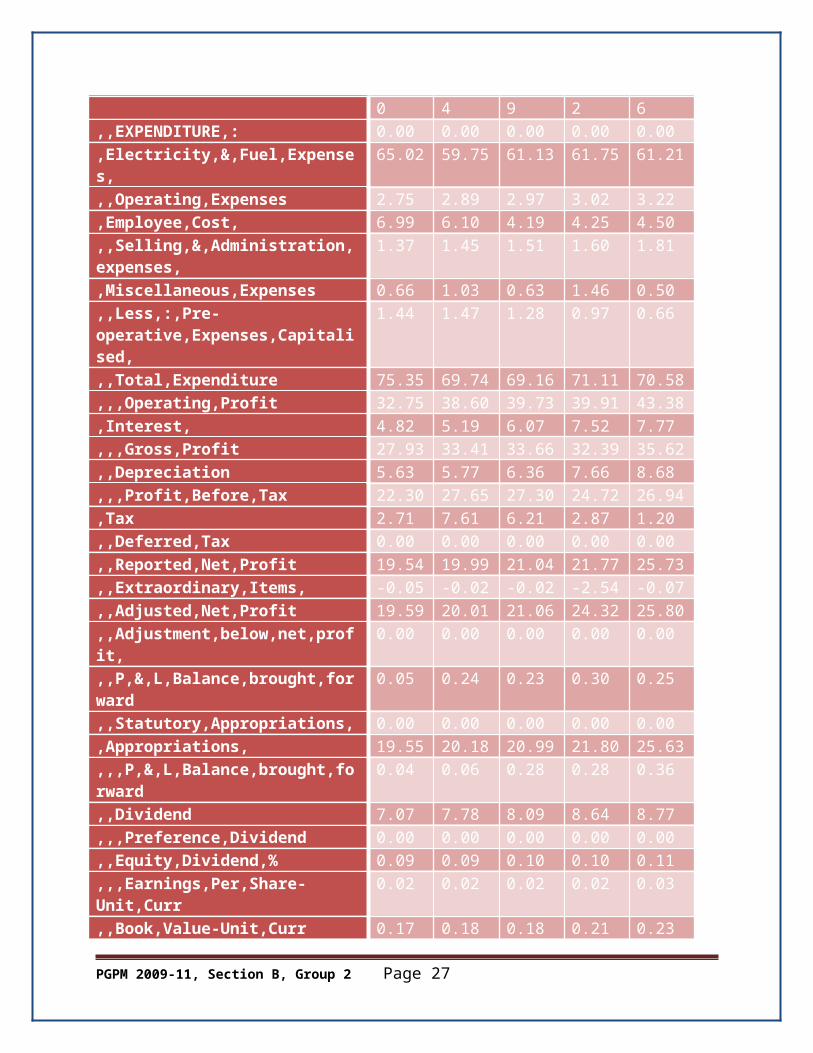
,,INCOME,: , , , , ,,Operating,Income, 100.53 100.57 100.57 100.66 100.74,,,Excise,Duty 0.53 0.57 0.57 0.66 0.74,,Net,Operating,Income 100.00 100.00 100.00 100.00 100.00,,Other,Income, 8.10 8.34 8.89 11.02 13.96,Stock,Adjustment, 0.00 0.00 0.00 0.00 0.00,,,Total,Income 108.10 108.34 108.89 111.02 113.96,,EXPENDITURE,: 0.00 0.00 0.00 0.00 0.00,Electricity,&,Fuel,Expenses, 65.02 59.75 61.13 61.75 61.21,,Operating,Expenses 2.75 2.89 2.97 3.02 3.22,Employee,Cost, 6.99 6.10 4.19 4.25 4.50,,Selling,&,Administration,expenses, 1.37 1.45 1.51 1.60 1.81,Miscellaneous,Expenses 0.66 1.03 0.63 1.46 0.50,,Less,:,Pre-operative,Expenses,Capitalised,
1.44 1.47 1.28 0.97 0.66
,,Total,Expenditure 75.35 69.74 69.16 71.11 70.58,,,Operating,Profit 32.75 38.60 39.73 39.91 43.38,Interest, 4.82 5.19 6.07 7.52 7.77
PGPM 2009-11, Section B, Group 2 Page 19
,,,Gross,Profit 27.93 33.41 33.66 32.39 35.62,,Depreciation 5.63 5.77 6.36 7.66 8.68,,,Profit,Before,Tax 22.30 27.65 27.30 24.72 26.94,Tax 2.71 7.61 6.21 2.87 1.20,,Deferred,Tax 0.00 0.00 0.00 0.00 0.00,,Reported,Net,Profit 19.54 19.99 21.04 21.77 25.73,,Extraordinary,Items, -0.05 -0.02 -0.02 -2.54 -0.07,,Adjusted,Net,Profit 19.59 20.01 21.06 24.32 25.80,,Adjustment,below,net,profit, 0.00 0.00 0.00 0.00 0.00,,P,&,L,Balance,brought,forward 0.05 0.24 0.23 0.30 0.25,,Statutory,Appropriations, 0.00 0.00 0.00 0.00 0.00,Appropriations, 19.55 20.18 20.99 21.80 25.63,,,P,&,L,Balance,brought,forward 0.04 0.06 0.28 0.28 0.36,,Dividend 7.07 7.78 8.09 8.64 8.77,,,Preference,Dividend 0.00 0.00 0.00 0.00 0.00,,Equity,Dividend,% 0.09 0.09 0.10 0.10 0.11,,,Earnings,Per,Share-Unit,Curr 0.02 0.02 0.02 0.02 0.03,,Book,Value-Unit,Curr 0.17 0.18 0.18 0.21 0.23
ANALYSIS:
NTPC,and,Tata,power,have,been,able,to,reduce,operating,expenses,over,the,years.,But,Tata,P
ower,has,brought,it,down,drastically,from,9%,to,about,4%.,
Operating,profit,margin,for,NTPC,has,dropped,from,42%,to,32%,over,the,years.,For,tata,power,
,it,has,stayed,constant,at,about,24%.,Interest,as,a,percentage,of,net,income,has,consistently,dr
opped,for,NTPC,,whereas,it,has,stayed,nearly,contant,for,tata,power.,This,shows,a,decrease,in,
dependence,on,loans,by,NTPC,as,interest,payments,are,directly,proportional,to,the,debt,of,a,co
mpany.,Depreciation,margin,also,has,consistently,dropped,as,a,percentage,of,net,income,for,bo
th,companies.,
PBT,margin,has,stayed,nearly,constant,for,Tata,Power,,and,in,the,case,of,NTPC,there,was,a,re
duction,in,2009.
PGPM 2009-11, Section B, Group 2 Page 20
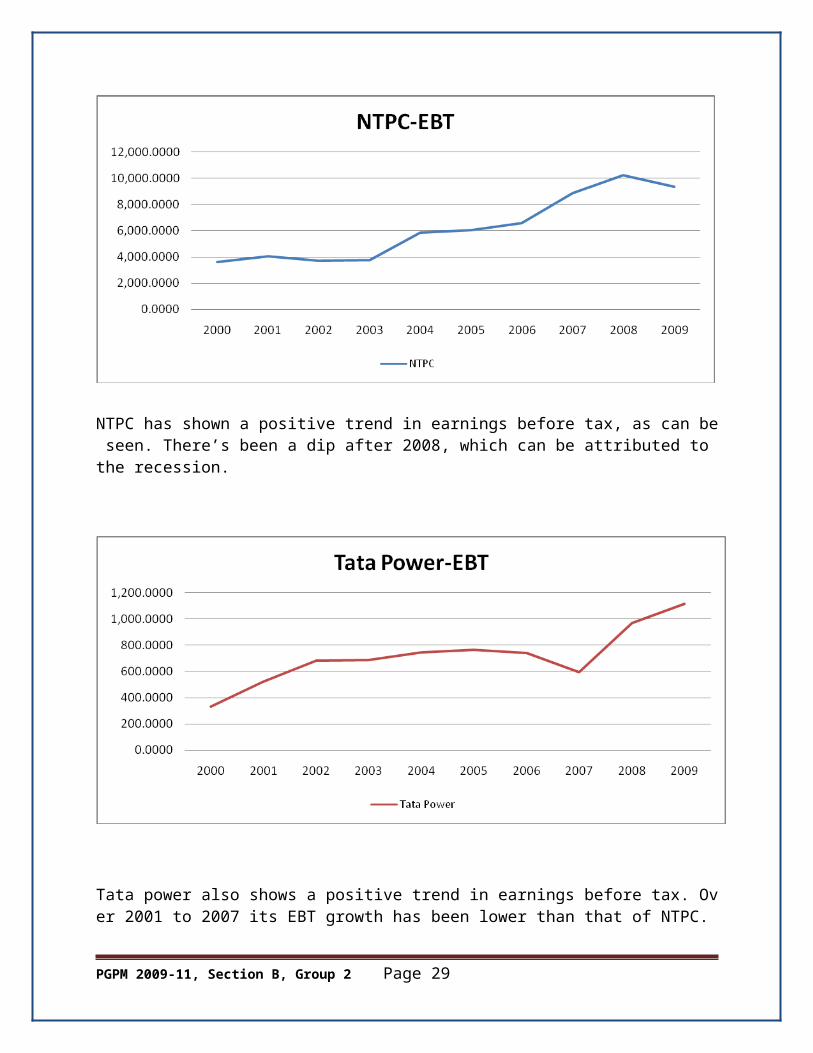
NTPC,has,shown,a,positive,trend,in,earnings,before,tax,,as,can,be,seen.,There’s,been,a,dip,after,2008,,which,can,be,attributed,to,the,recession.,
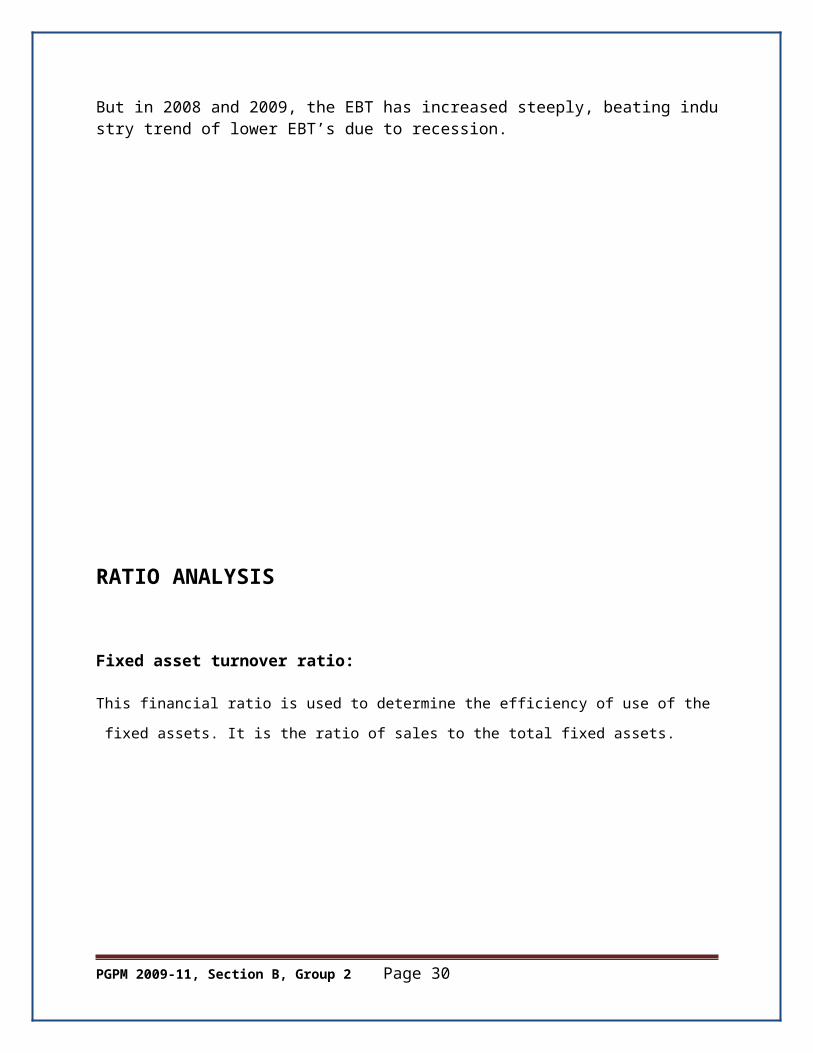
Tata,power,also,shows,a,positive,trend,in,earnings,before,tax.,Over,2001,to,2007,its,EBT,growth,has,been,lower,than,that,of,NTPC.,But,in,2008,and,2009,,the,EBT,has,increased,steeply,,beating,industry,trend,of,lower,EBT’s,due,to,recession.
PGPM 2009-11, Section B, Group 2 Page 21
RATIO,ANALYSIS
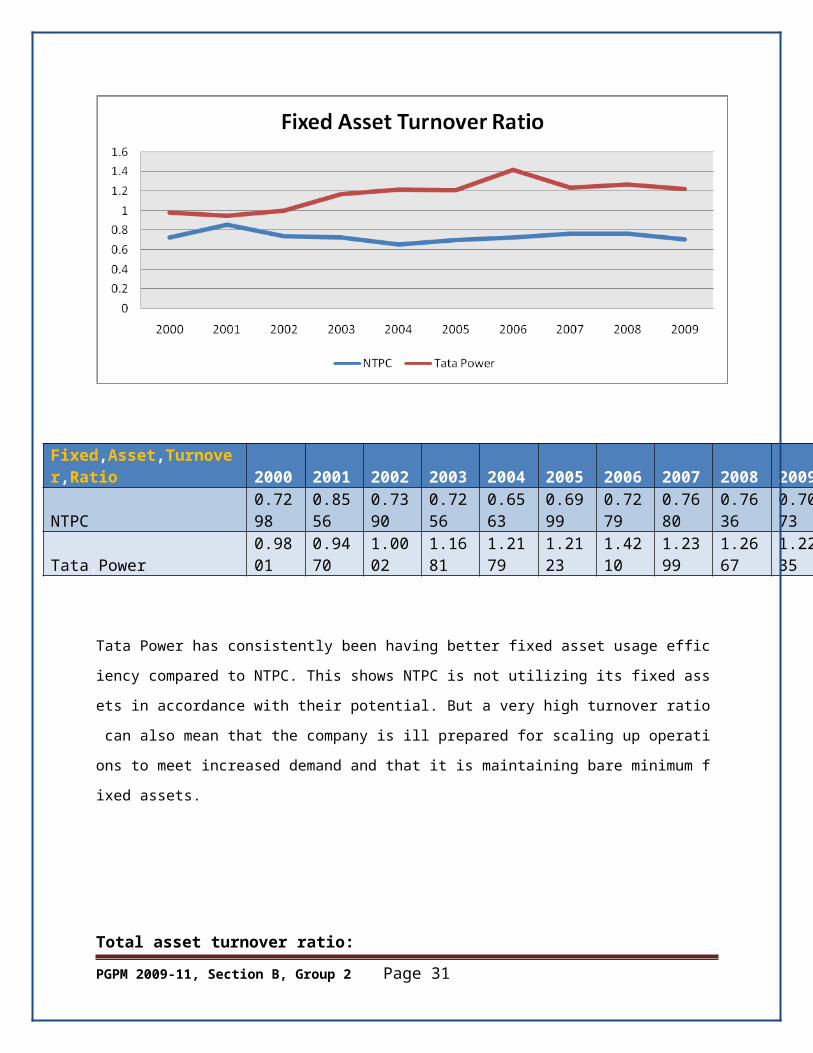
Fixed,asset,turnover,ratio:
This,financial,ratio,is,used,to,determine,the,efficiency,of,use,of,the,fixed,assets.,It,is,the,ratio,of,
sales,to,the,total,fixed,assets.
PGPM 2009-11, Section B, Group 2 Page 22
Fixed,Asset,Turnover,Ratio 2000 2001 2002 2003 2004 2005 2006 2007 2008 2009NTPC 0.7298 0.8556 0.7390 0.7256 0.6563 0.6999 0.7279 0.7680 0.7636 0.7073Tata,Power 0.9801 0.9470 1.0002 1.1681 1.2179 1.2123 1.4210 1.2399 1.2667 1.2235
Tata,Power,has,consistently,been,having,better,fixed,asset,usage,efficiency,compared,to,NTPC
.,This,shows,NTPC,is,not,utilizing,its,fixed,assets,in,accordance,with,their,potential.,But,a,very,h
igh,turnover,ratio,can,also,mean,that,the,company,is,ill,prepared,for,scaling,up,operations,to,me
et,increased,demand,and,that,it,is,maintaining,bare,minimum,fixed,assets.
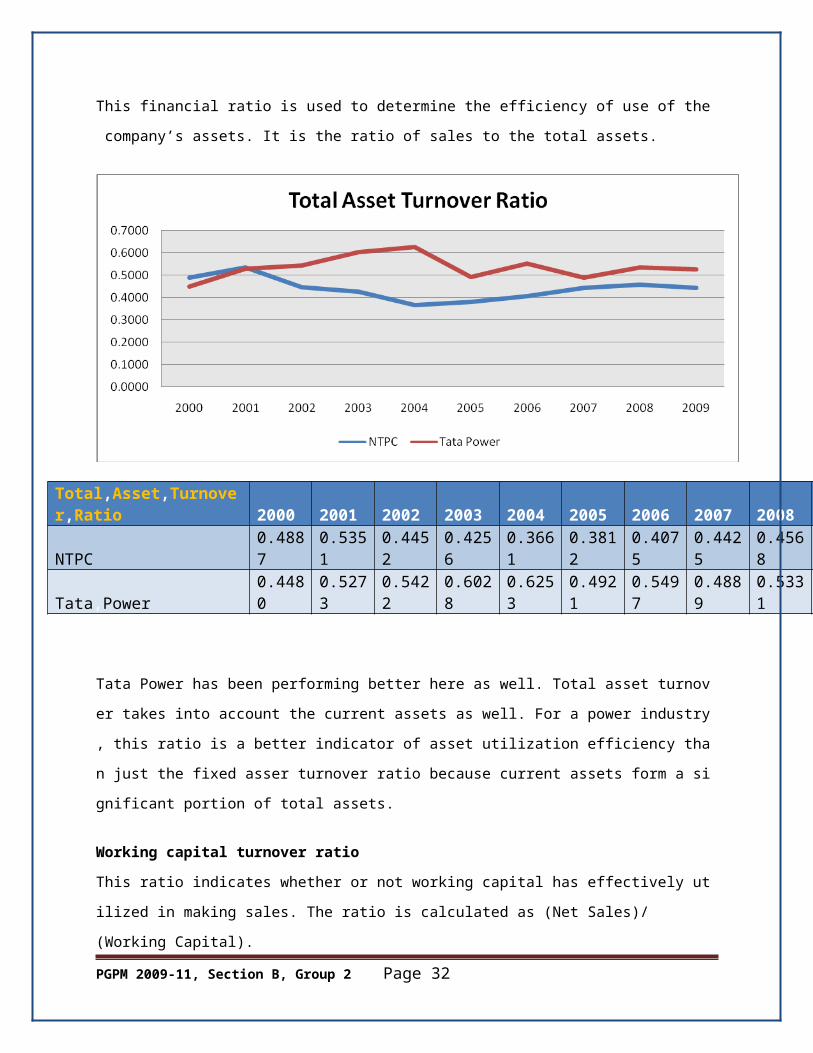
Total,asset,turnover,ratio:
This,financial,ratio,is,used,to,determine,the,efficiency,of,use,of,the,company’s,assets.,It,is,the,ra
tio,of,sales,to,the,total,assets.
Total,Asset,Turnover,Ratio 2000 2001 2002 2003 2004 2005 2006 2007 2008NTPC 0.4887 0.5351 0.4452 0.4256 0.3661 0.3812 0.4075 0.4425 0.4568Tata,Power 0.4480 0.5273 0.5422 0.6028 0.6253 0.4921 0.5497 0.4889 0.5331
PGPM 2009-11, Section B, Group 2 Page 23
Tata,Power,has,been,performing,better,here,as,well.,Total,asset,turnover,takes,into,account,the
,current,assets,as,well.,For,a,power,industry,,this,ratio,is,a,better,indicator,of,asset,utilization,effi
ciency,than,just,the,fixed,asser,turnover,ratio,because,current,assets,form,a,significant,portion,o
f,total,assets.,
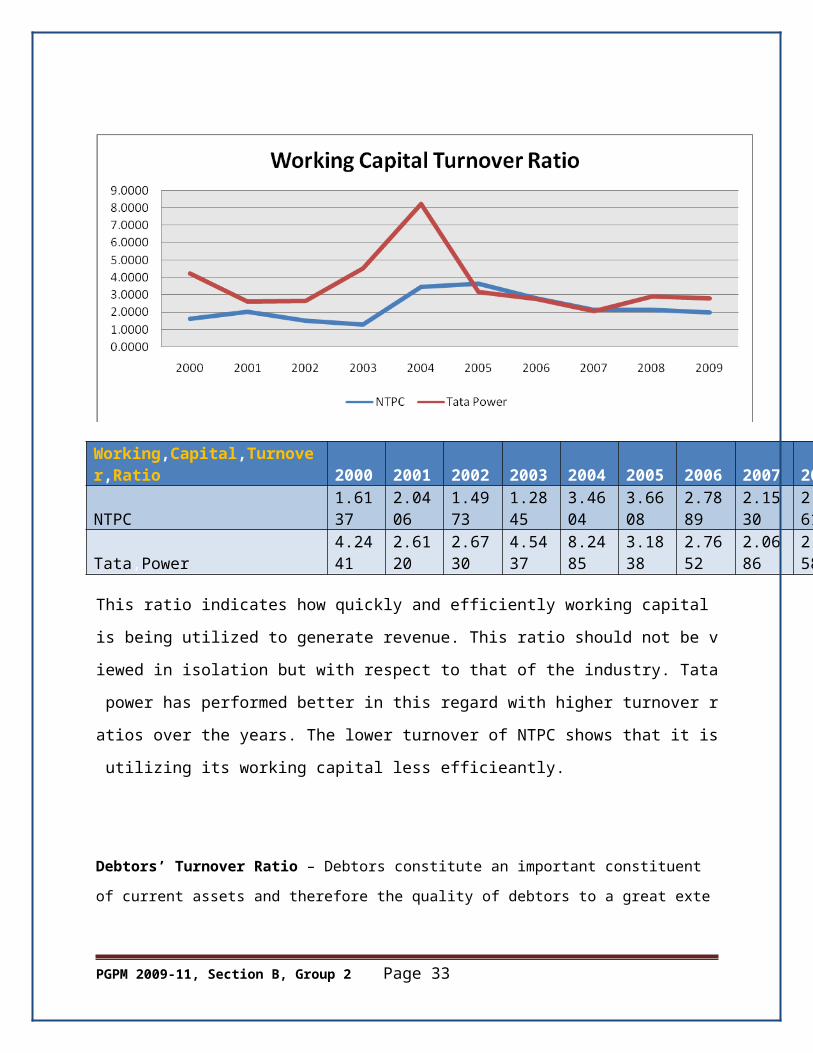
Working,capital,turnover,ratio,
This,ratio,indicates,whether,or,not,working,capital,has,effectively,utilized,in,making,sales.,The,ra
tio,is,calculated,as,(Net,Sales)/,(Working,Capital).
Working,Capital,Turnover,Ratio 2000 2001 2002 2003 2004 2005 2006 2007 2008NTPC 1.6137 2.0406 1.4973 1.2845 3.4604 3.6608 2.7889 2.1530 2.1361Tata,Power 4.2441 2.6120 2.6730 4.5437 8.2485 3.1838 2.7652 2.0686 2.9158
This,ratio,indicates,how,quickly,and,efficiently,working,capital,is,being,utilized,to,generate,reve
nue.,This,ratio,should,not,be,viewed,in,isolation,but,with,respect,to,that,of,the,industry.,Tata,po
wer,has,performed,better,in,this,regard,with,higher,turnover,ratios,over,the,years.,The,lower,turn
over,of,NTPC,shows,that,it,is,utilizing,its,working,capital,less,efficieantly.
PGPM 2009-11, Section B, Group 2 Page 24
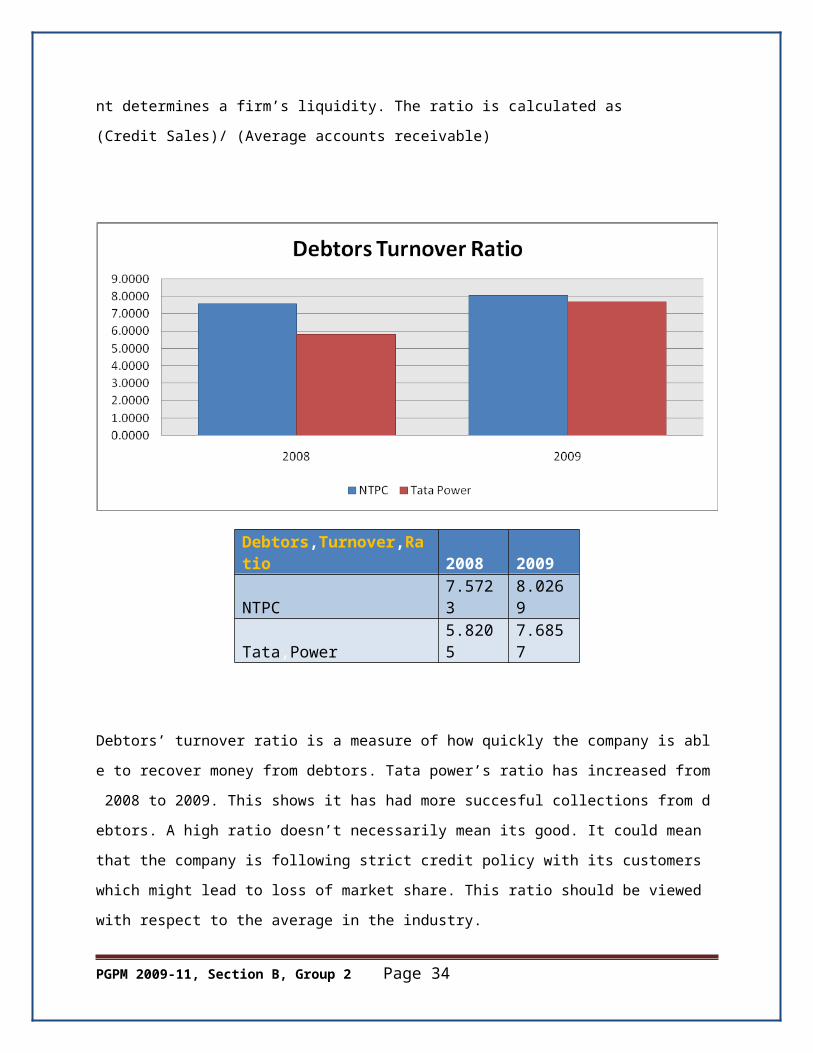
Debtors’,Turnover,Ratio,–,Debtors,constitute,an,important,constituent,of,current,assets,and,th
erefore,the,quality,of,debtors,to,a,great,extent,determines,a,firm’s,liquidity.,The,ratio,is,calculate
d,as,(Credit,Sales)/,(Average,accounts,receivable)
Debtors,Turnover,Ratio 2008 2009NTPC 7.5723 8.0269Tata,Power 5.8205 7.6857
Debtors’,turnover,ratio,is,a,measure,of,how,quickly,the,company,is,able,to,recover,money,from,
debtors.,Tata,power’s,ratio,has,increased,from,2008,to,2009.,This,shows,it,has,had,more,succe
sful,collections,from,debtors.,A,high,ratio,doesn’t,necessarily,mean,its,good.,It,could,mean,that,t
he,company,is,following,strict,credit,policy,with,its,customers,which,might,lead,to,loss,of,market,
share.,This,ratio,should,be,viewed,with,respect,to,the,average,in,the,industry.
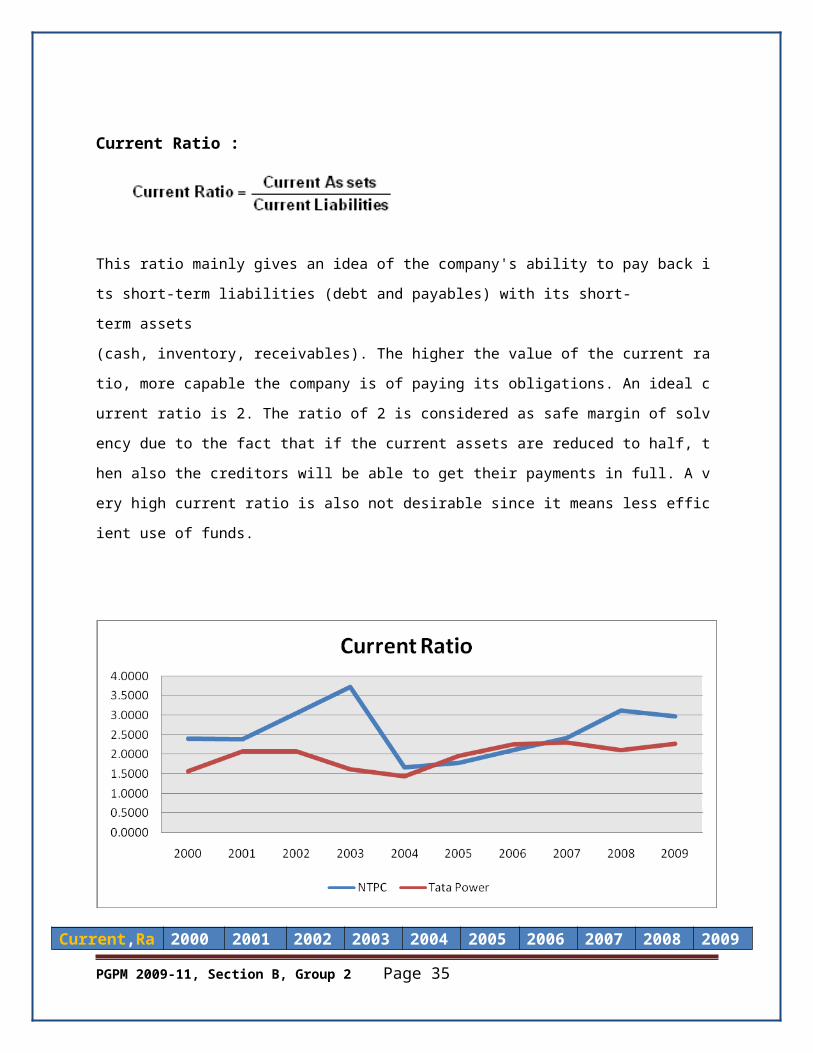
Current,Ratio,:
PGPM 2009-11, Section B, Group 2 Page 25
This,ratio,mainly,gives,an,idea,of,the,company's,ability,to,pay,back,its,short-term,liabilities,
(debt,and,payables),with,its,short-term,assets,
(cash,,inventory,,receivables).,The,higher,the,value,of,the,current,ratio,,more,capable,the,comp
any,is,of,paying,its,obligations.,An,ideal,current,ratio,is,2.,The,ratio,of,2,is,considered,as,safe,m
argin,of,solvency,due,to,the,fact,that,if,the,current,assets,are,reduced,to,half,,then,also,the,credi
tors,will,be,able,to,get,their,payments,in,full.,A,very,high,current,ratio,is,also,not,desirable,since,i
t,means,less,efficient,use,of,funds.
Current,Ratio 2000 2001 2002 2003 2004 2005 2006 2007 2008 2009NTPC 2.3898 2.3869 3.0555 3.7206 1.6610 1.7776 2.1024 2.4073 3.1136 2.9692Tata,Power 1.5689 2.0748 2.0712 1.6207 1.4352 1.9600 2.2506 2.2996 2.1070 2.2600
This,is,one,of,the,most,important,ratios,for,evaluating,a,company’s,short,term,liquidity.,NTPC,ha
s,had,a,higher,ratio,for,about,half,the,years,compared,to,Tata,power.,A,high,ratio,is,desirable,as
,it,indicates,that,the,company,can,meet,its,short,term,liabilities.,But,too,high,a,ratio,can,mean,th
at,current,assets,aren’t,being,utilized,efficiently,,upto,their,potential.,This,ratio,should,not,be,vie
wed,independently,but,in,conjunction,with,the,industry,average.
PGPM 2009-11, Section B, Group 2 Page 26
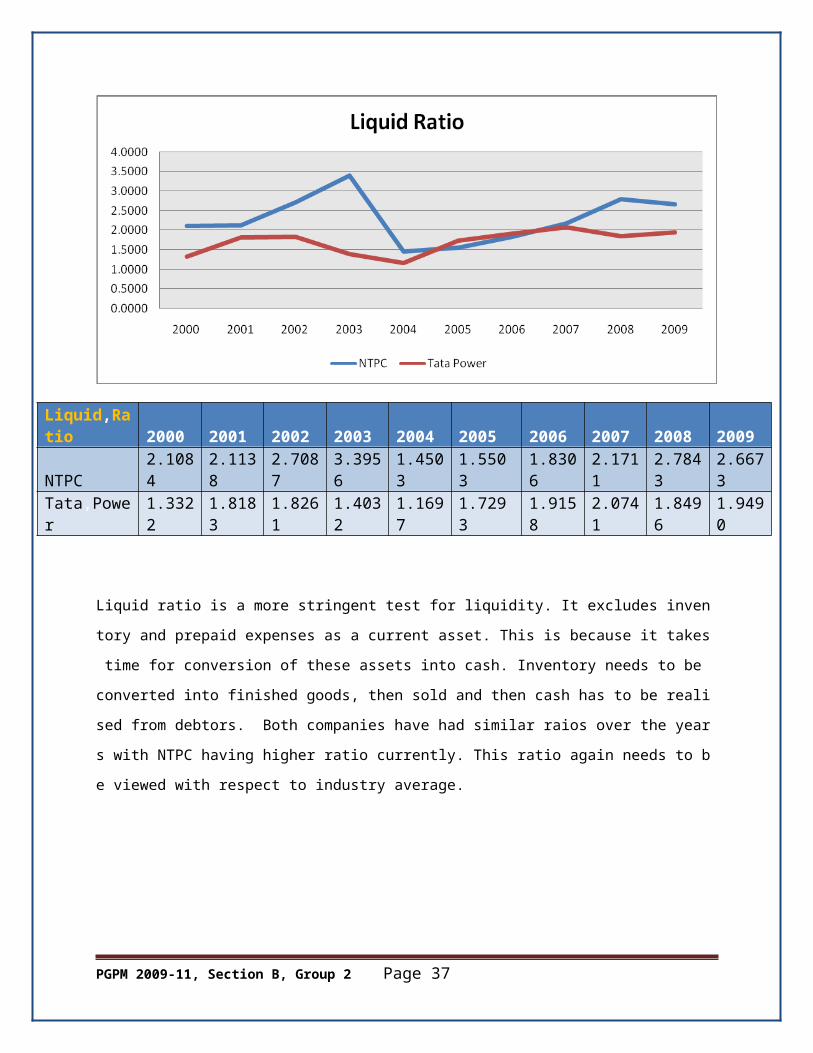
Liquid,Ratio
Liquid,Ratio 2000 2001 2002 2003 2004 2005 2006 2007 2008 2009NTPC 2.1084 2.1138 2.7087 3.3956 1.4503 1.5503 1.8306 2.1711 2.7843 2.6673Tata,Power 1.3322 1.8183 1.8261 1.4032 1.1697 1.7293 1.9158 2.0741 1.8496 1.9490
Liquid,ratio,is,a,more,stringent,test,for,liquidity.,It,excludes,inventory,and,prepaid,expenses,as,a
,current,asset.,This,is,because,it,takes,time,for,conversion,of,these,assets,into,cash.,Inventory,n
eeds,to,be,converted,into,finished,goods,,then,sold,and,then,cash,has,to,be,realised,from,debto
rs.,,Both,companies,have,had,similar,raios,over,the,years,with,NTPC,having,higher,ratio,current
ly.,This,ratio,again,needs,to,be,viewed,with,respect,to,industry,average.
PGPM 2009-11, Section B, Group 2 Page 27
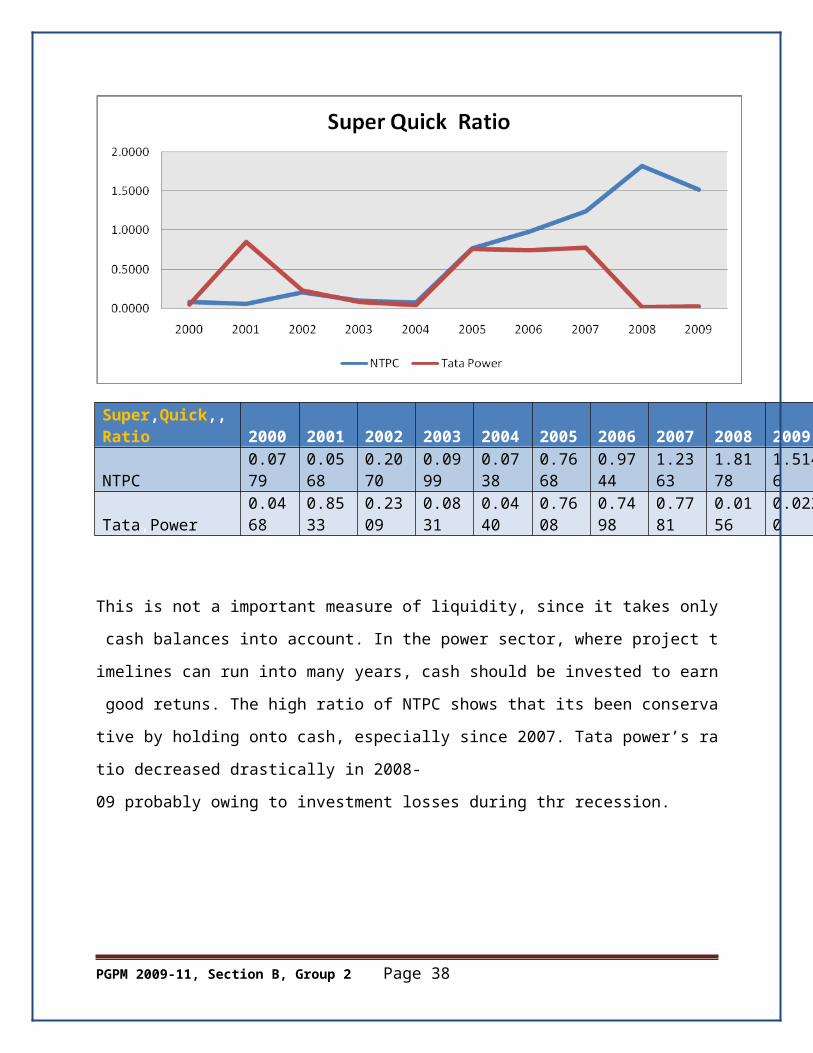
Super,Quick,,Ratio 2000 2001 2002 2003 2004 2005 2006 2007 2008 2009NTPC 0.0779 0.0568 0.2070 0.0999 0.0738 0.7668 0.9744 1.2363 1.8178 1.5146Tata,Power 0.0468 0.8533 0.2309 0.0831 0.0440 0.7608 0.7498 0.7781 0.0156 0.0220
This,is,not,a,important,measure,of,liquidity,,since,it,takes,only,cash,balances,into,account.,In,the,
power,sector,,where,project,timelines,can,run,into,many,years,,cash,should,be,invested,to,earn,g
ood,retuns.,The,high,ratio,of,NTPC,shows,that,its,been,conservative,by,holding,onto,cash,,especi
ally,since,2007.,Tata,power’s,ratio,decreased,drastically,in,2008-
09,probably,owing,to,investment,losses,during,thr,recession.
PROFITABILITY
PGPM 2009-11, Section B, Group 2 Page 28
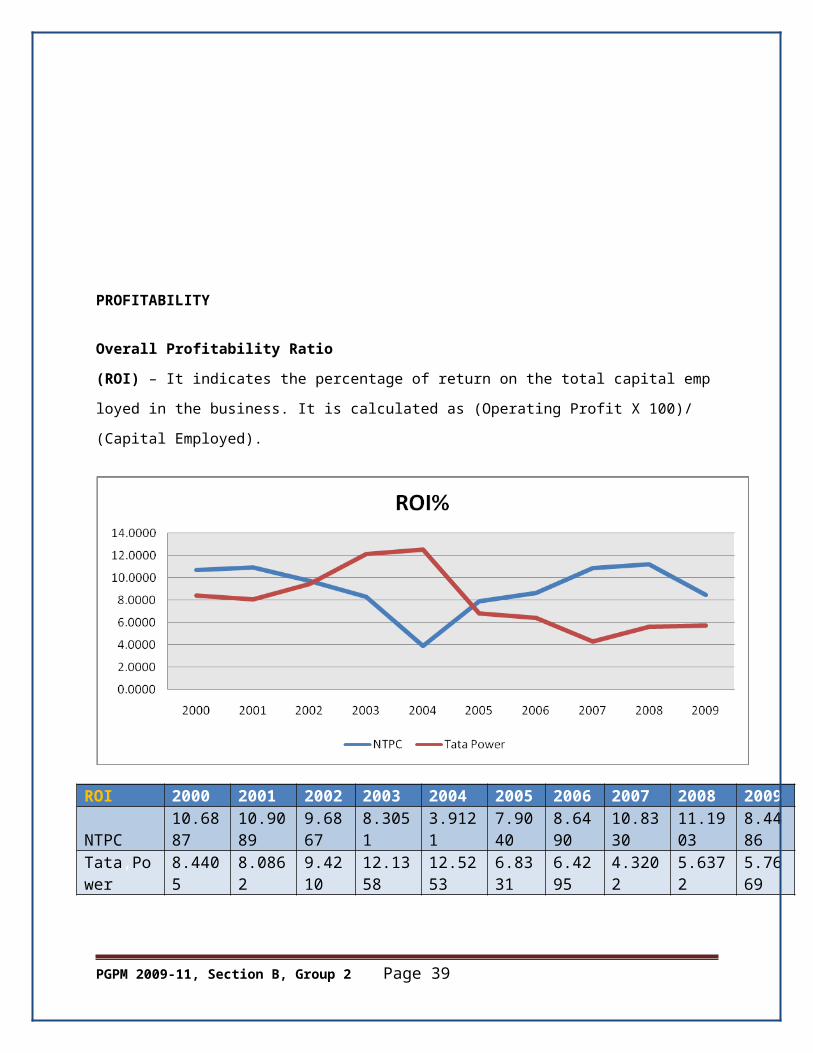
Overall,Profitability,Ratio,
(ROI),–,It,indicates,the,percentage,of,return,on,the,total,capital,employed,in,the,business.,It,is,c
alculated,as,(Operating,Profit,X,100)/,(Capital,Employed).
ROI 2000 2001 2002 2003 2004 2005 2006 2007 2008 2009NTPC 10.6887 10.9089 9.6867 8.3051 3.9121 7.9040 8.6490 10.8330 11.1903 8.4486Tata,Power 8.4405 8.0862 9.4210 12.1358 12.5253 6.8331 6.4295 4.3202 5.6372 5.7669
Return,on,investments,is,the,returns,on,total,investment,by,the,company.,This,includes,the,preference,and,normal,shareholders,and,also,creditors,who,made,long,term,loans,to,the,company,(bondholders,,banks,etc).,NTPC,has,been,performing,better,than,Tata,power,since,2005.
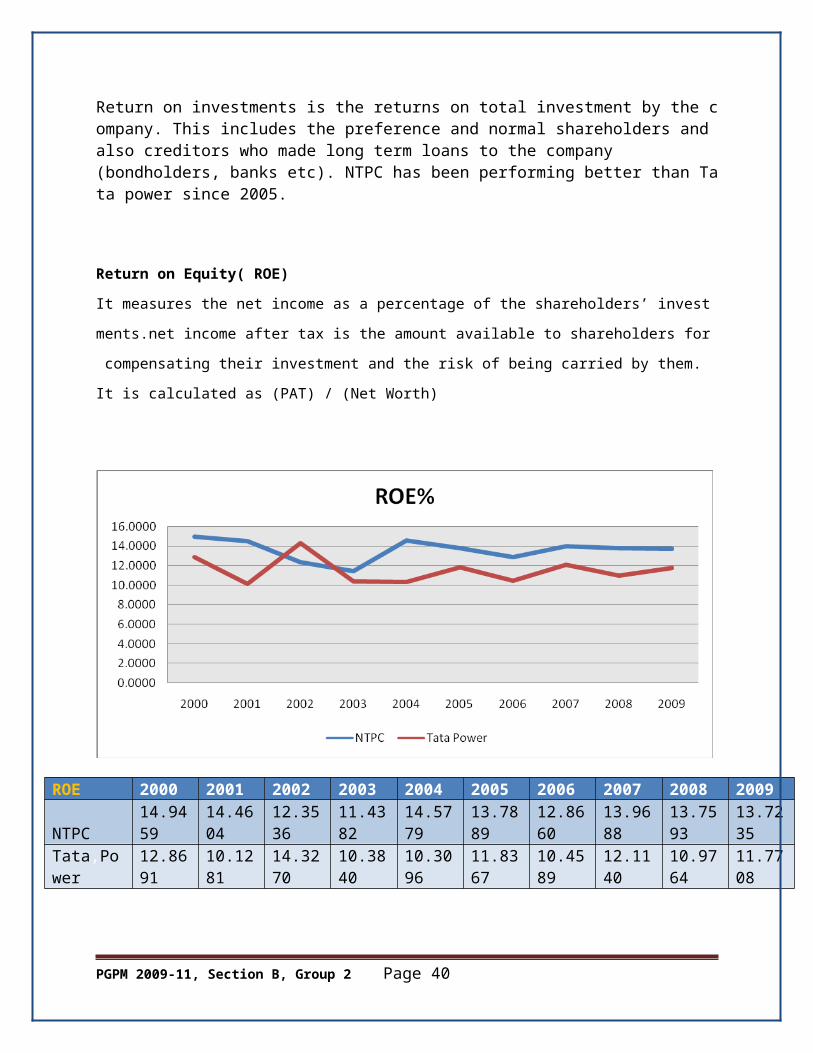
Return,on,Equity(,ROE)
It,measures,the,net,income,as,a,percentage,of,the,shareholders’,investments.net,income,after,t
ax,is,the,amount,available,to,shareholders,for,compensating,their,investment,and,the,risk,of,bei
ng,carried,by,them.,It,is,calculated,as,(PAT),/,(Net,Worth)
PGPM 2009-11, Section B, Group 2 Page 29
ROE 2000 2001 2002 2003 2004 2005 2006 2007 2008 2009NTPC 14.9459 14.4604 12.3536 11.4382 14.5779 13.7889 12.8660 13.9688 13.7593 13.7235Tata,Power 12.8691 10.1281 14.3270 10.3840 10.3096 11.8367 10.4589 12.1140 10.9764 11.7708
Return,on,equity,is,the,retuns,to,the,common,shareholders,of,a,company.,NTPC,has,been,perfo
rming,consistently,better,in,this,regard,as,well.
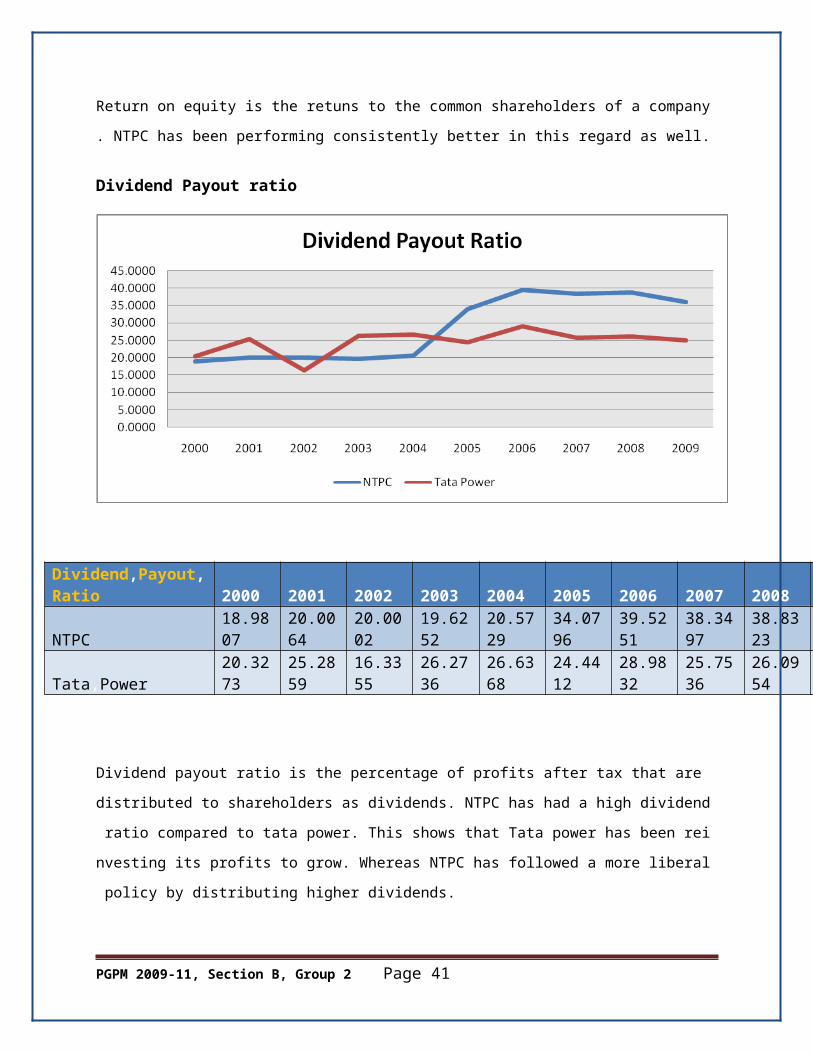
Dividend,Payout,ratio
PGPM 2009-11, Section B, Group 2 Page 30
Dividend,Payout,Ratio 2000 2001 2002 2003 2004 2005 2006 2007 2008NTPC 18.9807 20.0064 20.0002 19.6252 20.5729 34.0796 39.5251 38.3497 38.8323Tata,Power 20.3273 25.2859 16.3355 26.2736 26.6368 24.4412 28.9832 25.7536 26.0954
Dividend,payout,ratio,is,the,percentage,of,profits,after,tax,that,are,distributed,to,shareholders,as
,dividends.,NTPC,has,had,a,high,dividend,ratio,compared,to,tata,power.,This,shows,that,Tata,p
ower,has,been,reinvesting,its,profits,to,grow.,Whereas,NTPC,has,followed,a,more,liberal,policy,
by,distributing,higher,dividends.
SOLVENCY:
Debt,to,equity,ratio
Debt,To,Equity,Ratio 2000 2001 2002 2003 2004 2005 2006 2007 2008 2009NTPC 0.4398 0.3797 0.4042 0.4190 0.4282 0.4058 0.4449 0.4971 0.5034 0.5770
PGPM 2009-11, Section B, Group 2 Page 31
Tata,Power 0.6722 0.6716 0.6589 0.5083 0.3409 0.5568 0.4959 0.6022 0.3750 0.5980
This,ratio,shows,how,much,a,company,has,relied,on,debt,as,a,source,of,financing.,As,we,see,,tat
a,power,has,consistently,been,having,a,higher,ratio,indicating,it,has,relied,on,debt,more,than,NT
PC.,NTPC,has,been,relatively,more,conservative,and,relied,on,owners’,equity,more.
Interest,coverage,ratio:
A,ratio,used,to,determine,how,easily,a,company,can,pay,interest,on,outstanding,debt.,T
he,interest,coverage,ratio,is,calculated,by,dividing,a,company's,earnings,before,interest
,and,taxes,(EBIT),of,one,period,by,the,company's,interest,expenses,of,the,same,period:
Interest,Coverage,Ratio 2000 2001 2002 2003 2004 2005 2006 2007 2008 2009NTPC 3.5888 3.5597 4.4899 3.7485 0.5984 2.6704 2.8225 4.0301 4.7239 3.9460Tata,Power 2.3209 2.1208 1.8993 2.5322 2.9895 2.8542 3.2329 2.1797 3.6106 2.4440
PGPM 2009-11, Section B, Group 2 Page 32
This,ratio,shows,how,capable,is,a,company,in,meeting,its,interest,payments,on,long,term,loans.
,Lately,NTPC,has,been,having,better,ratios,than,Tata,power.,This,could,also,indicate,that,Tata,
power,has,been,taking,up,more,longter,debt,that,has,increased,interest,payment.
DU,PONT,ANALYSIS:
TATA,POWER:
Year 2009 2008 2007 2006 2005ROE(Return,on,equity) 11.7708 10.97642 12.11398 10.45892 11.83673Total,Asset,Turnover,Ratio
0.524218 0.533143 0.488886 0.54968 0.492134
Financial,Leverage,Ratio 1.598019 1.375022 1.602237 1.495892 1.556805Net,Profit,Margin 0.140512 0.149729 0.154651 0.127197 0.154495
Return,on,equity,is,seperated,into,three,components,of,asset,turnover,ratio,,net,profit,and,financial,leverage.,The,increase,in,the,return,on,equity,from,2008,to,2009.,This,is,not,explained,by,either,asset,turnover,or,net,profit,margin,,both,of,which,have,dropped.,The,increased,leverage,explains,the,higher,ROE.,These,three,components,of,ROE,explain,the,effect,of,asset,utilization,efficiency,,leverage,and,net,profit,margin,on,ROE.,An,increase,in,these,ratios,leads,to,an,increase,in,ROE.
NTPC:
YEAR 2009 2008 2007 2006 2005ROE 13.72% 13.76% 13.97% 12.87% 13.79%Total,Asset,Turnover,Ratio 0.44 0.46 0.44 0.41 0.38Financial,Leverage,Ratio 1.58 1.50 1.50 1.44 1.41Net,Profit,Margin 0.20 0.20 0.21 0.22 0.26
ROE,remained,fairly,stable,over,the,years,,except,a,dip,from,2005,to,2006.,This,can,be,attribute
d,to,a,reduction,in,net,profit,margin,from,0.26,to,0.22.,An,increase,in,leverage,alone,cannot,ens
ure,a,higher,return,on,equity,,as,the,company,should,be,able,to,generate,sufficient,profits,by,usi
ng,the,borrowed,money.,Otherwise,it’ll,lead,to,a,reduction,in,the,asset,turnover,ratio,which,bala
nces,the,increase,in,leverage,,and,there,is,no,net,effect,on,ROE.
PGPM 2009-11, Section B, Group 2 Page 33
CASH,FLOW,POSITION:
TATA,POWER
YEAR 2009 2008 2007 2006 2005Cash,Flow,SummaryCash,and,Cash,Equivalents,at,Beginning,of,the,year
28.7 1002.71 974.05 986.49 51.9
Net,Cash,from,Operating,Activities, 648.61 1126.25 421.2 296.86 444.09Net,Cash,Used,in,Investing,Activities, -2220.5 -2541.1 -931.06 144.46 -308.0Net,Cash,Used,in,Financing,Activities, 1588.71 440.88 538.52 -453.7 798.58Net,Inc/(Dec),in,Cash,and,Cash,Equivalent 16.8 -974.01 28.66 -12.44 934.59Cash,and,Cash,Equivalents,at,End,of,the,year 45.5 28.7 1002.71 974.05 986.49
As,we,can,see,,the,operating,cash,flows,for,tata,power,are,inadequate,to,meet,its,investment,sp
ending.,From,2007,to,2009,,it,has,gone,in,for,lot,of,capital,expenditure,and,other,investment.,Th
e,financing,cashflows,has,been,positive,for,nearly,all,years.,This,is,because,the,company,has,g
one,in,for,raising,loans,as,a,form,of,financing.,The,negative,values,of,investing,cashflow,shows,
that,Tata,power,has,focussed,on,capacity,expansion,and,investing,in,other,assets.,
NTPC:
YEAR 2009 2008 2007 2006 2005Cash,Flow,SummaryCash,and,Cash,Equivalents,at,Beginning,of,the,year
14933.2 13314.6 8471.4 6078.3 6635.1
Net,Cash,from,Operating,Activities, 9688.1 9786 8065.3 5972 5099.8Net,Cash,Used,in,Investing,Activities, -7500.4 -5818.7 -3145.8 -2699 -6413Net,Cash,Used,in,Financing,Activities, -849.3 -2348.7 -76.3 -879.7 757Net,Inc/(Dec),in,Cash,and,Cash,Equivalent 1338.4 1618.6 4843.2 2393.1 -556.8Cash,and,Cash,Equivalents,at,End,of,the,year 16271.6 14933.2 13314.6 8471.4 6078.3
NTPC’s,cash,flow,statement,is,in,stark,contrast,with,that,of,Tata,power.,Here,,the,operating,cas
h,flows,in,all,years,are,more,than,sufficient,to,meet,both,investing,and,financing,activities.,The,n
egative,values,for,financng,activities,shows,that,NTPC,hasn’t,gone,in,for,issuing,new,debt,or,eq
PGPM 2009-11, Section B, Group 2 Page 34
uity,,and,is,just,paying,out,interests,and,dividends.,The,negative,values,for,investing,activities,in
dicate,NTPC,,like,Tata,Power,,is,going,for,capacity,expansion,and,investing,in,other,assets.,
References:,
1. http://www.capitaline.com
2. PROWESS
3. www.tatapower.com
4. www.ntpc.org
5. www.wikipedia.com
PGPM 2009-11, Section B, Group 2 Page 35
6. http://info.shine.com
7. www.powermin.gov.in
8. http://www.infraline.com/powersector/
ANNEXURE,
NTPC,BALANCE,SHEET
,,,YearMar,09,
Mar,08,
Mar,07,
Mar,06,
Mar,05,
Mar,04,
Mar,03,
Mar,02,
Mar,01,
Mar,00,
,,SOURCES,OF,FUNDS,:
,Share,Capital,8,245.50
8,245.50
8,245.50
8,245.50
8,245.50
7,812.50
7,812.55
7,812.55
7,812.55
7,812.55
,,Reserves,Total, 51,668. 45,766. 41,008. 37,154. 33,868. 28,275. 23,727. 20,839. 18,008. 15,100.
PGPM 2009-11, Section B, Group 2 Page 36
30 50 00 00 20 10 30 93 24 27
,,Equity,Share,Warrants 0 0 0 0 0 0 0 0 0 0
,,,Equity,Application,Money 0 0 0 0 0 0 0 0 0 0
,,Total,Shareholders,Funds59,913.80
54,012.00
49,253.50
45,399.50
42,113.70
36,087.60
31,539.85
28,652.48
25,820.79
22,912.82
,,Secured,Loans,8,969.60
7,314.70
6,822.90
5,732.70
4,440.70
4,584.40
4,122.60
1,645.50
1,965.47
2,427.83
,Unsecured,Loans,25,598.20
19,875.90
17,661.50
14,464.60
12,647.10
10,868.40
9,093.10
9,935.68
7,839.25
7,649.56
,,,Service,Line,&,Sec.Dep.,from,Cust. 0 0 0 0 0 0 0 0 0 0
,,Total,Debt34,567.80
27,190.60
24,484.40
20,197.30
17,087.80
15,452.80
13,215.70
11,581.18
9,804.72
10,077.39
,,Total,Liabilities,94,481.60
81,202.60
73,737.90
65,596.80
59,201.50
51,540.40
44,755.55
40,233.66
35,625.51
32,990.21
,,APPLICATION,OF,FUNDS,:
,Gross,Block,62,353.00
53,368.00
50,727.30
46,039.60
43,106.20
40,028.10
36,610.60
32,891.15
32,307.35
28,476.24
,,Less:,Accumulated,Depreciation,
29,415.30
27,274.30
25,079.20
22,950.10
20,791.40
18,773.60
16,745.60
15,213.11
13,841.61
11,440.30
,Net,Block,32,937.70
26,093.70
25,648.10
23,089.50
22,314.80
21,254.50
19,865.00
17,678.04
18,465.74
17,035.94
,,,Lease,Adjustment 0 0 0 0 0 0 0 0 0 0
,Capital,Work,in,Progress26,404.90
22,478.30
16,839.20
13,634.00
9,925.20
7,495.30
6,386.30
6,558.38
3,816.53
5,055.27
,,Investments,13,983.50
15,267.20
16,094.30
19,289.10
20,797.70
17,338.00
3,667.40
4,028.11
3,991.46 901.59
,,Current,Assets,,Loans,&,Advances
,Inventories,3,243.40
2,705.50
2,543.50
2,362.90
1,801.50
1,738.00
1,771.20
2,018.34
1,839.78
2,022.69
,,Sundry,Debtors,3,584.20
2,982.70
1,252.30 867.8
1,374.70 469.9
12,434.90
11,532.82
9,585.14
8,208.83
,Cash,and,Bank16,271.60
14,933.20
13,314.60
8,471.40
6,078.30 609.1 544.7
1,204.86 382.95 560.19
,,Loans,and,Advances,8,799.50
4,957.20
8,816.00
6,576.00
4,836.30
10,884.60
5,527.80
3,025.32
4,271.50
6,389.08
,,Total,Current,Assets31,898.70
25,578.60
25,926.40
18,278.10
14,090.80
13,701.60
20,278.60
17,781.34
16,079.37
17,180.79
,,,Less:,Current,Liabilities,and,Provisions
,,Current,Liabilities,7,493.60
5,803.70
5,323.50
4,910.20
5,230.60
6,524.40
3,420.15
3,145.85
2,766.23
2,468.80
,Provisions,3,249.50
2,411.40
5,446.50
3,783.60
2,696.30
1,724.50
2,030.20
2,673.60
3,970.41
4,720.50
,,,Total,Current,Liabilities10,743.10
8,215.10
10,770.00
8,693.80
7,926.90
8,248.90
5,450.35
5,819.45
6,736.64
7,189.30
,,Net,Current,Assets21,155.60
17,363.50
15,156.40
9,584.30
6,163.90
5,452.70
14,828.25
11,961.89
9,342.73
9,991.49
,,Miscellaneous,Expenses,not,written,off, 0 0 0 0 0 0 8.7 7.24 9.05 5.92
,,Deferred,Tax,Assets1,869.50
1,502.20
1,058.20 943.2 653.9 940.8 0 0 0 0
,,,Deferred,Tax,Liability1,869.60
1,502.30
1,058.30 943.3 654 940.9 0.1 0 0 0
,,Net,Deferred,Tax -0.1 -0.1 -0.1 -0.1 -0.1 -0.1 -0.1 0 0 0
,,,Total,Assets94,481.60
81,202.60
73,737.90
65,596.80
59,201.50
51,540.40
44,755.55
40,233.66
35,625.51
32,990.21
,Contingent,Liabilities7,830.30
5,246.70
4,266.50
3,166.20
1,966.80
1,950.80
2,048.30
1,420.32
2,410.68
2,142.61
PGPM 2009-11, Section B, Group 2 Page 37
,http://www.capitaline.com
NTPC,PROFIT,AND,LOSS,STATEMENT
,,,Year Mar,09(12),
Mar,08(12),
Mar,07(12),
Mar,06(12),
Mar,05(12),
Mar,04(12),
Mar,03(12),
Mar,02(12),
Mar,01(12),
Mar,00(12),
,,INCOME,:
,Operating,Income, 42,196.80
37,302.40
32,817.30
26,904.90
22,732.40
18,868.40
19,047.50
17,911.05
19,064.95
16,123.22
,,,Excise,Duty 221.6 211.4 185.6 175.7 167.4 0 0 0 0 0
,,Net,Operating,Income 41,975.20
37,091.00
32,631.70
26,729.20
22,565.00
18,868.40
19,047.50
17,911.05
19,064.95
16,123.22
,,Other,Income, 3,400.00
3,091.70
2,901.50
2,945.30
3,151.20
7,243.10
1,028.60
722.78 1,279.22
1,087.19
,Stock,Adjustment, 0 0 0 0 0 0 0 0 0 0
,,,Total,Income 45,375.20
40,182.70
35,533.20
29,674.50
25,716.20
26,111.50
20,076.10
18,633.83
20,344.17
17,210.41
,,EXPENDITURE,:
,Electricity,&,Fuel,Expenses,
27,292.30
22,160.70
19,947.60
16,504.20
13,811.30
12,284.20
11,134.40
10,582.88
10,036.52
8,141.77
,,Operating,Expenses 1,152.90
1,073.70
969.1 807.8 726.9 632.6 628.3 637.81 608.73 540.08
,Employee,Cost, 2,934.30
2,261.00
1,367.10
1,136.50
1,016.40
960.2 899.2 884.87 813.01 654.94
,,Selling,&,Administration,expenses,
574.9 536.3 494 429 408.1 323.2 239 300.65 242.17 201.07
,Miscellaneous,Expenses
278.5 380.8 207 390.3 113.7 744.1 783 348.26 1,246.24
1,032.88
,,Less,:,Pre-operative,Expenses,Capitalised,
604.6 546.8 416.5 259.8 149.1 115.4 -117.5 124.04 93.71 59.2
,,Total,Expenditure 31,628.30
25,865.70
22,568.30
19,008.00
15,927.30
14,828.90
13,801.40
12,630.43
12,852.96
10,511.54
,,,Operating,Profit 13,746.90
14,317.00
12,964.90
10,666.50
9,788.90
11,282.60
6,274.70
6,003.40
7,491.21
6,698.87
,Interest, 2,022.90
1,923.60
1,982.10
2,010.10
1,752.30
3,369.70
991.6 868.03 1,091.76
982.56
,,,Gross,Profit 11,724.00
12,393.40
10,982.80
8,656.40
8,036.60
7,912.90
5,283.10
5,135.37
6,399.45
5,716.31
,,Depreciation 2,364.50
2,138.50
2,075.40
2,047.70
1,958.40
2,023.20
1,529.10
1,383.29
2,325.64
2,085.44
,,,Profit,Before,Tax 9,359.50
10,254.90
8,907.40
6,608.70
6,078.20
5,889.70
3,754.00
3,752.08
4,073.81
3,630.87
,Tax 1,137.20
2,823.20
2,027.30
767.6 271.2 628.9 146.4 212.46 340.01 206.34
,,Deferred,Tax 0 0 0 0 0 0 0.1 0 0 0
,,Reported,Net,Profit 8,201.30
7,414.80
6,864.70
5,820.20
5,807.00
5,260.80
3,607.50
3,539.62
3,733.80
3,424.53
,,Extraordinary,Items, -20.13 -8.58 -7.13 -679.9 -15.48 856.06 6.73 -2.61 -2.47 -3.55
,,Adjusted,Net,Profit 8,221.43
7,423.38
6,871.83
6,500.10
5,822.48
4,404.74
3,600.77
3,542.23
3,736.27
3,428.08
,,Adjustment,below,net,profit,
0 0 0 0 0 0 0 0 0 0
,,P,&,L,Balance,brought,forward
21.1 89.9 75.2 81.2 56.6 68.1 149.6 280.81 11.68 140.57
,,Statutory,Appropriations,
0 0 0 0 0 0 0 0 0 0
,Appropriations, 8,207.30
7,483.60
6,850.00
5,826.20
5,782.40
5,272.30
3,689.00
3,670.84
3,464.67
3,553.42
PGPM 2009-11, Section B, Group 2 Page 38
,,,P,&,L,Balance,brought,forward
15.1 21.1 89.9 75.2 81.2 56.6 68.1 149.59 280.81 11.68
,,Dividend 2,968.30
2,885.90
2,638.50
2,308.70
1,979.00
1,082.30
708 707.93 747 650
,,,Preference,Dividend 0 0 0 0 0 0 0 0 0 0
,,Equity,Dividend,% 36 35 32 28 24 13.85 9.06 9.06 9.56 8.32
,,,Earnings,Per,Share-Unit,Curr
9.34 8.4 7.85 6.67 6.72 6.56 4.57 453.07 468.17 424.26
,,Book,Value-Unit,Curr 72.66 65.5 59.73 55.06 51.07 46.19 40.37 3,667.49
3,305.04
2,932.82
,http://www.capitaline.com
TATA,POWER,BALANCE,SHEET
,,,Year Mar,09, Mar,08, Mar,07,
Mar,06,
Mar,05,
Mar,04,
Mar,03,
Mar,02,
Mar,01,
Mar,00,
,,SOURCES,OF,FUNDS,:
,Share,Capital, 221.44 220.72 197.92 197.92 197.92 197.92 197.91 197.91 197.91 115.54
,,Reserves,Total, 8,470.92
7,817.20
5,835.19
5,357.72
4,938.55
4,852.42
4,522.33
4,034.73
3,670.15
1,741.05
,,Equity,Share,Warrants 0 60.99 0 0 0 0 0 0 0 0
,,,Equity,Application,Money 0 0 0 0 0 0 0 0 0 0.1
,,Total,Shareholders,Funds 8,692.36
8,098.91
6,033.11
5,555.64
5,136.47
5,050.34
4,720.24
4,232.64
3,868.06
1,856.69
,,Secured,Loans, 3,931.71
2,331.09
1,354.30
946 1,059.07
721.73 1,340.37
1,506.54
1,337.96
624.31
,Unsecured,Loans, 1,266.49
706.18 2,279.06
1,809.00
1,800.94
999.69 1,058.83
1,282.39
1,259.93
623.69
,,,Service,Line,&,Sec.Dep.,from,Cust.
0 0 0 0 0 0 0 0 0 0
,,Total,Debt 5,198.20
3,037.27
3,633.36
2,755.00
2,860.01
1,721.42
2,399.20
2,788.93
2,597.89
1,248.00
,,Total,Liabilities, 13,890.56
11,136.18
9,666.47
8,310.64
7,996.48
6,771.76
7,119.44
7,021.57
6,465.95
3,104.69
,,APPLICATION,OF,FUNDS,:
,Gross,Block, 8,985.86
6,482.25
6,229.71
5,924.74
5,465.84
5,534.70
5,370.79
4,975.12
4,397.42
1,637.42
,,Less:,Accumulated,Depreciation, 3,795.32
3,476.76
3,199.40
2,921.72
2,657.37
2,364.36
2,034.74
1,724.57
1,446.88
622.19
,Net,Block, 5,190.54
3,005.49
3,030.31
3,003.02
2,808.47
3,170.34
3,336.05
3,250.55
2,950.54
1,015.23
,,,Lease,Adjustment 0 0 0 0 0 0 0 0 0 0
,Capital,Work,in,Progress 761.16 1,681.74
781.05 211.81 437.65 306.39 337.95 556.05 649.48 403.79
,,Investments, 5,443.47
4,430.00
3,570.15
3,412.17
3,502.92
2,728.83
2,451.83
1,882.09
1,505.19
1,354.92
,,Current,Assets,,Loans,&,Advances,Inventories, 644.14 473.61 396.42 442.26 297.03 313.22 330.98 325.96 311.48 136.38
,,Sundry,Debtors, 1,587.97
1,414.52
1,476.63
1,058.23
696.63 718.21 889.01 765.91 573.33 293.89
,Cash,and,Bank 45.5 28.7 1,367. 990.55 979.6 51.9 126.41 307.01 1,036. 26.96
PGPM 2009-11, Section B, Group 2 Page 39
72 27,,Loans,and,Advances, 2,403.5
31,958.68
801.56 482 550.36 609.68 1,119.77
1,355.07
598.68 446.49
,,Total,Current,Assets 4,681.14
3,875.51
4,042.33
2,973.04
2,523.62
1,693.01
2,466.17
2,753.95
2,519.76
903.72
,,,Less:,Current,Liabilities,and,Provisions,,Current,Liabilities, 1,419.3
31,253.87
1,126.26
731.81 706.87 907.21 1,067.22
1,056.41
891.02 387.5
,Provisions, 651.99 585.44 631.58 589.2 580.7 272.45 454.43 273.21 323.46 188.51
,,,Total,Current,Liabilities 2,071.32
1,839.31
1,757.84
1,321.01
1,287.57
1,179.66
1,521.65
1,329.62
1,214.48
576.01
,,Net,Current,Assets 2,609.82
2,036.20
2,284.49
1,652.03
1,236.05
513.35 944.52 1,424.33
1,305.28
327.71
,,Miscellaneous,Expenses,not,written,off,
0 1.69 6.17 15.46 22.71 15.61 28.52 42.16 55.46 3.04
,,Deferred,Tax,Assets 91.13 81.22 63.25 62.68 52.5 86.31 67.71 0 0 0
,,,Deferred,Tax,Liability 205.56 100.16 68.95 46.53 63.82 49.07 47.14 133.61 0 0
,,Net,Deferred,Tax -114.43 -18.94 -5.7 16.15 -11.32 37.24 20.57 -133.61
0 0
,,,Total,Assets 13,890.56
11,136.18
9,666.47
8,310.64
7,996.48
6,771.76
7,119.44
7,021.57
6,465.95
3,104.69
,Contingent,Liabilities 10,205.10
8,449.38
1,358.37
1,543.81
278.03 236.3 181.87 189.82 179.29 152.4
,http://www.capitaline.com
TATA,POWER,PROFIT,AND,LOSS,STATEMENT
,,,Year Mar,09(12), Mar,08(12), Mar,07(12), Mar,06(12), Mar,05(12), Mar,04(12), Mar,03(12), Mar,02(12), Mar
,,INCOME,:
,Operating,Income, 7,282.28 5,937.36 4,725.92 4,568.67 3,935.63 4,237.05 4,292.40 3,807.24 3,409.76
,,,Excise,Duty 0.6 0.18 0.12 0.48 0.29 2.66 0.75 0 0.38
,,Net,Operating,Income 7,281.68 5,937.18 4,725.80 4,568.19 3,935.34 4,234.39 4,291.65 3,807.24 3,409.38
,,Other,Income, 642.05 516.08 367.71 369.06 411.44 179.87 165.73 368.12 245.58
,Stock,Adjustment, -0.07 -0.74 -8.32 8.95 -8.08 -10.49 -11.98 -9.85 7.94
,,,Total,Income 7,923.66 6,452.52 5,085.19 4,946.20 4,338.70 4,403.77 4,445.40 4,165.51 3,662.90
,,EXPENDITURE,:
,Electricity,&,Fuel,Expenses, 5,306.97 4,263.86 3,373.49 2,979.71 2,279.68 2,258.36 2,469.49 2,167.47 2,088.74
,,Operating,Expenses 354.81 323.28 304.18 430.29 377.26 273.19 187.92 179.67 157.89
,Employee,Cost, 309.06 257.8 197.67 171.97 153.51 189.66 139.5 134.82 133.59
,,Selling,&,Administration,expenses, 123.3 116.43 105.61 114.76 139.64 206.11 183.4 189.56 155.66
,Miscellaneous,Expenses 72.85 68 40.68 64.17 99.52 132.5 133.41 192.69 146.1
,,Less,:,Pre-operative,Expenses,Capitalised,
15.21 10.46 5.36 5.38 20.3 7.56 4.11 0.12 0
,,Total,Expenditure 6,151.78 5,018.91 4,016.27 3,755.52 3,029.31 3,052.26 3,109.61 2,864.09 2,681.98
PGPM 2009-11, Section B, Group 2 Page 40
,,,Operating,Profit 1,771.88 1,433.61 1,068.92 1,190.68 1,309.39 1,351.51 1,335.79 1,301.42 980.92
,Interest, 327.76 173.87 191.59 165.28 191.44 283.72 341.21 348.28 246.53
,,,Gross,Profit 1,444.12 1,259.74 877.33 1,025.40 1,117.95 1,067.79 994.58 953.14 734.39
,,Depreciation 328.85 290.5 291.92 278.34 359.62 333.95 318.04 281.65 204.55
,,,Profit,Before,Tax 1,115.27 969.24 585.41 747.06 758.33 733.84 676.54 671.49 529.84
,Tax 92.18 81.01 -137.12 157.05 158.42 223.66 198.37 74.93 130.14
,,Deferred,Tax 95.49 13.24 21.85 -27.47 48.55 -16.67 -58.25 88.33 0
,,Reported,Net,Profit 922.2 869.9 696.8 610.54 551.36 526.85 536.42 508.23 399.7
,,Extraordinary,Items, 230.59 298.81 33.56 145.6 176.19 26.83 25.19 183.39 50.72
,,Adjusted,Net,Profit 691.61 571.09 663.24 464.94 375.17 500.02 511.23 324.84 348.98
,,Adjustment,below,net,profit, 0 0 0 0 -0.36 0 0 0 0
,,P,&,L,Balance,brought,forward 2,105.22 1,963.66 1,666.15 1,432.83 1,197.64 1,019.41 897.87 823.05 708.83
,,Statutory,Appropriations, -45.3 58.59 22.83 35.29 -3.73 42.16 69.91 126.85 26.31
,Appropriations, 819.51 669.75 376.46 341.93 319.54 306.46 344.97 306.56 259.17
,,,P,&,L,Balance,brought,forward 2,253.21 2,105.22 1,963.66 1,666.15 1,432.83 1,197.64 1,019.41 897.87 823.05
,,Dividend 255.26 231.98 188.22 168.41 148.6 138.69 128.78 99.06 99.06
,,,Preference,Dividend 0 0 0 0 0 0 0 0 0
,,Equity,Dividend,% 115 105 95 85 75 70 65 50 50
,,,Earnings,Per,Share-Unit,Curr 40.21 38.19 33.59 29.66 26.8 25.72 26.27 25.68 19.69
,,Book,Value-Unit,Curr 382.06 352.27 291.77 267.76 248.36 245.02 229.85 206.13 188.15
,http://www.capitaline.com
PGPM 2009-11, Section B, Group 2 Page 41