financial analysis of atlac
DESCRIPTION
Financial Analysis of ATLAC Management ConsultantsTRANSCRIPT

4.1 IntroductionThese section efforts have been made to cover all relevant aspects of the financial performance
of ATLAC. Overtime comparison and Common Size analysis are carried out with the view to
extract concrete conclusion to describe financial standing and performance of the Firm.
4.2 Financial Analysis
Financial statements are the principal means of reporting the financial condition and results of
operations of a business entity. These statements are meant to assist various parties in decision
making who are interested in the activities of the business. These statements are means to an end
of helping stakeholders in decision-making. To improve the quality of decision making proper
analysis of these statements helps a lot. Financial statements analysis helps in determining the
financial conditions at any particular points in time and effectiveness of operations of a firm
during a specific period.
The various stakeholders of business are interested in the analysis of financials statements. But
the focus of interest of all is not the same. For example,. Short term creditors are interested in
short term liquidity of the business and long term creditors are interested in the long term cash
flow which the firm can generate over the long period of time. Investors are interested in the
firm’s ability to sustain profitability over a period of time. Government agencies analyze
financial data for tax purposes. The internal users of financial statements like management also
analyze financial data for planning and control.
4.2.1 Common Size Analysis of Balance Sheet
Common size analysis is an analysis of financial statements where the total assets divide all balance sheet
items of asset side and all credit side balances divided by all liability items, and all income statement
items are divided by net sales/revenues. Common size analyses are extremely helpful to highlight changes
over the time in financial performance and financial conditions of the company. The table shows common
size analysis of the balance sheets for the years 2011-12, 2012-13 & 2013-14.

Short-term advances have shown a significant change. Where as total advances show a total
change of only 1.70%. This is very significant to note that major decrease has occurred in long-
term performing and non-performing advances.
On the liability side the total current liability has shown change of about 4%. The main reason
for which is increase in current deposits, which are about 6%. The long-term liability of the
organization is also decreased by 2%. The main reason for this is that fixed deposits of
organization are decreased by 2%, which shows that there is a slight change in the organization’s
position by decrease in fixed deposits.

Table: 4-1 Common size analysis of Balance Sheet
Common size (%)
Assets 2011-12 2012-13 2013-14
Cash/Bal. With Firms 10.85 8.26 9.86
Balance with other Firms 0.79 1.23 0.87
lending to F.Is 4.67 3.76 3.73
Investment 21.82 19.21 21.97
Advances-Performing 55.32 59.75 55.20
Advances Non-Performing 1.12 1.53 1.84
Fixed Assets 3.19 2.97 3.54
Deferred tax asset-net - 0.33 0.1
Other Assets 2.24 3.0 2.78
Total Assets 100 100 100
Liabilities
B/Payables 1.14 0.85 0.83
Borrowings ST 11.14 7.59 5.67
Deposits - Current 75.74 79.85 79.40
Sub-ordinated loans 1.08 1.98 1.93
Deferred tax liability 0.42 - -
Other Liabilities 2.50 2.49 2.34
Total Liability 92.02 92.76 90.17

Assets in 2013
9.86
3.73
21.9756.86
3.54Cashlending to F.IsInvestment AdvancesFixed Assets
Equity
Share Capital 1.52 1.67 1.80
Reserves 1.93 2.56 3.05
Accumulated Losses/Profits 2.95 2.74 3.58
Minority Interest
Surplus on revaluation 1.58 0.27 1.40
Total Equity 7.98 7.24 9.83
Source: Self made
Figure 4-2 Assets In 2013.

Figure 4-3 Liabilities and Equity in 2013.
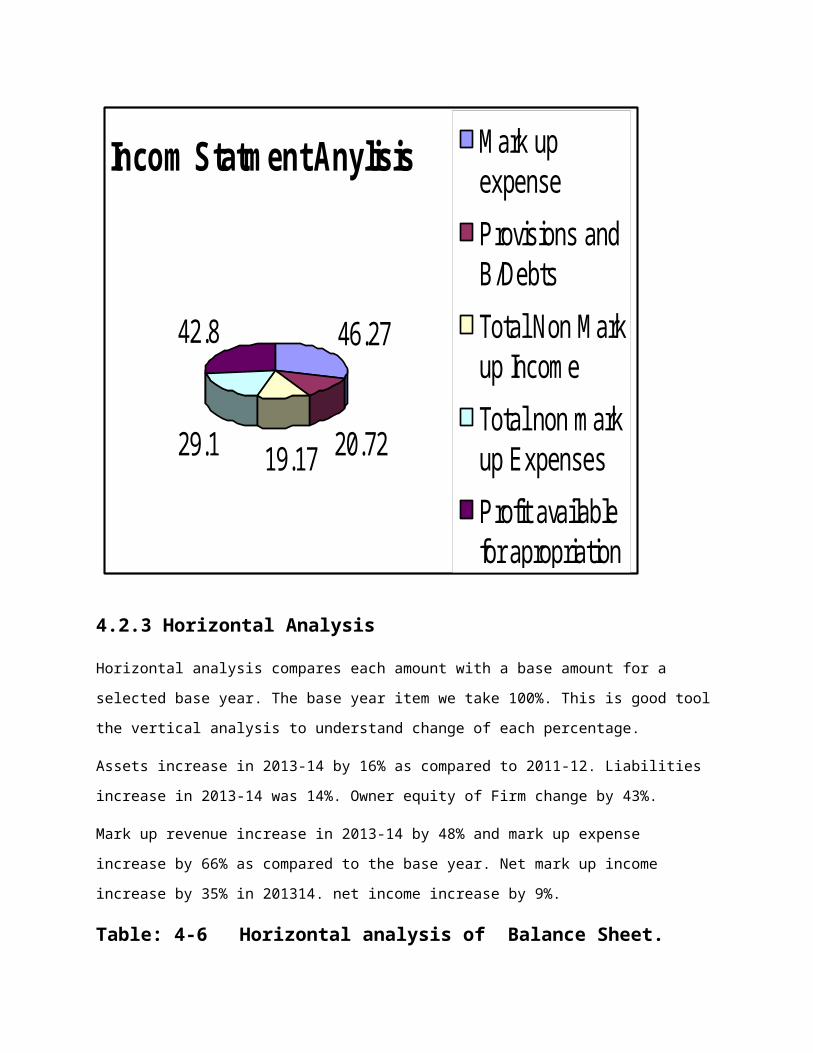
4.2.2 Common Size Analysis of Income Statement
The common size analysis of income statement is given in the table. Which shows that the
ATLAC has been not able to control its interest or mark up expense. As a result of increase in
mark up expense as a percentage of total revenues the gross profit margin has shown a trend of
continuous decrease.
The decreases G/P Margin shows deficiency of the Firm and lack of controlling cost of
(Markup expense) and better strategy of pricing, products and services.
The provision for non-performing loans has a increasing trend making provision for non-
performing loans and diminution in value of investment, which decreases the profit of current
year. The addition in provision is a bad sign, which shows that the Firm is not recovering its
disbursed advances. It shows the bad credit management of the Firm.

Non markup expenses also show a decreasing trend in absolute amount though the common size
in percentages have shown a mixed trend due to the changes in revenue figures. The non-
performing expanses also decrease to about 12%, which is a very high percentage, but the other
aspect of this is that it increased the efficiency and credit management of the staff.
Like gross profit the net profit margin before tax has also decreased with 37% . The tax expanse
is decreased about 29% because of the decrease in profit. Profit brought forward from previous
year is reduced by 10%.
The common size analysis of the ATLAC is clearly showing that the Firm has no improvement in its
performance. The organization shows low profit in last two years which is a negative sign. Employees
which they can work more effectively and efficiently increasing
Table: 4-4 Common size analysis of Income Statement Common size (%)
ITEMS 2011-12 2012-13 2013-14
Mark up revenue 100 100 100
Mark up expense 41.26 46.34 46.27
Gross profit 58.74 53.66 53.73
Provisions and B/Debts 15.63 15.60 20.72
Net Mark up Income 43.1 38.06 33.1
Total Non Mark up Income 21.9 20.57 19.17
Total Income 65.0 58.62 52.16

Total non mark up Expenses 33.31 31.9 29.10
Profits before tax 31.68 26.72 23.06
Taxation 11.21 10.67 7.95
Profit after tax 20.47 15.10 16.05
Unappropriated profit brought
forward 30.28 30.15 27.28
Surplus on revaluation of Assets 0.44 0.48 0.41
Profit available for apropriation 50.9 46.68 42.80
Source: Self made

Figure 4-5 Common Size Analysis of Income statement.
Incom Statment Anylisis
46.27
20.7219.1729.1
42.8
Mark upexpense
Provisions andB/Debts
Total Non Markup Income
Total non markup Expenses
Profit availablefor apropriation
4.2.3 Horizontal Analysis
Horizontal analysis compares each amount with a base amount for a selected base year. The base year
item we take 100%. This is good tool the vertical analysis to understand change of each percentage.
Assets increase in 2013-14 by 16% as compared to 2011-12. Liabilities increase in 2013-14 was 14%.
Owner equity of Firm change by 43%.
Mark up revenue increase in 2013-14 by 48% and mark up expense increase by 66% as compared to the
base year. Net mark up income increase by 35% in 201314. net income increase by 9%.

Table: 4-6 Horizontal analysis of Balance Sheet.
Horizontal Analysis (%)
Assets 2011-12 2012-13 2013-14
Cash/Bal. With Firms 100 87 106.31
Balance with other Firms 100 178.88 129.2
lending to F.Is 100 92.3 93.47
Investment 100 100.64 117.78
Advances-Performing 100 123.34 116.82
Advances Non-Performing 100 155.07 191.05
Fixed Assets 100 106.51 129.59
Other Assets 100 144.76 144.58
Total Assets 100 116.87 116.87
Liabilities
B/Payables 100 84.45 84.67
Borrowings ST 100 74.78 59.47
Deposits - Current 100 122.50 122.5
Sub-ordinated loans 100 200 200
Other Liabilities 100 130.58 113.08
Total Liability 100 115.13 114.54
Shareholder's Equity
Share Capital 100 137.5 137.50
Reserves 100 184.75 184.75

Accumulated Losses/Profits 100 141.74 141.75
Surplus on revaluation 100 102.95 102.95
Total Shareholder's Equity 100 103.40 143.64
Source: Self made
Table: 4-7 Horizontal Analysis of Income StatementHorizontal Analysis (%)
ITEMS 2011-12 2012-13 2013-14
Mark up revenue 100 126.5 148.26
Mark up expense 100 142.07 166.29
Gross profit 100 115.54 135.60
Provisions and B/Debts 100 126.08 196.43
Non Mark up Income 100 111.71 29.77
Total Income 100 114.09 119.0
Total non mark up Expenses 100 121.13 129.53
Profits before tax 100 106.68 107.91
Taxation 100 120.40 105.20
Profit after tax 100 99.10 109.40
Unappropriated profit brought
forward 100 125.93 133.58
Profit available for apropriation 100 116.0 124.66
Source: Self made
4.2.3 Ratio Analysis.Ratio analysis is the most commonly used analysis to judge the financial strength of a company. It is a
quantitative relation between two magnitudes of the same kind. This comparison allows the firm to detect
major operating differences. the main categories of ratios are.
Profitability ratiosProfitability ratios are the financial statement ratios which focus on how well a business is performing in
terms of profit.
Net Interest Margin: Net interest margin (NIM) is a measure of the difference between the interest income generated by Firms
or other financial institutions and the amount of interest paid out to their lenders, relative to the amount of
their assets. It is similar to the gross margin of non-financial companies
Years
Interest Expenses / Interest
Income

2011-12 16,936,187/41,045,543 0.41
2012-13 24,061,790/51,919,229 0.46
2013-14 28,163,787/60,857,035 0.46
Interpretation.
This ratio examines how successful a firm's investment decisions are compared to its debt
situations. The interest margin ratio in 2013-14 is deceases as compared to 2011-12 favourable
for the Firm, because investment decisions are well planed.
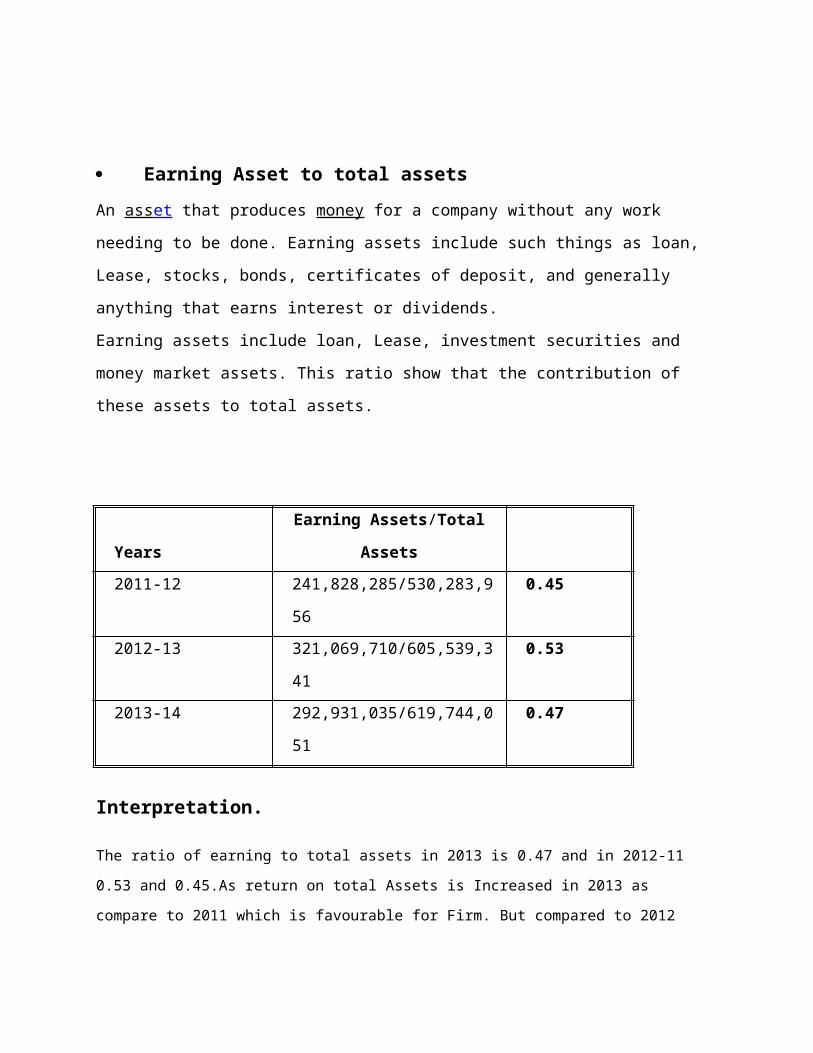
Earning Asset to total assetsAn ass et that produces money for a company without any work needing to be done. Earning
assets include such things as loan, Lease, stocks, bonds, certificates of deposit, and generally
anything that earns interest or dividends.
Earning assets include loan, Lease, investment securities and money market assets. This ratio
show that the contribution of these assets to total assets.
Interpretation.
Years
Earning Assets/Total
Assets
2011-12 241,828,285/530,283,956 0.45
2012-13 321,069,710/605,539,341 0.53
2013-14 292,931,035/619,744,051 0.47

The ratio of earning to total assets in 2013 is 0.47 and in 2012-11 0.53 and 0.45.As return on total Assets
is Increased in 2013 as compare to 2011 which is favourable for Firm. But compared to 2012 return on
total assets decreases which is not favourable for Firm because in 2011 earn assets low return.
Net Interest Margin to Average Earning Assets
Return on Earning Assets.An indicator of how profitable a company is relative to its earning assets. ROEA gives an idea as to how
efficient management is at using its assets to generate earnings.
Interpretation.
Years Net income/average
earning assets
2011-12 8,402590/241,828,285 0.034
2012-13 8,333,120/281,448,997 0.030
2013-14 9,192,687/307,000,372 0.030

Return on earning assets is decreases in 2013 as compared to previous year, due to inefficient
management of ATLAC, showing unfavorable trend.
Figure No. 4.10 Net interest Margin To Average Earning Assets.
Operating Cost to income ratio
The cost/income ratio is an efficiency measure similar to operating margin. Unlike the operating margin,
lower is better. The cost income ratio is most commonly used in the financial sector
Years Non interest cost/income
2011-12 13,674,688/8,402,590 1.62
2012-13 16,565,344/8,333,120 1.98
2013-14 17712934/9,192687 1.92
Interpretation.
Operating Cost to income ratio is decrease as compared to previous year which shows Firm efficiently
managed his non interest cost. This is favourable for Firm because that effect on net income with
positively. But compared as 2011 operating cost increase.

1.62
1.98 1.92
0
0.5
1
1.5
2
2011 2012 2013
Operating Cost to incom Ratio
Operating Cost to incomRatio
Figure No. 4.11 Operating Cost to Income Ratio.
Equity to Total Assets.The equity to debt ratio show how much ABL have equity out of total assets.
YEARS EQUITY/TOTAL ASSETS
2011 42,421,404/16,936,187 0.079
2012 43,862,759/24061,790 0.072
2013 60,936,723/28163,787 0.098
0.0790.072
0.098
0
0.02
0.04
0.06
0.08
0.1
2011 2012 2013
Equity To Total Assets
Equity To Total Assets
Interpretation.
This ratio shows the ownership of the Firm. In 2013 it is 0.098 while in 2011 it is only 0.79 which shows
in 2013 Firm equity are increases.
Figure No. 4.12 Equity to Total Assets.