financial analysis - barclays plc is a global financial services provider engaged in retail banking,...
TRANSCRIPT
7/30/2019 Financial Analysis - Barclays PLC is a Global Financial Services Provider Engaged in Retail Banking, Credit Cards, Wholesale Banking, Investment Banking, Wealth Management …
http://slidepdf.com/reader/full/financial-analysis-barclays-plc-is-a-global-financial-services-provider-engaged 1/8
24.04.2013
Ticker: Barclays PLC Benchmark:
Currency: London: BARC, Currency: GBp FTSE 100 INDEX (UKX)
Sector: Financials Industry: Commercial Banks Year:
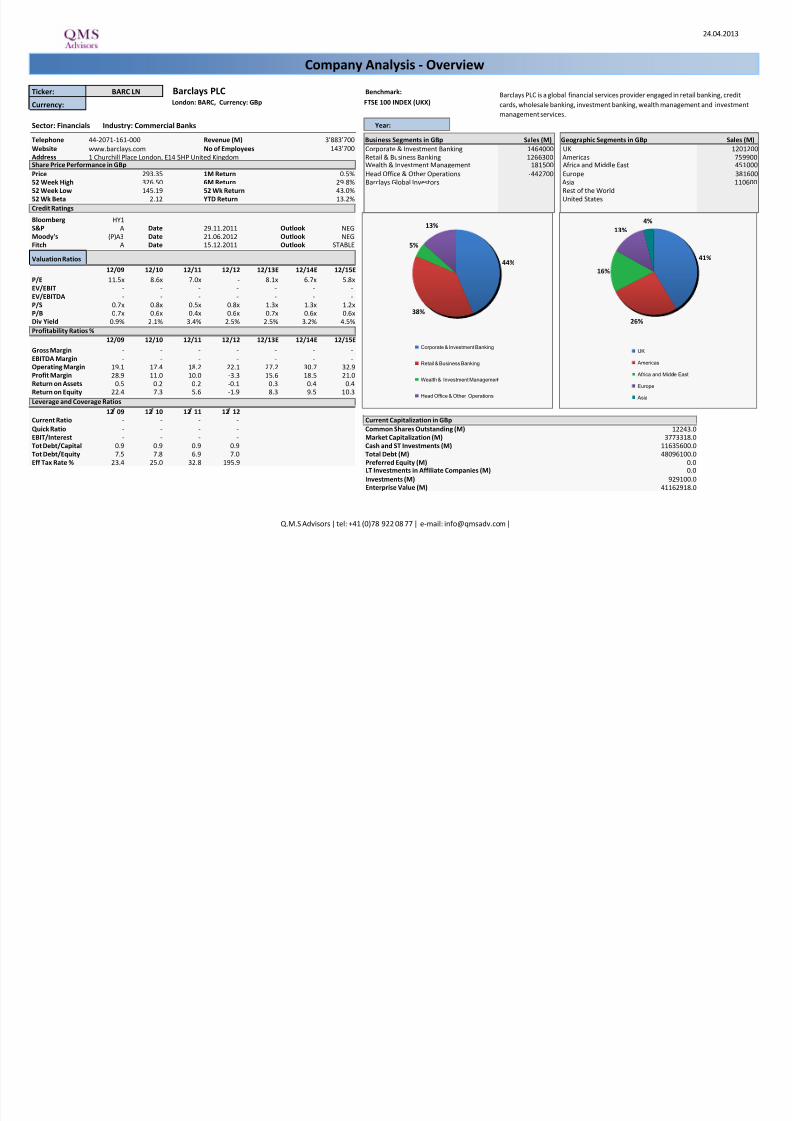
Telephone 44-2071-161-000 Revenue (M) Business Segments in GBp Sales (M) Geographic Segments in GBp Sales (M)Website www.barclays.com No of Employees Corporate & Investment Banking 1464000 UK 1201200
Address 1 Churchill Place London, E14 5HP United Kingdom Retail & Business Banking 1266300 Americas 759900Share Price Performance in GBp Wealth & Investment Management 181500 Africa and Middle East 451000
Price 293.35 1M Return 0.5% Head Office & Other Operations -442700 Europe 381600
52 Week High 326.50 6M Return 29.8% Barclays Global Investors Asia 110600
52 Week Low 145.19 52 Wk Return 43.0% Rest of the World
52 Wk Beta 2.12 YTD Return 13.2% United States
Credit Ratings
Bloomberg HY1
S&P A Date 29.11.2011 Outlook NEG
Moody's (P)A3 Date 21.06.2012 Outlook NEG
Fitch A Date 15.12.2011 Outlook STABLE
Valuation Ratios
12/09 12/10 12/11 12/12 12/13E 12/14E 12/15E
P/E 11.5x 8.6x 7.0x - 8.1x 6.7x 5.8x
EV/EBIT - - - - - - -
EV/EBITDA - - - - - - -
P/S 0.7x 0.8x 0.5x 0.8x 1.3x 1.3x 1.2x
P/B 0.7x 0.6x 0.4x 0.6x 0.7x 0.6x 0.6x
Div Yield 0.9% 2.1% 3.4% 2.5% 2.5% 3.2% 4.5%
Profitability Ratios %
12/09 12/10 12/11 12/12 12/13E 12/14E 12/15E
Gross Margin - - - - - - -
EBITDA Margin - - - - - - -
Operating Margin 19.1 17.4 18.2 22.1 27.2 30.7 32.9
Profit Margin 28.9 11.0 10.0 -3.3 15.6 18.5 21.0
Return on Assets 0.5 0.2 0.2 -0.1 0.3 0.4 0.4
Return on Equity 22.4 7.3 5.6 -1.9 8.3 9.5 10.3
Leverage and Coverage Ratios
12 09 12 10 12 11 12 12Current Ratio - - - - Current Capitalization in GBp
Quick Ratio - - - - Common Shares Outstanding (M) 12243.0
EBIT/Interest - - - - Market Capitalization (M) 3773318.0
Tot Debt/Capital 0.9 0.9 0.9 0.9 Cash and ST Investments (M) 11635600.0
Tot Debt/Equity 7.5 7.8 6.9 7.0 Total Debt (M) 48096100.0
Eff Tax Rate % 23.4 25.0 32.8 195.9 Preferred Equity (M) 0.0LT Investments in Affiliate Companies (M) 0.0
Investments (M) 929100.0
Enterprise Value (M) 41162918.0
Barclays PLC is a global financial services provider engaged in retail banking, credit
cards, wholesale banking, investment banking, wealth management and investment
management services.
BARC LN
3'883'700143'700
Company Analysis - Overview
44%
38%
5%
13%
Corporate & Investment Banking
Retail & Business Banking
Wealth & Investment Management
Head Office & Other Operations
41%
26%
16%
13%
4%
UK
Americas
Africa and Middle East
Europe
Asia
Q.M.S Advisors | tel: +41 (0)78 922 08 77 | e-mail: [email protected] |

7/30/2019 Financial Analysis - Barclays PLC is a Global Financial Services Provider Engaged in Retail Banking, Credit Cards, Wholesale Banking, Investment Banking, Wealth Management …
http://slidepdf.com/reader/full/financial-analysis-barclays-plc-is-a-global-financial-services-provider-engaged 2/8
Barclays PLCTarget price in GBp
Date Buy Hold Sell Date Price Target Price Broker Analyst Recommendation Target Date
29-Mar-13 64% 27 9 24-Apr-13 293.35 363.64 Deutsche Bank JASON NAPIER buy 380.00 24-Apr-13
28-Feb-13 63% 28 9 23-Apr-13 298.30 363.64 Investec IAN GORDON buy 345.00 24-Apr-13
31-Jan-13 55% 29 16 22-Apr-13 289.50 363.64 RBC Capital Markets FIONA SWAFFIELD outperform 375.00 24-Apr-13
31-Dec-12 52% 32 16 19-Apr-13 286.35 363.64 Keefe, Bruyette & Woods MARK J PHIN outperform 400.00 24-Apr-13
30-Nov-12 52% 35 13 18-Apr-13 283.75 363.64 Sanford C. Bernstein & Co CHIRANTAN BARUA outperform 400.00 24-Apr-13
31-Oct-12 48% 35 16 17-Apr-13 290.30 363.64 Canaccord Genuity Corp GARETH HUNT hold 280.00 24-Apr-13
28-Sep-12 55% 32 13 16-Apr-13 294.80 363.38 Nomura CHINTAN JOSHI reduce 305.00 24-Apr-13
31-Aug-12 61% 29 10 15-Apr-13 296.75 363.38 Numis Securities Ltd MICHAEL J TRIPPITT buy 400.00 24-Apr-13
31-Jul-12 65% 26 10 12-Apr-13 299.30 363.38 Oriel Securities Ltd VIVEK RAJA buy 380.00 24-Apr-13
29-Jun-12 63% 28 9 11-Apr-13 303.90 363.38 Societe Generale JAMES INVINE buy 380.00 23-Apr-13
31-May-12 67% 24 9 10-Apr-13 298.25 363.38 Credit Suisse CARLA ANTUNES-SILVA neutral 290.00 22-Apr-13
30-Apr-12 67% 24 9 9-Apr-13 286.00 363.38 JPMorgan RAUL SINHA overweight 375.00 22-Apr-13
8-Apr-13 277.20 363.38 Exane BNP Paribas TOM RAYNER outperform 400.00 22-Apr-13
5-Apr-13 280.00 363.38 Macquarie EDWARD FIRTH neutral 320.00 19-Apr-13
4-Apr-13 284.90 363.38 AlphaValue DAVID GRINSZTAJN buy 353.00 18-Apr-13
3-Apr-13 289.30 363.38 Bankhaus Lampe NEIL SMITH buy 370.00 17-Apr-13
2-Apr-13 297.50 363.38 Baden Hill LLP JAMIE MOYES sell 12-Apr-13
1-Apr-13 291.15 363.38 Berenberg Bank JAMES CHAPPELL sell 160.00 11-Apr-13
29-Mar-13 291.15 363.38 Day by Day VALERIE GASTALDY buy 361.00 10-Apr-13
28-Mar-13 291.15 363.38 Redburn Partners FAHED KUNWAR buy 8-Apr-13
27-Mar-13 287.90 365.84 Grupo Santander ARTURO DE FRIAS buy 340.00 2-Apr-13
26-Mar-13 287.20 365.84 Mediobanca SpA CHRISTOPHER J WHEELER outperform 425.00 28-Mar-13
25-Mar-13 282.10 365.84 Shore Capital Stockbrokers GARY GREENWOOD hold 28-Mar-13
22-Mar-13 292.00 364.32 Morgan Stanley CHRISTOPHER MANNERS Overwt/In-Line 438.00 25-Mar-13
21-Mar-13 294.60 364.32 EVA Dimensions AUSTIN BURKETT hold 21-Mar-13
20-Mar-13 295.20 364.32 HSBC PETER TOEMAN overweight 400.00 26-Feb-13
19-Mar-13 297.50 364.32 Espir ito Santo Investment Bank Research SHAILESH RAIKUNDLIA buy 418.00 26-Feb-13
18-Mar-13 305.95 364.32 Goldman Sachs FREDERIK THOMASEN neutral/neutral 340.00 19-Feb-13
15-Mar-13 320.05 364.32 S&P Capital IQ FRANK BRADEN buy 380.00 13-Feb-13
14-Mar-13 317.90 364.32 Independent Research GmbH STEFAN BONGARDT buy 350.00 12-Feb-13
Company Analysis - Analysts Ratings
Buy and Sell Recommendations vs Price and Target Price
67% 67% 63% 65% 61%55%
48% 52% 52% 55%63% 64%
24% 24% 28% 26% 29%32%
35%35% 32% 29%
28% 27%
9% 9% 9% 10% 10% 13% 16% 13% 16% 16%9% 9%
0%
20%
40%
60%
80%
100%
avr.12 mai.12 juin.12 jui l.12 août.12 sept.12 oct.12 nov.12 déc.12 janv.13 févr.13 mars.13
B r o k e r R e c o m m e n d a t i o n
0
50
100
150
200
250
300
350
400 P r i c e
Buy Hold Sell Price Target Price
Brokers' Target Price
050
100150200250300350400450500
D e u t s c h e B a n k
I n v e s t e c
R B C C a p i t a l M a r k e t s
K e e f e , B r u y e t t e & W o o d s
S a n f o r d C . B e r n s t e i n & C o
C a n a c c o r d G e n u i t y C o r p
N o m u r a
N u m i s S e c u r i t i e s L t d
O r i e l S e c u r i t i e s L t d
S o c i e t e G e n e r a l e
C r e d i t S u i s s e
J P M o r g a n
E x a n e B N P P a r i b a s
M a c q u a r i e
A l p h a V a l u e
B a n k h a u s L a m p e
B a d e n H i l l L L P
B e r e n b e r g B a n k
D a y b y D a y
R e d b u r n P a r t n e r s
G r u p o S a n t a n d e r
M e d i o b a n c a S p A
S h o r e C a p i t a l S t o c k b r o k e r s
M o r g a n S t a n l e y
E V A D i m e n s i o n s
H S B C
E s p i r i t o S a n t o I n v e s t m e n t B a n k
R e s e a r c h
G o l d m a n S a c h s
S & P C a p i t a l I Q
I n d e p e n d e n t R e s e a r c h G m b H
L i b e r u m C a p i t a l L t d
Q.M.S Advisors | tel: +41 (0)78 922 08 77 | e-mail: [email protected] |
7/30/2019 Financial Analysis - Barclays PLC is a Global Financial Services Provider Engaged in Retail Banking, Credit Cards, Wholesale Banking, Investment Banking, Wealth Management …
http://slidepdf.com/reader/full/financial-analysis-barclays-plc-is-a-global-financial-services-provider-engaged 3/8
24.04.2013
Barclays PLC
Ownership Statistics Geographic Ownership Distribution
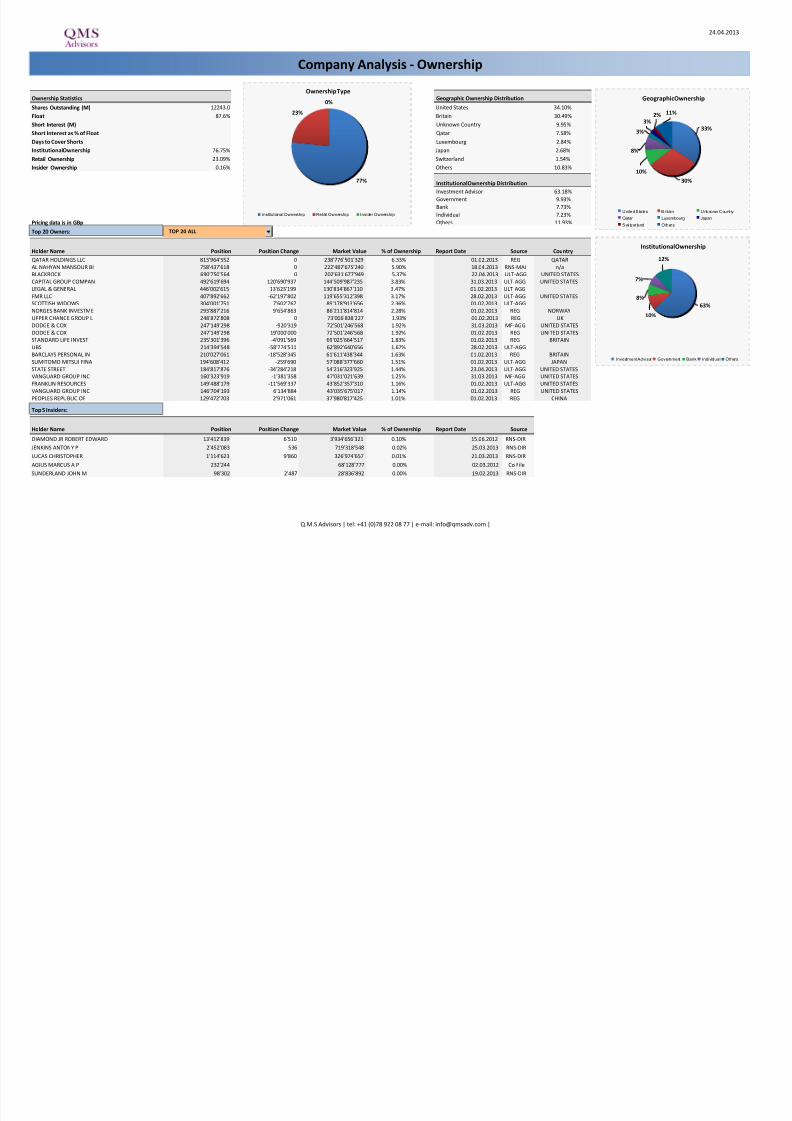
Shares Outstanding (M) 12243.0 United States 34.10%
Float 87.6% Britain 30.49%
Short Interest (M) Unknown Country 9.95%
Short Interest as % of Float Qatar 7.58%
Days to Cover Shorts Luxembourg 2.84%
Institutional Ownership 76.75% Japan 2.68%
Retail Ownership 23.09% Switzerland 1.54%
Insider Ownership 0.16% Others 10.83%
Institutional Ownership Distribution
Investment Advisor 63.18%
Government 9.93%
Bank 7.73%
Individual 7.23%
Pricing data is in GBp Others 11.93%
Top 20 Owners:
Holder Name Position Position Change Market Value % of Ownership Report Date Source Country
QATAR HOLDINGS LLC 813'964'552 0 238'776'501'329 6.33% 01.02.2013 REG QATAR
AL NAHYAN MANSOUR BI 758'437'618 0 222'487'675'240 5.90% 18.04.2013 RNS-MAJ n/a
BLACKROCK 690'750'564 0 202'631'677'949 5.37% 22.04.2013 ULT-AGG UNITED STATESCAPITAL GROUP COMPAN 492'619'694 120'690'937 144'509'987'235 3.83% 31.03.2013 ULT-AGG UNITED STATES
LEGAL & GENERAL 446'002'615 13'623'199 130'834'867'110 3.47% 01.02.2013 ULT-AGG
FMR LLC 407'892'662 -62'197'802 119'655'312'398 3.17% 28.02.2013 ULT-AGG UNITED STATES
SCOTTISH WIDOWS 304'001'751 7'602'767 89'178'913'656 2.36% 01.02.2013 ULT-AGG
NORGES BANK INVESTME 293'887'216 9'654'863 86'211'814'814 2.28% 01.02.2013 REG NORWAY
UPPER CHANCE GROUP L 248'872'808 0 73'006'838'227 1.93% 01.02.2013 REG UK
DODGE & COX 247'149'298 -920'319 72'501'246'568 1.92% 31.03.2013 MF-AGG UNITED STATES
DODGE & COX 247'149'298 -19'000'000 72'501'246'568 1.92% 01.02.2013 REG UNITED STATES
STANDARD LIFE INVEST 235'301'396 -4'091'569 69'025'664'517 1.83% 01.02.2013 REG BRITAIN
UBS 214'394'548 -58'774'511 62'892'640'656 1.67% 28.02.2013 ULT-AGG
BARCLAYS PERSONAL IN 210'027'061 -18'528'345 61'611'438'344 1.63% 01.02.2013 REG BRITAIN
SUMITOMO MITSUI FINA 194'608'412 -259'690 57'088'377'660 1.51% 01.02.2013 ULT-AGG JAPAN
STATE STREET 184'817'876 -34'284'218 54'216'323'925 1.44% 23.04.2013 ULT-AGG UNITED STATES
VANGUARD GROUP INC 160'323'919 -1'381'358 47'031'021'639 1.25% 31.03.2013 MF-AGG UNITED STATES
FRANKLIN RESOURCES 149'488'179 -11'569'337 43'852'357'310 1.16% 01.02.2013 ULT-AGG UNITED STATES
VANGUARD GROUP INC 146'704'193 6'134'884 43'035'675'017 1.14% 01.02.2013 REG UNITED STATES
PEOPLES REPUBLIC OF 129'472'703 2'971'061 37'980'817'425 1.01% 01.02.2013 REG CHINA
Top 5 Insiders:
Holder Name Position Position Change Market Value % of Ownership Report Date Source
DIAMOND JR ROBERT EDWARD 13'412'839 6'510 3'934'656'321 0.10% 15.06.2012 RNS-DIR
JENKINS ANTONY P 2'452'083 536 719'318'548 0.02% 25.03.2013 RNS-DIR
LUCAS CHRISTOPHER 1'114'623 9'860 326'974'657 0.01% 21.03.2013 RNS-DIR
AGIUS MARCUS A P 232'244 68'128'777 0.00% 02.03.2012 Co File
SUNDERLAND JOHN M 98'302 2'487 28'836'892 0.00% 19.02.2013 RNS-DIR
Company Analysis - Ownership
Ownership Type
77%
23%
0%
Institutional Ownership Retail Ownership Insider Ownership
Geographic Ownership
33%
11%
10%
3%
8%
3%2%
30%
United Sta tes Br it ain Unknown Count ry
Qatar Luxembourg Japan
Switzer land Others
Institutional Ownership
63%
8%
12%
7%
10%
Investment Advisor Government Bank Individual Others
TOP 20 ALL
Q.M.S Advisors | tel: +41 (0)78 922 08 77 | e-mail: [email protected] |

7/30/2019 Financial Analysis - Barclays PLC is a Global Financial Services Provider Engaged in Retail Banking, Credit Cards, Wholesale Banking, Investment Banking, Wealth Management …
http://slidepdf.com/reader/full/financial-analysis-barclays-plc-is-a-global-financial-services-provider-engaged 4/8
Barclays PLCFinancial information is in GBp (M)
Periodicity: 12/02 12/03 12/04 12/05 12/06 12/07 12/08 12/09 12/10 12/11 12/12 12/13E 12/14E 12/15E
Income Statement
Revenue 1'769'500 1'886'700 2'181'700 2'721'500 3'508'500 3'966'800 3'715'900 4'178'900 4'005'800 3'842'800 3'883'700 2'927'873 3'010'932 3'108'065- Cost of Goods Sold
Gross Income
- Sel ling, General & Admin Expenses 662'500 725'200 852'700 1 '051'800 1 '308'500 1 '319'900 1 '339'700 1 '668'200 1 '972'800 1 '918'000 1 '913'900
(Research & Dev Costs)
Operating Income 321'800 381' 200 448'800 524'400 635'600 700'600 72'000 619'000 564'900 547'200 690' 800 795'113 923'525 1' 022'500
- Interest Expense
- Foreign Exchange Losses (Gains)
- Net Non-Operating Losses (Gains) 1'300 -3'300 -9'200 -3'600 -78'000 -7'000 -441'600 160'500 -41'600 -40'700 666'200
Pretax Income 320'500 384' 500 458'000 528'000 713'600 707'600 513'600 458'500 606'500 587'900 24' 600 724'492 863'296 1' 491'972
- Income Tax Expense 95'500 107'600 127'900 143'900 194'100 198'100 45'300 107'400 151'600 192'800 48'200
Income Before XO Items 225'000 276' 900 330'100 384'100 519'500 509'500 468'300 351'100 454'900 395'100 -23' 600
- Extraordinary Loss Net of Tax 0 0 0 0 0 0 -60'400 -677'700 0 0 0
- Minority Interests 2'000 2'500 4'700 39'400 62'400 67'800 90'500 89'500 98'500 94'400 80'500
Diluted EPS Before XO Items 32.55 41.02 48.72 51.76 68.41 65.30 49.86 22.78 28.62 24.01 (8.25)
Net Income Adjusted* 223'000 274' 000 322'300 344'700 438'400 441'700 197'600 288'500 328'248 304'300 421' 800 455'748 557'023 652'873
EPS Adjusted 32.82 0.00 49.66 52.97 67.20 67.10 26.70 26.50 28.00 25.40 34.50 36.42 43.82 51.00
Dividends Per Share 17.87 19.96 23.37 25.91 30.19 33.11 11.50 2.50 5.50 6.00 6.50 7.24 9.36 13.19
Payout Ratio % 54.1 48.8 47.0 48.9 43.2 51.0 24.0 11.0 18.8 24.2 0.20 0.21 0.26
Total Shares Outstanding 6'757 6'744 6'627 6'664 6'710 6'778 8'372 11'412 12'182 12'199 12'243
Diluted Shares Outstanding 6'852 6'689 6'679 6'660 6'682 6'764 7'577 11'484 12'452 12'526 12'614
EBITDA
*Net income excludes extraordinary gains and losses and one-time charges.
Equivalent Estimates
Company Analysis - Financials I/IV
FiscalYear
Q.M.S Advisors | tel: +41 (0)78 922 08 77 | e-mail: [email protected] |
7/30/2019 Financial Analysis - Barclays PLC is a Global Financial Services Provider Engaged in Retail Banking, Credit Cards, Wholesale Banking, Investment Banking, Wealth Management …
http://slidepdf.com/reader/full/financial-analysis-barclays-plc-is-a-global-financial-services-provider-engaged 5/8
Periodicity: 12/02 12/03 12/04 12/05 12/06 12/07 12/08 12/09 12/10 12/11 12/12 12/13E 12/14E 12/15E
Balance Sheet
Total Current Assets
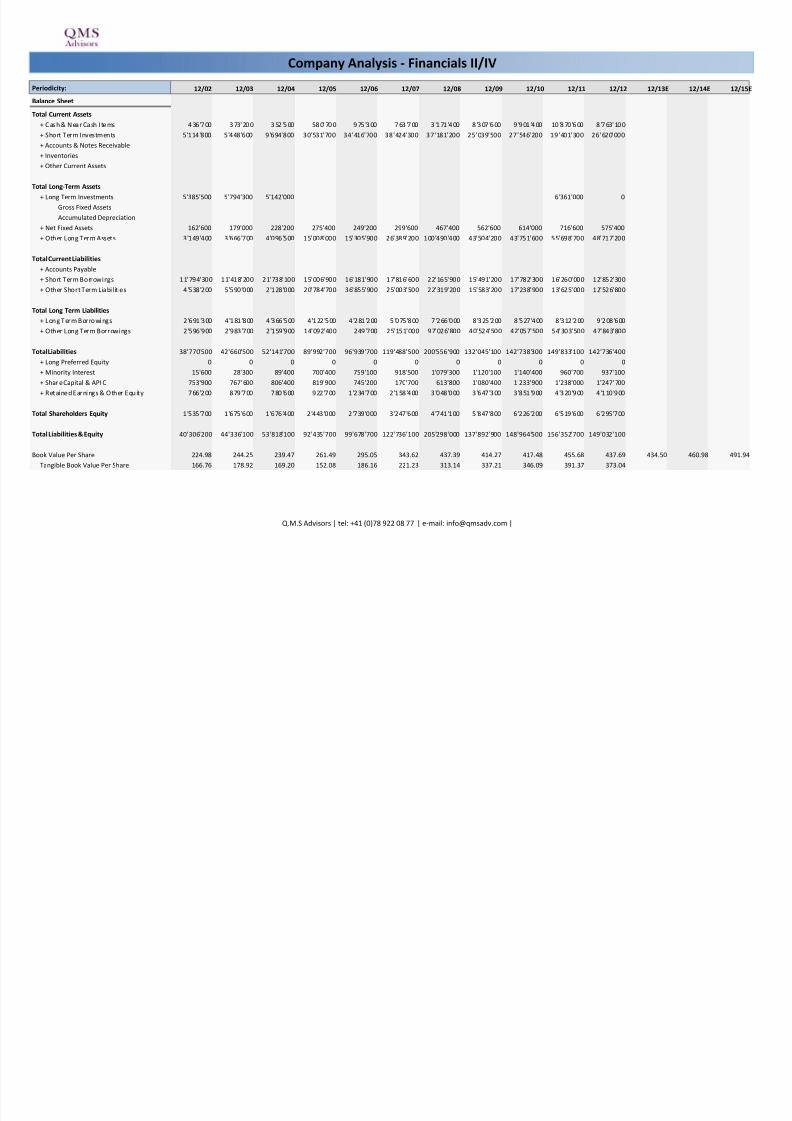
+ C as h & N ea r Ca sh I te ms 4 36 '7 00 3 73' 20 0 3 52 '5 00 58 0' 70 0 9 75 '3 00 7 63 '7 00 3 '1 71 '4 00 8 '3 07 '6 00 9 '9 01 '4 00 10 '8 70 '6 00 8 '7 63' 10 0
+ Short Term Investments 5'114'800 5'448'600 9'694'800 30'531'700 34'416'700 38'424'300 37'181'200 25'039'500 27'546'200 19'401'300 26'620'000+ Accounts & Notes Receivable
+ Inventories
+ Other Current Assets
Total Long-Term Assets
+ Long Term Investments 5'385'500 5'794'300 5'142'000 6'361'000 0
Gross Fixed Assets
Accumulated Depreciation
+ Net Fixed Assets 162'600 179'000 228'200 275'400 249'200 299'600 467'400 562'600 614'000 716'600 575'400
+ Other Long Term Assets 3'149'400 3'666'700 4'096'500 15'008'000 15'305'900 26'389'200 100'490'400 43'504'200 43'751'600 55'698'700 48'717'200
Total Current Liabilities
+ Accounts Payable
+ Short Term Borrowings 11'794'300 11'418'200 21'738'100 15'006'900 16'181'900 17'816'600 22'165'900 15'491'200 17'782'300 16'260'000 12'852'300
+ Other Short Term Liabilities 4'538'200 5'590'000 2'128'000 20'784'700 36'855'900 25'003'500 22'319'200 15'583'200 17'238'900 13'625'000 12'526'800
Total Long Term Liabilities
+ Long Term Borrowings 2 '691'300 4 '181'800 4 '366'500 4 '122'500 4 '281'200 5 '075'800 7 '266'000 8 '325'200 8 '527'400 8 '312'200 9 '208'600
+ Other Long Term Borrowings 2'596'900 2'983'700 2'159'900 14'092'400 249'700 25'151'000 97'026'800 40'524'500 42'057'500 54'303'500 47'843'800
Total Liabilities 38'770'500 42'660'500 52'141'700 89'992'700 96'939'700 119'488'500 200'556'900 132'045'100 142'738'300 149'833'100 142'736'400
+ Long Preferred Equity 0 0 0 0 0 0 0 0 0 0 0
+ Minority Interest 15'600 28'300 89'400 700'400 759'100 918'500 1'079'300 1'120'100 1'140'400 960'700 937'100
+ Shar e Capital & API C 753'900 767' 600 806'400 819'900 745'200 170'700 613'800 1'080'400 1'233'900 1'238'000 1'247' 700
+ Retained Earnings & Other Equity 766'200 879'700 780'600 922'700 1 '234'700 2 '158'400 3 '048'000 3 '647'300 3 '851'900 4 '320'900 4 '110'900
Total Shareholders Equity 1'535'700 1'675'600 1'676'400 2'443'000 2'739'000 3'247'600 4'741'100 5'847'800 6'226'200 6'519'600 6'295'700
Total Liabilities & Equity 40'306'200 44'336'100 53'818'100 92'435'700 99'678'700 122'736'100 205'298'000 137'892'900 148'964'500 156'352'700 149'032'100
Book Value Per Share 224.98 244.25 239.47 261.49 295.05 343.62 437.39 414.27 417.48 455.68 437.69 434.50 460.98 491.94
Tangible Book Value Per Share 166.76 178.92 169.20 152.08 186.16 221.23 313.14 337.21 346.09 391.37 373.04
Company Analysis - Financials II/IV
Q.M.S Advisors | tel: +41 (0)78 922 08 77 | e-mail: [email protected] |

7/30/2019 Financial Analysis - Barclays PLC is a Global Financial Services Provider Engaged in Retail Banking, Credit Cards, Wholesale Banking, Investment Banking, Wealth Management …
http://slidepdf.com/reader/full/financial-analysis-barclays-plc-is-a-global-financial-services-provider-engaged 6/8
Periodicity: 12/02 12/03 12/04 12/05 12/06 12/07 12/08 12/09 12/10 12/11 12/12 12/13E 12/14E 12/15E
Cash Flows
Net Income 223'000 274' 400 325'400 344'700 457'100 441'700 438'200 939'300 356'400 300'700 -104' 100 425'125 521'100 599'231
+ D eprec iation & Amortization 202'900 190' 100 142'100 202'100 276'600 346'400 630'400 926'700 701'800 670'600 471' 500
+ Other Non-Cash Adjustments 1 '272'200 941'800 -241'200 2 '695'300 -1'715'900 -3'123'000 319'400 4 '690'500 760'500 -742'000 -1 '502'700+ Changes in Non-Cash Capital -3'634'100 -2'546'000 -2'176'100 -3'270'100 31'000 0 0 0
Cash From Operating Activities -1'936'000 -1'139'700 -1'949'800 -28'000 -951'200 -2'334'900 1'388'000 6'556'500 1'818'700 229'300 -1'135'300
+ Disposal of Fixed Assets 28'900 9'700 12'500 9'800 78'600 61'700 79'900 37'200 55'600
+ Capital Expenditures -30'100 -31'000 -53'200 -58'800 -65'400 -124'100 -164'300 -115'000 -176'700 -145'400 -60'400
+ Increase in Investments -2'812'800 -3'688'600 -4'752'000 -5'348'300 -4'708'600 -2'689'900 -5'775'600 -7'842'000 -7'641'800 -6'752'500 -8'079'600
+ Decrease in Investments 2 '138'400 3 '853'100 4 '116'300 5 '111'100 4 '606'900 3 '842'300 5 '142'900 8 '855'900 7 '125'100 6 '694'100 7 '376'900
+ Other Investing Activities -61'200 -93'000 -24'900 -234'200 -26'900 -83'600 -149'100 252'700 75'100 12'600 53'200
Cash From Investing Activities -1'618'000 -832'900 -4'977'600 -6'838'100 -2'853'900 -6'792'300 -6'709'300 3'737'000 -6'883'900 3'642'800 -486'800
+ Dividends Paid -114'600 -124'900 -142'500 -189'400 -221'500 -255'900 -269'700 -63'300 -130'700 -138'700 -142'700
+ Change in Short Term Borrowings 0 0 0 0 0 0
+ Incre as e in Long T erm Borro wings 2 17 '3 00 1 92' 60 0 66 '6 00 11 7' 90 0 4' 94 3' 70 0 9 '5 21 '4 00 5 76 '3 00 3 54 '9 00 2 13 '1 00 8 8' 000 2 25' 80 0
+ Decrea se in Long T erm Borro wings - 37 '6 00 - 97 '40 0 - 61' 10 0 - 46 '4 00 -3 6' 60 0 -6 8' 30 0 -1 20 '7 00 -4 38 '3 00 - 12 1' 10 0 - 40 0' 300 - 26 8' 00 0
+ Increase in Capital Stocks 8'700 11'300 6'000 13'800 17'900 249'400 959'200 80'600 153'500 4'100 9'700
+ Decrease in Capital Stocks -54'600 -20'400 -73'400 -14'300 -3'100 -185'000 -17'300 0 -98'900 -23'500 -97'900
+ Other Financi ng Activiti es 65'600 331' 300 453'400 1'606'600 119'400 78'100 -437'600 -324'000 384'200 -419'000 -422' 000
Cash From Financing Activities 3'433'300 1'935'400 6'993'700 6'786'400 4'819'800 9'339'700 8'464'500 -5'310'400 6'771'200 -2'044'800 -1'154'500
Net Changes in Cash -120'700 -37'200 66'300 -79'700 1' 014'700 212'500 3'143'200 4'983'100 1'706'000 1'827'300 -2'776' 600
Free Cash F low (CFO-CAPEX) -1'966'100 -1 '170'700 -2'003'000 -86'800 -1'016'600 -2'459'000 1 '223'700 6 '441'500 1 '642'000 83'900 -1 '195'700
Free Cash Flow To Firm
F re e C as h F lo w T o E qui ty -1 '7 57 '5 00 - 1' 06 5' 80 0 - 1' 98 5' 00 0 -5 '5 00 3' 96 9' 10 0 7 '0 55 '8 00 1 '7 59 '2 00 6 '3 95 '3 00 1 '7 89 '6 00 - 22 8' 400 - 1' 23 7' 90 0
Free Cash Flow per Share -288.97 -175.86 -305.70 -13.34 -155.74 -373.60 165.61 591.51 140.11 7.00 -97.81
Company Analysis - Financials III/IV
Q.M.S Advisors | tel: +41 (0)78 922 08 77 | e-mail: [email protected] |

7/30/2019 Financial Analysis - Barclays PLC is a Global Financial Services Provider Engaged in Retail Banking, Credit Cards, Wholesale Banking, Investment Banking, Wealth Management …
http://slidepdf.com/reader/full/financial-analysis-barclays-plc-is-a-global-financial-services-provider-engaged 7/8
Periodicity: 12/02 12/03 12/04 12/05 12/06 12/07 12/08 12/09 12/10 12/11 12/12 12/13E 12/14E 12/15E
Ratio Analysis
Valuation Ratios
Price Earnings 11.4x 11.8x 11.5x 11.2x 10.2x 7.3x 3.0x 11.5x 8.6x 7.0x 8.1x 6.7x 5.8x
EV to EBITEV to EBITDA
Price to Sales 1.4x 1.7x 1.7x 1.4x 1.3x 0.8x 0.3x 0.7x 0.8x 0.5x 0.8x 1.3x 1.3x 1.2x
Price to Book 1.7x 2.0x 2.4x 2.3x 2.4x 1.4x 0.4x 0.7x 0.6x 0.4x 0.6x 0.7x 0.6x 0.6x
Dividend Yield 4.8% 4.1% 4.1% 4.4% 4.2% 6.7% 7.5% 0.9% 2.1% 3.4% 2.5% 2.5% 3.2% 4.5%
Profitability Ratios
Gross Margin
EBITDA Margin - - -
Operating Margin 27.1% 29.2% 30.4% 29.0% 28.3% 29.2% 3.5% 19.1% 17.4% 18.2% 22.1% 27.2% 30.7% 32.9%
Profit Margin 18.8% 21.0% 22.0% 19.1% 20.4% 18.4% 21.3% 28.9% 11.0% 10.0% -3.3% 15.6% 18.5% 21.0%
Return on Assets 0.6% 0.6% 0.7% 0.5% 0.5% 0.4% 0.3% 0.5% 0.2% 0.2% -0.1% 0.3% 0.4% 0.4%
Return on Equity 15.0% 17.3% 20.1% 20.7% 24.6% 20.5% 14.6% 22.4% 7.3% 5.6% -1.9% 8.3% 9.5% 10.3%
Leverage & Coverage Ratios
Current Ratio
Quick Ratio
Interest Coverage Ratio (EBIT/I)
Tot Debt/Capital 0.90 0.90 0.94 0.93 0.93 0.92 0.91 0.88 0.89 0.87 0.87
Tot Debt/Equity 9.43 9.31 15.57 12.79 12.47 12.27 10.05 7.47 7.85 6.95 6.96
Others
Asset Turnover 0.05 0.04 0.04 0.04 0.04 0.04 0.02 0.02 0.03 0.03 0.03
Accounts Receivable Turnover
Accounts Payable Turnover
Inventory Turnover
Effective Tax Rate 29.8% 28.0% 27.9% 27.3% 27.2% 28.0% 8.8% 23.4% 25.0% 32.8% 195.9%
Company Analysis - Financials IV/IV
Q.M.S Advisors | tel: +41 (0)78 922 08 77 | e-mail: [email protected] |
7/30/2019 Financial Analysis - Barclays PLC is a Global Financial Services Provider Engaged in Retail Banking, Credit Cards, Wholesale Banking, Investment Banking, Wealth Management …
http://slidepdf.com/reader/full/financial-analysis-barclays-plc-is-a-global-financial-services-provider-engaged 8/8
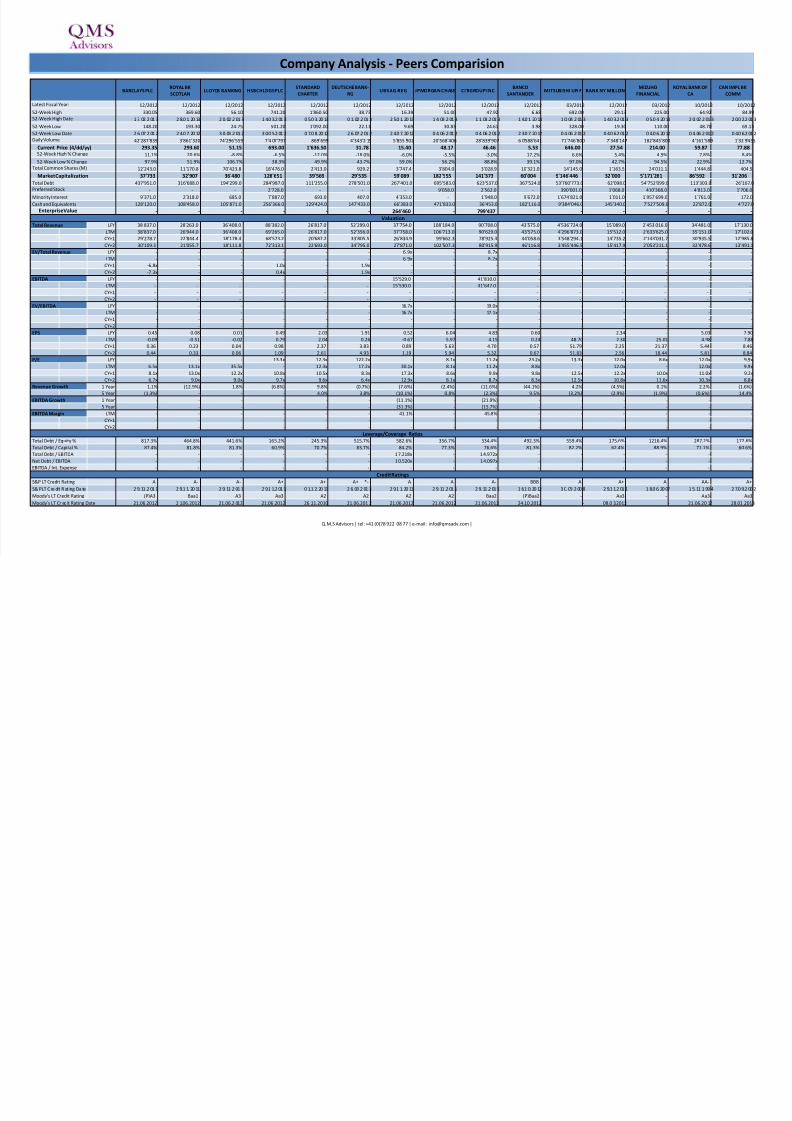
BARCLAYS PLCROYAL BK
SCOTLANLLOYDS BANKING HSBC HLDGS PLC
STANDARD
CHARTER
DEUTSCHE BANK-
RGUBS AG-REG JPMORGAN CHASE CITIGROUP INC
BANCO
SANTANDERMITSUBISHI UFJ F BANK NY MELLON
MIZUHO
FINANCIAL
ROYAL BANK OF
CA
CAN IMPL BK
COMM
12/2012 12/2012 12/2012 12/2012 12/2012 12/2012 12/2012 12/2012 12/2012 12/2012 03/2012 12/2012 03/2012 10/2012 10/2012
330.05 369.60 56.10 741.20 1'860.50 38.73 16.39 51.00 47.92 6.68 692.00 29.13 225.00 64.92 84.99
1 3. 02 .2 01 3 2 8.0 1. 20 13 2 0. 02 .2 01 3 1 4.0 3.2 01 3 0 5.0 3. 20 13 0 1. 02 .2 01 3 2 5.0 1. 20 13 1 4. 03 .2 01 3 1 1. 03 .2 01 3 1 4.0 1. 20 13 1 0. 04 .2 01 3 1 4.0 3.2 01 3 0 5.0 4. 20 13 2 0. 02 .2 01 3 2 0.0 2.2 01 3
148.20 193.30 24.75 501.20 1'092.00 22.11 9.69 30.83 24.61 3.98 328.00 19.30 110.00 48.70 69.13
2 6. 07 .2 01 2 2 4.0 7. 20 12 3 0. 05 .2 01 2 3 0.0 5.2 01 2 0 7.0 8. 20 12 2 6. 07 .2 01 2 2 4.0 7. 20 12 0 4. 06 .2 01 2 0 4. 06 .2 01 2 2 3.0 7. 20 12 0 4. 06 .2 01 2 0 4.0 6.2 01 2 0 4.0 6. 20 12 0 4. 06 .2 01 2 0 4.0 6.2 01 2
42'287'839 3'861'320 74'296'559 7'4 07'797 869'699 4'343'2 15 5'855 '902 20'568'406 28'839'907 6 0'588'641 71'746'800 7'348'147 182'845'800 4'161'589 1'32 9'435
293.35 293.60 51.15 693.00 1'636.50 31.78 15.40 48.17 46.46 5.53 646.00 27.54 214.00 59.87 77.88
-11.1% -20.6% -8.8% -6.5% -12.0% -18.0% -6.0% -5.5% -3.0% -17.2% -6.6% -5.4% -4.9% -7.8% -8.4%
97.9% 51.9% 106.7% 38.3% 49.9% 43.7% 59.0% 56.2% 88.8% 39.1% 97.0% 42.7% 94.5% 22.9% 12.7%
12'243.0 11'170.8 70'423.8 18'476.0 2'413.0 929.2 3'747.4 3'804.0 3'028.9 10'321.0 14'145.0 1'163.5 24'011.1 1'444.8 404.5
37'733 32'907 36'480 128'651 39'569 29'535 59'089 182'555 141'373 60'004 9'146'446 32'000 5'171'281 86'592 31'206
437'951.0 316'688.0 194'299.0 284'987.0 111'255.0 278'501.0 267'401.0 695'583.0 623'537.0 367'524.0 53'760'773.0 62'098.0 54'752'099.0 113'303.0 26'167.0
- - - 2'728.0 - - - 9'058.0 2'562.0 - 390'001.0 1'068.0 410'368.0 4'813.0 1'706.0
9'371.0 2'318.0 685.0 7'887.0 693.0 407.0 4'353.0 - 1'948.0 9'672.0 1'674'821.0 1'011.0 1'957'699.0 1'761.0 172.0
128'120.0 108'458.0 105'871.0 256'366.0 129'424.0 147'433.0 66'383.0 471'833.0 36'453.0 182'116.0 9'384'046.0 145'340.0 7'527'509.0 22'872.0 4'727.0
- - - - - - 264'460 - 799'437 - - - - - -
LFY 38'837.0 28'263.0 36'408.0 88'382.0 26'817.0 52'299.0 37'754.0 108'184.0 90'708.0 43'575.0 4'536'724.0 15'089.0 2'453'016.0 34'481.0 17'130.0
LTM 38'837.0 26'944.0 36'408.0 69'265.0 26'817.0 52'356.0 37'758.0 106'713.0 90'629.0 43'575.0 4'296'873.0 15'512.0 2'633'625.0 35'151.0 17'102.0
CY+1 29'278.7 22'844.4 18'178.4 68'573.2 20'687.2 33'805.5 26'834.9 99'662.3 78'925.3 44'058.6 3'548'294.1 14'735.2 2'143'031.7 30'935.5 12'985.8
CY+2 30'109.3 21'055.7 18'111.8 72'313.1 22'693.0 34'795.0 27'871.0 102'507.3 80'915.9 46'116.8 3'455'446.5 15'417.9 2'053'211.1 32'478.6 13'491.1
LFY - - - - - - 6.9x - 8.7x - - - - - -
LTM - - - - - - 6.9x - 8.7x - - - - - -
CY+1 -6.8x - - 1.0x - 1.9x - - - - - - - - -
CY+2 -7.3x - - 0.4x - 1.9x - - - - - - - - -
LFY - - - - - - 15'529.0 - 41'810.0 - - - - - -
LTM - - - - - - 15'530.0 - 41'647.0 - - - - - -
CY+1 - - - - - - - - - - - - - - -
CY+2 - - - - - - - - - - - - - - -
LFY - - - - - - 16.7x - 19.0x - - - - - -
LTM - - - - - - 16.7x - 17.1x - - - - - -
CY+1 - - - - - - - - - - - - - - -
CY+2 - - - - - - - - - - - - - - -
LFY 0.45 0.08 0.01 0.49 2.03 1.91 0.52 6.04 4.83 0.60 - 2.34 - 5.03 7.90
LTM -0.09 -0.51 -0.02 0.79 2.04 0.26 -0.67 5.97 4.15 0.24 48.70 2.30 25.01 4.98 7.88
CY+1 0.36 0.23 0.04 0.98 2.37 3.83 0.89 5.63 4.70 0.57 51.79 2.25 21.37 5.44 8.46
CY+2 0.44 0.33 0.06 1.09 2.61 4.93 1.19 5.94 5.32 0.67 51.83 2.56 18.44 5.81 8.84
LFY - - - 13.3x 12.3x 122.2x - 8.1x 11.2x 23.2x 13.3x 12.0x 8.6x 12.0x 9.9x
LTM 6.5x 13.1x 35.5x - 12.3x 17.2x 30.1x 8.1x 11.2x 8.8x - 12.0x - 12.0x 9.9x
CY+1 8.1x 13.0x 12.2x 10.8x 10.5x 8.3x 17.3x 8.6x 9.9x 9.8x 12.5x 12.2x 10.0x 11.0x 9.2x
CY+2 6.7x 9.0x 9.0x 9.7x 9.6x 6.4x 12.9x 8.1x 8.7x 8.3x 12.5x 10.8x 11.6x 10.3x 8.8x
1 Year 1.1% (12.9%) 1.8% (6.8%) 9.8% (0.7%) (7.6%) (2.4%) (11.6%) (44.1%) 4.2% (4.5%) 0.1% 2.2% (1.6%)
5 Year (1.3%) - - - 4.0% 3.8% (10.1%) 0.8% (2.3%) 9.5% (3.2%) (2.9%) (1.9%) (0.6%) 14.4%
1 Year - - - - - - (11.1%) - (21.9%) - - - - - -
5 Year - - - - - - (31.3%) - (15.7%) - - - - - -
LTM - - - - - - 41.1% - 45.8% - - - - - -CY+1 - - - - - - - - - - - - - - -
CY+2 - - - - - - - - - - - - - - -
Total Debt / Equity % 817.3% 464.8% 441.6% 165.2% 245.3% 515.7% 582.6% 356.7% 334.4% 492.3% 559.4% 175.6% 1216.4% 287.2% 172.6%
Total Debt / Capital % 87.4% 81.8% 81.3% 60.9% 70.7% 83.7% 84.2% 77.3% 76.6% 81.3% 82.2% 62.4% 88.9% 71.1% 60.6%
Total Debt / EBITDA - - - - - - 17.218x - 14.972x - - - - - -
Net Debt / EBITDA - - - - - - 10.520x - 14.097x - - - - - -
EBITDA / Int. Expense - - - - - - - - - - - - - - -
S&P LT Credit Rating A A- A- A+ A+ A+ *- A A A- BBB A A+ A AA- A+
S& P LT C re dit R at ing Da te 2 9. 11 .2 01 1 2 9.1 1. 20 11 2 9. 11 .2 01 1 2 9.1 1.2 01 1 0 1.1 2. 20 11 2 6. 03 .2 01 3 2 9.1 1. 20 11 2 9. 11 .2 01 1 2 9. 11 .2 01 1 1 6.1 0. 20 12 3 0. 09 .2 00 8 2 9.1 1.2 01 1 1 8.0 6. 20 07 1 5. 11 .1 99 4 2 7.0 9.2 00 2
Moody's LT Credit Rating (P)A3 Baa1 A3 Aa3 A2 A2 A2 A2 Baa2 (P)Baa2 - Aa3 - Aa3 Aa3
Moody's LT Cr edit Rating Date 21.06.2012 2 1.06.2012 21.06.2 012 21.06 .2012 26 .11.2010 21.06.201 2 21.06.2012 21.06.2012 21.06.2012 24.10.2012 - 08.0 3.2012 - 21.06.20 12 28.01 .2013
52-Week High Date
52-Week Low
Latest Fiscal Year:
52-Week High
Total Debt
Market Capitalization
Daily Volume
52-Week Low % Change
Current Price (4/dd/yy)52-Week High % Change
Cash and Equivalents
EBITDA
EV/EBITDA
Enterprise Value
Valuation
Preferred Stock
52-Week Low Date
Minority Interest
Total Common Shares (M)
P/E
Revenue Growth
Total Revenue
EV/Total Revenue
EPS
EBITDA Growth
EBITDA Margin
Credit Ratings
Leverage/Coverage Ratios
Company Analysis - Peers Comparision
Q.M.S Advisors | tel: +41 (0)78 922 08 77 | e-mail: [email protected] |