finance division briefing paper school construction authority
TRANSCRIPT

Finance Division Briefing Paper School Construction Authority
Finance Division Preston Niblack, Director Jeffrey Rodus, First Deputy Director
Hearing on the Mayor’s Fiscal 2013 Preliminary Capital Budget
Department of Education – School Construction Authority
March 26, 2012 Regina Poreda Ryan, Assistant Director Eisha N. Wright, Unit Head Christina Perrotti, Legislative Financial Analyst
THE COUNCIL OF THE CITY OF NEW YORK
Speaker of the Council Christine C. Quinn
Hon. Robert Jackson, Chair, Education Committee
08 Fall


Finance Division Briefing Paper School Construction Authority
Page i
Table of Contents Department of Education and School Construction Authority Overview ..................................................... 1
Fiscal 2010-2014 Five Year Capital Plan Highlights .............................................................................................. 1
Current Plan vs. February 2012 Proposed Amendment ...................................................................................... 3
Capacity ................................................................................................................................................................................... 3
Capital Investment ........................................................................................................................................................... 11
Appendix I: Development and Structure of Capital Plan .................................................................................. 18
Appendix II: Fiscal 2012 PMMR Indicators ............................................................................................................ 21

Finance Division Briefing Paper School Construction Authority
Page 1
Department of Education and School Construction Authority Overview The Department of Education (DOE) provides primary and secondary education to over 1 million pre-kindergarten to grade 12 students in 32 school districts and roughly 1,700 schools. The School Construction Authority (SCA) is the DOE’s capital planning and construction agent; it is the one agency responsible for new school construction and major renovations to older schools. The SCA is responsible for all capital planning, budgeting, design and operations. The SCA coordinates the development of the Department of Education’s Five Year Capital Plan, selects and acquires sites for new schools, leases buildings for schools and supervises conversion of administrative space for classroom use. For a discussion of how the DOE and SCA develop the Capital Plan and an overview of the plan’s structure, refer to Appendix I.
This report will provide an overview of the February 2012 Proposed Amendment to the Fiscal 2010-2014 Five Year Capital Plan as well as the Fiscal 2012 Preliminary Mayor’s Management Reports for the School Construction Authority and Department of Education as they relates to the capital program. After discussing the highlights of the Proposed Amendment, it will describe in further detail the Capacity and Capital Investment categories of the plan.
Fiscal 2010-2014 Five Year Capital Plan Highlights
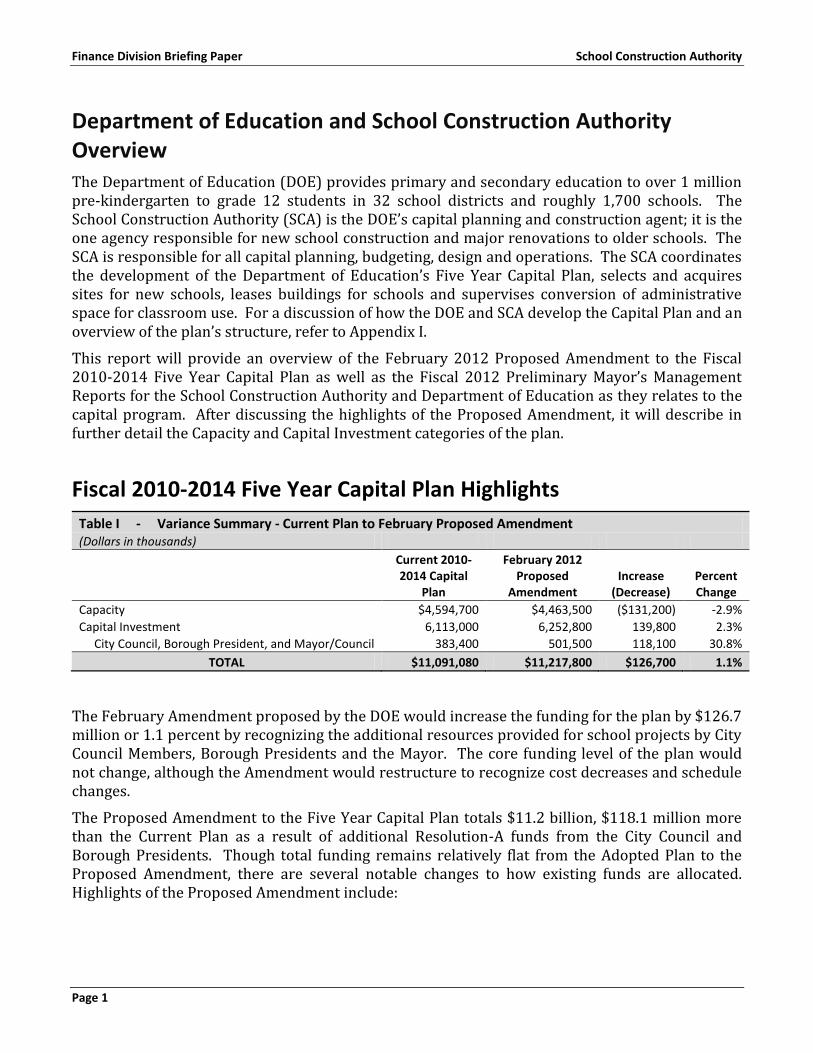
Table I - Variance Summary - Current Plan to February Proposed Amendment (Dollars in thousands)
Current 2010-2014 Capital
Plan
February 2012 Proposed
Amendment
Percent Change
Increase (Decrease)
Capacity $4,594,700 $4,463,500 ($131,200) -2.9%
Capital Investment 6,113,000 6,252,800 139,800 2.3%
City Council, Borough President, and Mayor/Council 383,400 501,500 118,100 30.8%
TOTAL $11,091,080 $11,217,800 $126,700 1.1%
The February Amendment proposed by the DOE would increase the funding for the plan by $126.7 million or 1.1 percent by recognizing the additional resources provided for school projects by City Council Members, Borough Presidents and the Mayor. The core funding level of the plan would not change, although the Amendment would restructure to recognize cost decreases and schedule changes.
The Proposed Amendment to the Five Year Capital Plan totals $11.2 billion, $118.1 million more than the Current Plan as a result of additional Resolution-A funds from the City Council and Borough Presidents. Though total funding remains relatively flat from the Adopted Plan to the Proposed Amendment, there are several notable changes to how existing funds are allocated. Highlights of the Proposed Amendment include:

Finance Division Briefing Paper School Construction Authority
Page 2
Budget Increase City Council, Borough Presidents and the Mayor/City Council partnership added $118 million worth of projects since the plan was adopted in June. Of this, $110 million was City Council funding.
5,000 New Seats The DOE proposes to shift $59 million from the Facility Replacement Program to New Capacity, which would enable it to add 5,000 new seats to the plan for a total of 33,900 seats.
Capital Improvement Program Increase Savings achieved in the Facility Replacement Program and from lower prior plan completion costs would be shifted into the Capital Improvement Program. The added funds would be used to complete critical projects, such as upgrades to fire alarm systems.
Facility Replacement Savings Lower than expected lease rates led the SCA to renew several leases, reducing the number of seats it needs to replace from 6,500 in the Adopted Plan to 5,300 in the Proposed Amendment.
Prior Plan Completion Savings Favorable market conditions and lower than expected construction costs led the SCA to re-estimate prior plan completion costs and project $200 million in savings.
Technology Program Delay First presented in the November 2011 Amendment, the February Amendment includes a $200 reduction in technology spending in Fiscal 2012. The funds would remain in the technology budget by shifting $100 million to Fiscal 2013 and 2014.

Finance Division Briefing Paper School Construction Authority
Page 3
Current Plan vs. February 2012 Proposed Amendment The February Amendment totals $11.2 billion to fund capacity and capital improvement projects through Fiscal 2014. The Amendment provides $118 million more than the Current Plan’s $11.1 billion budget. The following table depicts the variances from the Current Plan to the Proposed Amendment:
Table 2 - Variance Detail - Current Plan to February Proposed Amendment
(Dollars in thousands)
Current 2010-2014
Capital Plan
February 2012
Proposed Amendment
Increase (Reduction)
Percent Change
Capacity
New Capacity $3,445,800 $3,504,600 $58,800 1.7%
Facility Replacement Program 938,900 748,900 (190,000) -20.2%
Charter/Partnership Schools 210,000 210,000 0 0.0%
Capacity Subtotal $4,594,700 $4,463,500 ($131,200) -2.9%
Capital Investment Capital Improvement Program $2,339,400 $2,639,100 $299,700 12.8%
Exteriors 1,384,200 1,541,700 157,500 11.4%
Interiors 823,200 967,700 144,500 17.6%
Other 132,000 129,800 (2,200) -1.7%
Children First Initiative $1,623,800 $1,638,800 $15,000 0.9%
Technology Enhancements 926,800 926,800 0 0.0%
Facility Enhancements 697,000 712,000 15,000 2.2%
Mandated Programs $2,149,800 $1,974,900 ($174,900) -8.1%
Remediation/Code Programs 266,800 232,500 (34,300) -12.9%
Fixed Programs 1,883,000 1,742,400 (140,600) -7.5%
Capital Investment Subtotal $6,113,000 $6,252,800 $139,800 2.3%
City Council, Borough President, and Mayor/Council $383,400 $501,500 $118,100 30.8%
GRAND TOTAL $11,091,100 $11,217,800 $126,700 1.1%
The $11.2 billion Proposed Amendment includes $4.46 million for Capacity; $6.25 million for Capital Investment; and $500 million from City Council, Borough Presidents, and the Mayor. The Capacity category encompasses all projects that will create new class room seats in the school system. The Capital Investment category covers all other capital projects in school buildings. Both categories are detailed below.
Capacity The Proposed Amendment includes $4.46 billion for capacity, a $131.2 million reduction from the Current Plan’s $4.59 billion Capacity budget. Capacity is broken down into three sub-categories: New Capacity, Facility Replacement, and Charter and Partnership Schools.
Finance Division Briefing Paper School Construction Authority
Page 4
New Capacity $3.50 billion The New Capacity program would increase by $58.8 million to total $3.5 billion in the Proposed Amendment. The Proposed Amendment includes an additional 5,022 new seats, 256 of which were included in the November 2011 Amendment at no additional cost. The new seats would increase the plan’s New Capacity to 33,888 seats, a 17.4 percent increase from the 28,866 seats in the Current Plan. As shown in the table below, the additional seats would be constructed in the following school districts: 2, 8, 10, 11, 24, 25, 28, 29, 78K, and 78Q. The Department has not yet identified the sub-districts in which the seats would be placed.
Of the 33,888 seats in the Proposed Amendment, 2,314 would be funded for design only in the Fiscal 2010-2014 Plan. Funding for construction of these seats would not be available until the Fiscal 2015-2019 Plan. Also, 3,100 of the seats would be for special education students. These estimates have not changed from the Current Plan, so all new seats in the Proposed Amendment would be for general education students and funded for design and construction in this plan.
The Department was able to increase funding for New Capacity without increasing funding for the plan as a whole by shifting funds from the Facility Replacement Program. The SCA projects that it could construct nearly 5,000 new seats with these funds because favorable market conditions have led to relatively low property values and lower construction costs. Importantly, the additional capacity would help to relieve overcrowding.

Finance Division Briefing Paper School Construction Authority
Page 5
Table 3 - New Capacity Projects
School District Sub-Districts
Total Feb. 2012
Identified Need
Current Plan Seats
Feb. 2012 Amend.
Additional Funded Seats
Number of Seats in
Scope/Design
Number of Seats in Construction/
Completed
2 Tribeca / Village
4,624
1,301
236
1,537 0
2 Chelsea / Midtown West 1,127 0 321
2 Flatiron / Gramercy / Murray Hill
738 0 640
2 Upper East Side 500 126 374
Subtotal District 2 4,624 3,666 236 1,663 1,335
3 Upper West Side 480 480 0 480 0
8 Pelham Bay / Edgewater Park / Throgs Neck 1,201
0 700
0 0
8 Soundview 0 0 0
Subtotal District 8 1,201 0 700 0 0
9 South Highbridge 1,148
0 0 0 0
9 Highbridge 391 0 0 391
Subtotal District 9 1,148 391 0 0 391
10 Spuyten Duyvil / Riverdale/ Fieldston / North Riverdale
2,897
416
350
0 0
10 Kingsbridge / Norwood / Bedford Park
640 0 640
10 Fordham/Belmont 0 0 0
Subtotal District 10 2,897 1,056 350 0 640
11 Van Nest / Pelham Parkway 3,004
1,476 700
795 379
11 Woodlawn/Williamsbridge 0 0 0
Subtotal District 11 3,004 1,476 700 795 379
13 DUMBO / Navy Yard / Fort Greene
360 360 0 0 0
14 Williamsburg / Greenpoint 612 612 0 0 0
15 Sunset Park
4,215
1,495
0
1,089 0
15 Park Slope 738 0 0
15 Carroll Gardens /Gowanus /Red Hook
0 0 0
Subtotal District 15 4,251 2,233 0 1,089 0
20 Owls Head Park / Bay Ridge
5,317
1,476
0
0 1,075
20 Dyker Heights 416 0 0
20 Borough Park/Kensington/Bensonhurst
0 0 0
Subtotal District 20 5,317 1,892 0 0 1,075
22 Flatlands/ Midwood 1,154 1,154 0 757 0
24 North Corona / South Corona / Lefrak City/ Elmhurst
7,096
3,123
700
2,691 432
24 Maspeth / South of Woodside 612 432 0
24 Glendale / Ridgewood 756 756 0
Subtotal District 24 7,096 4,491 700 3,879 432

Finance Division Briefing Paper School Construction Authority
Page 6
School District Sub-Districts
Total Feb. 2012
Identified Need
Current Plan Seats
Feb. 2012 Amend.
Additional Funded Seats
Number of Seats in
Scope/Design
Number of Seats in Construction/
Completed
25 Beechhurst / College Point/ Whitestone
2,171 232
750 0 232
25 Flushing / Murray Hill / Willets Point
738 0 0
Subtotal District 25 2,171 970 750 0 232
26 Bayside and Auburndale 416 416 0 0 0
27 Howard Beach / Lindenwood
832
416
0
0 0
27 Ozone Park / South Ozone Park / Richmond Hill/ Woodhaven
416 416 0
Subtotal District 27 832 832 0 416 0
28 South Jamaica/ Rochdale /Kew Gardens
1,645 0
426 0 0
28 Rego Park / Forest Hills / Kew Gardens / Jamaica
757 833 0
Subtotal District 28 1,645 757 426 833 0
29 Cambria Heights/St. Albans 1,822
0 350
0 0
29 Hollis 738 379 0
Subtotal District 29 1,822 738 350 379 0
30 East Elmhurst / Jackson Heights
4,341
1,553
0
423 540
30 Woodside / Sunnyside 832 508 0
30 Long Island City / Ravenswood
578 0 578
Subtotal District 30 4,341 2,963 0 931 1,118
31 South Shore
3,218
444
0
444 0
31 New Dorp 844 0 844
31 North Shore 416 372 0
Subtotal District 31 3,218 1,704 0 816 844
Subtotal PS And PS/IS 46,589 26,191 4,212 12,038 6,446
78K Brooklyn 1,202 1,202 0 0 1,202
78Q Queens 2,283 1,473 810 0 1,473
Subtotal IS/HS 3,485 2,675 810 0 2,675
GRAND TOTAL 50,074 28,866 5,022 12,038 9,121
TOTAL SEATS IN PROPOSED AMENDMENT 33,888
*180 new seats in School District 2 and 76 new seats in School District 28 were included in the November 2011 Amendment.
Source: NYC Department of Education, “Building on Success: FY 2010 – 2014 Five Year Capital Plan Proposed 2012 Amendment,” February 2012.
Finance Division Briefing Paper School Construction Authority
Page 7
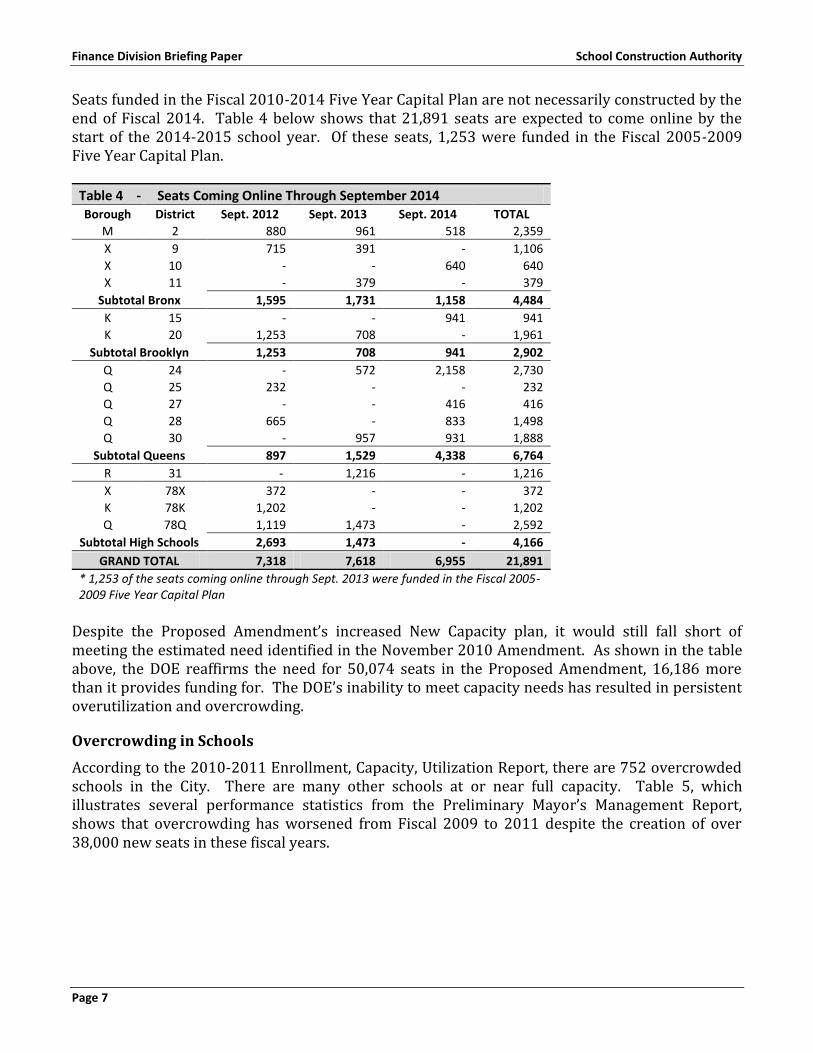
Seats funded in the Fiscal 2010-2014 Five Year Capital Plan are not necessarily constructed by the end of Fiscal 2014. Table 4 below shows that 21,891 seats are expected to come online by the start of the 2014-2015 school year. Of these seats, 1,253 were funded in the Fiscal 2005-2009 Five Year Capital Plan.
Table 4 - Seats Coming Online Through September 2014 Borough District Sept. 2012 Sept. 2013 Sept. 2014 TOTAL
M 2 880 961 518 2,359
X 9 715 391 - 1,106
X 10 - - 640 640
X 11 - 379 - 379
Subtotal Bronx 1,595 1,731 1,158 4,484
K 15 - - 941 941
K 20 1,253 708 - 1,961
Subtotal Brooklyn 1,253 708 941 2,902
Q 24 - 572 2,158 2,730
Q 25 232 - - 232
Q 27 - - 416 416
Q 28 665 - 833 1,498
Q 30 - 957 931 1,888
Subtotal Queens 897 1,529 4,338 6,764
R 31 - 1,216 - 1,216
X 78X 372 - - 372
K 78K 1,202 - - 1,202
Q 78Q 1,119 1,473 - 2,592
Subtotal High Schools 2,693 1,473 - 4,166
GRAND TOTAL 7,318 7,618 6,955 21,891
* 1,253 of the seats coming online through Sept. 2013 were funded in the Fiscal 2005-2009 Five Year Capital Plan
Despite the Proposed Amendment’s increased New Capacity plan, it would still fall short of meeting the estimated need identified in the November 2010 Amendment. As shown in the table above, the DOE reaffirms the need for 50,074 seats in the Proposed Amendment, 16,186 more than it provides funding for. The DOE’s inability to meet capacity needs has resulted in persistent overutilization and overcrowding.
Overcrowding in Schools
According to the 2010-2011 Enrollment, Capacity, Utilization Report, there are 752 overcrowded schools in the City. There are many other schools at or near full capacity. Table 5, which illustrates several performance statistics from the Preliminary Mayor’s Management Report, shows that overcrowding has worsened from Fiscal 2009 to 2011 despite the creation of over 38,000 new seats in these fiscal years.

Finance Division Briefing Paper School Construction Authority
Page 8
Table 5 - Fiscal 2012 Preliminary Mayor's Management Report
Department of Education
Actual Target
4-Month Actual
4-Month Actual
Performance Statistics FY 09 FY 10 FY 11 FY 12 FY 13 FY 11 FY 12
Average class size (end of October) (Preliminary Unaudited) – Kindergarten 20.7 21.7 22.1 * * 22.0 22.8
- Grade 1 21.3 22.0 22.9 * * 22.9 24.0
- Grade 2 21.4 22.2 23.2 * * 23.2 24.2
- Grade 3 21.9 22.5 23.7 * * 23.8 24.6
- Grade 4 23.4 24.4 25.0 * * 25.0 25.3
- Grade 5 24.2 24.8 25.4 * * 25.4 25.7
- Grade 6 25.6 26.1 26.2 * * 26.3 27.0
- Grade 7 26.5 26.8 27.1 * * 27.1 27.2
- Grade 8 26.8 27.5 27.3 * * 27.4 27.4
Schools that exceed capacity – Elementary schools (%) 28.0% 31.0% 32.0% * * NA NA
- Middle schools (%) 12.0% 9.0% 12.0% * * NA NA
- High schools (%) 37.0% 37.0% 37.0% * * NA NA Students in schools that exceed capacity - Elementary/middle schools (%) 22.0% 24.0% 26.0% * * NA NA
- High schools (%) 52.0% 53.0% 55.0% * * NA NA
Total new seats created 14,329 18,525 5,593 8,911 9,137 0 0
Overutilization contributes to several factors that impact a child’s education, including large class sizes, the creation of unconventional and inadequate classrooms, and the use of transportable classroom units (TCUs).
Class Size Overutilization leads to large class sizes, which have been increasing every year since the 2008-2009 school year; studies show that large class sizes are negatively correlated with student academic performance.
Unconventional and Inadequate Classrooms The need for classroom space has forced schools to turn non-instructional spaces or specialized classrooms such as art studios into regular classrooms. In addition, these converted instructional spaces might be in basements, not have windows, or lack appropriate design and infrastructure necessary for instruction.
Transportable Classroom Units (TCU) TCUs are placed on school grounds to serve as classrooms. They are temporary solutions to relieve overcrowding, however some of these “temporary” structures have been in use for nearly two decades because capacity needs have not been met by the Capital Plan. According to the Department’s 2011 Report on Temporary and Non-Standardized Classrooms, in the 2010-2011 school year there were 363 TCUs serving 8,582 students, not including high school students.

Finance Division Briefing Paper School Construction Authority
Page 9
Fiscal constraints prevent the Department from meeting capacity needs. In addition to a lack of funding, the DOE has discussed the difficulty of finding sites where there is need for new capacity as a problem. In some instances the DOE has not been able to secure sites for new schools in the sub-districts in which the need has been identified. Though sometimes re-zoning can resolve the issue, the Department cannot construct new seats if it has no place to put them.
Another factor that hinders new seat construction is the DOE’s practice of creating small schools in collocated buildings. The Department continues to close large schools and re-open several smaller schools within a single building. Though schools share some spaces such as cafeterias and gymnasiums, certain spaces are necessary for each individual school. For example, a building containing three schools generally has administrative offices for each school, some of which are located in rooms that could otherwise serve as classrooms or other student space. What’s more, the capital costs associated with collocating schools use funds that could potentially otherwise be spent on building new capacity.
In addition, the Department could add more funding to the New Capacity program in order to construct additional seats and relieve overcrowding. Especially because market conditions are currently favorable for property acquisition and construction, the DOE would likely be able to add a relatively large number of seats with relatively little funding.
Facility Replacement Program $748.9 million Funding in the Facility Replacement section of the Capacity category is intended for the replacement of facilities whose leases will expire during this five year plan. The Proposed Amendment provides $748.9 million for replacement of 5,300 seats over the five year period. The Current Plan includes $938.9 million for replacement of 6,500 seats. The 20.2 percent funding reduction stems from lower than expected lease rates that enabled the SCA to renew rather than
replace several existing leases. Savings would be shifted into the New Capacity and the Capital
Improvement Program.
Charter and Partnership Schools $210 million
Table 6 - Planned Charter School Projects Dollars in thousands
Charter School School District
Number of Seats
DOE Funding Contribution
KIPP High School 7 800 $25,000
DREAM 4 450 32,500
ICAHN 11 924 22,000
Harlem Promise Academy 5 1,200 60,000
PAVE 15 350 25,933
Columbia Secondary School N/A 567 20,000
Unallocated Funding
22,940
TOTAL 4,291 $208,373
Funding for Charter and Partnership Schools remains unchanged from the Current Plan’s $210 million allocation. All but $22.9 million of the funds have already been committed. The DOE has not provided information regarding how these funds will be used. The DOE’s investments in charter schools are executed in partnership with outside organizations. Partnerships include

Finance Division Briefing Paper School Construction Authority
Page 10
those formed through the Charter Facilities matching grant program. Under this program, private partners may contribute up to fifty percent of the capital costs for charter schools. See April Proposed Amendment to the Fiscal 2010-2014 Five Year Capital Plan page 32.
The SCA has stated that Charter Schools created during the Fiscal 2005-2009 Capital Plan were done so for 73 cents on the dollar when compared to new capacity construction for traditional public schools. Planned Charter Partnership School projects are listed in the table below, and the DOE will continue to explore additional Charter and Partnership opportunities.

Finance Division Briefing Paper School Construction Authority
Page 11
Capital Investment Funding for the Capital Investment category totals $6.25 billion in the Proposed Amendment, a $139.8 million increase from the Current Plan. These amounts do not include additional funding from the City Council, Borough Presidents, or other sources. Capital Investment is comprised of the Capital Improvement Program, Children First Initiatives, and Mandated Programs.
Capital Improvement Program $2.64 billion The Proposed Amendment provides $2.64 billion for the Capital Improvement Program (CIP), a $299.7 million or 12.8 percent increase from the Current Plan. The program includes all interior and exterior upgrades to the DOE building stock of approximately 1,500 buildings, with work such as building repairs, system replacements, and reconfiguration of existing school buildings.
Projects are selected for the plan based on the level of need for repair. The CIP can include projects to address building conditions rated 1-5 on the Building Conditions Assessment Survey (BCAS), a survey mandated by the New York State Education Department that requires visual inspections of every school to assess the building’s physical condition. Most of the projects included in the Proposed Amendment are for the repair of poor building conditions, or those rated level 5. In Table 7 below, data from the Fiscal 2012 Preliminary Mayor’s Management Report shows no poor building conditions, likely because the CIP program provides funds to fix such conditions.
There are few building conditions rated fair to poor, as the Capital Plan generally does not provide enough funds to address all of these conditions. Nearly half of buildings are rated in fair condition. At times projects to improve building conditions rated as fair may be addressed, but generally this occurs because they are included in a larger project. As building conditions worsen they usually become more expensive to fix. Additional funding to address CIP projects before they reach poor condition would likely result in long-term cost-savings.

Finance Division Briefing Paper School Construction Authority
Page 12
Table 7 - Fiscal 2012 PMMR Indicators
Actual Target 4-Month
Actual 4-Month
Actual
FY 09 FY 10 FY 11 FY 12 FY 13 FY 11 FY 12
Hazardous building violations total backlog 163 204 108 * * 135 126
- Fair to good condition (%) 46.2% 47.2% 50.0% * * NA NA
- Fair condition (%) 52.0% 51.0% 48.5% * * NA NA
- Fair to poor condition (%) 0.2% 0.1% 0.1% * * NA NA
- Poor condition (%) 0.0% 0.0% 0.0% * * NA NA
Exterior Projects $1.54 billion Much of the capital work on buildings’ exteriors is performed to make buildings water tight. Water infiltration is the single greatest cause of accelerated deterioration of existing facilities. The SCA prioritizes making every building watertight in order to assuage water damage and hopefully keep the building stock in satisfactory condition until it is able to identify funding for greater improvements. The Proposed Amendment would increase funding for exteriors by $157.5 million or 11.4 percent.
Interior Projects $967.7 million Interior improvements include capital work identified by the Building Conditions Assessment Survey (BCAS), work required to fulfill educational needs, and work funded under PlaNYC initiatives. Examples of project areas are cafeterias, kitchen upgrades, and elevators. Funding for interiors would increase by $144.5 million or 17.6 percent from the Current Plan. Of this increase, $115.2 million is for low-voltage electrical systems. Most of the additional funds, which were shifted from savings in prior plan completion costs, would fund upgrades to fire alarms in approximately 60 buildings. Also included in Interiors are lighting replacement and boiler conversions, projects that are included in “NYC Schools Comprehensive Plan: Greener, Healthier Schools for the 21st Century” (the Comprehensive Plan), the City’s ten-year plan to improve energy efficiency in schools.
Of the Proposed Amendment’s $967.7 million for interior improvements, $183.2 million would be for lighting fixtures. The budget for lighting fixtures includes $170.6 million to fund, through Fiscal 2014, the Comprehensive Plan’s projects to replace inefficient, PCB-containing lighting fixtures. In addition, the Proposed Amendment provides $168.8 million for boiler conversions, a $33.3 million or 24.6 percent funding increase from the Current Plan.
NYC Schools Comprehensive Plan
In order to address widespread concern regarding polychlorinated biphenyls (PCBs), a carcinogenic toxin that was found at very high levels in several schools, in February 2011 the Administration released the Comprehensive Plan, a ten-year plan to improve energy efficiency in schools that includes a plan to remediate PCBs found in light fixtures. The plan was incorporated into PlaNYC and is designed to replace and repair outdated equipment in schools, including boiler upgrades, insulation, occupancy sensors, and lighting. Lighting replacement in more than 700 schools would significantly reduce the presence of PCBs, which
Finance Division Briefing Paper School Construction Authority
Page 13
are often found in older, inefficient light fixtures. Also in the Comprehensive Plan, boilers using number 4 or 6 fuel oil are converted to boilers that use cleaner, safer fuel and improve energy efficiency. At the same time, the upgrades to more efficient lighting and boilers would produce long-term cost-savings.
The $843.9 million Comprehensive Plan, financed and implemented through contracts with Energy Savings Companies (ESCOs), is funded through the Five Year Capital Plan. The April 2011 Amendment added $140.6 million to the Capital Improvement Program for lighting replacement, which would fund the Comprehensive Plan’s PCB remediation strategy though Fiscal 2014. At adoption, the City Council supplemented this with an additional $30 million in order to replace PCB-containing light fixtures in more schools within the first three years of the Comprehensive Plan. The DOE moved $30 million from the technology budget to lighting replacement, $10 million in each of the three remaining fiscal years covered by the plan, for a total of $170.6 million for PCB remediation. The additional $30 million was intended to fund the immediate replacement of lighting fixtures in school buildings where leaking ballasts (a component of lighting fixtures) had been identified. The supplementary funds enabled the DOE to replace PCB-containing light fixtures at an additional eight schools in Fiscal 2012.
Thus far, a total of 64 buildings identified as having leaking ballasts have undergone comprehensive lighting replacement. In addition, 90 buildings that have been identified as having leaking ballasts have had these leaking ballasts replaced and are being prioritized for receiving comprehensive lighting replacements. Each of these lists of school buildings is presented in the February 2012 Proposed Amendment and is available on the SCA’s website at http://www.nycsca.org/Community/Programs/EPA-NYC-PCB. The list of all buildings included in the Comprehensive Plan is also available at this link.
The Comprehensive Plan includes critical projects that will not only produce long-term cost-savings, but which will also improve the environment and reduce health risks for the City’s students. Given the importance of the work outlined in the plan, many Council Members and experts believe the ten-year timeframe is too long. In addition, many individuals have suggested that the Comprehensive Plan should address the remediation of all PCBs, such as those found in caulk, rather than addressing only PCBs contained in light fixtures.
Children First Initiatives $1.7 billion Children First Initiatives are projects that support the Department’s reform and instructional policies. The April Amendment includes $1.65 billion for Children First Initiatives, up slightly from $1.64 billion in the Current Plan. This category contains two main subcategories: Technology and Facility Enhancements.
Technology Enhancements $926.8 million The DOE seeks to meet the challenge of preparing students for college and work by using technology as a transformative tool for learning, motivating students, expanding access to learning, and tailoring instruction to individual needs. The total amount of funding for technology – $926.8 million – remains unchanged from the Current Plan to the Proposed Amendment. However, the DOE proposes shifting a total of $200 million from Fiscal Years 2011 and 2012 to Fiscal Years 2013 and 2014. The funding shifts are detailed in Table 8 below.

Finance Division Briefing Paper School Construction Authority
Page 14
Table 8 - Variance in Technology Budget Dollars in thousands
Fiscal 2010 Fiscal 2011 Fiscal 2012 Fiscal 2013 Fiscal 2014 TOTAL
Current Plan $49,000 $72,000 $532,250 $138,500 $135,000 $926,750
Proposed Amendment 49,000 50,800 353,450 238,500 235,000 926,750
Difference $0 ($21,200) ($178,800) $100,000 $100,000 $0
Funds were moved to the final two years of the plan because the Department is unable to spend the entire $72 million allocation for Fiscal 2011 and the $532.25 million allocation for Fiscal 2012 in the Current Plan. The DOE is facing difficulties securing contracts with Verizon that would enable the SCA to move forward with technology spending. Considering the possibility that the SCA will not be able to spend the entire technology budget this plan, it is unclear why the DOE has not shifted some of this funding to other categories of spending. For example, the DOE could increase funding for capacity, given the overcrowding problem and need for 21,000 additional seats, and take advantage of the low property and construction costs while market conditions are still favorable.
The DOE has touted its focus on improving technology in schools and maintains that these efforts are critical to provide students with an education that will enable them to compete in college and the workplace in the 21st century. The Department aims to improve Internet connectivity at all schools under this Capital Plan and install hardware and learning systems to allow for technology-based classroom instruction. Technology projects are organized into several categories as shown in Table 9 below. Though funding shifts among fiscal years, there are no changes in the plan’s total funding for each category of spending.
Table 9 - Technology Enhancements Dollars in thousands
Enhancement Proposed Amendment
Classroom Hardware and Installation $345,000
School Building and Classroom Connectivity Cabling: Schools' Bandwidth Upgrade 243,800
Schools Unified Communication Infrastructure Combined above
School Network Equipment and Common Area Wiring: MDF/IDF Upgrade; Security 90,800
Wireless Technology Upgrade 103,800
School Application: Teacher/Student Class Relationships (Identity Management) 27,700
Learning Systems/Platforms 43,500
Business and Operations Applications 72,200
TOTAL $926,800
The improved technological infrastructure would enable the Department to expand its initiatives that are largely based on individualized instruction and online learning opportunities. The Innovation Zone (iZone) program is one such model. An online learning platform would enable the DOE to conduct professional development online, offer online Advanced Placement courses, online credit recovery courses, and blended classes for students. The DOE plans to develop 400 Innovation Zone schools. Though not all schools benefitting from enhanced technology will participate in the iZone program within the next few years, technological upgrades will prepare them for future participation in the program. Though technology in schools can enhance learning through educational tools, some stakeholders have expressed worries that the DOE is using

Finance Division Briefing Paper School Construction Authority
Page 15
distance learning and technology-based individualized instructional models as an alternative to reducing class sizes and hiring more teachers.
The DOE is focused on improving technology in schools in part because the Department aims to begin conducting all student assessments and testing online within the next several years. New York State joined the Partnership for Assessment of Readiness for College and Careers (PARCC) assessment consortium as a strategy to obtain Race to the Top assessment funds. States participating in this consortium propose to launch a redesigned ELA and Math assessment program, most of which would be conducted online, in the 2014-15 school year. The DOE’s spending on technology in the final years of the Capital Plan is in part to enable New York City to participate in the assessment program.
The City Council also funds many computer labs and technology purchases for schools in council districts that work in conjunction with the DOE/SCA’s initiatives, providing even greater benefits to the students.
Facility Enhancements $712 million The Facility Enhancements Program funds facilities adjustments that enable changes to instructional offerings in particular buildings. This program complements the SCA’s new capacity program by ensuring that the schools are making use of existing space in the most efficient way possible and that this space is aligned with the goals of meeting demand and improving student achievement.
Table 10 - Facility Enhancements Dollars in thousands
Program Current Plan Proposed
Amendment Difference Percent change
Facility Restructuring $205,000 $219,000 $14,000 6.8%
Safety and Security 80,200 80,200 0 0.0%
Science Lab Upgrades 95,000 95,000 0 0.0%
Accessibility 75,000 75,000 0 0.0%
Physical Fitness Upgrades 210,700 205,000 (5,700) -2.7%
Library Upgrades 10,100 8,000 (2,100) -20.8%
Auditorium Upgrades 21,000 29,800 8,800 41.9%
TOTAL $697,000 $712,000 $15,000 2.2%
As shown in Table 10 above, funding in the Proposed Amendment for facility enhancements is $712 million, a $15 million increase from the Current Plan. Notably, funding for facility restructuring is slated to increase by $14 million. In an effort to expand Career and Technical Education (CTE) opportunities for students, the DOE plans to create five CTE “demonstration sites” over the next two years. The Department also seeks to open small CTE schools that will require capital investment in resources such as labs and equipment.
In order to plan facility enhancements, the DOE conducts ongoing assessments of demand for services, facilities utilization, student learning conditions, and community education priorities by neighborhood and across the City. Two basic situations generate the need for realignment: the need for instructional space and changes to planned instructional services. Need for instructional space is identified when new schools or programs are opened within existing schools, an existing

Finance Division Briefing Paper School Construction Authority
Page 16
school is relocated, grade levels within a school are reconfigured, or the enrollment conditions are adjusted. Changes to planned instructional services can create new space needs where, for example, full-day pre-kindergarten classes are added and all other classes are fully-enrolled.
Mandated Programs $1.97 billion This program area includes projects for which it is not possible or appropriate to allocate funds by Borough, District, or school. Mandated Programs is composed of two main sub-categories: Remediation and Code Compliance, and Fixed Programs. The Proposed Amendment includes $1.97 billion for mandated programs, a $174.9 million decrease from the Current Plan. Remediation and Code Compliance $232.5 million
The Remediation and Code Compliance Program includes funding to undertake required work in existing DOE facilities.
Table 11 - Remediation/Code Compliance Program Dollars in thousands
Program/Need Current
Plan Proposed
Amendment Difference Percent Change
Asbestos abatement $155,700 $156,100 $400 0.3%
Lead abatement 14,200 12,500 (1,700) -12.0%
Emergency lighting 15,500 14,500 (1,000) -6.5%
Code compliance 81,400 49,400 (32,000) -39.3%
TOTAL $266,800 $232,500 ($34,300) -12.9%
Funding for Remediation and Code Compliance totals $266.8 million in the Proposed Amendment, a $34.3 million or 12.9 percent decrease from the Current Plan. Table 11 above shows that most of the reduction is the result of a $32 million decrease in funding for code compliance.
Fixed Programs $1.74 billion Fixed Programs comprises the majority of funding in Mandated Programs, with $1.74 billion planned in the Proposed Amendment. Funding for Mandated Programs is necessary to execute the other spending areas in the Capital Plan. There are four main areas in Fixed Programs, as shown in Table 12 and described below.
Table 12 - Fixed Programs Dollars in thousands
Program/Need Current
Plan Proposed
Amendment Difference Percent Change
Building Conditions Survey $48,400 $49,500 $1,100 2.3%
Wrap-up Insurance 486,500 488,300 1,800 0.4%
Prior Plan Completion Cost 1,058,700 858,700 (200,000) -18.9%
Emergency, Unspecified, and Miscellaneous 289,400 345,900 56,500 19.5%
TOTAL $1,883,000 $1,742,400 ($140,600) -7.5%

Finance Division Briefing Paper School Construction Authority
Page 17
Building Conditions Surveys – Funds the completion of the annual facility inspection surveys and an extensive BCAS every five years.
Wrap-up Insurance – The cost associated with the SCA’s Owner Controlled Insurance Program (OCIP). This program allows contractors and subcontractors working on SCA projects to become insured through the SCA for Worker’s Compensation and Employer’s Liability, General Liability, Excess Liability, and Builder’s risk. Currently over 1,500 contractors are enrolled in OCIP.
Prior Plan Completion Cost - Funds projects still in progress from the Fiscal 2005-2009 Capital Plan.
The 7.5 percent net reduction in funding for Mandated Programs predominantly stems from $200 million in savings from prior plan completion costs, which has a $1.06 billion budget in the Current Plan. The savings were shifted to New Capacity and the Capital Improvement Program, as described earlier.
Emergency, Unspecified, and Miscellaneous projects ($345.9 million) – This funding allows the SCA to respond to any unforeseen needs and emergencies that arise during the course of executing its capital plan. Funding for these projects would increase by $56.5 million from the Current Plan to the Proposed Amendment.
Finance Division Briefing Paper School Construction Authority
Page 18
Appendix I: Development and Structure of Capital Plan
Five Year Capital Plan Amendment Process
The Department of Education creates its capital plan through the School Construction Authority (SCA) in five-year increments. After initial adoption of the Five Year Capital Plan, it is amended annually. An annual amendment is typically proposed in November of each year and a revised proposed amendment is usually issued in February. The Council reviews the November Proposed Amendment and submits suggestions for changes to the Capital Plan, as do the Community Education Councils (CECs). The SCA has incorporated some of these suggestions into the February Revised Proposed Amendment and will continue to review others for possible addition into next year’s November Proposed Amendment.
The Panel for Education Policy (PEP) must approve an amendment to the Five Year Plan before it can be voted on by the City Council. Historically the Council votes on the amendment in conjunction with the adoption process, but by law, the Council can vote on the plan at any time after the PEP approves the amendment and before July first of that year.
The 2010-2014 Five Year Capital Plan (Current Plan) was originally approved by the City Council in June 2009, and has since been replaced with the April 2011 Revised Amendment for the same period (the Adopted, or Current Plan).1 The DOE issued a proposed amendment in November 2011, and the Revised Proposed Amendment in February 2012.
Identifying Capital Needs
In order to identify the need for capacity, the Department’s Division of Portfolio Planning assesses capacity and utilization of existing schools as well as demographic projections of future enrollment. The Annual Facilities Survey is conducted to gather information regarding the size, function, and use of each room in every school building. The DOE also releases the publicly available Enrollment-Capacity-Utilization Report, more commonly known as the Blue Book, which summarizes the enrollment, capacity, and utilization rate for every school.
The SCA conducts the Building Condition Assessment Survey (BCAS) ever five years, which is mandated by the New York State Education Department, to identify necessary capital improvement projects. A team of architects and engineers visually inspects every school building, administrative building, leased facility, annex, mini-school, temporary building, and field house to assess the facility’s physical condition. Every identified deficient condition, other than those identified as under construction or non-accessible, is rated 1-5. The Capital Plan addresses building conditions rated 1-5. Priority 1 equates to “good” condition. These building conditions are lowest priority and the identified deficiency has no significant impact on functionality, though addressing the issue would likely result in operational or maintenance savings. Priority 5 conditions are “poor” and highest priority. These building conditions require repair or improvement to architectural, mechanical, or electrical facility support systems.
1 The February 2011 Revised Proposed Amendment (February Amendment) was not considered by the PEP or the City Council because it reflected proposals in the Governor’s Executive State Budget that were not adopted, significantly changing available state funding for the February Amendment. The Department released a new Revised Proposed Amendment in April 2011 (April Amendment) to replace the February Amendment, and the February Amendment was withdrawn from consideration.

Finance Division Briefing Paper School Construction Authority
Page 19
The DOE and SCA use the information they gather to develop the Five Year Capital Plan and its annual amendments. In addition, they must consider fiscal resources and additional factors such as siting issues for new capacity when prioritizing projects. The current capital plan (Adopted Plan) was adopted in June 2011, a proposed amendment was released in November 2011, and the revised proposed amendment was released in February 2012. This report provides an overview and analysis of the Department of Education’s February 2012 Proposed Amendment to the Fiscal Year 2010-2014 Five Year Capital Plan.
Structure of the Plan
The Five Year Capital Plan report issued by the DOE includes a narrative that outlines various categories of spending as well as several appendices that provide detailed information about the projects in the plan.
The narrative is organized into two main categories and various subcategories. The two major areas are Capacity and Capital Improvement.
Capacity includes all projects that create new school facilities. It is separated into three separate divisions: New Capacity, Facility Replacement, and Charter and Partnership Schools.
Capital Investment includes all projects undertaken to improve and upgrade existing facilities. This category is divided into the following subcategories: Capital Improvement Program (CIP), Children First Initiatives, and Mandated Programs. The Appendix is comprised of various lists of projects organized in different ways.
The SCA publishes three versions of the Five Year Capital Plan: the Classic Edition, the School-Based Edition sorted by City Council district and school, and the School-Based Edition sorted by borough, school district, and school. The narrative of the report is consistent among the three editions. The reports differ in the structure of their appendices.
Though the structure of the appendices differs by each report, all reports include generally the same information. However, the School-Based editions provide a more comprehensive list of projects in the School Based Program Appendix, as described below, than the Classic Edition provides. Every report includes a Plan Summary table and Borough Summary tables that disaggregate the budget by fiscal year among various project categories. These tables are useful for determining citywide or borough spending by various categories for each year of the Capital Plan. The Classic Edition also includes separate tables that provide detail on several specific programs, such as initiatives or project areas that seem to be of special interest to the city. For example, on pages C8-C9 of the Appendix is a list of all individual projects within the Science Lab Program. In addition, the following are useful tables available in the appendices of the Capital Plan reports:
Capacity Projects – these tables provide the highest level of detail for individual capacity projects in the Plan, laying out information such as the project location if it has been sited, the forecasted capacity the project will create, design and construction start dates, estimated completion dates, estimated costs, and funding requirements to complete the projects.

Finance Division Briefing Paper School Construction Authority
Page 20
Replacement Projects – delivers the same information as is included in the capacity projects table for capacity projects that replace, rather than add, seats.
School Based Program – these tables list capital improvement projects in the Capital Plan that have a construction start date in the first fiscal year of the Capital Plan through the first fiscal out year. Therefore, the April 2011 Amendment includes projects from 2010-2013. The organization of the school based program tables varies by plan edition, with the most comprehensive tables in the School-Based editions.
Added Projects – a list of capital improvement projects that have been added to the amendment since the last adoption. Therefore, the Current Plan includes no projects from the April Amendment’s Added Projects table.
Cancelled projects – those projects that are in the Current Plan but removed from the amendment. This chart provides a reason for each project’s cancellation.

Finance Division Briefing Paper School Construction Authority
Page 21
Appendix II: Fiscal 2012 PMMR Indicators
Fiscal 2012 Preliminary Mayor's Management Report
School Construction Authority
Actual
Target Updated
4-Month Actual
4-Month Actual
Performance Statistics FY 09 FY 10 FY 11 FY 12 FY 13 FY 11 FY 12
Total new seats created 14,329 18,525 5,593 8,911 91,137 0 0
New schools and additions 23 26 10 12 17 NA NA
New schools and additions - construction funds committed as a percent of initial authorized budget (%) 95.7% 94.6% 92.9% 100.0% 100.0% NA NA
Scheduled new seats constructed on time (%) 100.0% 100.0% 100.0% 100.0% 100.0% NA NA
Construction bid price for school capacity projects per square foot ($) $427 $443 $475 * * NA NA
Average new school construction cost per square foot - Early childhood ($) NA $628 NA * * NA NA
- Elementary ($) $551 $561 $566 * * NA NA
- Intermediate ($) $571 $515 NA * * NA NA
- High school ($) $479 $586 NA * * NA NA
Capital improvement projects constructed on time or early (%) 77.0% 83.0% 69.0% 80.0% 80.0% 69.0% 74.0%
Capital improvement projects constructed within budget (%) 86.0% 88.0% 73.0% 80.0% 80.0% 78.0% 77.0%
Ultimate cost of insurance losses as % of construction value (per calendar year) 6.3% 6.0% NA * * NA NA