finance constraints or free cash flow?
TRANSCRIPT
Empirica 22: 185-209, 1995. 185 (~) 1995 Kluwer Academic Publishers. Printed in the Netherlands.
Finance Constraints or Free Cash Flow? A N e w Look at the Life Cycle Mode l o f the Firm
ROBERT E. CARPENTER* Department of Economics, Emory University, Atlanta, USA
Abstract. It has long been argued that firms prefer internal to external finance for funding investment. Modern literatures in industrial organization, macroeconomics, and finance argue this preference is caused by information asymmetries. There are, however, important disagreements about the effect of the asymmetries. Asymmetries may lead to binding financing constraints, or they may allow managers to use free cash flow for unprofitable projects. Each model predicts a different relationship between investment and changes in debt finance and this paper estimates this relationship using firm-level data. The principal findings are that both financing constraints and the agency costs of free cash flow affect investment in a manner consistent with a life cycle model of the firm.
Key words: Investment, cash flow, life-cycle
JEL codes: E2, G3, L2
I. Introduction
It has long been argued that firms prefer internal to external finance for funding investment. An unsettled issue is, why? The mo d em literatures in finance, indus- trial organization, and macroeconomics emphasize that firms prefer internal funds because of the existence of information asymmetries. There are, however, important disagreements about where the information asymmetries occur and their resulting effects on investment. In particular, asymmetries may occur either between the firm and potential suppliers of new external finance, causing firms to face binding financing constraints, or they may exist between the firm and its existing owners, allowing managers to pursue unprofitable projects.
There are a large number of papers that report evidence that firms under-invest because of financing constraints. For example, Fazzari, Hubbard, and Petersen (1988) show that firms paying low dividends, an indicator of binding financing con- straints, exhibit investment that is more sensitive to cash flow than high-dividend paying firms. Subsequent studies have argued that financing constraints are respon- sible for the positive relationship between internal finance and other firm activities, such as research and development (R&D) and inventory investment. 1
An alternative literature argues that agency problems between managers and owners allow the former to engage in excessive levels of investment. The recog-

186 ROBERT E. CARPENTER
nition of the divergence of the incentives of managers and the owners of a public corporation dates back at least to Berle and Means (1932). Later, Marris (1964) provided evidence supporting a theory of managerial capitalism, a precursor to more formal agency models. 2 Jensen (1986) has recently revived elements of the managerial capitalism literature, proposing that, for some finns, information asymmetries between the managers and the owners of the firm provide incentives for managers to over-invest by using 'free cash flow' for unprofitable investment projects. 3
Both the financing constraint and the free cash flow literature predict a positive relationship between internal finance and investment spending. But each theory applies to much different types of firms. A 'life cycle' model of the firm proposed by Mueller (1969, 1972) and Grabowski and Mueller (1972), explicitly develops the link between internal finance and investment into a unified framework where young, fast growing firms use internal finance to mitigate the transaction costs of external finance, and mature finns use internal finance to maximize firm growth at the expense of shareholder wealth. The life cycle model contains elements of both the financing constraint and free cash flow models. It suggests that internal finance can have explanatory power for different types of firms and that both theories could come into play for the same firm (in different time periods).
This paper sheds some light on the extent to which financing constraints and free cash flow theories affect firm behavior. To date, only a few studies have attempted to distinguish between the competing views of asymmetric information and firm investment behavior. Lang and Litzenberger (1989) attempt to distinguish between under and over-investment theories by examining the response of stock prices to changes in dividends. They split firms into two categories, designating firms with Tobin's Q ratios of less than one as over-investors. Their results show that over-investing firms exhibit positive changes in equity prices after an increase in free cash flow paid to owners as higher dividends. They interpret this as evidence consistent with the free cash flow hypothesis. Hoshi, Kashyap, and Scharfstein (1991) argue that if managers waste free cash flow, investment should be highly sensitive to changes in internal finance because its use is difficult for outsiders to monitor. They report evidence against free cash flow theory, noting that investment of firms with low values of Tobin's Q is less sensitive to changes in internal finance. Hubbard, Kashyap, and Whited (1993) find that they cannot reject the fixed capital investment Euler equation, derived under the assumption of no capital market frictions, for mature firms. They argue that free cash flow theory 'does not appear to be important for business fixed investment'. Griffin (1988) interprets his finding of a role for cash flow in the determination of petroleum exploration activity as limited support for free cash flow theory. Oliner and Rudebusch (1992) report evidence in favor of financing constraints when compared to an alternative models motivated by transactions or agency costs. Vogt (1994) finds evidence supporting free cash flow theory in fixed investment regressions, but evidence in favor of finance constraints for the same firms' R&D expenditures. Kathuria and Mueller
FINANCE CONSTRAINTS OR FREE CASH FLOW? 187
(1994) report evidence from cross sectional regressions supporting a managerial discretion, or free cash flow model.
Because both theories predict a positive relationship between investment and internal finance, it is difficult to develop empirical tests based solely on the firm's response to changes in cash flow that will fully distinguish between them. 4 There- fore, the focus here is not only on cash flow, but also on the fundamental difference in the role that debt finance plays in the corporation's financing decision in each model. For finance-constrained firms, debt is a source of external finance used to fund profitable investment projects. When these firms issue new debt, it represents a relaxation of the constraint, and there should be a large and positive change in investment. If firms over-invest because of managerial opportunism, debt may be used as a device to restrict managers' ability to invest in unprofitable projects. When debt is used in this fashion, it should be associated with declines in invest- ment spending.
To discriminate between the two hypotheses, I construct a sample of manufac- turing firms from the Compustat files. Following Lang and Litzenberger (1989) I divide the sample into over-investors and under-investors based on the firm's Tobin's Q. I use this criterion as a starting point, dividing the sample more finely, by both Q and dividend behavior, to more sharply differentiate between over and under-investing firms. In addition, I construct a sample of firms based on Jensen's (1986) suggestion that firms can pledge free cash flow by issuing debt without retaining its proceeds. The firms in this subset of the data are over-investors who use new issues of long-term debt to repurchase equity. Jensen (1987) argues that this type of restructuring maximizes the control effects of debt. 5
Overall, I find evidence that firms' preference for internal funds may stem from both finance constraints and from the agency costs of free cash flow, a result consistent with earlier life cycle models of the firm. As both the financing constraint and the free cash flow models predict, cash flow has a statistically significant and economically important effect for both over and under-investing firms. The key results, however, center on the finns' response to changes in long-term debt. Firms with low values of Tobin's Q, or who pay low dividends, exhibit investment that responds positively and strongly to changes in long-term debt; behavior consistent with the relaxation of a binding finance constraint. Firms with high values of Tobin's Q, and that also pay high dividends, are least likely to view external finance as a constraint on their behavior. Debt has little explanatory power for these firms' investment. On the other hand, I find evidence consistent with the agency costs of free cash flow in a subset of the data that includes large, slow-growing firms that restructure by swapping debt for equity. Even though investment exhibits a strong, positive response to an increase in long-term debt for these firms, after a debt-for- equity restructuring the 'marginal' effect of debt on investment, approximated by its point estimate in a multiple regression, falls significantly.
The rest of the paper proceeds as follows: In section II, I discuss both theories in more detail, drawing testable hypotheses from the models and showing the
188 ROBERT E. CARPENTER
linkage of the more recent literature based on recent advances in the economics of information to the earlier literature on the life cycle model of the firm. Section III describes the empirical model used to determine the source of the financing hierarchy and highlights key empirical predictions from each model. Section IV describes the sample and presents summary statistics. Section V discusses the empirical results and section VI concludes.
II. Asymmetric Information and Investment
1. FINANCE CONSTRAINTS
The central proposition of models linking information asymmetries to investment decisions is that the exchange of information is costly. Adverse selection problems or moral hazard in the capital markets may disrupt the flow of external finance to firms. In the most extreme case, Stiglitz and Weiss (1981) show that equilibria in the credit markets can exist concurrently with an excess demand for loans. If lenders engage in credit rationing some firms' investment may be constrained by their internal finance. Myers and Majluf (1984) show that similar adverse selection problems may cause managers to forego profitable investment opportunities if they must be financed with equity.
Empirical evidence linking internal finance to investment dates back at least to Meyer and Kuh (1957). More recently, Fazzari, Hubbard, and Petersen (1988), Hoshi, Kashyap, and Scharfstein (1991), Devereux and Schianterelli (1990), and Whited (1992) present evidence and arguments that suggest firms face finance con- straints on fixed investment because of capital market imperfections. Himmelberg and Petersen (1994) present similar evidence for R&D expenditures, and Calomiris, Himmelberg, and Wachtel (1994), Carpenter, Fazzari, and Petersen (1994), Gertler and Gilchrist (1994), and Kashyap, Lamont, and Stein (1994) find evidence that finance constraints affect inventory investment. The implication of this research is that the linkage between cash flow and investment results from credit market imper- fections that increase the cost of external finance relative to internal finance and leads to under-investment, i.e., profitable investment projects are not undertaken because of a shortage of low-cost internal funds. 6
This view suggests that firms prefer internal finance because it is relatively less costly than external funds. Firms will issue new debt only when their prospective investments remain profitable after compensating lenders for the uncertainty sur- rounding the project's prospective payoffs, or if the finance constraint is relaxed. If these firms issue debt, it is to invest in positive net present value investment projects and their investment expenditures should increase.
2. FREE CASH FLOW THEORY
Free cash flow theory centers on the agency costs resulting from the separation of ownership from control and the incentives that managers have to pursue activities

FINANCE CONSTRAINTS OR FREE CASH FLOW? 189
Cost of Finance
r+F~
r'
0
I3
I I I
B A ~C Sources of Finance
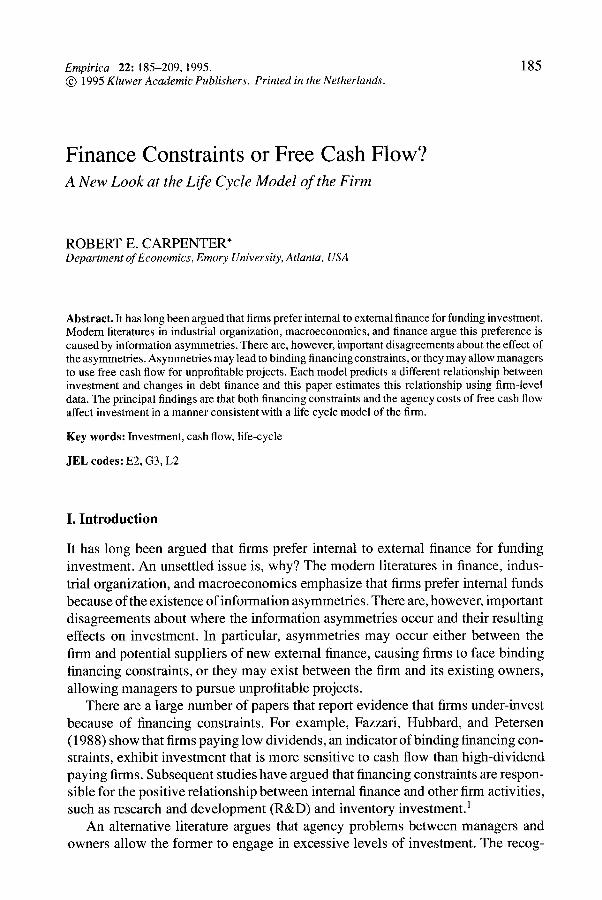
Fig. 1.
that reduce shareholder wealth. For example, managers may be biased toward an above-optimal level of growth for the firm if their compensation is related to the size or the growth of the firm. Managers may also prefer growth if the non-pecuniary benefits they can consume grows with the size of the firm] The pursuit of goals that are not in the shareholders' interest leads managers to prefer internal funds and avoid the 'direct disciplining influences of the securities market', and 'restrictions on the company's freedom of action which result from any restrictive provisions involved in the issue [of securities]' (Baumol, 1965, pp. 70-75).
Jensen (1986) suggests that managers can limit the agency problems of free cash flow by issuing debt and paying the proceeds to stockholders. Leverage restricts the use of internal finance generated by the firm by forcing managers to use cash flow to meet their contractually specified interest obligations. Meyer and Kuh (1957, p. 17) also recognized the ability of leverage to reduce managerial prerogatives. The reduction of managers' incentive to invest in negative net present value (NPV) projects may be attributed to creditors' legal rights to reorganize or even liquidate the firm in the event of default.
Free cash flow theory has important implications for the effect of leverage on a firm's investment-financing decisions. Additional leverage leaves less free cash flow at the managers' discretion at the same time that it increases the level of intensity at which the firm's activities are monitored. The firm becomes more profitable as it substitutes contractually obligated debt service for negative net present value investments and the price of the firm's equity should rise. Indeed, most empirical studies supporting the free cash flow hypothesis rely heavily on evidence that shows an increase in share prices after a leverage increasing transaction. 8
190 ROBERT E. CARPENTER
However, free cash flow theory also predicts a change in the firms investment financing decisions that will be reflected in the relationship between debt finance and investment expenditures. If firms use additional leverage to restrict the manag- er's ability to pursue unprofitable investment projects, then debt acts as a monitoring and disciplinary device rather than as a source of funds for investment. When a firm that was previously over-investing issues long-term debt to pledge free cash flow to shareholders, investment expenditures should decrease, especially when the managers of the firm pay the proceeds of the issue to the shareholders. 9
Figure 1 contrasts the behavior of a finance-constrained firm with a firm whose managers waste free cash flow. A comparison of Figure 1 with Mueller (1969) and Fazzari, Hubbard, and Petersen (1988) also shows the close linkage between the earlier life cycle models of the firm and the more recent literature.
Because each model suggests that the availability of finance is an important factor in the firm's investment decision, sources of finance and investment expen- ditures are represented on the horizontal axis. The firm's cost of finance is repre- sented on the vertical axis. To simplify the presentation, there are two sources of funds, internal finance (cash flow) and external finance (long-term debt). The firm generates internal finance equal to 0A, and if its managers maximize shareholder wealth, it discounts this cash flow at interest rate r. In a neoclassical model without information asymmetries, r equals the firm's cost of capital. However, because of information asymmetries, lenders in this model demand a premium above the cost of capital. This premium, denoted f~, leads to a discrete jump in the firms cost of finance (this premium could also be motivated by the presence of transactions costs) and the firm must pay r + f~ for external finance. 1~
Investment opportunities are given by the schedules I1, I2, and I3. Schedule I1 shows a firm with sufficient internal funds to finance its investment expenditures. Cash flow is greater than funds required to finance investment projects with an internal rate of return equal to r. In this case the firm invests 0B and pays the remaining internal funds (BA) to shareholders as dividends.
Schedule I2 shows a firm that is finance constrained. This firm would invest 0C if AC external finance could be borrowed at the neoclassical cost of capital. However, because of information asymmetries the cost of capital is equal to r + f~, above the return on the marginal investment project. This firm under-invests, relative to an identical firm in a perfect capital market, by an amount AC. Internal finance places a binding constraint on this firm's capital expenditures. An increase in cash flow will lengthen the horizontal line segment at discount rate r, relaxing the finance constraint and increasing the firm's investment expenditures.
Profit maximizing managers with initial investment opportunities summarized by schedule I2 will issue debt if their investment opportunities improve, shifting the schedule to the right, as shown by schedule I3. The expected payoffs from investment are now large enough to pay the premium lenders demand for their lack of project specific information. The firm will issue AC external finance and increase its investment expenditures a like amount. A profit maximizing firm might

FINANCE CONSTRAINTS OR FREE CASH FLOW? 191
also issue external finance if it can credibly communicate information about its investment opportunities to lenders, reducing f~ and the cost differential between internal and external finance.
To avoid clutter, now assume that the managers maximize their own utility rather than shareholder wealth, and that investment opportunities are summarized by schedule I1. The internal rate of return that maximizes shareholder wealth remains equal to r. As before, these managers should invest 0B, paying the remaining free cash flow of BA to shareholders. However, the managers act as if the opportunity cost of internal finance is r r and invest all free cash flow. Total capital expenditures are equal to 0A. However, the expenditures on investment projects beyond 0B decrease the shareholder wealth because their return is below the appropriate cost of capital. Furthermore, the managers behave as if the discount rate is variable, an increase in internal finance will result in increased investment expenditures as the managers continue to fully utilize the free cash flow generated by the firm.
Since the return on the investment projects financed with the free cash flow is below the opportunity cost of funds to a profit maximizing management team, the value of the firm falls. Managers of firms with substantial free cash flow may wish to pledge it to the shareholders to avoid, for example, a takeover bid.11 If managers disgorge all of the firms free cash flow to shareholders by repurchasing equity with new debt, the firm's free cash flow, and its investment expenditures, fall by BA.
III. Empirical Specification, Tests and Predictions
This section describes the fixed investment regressions that examine the link between internal finance, long-term debt, and investment expenditure. For the primary specification, I modify a widely used fixed investment equation. For firm i at time t let:
(1)
The c~/ are firm-specific intercepts, while the At allow for year effects. The variable uit is a random disturbance. Capital expenditures are represented by I. Beginning of period Tobin's Q controls for changes in investment opportunities. Sources of internal finance are represented by cash flow, CF, and the change in working capital, AW. Cash flow is internal funds that are generated from the operation of the business enterprise and are essentially income before extraor- dinary items and discontinued operations plus non-cash charges against income (depreciation). 12 Working capital is defined as current assets minus current liabil- ities. Recent research by Fazzari and Petersen (1993) and Carpenter, Fazzari, and Petersen (1994) argues that firms may respond to shocks to internal finance by reducing the rate at which they accumulate assets. They argue that if cash flow
192 ROBERT E. CARPENTER
falls, assets with relatively low adjustment costs (here working capital) will fall most, freeing up liquidity that may be used to maintain investment in assets with higher adjustment costs, i.e., fixed investment. If firms use working capital as a source of funds to smooth fixed investment, working capital investment will enter the regression with a negative coefficient.
The firm's sources of external debt finance are represented by ALTD. I defined ALTD as new issues of long-term debt less retirements of long-term debt plus the change in current debt. This definition captures any change in leverage when convertible bonds are redeemed for equity. In addition, since the new long-term debt variable measures funds actually raised, it accounts for any discount or pre- mium upon issuance of the debt. Lastly, the change in current debt controls for reclassification of long-term debt to current debt in the last year before it becomes due. 13 Investment, cash flow, AW, and ALTD are scaled by the firm's beginning- of-period capital stock to control for heteroscedasticity.14
Both the change in working capital and the net issue of long-term debt are endogenous variables. I instrumented Equation (1) with the beginning of period stock of working capital and the beginning of period stock of long-term debt. The stock of long-term debt is an especially appropriate instrument for the change in long-term debt. With higher levels of long-term debt, the probability of default rises. Therefore, the marginal cost of debt should rise as its stock rises. The stock of outstanding debt should also be related to the intensity of monitoring so that with a larger stock of debt the ability of managers to waste cash flow falls. Both stories justify the use of the stock (LTD/tf)~ as an instrument. The justification for the use of the beginning of period stock of working capital as an instrument for working capital investment is discussed in Fazzari and Petersen (1993).
The empirical tests of this paper focus on splitting the sample into two groups, firms that face profitable, but unexploited investment opportunities (under-investors) and firms with unprofitable investments (over-investors). As stated above, I follow Lang and Litzenberger (1989) in using empirical estimates of Tobin's Q to segre- gate over-investors. They show that under a general set of assumptions 'an average Q ratio of less than unity is the sufficient condition for a firm to be over-investing'. Therefore, I denote firms with average Q's less than one as over-investors. Firms with Q's greater than one I call under-investors. 15
I also examine more detailed splits of the data. For both over and under- investors, I examine splits of the data by retention behavior. This ability to split in more than one dimension allows a comparison of the effect of changes in internal and external finance on the investment of firms with different financial attributes. For example, low Q, low-dividend firms are firms with poor investment opportunities, as evaluated by the market, who also retain a substantial portion of their earnings. In models where agency costs lead to over-investment and low Q 's, the finn's managers may retain an excessively high proportion of income to finance additional investment not able to be financed externally because of the monitoring role of the capital markets. Alternatively, in a model where finance constraints

FINANCE CONSTRAINTS OR FREE CASH FLOW? 193
restrict access to external finance, firms with poor opportunities (as evaluated by the market) and who also pay very low dividends are the quintessential financially constrained firm. These firms find external funds very costly, and rely principally upon internal finance for investment.
The response of the firm's investment to changes in both internal and external finance is crucial in determining the source of the financing hierarchy. If their managers use free cash flow to purchase unprofitable investment projects, firms in the low Q, low-dividend group may not face finance constraints. The managers of these firms may issue debt to restrict their ability to appropriate free cash flow. When new debt is issued to reduce wasteful investment spending, the sign of the long-term debt coefficient should be negative.
This contrasts sharply with the behavior of a finance-constrained firm. When finance-constrained firms issue external finance, they will do so when their invest- ment project is profitable not only with the standard positive NPV criterion, but also when one of two conditions are met. One, the project is demonstrably prof- itable to suppliers of external finance, inducing them to provide credit to a rationed firm, or two, the project has a high enough return to remain profitable even after any premium for asymmetric information is paid. For a finance-constrained firm, new debt indicates a relaxation of the constraint and the firm should respond by increasing its investment expenditures. Empirically, a financed constrained firm should have a large, positive coefficient on A L T D .
Splitting the sample by both Tobin's Q and retention ratios also provides a group of firms that have high average Q's and pay high dividends. High Q's are consistent with a favorable evaluation of the firm's investment projects by the markets. High dividends indicate that the firm may generate enough internal funds to finance its capital expenditures. This type of firm is least likely to face finance constraints. It is also least likely to have managers who waste free cash flow. Such firms may exhibit relatively small cash flow coefficients if internal finance does not represent a constraint on investment. For the same reasons, they might also exhibit relatively small (in absolute value) coefficients on the change in working capital. Lastly, because firms are likely to be considered 'good' risks, they may not face serious information problems in the capital markets. They are less likely to view new long-term debt as the relaxation of a binding external finance constraint and there is less cause to expect a tight relationship between new capital expenditures and new debt.16
Splitting the data on the basis of both retention behavior and Tobin's Q to segregate over and under-investors is a finer screen than splitting on the basis of Tobin's Q alone. However, I attempt a still finer screen of the data. As stated above, firms with Tobin's Q ratios less than one exhibit a sufficient condition for over- investment. However, over-investment is not a sufficient condition for managers who act in their own interests rather than the shareholders'. Average Q's of less than one may be exhibited by firms that realized 'bad' outcomes of investment
194 ROBERT E. CARPENTER
projects whose expected NPVs were positive as well as by firms whose managers deliberately invest in negative NPV projects.
I examine the group of over-investors more closely with the third sample split. Jensen (1986, 1987) argues that the greatest reduction in the agency costs of free cash flow follows a leverage increasing transaction where the managers do not retain the proceeds of the issue. Therefore, from the over-investor (low Q) group, I examine firms who restructure by using new long-term debt to repurchase equity. This split focuses selectively on firms that most closely fit the agency model of free cash flow. If the root cause of over-investment is that managers waste free cash flow, restructuring by using debt to repurchase equity will enhance the control features of debt (see Jensen, 1987). I refer to this group as the 'agency' firms. 17 Using the same arguments as above, the coefficient on the long-term debt variable should be very small, and perhaps negative, for this group of firms.
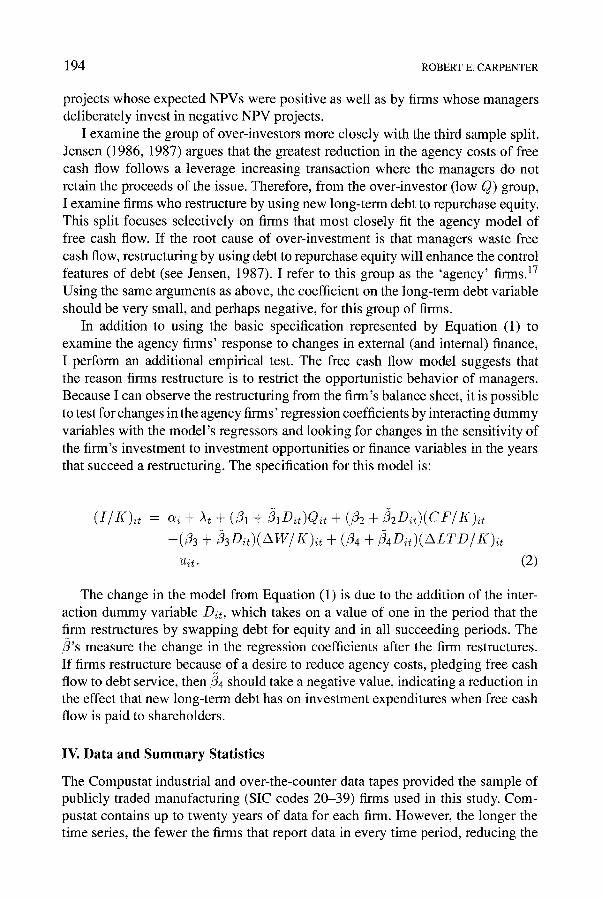
In addition to using the basic specification represented by Equation (1) to examine the agency firms' response to changes in external (and internal) finance, I perform an additional empirical test. The free cash flow model suggests that the reason firms restructure is to restrict the opportunistic behavior of managers. Because I can observe the restructuring from the finn's balance sheet, it is possible to test for changes in the agency firms' regression coefficients by interacting dummy variables with the model's regressors and looking for changes in the sensitivity of the firm's investment to investment opportunities or finance variables in the years that succeed a restructuring. The specification for this model is:
( I lK ) i t = eel q- At q- (~1 + ~,Dit)Qit q- (/32 -[- ~2Dit ) (CF/ t ( ) i t
-}-(/33 q- ~3Oit)(nW/[()it q- (/~4 + kDit)(ALTD/I()it +uit. (2)
The change in the model from Equation (1) is due to the addition of the inter- action dummy variable Dit, which takes on a value of one in the period that the firm restructures by swapping debt for equity and in all succeeding periods. The ~'s measure the change in the regression coefficients after the firm restructures. If firms restructure because of a desire to reduce agency costs, pledging free cash flow to debt service, then/34 should take a negative value, indicating a reduction in the effect that new long-term debt has on investment expenditures when free cash flow is paid to shareholders.
IV. Data and Summary Statistics
The Compustat industrial and over-the-counter data tapes provided the sample of publicly traded manufacturing (SIC codes 20-39) firms used in this study. Com- pustat contains up to twenty years of data for each firm. However, the longer the time series, the fewer the firms that report data in every time period, reducing the
FINANCE CONSTRAINTS OR FREE CASH FLOW? 195
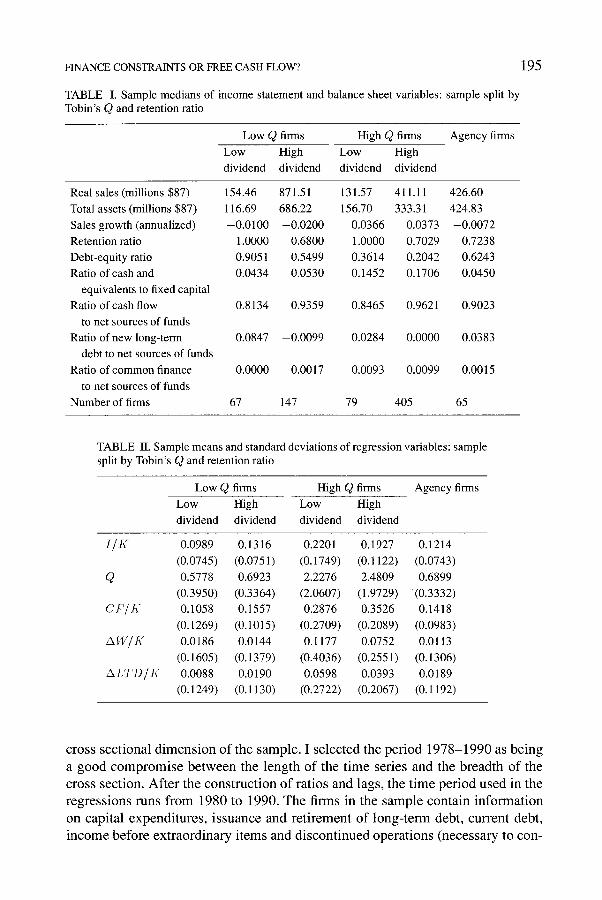
TABLE I. Sample medians of income statement and balance sheet variables: sample split by Tobin's Q and retention ratio
Low Q firms High Q firms Agency finns Low High Low High dividend dividend dividend dividend
Real sales (millions $87) 154.46 871.51 131.57 411.11 426.60 Total assets (millions $87) 116.69 686.22 156.70 333.31 424.83 Sales growth (annualized) -0.0100 -0.0200 0.0366 0.0373 -0.0072 Retention ratio 1.0000 0.6800 1.0000 0.7029 0.7238 Debt-equity ratio 0.9051 0.5499 0.3614 0.2042 0.6243 Ratio of cash and 0.0434 0.0530 0.1452 0.1706 0.0450
equivalents to fixed capital Ratio of cash flow 0.8134 0.9359 0.8465 0.9621 0.9023
to net sources of funds Ratio of new long-term 0.0847 -0.0099 0.0284 0.0000 0.0383
debt to net sources of funds Ratio of common finance 0.0000 0.0017 0.0093 0.0099 0.0015
to net sources of funds Number of finns 67 147 79 405 65
TABLE II. Sample means and standard deviations of regression variables: sample split by Tobin's Q and retention ratio
Low Q firms High Q finns Agency finns
Low High Low High dividend dividend dividend dividend
[/I( 0.0989 0.1316 0.2201 0.1927 0.1214 (0.0745) (0.0751) (0.1749) (0.1122) (0.0743)
Q 0.5778 0.6923 2.2276 2.4809 0.6899 (0.3950) (0.3364) (2.0607) (1.9729) (0.3332)
CF/K 0.1058 0.1557 0.2876 0.3526 0.1418 (0.1269) (0.1015) (0.2709) (0.2089) (0.0983)
AW/t( 0.0186 0.0144 0.1177 0.0752 0.0113 (0.1605) (0.1379) (0.4036) (0.2551) (0.1306)
~LTD/t( 0.0088 0.0190 0.0598 0.0393 0.0189 (0.1249) (0.1130) (0.2722) (0.2067) (0.1192)
c ross sec t iona l d i m e n s i o n o f the sample . I s e l ec t ed the p e r i o d 1 9 7 8 - 1 9 9 0 as b e i n g
a g o o d c o m p r o m i s e b e t w e e n the l eng th o f the t ime ser ies and the b read th o f the
c ross sect ion. A f t e r the cons t ruc t i on o f ra t ios and lags , the t i m e p e r i o d used in the
r eg re s s ions runs f rom 1980 to 1990. T h e f i rms in the s a m p l e con ta in i n f o r m a t i o n
on cap i ta l expend i tu r e s , i s suance and r e t i r emen t o f l o n g - t e r m debt , cur ren t debt ,
i n c o m e be fo re e x t r a o r d i n a r y i t ems and d i s c o n t i n u e d ope ra t i ons (necessa ry to con-
196 ROBERT E. CARPENTER
struct the cash flow variable), and their outstanding shares of common stock along with its year-end closing price (necessary to construct an estimate of Tobin's Q) for every year of the data sample. In addition, I included only those finns for whom an estimate of their replacement cost capital stock could be estimated, whose replace- ment capital was valued at greater than $5 million, and who were not involved in a major merger or acquisition during the sample period.
For the 698 firms that remained, I calculated an average Tobin's Q for each finn over the sample period. Firms with mean values of Tobin's Q less than one are placed into the over-investor group, referred to in the tables below as low Q firms. Finns with mean values of Q greater than one are under-investors and denoted high Q firms. The sample split results in 214 low Q finns and 484 high Q finns. For both the high and the low Q finns, I divided the sample into two additional groups based on their retention behavior. I examined the percentage of income each firm paid as dividends over the sample period. Firms that paid less than five percent (on average) of their income as dividends I call low-dividend finns. Finns that paid five percent or more of income as dividends I call high-dividend firms. The agency firms are a subset of the low Q firms, including those firms with a substantial swap of debt for equity, their summary statistics are provided in Tables I and II for comparison with low and high Q firms in advance of a more detailed discussion below.
Descriptive statistics from the sample are presented in Table I. Because of substantial skewness in the data, I present sample medians. Retention practices seem to be correlated with firm size. Low-dividend firms tend to be much smaller than high-dividend firms for both low and high Q finns. For finns with low Q 's, the firms that also pay low dividends have real sales of $154.46 million and total assets of $116.69 million. The low Q, high-dividend finns are approximately six times larger, with median sales of $871.51 million and total assets of $686.22 million. For high Q firms there is also a large difference in size between dividend classes, real sales of $131.57 million and total assets of $156.7 million for low-dividend firms versus real sales of $411.11 million and total assets of $333.31 million for high-dividend finns. However, the difference in firm size across dividend classes for the high Q firms is not as pronounced as that of the low Q finns. High-dividend firms with low Q's are about twice as large as high-dividend firms with high Q 's. The low-dividend finns in each group are approximately the same size. Firms with high Q's were growing more quickly over the sample period, with a median sales growth rate of approximately 3.5 percent. By contrast, low Q finns exhibited negative sales growth.
Median values of selected financial statistics can also be found in Table I. All firms rely heavily on internal finance compared with other sources of funds. The ratio of cash flow to net sources (where net sources are defined as the sum of cash flow, ALTD, and funds raised by issuing common stock) is greater than 0.80 for all classifications of firms, more than 0.90 for high-dividend finns. The high retention ratios exhibited by low-dividend finns indicate that the median finn retains all of

FINANCE CONSTRAINTS OR FREE CASH FLOW? 197
10
8
= 2 Z
0 I I I I I I I I I I
80 81 82 83 84 85 86 87 88 89 90
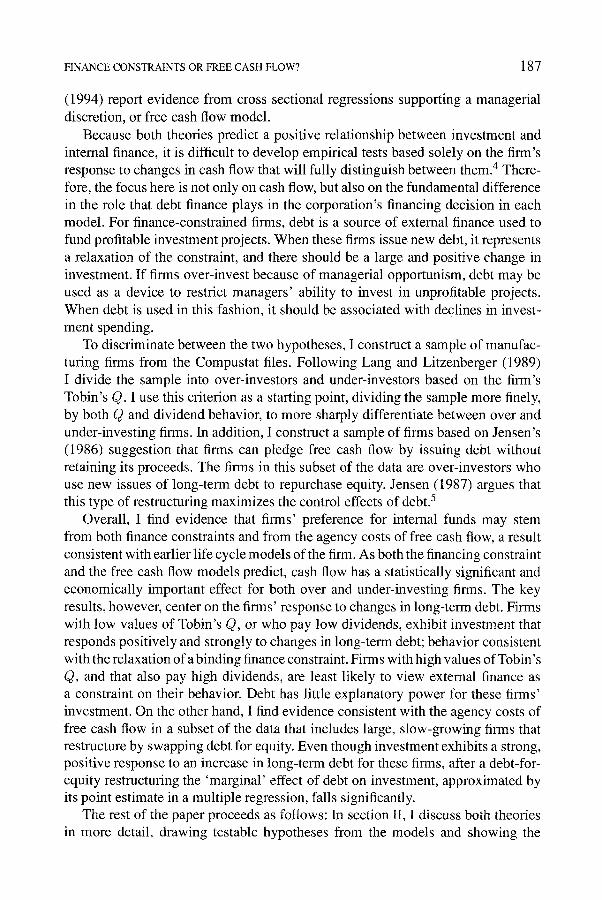
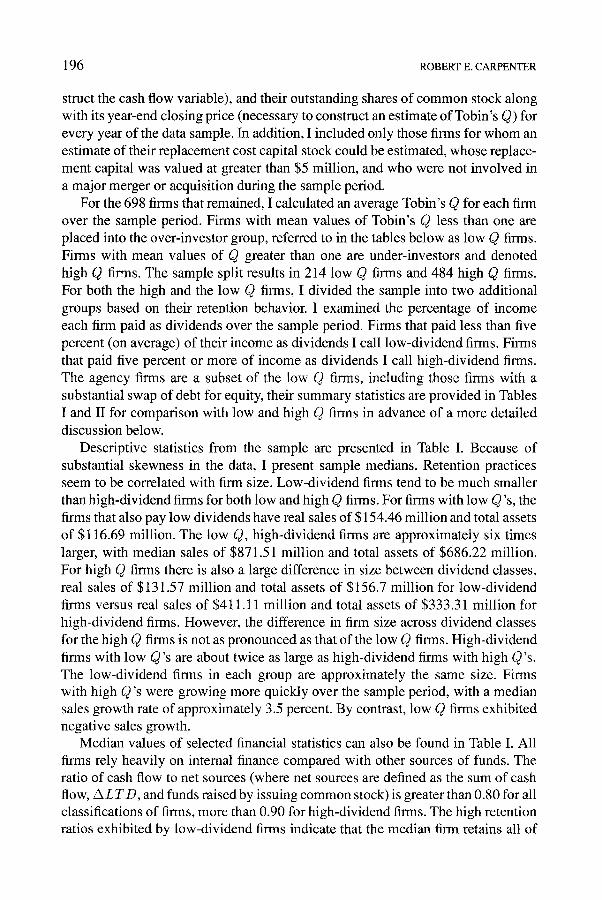
Fig. 2. Number of initial restructurings.
its internal finance. New equity issues are the least important source of finance, accounting for less than one percent of net sources. New long-term debt is a larger proportion of net sources for low-dividend firms.18
Low Q firms also have larger debt-equity ratios (a measure of solvency) than high Q firms, and low-dividend firms have larger debt-equity ratios than high- dividend firms. The highest debt-equity ratios are exhibited by low Q, low-dividend firms at 0.9051. Lastly, low Q firms seem to have less cash and short-term invest- ments than high Q firms. The ratio of cash and short-term investments to fixed capital is between 0.043 and 0.053 for low Q and between approximately 0.145 and 0.170 for high Q firms. Firms with opportunistic managers may have little cash on hand if they use such assets to maximize their own utility at the expense of the shareholders. Alternatively, firms that face finance constraints may also tend to have low levels of cash and liquid assets if they draw down their stocks of cash to finance other firm activities.
Table II reports summary statistics for low and high Q firms, divided by their dividend behavior, as well as agency firms, for the key regression variables. The faster growth of high Q firms relative to low Q firms observed in Table I is also apparent from an examination of the ratio of fixed investment to capital in Table II. Low Q firms have mean [/K of approximately 0.10 and 0.13 for low and high- dividend firms, respectively. In contrast the I/t( ratios for low and high-dividend firms in the high Q group are 0.22 and 0.19.
As mentioned above, I also examine a subset of these low Q over-investors called agency firms. These firms undergo substantial restructuring during the sam- ple period, purchasing a large fraction of their outstanding common stock by issuing new debt. To be placed into this category, the firm's shares of outstanding common stock must have declined by at least 5 percent within a single year, and it must

198 ROBERT E. CARPENTER
w 7 t-
�9 t- 6
.= 5
" 6 3
E 2
z 1
0
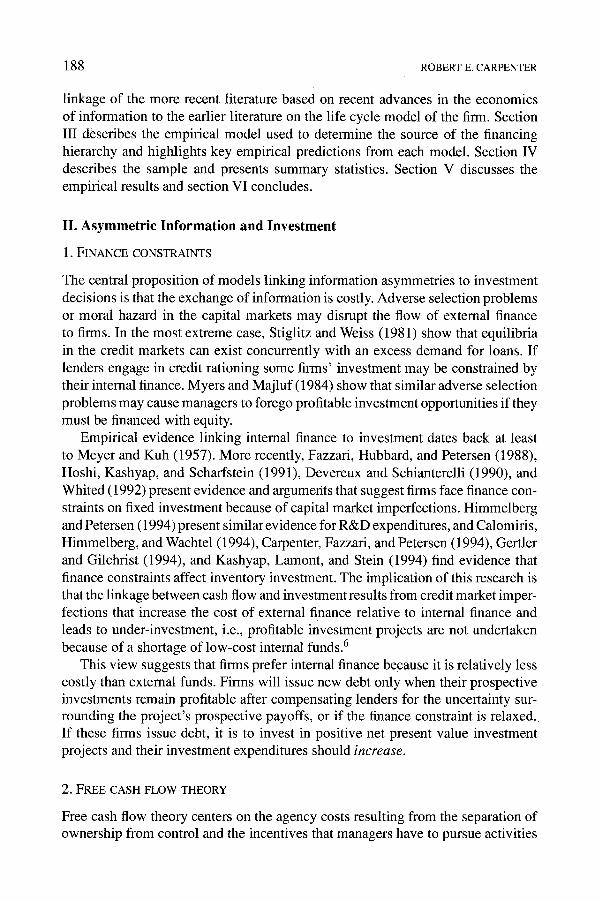
Fig, 3.
0 ~ ~ ~ ~ ~ ~ ~ ~ ~ 0-~ ~
2 Digit SIC
~dust r ia l composit ion of ~ e n c y r i m s .
have concurrently issued new debt in an amount sufficient to purchase more than 50 percent of the value of this stock during the same period. Sixty-five firms met the criteria for the agency sample. I examined a number of other combinations of debt issues and stock repurchases, the composition of the sample and the empirical results below were insensitive to the choice.
Figure 2 shows the number of initial restructurings for the agency firms during each year of the sample period. Restructurings in the sample generally increased throughout the 1980's, possibly reflecting an increasing number of defensive restructurings as the latest merger boom reached its peak. The number of restruc- turings drop after 1987, coincident with the slowdown in economic activity during the latter portion of the decade.
Figure 3 provides a breakdown of the .agency firms' industrial composition. Restructuring activity is most heavily concentrated in the petroleum industry (SIC 29), the focus of several studies of free cash flow (see Jensen, 1987 and Griffin, 1988). The industrial machinery (SIC 35), food (SIC 20), and transportation (SIC 37) industries also comprise a relatively large proportion of the agency sample.
Unsurprisingly, the industrial groups containing the largest firms also exhibit the largest restructurings. The agency firms in the paper (SIC 26), petroleum (SIC 29), primary metals (SIC 33) and transportation (SIC 37) industries all have median total assets greater than two billion dollars. The median percentage decline in the number of outstanding common shares in these industries, during the year of the initial restructuring, ranges from approximately 8-20 percent with an approximate value of $100 million (primary metals) to $400 million (petroleum). For comparison, the median percentage decline in the number of outstanding common shares for the agency firms as a whole was approximately 10 percent, with a median value of approximately $22 million.

FINANCE CONSTRAINTS OR FREE CASH FLOW? 199
TABLE HI. Fixed investment regressions: split by Tobin's Q; dependent variable I / I f
Low Q firms High Q firms
Q 0.0292 (0.0057) 0.0167 (0.0013) CF/K 0.3620 (0.0297) 0.2866 (0.0192) AW/K -0,3359 (0.0425) -0.1588 (0.0204) ALTD/ t ( 0.4633 (0.0751) 0.0895 (0.0437)
Adjusted R 2 0.2372 0.2804
Sample period 1980-1990. Fixed finn and time effects not reported. Standard errors, in parentheses, are corrected for the reduction in the degrees of freedom lost with fixed effects.
Table I shows that agency firms are relatively large and slow growing firms. Their median sales of $426.6 million and total assets of $424.8 million place them about halfway between high and low-dividend firms with low Q 's. Over the sample period, they exhibited negative sales growth. Like the other firms in the sample, agency firms rely on internal finance for over ninety percent of their total sources of finance. Their debt-equity ratio of 0.6243 is exceeded only by the low Q, low dividend firms. Table II reinforces the notion that agency firms are slow growers with poor average investment opportunities; their mean level of investment (0.12) and Q (0.69) are among the lowest in the sample.
From an examination of the summary statistics of the sample, it appears that low Q firms exhibit relatively slow growth, and low dividend firms are smaller than high dividend finns. Furthermore, agency firms seem to be relatively large, slow growing firms in industries with poor investment opportunities during the 1980's (a fact supported by their low average Q 's) and relatively high retention rates (0.72 versus 0.68 for high-dividend, low Q firms). Jensen (1987) suggests that more debt will not always have 'positive control effects' and that the control function of debt is most important for slowly growing firms with large cash flow. The sample statistics show that both the low Q and the agency firms in the sample seem to have many of the characteristics that would tend to give debt positive control over managerial investment decisions.
V. Regression Results
This section reports the empirical results by moving methodically through the splits of the data. First, I discuss the results of the fixed investment regressions based on Equation (1) for the sample split into over and under-investors based on Tobin's Q. I then discuss finer splits of the data, splitting the sample by both Q and dividend behavior. I also discuss the regressions results for agency finns, comparing the

200 ROBERT E. CARPENTER
TABLE IV. Fixed investment regressions: split by Tobin's Q and retention ratio; dependent variable I / I (
Low Q firms Low dividend firms High dividend firms
Q 0.0074 (0.0131) 0.0369 (0.0076) CF/K 0.3550 (0.0513) 0.4068 (0.0506) AW/K --0.3134 (0.0603) -0.4072 (0.0812) ALTD/K 0.7394 (0.1927) 0.2978 (0.0841)
AdjustedR 2 0.1447 0.2434
High Q firms Low dividend firms High dividend firms
Q 0.0264 (0.0048) 0.0136 (0.0013) CF/K 0.3155 (0.0504) 0.2715 (0.0205) AW/K --0.2140 (0.0553) --0.1270 (0.0209) ALTD/K 0.3040 (0.0920) 0.0328 (0.0498)
Adjusted R 2 0,3240 0.2664
Sample period 1980-1990. Fixed firm and time effects not report- ed. Standard errors, in parentheses, are corrected for the reduction in the degrees of freedom lost with fixed effects.
results to those based on splitting by Q and dividends before running regressions based on Equation (2).
1. SPLIT BY TOBIN'S Q
Tables III and IV report regression results from the specification given by Equation (1). As discussed in section III, I used the beginning of period stocks of working capital and long-term debt as instruments for the endogenous change in working capital and in long-term debt. I argued that because the intensity of monitoring and the risk of bankruptcy increase with the stock of debt, its marginal costs will rise with a rise in its stock. Fazzari and Petersen (1993) apply somewhat similar reasoning when they instrument the change in working capital with its lagged stock. The first-stage regressions of Equation (1) support this justification; the stock of working capital and the stock of new long-term debt have negative and significant coefficients in the first-stage regressions for the change in working capital and the change in new long-term debt.
Table III shows the results of Equation (1) for low Q and high Q firms (left to right). The standard errors of each coefficient estimate are in parentheses to the right of the point estimate and have been corrected for the loss in degrees of freedom due to fixed firm effects. The results in Table III seem inconsistent with the characterization of low Q firms as being over-investors because of the
FINANCE CONSTRAINTS OR FREE CASH FLOW? 201
opportunistic behavior of managers. Table III indicates that new long-term debt has a strong positive influence on investment for the low Q finns. The point estimate of 0.4633 for the change in long-term debt suggests that these finns spend close to one-half of new long-term debt on capital expenditures. On the other hand, while high Q firms' investment exhibits a statistically significant response to new long-term debt, the value of the point estimate is far smaller at 0.0895.
Low Q firms also exhibit the largest sensitivity to changes in internal finance. The absolute values of the cash flow and working capital coefficients are larger for low Q finns than for high Q finns. However, the interpretation the internal finance coefficients is less clear. If firms have low Q's through the opportunistic behavior of managers, their use of difficult-to-monitor internal funds to pursue bad investments may lead to large coefficients on internal finance variables, a point noted by Hoshi, Kashyap and Scharfstein (1991). However, a low Q means that the capital markets place a low value on the firm's investment opportunities, possibly making it difficult for profit maximizing managers with good investment projects to acquire external funds. These firms may face finance constraints that make their investment sensitive to changes in internal finance.
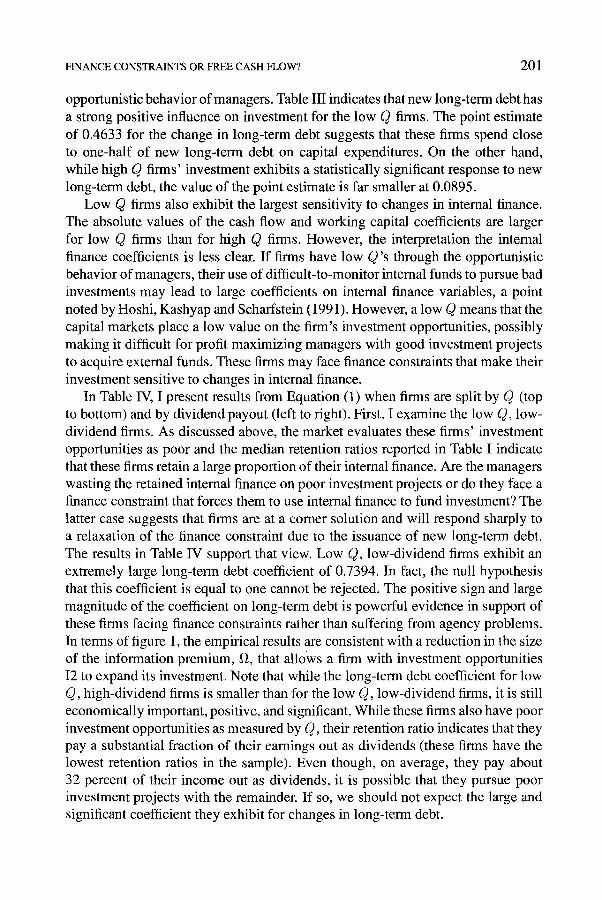
In Table IV, I present results from Equation (1) when firms are split by Q (top to bottom) and by dividend payout (left to right). First, I examine the low Q, low- dividend firms. As discussed above, the market evaluates these firms' investment opportunities as poor and the median retention ratios reported in Table I indicate that these firms retain a large proportion of their internal finance. Are the managers wasting the retained internal finance on poor investment projects or do they face a finance constraint that forces them to use internal finance to fund investment? The latter case suggests that firms are at a comer solution and will respond sharply to a relaxation of the finance constraint due to the issuance of new long-term debt. The results in Table IV support that view. Low Q, low-dividend firms exhibit an extremely large long-term debt coefficient of 0.7394. In fact, the null hypothesis that this coefficient is equal to one cannot be rejected. The positive sign and large magnitude of the coefficient on long-term debt is powerful evidence in support of these firms facing finance constraints rather than suffering from agency problems. In terms of figure 1, the empirical results are consistent with a reduction in the size of the information premium, f~, that allows a firm with investment opportunities I2 to expand its investment. Note that while the long-term debt coefficient for low Q, high-dividend firms is smaller than for the low Q, low-dividend firms, it is still economically important, positive, and significant. While these firms also have poor investment opportunities as measured by Q, their retention ratio indicates that they pay a substantial fraction of their earnings out as dividends (these firms have the lowest retention ratios in the sample). Even though, on average, they pay about 32 percent of their income out as dividends, it is possible that they pursue poor investment projects with the remainder. If so, we should not expect the large and significant coefficient they exhibit for changes in long-term debt.
202 ROBERT E. CARPENTER
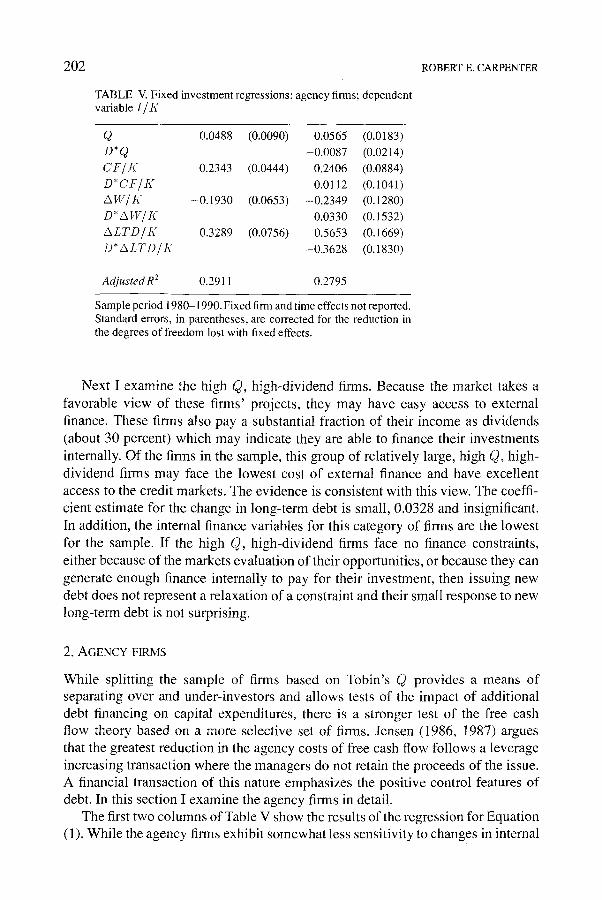
TABLE V. Fixed investment regressions: agency firms; dependent variable I lK
Q 0.0488 (0.0090) 0.0565 (0.0183) D*Q -0.0087 (0.0214) CF/K 0.2343 (0.0444) 0.2406 (0.0884) D*CF/K 0.0112 (0.1041) AW/K -0.1930 (0.0653) -0.2349 (0.1280) D*AW/K 0.0330 (0.1532) ALTD/K 0.3289 (0.0756) 0.5653 (0.1669) D*ALTD/K -0.3628 (0.1830)
Adjusted R 2 0.2911 0.2795
Sample period 1980-1990. Fixed firm and time effects not reported. Standard errors, in parentheses, are corrected for the reduction in the degrees of freedom lost with fixed effects.
Next I examine the high Q, high-dividend firms. Because the market takes a favorable view of these firms' projects, they may have easy access to external finance. These firms also pay a substantial fraction of their income as dividends (about 30 percent) which may indicate they are able to finance their investments internally. Of the firms in the sample, this group of relatively large, high Q, high- dividend firms may face the lowest cost of external finance and have excellent access to the credit markets. The evidence is consistent with this view. The coeffi- cient estimate for the change in long-term debt is small, 0.0328 and insignificant. In addition, the internal finance variables for this category of firms are the lowest for the sample. If the high Q, high-dividend firms face no finance constraints, either because of the markets evaluation of their opportunities, or because they can generate enough finance internally to pay for their investment, then issuing new debt does not represent a relaxation of a constraint and their small response to new long-term debt is not surprising.
2. AGENCY FIRMS
While splitting the sample of firms based on Tobin's Q provides a means of separating over and under-investors and allows tests of the impact of additional debt financing on capital expenditures, there is a stronger test of the free cash flow theory based on a more selective set of firms. Jensen (1986, 1987) argues that the greatest reduction in the agency costs of free cash flow follows a leverage increasing transaction where the managers do not retain the proceeds of the issue. A financial transaction of this nature emphasizes the positive control features of debt. In this section I examine the agency finns in detail.
The first two columns of Table V show the results of the regression for Equation (1). While the agency finns exhibit somewhat less sensitivity to changes in internal

FINANCE CONSTRAINTS OR FREE CASH FLOW? 203
finance variables than low and high Q firms, their response to changes in long- term debt is economically important and significant (0.3289), inconsistent with the predictions of free cash flow theory. The coefficients on the internal finance variables are small relative to the agency firms' parent group of low Q firms, and while structural interpretations based of a reduced-form empirical model must always be cautious, these results do not seem consistent with a dollar for dollar movement of internal finance and investment.
The fact that the agency firms restructure during the sample period provides us with the ability to perform an additional empirical test. If agency firms use the restructuring to improve managerial efficiency by pledging free cash flow to shareholders, then there should be a change in the underlying relationship between sources of finance and investment that will be reflected in the parameter estimates of Equation (2). Furthermore, the restructuring activity itself provides us with the ability to identify the period that the 'regime' change takes place. This test is especially useful if the reason for the relatively large response of agency firms to new long-term debt observed in Table IV is the result of their behavior prior to the more intensive monitoring expected after a leverage increasing restructuring.
The second two columns of Table V show the change in the coefficients on each of the right hand side variables after the restructuring. Since the dummy variable I)it takes on a value of 1 beginning with the period of the restructuring and in all subsequent periods, the coefficient estimate for the product of a given right hand side variable and the dummy variable Dit represents the change in the coefficient estimate after the restructuring takes place.
These results are very suggestive and support the existence of free cash flow theory. After the agency firms restructure there is a sharp and statistically significant decline in the size of the long-term debt coefficient. The point estimate of the long-term debt coefficient changes from 0.5653 to 0.2025, a decline of 0.3628. The changes in the remaining coefficients are economically small and statistically insignificant. The results of this regression do not seem to be driven entirely by the year that the restructuring occurs. Changing the definition of the interaction dummy variable so that Di~ takes on a value in the first year succeeding the restructuring reduces the size of the decline in the long-term debt coefficient, and the interaction variable is no longer significant. However, the interaction dummy is still negative in sign.
3. ALTERNATIVE SPECIFICATIONS AND ROBUSTNESS
The results of the estimation are robust to a variety of alternative specifications. Parameter estimates in Tables III-V show that Tobin's Q has a statistically sig- nificant and economically important impact upon investment expenditures. I used Tobin's Q in the empirical model to maintain comparability with the splitting vari- able. However, in some studies tax-adjusted Q, a more complex variable that allows for differences in the taxation of capital gains and dividend income, is used as the
204 ROBERT E. CARPENTER
proxy for investment opportunities. I repeated the regressions using tax adjusted Q and other than a reduction in the size of the point estimate for Q, there were no substantive changes in the coefficients.19
I also included lags of cash flow, AW, Q, and the change in long-term debt as additional independent variables. These variables may have explanatory power if there is significant serial correlation in the relationship between, for example, shocks to internal finance and investment expenditures or time-to-build problems. The pattern of coefficients is not disrupted when these lags are included in the model. In fact, one interesting result of including lags of each of the independent variables is that for the low Q, low dividend firms the long-term debt coefficient rises to 0.978.
Lastly, I checked for a change in the average level in the investment of agency firms after restructuring by introducing an additional set of time dummies into specifications represented by equations 1 and 2. The dummies indexed the year of, and the four years succeeding, a restructuring. The free cash flow theory suggests a change in the marginal effect of debt finance after a restructuring. However, it is possible that the slope of the regression line remains relatively constant following a restructuring, but the intercept falls. If so, the effect may be picked up by these additional dummy variables. After introducing the additional dummies in addition to the regression with fixed year effects, an F-test indicated no level statistically significant shift in the intercept of the regression succeeding a restructuring. This result is not entirely surprising. Because the dummies indexing time periods after restructuring are highly correlated with the time effects, it may be impossible to identify their independent effect. Therefore, I repeated the regression with the time dummies, but deleting the fixed year effects. As before, the time dummies were statistically insignificant as a group.
VI. Conclusion
Capital market imperfections may explain firms' preference for internal funds to finance investment. However, two different descriptions of the effects of the imper- fections have emerged. First, that a shortage of internal funds may lead firms to under-invest if information asymmetries lead to problems credibly communicating the firm's prospects to outsiders. Second, these asymmetries may lead to over- investment if managers use a surplus of internal funds to purchase investment projects that maximize their utility instead of shareholder wealth.
The principal findings of this paper are that both financing constraints and the agency costs of free cash flow appear to affect investment; results consistent with a life cycle model of the firm. Both under and over-investors' capital expenditures are positively correlated with internal finance. However, the investment of relatively small firms with low Q 's, and who pay low dividends, is very responsive to new long-term debt, evidence that they face a binding finance constraint. Firms least likely to face finance constraints, with good investment projects and plenty of

FINANCE CONSTRAINTS OR FREE CASH FLOW? 205
internal finance exhibit investment that is relatively unresponsive to changes in financial variables.
On the other hand, firms in the agency subset seem to use debt to pledge free cash flow to shareholders. After these firms restructured their balance sheets, empir- ical tests indicated a statistically significant and economically important reduction in the response of their investment to new long-term debt. However, even after the restructuring, the agency firms exhibited a strong positive response to new long-term debt, which may indicate that while efficiency was enhanced by the restructuring, the managers' ability to use free cash flow for poor investment projects was not completely eliminated.
This research indicates that capital market imperfections can have multiple sources. Identifying the source of the financing hierarchy for different types of firms, and the reason for their preference for internal funds, is important. Internal finance is a highly procyclical variable that has a close relationship with investment, the most volatile component of aggregate demand. If finns 'prefer' internal funds because constraints render external finance unavailable, the cyclical downturns in internal finance will result in relatively larger reductions in welfare than if firms prefer internal funds to escape the monitoring of external creditors. Furthermore, public policy designed to stimulate investment by increasing after tax-cash flow (e.g., lower corporate tax rates, accelerated depreciation schedules, amortization of R&D expenditures) will be most efficient if it is designed to target under- investors.
Appendix
Replacement Value Capital Stock: Constructing an estimate of the firm's replace- ment value capital stock is necessary to correct for potential biases introduced by historical cost accounting. The technique that I use to construct this estimate is a modification of the method used in Salinger and Summers. Several assumptions are required to construct the series and are discussed in more detail in the Salinger and Summers paper. First, the equipment's fixed capital has a common useful life (L). Second, because COMPUSTAT does not report the method that firms use to depreciate their capital stock in any detail, all firms are assumed to use straight line methods for book depreciation. Third, actual depreciation is exponential with rate 2/L, equivalent to double-declining digits depreciation. Fourth, all investments are made at the beginning of the year, and all depreciation is taken at the end of the year. Last, the value of reported gross property, plant and equipment in the initial year that the firm appears in the sample is equal to its replacement value, thus functioning as a seed value for the Salinger and Summers algorithm.
The formula L~ = (K~-I + I~)/DEPt provides an estimate of the useful lifetime of fixed capital, t( represents the book value of gross property, plant and equipment, I is capital expenditures, and DEP is book depreciation. Instead of allowing the estimated useful life to fluctuate from year to year, I use each the
206 ROBERT E. CARPENTER
average of each firms L. In addition, if reported depreciation is small in any given year, L becomes implausibly large. I place an upper bound of forty years and a lower bound of three years on L. The Salinger-Summers algorithm uses a method similar to perpetual inventory methods to create the replacement cost estimate of K. The actual formula is:
IC~ = (tC~t_t(P~/P~_I) +/ i t ) (1 - (2/Li))
Most studies of investment utilizing the COMPUSTAT database limit the sample by deleting firms who participate in mergers and acquisitions from the database. Some papers also eliminate firms that divest a portion of their capital from the data as well. Because the Salinger and Summers algorithm uses capital expenditures to measure the addition to the capital stock, this method will perform poorly after an acquisition or divestiture and misstate the replacement capital stock. Unless the firm was explicitly coded as participating in a merger by COMPUSTAT, I retain these firms and adjust the procedure to account for both acquisitions and divestitures. If the firm undertakes a large acquisition relative to the size of its beginning of period capital stock, where the acquisition is measured by the change in gross property plant and equipment less capital expenditures, then instead of using capital expenditures as the increment to the capital stock during that period, I use the change in gross property, plant, and equipment plus retirements. If the firm divests a large proportion of its capital relative to the beginning of period capital stock, where the divestiture is measured by the change in gross property, plant and equipment, I use the change in net plant as the increment to the capital stock for that period.
Tobin's Q represents the investment opportunities facing the firm. While the firm is really concerned with a projects marginal Q, only average Q is typically observable. Average Q is measured as Q = (E + T D B T - I N V ) / P K , where E represents the sum of the value of the firm's common and preferred stock. The value of common stock is equal to the closing stock price times outstanding shares; the value of preferred is measured by dividing preferred dividends by the Standard and Poors preferred stock yield. T D B T represents the total debt of the firm and I N V is the value of the firm's inventories. P K is the replacement cost of the firms capital stock.
Cash Flow. I defined cash flow as income before extraordinary items, plus depreciation and amortization, equity in net loss, extra ordinary items and discon- tinued operations and deferred taxes.
Notes
* I thank Gerald Dwyer, Steven Fazzari, Phil Keefer, Doug Lamdin, Mark McBride, Den- nis Mueller, Bruce Petersen, Mark Vaughan, and Mike Williams for comments. I gratefully acknowledgethe University Research Committee of Emory University for financial support and
FINANCE CONSTRAINTS OR FREE CASH FLOW? 207
Robert Parks for technical advice and support. I thank Raymond Atkins for excellent research assistance.
1. For citations to the more recent literature, see section II. 2. See, for example, Jensen and Meckling (1976). 3. Jensen (1987) defines free cash flow as the portion of cash flow that remains after all positive
net present value projects are undertaken. 4. This point is recognized by Mueller (1992). See Kathuria and Mueller (1994) and Vogt (1994)
for innovative tests that attempt to distinguish between finance-constrained firms and 'free cash flow' firms by examining the differences in firms' response to changes in cash flow.
5. Donaldson (1961, p. 83) also recognized the relationship between added debt and increased managerial efficiency, noting '[a]dded debt has the ... disadvantage of adding to the rigidity of outflows... Substantial additions to debt invariably mean increased attention to cash flow forecasting and tighter controls over cash flow'.
6. This is a large literature which continues to grow rapidly. See Bemanke (1993) and Gertler (1988) for extensive surveys of this literature and for the citations of several additional studies.
7. Jensen and Meckling (1976) show that incomplete monitoring provides managers with incen- tives to expandthe scale of the firm faster than is optimal. Murphy (1985) shows that managerial compensation and the growth in the firms sales are positively related. Joskow, Rose, and Shep- ard (1993) show that the elasticity of CEO compensation with respect to the size of the film is over twice as large as the elasticity of compensation with respect to the firms stock mar- ket return. Also, see the discussion in Jensen and Meckling (1976) that relates managerial consumption of non-pecuniary benefits to the optimal scale of the finn.
8. See, for example, the studies cited in Jensen (1987). 9. Blair and Litan (1990) use a similar argument to suggest that their finding of a negative
relationship between the change in the capital stock and the level of debt finding at the industry level is inconsistent with the predictions of free cash flow theory.
10. For simplicity in the graphical exposition, I assume that the firm faces a perfectly elastic supply of external finance once the information premium is paid.
11. Lehn and Poulsen (1989) suggest that managers' motivation to pledge free cash flow might be driven by fear of takeover. Also, see Kathuria and Mueller (1994) for a discussion of how the probability of takeover affects managers' decisions to waste internal finance.
12. A more precise definition of cash flow and other key variables may be found in the appendix. 13. Because current debt is also a current liability of the firm, I adjusted the definition of working
capital to exclude current debt. 14. The estimated replacement value of the firm's capital stock was calculated with an adaptation
of the method used in Salinger and Summers (1983). See the data appendix of this paper for details on its construction.
15. Finns may also have Q values greater than one if they possess market power (see Lindenberg and Ross, 1981). In this case a monopolist with opportunistic managers may be placed into the under-investor group.
16. Firms that are not finance constrained, and whose managers act in shareholders' interests may issue debt for a variety of reasons, e.g., for tax shields.
17. The precise restructuring criteria used to identify an agency firm is discussed below. 18. Note that because the table reports sample medians, the ratios will not necessarily sum to one. 19. For details on the construction of the measure of the tax adjusted Q used in this paper, see
Fazzari, Hubbard and Petersen (1988). Tables where tax adjusted Q replaces Tobin's Q as an independent variable are available from the author upon request.
References
B aumol, William J. (1965) The Stock Market and Economic Efficiency, New York: Fordham Univer- sity Press.
Berle, Adolf A. and Means, Gardiner (1932) The Modern Corporation and Private Property, New York: Macmillan.

208 ROBERT E. CARPENTER
Bernanke, Ben S. (1993) 'Credit in the Macroeconomy', FederalReserve Bank of New York Quarterly Review 18, 50-70.
Blair, Margaret M. and Litan, Robert E. (1990) 'Corporate Leverage and Leveraged Buyouts in the Eighties', in John B. Shoven and Joel Waldfogel (eds), Debt, Taxes, and CorporateRestructuring, Washington D.C.: Brookings, 43-80.
Calomiris, Charles W., Himmelberg, Charles P. and Wachtel, Paul (1994) 'Commercial Paper, Cor- porate Finance, and the Business Cycle: A Microeconomic Perspective', NBER Working Paper No. 4848.
Carpenter, Robert E., Fazzari, Steven M. and Petersen, Bruce C. (1994) 'Inventory Investment, Internal Finance and the Business Cycle, BrookingsPapers on Economic Activity 2, 75-138.
Donaldson, Gordon (1961 ) Corporate Debt Capacity, Boston, Mass.: Harvard University. Devereux, Michael and Schiantarelli, Fabio (1990) 'Investment, Financial Factors, and Cash Flow:
Evidence From U.K. Panel Data', in R. Glenn Hubbard (ed.), Asymmetric Information, Corporate Finance, and Investment, Chicago: University of Chicago Press 279-306.
Fazzari, Steven M., Hubbard, R. Glenn and Petersen, Bruce C. (1988) 'Financing Constraints and Corporate Investment', Brookings Papers on Economic Activity 1, 141-195.
Fazzari, Steven M. and Petersen, Bruce C. (1993) 'Working Capital and Fixed Investment: New Evidence on Finance Constraints', Rand Journal of Economics 24,328-342.
Gertler, Mark (1988) 'Financial Structure and Aggregate Economic Activity: An Overview', Journal of Money, Credit and Banking 20, 559-596.
Gertler, Mark and Gilchrist, Simon (1994) 'Monetary Policy, Business Cycles and the Behavior of Small Manufacturing Firms', Quarterly Journal of Economics 109, 309-340.
Grabowski, Henry G. and Mueller, Dennis C. (1972) 'Managerial and Stockholder Welfare Models of Firm Expenditures', Review of Economics and Statistics 54, 9-24.
Griffin, James M. (1988) 'A Test of the Free Cash Flow Hypothesis: Results from the Petroleum Industry', Review of Economics and Statistics 70, 76-82.
Himmelberg, Charles P. and Petersen, Bruce C. (1994) 'R&D and Internal Finance: A Panel Study of Small Firms in High-Tech Industries', Review of Economics and Statistics 76, 38-51.
Hoshi, Takeo, Kashyap, Anil and Scharfstein, David (1991) 'Corporate Structure, Liquidity, and Investment: Evidence from Japanese Industrial Groups', Quarterly Journal of Economics 106, 33-60.
Hubbard, R. Glenn, Kashyap, Anti K. and Whited, Toni M. (1993) 'Internal Finance and Firm Investment', NBER Working Paper No. 4392.
Jensen, Michael C. (1986) 'Agency Costs of Free Cash Flow, Corporate Finance and Takeovers', Amer&an Economic Review 76, 323-329.
Jensen, Michael C. (1987) 'The Free Cash Flow Theory of Takeovers: A Financial Perspective on Mergers and Acquisitions and the Economy', in Lynne E. Browne and Eric S. Rosengren (eds.), The Merger Boom, Conference Series No. 31, Boston: The Federal Reserve Bank of Boston, 102-143.
Jensen, Michael C. and Meckling, William H. (1976) 'Theory of the Firm: Managerial Behavior, Agency Costs and Ownership Structure', Journal of Financial Economics 3,305-360.
Joskow, Paul, Rose, Nancy and Shepard, Andrea (1993) 'Regulatory Constraints on CEO Compen- sation', Brookings Papers on Economic Activity (Microeconomics) 1, 1-72.
Kashyap, Anil K., Lamont, Owen A. and Stein, Jeremy C. (1994) ' Credit Conditions and the Cyclical Behavior of Inventories', Quarterly Journal of Economics 109, 565-592.
Kathuria, Rajat and Mueller, Dennis C. (1994) Investment and Cash Flow: Asymmetric Information or Managerial Discretion, mimeo, February.
Lang, Larry H.P. and Litzenberger, Robert H. (1989) 'Dividend Announcements: Cash Flow Signaling vs. Free Cash Flow Hypothesis'? Journal of Financial Economics 24, 181-191.
Lehn, Kenneth and Poulsen, Annette (1989) 'Free Cash Flow and Stockholder Gains in Going Private Transactions', Journal of Finance 44, 771-787.
Lindenberg, Eric B. and Ross, Stephen A. (1981) 'Tobin's Q Ratio and Industrial Organization', Journal of Business 54, 1-32.
Marris, Robin (1964) The Economic Theory of Managerial Capitalism, Glencoe, Ill.: Free Press. Meyer, J. and Kuh, E. (1957) The Investment Decision, Cambridge, Mass.: Harvard University Press.

FINANCE CONSTRAINTS OR FREE CASH FLOW? 209
Murphy, Kevin J. (1985) 'Corporate Performance and Managerial Remuneration: An Empirical Analysis', Journal of Accounting and Economics 7, 11-42.
Mueller, Dennis C. (1969) 'A Theory of Conglomerate Mergers', Quarterly Journal of Economics 83, 643-659.
MueUer, Dennis C. (1972) 'A Life Cycle Theory of the Firm', Journal oflndustriaI Economics 20, 199-219.
Mueller, Dennis C. (1992) 'The Corporation and the Economist', International Journal oflndustrial Organization 10, 147-170.
Myers, Stewart C. and Majluf, Nicholas S. (1984) 'Corporate Financing and Investment Decisions When Firms Have Information Investors Do Not Have', Journal of Financial Economics 13, 187-221.
Oliner, Stephen and Rudebusch, Glenn (1992) 'Sources of the Financing Hierarchy for Business Investment', Review of Economics and Statistics 74,643-654.
Salinger, Michael A. and Summers, Lawrence H. (1983) 'Tax Reform and Corporate Investment: A Microeconometric Simulation Study', in Martin Feldstein (ed.), Behavioral Simulation Methods in Tax Policy Analysis, Chicago: University of Chicago Press, 247-28 I.
Stiglitz, Joseph and Weiss, Andrew (1981 ) 'Credit Rationing in Markets with Imperfect Information', American Economic Review 71,393-410.
Vogt, Stephen C. (1994) 'The Cash Flow/Investment Relationship: Evidence From U.S. Manufactur- ing Firms', Financial Management 23, 3-20.
Whited, Toni M. (1992) 'Debt, Liquidity Constraints, and Corporate Investment: Evidence from Panel Data', Journal of Finance 47, 1425-60.