finaldetailedprojectreport(dpr) vol i main …...s vashi, navi mumbai 400 705 stup,vashi detail...
TRANSCRIPT

Municipal Corporation of Greater Mumbai
CONSULTANCY SERVICES FOR PREPARATION OF FEASIBILITY REPORT, DPR PREPARATION, REPORT ON ENVIRONMENTAL STUDIES AND OBTAINING MOEF CLEARANCE AND BID PROCESS
MANAGMENT FOR MUMBAI COASTAL ROAD PROJECT
`
FINAL DETAILED PROJECT REPORT (DPR)
Vol – I Main ReportApril 2016
STUP Consultants Pvt. Ltd. Ernst& Young Pvt Ltd

S
Vashi, Navi Mumbai 400 705
STUP, VASHI
DETAIL PROJECT REPORT
STUP Consultants Pvt.Ltd.
or reproduced without their
No. PURPOSE OF ISSUE Nam Signat Nam Signat Nam Signat
STUP Consultants Pvt. Ltd Plot No.22A, Sector 19C, Palm Beach Road
Phone: 40887777. Fax: [91-22] 2783 62 40e-mail : [email protected]
OFFICE OF ORIGIN
OWNER MUNICIPAL CORPORATION OF GREATER MUMBAI
CONTRACTOR CLIENT
PROJECT CONSULTANCY SERVICES FOR PREPARATION OF FEASIBILITY REPORT, DPR PREPARATION, REPORT ON ENVIRONMENTAL
STUDIES AND OBTAINING MOEF CLEARANCE AND BID PROCESS
MANAGMENT FOR MUMBAI COASTAL ROAD PROJECT
TITLE
DATE Rev. MODIFICATIONS/ PREPARED CHECKED APPROVED
18.02.15 R0 For Approval SP AGA ADJ
13.04.16 R1 For Approval SP AGA ADJ
This note is the property of DATE PAGES NOTE No. 8098/E/DN-21 REV.No.
It should not be used, copied 13.04.16 5+160 R1

CONSULTANCY SERVICES FOR PREPARATION OFFEASIBILITY REPORT, DPR PREPARATION, REPORT ONENVIRONMENTAL STUDIES AND OBTAINING MOEF
STUP Consultants Pvt. Ltd CLEARANCE AND BID PROCESS MANAGMENT FOR MUMBAI
COASTAL ROAD PROJECT
5.2 Traffic Surveys ...................................................................................................................................................................141. INTRODUCTION............................................................................................................................................................1 5.2.1
5.2.2
5.2.3
5.2.4
5.2.5
5.2.6
5.2.7
5.2.9
Project Description.........................................................................................................................14
Traffic Surveys: Methodology ........................................................................................................14
Traffic Surveys Data Analysis & Results........................................................................................18
Speed and Delay Surveys................................................................................................................21
Origin Destination (O-D) Survey.................................................................................................. 23
Traffic Demand Forecast .............................................................................................................. 28
Lane Capacity................................................................................................................................ 29
Interchanges.................................................................................................................................. 34
1.1
1.2
1.3
1.4
1.5
General .................................................................................................................................................................................. 1
History of Reclamation of Mumbai..................................................................................................................................1
Project Road .........................................................................................................................................................................2
Objectives..............................................................................................................................................................................3
Report Structure...................................................................................................................................................................3
2. REGIONAL/STATE SOCIO-ECONOMIC PROFILE ................................................................................................. 4
2.1 General ..................................................................................................................................................................................4
2.2 Maharashtra State Geography............................................................................................................................................45.3 Traffic Dispersal Scheme of Existing Network............................................................................................................ 39
2.2.1
2.2.2
2.2.3
2.2.4
2.2.5
2.2.6
2.2.7
Geography ........................................................................................................................................4
Geology ............................................................................................................................................4
Demographical Features..................................................................................................................4
State of the Economy.......................................................................................................................4
Economic Sectors ............................................................................................................................5
Transport Infrastructure ..................................................................................................................6
Industry ............................................................................................................................................8
5.3.1
5.3.2
5.3.3
5.3.4
5.3.5
5.4.1
5.4.2
5.4.3
5.4.4
5.5.1
Amarson Garden............................................................................................................................ 39
Haji Ali Chowk.............................................................................................................................. 46
BWSL Worli ................................................................................................................................... 50
BWSL Toll Plaza Interchange....................................................................................................... 55
Carter Road.................................................................................................................................... 59
Ritumbara College Interchange .................................................................................................... 65
MADH Island................................................................................................................................ 69
Oshiwara Interchange ................................................................................................................... 72
Malad Interchange ........................................................................................................................ 76
Kandivali Interchange ................................................................................................................... 83
3. SOCIO-ECONOMIC PROFILE OF THE PROJECT INFLUENCE AREA................................................................ 9
3.1 Mumbai Metro City .............................................................................................................................................................9
3.1.1
3.1.2
3.1.3
3.1.4
3.1.5
3.1.6
Introduction .....................................................................................................................................9
Climate.............................................................................................................................................9
Population ........................................................................................................................................9
Demographics................................................................................................................................ 10
Average Rainfall in Mumbai .......................................................................................................... 10
Socio Economic profile of MMR ................................................................................................... 10
6. ALIGNMENT STUDIES...............................................................................................................................................87
6.1 Project Influence Area ......................................................................................................................................................87
6.1.1
6.1.2
6.1.3
6.1.4
Project Sections ............................................................................................................................. 87
Engineering and Social Constraints.............................................................................................. 87
Environmental Constraints ........................................................................................................... 89
Financial Constraints .................................................................................................................... 893.2 MMR Plan ...........................................................................................................................................................................10
4. METHODOLOGY ADOPTED FOR THE STUDY......................................................................................................13
4.1 General ................................................................................................................................................................................136.2 Project Alignment ..............................................................................................................................................................90
6.2.1
6.2.2
6.2.3
General........................................................................................................................................... 90
Alignment Options ........................................................................................................................ 90
Recommended Alignment Option- Option 7...............................................................................105
4.1.1
4.1.2
4.1.3
4.1.4
Collection and Review of Secondary Data .....................................................................................13
Reconnaissance Survey.................................................................................................................. 13
Field Investigations........................................................................................................................ 13
Design Standards and Methodology..............................................................................................13
6.3 Interchange Design and Dispersal Scheme .................................................................................................................105
6.3.1 Coastal Road Interchange (South Mumbai) ................................................................................105
6.3.2 Coastal Road Interchange (North Mumbai)................................................................................1075. TRAFFIC STUDIES AND ANALYSIS...........................................................................................................................14
5.1 Introduction........................................................................................................................................................................147. ENGINEERING SURVEY AND INVESTIGATIONS...............................................................................................1115.1.1
5.1.2
5.1.3
General ........................................................................................................................................... 14
Objective ........................................................................................................................................ 14
Scope .............................................................................................................................................. 14
7.1 Site Investigation..............................................................................................................................................................111
7.1.1 Topographical Survey................................................................................................................... 111
7.2 Hydraulic and Hydrological Investigations..................................................................................................................111
Detailed Project Report i

CONSULTANCY SERVICES FOR PREPARATION OFFEASIBILITY REPORT, DPR PREPARATION, REPORT ONENVIRONMENTAL STUDIES AND OBTAINING MOEF
STUP Consultants Pvt. Ltd CLEARANCE AND BID PROCESS MANAGMENT FOR MUMBAI
COASTAL ROAD PROJECT
7.3
7.4
7.5
Utilities Services ...............................................................................................................................................................111
Land acquisition plans.....................................................................................................................................................111
Material Survey and Investigation .................................................................................................................................111
8.12.3 Sewerage....................................................................................................................................... 131
8.12.4 Basis of Design for Sewerage ....................................................................................................... 131
Fire Suppression System.................................................................................................................................................1318.13
8.13.1
8.13.2
8.13.3
8.13.4
8.13.5
8.13.6
8.13.7
8.13.8
8.13.9
High Pressure Water Mist Fire Suppression System ................................................................... 131
Technical Specifications............................................................................................................... 131
Codes and Standards ....................................................................................................................132
System Design Basis ....................................................................................................................132
System Description and Operation ..............................................................................................132
Stand-by........................................................................................................................................132
Detection and Activation..............................................................................................................132
System Components .....................................................................................................................132
Co-ordination with the Tunnel Ventilation System .....................................................................134
8. TUNNEL STUDIES.....................................................................................................................................................1128.1
8.2
8.3
Introduction......................................................................................................................................................................112
Tunnel Layout ..................................................................................................................................................................112
Need for Investigation....................................................................................................................................................112
8.3.1 Tunnel Design ............................................................................................................................. 112
8.4
8.5
8.6
8.7
8.8
Design Basis for Tunnel .................................................................................................................................................113
Tunnel Geometric Design..............................................................................................................................................113
Assessment of Technical Feasibility .............................................................................................................................114
Details of TBM Technique.............................................................................................................................................115
Design of the tunnel in the TBM alternative...............................................................................................................116 8.13.10 Co-Ordination with Other Services .............................................................................................. 134
8.13.11 Reliability Of The System ............................................................................................................135
Integrated Tunnel Control System (SCADA).............................................................................................................135
8.8.1 General ......................................................................................................................................... 116
8.148.9 Tunnel Safety Services ....................................................................................................................................................117
8.14.1
8.14.2
8.14.3
8.14.4
8.14.5
8.14.6
8.14.7
8.14.8
Network Architecture ................................................................................................................... 135
Video Surveillance System............................................................................................................137
Fire Alarm System ........................................................................................................................142
Access Control System .................................................................................................................144
Traffic Control System..................................................................................................................145
Emergency Call Box and PA Communication System for Tunnel ..............................................147
Modes of operation & Cause & Effect Matrix for Tunnel Ventilation System............................ 151
System Architecture of Emergency Call System ..........................................................................184
8.9.1
8.9.2
8.9.3
Introduction ................................................................................................................................. 117
Design Objectives: ....................................................................................................................... 117
Ventilation System ....................................................................................................................... 121
8.10 Lighting..............................................................................................................................................................................127
8.10.1
8.10.2
8.10.3
8.10.4
8.10.5
8.10.6
8.10.7
Access Zone ................................................................................................................................. 127
Threshold Zone............................................................................................................................ 127
Transition Zone ........................................................................................................................... 127
Interior Zone ................................................................................................................................ 127
Exit Zone ..................................................................................................................................... 127
Street Lighting ............................................................................................................................. 127
Lighting installations ................................................................................................................... 127
9. RECLAMATION ..........................................................................................................................................................185
9.1
9.2
9.3
Introduction......................................................................................................................................................................185
Alignment Sections of Reclamation..............................................................................................................................185
Conventional Structures .................................................................................................................................................1858.11 Electrical............................................................................................................................................................................128
8.11.1
8.11.2
8.11.3
8.11.4
8.11.5
8.11.6
8.11.7
Design Standards & Codes .......................................................................................................... 128
Design Criteria............................................................................................................................. 129
Electrical Load Estimates............................................................................................................ 129
Source of Power............................................................................................................................ 129
Backup Power Supply .................................................................................................................. 129
Power Distribution System .......................................................................................................... 129
Lightning Protection System ....................................................................................................... 130
9.3.1 Conventional Methods of Reclamation........................................................................................ 185
9.4
9.5
Modern Methods of Reclamation .................................................................................................................................186
Methods of treatment for sub-soil improvement.......................................................................................................187
9.5.1 Improvement by increasing the strength .....................................................................................187
9.5.2 Improvement by Densification.....................................................................................................187
9.5.3 Improvement by drainage ............................................................................................................187
Design................................................................................................................................................................................188
Marine Aspects of Coastal Road...................................................................................................................................188
9.7.1 Meteorological data:.....................................................................................................................188
9.6
9.78.12 Plumbing and Sanitary System.......................................................................................................................................130
8.12.1 Codes and Regulation.................................................................................................................. 130
8.12.2 Water Supply System.................................................................................................................... 131 10. ENVIRONMENTAL IMPACT ASSESSMENT ..........................................................................................................192
Detailed Project Report ii

CONSULTANCY SERVICES FOR PREPARATION OFFEASIBILITY REPORT, DPR PREPARATION, REPORT ONENVIRONMENTAL STUDIES AND OBTAINING MOEF
STUP Consultants Pvt. Ltd CLEARANCE AND BID PROCESS MANAGMENT FOR MUMBAI
COASTAL ROAD PROJECT
10.1
10.2
10.3
10.4
10.5
10.6
10.7
10.8
Introduction......................................................................................................................................................................192
Role of Environment screening into the overall project preparation .....................................................................192
Legal Framework .............................................................................................................................................................192
List of Vulnerable Eco-system Components ............................................................................................................192
Indicators used in selecting important issues..............................................................................................................193
Methodology Adopted for Environmental Screening Exercise...............................................................................193
Objectives of Environmental Screening ......................................................................................................................193
Existing Baseline Environmental and Social Scenario...............................................................................................193
11.3 Estimation of Quantities and Cost ...............................................................................................................................205
12. ECONOMIC ANALYSIS INCLUDING SENSITIVITY ANALYSIS ......................................................................... 208
12.1
12.2
12.3
12.4
12.5
12.6
12.7
Introduction......................................................................................................................................................................208
Traffic Forecast................................................................................................................................................................208
Assumptions for Analysis...............................................................................................................................................211
Project Cost and Scheduling ..........................................................................................................................................211
Project Benefits ................................................................................................................................................................212
Economic Internal Rate of Return (EIRR) .................................................................................................................213
Conclusion for Economic Analysis ..............................................................................................................................21410.8.1
10.8.2
10.8.3
10.8.4
10.8.5
10.8.6
10.8.7
10.8.8
10.8.9
Location ....................................................................................................................................... 193
Climatic Conditions ..................................................................................................................... 194
Physiography and Soil Types....................................................................................................... 195
Geology and Geomorphology ...................................................................................................... 195
Ground Water Scenario................................................................................................................ 195
Seismic Hazards........................................................................................................................... 196
National Park............................................................................................................................... 196
Religious/ Historical/Archaeological Places.............................................................................. 197
Ecology ........................................................................................................................................ 197
13. FINANCIAL ANALYSIS AND FUNDING OPTIONS FOR DEVELOPMENT, MAINTENANCE AND MANAGEMENT ............................................................................................................................................................... 215
13.1
13.2
13.3
Approach & Methodology .............................................................................................................................................215
Project Timelines .............................................................................................................................................................215
Total Investment Costs...................................................................................................................................................215
13.3.1
13.3.2
13.3.3
Phasing of Construction ...............................................................................................................215
Interest during construction (IDC)..............................................................................................215
Means of Finance .........................................................................................................................21513.4
13.5
13.6
13.7
Final Alignment Option .................................................................................................................................................215
Operation and Maintenance Costs................................................................................................................................215
Profitability Projections ..................................................................................................................................................216
Key Financial Indicators.................................................................................................................................................217
10.8.10 Mangrove community of Mumbai ............................................................................................... 198
10.8.11 Land slides ................................................................................................................................... 198
10.8.12 Road Accidents ............................................................................................................................ 198
10.8.13 Industrial and Chemical Accidents.............................................................................................. 198
10.8.14 Climate change and Sea level rise................................................................................................ 198
10.8.15 Cyclones & Flooding ................................................................................................................... 198
10.8.16 Coastal Protection........................................................................................................................ 199
10.8.17 Demographic profile .................................................................................................................... 199
10.8.18 Land use pattern .......................................................................................................................... 199
10.8.19 Status of Air, water and noise pollution ....................................................................................... 199
10.9 Analysis of Alternatives ..................................................................................................................................................200
10.10 Major Findings & Environmental Implications..........................................................................................................200
10.10.1 Environmental Impact Assessment Study................................................................................... 201
10.10.2 Considerations for EIA study....................................................................................................... 202
10.10.3 Generic Structure of EIA report................................................................................................... 202
10.10.4 Procedure for clearance of project attracting CRZ notification .................................................. 203
10.11 Conclusion & Recommendations .................................................................................................................................203
11. INITIAL CONSTRUCTION COST ESTIMATES......................................................................................................205
14. BUS RAPID TRANSIT .................................................................................................................................................218
14.1
14.2
Introduction......................................................................................................................................................................218
Project Background.........................................................................................................................................................221
15. CONCLUSIONS AND RECOMMENDATIONS .......................................................................................................226
15.1
15.2
15.3
15.4
15.5
15.6
15.7
15.8
15.9
General ..............................................................................................................................................................................226
Traffic Analysis ................................................................................................................................................................226
Project Constraints and Project Sections.....................................................................................................................226
Option Analysis................................................................................................................................................................226
Alignment Proposals .......................................................................................................................................................226
Conclusions & Recommendations for Environmental Impact Assessment..........................................................226
Facilities.............................................................................................................................................................................227
Protection Wall (Break water wall) ...............................................................................................................................227
Conclusion from Economic analysis and Financial analysis.....................................................................................227
11.1
11.2
General ..............................................................................................................................................................................205
Methodology.....................................................................................................................................................................205
Detailed Project Report iii

CONSULTANCY SERVICES FOR PREPARATION OFFEASIBILITY REPORT, DPR PREPARATION, REPORT ONENVIRONMENTAL STUDIES AND OBTAINING MOEF
STUP Consultants Pvt. Ltd CLEARANCE AND BID PROCESS MANAGMENT FOR MUMBAI
COASTAL ROAD PROJECT
Detailed Project Report iv
CONSULTANCY SERVICES FOR PREPARATION OFFEASIBILITY REPORT, DPR PREPARATION, REPORT ONENVIRONMENTAL STUDIES AND OBTAINING MOEF
STUP Consultants Pvt. Ltd CLEARANCE AND BID PROCESS MANAGMENT FOR MUMBAI
COASTAL ROAD PROJECT
1. Introduction
1.1 General
Mumbai is reckoned as the financial capital of India. It houses a population of 12.4million besides a
large floating population, in a small area of 437sqkm and is surrounded by sea and has nowhere to
expand. The constraints of the geography and the inability of the city to expand have already made it
the densest metropolis of the world. High growth in the number of vehicles in the last 20 years has
resulted in extreme traffic congestion. This has lead to long commute times and a serious impact on
the productivity in the city as well as defining quality of life of its citizens. The extreme traffic
congestion has also resulted in Mumbai witnessing the worst kind of transport related pollution.
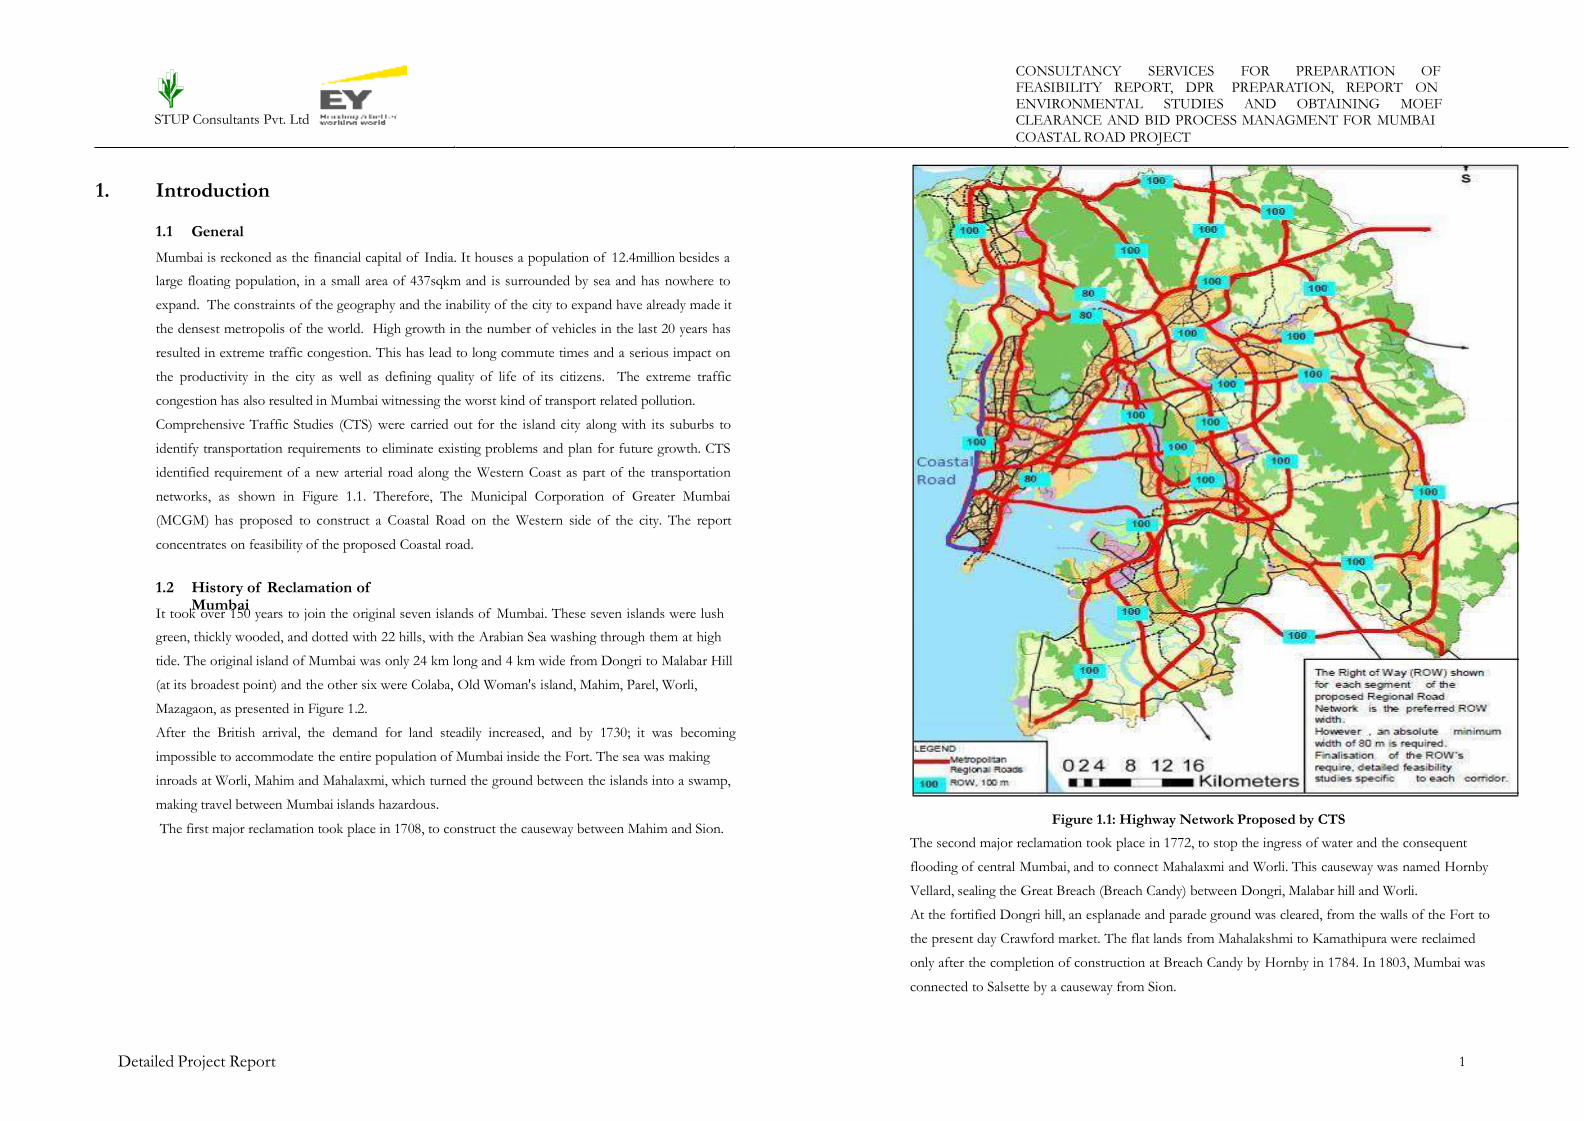
Comprehensive Traffic Studies (CTS) were carried out for the island city along with its suburbs to
identify transportation requirements to eliminate existing problems and plan for future growth. CTS
identified requirement of a new arterial road along the Western Coast as part of the transportation
networks, as shown in Figure 1.1. Therefore, The Municipal Corporation of Greater Mumbai
(MCGM) has proposed to construct a Coastal Road on the Western side of the city. The report
concentrates on feasibility of the proposed Coastal road.
1.2 History of Reclamation ofMumbai
It took over 150 years to join the original seven islands of Mumbai. These seven islands were lush
green, thickly wooded, and dotted with 22 hills, with the Arabian Sea washing through them at high
tide. The original island of Mumbai was only 24 km long and 4 km wide from Dongri to Malabar Hill
(at its broadest point) and the other six were Colaba, Old Woman's island, Mahim, Parel, Worli,
Mazagaon, as presented in Figure 1.2.
After the British arrival, the demand for land steadily increased, and by 1730; it was becoming
impossible to accommodate the entire population of Mumbai inside the Fort. The sea was making
inroads at Worli, Mahim and Mahalaxmi, which turned the ground between the islands into a swamp,
making travel between Mumbai islands hazardous.
The first major reclamation took place in 1708, to construct the causeway between Mahim and Sion.Figure 1.1: Highway Network Proposed by CTS
The second major reclamation took place in 1772, to stop the ingress of water and the consequent
flooding of central Mumbai, and to connect Mahalaxmi and Worli. This causeway was named Hornby
Vellard, sealing the Great Breach (Breach Candy) between Dongri, Malabar hill and Worli.
At the fortified Dongri hill, an esplanade and parade ground was cleared, from the walls of the Fort to
the present day Crawford market. The flat lands from Mahalakshmi to Kamathipura were reclaimed
only after the completion of construction at Breach Candy by Hornby in 1784. In 1803, Mumbai was
connected to Salsette by a causeway from Sion.
Detailed Project Report 1

CONSULTANCY SERVICES FOR PREPARATION OFFEASIBILITY REPORT, DPR PREPARATION, REPORT ONENVIRONMENTAL STUDIES AND OBTAINING MOEF
STUP Consultants Pvt. Ltd CLEARANCE AND BID PROCESS MANAGMENT FOR MUMBAI
COASTAL ROAD PROJECT
The horse drawn tramcars revolutionised transport in Colaba. The Prongs Lighthouse was
constructed off the island in 1875 and in the same year the Sassoon Docks were built by David
Sassoon on reclaimed land. The BB & CI (Bombay and Central India) Railways established a terminus
at Colaba. 90,000 sq. yards of land was reclaimed on the western shore of Colaba by the City
Improvement Trust, the work was completed in 1905. A seaside promenade (Cuffe Parade) was
completed the next year.
The next reclamation came, when the development of the Mumbai port had already begun. Major
quarrying had already begun in 1870. The hills of Chinchpokli and Byculla were quarried and dumped
into the sea, to fill the land near the railway line, the swamps and also the port to prevent the
accumulation of stagnant water. The first railway line was laid down in 1855 from Bori Bunder to
Thane.
By 1862 the town became widespread and the constructions that took place began to give rise to the
modern city of Mumbai. This became a regular feature in the succeeding years. The Fort walls were
demolished and the tanks up to Parel were filled. From 1870 to 1970, industrial and commercial
development prospered, which increased the spate of reclamation that ended with the famous
Backbay reclamation.
The first Backbay Reclamation Company (BRC) was formed in the 1860s with the express purpose
to reclaim the whole of Backbay. With the end of the American Civil War in 1865, land prices fell.
The government took over the narrow strip of land created by the BRC and gave it to the BB & CI
Railways (Bombay Baroda and Central India) to construct a new line between Churchgate and Colaba.
A proposal was made in 1917 to reclaim 607 hectares of land between Colaba and Backbay. The
project was taken over by the Development Directorate who planned to reclaim 463 hectares and
would have to relocate the Colaba terminus, which was moved to Bombay Central. The work
continued till 1945. Eventually 177 hectares was developed by 1929 of which 94 hectares was sold to
the military and 6 hectares was incorporated into the Marine Drive and its sea wall. Figure 1.3
presents the map of Mumbai in 1954.
Independence did not end the reclamation work but a third Backbay Reclamation was put into effect
and yielded the acreage on which stand the high rise buildings of Nariman Point and Cuffe Parade.
East of the Naval Dockyards some land was reclaimed and work was done to the north too. Coastal
Regulation Zone (CRZ) was introduced in 1990 banning reclamation for commercial activities.
Figure 1.2: Seven Islands of Mumbai
Colaba Causeway
The Thane and Colaba causeway were built during the tenure of Sir Robert Grant, the Governor of
Mumbai. He was also responsible for the construction of a number of roads between Mumbai and
the hinterland. The Colaba Causeway was completed in 1838 joining Colaba, Old Woman's island and
the H-shaped island of Mumbai together. Land prices shot up and Colaba became the centre of
commerce. The Causeway was widened and strengthened from 1861 to1863 (Cusrow Baug is built on
the causeway).
1.3 Project Road
Mumbai being an island city, surrounded on three sides by Arabian Sea, sea links were planned on the
western flank and the trans-harbour link on the east to connect the island city to the main land. One
of the prime reason sea links were planned as bridges was the restriction placed by the earlier Coastal
Detailed Project Report 2

CONSULTANCY SERVICES FOR PREPARATION OFFEASIBILITY REPORT, DPR PREPARATION, REPORT ONENVIRONMENTAL STUDIES AND OBTAINING MOEF
STUP Consultants Pvt. Ltd CLEARANCE AND BID PROCESS MANAGMENT FOR MUMBAI
COASTAL ROAD PROJECT
Regulatory Zones (CRZ) regulations preventing reclamation or stilt roads in the CRZ areas. The CRZ
notification dated 6 January 2011 issued by the Ministry of Environment and Forests, Govt. of India
(MOEF, GOI) now makes it possible to envisage coastal roads on stilts. During the meeting held in
Mumbai on 15 April 2011, the proposal of a reclamation based coastal road encircling Mumbai was
presented to the Hon‘ble Minister MoEF, GoI. Hon‘ble Minister suggested the proposal needed a
closer examination through a committee. Accordingly, Govt. of Maharashtra constituted a Joint
Technical Committee under the Chairmanship of Municipal Commissioner, MCGM on 30 June 2011
to study and make recommendations on the subject of coastal roads in Mumbai. The Committee held
various meetings and deliberated on the issues which were presented through its report to Govt. of
Maharashtra on 29 December 2011. The Committee recommended about 35.6 km. coastal road
comprising a combination of road based on reclamation, bridges, elevated roads and tunnels on
• Volume IX: Resettlement Action Plan Report
• Volume IV: Economic & Financial Analysis Report
western side of Mumbai. The Committee recommended this coastal road with two options of
alignments, both with a view to resolve the traffic congestion in Mumbai and to enable creation of the
much needed recreational open spaces.
MCGM has appointed a consortium of M/S STUP Consultants Pvt. Ltd consultants and M/S Ernst
& Young Pvt. Ltd for Preparation of Feasibility Report, DPR Preparation and Bid process
management for the proposed Mumbai Coastal Road Project.
1.4 Objectives
This report presents the studies carried out under guidance of Hon‘ble Additional Municipal
Commissioner to verify feasibility of the proposed coastal road, and recommendations for detailed
design stage of the project.
1.5 Report Structure
The Detailed Project Report contains the following documents:
• Volume I: Main Report
• Volume II: Design Report
• Volume III: Materials Report
• Volume IV: Engineering Report
• Volume V: Cost Estimate & Rate Analysis
• Volume VI: Drainage Design Report
• Volume VII: DrawingsFigure 1.3: Backbay Reclamation
• Volume VIII: Environmental Assessment Report
Detailed Project Report 3
CONSULTANCY SERVICES FOR PREPARATION OFFEASIBILITY REPORT, DPR PREPARATION, REPORT ONENVIRONMENTAL STUDIES AND OBTAINING MOEF
STUP Consultants Pvt. Ltd CLEARANCE AND BID PROCESS MANAGMENT FOR MUMBAI
COASTAL ROAD PROJECT
As per the population Census 2011, Maharashtra‘s population was 11.23 crore, which was 9.28 % of
India‘s population. Maharashtra is the second largest State in India in respect of population after Uttar
Pradesh. During the decade 1991-2001, the population of the State increased by 15.99%. The
corresponding growth during the earlier decade was 22.57 %. The decadal growth rate in 2001-2011
was more by 6.6%. As per Census, the population of India was 1,119,477.
2. Regional/State Socio-economic profile
2.1 General
Mumbai is the capital of Maharashtra state. This chapter
Maharashtra State, as it largely affects growth of Mumbai.
presents socio-economic profile of
2.2.3.2 Population Density
As per 2001 Population Census the density of population in the State was 322.5. During 2001-2011
there was an addition of 42.5 people per 1sq.km. As per Population Census 2011, the density of
population of the State is 365 per sqkm as compared to that of India (382). Mumbai has become the
most populated city and world‘s fifth. In 2011, Mumbai average density was 30,000 persons per sqkm
Urban Population
According to 2011 Population Census, 45.23 %( 42.4% in 2001) of the State‘s population was in
urban areas as against 27.8% at All-India level. Thus, the proportion in the state is substantially higher
than that for India.
2.2 Maharashtra State Geography
2.2.1 Geography
The dominant physical trait of the State is its plateau character. Maharashtra is a plateau of plateaus,
its western upturned rims rising to form the Sahyadri Range parallel to the sea-coast and its slopes
gently descending towards the East and South-east. Satpuda ranges cover northern part of the State,
while Ajanta and Satmala ranges run through central part of the State.
Arabain Sea guards the western boundary of Maharashtra while Gujarat and Madhya Pradesh are on
its northern side. The State receives its rainfall mainly from south-west monsoon.
Running north to south, throughout its length are the steeply rising Western Ghats. The foothills of
the ghats sometimes approach the seashore and sometimes withdraw 40 or 50 km away. Nestling in
these mountains, some at an altitude of 2000 meters are the hill stations of Maharashtra. These towns
offer clean, calm and a thoroughly refreshing alternative to city life. Mumbai, India's commercial
capital, and easily the most accessible city in this country, is the perfect gateway to Maharashtra's hill
country, with convenient and comfortable links by road, rail, and air.
2.2.4 State of the Economy
Maharashtra state has highest Gross State Domestic product (GSDP) in India. The statistical data is
presented in Table 2.1 below at current prices and constant prices.
Table2.1:GrossDomesticProductofMaharashtraState
2.2.2 Geology
Except around Mumbai, and along the eastern limits, the State of Maharashtra presents a
monotonously uniform, flat-topped skyline. This topography of the state is the outcome of its
geological structure. The state area, barring the extreme eastern Vidarbha region, Parts of Kolhapur
and Sindhudurg, is practically co-terminus with the Deccan Traps. Roughly 60 to 90 million years ago,
the outpouring of Basic Lava, through fissures formed horizontally bedded basalt over large areas.
Variations in their composition and structure have resulted in massive, well –jointed steel-gray cliff
faces alternating with structural benches of vesicular amygdaloidal lava and ash layers, all of which
contribute to the pyramid-shaped hills and crest – level plateau or mesas. Earth sculpturing under the
tropical climate completed the panorama – sharply defining the landform features in the semi – arid
conditions, and rounding the hilltops under wetter condition.2.2.4.1 Gross State Domestic Product (GSDP)
Gross State Domestic Product (GSDP), as per the advance estimates, is expected to grow at 10.5 per
cent during the year 2010-11 as against 8.7 per cent during the previous year. Increased agricultural
production will help ‗Agriculture & Allied activities‘ sector to grow by 12.5 per cent as against growth
2.2.3 Demographical Features
2.2.3.1 Population
Detailed Project Report 4
YearGross Domestic Product (Rs in Crores)
Current Prices Constant Prices
2000 - 2001 252,283 242,615
2001 - 2002 273,188 252,438
2002 - 2003 299,479 269,621
2003 - 2004 340,600 291,197
2004 - 2005 413,826 413,826
2005 - 2006 483,222 473,801
2006 - 2007 581,725 540,750
2007 - 2008 679,004 599,062
2008 - 2009 756,334 619,291
2009 - 2010 901,330 701,550
2010 - 2011 1,029,621 775,020

CONSULTANCY SERVICES FOR PREPARATION OFFEASIBILITY REPORT, DPR PREPARATION, REPORT ONENVIRONMENTAL STUDIES AND OBTAINING MOEF
STUP Consultants Pvt. Ltd CLEARANCE AND BID PROCESS MANAGMENT FOR MUMBAI
COASTAL ROAD PROJECT
of 3.1 per cent in the earlier year. Industry sector is expected to grow by 9.1 per cent. Services sector
is expected to grow by 10.9 percent during the year.
GSDP at constant (2004-05) prices is Rs.7, 01,550 crore during 2009-10, as against Rs.6,45,492 crore
in 2008-09, showing an increase of 8.7 per cent as per the preliminary estimates. GSDP during 2009-
10 at current prices is Rs 9, 01,330 crore, showing an increase of 16.6 per cent over the previous year. 2.2.5 Economic Sectors
Since the early nineties, the Government of India has initiated a number of reform measures in
various sectors to liberalise the economy and make it conducive to rapid growth. As a result of
liberalisation, the economy is on a high growth path, reflected by low inflation rate and growing
foreign exchange reserve.
Agriculture
About 61% of the total population in the State depends on agriculture and Allied activities. Net
irrigated area is about 33.50lakh hectare. Principle crops grown in the State are rice, jawar, bajra,
wheat, tur, mung, udid, gram and other pulses. The State is a major producer of oilseeds, groundnut,
sunflower, soyabean, the major oil seed crops. Important cash crops are cotton, sugarcane, turmeric
and vegetables.
Sorgham, millet, and pulses dominate the cropped area. Rice grows where rainfall exceeds 40 inches,
and wheat is a winter crop in fields that retain moisture. Cotton, tobacco and peanuts are major crops
in areas having 24-39 inches of rainfall. Irrigation dams in rain-shadow areas have resulted in a rich
sugarcane yield. The State has also a large area under horticulture and has an area of 10.91 lakh
hectares under various fruit crops like mango, banana, orange, grape, cashewnut, etc.
Forest Cover
As per the ‘State of forest Report 2001’ published by Forest Survey of India, Dehradun, the forest
cover of Maharashtra is 47482 sq. km. being open forests with crown density falling between 10 to 40
percent. The forest cover in the state has been showing increasing trends in the 1997, 1999, and 2001
assessments. In the 2001 assessment, the increase in forest cover in the State has been recorded as
810 sq km over the 1999 assessment.
Minerals
Maharashtra is richly endowed within various minerals of industrial importance like manganese, coal,
iron ore, limestone, copper, bauxite, silica sand, and common salt. These minerals are found in
substantial quantities in the eastern districts with some deposits in the west. Bituminous coal are
found in the district of Bhandara, Nagpur and Chandrapur. Undersea oil deposits were discovered in
and near Mumbai in the 1970s. The mountainous region of the state is a virtual repository of rich
timber reserves.
Table2.2: Sector wise GSDP for Maharashtra
(As per Economy Survey of Maharashtra 20012-2013)
2.2.4.2 State Per Capita Income
The Per Capita Incomes for the state are presented in Table 2.3.
Table2.3: PCI for Maharashtra
Irrigation and Power
Detailed Project Report 5
Year Per Capita Income (Rs in Crores)Current Prices Constant Prices
2000 - 2001 22,777 21,892
2001 - 2002 24,035 22,258
2002 - 2003 26,015 23,447
2003 - 2004 29,139 24,859
2004 - 2005 35,915 35,915
2005 - 2006 41,624 40,947
2006 - 2007 49,568 46,158
2007 - 2008 57,218 50,532
2008 - 2009 62,454 51,053
YearSector Wise GSDP for Maharashtra
Primary Secondary Tertiary Total
2000 - 2001 40601 67558 144124 252283
2001 - 2002 44842 70164 159107 274113
2002 - 2003 45719 78382 176375 300476
2003 - 2004 52519 91722 197183 341424
2004 - 2005 52811 105092 229487 387390
2005 - 2006 59654 120861 257543 438058
2006 - 2007 70515 183640 330342 584497
2007 - 2008 84556 217684 382577 684817
2008 - 2009 81001 230921 442048 753970
2009 - 2010 93988 249698 512065 855751
2010 - 2011 132449 290766 611870 1035085
2011 - 2012 153630 331749 714168 1199547
Year Per Capita Income (Rs in Crores)
Current Prices Constant Prices
2009 - 2010 74,027 57,458
2010 - 2011 83,471 62,729

CONSULTANCY SERVICES FOR PREPARATION OFFEASIBILITY REPORT, DPR PREPARATION, REPORT ONENVIRONMENTAL STUDIES AND OBTAINING MOEF
STUP Consultants Pvt. Ltd CLEARANCE AND BID PROCESS MANAGMENT FOR MUMBAI
COASTAL ROAD PROJECT
By the end of June 1998, 33 major, 177 medium and about 1.835 state sector minor irrigation projects
have been completed. Another 27 major, 86 medium and 263 minor irrigation projects were under
construction. The gross irrigated area at the end of June 1998 was nearly 1997-98.
Tourist Centre
The important Tourist Centres in the state includes Ajanta, Ellora, Elephanta, Kanheri and Karla
caves, Mahabaleshwar, Matheran and Panchgani, Jawhar, Maishejghat, Amboli, chikaldara, Panhala
Hill Stations and religious places at Pandharpur, Nasik, Nanded, Audhanagnath. Trimbakeshwar,
Tuljapur, Ganpatipule, Bhimashankar, Harihareshwar and Shegaon.
Social and CommunityServices
Social development in Maharashtra has attained satisfactory level of success. Successive government
of the state has followed a development strategy by consciously investing in social development
sector like education, medical and public health. The social security measures introduced by the state
government were directed towards reducing income disparities and uplifting weaker segments.
Table 2.5: Category wise Vehicles
2.2.6 Transport Infrastructure
The transport system promotes the development of backward regions and integrating them with the
main stream economy by opening their opportunities to trade and investment; acquire new
knowledge, awareness and contributing their share of intellectual and financial wealth to the national
development.
Railways
Maharashtra has 5,465 km of railway routes of which about 4040 km is broad gauge, 510 km meter
gauge and 915 km is narrow gauge. Few projects that are being implemented are presented in table 2.6Table 2.4 Category wise Road Lengths
Table 2.6: Railway Projects in Maharashtra
Air transport
Maharashtra state has seen rapid growth in vehicle population in all categories due to rapid economic
growth. Number of vehicles registered in the state is presented in table 2.5 below.
Detailed Project Report 6

CONSULTANCY SERVICES FOR PREPARATION OFFEASIBILITY REPORT, DPR PREPARATION, REPORT ONENVIRONMENTAL STUDIES AND OBTAINING MOEF
STUP Consultants Pvt. Ltd CLEARANCE AND BID PROCESS MANAGMENT FOR MUMBAI
COASTAL ROAD PROJECT
Sea Ports
Mumbai Port at Mumbai and Jawaharlal Nehru Port Trust at Navi Mumbai is the major port in
Maharashtra. There are 54 minor ports in the state.
Maharashtra has a total of twenty-four Air fields/Airports. Out of these 17 are under the control of
the state Government, four are managed and controlled by the International Airport Authority /
Airport Authority of India and the remaining three are manned and managed by the Ministry of
Defence.
The Airports under the control of the State government are: Amaravati, Baramati, Chandrapur,
Dhule, Gondia, Jalgaon, Karad, Kolhapur, Kinwat, Latur, Nanded, Osmanabad, Phaltan, Ratnagiri,
Sangli, Solapur, and Yavatmal. At present these airfields have no facilities for the operation of
commercial flights.
However number of airports available for commercial operations is limited and traffic handled by
these is presented in Table 2.7.
Table 2.8: Major Ports In Maharashtra
Table 2.7: Airports
Maharashtra Maritime Board (MMB) has undertaken development of six non major ports. Out of
these six Damankhol- Jaigad port has become operational with two cargo berths in first phase and
Dighi port is ready for commissioning. The cargo berth is commissioned at Lavagan- Jaigad port in
April, 2012. Pre construction activities are in progress for Vijaydurg port, Rewas-Aware port and Redi
port. Cargo handling by non major ports is presented in Table 2.9.
Detailed Project Report 7

CONSULTANCY SERVICES FOR PREPARATION OFFEASIBILITY REPORT, DPR PREPARATION, REPORT ONENVIRONMENTAL STUDIES AND OBTAINING MOEF
STUP Consultants Pvt. Ltd CLEARANCE AND BID PROCESS MANAGMENT FOR MUMBAI
COASTAL ROAD PROJECT
Table 2.9: Cargo Handling by Non Major Ports petroleum and coal products, metal products and parts, machinery and equipment (except transport
equipment), transport equipments and parts, other manufacturing industries, repair of capital goods
and the water works.
Table 2.10: Industrial Projects Registered & Implemented in Maharashtra
2.2.7 Industry
With its key location, linking the northern and southern parts of the country, Maharashtra has firmly
established itself as India‘s most pro-business State. The State has been identified as the country‘s
powerhouse and Industrial sector and occupies a prominent position in the economy of Maharashtra.
Cotton textiles, textile products, paper and paper products are the largest and the oldest industry in
the state. Important centers of this industry are located at Mumbai, Pune, Aurangabad, Nagpur,
Chandrapur, Solapur, Akola, and Amravati; hand loomed goods are produced especially in and
around Nagpur and Solapur. Food products, breviaries, tobacco and related products, printing and
publishing, rubber, plastic, petroleum, cement and coal products, basic chemicals and chemical
products, metal products, and parts, machinery (except electrical machinery), electrical machinery,
apparatus and appliances, and transport equipment and parts contribute substantially to the industrial
production in the state.
As per the annual survey of industries, the State has more than 1/4th share in the value of output for
the country, in respect of the following industries: chemical and chemical products, rubber, plastics
Detailed Project Report 8
Years
Projects Registered Projects Implemented
No.
Inves
tmen
t
(in
Rs.
cro
re)
Tar
gete
d
Em
plo
ymen
t (i
n'0
00)
No.
Inves
tmen
t
(in
Rs.
cro
re)
Em
plo
ymen
t ge
ner
ated
(in
'000
)
(1) (2) (3) (4) (5) (6) (7)
*1991-92 778 20,673 150.53 441 11,8 64.9
1992-93 994 21,172 178.28 542 8,44 67.7
1993-94 1,480 18,092 229.65 850 9,67 80.9
1994-95 979 19,654 160.34 576 10,8 53.7
1995-96 1,077 20,780 210.35 611 10,6 44.6
1996-97 812 16,568 129.82 458 3,41 26.9
1997-98 576 6,947 84.54 347 2,83 24.8
1998-99 1,303 42,468 291.51 430 3,89 39.1
1999-2000 841 37,789 150.46 333 2,44 16.9
2000-01 724 15,114 120.17 273 1,58 15.2
2001-02 703 9,997 100.63 168 540 8.7
2002-03 ** 181 5,081 19.14 32 65 0.8
Total 10,448 2,34,335 1,825.41 5,061 670.46 444.7
CONSULTANCY SERVICES FOR PREPARATION OFFEASIBILITY REPORT, DPR PREPARATION, REPORT ONENVIRONMENTAL STUDIES AND OBTAINING MOEF
STUP Consultants Pvt. Ltd CLEARANCE AND BID PROCESS MANAGMENT FOR MUMBAI
COASTAL ROAD PROJECT
3. Socio-Economic Profile of the project influence area
3.1 Mumbai Metro City
3.1.1 Introduction
Looking to growth of Mumbai Metro City, Govt. of Maharashtra in addition to existing authorities
like MCGM established Mumbai Metropolitan Region Development Authority (MMRDA) under the
MMRDA Act 1974 primarily as planning and development authority for Mumbai Metropolitan
Region (MMR) whose boundaries are defined by the said Act and its subsequent amendment. The
present boundaries of MMR encompass a total area of 4,355 sq. km. MMR consists of the following
revenue units:
•
•
•
•
•
•
•
Mumbai City District
Mumbai Suburban District
Part of Thane District (comprising Thane, Kalyan, Bhiwandi and Ambernath Tehsils)
Part of Vasai Tehsil
Part of Raigad District
Uran Tehsil; and
Part of Panvel, Karjat, Khalapur, Pen and Alibaug Tehsils
Figure 3.1: Average High/Low Temperature for Mumbai
NOTE: THE DATA FOR CHARTS ABOVE ARE TAKEN FROM YEAR 2000 TO 2012.
3.1.3 Population3.1.2 Climate
Mumbai's 2013 population is estimated at 19 million, but its total metropolitan area is home to more
than 20.5 million. As with other metropolitan areas in India, Mumbai's population has grown very
rapidly over the past two decades, and much of its population are migrants from other regions in the
country who came seeking better employment opportunities.
Mumbai's population has nearly doubled since 1991, when its population was just 12.5 million. This
rapid expansion has led to serious health-related issues, and a large percentage of the population lives
in slums.
The number of people living in slums is estimated at 9 million, which is up from 6 million just a
decade ago. That means about 62% of all Mumbaiker‘s live in slums. Dharavi, the second largest slum
in Asia, is located in central Mumbai and is home to 800,000 to 1 million people in just 2.39 square
kilometers (or 0.92 square miles). This makes it one of the most densely populated areas on the planet
with a density of a minimum of 334,728 people per square kilometer. It's also the most literate slum in
India with a literacy rate of 69%.
Because land is at such a premium, residents of Mumbai frequently live in cheap, cramped housing far
from work, so there are usually long commutes necessary on its busy mass transit system
The Climate of Mumbai is a tropical wet and dry climate. Mumbai's climate can be best described as
moderately hot with high level of humidity. Its coastal nature and tropical location ensures
temperatures won't fluctuate much throughout the year.
The mean average is 27.2 °C and average precipitation is 242.2 cm (95.35 inches). The mean
maximum average temperatures in about 32 °C (90 °F) in summer and 30 °C (86 °F) in winter, while
the average minimums are 25 °C (77 °F) in summer and 20.5 °C (68.9 °F) in winter. Mumbai
experiences four distinct seasons: Winter (December–Feb); Summer (March–May); Monsoon (June–
Sep); and Post-Monsoon (Oct–Dec).
Detailed Project Report 9

CONSULTANCY SERVICES FOR PREPARATION OFFEASIBILITY REPORT, DPR PREPARATION, REPORT ONENVIRONMENTAL STUDIES AND OBTAINING MOEF
STUP Consultants Pvt. Ltd CLEARANCE AND BID PROCESS MANAGMENT FOR MUMBAI
COASTAL ROAD PROJECT
Table 3.1 MMR Population as per census of India 2011
3.1.4 Demographics
Mumbai is a real melting pot as people from all over the region move here in search of jobs. Mumbai,
like most metropolitan areas of India, has a large polyglot population and 16 major languages of India
are spoken here, including Gujarati, Hindi and Marathi, along with a colloquial form of Hindi called
Bambaiya.
Mumbai's sex ratio is skewed, and a ward-level analysis of the last Census in 2013 found that 20 of the
city's 24 municipal wards had a decline in child sex ratio in the past decade. The Worli-Prabhadevi
region had the highest drop in child sex ratio. For every 1,000 boys, there are just 899 girls. This
gender imbalance is visible throughout Mumbai and it's blamed on sex-selective abortions.
Figure 3.2: Average Rainfall for Mumbai
Note: The data for charts above are taken from year 2000 to 2012.
3.1.6 Socio Economic profile of MMR
MMR is highly urbanized area with more than 90% of the total population of 11.9 million as per2001
census and 12.4 million as per 2011 census is concentrated in cities and towns. The urban population
is however confined to 8 Municipal Corporations, 11 Municipal Councils and 10 Non Municipal
Towns. Total area under these urban units is about 1,500 sq. km. In the rest of the region, about 1
million population is spread over 950 village settlements. The demographic census gives population
and worker details according to 88 census sections in Greater Mumbai, for suitably defined wards in
other urban centres and for village as a whole in MMR.
3.1.5 Average Rainfall in Mumbai
The maximum annual rainfall ever recorded was 3,452 mm (136 in) for 1954. The highest rainfall
recorded in a single day was 944 mm (37 in) on 26 July 2005. The average total annual rainfall is
2,146.6 mm (85 in) for the Island City, and 2,457 mm (97 in) for the suburbs.
3.2 MMR Plan
The sanctioned Regional Plan for MMR 1996-2011, specifies the land-use for different parts of the
region. In this plan, urban development is categorized under two classes namely, U1 and U2 zone. U1
zone, constituting 19% of the total land denotes intensive and high density urban development,
whereas, U2 zone, constituting 5% of the total envisages relatively low density urban development.
U1 zone largely covers the existing Municipal Corporations, Municipal Councils and a few Non
Municipal Towns. U2 zone is generally showing the possible outgrowth of the cities and towns.
Detailed Project Report 10
Mumbai Metropolitan Total Male Female
Population 18,414,288 9,894,088 8,520,200
Literates 15,132,568 8,423,992 6,708,576
Children (0-6) 1,743,997 917,855 826,142
Average Literacy (%) 90.78 93.85 87.19
Sex Ratio 861
Child Sex Ratio 900

CONSULTANCY SERVICES FOR PREPARATION OFFEASIBILITY REPORT, DPR PREPARATION, REPORT ONENVIRONMENTAL STUDIES AND OBTAINING MOEF
STUP Consultants Pvt. Ltd CLEARANCE AND BID PROCESS MANAGMENT FOR MUMBAI
COASTAL ROAD PROJECT
Further, 3% of the land is placed under Industrial Zone, 1% under Port and Airport and 6% under
Recreation & Tourism Development Zone and National Park. The rest of the 66% of land-use is
distributed among Forest Zone (23%), Green Zone (39%), Coastal Wetland (3%) and Water body
(1%). The Regional Plan also provides estimates of population and its distribution in different parts of
MMR for the year 2011. Corresponding projections for the year 2021 and 2031 are also made by
MMRDA.
Under the notification dated 4th February, 2003, Matheran Municipal Council area and the
surrounding region are declared as Eco-Sensitive Zone (ESZ) imposing restriction on industries and
development activities in the said zone. The ESZ covers an area of 215 sq. Km. area and its Zonal
Master Plan is to be prepared to guide the development.
Dronagiri Node in Navi Mumbai developed by CIDCO is designated as a Special Economic Zones
(SEZ) and its plan is currently under preparation. There is a proposal to establish
domestic/international airport near Panvel town in Navi Mumbai.
The Region has a fairly well developed rail and road network. The rail network consists of suburban
and main line sections. The rail network connects most of the important urban areas. The road
network comprises Expressways, National Highways, State Highways, Major District Roads, other
District Roads and Village Roads. The village settlements are largely served by the road network and
state road bus transport services.
Comprehensive Transportation Study forMMR
Comprehensive Transportation Study (CTS) for Mumbai Metropolitan Region (MMR) has proposed
extensive transport network for the travel needs of MMR for the horizon period up to 2031. Some of
the proposed road corridors are missing links which can provide faster transport connectivity
between Greater Mumbai and rest of the region.
As per CTS for MMR, following Highway Network is recommended on the western flank of the
island city between Manora (MLA Hostel) area in the south to Malad- Versova in the north:
The recommended highway network comprises a significant road length running along the coastline
of the city. The road network envisages a road running along the coastline from Nariman Point in the
south to connect to Versova on the western flank of the city. Eastern Freeway runs along the eastern
coast of the island city between south Mumbai to connect to Chembur and further to link to the
eastern express highway at Ghatkopar. The proposed Sewri-Nhava Trans Harbour link (MTHL) will
establish connectivity between Sewri on the main land and Nhava on the main land. The MTHL with
the connecting road network and the multi modal Virar-Alibag corridor would complete a ring road
around Mumbai.
MCGM authorities decided to take the planning and construction of Coastal road. Approximate
length of the project corridor is about 35.6 km. The proposed Coastal road approximate length of the
project corridor is about 35.6 kms from Nariman Point to Kandivali Junction link road.
provides alignment of proposed Mumbai Coastal Road Project.
Figure 3.3
Table 3.2 Highway Corridor Description
Detailed Project Report 11
Sr. No Highway Corridor Description Length (kms)
H20 Western Sea Link North Extn (Bandra-Dahisar) 26
H21 Western Sea Link North Extn (Dahisar-Virar): EBL Corridor 2016 38
H22 WesternSea Link South Extn (Worli-ColabaSea Link) 13.7

CONSULTANCY SERVICES FOR PREPARATION OFFEASIBILITY REPORT, DPR PREPARATION, REPORT ONENVIRONMENTAL STUDIES AND OBTAINING MOEF
STUP Consultants Pvt. Ltd CLEARANCE AND BID PROCESS MANAGMENT FOR MUMBAI
COASTAL ROAD PROJECT
Figure 3.3: Alignment of Mumbai Coastal Road Project
Detailed Project Report 12

CONSULTANCY SERVICES FOR PREPARATION OFFEASIBILITY REPORT, DPR PREPARATION, REPORT ONENVIRONMENTAL STUDIES AND OBTAINING MOEF
STUP Consultants Pvt. Ltd CLEARANCE AND BID PROCESS MANAGMENT FOR MUMBAI
COASTAL ROAD PROJECT
•
•
•
•
•
Origin-Destination Survey
Turning Movement Survey
Axle Load Survey
Speed and Delay Survey
Topographic Survey
4. Methodology Adopted for the Study
4.1 General
Methodology adopted for the study was initially presented in Inception Report. Design methodology
relevant to each discipline is summarized in subsequent chapters.
Satellite Imagery data and Shuttle Radar Topography Mission (SRTM) covering project Area was
completed in May 2014.
Strategic Environmental and Social Assessment and Screening
Stage 2:
Various permits necessary for carrying out engineering surveys and investigations were required to be
obtained. The process of obtaining such permissions was started immediately after project inception.
However, specific permissions related to location of surveys could be started only after finalization of
preferred alignment alternative. Except security clearance from Indian Navy all significant permits
have been obtained for the project investigations. Status of detailed investigations is as follows:
4.1.1 Collection and Review of Secondary Data
The secondary data required for the development
primarily from MCGM. The secondary data includes:
Report on Coastal Road by Committee
of study was collected from various sources
•
•
•
•
•
•
•
CTS for MMR
Sub-surface and geo-technical data
Sources of construction material
Rainfall and flooding
Coastal wave data including storm surges
Data of Littoral drift
Admiralty Charts
• Topographic Survey: Completed
•
•
•
•
•
•
•
•
•
•
•
GPS survey: Completed
Total Station Survey: Completed
Bathymetry: Completed
Geotechnical Studies: Completed (Except Tunnels)
Material Investigation: Completed
Pavement Investigation: Completed
Inventory of Structures: Completed
Hydrological Survey: Completed
Utilities Survey: Ongoing
Environmental Monitoring: Completed
Social Survey: Completed
The data collected was reviewed to understand the project and the project influenced areas.
4.1.2 Reconnaissance Survey
The detailed ground reconnaissance was undertaken by STUP‘s team and MCGM‘s officers.
Identified alignments were visited to carry out ground reconnaissance survey. The data collected from
the reconnaissance surveys was used for planning and programming the detailed surveys and
investigations. All field studies are being undertaken on the basis of information derived from the
reconnaissance surveys.
4.1.3 Field Investigations
The field investigations are being conducted on the approved alignment of project highway.
Following surveys are being conducted on preferred alignment with their status as on 15 December
2012:
Stage 1:
4.1.4 Design Standards and Methodology
Primary objective of highway engineering is to design the project road as per the recommendations
provided in the Indian Road Congress (IRC) guidelines and international best practices. Proposed
design standards for the project road were presented at inception stage of the project through
Inception Report. The report is presented as Appendix—B to this report.
•
•
Traffic Surveys
Classified Volume Count Survey
Detailed Project Report 13

CONSULTANCY SERVICES FOR PREPARATION OFFEASIBILITY REPORT, DPR PREPARATION, REPORT ONENVIRONMENTAL STUDIES AND OBTAINING MOEF
STUP Consultants Pvt. Ltd CLEARANCE AND BID PROCESS MANAGMENT FOR MUMBAI
COASTAL ROAD PROJECT
As part of this study, a methodology as per IRC guidelines have been followed to assess the characteristics
of the traffic on the proposed Coastal road. The details pertaining to the data collection, primary as well as
secondary, and results from its analysis are presented in the following sections.
5. Traffic Studies and Analysis
5.1 Introduction
5.2.2 Traffic Surveys: Methodology5.1.1 General
Traffic surveys were planned along the major highways at locations of inner cordon lines of CTS. This is to
relate the current traffic with the CTS and update its impact on the project road. Seventeen locations were
identified on the nodes of these inner cordon lines with existing arterial roads. Proposed traffic survey
locations and its reasoning was presented and communicated to the MCGM for approval.
The map at Figure 5-1 provides the Inter Cordon lines of Mumbai as per CTS report and Figure 5-2
provides traffic survey locations.
To build reliability into data collections, increase of scope of work; video surveys were carried out at all
locations for a minimum three days out of seven days traffic count surveys. The data was then tabulated
and analysed as per IRC-102. The proposed Coastal Road shall act as a bypass to existing traffic network
being a completely new highway. It was necessary to establish traffic entering and exiting at each of the
proposed interchange location. The traffic will predominantly get diverted from the current road network
based on time and cost savings. Based on these parameters diversion factors were derived for each of the
Origin & Destination (OD) data.
Traffic studies are essential for any road project, as it forms the basis for design of the project. MMR has
seen rapid geographic and economic growth over past two decades. The increased vehicle population
which causes traffic congestions during peak hours. Comprehensive Transport Study (CTS) was carried out
in 2006 by MMRDA to establish transportation network necessary to cater for sustainable growth. Traffic
studies for the project were conducted to relate the findings with CTS and conclusions were drawn.
5.1.2 Objective
The consultancy services concentrates on evolving an economical and financially viable alignment to
connect Nariman Point to Kandivali Junction of the proposed Coastal Road Project. As part of activity
number 2.4 Part 1 of Terms of Reference (ToR), STUP has prepared this report to provide Traffic and
transportation planning studies for assessment of traffic on the
2033/2043.
The chapter presents, findings of traffic survey and its analysis.
project corridor for the period up to
5.1.3 Scope
• Conduct seven days traffic volume count manually.
• Conduct One day Origin - Destination Survey.
• Speed and Delay Survey.
Projected traffic based on estimated traffic growth rate of costal road for the next 30 years.
5.2 Traffic Surveys
5.2.1 Project Description
Mumbai isthe financial capital of India and has been a growth centre providing opportunities for all. The
city has seen migration from all parts of the country for work and better life. Mumbai Island and its
surrounding districts of Thane and Raigad have also seen development of new employment and residential
area. The Municipal Corporation of Greater Mumbai (MCGM) has been in forefront of creating a world
class city driven by its vision. A Comprehensive Transport Study (CTS) was undertaken to identify
transportation network for the growth horizon up to year 2044. Figure 5-1: Inner Cordon lines from CTS Report
The traffic survey locations as per Inner Cordon lines given in the CTS report are shown below:
35
Detailed Project Report 14

CONSULTANCY SERVICES FOR PREPARATION OFFEASIBILITY REPORT, DPR PREPARATION, REPORT ONENVIRONMENTAL STUDIES AND OBTAINING MOEF
STUP Consultants Pvt. Ltd CLEARANCE AND BID PROCESS MANAGMENT FOR MUMBAI
COASTAL ROAD PROJECT
Classification of vehicles as per IRC: SP: 19-2001 ―Manual for Survey, Investigation and Preparation of
Road Projects (Second Revision)‖ was adopted for counts and presented in Table 5-2.
Table 5-2: Vehicle Classification Systems Adopted
Figure 5-2: Traffic Survey Locations
5.2.2.1 Classified Traffic Volume Count at Mid-Block
Traffic surveys at Mid-Blocks were conducted at Seventeen locations presented in Table 5-1.
Table 5-1: Traffic Survey Locations
The Passenger Car Unit (PCU) recommended by IRC-106 "Guidelines for Capacity of Urban Roads in
plain Areas" which are presented inTable 5-3.
Table 5-3: Equivalent PCU’s
Detailed Project Report 15
Sr.
NoVehicle Type
Equivalent PCU Factors
Percentage composition of Vehicle
type in traffic stream
5% 10% and above
Fast Vehicles
1 Two wheelers, Motor cycle or scooter etc. 0.5 0.75
2 Passenger car, pick-up van 1 1
1 Kurar near Foot over bridge on NH 8
2 Shankarwadi on NH 8
3 Airport on NH 8
4 Santacruz Flyover on NH 8
5 Nanawathi Hospital on SV Road
6 Amboli on SV Road
7 Malad west on SV Road
8 Infinity mall on Link Road
9 Sea link
10 Worli dairy
11 Napean sea road
12 Peddar road
13 Marine drive
14 Dadabhai Naoroji Road
15 P D Mellow Road
16 Gokhale road
17 Mahim on SV Road
Category Type of Vehicles
Fast Moving Vehicles
Two Wheeler
Three Wheeler
Car/Jeep
BusBus
Mini Bus
LCV
Truck
2-Axle
3-Axle
Multi Axle
Agricultural TractorWith Trailer
Without Trailer
Slow Moving Vehicles
Cycle
Cycle Rickshaw
Animal Drawn Vehicles
Others

CONSULTANCY SERVICES FOR PREPARATION OFFEASIBILITY REPORT, DPR PREPARATION, REPORT ONENVIRONMENTAL STUDIES AND OBTAINING MOEF
STUP Consultants Pvt. Ltd CLEARANCE AND BID PROCESS MANAGMENT FOR MUMBAI
COASTAL ROAD PROJECT
The analysis of O-D data starts with coding of zones, i.e. categorising of the traffic with respect to its
origin and destination. These Origins and Destinations depending on their distance from the project road
are assigned to a region in terms of local, district and state. These regions are designated with unique code.
These codes are termed as Traffic Analysis Zones (TAZ). All important areas of traffic generating points
were assigned as local zones, immediate influence areas of the project road and districts were designated
with district level zones, and state beyond the project influence areas were assigned broadly into state level
zones. Total 26 zones were identified for the O-D survey analysis for the project road. The list of traffic
analysis zones and respective codes are provided in Table 5-4.
Table 5-4: Zoning System
Recording was done in a prescribed standard format as per IRC: SP: 19-2001 ―Manual for survey,
Investigation and Preparation of Road Projects (Second Revision)‖.
Daily traffic summary for all locations are provided in the appendix 'C'. Information in these sheets has
been compiled from the field data for both the directions in separate forms.
5.2.2.2 Origin Destination (O-D) Survey
Analysis was carried out to determine composition of traffic. The Origin–Destination surveys were carried
out at the same locations, where classified TVC were conducted. O-D surveys were conducted to
determine the travel characteristics by different modes of vehicles within the project area. The expected
traffic on any new bypass road is estimated as per IRC 102. Origin-Destination studies have been
conducted at the same place of volume count as per IRC guidelines. The different types of vehicles were
broadly divided into two categories as Passenger Vehicles and Goods Vehicles. Passenger vehicles
constitute mainly of two wheelers, three-wheelers, cars, jeeps, vans, buses & cycles. Goods vehicles
constitute light commercial vehicles, 2 - axle, 3-axle, multi – axle & tractor data was recorded based on the
above-mentioned categories as per IRC SP 19.
The O-D survey was carried out on a weekday (one day-24 hours) at each location, by roadside interview
method as described in IRC: 102-1988. Both passenger and commercial vehicles plying on the project road
were stopped on a random sampling basis and interviewed.
The information pertaining to origin and destination of trips collected during roadside interviews was
analysed to obtain the trip distribution based on a zoning system suitably designed for the present study.
Detailed Project Report 16
Local Code Place
1 CST, Churchgate
2 Mumbai Central, Grant Road, Charni Road
3 Marine Lines
4 Masjid, Sandhust Road
5 Elphiston Road, Lower Parel, Mahalaxmi
6 Byculla, Chinchpokli, Reay Road, Dockyard
7 Mahim, Sion, Matunga road, Dadar
8 Parel, Sewri, Curry Road, Cotton Green
9 Santacruz, Khar, Bandra
10 Chunabhatti, GTB Nagar, King Circle, Matunga, Wadala
11 Jogeshwari, Andheri, Vile Parle
12 Ghatkopar, Vidhyavihar, Chembur, Kurla, Govandi, Mankhurd
13 Malad, Goregaon
14 Mulund, Bhandup, Kanjur Marg, Vikhroli
15 Dahisar, Borivali, Kandivali
District Code
16 Navi Mumbai Region
17 Panvel-Uran Region, Pen-Alibagh Region, Neral-Karjat Region
18 Thane(Part of Thane Dist), North Eastern Region
19 Mira Bayander, North Western Region
Sr.
NoVehicle Type
Equivalent PCU Factors
Percentage composition of Vehicle
type in traffic stream
5% 10% and above
3 Auto-rickshaw 1.2 2
4 Light commercial vehicle 1.4 2
5 Truck or Bus 2.2 3.7
6 Agricultural Tractor Trailer 4 5
Slow Vehicles
7 Cycle 0.4 0.5
8 Cycle rickshaw 1.5 2
9 Tonga (Horse drawn vehicle) 1.5 2
10 Hand cart 2 3

CONSULTANCY SERVICES FOR PREPARATION OFFEASIBILITY REPORT, DPR PREPARATION, REPORT ONENVIRONMENTAL STUDIES AND OBTAINING MOEF
STUP Consultants Pvt. Ltd CLEARANCE AND BID PROCESS MANAGMENT FOR MUMBAI
COASTAL ROAD PROJECT
Figure 5-3: Traffic Zones - Internal
15 internal zones were been selected considering the Ward boundaries of Greater Mumbai along the
proposed road.
Figure 5-4: Traffic Zones - External
Detailed Project Report 17
Local Code Place
20 Rest of Thane District, Ahmedpur, Nashik, Dhule, Jalgaon, Nandurbar
21 Raigad, Ratnagiri, Sindhudurg, Kolhapur, Sangli, Solapur, satara, Pune
22 Rest of Maharastra
23 Gujarat, MP, Rajasthan
24 AP, TN, Kerala, Karnataka
25 UP, Haryana, Himachal Pradesh, Punjab, Jammu & Kashmir, Uttaranchal
26 Eastern States, Rest of India

CONSULTANCY SERVICES FOR PREPARATION OFFEASIBILITY REPORT, DPR PREPARATION, REPORT ONENVIRONMENTAL STUDIES AND OBTAINING MOEF
STUP Consultants Pvt. Ltd CLEARANCE AND BID PROCESS MANAGMENT FOR MUMBAI
COASTAL ROAD PROJECT
The travel characteristics obtained by O-D survey facilitate the classification of O-D travel pattern on the
project road.
Trained enumerators under the supervision of transport planners collected the trip characteristics using the
survey forms designed for this purpose. The travel characteristics obtained from O-D surveys identified
were analysed to obtain the trip distribution based on the zoning The Origin and Destination Matrix for all
the locations are given in Appendix-A.
Table 5-6: Directional Average Daily Traffic (ADT)
5.2.3 Traffic Surveys Data Analysis & Results
Summary of traffic survey data, its analysis and recommendations are presented in subsequent paragraphs.
5.2.3.1 Classified Traffic Volume Count at Mid-Blocks
Average Daily Traffic
Annual Average Daily Traffic
Average Daily Traffic (ADT) at all 17 locations is provided in Error! Reference source not found..
Directional average daily traffic is presented in Error! Reference source not found..
Table 5-5: Average Daily Traffic (ADT)
Detailed Project Report 18
Location ADT (In Nos) ADT ( In PCUs )
Kurar 184727 245648
Shankarwadi 216624 273544
Airport 270864 352508
Santacruz Flyover 222426 307166
Nanawati Hospital 66078 97955
Amboli 75026 104041
Malad west 38647 53464
Infinity mall 120235 164117
Sea link 49009 51544
Worli dairy 48699 49326
Napean sea road 30349 32161
Peddar road 81943 83947
Marine drive 53466 53354
Dadabhai Naoroji Road 59704 64882
P D Mellow Road 46008 49220
Gokhale road 37814 40252
Mahim 213769 220612
Location DirectionADT
(In Nos)ADT
( In PCUs )
Kurar
Borivali - Goregaon 94257 121564
Goregaon - Borivali 90471 124084
Shankarwadi
Andheri - Goregaon East 101064 128314
Goregaon East - Andheri 115560 145230
Airport
Chakala - Bandra 135970 177495
Bandra - Chakala 134894 175013
SantacruzFlyover
CST Airport - Bandra 110893 152955
Bandra - CST Airport 111532 154211
NanawathiHospital
Santa Cruz - Andheri 33583 50314
Andheri - Santa Cruz 32495 47640
AmboliGoregaon - Amboli 37546 51464
Amboli - Goregaon 37480 52578
Malad west
Malad Station - Goregaon 20192 28245
Goregaon - Malad Station 18456 25219
Infinity mall
Borivali - Goregaon (Infinity) 60195 81860
Goregaon - Borivali (Infinity) 60040 82257
Sea link
Worli - Bandra 24206 25320
Bandra - Worli 24803 26223
Worli dairyHaji Ali - Worli 23708 23720
Worli - Haji Ali 24991 25606
Napean SeaRoad
Haji Ali - MSRDC 15306 16204
MSRDC - Haji Ali 15043 15957
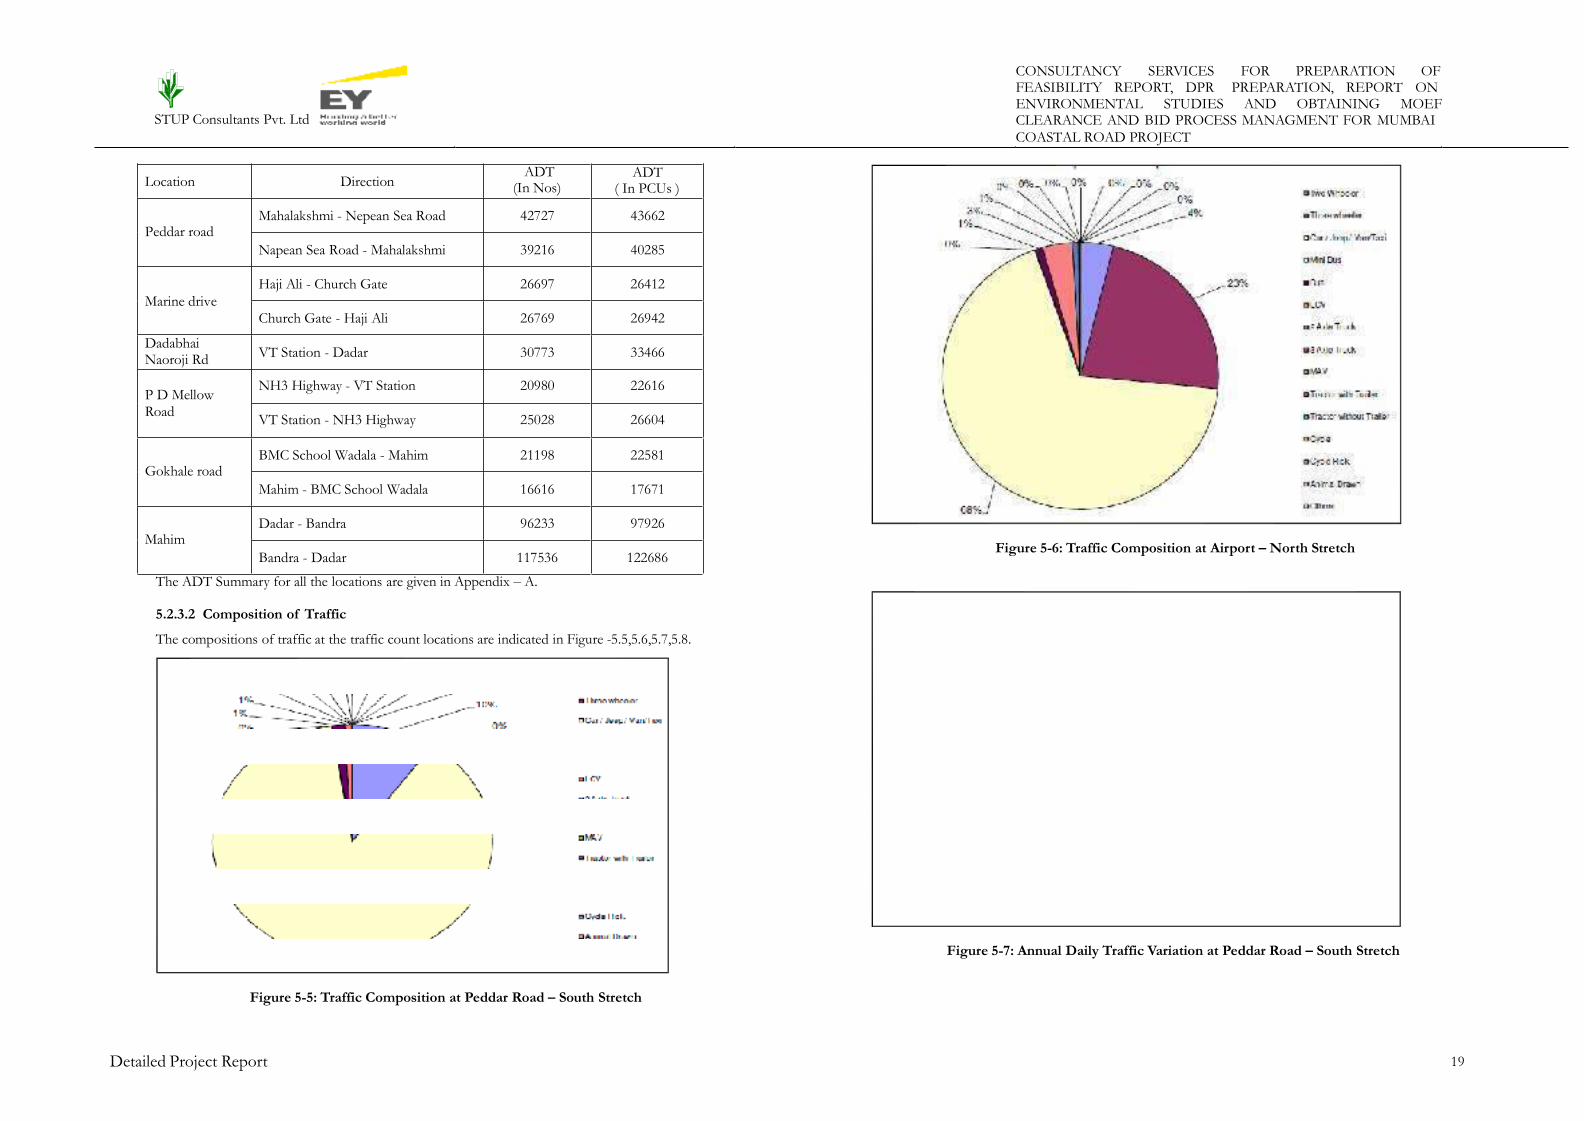
CONSULTANCY SERVICES FOR PREPARATION OFFEASIBILITY REPORT, DPR PREPARATION, REPORT ONENVIRONMENTAL STUDIES AND OBTAINING MOEF
STUP Consultants Pvt. Ltd CLEARANCE AND BID PROCESS MANAGMENT FOR MUMBAI
COASTAL ROAD PROJECT
( In PCUs )
Figure 5-6: Traffic Composition at Airport – North Stretch
The ADT Summary for all the locations are given in Appendix – A.
5.2.3.2 Composition of Traffic
The compositions of traffic at the traffic count locations are indicated in Figure -5.5,5.6,5.7,5.8.
Figure 5-7: Annual Daily Traffic Variation at Peddar Road – South Stretch
Figure 5-5: Traffic Composition at Peddar Road – South Stretch
Detailed Project Report 19
Location DirectionADT
(In Nos)ADT
Peddar roadMahalakshmi - Nepean Sea Road 42727 43662
Napean Sea Road - Mahalakshmi 39216 40285
Marine drive
Haji Ali - Church Gate 26697 26412
Church Gate - Haji Ali 26769 26942
DadabhaiNaoroji Rd
VT Station - Dadar 30773 33466
P D MellowRoad
NH3 Highway - VT Station 20980 22616
VT Station - NH3 Highway 25028 26604
Gokhale roadBMC School Wadala - Mahim 21198 22581
Mahim - BMC School Wadala 16616 17671
MahimDadar - Bandra 96233 97926
Bandra - Dadar 117536 122686

CONSULTANCY SERVICES FOR PREPARATION OFFEASIBILITY REPORT, DPR PREPARATION, REPORT ONENVIRONMENTAL STUDIES AND OBTAINING MOEF
STUP Consultants Pvt. Ltd CLEARANCE AND BID PROCESS MANAGMENT FOR MUMBAI
COASTAL ROAD PROJECT
(%)
Figure 5-8: Annual Daily Traffic Variation at Airport – North Stretch
For almost all the locations the composition shows predominance of light fast vehicles.
The share for light vehicles at various locations ranges from 88% at Santacruz Flyover to 99% at Worli
Dairy.
The composition of traffic for all the locations is pictorially indicated in Appendix-A.
5.2.3.3 Peak Hour Traffic volumes at Mid-Blocks
From the table showing Classified Average hourly traffic volumes for both the directions, the peak hour
traffic observed at surveyed locations are provided in table 5-7. Peak hours were observed; one as morning
peak hour and evening peak hour.
Table 5-7: Peak Hour traffic
(%)
Detailed Project Report 20
Sr. No.
LocationType of Peak
HourDuration
Peak Hour VolumePeak HourPercentage
No's PCU's No's (%)PCU's
1 Kurar
Morning 09:00 - 10:00 8798 11756 4.76 4.79
Evening 15:00 - 16:00 11907 15445 6.45 6.29
2 Shankarwadi
Morning 11:00 - 12:00 11972 15387 5.53 5.62
Evening 18:00 - 19:00 14744 17560 6.81 6.42
3 Airport
Morning 09:00 - 10:00 14861 19363 5.49 5.49
Evening 14:00 - 15:00 15685 20277 5.79 5.75
Sr. No.
LocationType of Peak
HourDuration
Peak Hour VolumePeak HourPercentage
No's PCU's No's (%)PCU's
4SantacruzFlyover
Morning 09:00 - 10:00 11081 15339 4.98 4.99
Evening 15:00 - 16:00 11992 16096 5.39 5.24
5NanawathiHospital
Morning 12:00 - 13:00 4095 6014 6.20 6.14
Evening 20:00 - 21:00 3932 5482 5.95 5.60
6 Amboli
Morning 09:00 - 10:00 2232 3024 2.98 2.91
Evening 16:00 - 17:00 6251 8699 8.33 8.36
7 Malad west
Morning 12:00 - 13:00 2119 2955 5.48 5.53
Evening 20:00 - 21:00 2547 3544 6.59 6.63
8 Infinity mall
Morning 08:00 - 09:00 6918 9364 5.75 5.71
Evening 20:00 - 21:00 6021 8186 5.01 4.99
9 Sea link
Morning 12:00 - 13:00 2625 2759 5.36 5.35
Evening 19:00 - 20:00 3174 3295 6.48 6.39
10 Worli dairy
Morning 10:00 - 11:00 3531 3584 7.25 7.27
Evening 19:00 - 20:00 3578 3573 7.35 7.24
11Napean sea road
Morning 12:00 - 13:00 1938 2029 6.39 6.31
Evening 19:00 - 20:00 2260 2468 7.45 7.67
12 Peddar road
Morning 11:00 - 12:00 5515 5650 6.73 6.73
Evening 17:00 - 18:00 5150 5237 6.28 6.24
13 Marine drive
Morning 09:00 - 10:00 3594 3644 6.72 6.83
Evening 16:00 - 17:00 3877 3859 7.25 7.23
14DadabhaiNaoroji Rd
Morning 12:00 - 13:00 3149 3360 5.27 5.18
Evening 18:00 - 19:00 3913 4298 6.55 6.62
15P D MellowRoad
Morning 11:00 - 12:00 3019 3248 6.56 6.60
Evening 16:00 - 17:00 2733 2937 5.94 5.97
16 Gokhale road
Morning 08:00 - 09:00 2759 2902 7.30 7.21
Evening 14:00 - 15:00 2580 2738 6.82 6.80
17 Mahim
Morning 06:00 - 07:00 15231 14966 7.12 6.78
Evening 16:00 - 17:00 14261 14737 6.67 6.68

CONSULTANCY SERVICES FOR PREPARATION OFFEASIBILITY REPORT, DPR PREPARATION, REPORT ONENVIRONMENTAL STUDIES AND OBTAINING MOEF
STUP Consultants Pvt. Ltd CLEARANCE AND BID PROCESS MANAGMENT FOR MUMBAI
COASTAL ROAD PROJECT
From the above table it is observed that peak hour traffic varies from 2.98% to 8.33% in Nos and
2.91% to 8.36% in PCUs.
For calculation 10% of AADT was considered for calculation of capacity of proposed road and
interchange arms.
The Hourly variation of traffic for all the locations is pictorially indicated in Appendix B1.
Table 5-8: Time of travel- Southward Journey Peak Hour (in Hour)
5.2.4 Speed and Delay Surveys
Speed and delay surveys were carried out from Kandivali to Nariman Point corridor taking in to
consideration existing fastest corridor for movement during peak and off-peak hours. This is to establish
current average speed and time delays. Benefit cost analysis as per IRC SP 30 based on Vehicle Operating
Costs (VOC) and time delays are basis for decision by a user to make use of the Project Road. Fuel prices
have been varying in Mumbai over past two year period, therefore Petrol price has been taken as Rs.
65/litre and Diesel Price as Rs 55/litre (Current Rates April 2016). Based on user survey, mileage for petrol
car has been taken as 12kmpl on congested road and 17kmpl on expressway and for diesel car 8Kmpl for
congested road and 11kmpl for an expressway respectively.
Therefore fuel cost savings per km travel on project road for petrol cars= (65/12)-(65/17) = Rs 1.61
Therefore fuel cost savings per km travel on project road for Diesel cars= (55/8)-(55/11) = Rs 1.875
Time savings may be monetised by as per IRC SP 30 at 2009 price base = Rs. 62.5 per hour
WPI for 2009=124.50
WPI for 2013=168.80
Therefore, time savings= (62.5x168.80)/124.50 =84.58, say Rs. 84/ per hour at 2013 price level.
Time Savings were calculated with consideration of time necessary to reach Project Road using existing
network. Bandra Worli Link being a tolled road, with construction of the Project Road to similar standards
as an extension, traffic on the Sea Link may only increase slightly due to impact of project road. Percentage
diversion for each location of survey for each Origin and Destination was considered.
Table 5-9: Distance of travel- Southward Journey Peak Hour (in Km)
Table 5-10: Time of travel- Northward Journey Peak Hour (in Hour)
5.2.4.1 Existing Road Speed Delay Analysis
3 trips from Kandivali to Nariman Point were carried out to establish the speed and delay data. During the
survey, noted down the travel time including actual running time and stopped delays. Zone wise travel time
matrix and distance travelled in both Southward Journey and Northward journey is presented in
Table 5 8, Table 5 9, Table 5 10 and Table 5 12.
Detailed Project Report 21
DESTINATION ZONES
OR
IGIN
ZO
NE
S
zone 15 13 11 9 7 5 2 3 1
15 - - - - - - - - -
13 0:15:00 - - - - - - - -
11 0:23:00 0:08:00 - - - - - - -
9 0:44:00 0:29:00 0:21:00 - - - - - -
7 0:54:00 0:39:00 0:31:00 0:10:00 - - - - -
5 1:18:00 1:03:00 0:55:00 0:34:00 0:24:00 - - - -
2 1:26:00 1:11:00 1:03:00 0:42:00 0:32:00 0:08:00 - - -
3 1:34:00 1:19:00 1:11:00 0:50:00 0:40:00 0:16:00 0:08:00 - -
1 1:44:00 1:29:00 1:21:00 1:00:00 0:50:00 0:26:00 0:18:00 0:10:00 -
DESTINATION ZONES
OR
IGIN
ZO
NE
S
Zone 15 13 11 9 7 5 2 3 1
15 - 5.59 9.36 17.43 29.04 32.49 36.09 37.19 43.19
13 - - 3.77 11.84 23.45 26.90 30.50 31.60 37.60
11 - - - 8.07 19.68 23.13 26.73 27.83 33.83
9 - - - - 11.61 15.06 18.66 19.76 25.76
7 - - - - - 3.45 7.05 8.15 14.15
5 - - - - - - 3.60 4.70 10.70
2 - - - - - - - 1.10 7.10
3 - - - - - - - - 6.00
1 - - - - - - - - -
DESTINATION ZONES
OR
IGIN
ZO
NE
S
zone 15 13 11 9 7 5 2 3 1
15 - 0:44:00 0:57:00 1:29:00 1:48:00 2:06:00 2:19:00 2:23:00 2:50:00
13 - - 0:13:00 0:45:00 1:04:00 1:22:00 1:35:00 1:39:00 2:06:00
11 - - - 0:32:00 0:51:00 1:09:00 1:22:00 1:26:00 1:53:00
9 - - - - 0:19:00 0:37:00 0:50:00 0:54:00 1:21:00
7 - - - - - 0:18:00 0:31:00 0:35:00 1:02:00
5 - - - - - - 0:13:00 0:17:00 0:44:00
2 - - - - - - - 0:04:00 0:31:00
3 - - - - - - - - 0:27:00
1 - - - - - - - - -
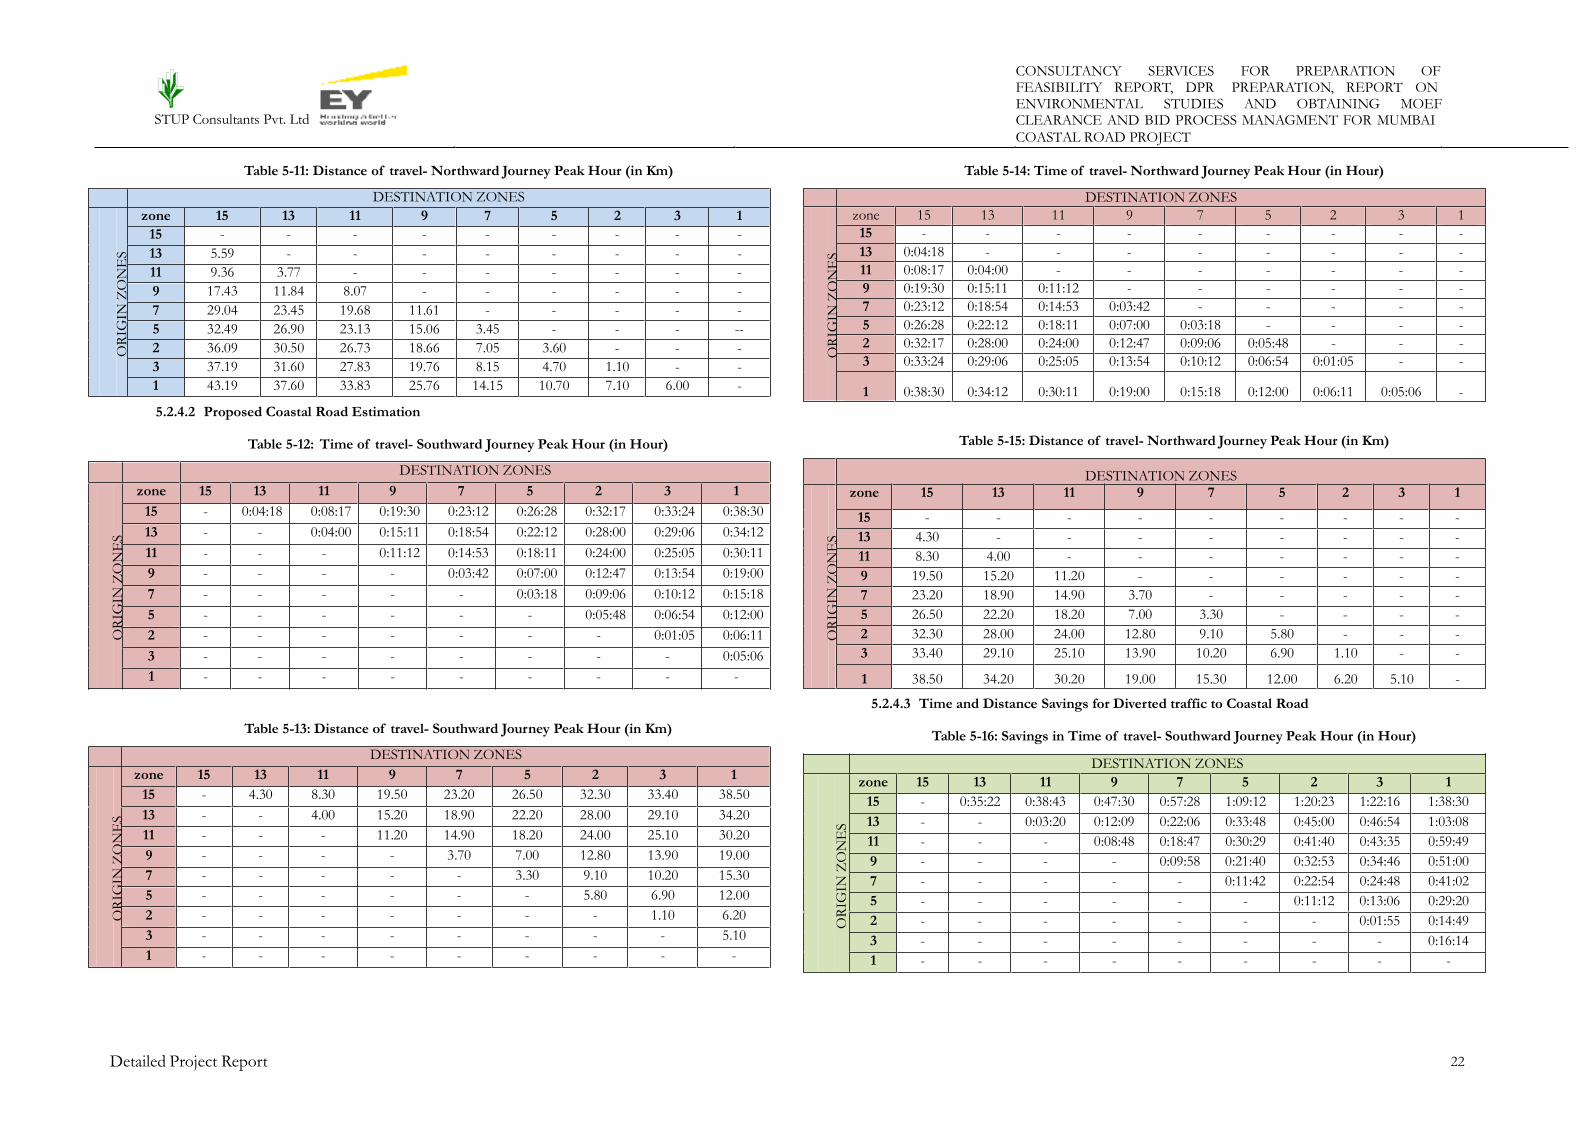
CONSULTANCY SERVICES FOR PREPARATION OFFEASIBILITY REPORT, DPR PREPARATION, REPORT ONENVIRONMENTAL STUDIES AND OBTAINING MOEF
STUP Consultants Pvt. Ltd CLEARANCE AND BID PROCESS MANAGMENT FOR MUMBAI
COASTAL ROAD PROJECT
Table 5-11: Distance of travel- Northward Journey Peak Hour (in Km) Table 5-14: Time of travel- Northward Journey Peak Hour (in Hour)
5.2.4.2 Proposed Coastal Road Estimation
Table 5-15: Distance of travel- Northward Journey Peak Hour (in Km)Table 5-12: Time of travel- Southward Journey Peak Hour (in Hour)
5.2.4.3 Time and Distance Savings for Diverted traffic to Coastal Road
Table 5-13: Distance of travel- Southward Journey Peak Hour (in Km)Table 5-16: Savings in Time of travel- Southward Journey Peak Hour (in Hour)
Detailed Project Report 22
DESTINATION ZONES
OR
IGIN
ZO
NE
S
zone 15 13 11 9 7 5 2 3 1
15 - 0:35:22 0:38:43 0:47:30 0:57:28 1:09:12 1:20:23 1:22:16 1:38:30
13 - - 0:03:20 0:12:09 0:22:06 0:33:48 0:45:00 0:46:54 1:03:08
11 - - - 0:08:48 0:18:47 0:30:29 0:41:40 0:43:35 0:59:49
9 - - - - 0:09:58 0:21:40 0:32:53 0:34:46 0:51:00
7 - - - - - 0:11:42 0:22:54 0:24:48 0:41:02
5 - - - - - - 0:11:12 0:13:06 0:29:20
2 - - - - - - - 0:01:55 0:14:49
3 - - - - - - - - 0:16:14
1 - - - - - - - - -
DESTINATION ZONES
OR
IGIN
ZO
NE
S
zone 15 13 11 9 7 5 2 3 1
15 - 4.30 8.30 19.50 23.20 26.50 32.30 33.40 38.50
13 - - 4.00 15.20 18.90 22.20 28.00 29.10 34.20
11 - - - 11.20 14.90 18.20 24.00 25.10 30.20
9 - - - - 3.70 7.00 12.80 13.90 19.00
7 - - - - - 3.30 9.10 10.20 15.30
5 - - - - - - 5.80 6.90 12.00
2 - - - - - - - 1.10 6.20
3 - - - - - - - - 5.10
1 - - - - - - - - -
DESTINATION ZONES
OR
IGIN
ZO
NE
S
zone 15 13 11 9 7 5 2 3 1
15 - 0:04:18 0:08:17 0:19:30 0:23:12 0:26:28 0:32:17 0:33:24 0:38:30
13 - - 0:04:00 0:15:11 0:18:54 0:22:12 0:28:00 0:29:06 0:34:12
11 - - - 0:11:12 0:14:53 0:18:11 0:24:00 0:25:05 0:30:11
9 - - - - 0:03:42 0:07:00 0:12:47 0:13:54 0:19:00
7 - - - - - 0:03:18 0:09:06 0:10:12 0:15:18
5 - - - - - - 0:05:48 0:06:54 0:12:00
2 - - - - - - - 0:01:05 0:06:11
3 - - - - - - - - 0:05:06
1 - - - - - - - - -
DESTINATION ZONES
OR
IGIN
ZO
NE
S
zone 15 13 11 9 7 5 2 3 1
15 - - - - - - - - -
13 4.30 - - - - - - - -
11 8.30 4.00 - - - - - - -
9 19.50 15.20 11.20 - - - - - -
7 23.20 18.90 14.90 3.70 - - - - -
5 26.50 22.20 18.20 7.00 3.30 - - - -
2 32.30 28.00 24.00 12.80 9.10 5.80 - - -
3 33.40 29.10 25.10 13.90 10.20 6.90 1.10 - -
1 38.50 34.20 30.20 19.00 15.30 12.00 6.20 5.10 -
DESTINATION ZONES
OR
IGIN
ZO
NE
S
zone 15 13 11 9 7 5 2 3 1
15 - - - - - - - - -
13 0:04:18 - - - - - - - -
11 0:08:17 0:04:00 - - - - - - -
9 0:19:30 0:15:11 0:11:12 - - - - - -
7 0:23:12 0:18:54 0:14:53 0:03:42 - - - - -
5 0:26:28 0:22:12 0:18:11 0:07:00 0:03:18 - - - -
2 0:32:17 0:28:00 0:24:00 0:12:47 0:09:06 0:05:48 - - -
3 0:33:24 0:29:06 0:25:05 0:13:54 0:10:12 0:06:54 0:01:05 - -
1 0:38:30 0:34:12 0:30:11 0:19:00 0:15:18 0:12:00 0:06:11 0:05:06 -
DESTINATION ZONES
OR
IGIN
ZO
NE
S
zone 15 13 11 9 7 5 2 3 1
15 - - - - - - - - -
13 5.59 - - - - - - - -
11 9.36 3.77 - - - - - - -
9 17.43 11.84 8.07 - - - - - -
7 29.04 23.45 19.68 11.61 - - - - -
5 32.49 26.90 23.13 15.06 3.45 - - - --
2 36.09 30.50 26.73 18.66 7.05 3.60 - - -
3 37.19 31.60 27.83 19.76 8.15 4.70 1.10 - -
1 43.19 37.60 33.83 25.76 14.15 10.70 7.10 6.00 -

CONSULTANCY SERVICES FOR PREPARATION OFFEASIBILITY REPORT, DPR PREPARATION, REPORT ONENVIRONMENTAL STUDIES AND OBTAINING MOEF
STUP Consultants Pvt. Ltd CLEARANCE AND BID PROCESS MANAGMENT FOR MUMBAI
COASTAL ROAD PROJECT
Table 5-17: Savings in Distance of travel- Southward Journey Peak Hour (in Km) 5.2.4.4 Cost Savings for Diverted traffic to Coastal Road
Estimated Total Cost Savings inclusive of Time savings (Monetised), Distance Savings (Monetised) and
Vehicle Operating Cost Savings
Total Cost Savings = Cost of travel time savings + Cost of distance saved + Cost of savings in vehicle
operation cost
Table 5-20: Cost savings in Rupees - Southward Direction Travel (Peak Hour)
Table 5-18: Savings in Time of travel- Northward Journey Peak Hour (in Hour)
Table 5-21: Cost savings in Rupees - Northward Direction Travel (Peak Hour)
Table 5-19: Savings in Distance of travel- Northward Journey Peak Hour (in Km)
5.2.5 Origin Destination (O-D) Survey
One day O-D Survey was conducted at the locations of TVC surveys. The surveys are essential to estimate
likely traffic volumes on new links.
The influencing traffic corridors related to the project road is shown below:
Detailed Project Report 23
DESTINATION ZONES
OR
IGIN
ZO
NE
S
zone 15 13 11 9 7 5 2 3 1
15 - - - - - - - - -
13 1.29 - - - - - - - -
11 1.06 -0.23 - - - - - - -
9 -2.07 -3.36 -3.13 - - - - - -
7 5.84 4.55 4.78 7.91 - - - - -
5 5.99 4.7 4.93 8.06 0.15 - - - -
2 3.79 2.5 2.73 5.86 -2.05 -2.2 - - -
3 3.79 2.5 2.73 5.86 -2.05 -2.2 0 - -
1 4.69 3.4 3.63 6.76 -1.15 -1.3 0.9 0.9 -
DESTINATION ZONES
OR
IGIN
ZO
NE
S
zone 15 13 11 9 7 5 2 3 1
15 - - - - - - - - -
13 26.79 - - - - - - - -
11 54.32 27.51 - - - - - - -
9 44.40 17.63 -9.86 - - - - - -
7 133.46 106.63 79.14 89.02 - - - - -
5 154.72 127.89 100.40 110.32 21.26 - - - -
2 146.25 119.24 91.93 101.85 12.85 -8.41 - - -
3 157.29 130.47 102.97 112.89 23.84 2.57 11.04 - -
1 180.61 154.10 126.60 136.52 47.46 26.20 34.67 23.63 -
DESTINATION ZONES
OR
IGIN
ZO
NE
S
zone 15 13 11 9 7 5 2 3 1
15 - - - - - - - - -
13 0:07:42 - - - - - - - -
11 0:30:03 0:22:20 - - - - - - -
9 0:31:10 0:23:29 0:01:08 - - - - - -
7 0:40:48 0:33:06 0:10:47 0:09:38 - - - - -
5 0:54:52 0:47:08 0:24:49 0:23:40 0:14:02 - - - -
2 0:57:23 0:49:40 0:27:20 0:26:13 0:16:34 0:02:32 - - -
3 1:06:16 0:58:34 0:36:15 0:35:06 0:25:28 0:11:26 0:08:55 - -
1 1:13:10 1:05:28 0:43:09 0:42:00 0:32:22 0:18:20 0:15:49 0:06:54 -
DESTINATION ZONES
OR
IGIN
ZO
NE
S
Zone 15 13 11 9 7 5 2 3 1
15 - 55.61 63.35 61.42 150.82 160.37 170.21 173.96 207.00
13 - - 7.72 5.82 95.17 114.00 114.38 118.31 151.67
11 - - - -1.88 87.47 106.30 106.86 110.61 143.96
9 - - - - 89.37 108.23 108.79 112.54 145.89
7 - - - - - 18.83 19.44 23.14 56.49
5 - - - - - - 0.61 4.31 37.66
2 - - - - - - - 3.75 33.63
3 - - - - - - - - 33.35
1 - - - - - - - - -
DESTINATION ZONES
OR
IGIN
ZO
NE
S
zone 15 13 11 9 7 5 2 3 1
15 - 1.29 1.06 -2.07 5.84 5.99 3.79 3.79 4.69
13 - - -0.23 -3.36 4.55 4.7 2.5 2.5 3.4
11 - - - -3.13 4.78 4.93 2.73 2.73 3.63
9 - - - - 7.91 8.06 5.86 5.86 6.76
7 - - - - - 0.15 -2.05 -2.05 -1.15
5 - - - - - - -2.2 -2.2 -1.3
2 - - - - - - - - 0.9
3 - - - - - - - - 0.9
1 - - - - - - - - -

CONSULTANCY SERVICES FOR PREPARATION OFFEASIBILITY REPORT, DPR PREPARATION, REPORT ONENVIRONMENTAL STUDIES AND OBTAINING MOEF
STUP Consultants Pvt. Ltd CLEARANCE AND BID PROCESS MANAGMENT FOR MUMBAI
COASTAL ROAD PROJECT
• Influencing Traffic Corridors
Figure 5-10: Influencing Traffic Corridor – North End
Central part – Diverted traffic mainly from
• Santacruz Flyover
• Bandra -Worli Sea Link
Southern side – Diverted traffic mainly from
• Marine Drive
• Dadabhai Naoroji RoadFigure 5-9: Traffic Influencing Corridors
Northern side – Diverted traffic mainly from• P D Mellow Road
• Link Road• Khan Abdul Gaffar Khan Road
• S V Road• Napean Sea Road
• Western Express Highway (NH 8)• Peddar road
• Gokhale Road
Detailed Project Report 24

CONSULTANCY SERVICES FOR PREPARATION OFFEASIBILITY REPORT, DPR PREPARATION, REPORT ONENVIRONMENTAL STUDIES AND OBTAINING MOEF
STUP Consultants Pvt. Ltd CLEARANCE AND BID PROCESS MANAGMENT FOR MUMBAI
COASTAL ROAD PROJECT
Except for Wards A, C, P & R, which are located at northern and southern ends, rest of the wards are
located in the middle with significant movement.
Figure 5-11: Influencing Traffic Corridor – South End
5.2.5.1 O-D Analysis
From O-D matrix was derived for each of the 17 traffic survey locations. Based on Speed and Delay
analysis percentage diversion was assigned to each O-D in the matrix to derive the actual percentage of
traffic getting diverted at the survey location. Percentage diverted traffic for each survey location is
presented in Table. The diverted traffic shall reach the project road through proposed interchanges.
Therefore, this traffic has been assigned to each of the proposed interchange location based on O-D.
From both the ends it is observed that major generating / attracting zones are - Wards A, C, GS, H, K, D,
Gh, P and R. These wards account for more than 70% of movement pattern.
Detailed Project Report 25

CONSULTANCY SERVICES FOR PREPARATION OFFEASIBILITY REPORT, DPR PREPARATION, REPORT ONENVIRONMENTAL STUDIES AND OBTAINING MOEF
STUP Consultants Pvt. Ltd CLEARANCE AND BID PROCESS MANAGMENT FOR MUMBAI
COASTAL ROAD PROJECT
Table 5-22: Total Diversions to Coastal Road at each Traffic Survey Location based on O-D related Cost Savings
Detailed Project Report 26
Location AADT All VehiclesAADT Divertible
VehiclesZone ID Productions % Attractions % Productions AADT Attractions AADT
Total Diverted
Traffic Both
Directions
KurarIn No's 184727 105029
13A 69% 62%24068 22720 46788
IN PCU 245648 133532 30600 28886 59486
ShankarwadiIn No's 216624 123727
11A 28% 26%3577 3101 6678
IN PCU 273544 153075 4426 3836 8262
AirportIn No's 270864 198981
9A 7% 7%1785 1244 3029
IN PCU 352508 221792 1990 1386 3376
Santacruz FlyoverIn No's 222426 146282
9B 7% 10%401 1724 2125
IN PCU 307166 194527 533 2293 2825
Nanawati HospitalIn No's 66078 28486
11C 42% 43%1677 1425 3102
IN PCU 97955 32868 1935 1645 3579
AmboliIn No's 75026 34811
11B 26% 26%1214 1584 2797
IN PCU 104041 44396 1548 2020 3568
Malad westIn No's 38647 16827
13B 69% 60%3891 3237 7128
IN PCU 53464 20366 4710 3917 8627
Infinity mallIn No's 120235 46177
13C 71% 69%10663 9699 20362
IN PCU 164117 54571 12602 11462 24064
Sea linkIn No's 49009 45544
9C 46% 45%5195 3843 9038
IN PCU 51544 47397 5407 4000 9406
Worli dairyIn No's 48699 46723
5 7% 8%581 453 1035
IN PCU 49326 47845 595 464 1059
Napean sea roadIn No's 30349 24518
2B 8% 8%38 502 540
IN PCU 32161 27788 43 569 612
Peddar roadIn No's 81943 73967
2A 4% 4%685 533 1218
IN PCU 83947 77967 722 562 1284
Marine driveIn No's 53466 45069
3 8% 8%633 1067 1700
IN PCU 53354 47057 661 1114 1775
Dadabhai Naoroji Road In No's 59704 51270 1B 18% 52% 0 0 0

CONSULTANCY SERVICES FOR PREPARATION OFFEASIBILITY REPORT, DPR PREPARATION, REPORT ONENVIRONMENTAL STUDIES AND OBTAINING MOEF
STUP Consultants Pvt. Ltd CLEARANCE AND BID PROCESS MANAGMENT FOR MUMBAI
COASTAL ROAD PROJECT
Detailed Project Report 27
Location AADT All VehiclesAADT Divertible
VehiclesZone ID Productions % Attractions % Productions AADT Attractions AADT
Total Diverted
Traffic Both
Directions
IN PCU 64882 58556 0 0 0
P D Mellow RoadIn No's 46008 36641
1A 15% 61%0 0 0
IN PCU 49220 38516 0 0 0
Gokhula roadIn No's 37814 27077
7B 15% 14%573 244 817
IN PCU 40252 32200 682 290 971
MahimIn No's 213769 143830
7A 8% 8%1515 1582 3097
IN PCU 220612 168148 1771 1850 3621

CONSULTANCY SERVICES FOR PREPARATION OFFEASIBILITY REPORT, DPR PREPARATION, REPORT ONENVIRONMENTAL STUDIES AND OBTAINING MOEF
STUP Consultants Pvt. Ltd CLEARANCE AND BID PROCESS MANAGMENT FOR MUMBAI
COASTAL ROAD PROJECT
5.2.6 Traffic Demand Forecast Table 5-23: Growth of Registered Vehicles in Maharashtra
5.2.6.1 Growth Factor
Traffic Growth on a road facility is generally estimated on the basis of historical trends. Demand changes
are usually because of shifts in the pattern of economic activities in the surrounding regions. Theproposed
coastal road is from Princes Flyover to Kandivali Junction link road. Hence, future traffic estimation
necessitates a preview, however imprecise, of the probable pattern of future growth of the economy of the
country and particularly Greater Mumbai. CTS was carried out for the MMR in 2008 to establish various
parameters. The study concentrates in updating the findings of the CTS related to the impact of the
Coastal Road and extend the horizon period from 2031 to 2043.
It may be noted that the Coastal Road will be mainly used by city traffic particularly by cars and taxis
between southern end at Princes Flyover and northern end at Kandivali. The access points are provided
through 12 interchanges, four along southern stretch between Princes Flyover and BWSL and eight along
northern stretch between BWSL and Kandivali. However it is expected that with another proposed link
between NH 348 near Gavan Phata extended to coastal road by Worli Sewri link, some amount of traffic
from / to Navi Mumbai and Raigad will be loaded on the Coastal Road. Moreover, the development
potential along the study corridor is quite restricted. In that situation, the growth of registered vehicles,
especially cars and taxis, will be the guiding factor for traffic projection. The analysis of the secondary data
indicates that;
The number of total registered vehicles in Maharashtra (2008-2012) is growing at 11.46% per annum
(Table 5.22).
The main influence area of the corridor has been considered as Greater Mumbai Region and Rest of MMR
covering Thane, Kalyan, Vashi, Navi Mumbai and Vasai. Overall increase in registered vehicles (2008-
2012) in these regions is 8.46% and 8.99% respectively (Table 5.23).
While the number of cars and taxis in Maharashtra is growing at 12.69% per annum, the growth of the
same in Greater Mumbai (2010-2012) is 8.30% per annum:
Table 5-24: Growth of Registered Vehicles in Greater Mumbai and Thane Region
Since global economic downturn and high growth of Pune, population growth of Mumbai Island and
MMR has slowed down significantly. Growth of traffic in CTS report was estimated based on almost linear
growth in population till 2031. However due to economic downturn, competition by surrounding cities
and acute rise in property prices the population growth of MMR has stabilised over past decade. This
means that organic increase in the population was compensated by migration from MMR. However, it is
expected that with correction property price, the inventory of unsold houses on market will be sold out
Detailed Project Report 28
Year Total Registered Cars and Taxis as on31stMarch
Greater Mumbai Thane
2010 598,710 465,270
2011 637,332 499,978
2012 702,157 537,275
Growth per Annum (2010-2012) 8.30% 7.46%

CONSULTANCY SERVICES FOR PREPARATION OFFEASIBILITY REPORT, DPR PREPARATION, REPORT ONENVIRONMENTAL STUDIES AND OBTAINING MOEF
STUP Consultants Pvt. Ltd CLEARANCE AND BID PROCESS MANAGMENT FOR MUMBAI
COASTAL ROAD PROJECT
over next 5 to 8 years along with new projects mainly aimed at low income and middle income groups. It is
unlikely that the actual population growth in MMR will match organic growth in population. Therefore, an
increase in population by 5% is assumed over next two decades, mostly towards Navi Mumbai.
Table 5-25: Growth Rates in Different Scenarios
• Per Capita Trip Rates (PCTR)
The trip rates observed during CTS study and provided in the report are given below:
However for estimation capacity an overall growth rate of 2% has been considered.
The projected traffic is shown in Appendix.
5.2.7 Lane Capacity
Capacity analysis is fundamental to planning, design and operation of roads. Among other things, it
provides the basis for determining the number of traffic lanes to be provided for different road sections
having regard to volume, composition and other parameters of traffic. Alternatively, for an existing road
network, the capacity analysis provides a means of assessing the traffic carrying ability of the number of
traffic lanes provided for a given road link under the prevailing roadway and traffic conditions. Capacity
standards can therefore help in rational evaluation of the investments needed for further road construction
and improvements.
Level of Service:
As per IRC– 106:1990 ―Guidelines for Capacity of Urban roads in plain areas‖. LOS is defined as a
qualitative measure describing operational conditions within a traffic stream, and their perception by
drivers/passengers. Under prevailing circumstances LOS B is considered an appropriate target. The
volume of traffic will be 70% of the max. Capacity and this is taken as the ―design service volume‖. In the
LOS B condition is in the zone of stable flow, with the drivers still having reasonable freedom to select
their desire speed and manoeuvre within the traffic stream below. Construction of additional east-west
links will result in significant increase in traffic volume along the coastal road considering overall traffic
growth in MMR
Figure 5-12: Trip Rates from CTS Report
However, considering that coastal road traffic will mainly comprise of cars only the growth rate of traffic
will be governed by car ownership. Car ownership per 1000 population in 2011 was 139 cars for MMR.
CTS has estimated the car ownership of 204 cars per 1000 population of MMR in 2021 and 266 cars per
1000 population of MMR in 2031. However, considering estimates for other cities it is likely that Car
ownership in MMR shall stabilise at 180 cars per 1000 population by 2031. Considering this along with 5%
increase in population over next two decades and 3% growth thereafter till 2041, the growth in car traffic
has been estimated as,
Year
2014 to 2024
2024 to 2034
2034 to 2043
Growth
20.86%
18.13%
03.00%
The same has adopted for projection of traffic growth over Horizon period up to 2043.
Detailed Project Report 29
Year Growth Scenario – Per Annum (%)
2015 -2019 3.00
2020 - 2024 2.72
2025 - 2029 2.30
2030 - 2034 1.32
2035 - 2039 0.30
2040 - 2043 0.30
Overall Growth 1.67

CONSULTANCY SERVICES FOR PREPARATION OFFEASIBILITY REPORT, DPR PREPARATION, REPORT ONENVIRONMENTAL STUDIES AND OBTAINING MOEF
STUP Consultants Pvt. Ltd CLEARANCE AND BID PROCESS MANAGMENT FOR MUMBAI
COASTAL ROAD PROJECT
Figure 5-13: Interchange Locations
Figure 5-14: Link Traffic between Interchanges – Base Year 2014
Detailed Project Report 30

CONSULTANCY SERVICES FOR PREPARATION OFFEASIBILITY REPORT, DPR PREPARATION, REPORT ONENVIRONMENTAL STUDIES AND OBTAINING MOEF
STUP Consultants Pvt. Ltd CLEARANCE AND BID PROCESS MANAGMENT FOR MUMBAI
COASTAL ROAD PROJECT
Figure 5-15: Interchange Locations
Figure 5-16: Link Traffic between Interchanges – Horizon Year 2044
Detailed Project Report 31

CONSULTANCY SERVICES FOR PREPARATION OFFEASIBILITY REPORT, DPR PREPARATION, REPORT ONENVIRONMENTAL STUDIES AND OBTAINING MOEF
STUP Consultants Pvt. Ltd CLEARANCE AND BID PROCESS MANAGMENT FOR MUMBAI
COASTAL ROAD PROJECT
Table 5-26: Lane Capacity – North Bound Carriageway
Detailed Project Report 32

CONSULTANCY SERVICES FOR PREPARATION OFFEASIBILITY REPORT, DPR PREPARATION, REPORT ONENVIRONMENTAL STUDIES AND OBTAINING MOEF
STUP Consultants Pvt. Ltd CLEARANCE AND BID PROCESS MANAGMENT FOR MUMBAI
COASTAL ROAD PROJECT
Table 5-27: Lane Capacity – South Bound Carriageway
Detailed Project Report 33

CONSULTANCY SERVICES FOR PREPARATION OFFEASIBILITY REPORT, DPR PREPARATION, REPORT ONENVIRONMENTAL STUDIES AND OBTAINING MOEF
STUP Consultants Pvt. Ltd CLEARANCE AND BID PROCESS MANAGMENT FOR MUMBAI
COASTAL ROAD PROJECT
5.2.9 Interchanges
Interchanges will be necessary at all crossings of highway which are to be developed as completely access
controlled. An interchange may be justified at the crossing of a major arterial road with another road of
similar category carrying heavy traffic.
We have studied the requirement of traffic interchanges at the major junctions on project corridor as per
IRC: 92-1985 (Guidelines for the design of Interchanges in Urban Areas) and IRC: SP: 41-1994
(Guidelines for the Design of At- Grade Intersections in Rural and Urban Areas) etc.
These studies are the base for deciding many components like approach width & exit width, approach &
exit angles etc. However, the objective of the present study is to assess the Directional Traffic volumes at
the proposed interchanges.
Traffic flow diagrams for the twelve interchanges separately for the base year (2014) and horizon year
(2043) are studied and given below. Figure 5-17: Proposed Interchange Locations
5.2.9.2 Directional Traffic Volumes
Directional traffic for proposed interchanges are given below:5.2.9.1 Proposed Interchange Locations
The proposed Interchanges Locations for coastal road are listed below:
• Jagannath Bhosle Marg
• Exit on Marine Drive
• Amarsons Garden Interchange
• Haji Ali Interchange
• Bandra Worli Sea Link Interchange (Worli)
• Bandra Worli Sea Link Interchange (Bandra)
• Otters Club interchange
• Carter Road Interchange ( Danda Village)
• Ritumbara College Interchange
• MADH Island Interchange (Institute of Fisheries Education)
• Oshiwara Interchange
• Malad InterchangeFigure 5-18: Jagannath Bhosale Marg Interchange (AADT in PCU’s)
• Kandivali Interchange
Detailed Project Report 34

CONSULTANCY SERVICES FOR PREPARATION OFFEASIBILITY REPORT, DPR PREPARATION, REPORT ONENVIRONMENTAL STUDIES AND OBTAINING MOEF
STUP Consultants Pvt. Ltd CLEARANCE AND BID PROCESS MANAGMENT FOR MUMBAI
COASTAL ROAD PROJECT
Figure 5-19: Princess Street Flyover Interchange (AADT in PCU’s) (Phase-II) Figure 5-21: Amarsons Garden Interchange (AADT in PCU’s) (Phase-II)
Figure 5-20: Princess Street Flyover Interchange (AADT in PCU’s) (Phase-I)
Note: If Phase-II does not occur, Capacity at Princess Street flyover will reach 5% growth rate by 2022
(Fig 5-20).
Figure 5-22: Haji Ali Interchange (AADT in PCU’s)
Detailed Project Report 35

CONSULTANCY SERVICES FOR PREPARATION OFFEASIBILITY REPORT, DPR PREPARATION, REPORT ONENVIRONMENTAL STUDIES AND OBTAINING MOEF
STUP Consultants Pvt. Ltd CLEARANCE AND BID PROCESS MANAGMENT FOR MUMBAI
COASTAL ROAD PROJECT
Figure 5-25: Carter Road Interchange (Danda Village) (AADT in PCU’s)Figure 5-23: Bandra Worli Sea Link Interchange (Worli) (AADT in PCU’s)
Figure 5-26: Ritumbhara College Interchange (AADT in PCU’s)
Figure 5-24: Bandra Worli Sea Link Interchange (Bandra) (AADT in PCU’s)
Detailed Project Report 36

CONSULTANCY SERVICES FOR PREPARATION OFFEASIBILITY REPORT, DPR PREPARATION, REPORT ONENVIRONMENTAL STUDIES AND OBTAINING MOEF
STUP Consultants Pvt. Ltd CLEARANCE AND BID PROCESS MANAGMENT FOR MUMBAI
COASTAL ROAD PROJECT
Figure 5-29: Malad Interchange (AADT in PCU’s)Figure 5-27: MADH island Interchange (Institute of Fisheries Education) (AADT in PCU’s)
Figure 5-30: Kandivali Interchange (AADT in PCU’s)Figure 5-28: Oshiwara Interchange (AADT in PCU’s)
Detailed Project Report 37

CONSULTANCY SERVICES FOR PREPARATION OFFEASIBILITY REPORT, DPR PREPARATION, REPORT ONENVIRONMENTAL STUDIES AND OBTAINING MOEF
STUP Consultants Pvt. Ltd CLEARANCE AND BID PROCESS MANAGMENT FOR MUMBAI
COASTAL ROAD PROJECT
Table 5-28: Peak Hour Link Traffic/Hr/Lane (Towards South) The projected link traffic is shown in Appendix.
Table 5-29: Peak Hour Link Traffic/Hr/Lane (Towards North)
Detailed Project Report 38
Link 2014 2019 2024 2029 2034 2039 2044
1 - B 910 1005 1110 1225 1353 1493 1649
A - B 739 816 901 995 1098 1213 1339
B - 2 1649 1821 2011 2220 2451 2706 2988
2 - 3 1686 1861 2055 2268 2505 2765 3053
3 - 4 2555 2821 3114 3438 3796 4191 4627
4 - C 2674 2952 3259 3598 3973 4386 4843
C -5 2727 3011 3324 3670 4052 4474 4940
5 - 6 2552 2818 3111 3435 3793 4187 4623
6 - 7 2340 2584 2853 3150 3477 3839 4239
7 - 8 2128 2350 2594 2864 3162 3491 3855
8 - 9 1968 2173 2399 2649 2925 3229 3565
9 - 10 1640 1811 2000 2208 2438 2691 2972
10 -11 1313 1449 1600 1767 1951 2154 2378
Link 2014 2019 2024 2029 2034 2039 2044
11-10 1313 1449 1600 1767 1951 2154 2378
10-9 1640 1811 2000 2208 2438 2691 2972
9-8 1968 2173 2399 2649 2925 3229 3565
8-7 2674 2952 3259 3598 3973 4386 4843
7-6 2340 2584 2853 3150 3477 3839 4239
6 - 5 2587 2857 3154 3482 3845 4245 4686
5 - C 2727 3011 3324 3670 4052 4474 4940
C - 4 2674 2952 3259 3598 3973 4386 4843
4 - 3 2555 2821 3114 3438 3796 4191 4627
3 - 2 1686 1861 2055 2268 2505 2765 3053
2 - B 1649 1785 1971 2176 2403 2653 2929
B - A 739 816 901 995 1098 1213 1339
B -1 910 1005 1110 1225 1353 1493 1649

CONSULTANCY SERVICES FOR PREPARATION OFFEASIBILITY REPORT, DPR PREPARATION, REPORT ONENVIRONMENTAL STUDIES AND OBTAINING MOEF
STUP Consultants Pvt. Ltd CLEARANCE AND BID PROCESS MANAGMENT FOR MUMBAI
COASTAL ROAD PROJECT
5.3 Traffic Dispersal Scheme of Existing Network
Traffic diversions calculated in the report are based on minimum improvement to the current roads
through which traffic dispersal is likely to take place. However, some improvement will be necessary to
cater for changes to the traffic flow directions. Existing road network influenced by the proposed road at
each interchange is described in subsequent paragraphs along with proposed improvements.
5.3.1 Amarson Garden
The proposed interchange connects exiting road at Amarson Garden to proposed alignment. This trumped
interchange will connect the traffic on Bhulabhai Desai Marg (Warden Road). This interchange will give
the connectivity to traffic from kalvadevi, Girgaon, Bhuleswar, Malabar Hill, Kemp‘s Corner Area. Entry
ramp of this junction start from Tara Garden and exit ramp end near to the U. S. Federal Government
Building on existing Bhulabhai Desai Road. This interchange has 4 free flow movement of traffic between
existing road and proposed costal road without any traffic conflict. Figure 5-31 shows the connectivity and
traffic movement between existing road and proposed road networks. Figure 5-32 shows the traffic
dispersal scheme for the interchange.
Figure 5-32: Traffic Dispersal Scheme – Amarson Garden Interchange
Proposed network development scheme for the catchment of
Comprehensive Mobility Plan has been reproduced in Figure 5-33.
is appended in Table 5-30.
Amarson Garden Interchange from
Summary of the development scheme
Figure 5-31: Directional Traffic Movement –Amarson Garden Interchange
Figure 5-33 : Network Development Scheme – Amarson Garden Interchange
Detailed Project Report 39
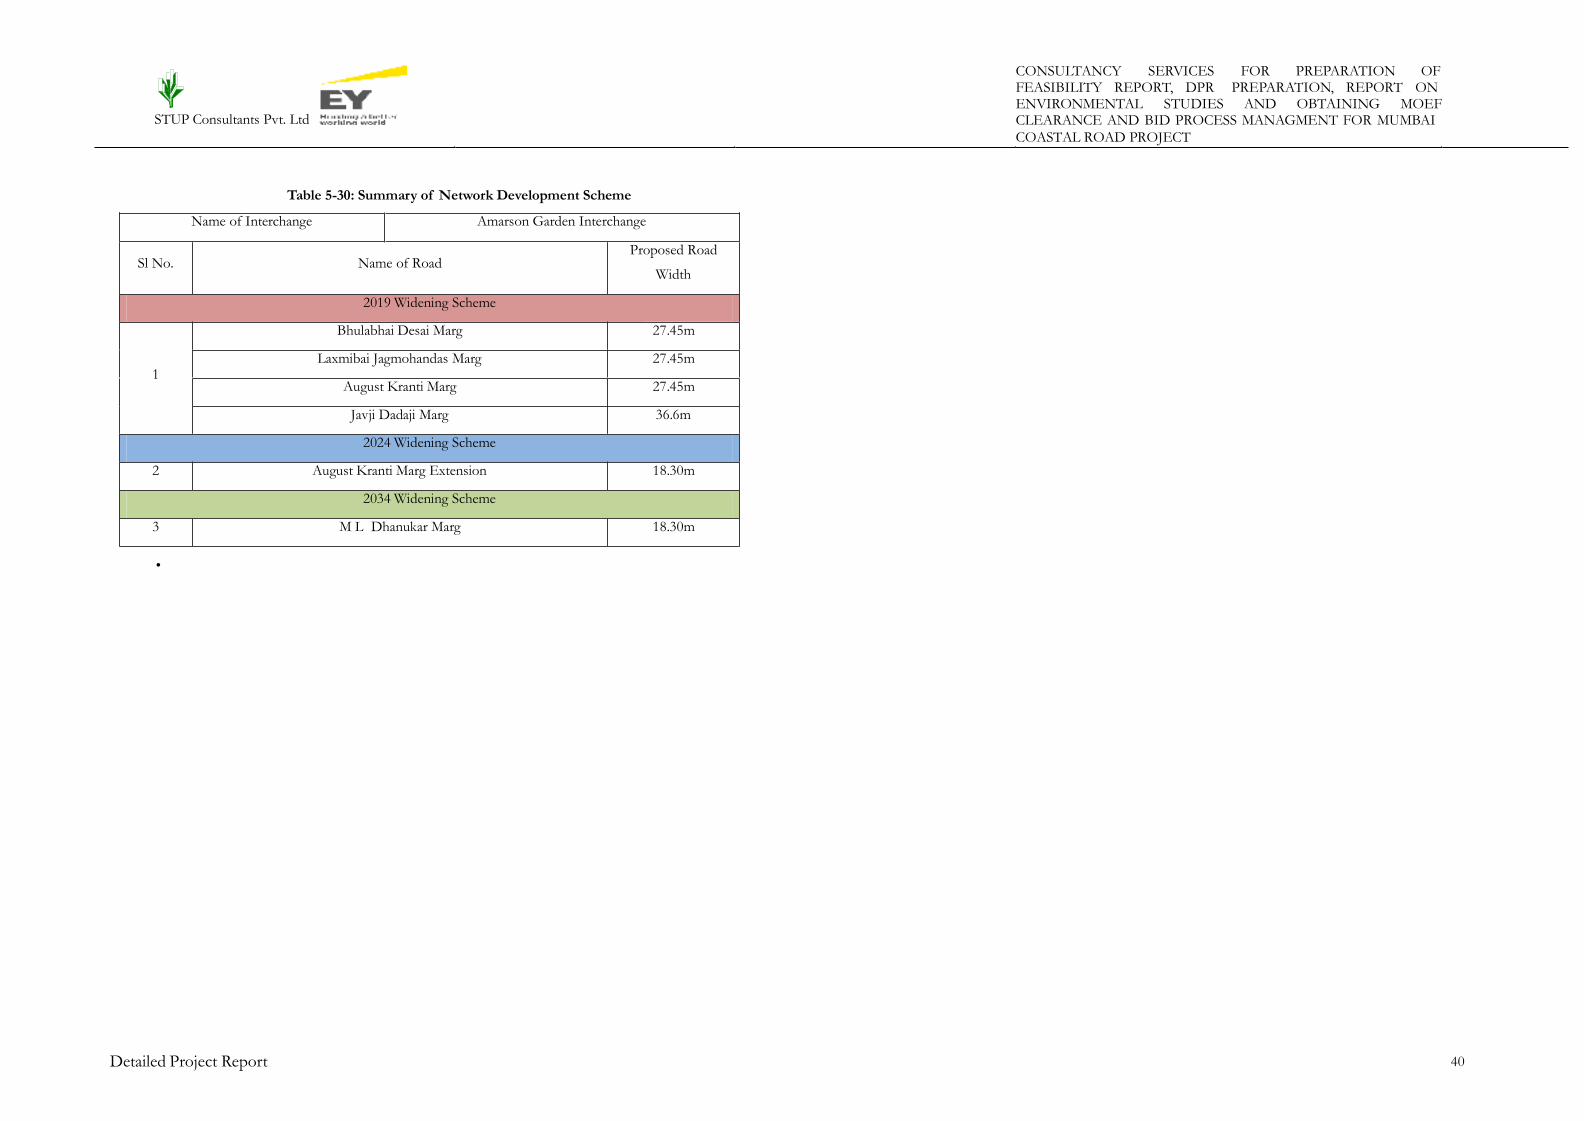
CONSULTANCY SERVICES FOR PREPARATION OFFEASIBILITY REPORT, DPR PREPARATION, REPORT ONENVIRONMENTAL STUDIES AND OBTAINING MOEF
STUP Consultants Pvt. Ltd CLEARANCE AND BID PROCESS MANAGMENT FOR MUMBAI
COASTAL ROAD PROJECT
Table 5-30: Summary of Network Development Scheme
•
Detailed Project Report 40
Name of Interchange Amarson Garden Interchange
Sl No. Name of RoadProposed Road
Width
2019 Widening Scheme
1
Bhulabhai Desai Marg 27.45m
Laxmibai Jagmohandas Marg 27.45m
August Kranti Marg 27.45m
Javji Dadaji Marg 36.6m
2024 Widening Scheme
2 August Kranti Marg Extension 18.30m
2034 Widening Scheme
3 M L Dhanukar Marg 18.30m

CONSULTANCY SERVICES FOR PREPARATION OFFEASIBILITY REPORT, DPR PREPARATION, REPORT ONENVIRONMENTAL STUDIES AND OBTAINING MOEF
STUP Consultants Pvt. Ltd CLEARANCE AND BID PROCESS MANAGMENT FOR MUMBAI
COASTAL ROAD PROJECT
• Junction Development Scheme-
Junctions need to be developed are:
Mukesh Chowk (Bhulabhai Desai Marg –Neapean Sea Road – August Kranti Marg)
existing road,
Average
i.
PCU/hr
requested toAverage
improvement
Detailed Project Report41
Junction Name Mukesh Chowk (Bhulabhai Desai Marg –Neapean Sea Road – August Kranti Marg)
Road Details LOS - Existing road (2019)
Proposed development
Scheme (2019)
LOS - After improvement (2019)
Road Segment Type of RoadWidth of
road segment
Existing RoadConfiguration
Traffic From Coastal Road,
PCU/hr
Design Capacity of
existing road,
PCU/hr
V/C ratio LOS
Traffic From Coastal Road,
PCU/hr
Design Capacity of
existing road,V/C ratio LOS
Remarks
Bhulabhai DesaiMarg
Arterial Road 14m 4 lane divided 1221 3600 0.34
B- AboveAverage
Proposes 6 lane divided road
1221 5400 0.23
B- Above Site visit
check the availability of land
Neapean Sea Road Arterial Road 14m 4 lane divided 1221 3600 0.34
B- Above Average
1221 5400 0.23
B- Above Average
for the proposed
Road Details LOS - Existing road (2014)
Proposed development
Scheme (2014)
LOS - After improvement (2014)
RemarksRoad Segment Type of Road
Width of road
segment
Existing RoadConfiguration
Traffic From Coastal Road,
PCU/hr
Design Capacity of
existing road,
PCU/hr
V/C ratio LOS
Traffic From Coastal Road,
PCU/hr
DesignCapacity of
PCU/hr
V/C ratio LOS
Bhulabhai Desai Marg Arterial Road 14m 4 lane divided 1054 3600 0.29
B- AboveAverage
Minor improvements like installation of road
furniture‘s (Signages & Markings).
1054 3600 0.29
B- AboveAverage -
Neapean Sea Road Arterial Road 14m 4 lane divided 1054 3600 0.29
B-
AboveAverage
1054 3600 0.29
B-
Above-
August Kranti Marg Arterial Road 14m 4 lane divided 1054 3600 0.29
B-
AboveAverage
1054 3600 0.29
B-
AboveAverage
-

CONSULTANCY SERVICES FOR PREPARATION OFFEASIBILITY REPORT, DPR PREPARATION, REPORT ONENVIRONMENTAL STUDIES AND OBTAINING MOEF
STUP Consultants Pvt. Ltd CLEARANCE AND BID PROCESS MANAGMENT FOR MUMBAI
COASTAL ROAD PROJECT
Above
Capacity of
PCU/hr
Above
-
Average
Above
Capacity of
PCU/hr
requested to
Above Average
Above Average
Detailed Project Report 42
Junction Name Mukesh Chowk (Bhulabhai Desai Marg –Neapean Sea Road – August Kranti Marg)
Road Segment
LOS- Horizon Year (2043)
Proposed development Scheme (2043)
LOS- After Improvement Horizon Year (2043)
RemarksTraffic from
Coastal Road,
PCU/hr
Design Capacity of
existing road,
PCU/hr
V/C ratio LOS
Traffic From Coastal Road,
PCU/hr
Design
existing road,
V/C ratio LOS
Bhulabhai DesaiMarg
2557 5400 0.47C -
AverageProposes 8 lane divided road 2557 7200 0.36
B -Above Average
Site visit
check the availability of land for the proposed
improvement
Neapean Sea Road 2557 5400 0.47C -
AverageProposes 8 lane divided road 2557 7200 0.36
B -
August Kranti Marg 2557 5400 0.471C -
AverageProposes 8 lane divided road 2557 7200 0.36
B -
Junction Name Mukesh Chowk (Bhulabhai Desai Marg –Neapean Sea Road – August Kranti Marg)
Road Details LOS (2024)
Proposed development
Scheme (2024)
LOS (2034)
Proposed development
Scheme (2034)Road Segment Type of RoadWidth of
road segment
Existing RoadConfiguration
Traffic From Coastal Road,
PCU/hr
Design Capacity of
existing road,
PCU/hr
V/C ratio LOS
Traffic From Coastal Road,
PCU/hr
Design
existing road, V/C ratio LOS
Bhulabhai Desai Marg Arterial Road 14m 4 lane divided 1415 5400 0.26
B-
AboveAverage
Minor improvements like
installation of proper road Signages & Markings
1903 5400 0.26
B-
Average
Minor improvements like installation of proper road
Signages & Markings
Neapean Sea Road Arterial Road 14m 4 lane divided 1415 5400 0.26
B- AboveAverage
1903 5400 0.26
B
Above
August Kranti Marg Arterial Road 14m 4 lane divided 1415 5400 0.26
B- AboveAverage
1903 5400 0.26
B-
Average
August Kranti Marg Arterial Road 14m 4 lane divided 1221 3600 0.34
B-
Above
Average
1221 5400 0.23
B-
Average

CONSULTANCY SERVICES FOR PREPARATION OFFEASIBILITY REPORT, DPR PREPARATION, REPORT ONENVIRONMENTAL STUDIES AND OBTAINING MOEF
STUP Consultants Pvt. Ltd CLEARANCE AND BID PROCESS MANAGMENT FOR MUMBAI
COASTAL ROAD PROJECT
ii.
• Adeshir B Godrej Chowk
Above
Above
furniture‘s (Signages &
Average
Capacity
road,
-
-
-
Detailed Project Report 43
Junction Name Adeshir B Godrej Chowk
Road Details LOS (2024)
Proposed development
Scheme (2024)
LOS (2034)
Proposed developmentScheme (2034)Road Segment Type of Road
Width of road
segment
Existing RoadConfiguration
Traffic From Coastal Road,
PCU/hr
Design Capacity
of existing
road, PCU/hr
V/Cratio
LOSTraffic From Coastal Road,
PCU/hr
Design Capacity of
existing road, PCU/hr
V/Cratio
LOS
August Kranti Marg Arterial Road 14m 4 lane divided 1221 5400 0.23
B- AboveAverage
Minor improvements like installation
of road furniture‘s (Signages & Markings).
1903 5400 0.35
B-
Average
Minor improvements like installation of road
Markings).
Peddar Road Arterial Road 15m 4 lane divided 1221 5400 0.23
B- AboveAverage
1903 5400 0.35
B-
Average
Ridges Road( Service Road)
Arterial Road 7m two lane 1221 3600 0.34
B- AboveAverage
1903 3600 0.53C -
Junction Name Adeshir B Godrej Chowk
Road Segment
LOS- Horizon Year (2043)
Proposed development
Scheme (2043)
LOS- After Improvement Horizon Year (2043)
RemarksTraffic from
Coastal Road, PCU/hr
Design Capacity of
existing road, PCU/hr
V/C ratio LOS
Traffic From
Coastal Road,
PCU/hr
Design
of existing
PCU/hr
V/C ratio LOS
August Kranti Marg 2557 5400 0.47C
- AverageProposes 8 lane
divided road2557 7200 0.36
B
Above Average
Site visit requested to check the availability of land for the proposed improvement
Peddar Road 2557 5400 0.47C
- AverageProposes 8 lane
divided road2557 7200 0.36
B
Above Average
Ridges Road( Service Road)
2557 3600 0.71
D- BelowAverage
Proposes 6 lane divided road
2557 5400 0.47
B
Above Average

CONSULTANCY SERVICES FOR PREPARATION OFFEASIBILITY REPORT, DPR PREPARATION, REPORT ONENVIRONMENTAL STUDIES AND OBTAINING MOEF
STUP Consultants Pvt. Ltd CLEARANCE AND BID PROCESS MANAGMENT FOR MUMBAI
COASTAL ROAD PROJECT
• Warden Road- Peddar Road Chowk
PCU/hr
Excellent
Excellent
Capacity of
PCU/hr
Capacity of
PCU/hr
Detailed Project Report 44
Junction Name Warden Road- Peddar Road Chowk
Road Details LOS - Existing road (2019)
Proposed developmentScheme (2019)
LOS - After improvement (2019)
RemarksRoad Segment Type of Road
Width of road
segment
Existing RoadConfiguration
Traffic From Coastal Road,
PCU/hr
Design Capacity of
existing road,
PCU/hr
V/C ratio LOS
Traffic From
Coastal Road,
PCU/hr
Design
existing road,
V/C ratio LOS
Warden Road Arterial Road 14m 4 lane divided 236 3600 0.07A-
ExcellentMinor improvements like
installation of road furniture‘s (Signages &
Markings).
236 3600 0.07A-
Excellent
-
Peddar Road Arterial Road 15m 4 lane divided 236 3600 0.07A-
Excellent
236 3600 0.07A-
Excellent
-
Road Details LOS (2024)
Proposed developmentScheme (2024)
LOS (2034)
Proposed developmentScheme (2034)Road Segment Type of Road
Width of road
segment
Existing RoadConfiguration
Traffic From Coastal Road,
PCU/hr
Design Capacity of
existing road,
PCU/hr
V/C ratio LOS
Traffic From
Coastal Road,
PCU/hr
Design
existing road,
V/C ratio LOS
Warden Road Arterial Road 14m 4 lane divided 274 3600 0.08A-
Excellent
.
368 3600 0.10A-
Excellent
-
Peddar Road Arterial Road 15m 4 lane divided 274 3600 0.08A-
Excellent368 3600 0.10
A-
Excellent
Road Details LOS - Existing road (2014)
Proposed developmentScheme (2014)
LOS - After improvement (2014)
RemarksRoad Segment
Type ofRoad
Width of road
segment
Existing RoadConfiguration
Traffic From Coastal Road,
PCU/hr
Design Capacity of
existing road, PCU/hr
V/Cratio
LOS
Traffic From
Coastal Road,
PCU/hr
Design Capacity of
existing road,V/C ratio LOS
Warden Road Arterial Road 14m 4 lane divided 204 3600 0.06
A-
Excellent
Minor improvements like installation of road
furniture‘s (Signages & Markings).
204 3600 0.06
A- -
Peddar Road Arterial Road 15m 4 lane divided 204 3600 0.06
A-
Excellent
Minor improvements like installation of road
furniture‘s (Signages & Markings).
204 3600 0.06
A- -

CONSULTANCY SERVICES FOR PREPARATION OFFEASIBILITY REPORT, DPR PREPARATION, REPORT ONENVIRONMENTAL STUDIES AND OBTAINING MOEF
STUP Consultants Pvt. Ltd CLEARANCE AND BID PROCESS MANAGMENT FOR MUMBAI
COASTAL ROAD PROJECT
Detailed Project Report 45
Junction Name Warden Road- Peddar Road Chowk
RoadSegment
LOS- Horizon Year (2043)
Proposed developmentScheme (2043)
LOS- After Improvement Horizon Year (2043)
RemarksTraffic from Coastal Road,
PCU/hr
Design Capacity of existing road,
PCU/hrV/C ratio LOS
Traffic From CoastalRoad, PCU/hr
Design Capacity of existing road, PCU/hr
V/C ratio LOS
WardenRoad
496 3600 0.14A -
ExcellentNo improvement necessary - - - -
-
Peddar Road 496 3600 0.14A -
ExcellentNo improvement necessary - - - -

CONSULTANCY SERVICES FOR PREPARATION OFFEASIBILITY REPORT, DPR PREPARATION, REPORT ONENVIRONMENTAL STUDIES AND OBTAINING MOEF
STUP Consultants Pvt. Ltd CLEARANCE AND BID PROCESS MANAGMENT FOR MUMBAI
COASTAL ROAD PROJECT
5.3.2 Haji Ali Chowk
This Junction is most important interchange to provide connection for religious place and business area.
Interchange connects to existing Lala Lajpatrai Marg. Interchange will provide the entry and exit
connection for both traffic coming from south and north of Mumbai. This will provide the connectivity to
the Mumbai Central Terminus, Cumballa Hill, Tardeo, Tulsiwadi, Agripada, Mahalaxmi Race Course,
Peddar Road, Pandit Madan Mohan Malviya Marg and Clarke Road area. This interchange has 7 free flow
movement of traffic between existing road and proposed costal road without any traffic conflict. Figure
5-34 shows the connectivity and directional traffic movement between
network. Figure 5-35 shows the traffic dispersal road network diagram.
existing and proposed roads
Figure 5-35: Traffic Dispersal Scheme – Haji Ali Chowk
Proposed network development scheme for the catchment of Haji Ali Interchange from Comprehensive
Mobility Plan has been reproduced in Figure 5-36. Network development scheme summary is presented in
Table 5 31.
Figure 5-34: Directional Traffic Movement – Haji Ali Interchange
Detailed Project Report 46

CONSULTANCY SERVICES FOR PREPARATION OFFEASIBILITY REPORT, DPR PREPARATION, REPORT ONENVIRONMENTAL STUDIES AND OBTAINING MOEF
STUP Consultants Pvt. Ltd CLEARANCE AND BID PROCESS MANAGMENT FOR MUMBAI
COASTAL ROAD PROJECT
Table 5-31: summary of Network Development Scheme
Figure 5-36 : Network Development Scheme – Haji Ali Chowk
Detailed Project Report 47
Name of Interchange Haji Ali Interchange
Sl No. Name of Road Proposed Road Width
2019 Widening Scheme
1
Tardeo Road 36.6m
Dr E Moses Marg 33.5m
Samanth Bhai Rathod Marg 42.7m
Lala Lajpatrai Marg 36.6m
Sane Guruji Marg 36.6m
Sakpal Marg -Dr E Moses Marg 27.45m
Sane Guruji Marg 42.7m
Dr East Moses Marg 30.5m
2024 Widening Scheme
2Ripon Road 18.30m
Bapurao Jagtap Road 27.45m
2034 Widening Scheme
3
Ghas Galli Road 24.4m
Deshmukh Lane 18.30m
Kishav Ravkhadhi Road 18.30m

CONSULTANCY SERVICES FOR PREPARATION OFFEASIBILITY REPORT, DPR PREPARATION, REPORT ONENVIRONMENTAL STUDIES AND OBTAINING MOEF
STUP Consultants Pvt. Ltd CLEARANCE AND BID PROCESS MANAGMENT FOR MUMBAI
COASTAL ROAD PROJECT
iii.
iv.
v.
Junction Development Scheme
Junctions which need to be developed are:
Haji Ali Chowk
Capacity of
road,
Average
Detailed Project Report 48
Junction Name Haji Ali Chowk
Road Details LOS - Existing road (2019)
Proposed development Scheme
(2019)
LOS - After improvement (2019)
Road Segment Type of Road
Width of road
segment
Existing RoadConfiguration
Traffic From
Coastal Road,
PCU/hr
Design Capacity of
existing road,
PCU/hr
V/Cratio
LOS
Traffic From
Coastal Road,
PCU/hr
Design Capacity of
existing road,
PCU/hr
V/Cratio
LOSRemarks
Lala Lajpatrai Marg Arterial Road 30m 6 lane divided 781 5400 0.14A-
Excellent
Minor improvements like installation of road furniture‘s (Signages &
Markings).
781 5400 0.14A-
Excellent-
Tardeo Road Arterial Road 27m 4 lane divided 781 3600 0.22
B- AboveAverage
781 3600 0.22
B-
Above-
Dr. E Moses Road Arterial Road 14m 4 lane divided 781 3600 0.22
B-
AboveAverage
781 3600 0.22
B-
AboveAverage
-
Dr. Gopalrao Deshmukh Marg Arterial Road 24m 4 lane divided 781 3600 0.22
B-
AboveAverage
781 3600 0.22
B-
AboveAverage
-
Road Details LOS - Existing road (2014)
Proposed development Scheme
(2014)
LOS - After improvement (2014)
RemarksRoad Segment Type of Road
Width of road
segment
Existing RoadConfiguration
Traffic From
Coastal Road,
PCU/hr
Design Capacity of
existing road,
PCU/hr
V/C ratio LOS
Traffic From
Coastal Road,
PCU/hr
Design
existing
PCU/hr
V/C ratio LOS
Lala Lajpatrai Marg Arterial Road 30m 6 lane divided 674 5400 0.12A-
Excellent
Minor improvements like installation of road furniture‘s (Signages &
Markings).
674 5400 0.12A-
Excellent-
Tardeo Road Arterial Road 27m 4 lane divided 674 3600 0.19A-
Excellent674 3600 0.19
A-
Excellent-
Dr. E Moses Road Arterial Road 14m 4 lane divided 674 3600 0.19A-
Excellent
674 3600 0.19A-
Excellent
-
Dr. Gopalrao Deshmukh Marg Arterial Road 24m 4 lane divided 674 3600 0.19A-
Excellent
674 3600 0.19A-
Excellent
-

CONSULTANCY SERVICES FOR PREPARATION OFFEASIBILITY REPORT, DPR PREPARATION, REPORT ONENVIRONMENTAL STUDIES AND OBTAINING MOEF
STUP Consultants Pvt. Ltd CLEARANCE AND BID PROCESS MANAGMENT FOR MUMBAI
COASTAL ROAD PROJECT
-
Average
Above
Above
Above
requested to
availability of
Above Average
Above Average
Detailed Project Report 49
Road Segment
Junction Name Haji Ali Chowk
LOS- Horizon Year (2043)
Proposed development Scheme
(2043)
LOS- After Improvement Horizon Year (2043)
Traffic from Coastal Road,
PCU/hr
Design Capacity of existing road,
PCU/hrV/C ratio LOS
Traffic From CoastalRoad, PCU/hr
Design Capacity of existing road, PCU/hr
V/C ratio LOSRemarks
Lala LajpatraiMarg
1637 5400 0.30B
- AboveAverage
8 lane divided 1637 7200 0.23B -
Above AverageSite visit
Tardeo Road 1637 3600 0.45C -
Average6 lane divided 1637 5400 0.30
B -Above Average
check the
land for the proposed
Dr. E MosesRoad
1637 3600 0.45C -
Average6 lane divided 1637 5400 0.30
B -
Dr. Gopalrao Deshmukh
Marg1637 3600 0.45
C -Average
6 lane divided 1637 5400 0.30B -
improvement
Junction Name Haji Ali Chowk
Road Details LOS (2024)Proposed
developmen t Scheme
(2024)
LOS (2034) Proposed developm
ent Scheme (2034)
Road Segment Type of Road
Width of road
segment
Existing RoadConfiguration
Traffic From Coastal Road,
PCU/hr
Design Capacity of
existing road, PCU/hr
V/Cratio
LOS
Traffic From Coastal Road,
PCU/hr
Design Capacity of
existing road, PCU/hr
V/Cratio
LOS
Lala Lajpatrai Marg Arterial Road 30m 6 lane divided 906 5400 0.17
A-
Excellent
-
1218 5400 0.23
B
Above
Tardeo Road Arterial Road 27m 4 lane divided 906 3600 0.25
B- AboveAverage 1218 3600 0.34
B-
Average
Dr. E Moses Road Arterial Road 14m 4 lane divided 906 3600 0.25
B- AboveAverage 1218 3600 0.34
B-
Average
Dr. Gopalrao Deshmukh Marg Arterial Road 24m 4 lane divided 906 3600 0.25
B- AboveAverage 1218 3600 0.34
B-
Average

CONSULTANCY SERVICES FOR PREPARATION OFFEASIBILITY REPORT, DPR PREPARATION, REPORT ONENVIRONMENTAL STUDIES AND OBTAINING MOEF
STUP Consultants Pvt. Ltd CLEARANCE AND BID PROCESS MANAGMENT FOR MUMBAI
COASTAL ROAD PROJECT
5.3.3 BWSL Worli
South face of Bandra Worli Sea Link (BWSL) at Worli will connect to proposed alignment and before this
merging one interchange proposed to provide the connectivity with existing road. This trumped
interchange will connect the Khan Abdul Gaffar Khan Marg near Gautam Buddha Udyan to proposed
alignment by entry and exit facility. This interchange will provide the connectivity to the prabhadevi, dadar
west, worli, parel, lower parel, worli dairy and upper Worli area. This interchange provides conflict free
traffic movement for all movement. Figure 5-37 show the connectivity and traffic movement between
existing road and proposed coastal road network. Figure 5-38 shows the traffic dispersal scheme for the
interchange.
Figure 5-38: traffic Dispersal Scheme at Worli Interchange
Figure 5-37: Directional Traffic Movement at Worli Interchange
Detailed Project Report 50

CONSULTANCY SERVICES FOR PREPARATION OFFEASIBILITY REPORT, DPR PREPARATION, REPORT ONENVIRONMENTAL STUDIES AND OBTAINING MOEF
STUP Consultants Pvt. Ltd CLEARANCE AND BID PROCESS MANAGMENT FOR MUMBAI
COASTAL ROAD PROJECT
Table 5-32: Summary of Network Development Scheme
Proposed network development scheme for the catchment of Worli Dairy Interchange from
Comprehensive Mobility Plan has been reproduced in Figure 5 39. Table 5 32 presents the summary of
network development scheme.
Figure 5-39 : Network Development Scheme – Worli Interchange
Detailed Project Report 51
Name of Interchange Worli Interchange
Sl No. Name of Road Proposed Road Width
2019 Widening Scheme
1
Dr Annie Besant Road 36.60m
Shankar Ghaenkar Road 27.45m
Dr Annie Besant Road 27.45m
Pandurang Budhkar Marg -
2024 Widening Scheme
2
Dr R G Thadani Marg 18.30m
Sir Pochkhanawala Marg 18.30m
G M Bhosle Marg 27.45m
Veer Nariman Marg 18.30m
2034 Widening Scheme
3
Worli Seaface Road 24.4m
Chndarkant S Rane Marg 13.4m
Hind Cycle Marg 18.30m
Pandurang Budhkar Marg 18.30m
V B Worlikar Marg 18.30m

CONSULTANCY SERVICES FOR PREPARATION OFFEASIBILITY REPORT, DPR PREPARATION, REPORT ONENVIRONMENTAL STUDIES AND OBTAINING MOEF
STUP Consultants Pvt. Ltd CLEARANCE AND BID PROCESS MANAGMENT FOR MUMBAI
COASTAL ROAD PROJECT
Junction Development Scheme
vi.
vii.
Junctions which need to be developed are:
Worli Sea face road-Dr RG Tadani Marg junction
Capacity of
PCU/hr
road,
ent
(2034)
-
-
-
Detailed Project Report 52
Road Details LOS (2024)
Proposed development
Scheme (2024)
LOS (2034)
Road SegmentType ofRoad
Width of road
segment
Existing RoadConfiguration
Traffic From Coastal Road,
PCU/hr
Design Capacity of
existing road, PCU/hr
V/Cratio
LOSTraffic From Coastal Road,
PCU/hr
Design Capacity
of existing road,
PCU/hr
V/Cratio
LOS
Proposeddevelopm
Scheme
Worli Sea faceRoad
Arterial Road 22m 6 lane divided 231 5400 0.04A -
Excellent- 287 5400 0.04
A
Excellent
Dr. R G ThadaniRoad
Arterial Road 17m 6 lane divided 231 5400 0.05 A -Excellent
6 lane divided 287 5400 0.05A
Excellent
Junction Name Worli Sea face road-Dr RG Tadani Marg junction
Road Details LOS - Existing road (2019)
Proposed development
Scheme (2019)
LOS - After improvement (2019)
Road Segment Type of RoadWidth of
road segment
Existing RoadConfiguration
Traffic From Coastal Road,
PCU/hr
Design Capacity of
existing road, PCU/hr
V/Cratio
LOS
Traffic From Coastal Road,
PCU/hr
Design Capacity
of existing
PCU/hr
V/C ratio LOSRemarks
Worli Sea faceRoad
Arterial Road 22m 6 lane divided 184 5400 0.03A-
Excellent
Minor improvements like installation
of road
furniture‘s (Signages & Markings).
184 5400 0.03A-
Excellent
-
Dr. R G ThadaniRoad
Arterial Road 17m 4 lane divided 184 3600 0.05A-
Excellent184 3600 0.05
A-
Excellent-
Road Details LOS - Existing road (2014)
Proposed developmentScheme (2014)
LOS - After improvement (2014)
RemarksRoad Segment Type of Road
Width of road
segment
Existing Road
Configuratio n
Traffic From Coastal Road,
PCU/hr
Design Capacity of
existing road, PCU/hr
V/C ratio LOS
Traffic From
Coastal Road,
PCU/hr
Design
existing road,
V/C ratio LOS
Worli Sea faceRoad
Arterial Road 22m6 lane
divided159 5400 0.03
A-
Excellent
Minor improvements like installation of road
furniture‘s (Signages & Markings).
159 5400 0.03
A-
Excellent-
Dr. R G ThadaniRoad
Arterial Road 17m4 lane
divided159 3600 0.04
A-
Excellent
Minor improvements like installation of road
furniture‘s (Signages & Markings).
159 3600 0.04
A-
Excellent-
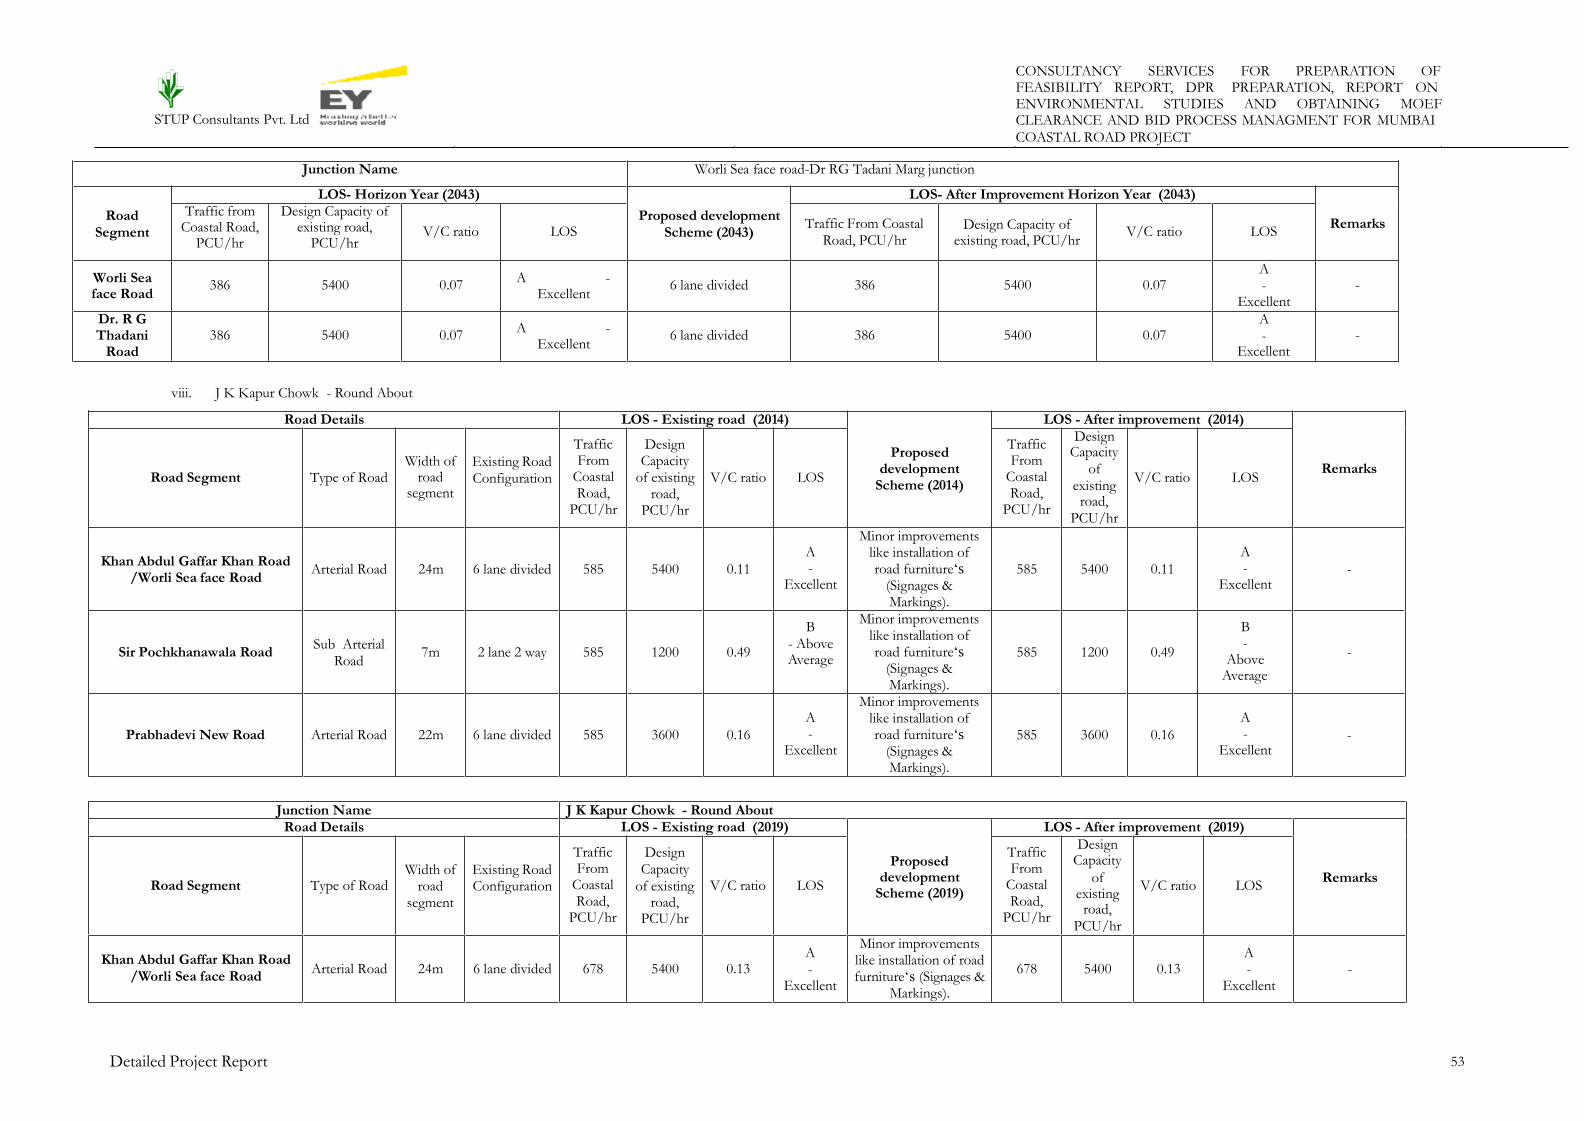
CONSULTANCY SERVICES FOR PREPARATION OFFEASIBILITY REPORT, DPR PREPARATION, REPORT ONENVIRONMENTAL STUDIES AND OBTAINING MOEF
STUP Consultants Pvt. Ltd CLEARANCE AND BID PROCESS MANAGMENT FOR MUMBAI
COASTAL ROAD PROJECT
Excellent
viii. J K Kapur Chowk - Round About
Capacity
road,
Average
Capacity
road,
Detailed Project Report 53
Junction Name J K Kapur Chowk - Round About
Road Details LOS - Existing road (2019)
Proposed development
Scheme (2019)
LOS - After improvement (2019)
Road Segment Type of RoadWidth of
road segment
Existing RoadConfiguration
Traffic From
Coastal Road,
PCU/hr
DesignCapacity
of existing road,
PCU/hr
V/C ratio LOS
Traffic From
Coastal Road,
PCU/hr
Design
of existing
PCU/hr
V/C ratio LOSRemarks
Khan Abdul Gaffar Khan Road/Worli Sea face Road
Arterial Road 24m 6 lane divided 678 5400 0.13A-
Excellent
Minor improvements like installation of road furniture‘s (Signages &
Markings).
678 5400 0.13A-
Excellent-
Road Details LOS - Existing road (2014)
Proposed development
Scheme (2014)
LOS - After improvement (2014)
RemarksRoad Segment Type of Road
Width of road
segment
Existing RoadConfiguration
Traffic From
Coastal Road,
PCU/hr
DesignCapacity
of existing road,
PCU/hr
V/C ratio LOS
Traffic From
Coastal Road,
PCU/hr
Design
of existing
PCU/hr
V/C ratio LOS
Khan Abdul Gaffar Khan Road/Worli Sea face Road
Arterial Road 24m 6 lane divided 585 5400 0.11
A-
Excellent
Minor improvements like installation of road furniture‘s
(Signages & Markings).
585 5400 0.11
A-
Excellent-
Sir Pochkhanawala RoadSub Arterial
Road7m 2 lane 2 way 585 1200 0.49
B- AboveAverage
Minor improvements like installation of road furniture‘s
(Signages & Markings).
585 1200 0.49
B-
Above-
Prabhadevi New Road Arterial Road 22m 6 lane divided 585 3600 0.16
A-
Excellent
Minor improvements like installation of road furniture‘s
(Signages & Markings).
585 3600 0.16
A-
Excellent-
Junction Name Worli Sea face road-Dr RG Tadani Marg junction
RoadSegment
LOS- Horizon Year (2043)
Proposed developmentScheme (2043)
LOS- After Improvement Horizon Year (2043)
RemarksTraffic from
Coastal Road, PCU/hr
Design Capacity of existing road,
PCU/hrV/C ratio LOS
Traffic From CoastalRoad, PCU/hr
Design Capacity of existing road, PCU/hr
V/C ratio LOS
Worli Sea face Road
386 5400 0.07A -
Excellent6 lane divided 386 5400 0.07
A-
Excellent-
Dr. R G Thadani
Road386 5400 0.07
A -Excellent
6 lane divided 386 5400 0.07A- -

CONSULTANCY SERVICES FOR PREPARATION OFFEASIBILITY REPORT, DPR PREPARATION, REPORT ONENVIRONMENTAL STUDIES AND OBTAINING MOEF
STUP Consultants Pvt. Ltd CLEARANCE AND BID PROCESS MANAGMENT FOR MUMBAI
COASTAL ROAD PROJECT
Average
Excellent
Developmen
-
like
road
Above
Excellent
Excellent
Detailed Project Report 54
Junction Name J K Kapur Chowk - Round About
Road Segment
LOS- Horizon Year (2043)
Proposed development
Scheme (2043)
LOS- After Improvement Horizon Year (2043)
Traffic from Coastal Road,
PCU/hr
Design Capacity of existing road,
PCU/hrV/C ratio LOS
Traffic From CoastalRoad, PCU/hr
Design Capacity of existing road, PCU/hr
V/C ratio LOSRemarks
Khan Abdul Gaffar Khan Road /Worli
Sea face Road1420 7200 0.20
A -Excellent
- 1420 7200 0.20A- -
Sir PochkhanawalaRoad
1420 2900 0.49C -
Average4 lane divided to6 lane divided
1420 4300 0.33B-
Above Average-
Prabhadevi New Road 1420 3601 0.39B -Above Average
5 lane divided to8 lane divided
1420 7201 0.20A- -
Junction Name J K Kapur Chowk - Round About
Road Details LOS (2024)
Proposed Development
(2024)
LOS (2034)
Road Segment Type of Road
Width of road segment
Existing RoadConfiguration
Traffic From
Coastal Road,
PCU/hr
DesignCapacity
of existing road,
PCU/hr
V/C ratio LOS
Traffic From Coastal Road,
PCU/hr
DesignCapacity
of existing road,
PCU/hr
V/C ratio LOS
Proposed
t (2034)
Khan Abdul Gaffar Khan Road/Worli Sea face Road
Arterial Road 24m 6 lane divided 786 5400 0.15A-
Excellent- 1056 5400 0.20
A
Excellent
Sir Pochkhanawala RoadSub Arterial
Road7m 2 lane 2 way 786 2900 0.27
B –Above
Average
Proposes 4 lane divided
1056 2900 0.36B –
Above
Average
Minor improvements
installation of
furniture‘s
(Signages &
Prabhadevi New Road Arterial Road 22m 6 lane divided 786 3600 0.22
B- Above Average - 1056 3600 0.29
B-
Average
Markings).
Sir Pochkhanawala RoadSub Arterial
Road7m 2 lane 2 way 678 1200 0.57
C-
Average
Minor improvements like installation of road furniture‘s (Signages &
Markings).
678 1200 0.57
C- -
Prabhadevi New Road Arterial Road 22m 6 lane divided 678 3600 0.19
A-
Excellent
Minor improvements like installation of road furniture‘s (Signages &
Markings).
678 3600 0.19
A- -

CONSULTANCY SERVICES FOR PREPARATION OFFEASIBILITY REPORT, DPR PREPARATION, REPORT ONENVIRONMENTAL STUDIES AND OBTAINING MOEF
STUP Consultants Pvt. Ltd CLEARANCE AND BID PROCESS MANAGMENT FOR MUMBAI
COASTAL ROAD PROJECT
5.3.4 BWSL Toll Plaza Interchange
Interchange will connect to existing road near the Toll Plaza location of BWSL. North face of Bandra
Worli Sea Link (BWSL) at Bandra will connect to proposed alignment. This Interchange provides
connection to entry and exit from the proposed alignment go to north and south of the Mumbai.
Interchange will collect the traffic from Bandra kurla complex, Kalanagar, Bandra Terminus, Bandra East,
Bandra West, Mahim and Dharavi Area. This interchange has 6 conflict free traffic movement between
proposed and existing road network.
Figure 5-40 shows the connectivity and directional traffic movement between existing road and proposed
coastal road network. Figure 5-41 presents the traffic dispersal scheme for BWSL Toll Plaza interchange.
Figure 5-41: Traffic Dispersal Scheme – BWSL Toll Plaza Interchange
Figure 5-40: Directional Traffic Movement at BWSL Toll Plaza Interchange
Detailed Project Report 55

CONSULTANCY SERVICES FOR PREPARATION OFFEASIBILITY REPORT, DPR PREPARATION, REPORT ONENVIRONMENTAL STUDIES AND OBTAINING MOEF
STUP Consultants Pvt. Ltd CLEARANCE AND BID PROCESS MANAGMENT FOR MUMBAI
COASTAL ROAD PROJECT
Table 5 33 presents the summary of network development scheme.
Table 5-33: Summary of Network Development Scheme
Detailed Project Report 56
Name of Interchange BWSL Toll Plaza Interchange
Sl No. Name of Road Proposed Road Width
2019 Widening Scheme
1
Mori Road 18.30m
Swatantrya Veer Savarkar Marg 27.45m
Swami Vivekananda Road 30.5m
2024 Widening Scheme
2 Raheja Hospital Marg 27.45m
2034 Widening Scheme
3
Byramji Jeejeebhoy Road 18.30m
Kane Road 18.30m
Krishna Chandra Road 27.45m
T M Mandi Road 18.30m
Byramji Jeejeebhoy Road 18.30m

CONSULTANCY SERVICES FOR PREPARATION OFFEASIBILITY REPORT, DPR PREPARATION, REPORT ONENVIRONMENTAL STUDIES AND OBTAINING MOEF
STUP Consultants Pvt. Ltd CLEARANCE AND BID PROCESS MANAGMENT FOR MUMBAI
COASTAL ROAD PROJECT
Junction Development Scheme
ix.
x.
Junctions which need to be developed are:
Mohammad Rafi Chowk
Capacity of
PCU/hr
Average
•
Capacity of
PCU/hr
-
Average
Average
•
Development
PCU/hr
improvements like
Detailed Project Report 57
Junction Name Mohammad Rafi Chowk
Road Details LOS (2024)Proposed
Developme nt (2024)
LOS (2034)
Road Segment Type of Road
Width of road
segment
Existing Road
Configuratio n
Traffic From Coastal Road,
PCU/hr
Design Capacity of
existing road, PCU/hr
V/Cratio
LOSTraffic From Coastal
Road, PCU/hr
Design Capacity of
existing road,V/Cratio
LOS
Proposed
(2034)
WesternExpressway
Arterial Road 22m 8 lane divided 1652 7200 0.23B-
Above
Minor improveme
nts like2221 5400 0.20
A-
Excellent
Minor
installation of
Junction Name Mohammad Rafi Chowk
Road Details LOS - Existing road (2019)
Proposed development
Scheme (2019)
LOS - After improvement (2019)
Road SegmentType of
Road
Width of road
segment
Existing RoadConfiguration
Traffic From Coastal Road,
PCU/hr
Design Capacity of
existing road, PCU/hr
V/C ratio LOS
Traffic From
Coastal Road,
PCU/hr
Design
existing road,
V/Cratio
LOSRemarks
WesternExpressway
Arterial Road 22m 8 lane divided 1425 7200 0.20
B-
AboveAverage
Minor improvements like installation of road furniture‘s
(Signages & Markings).
1425 7200 0.20
B
Above -
S V Road Arterial Road 20m 6 lane divided 145 5400 0.26
B-
AboveAverage
Minor improvements like installation of road furniture‘s
(Signages & Markings).
145 5400 0.26
B-
Above-
Road Details LOS - Existing road (2014)
Proposed development
Scheme (2014)
LOS - After improvement (2014)
RemarksRoad Segment Type of Road
Width of road
segment
Existing RoadConfiguration
Traffic From Coastal Road,
PCU/hr
Design Capacity of
existing road, PCU/hr
V/Cratio
LOS
Traffic From
Coastal Road,
PCU/hr
Design
existing road,
V/Cratio
LOS
WesternExpressway
Arterial Road 22m 8 lane divided 1230 7200 0.17
A-
Excellent
Minor improvements like installation of road furniture‘s
(Signages & Markings).
1230 7200 0.17
A-
Excellent-
S V Road Arterial Road 20m 6 lane divided 1230 5400 0.23
B- Above
Average
Minor improvements like installation of road furniture‘s
(Signages & Markings).
1230 5400 0.23
B-
Above-

CONSULTANCY SERVICES FOR PREPARATION OFFEASIBILITY REPORT, DPR PREPARATION, REPORT ONENVIRONMENTAL STUDIES AND OBTAINING MOEF
STUP Consultants Pvt. Ltd CLEARANCE AND BID PROCESS MANAGMENT FOR MUMBAI
COASTAL ROAD PROJECT
-
check the availability of
improvement
Detailed Project Report 58
Junction Name M M ohammad Rafi Chowk
Road Segment
LOS- Horizon Year (2043)
Proposed development
Scheme (2043)
LOS- After Improvement Horizon Year (2043)
RemarksTraffic from Coastal Road,
PCU/hr
Design Capacity of existing road,
PCU/hrV/C ratio LOS
Traffic From CoastalRoad, PCU/hr
Design Capacity of existing road, PCU/hr
V/C ratio LOS
WesternExpressway
2813 7200 0.39
B- AboveAverage
8 lane divided 2813 7200 0.39
B- Above
Average-
S V Road 2813 5400 0.52
C-
Average
6 lane divided to 8 lane divided
2813 7200 0.39
B- Above
Average
Site visit requested to
land for the proposed
Average installation of road
furniture‘s (Signages & Markings).
road furniture‘s
(Signages & Markings).
S V Road Arterial Road 20m 6 lane divided 1652 5400 0.31
B- AboveAverage
2221 5400 0.41C
Average

CONSULTANCY SERVICES FOR PREPARATION OFFEASIBILITY REPORT, DPR PREPARATION, REPORT ONENVIRONMENTAL STUDIES AND OBTAINING MOEF
STUP Consultants Pvt. Ltd CLEARANCE AND BID PROCESS MANAGMENT FOR MUMBAI
COASTAL ROAD PROJECT
5.3.5 Carter Road
This interchange connects to existing Dattaram Lad Path near CCD corner. This provides connectivity to
Khar east & west, Juhu, Santacruz east & west area. This interchange has 4 conflict free traffic movement
between existing and proposed road. It collects traffic from Bandra west, Palli Village and ONGC Colony.
Figure 5-42 shows the connectivity and directional traffic movement between existing road and proposed
coastal road network. Figure 5 44 presents the traffic dispersal scheme for the interchange.
Figure 5-43: Traffic Dispersal Scheme – Carter Road Interchange
Figure 5-42: Directional Traffic Movement –Carter Road Interchange
Detailed Project Report 59

CONSULTANCY SERVICES FOR PREPARATION OFFEASIBILITY REPORT, DPR PREPARATION, REPORT ONENVIRONMENTAL STUDIES AND OBTAINING MOEF
STUP Consultants Pvt. Ltd CLEARANCE AND BID PROCESS MANAGMENT FOR MUMBAI
COASTAL ROAD PROJECT
Proposed network development scheme for the catchment of Carter Road Interchange from
Comprehensive Mobility Plan has been reproduced in Figure 5 45. Summary of development scheme is
appended in Table 5 34
.
Table 5-34: Summary of Network Development Scheme
Figure 5-44: Network Development Scheme –Carter Road Interchange
Detailed Project Report 60
Name of Interchange Carter Road Interchange
Sl No. Name of Road Proposed Road Width
2024 Widening Scheme
1
Dattaram Lad Path Marg 27.45m
Chitrakar Dhurandhar Marg 18.30m
Vithal Bhai Patel Road 27.45
S B Patil Road 18.30m
2034 Widening Scheme
3
Pali Mala Road 18.30m
Dr Babasheb Ambedkar Marg 18.30m
St . Andrews Road 18.30m
Khatwan Darbar Marg 18.30m
7th Road 18.30m

CONSULTANCY SERVICES FOR PREPARATION OFFEASIBILITY REPORT, DPR PREPARATION, REPORT ONENVIRONMENTAL STUDIES AND OBTAINING MOEF
STUP Consultants Pvt. Ltd CLEARANCE AND BID PROCESS MANAGMENT FOR MUMBAI
COASTAL ROAD PROJECT
Junction Development Scheme
xi.
xii.
Junction which need to be developed :
Linking Road- Chitrakar Durandhar Road Junction
Capacity
road,
availability of land nearby
Capacity
road,
installation of road
-
Detailed Project Report 61
Junction Name Linking Road- Chitrakar Dhurandar Road Junction
Road Details LOS - Existing road (2019)
Proposed development
Scheme (2019)
LOS - After improvement (2019)
RemarksRoad Segment Type of Road
Width of road segme
nt
Existing RoadConfiguration
Traffic From
Coastal Road,
PCU/h r
Design Capacity
of existing road,
PCU/hr
V/Cratio
LOS
Traffic From
Coastal Road,
PCU/hr
Design
of existing
PCU/hr
V/Cratio
LOS
Linking Road Arterial Road 18m 4 lane divided 716 3600 0.20A-
Excellent
Minor improvements like installation
of road
furniture‘s (Signages & Markings).
716 3600 0.20A-
ExcellentMinor improvements like
furniture‘s (Signages &
Markings).Chitrakar DhurandarRoad
Arterial Road 12m 2 lane undivided 716 1500 0.48
C-
Average716 1500 0.48
C
Average
Road Details LOS - Existing road (2014)
Proposed development
Scheme (2014)
LOS - After improvement (2014)
RemarksRoad Segment Type of Road
Width of road segmen
t
Existing RoadConfiguration
Traffic From
Coastal Road,
PCU/hr
Design Capacity
of existing
road, PCU/hr
V/C ratio LOS
Traffic From
Coastal Road,
PCU/hr
Design
of existing
PCU/hr
V/C ratio LOS
Linking Road Arterial Road 18m 4 lane divided 618 3600 0.17A-
Excellent
Minor improvements like installation
of road
furniture‘s (Signages & Markings).
618 3600 0.17A-
Excellent
-
Chitrakar DhurandarRoad
Arterial Road 12m 2 lane undivided 618 1500 0.41C-
Average
4 lane undivided
618 3000 0.2A-
Excellent
Need site visit to check the

CONSULTANCY SERVICES FOR PREPARATION OFFEASIBILITY REPORT, DPR PREPARATION, REPORT ONENVIRONMENTAL STUDIES AND OBTAINING MOEF
STUP Consultants Pvt. Ltd CLEARANCE AND BID PROCESS MANAGMENT FOR MUMBAI
COASTAL ROAD PROJECT
Capacity
PCU/hr
installation of road
Markings).
Above
Capacity of
PCU/hr
land for the proposed
land for the proposed
Detailed Project Report 62
Junction Name L Linking Road- Chitrakar Dhurandar Road Junction
Road Segment
LOS- Horizon Year (2043)
Proposed development
Scheme (2043)
LOS- After Improvement Horizon Year (2043)
RemarksTraffic from Coastal Road,
PCU/hr
Design Capacity
of existing road,
PCU/hr
V/C ratio LOSTraffic From Coastal Road,
PCU/hr
Design
existing road, V/C ratio LOS
Linking Road 1499 5400 0.28
B- AboveAverage
Minor improvements like installation of road furniture‘s (Signages &
Markings).
1499 5400 0.28B -Above Average
Site visit requested to check the availability of
improvement
ChitrakarDhurandar Road
1499 3600 0.42
B- AboveAverage
Minor improvements like installation of road furniture‘s (Signages &
Markings).
1499 3600 0.42B -
Above Average
Site visit requested to check the availability of
improvement
Junction Name Linking Road- Chitrakar Dhurandar Road Junction
Road Details LOS - (2024)
Proposed development
Scheme (2024)
LOS - (2034)
Proposed developmentScheme (2034Road Segment Type of Road
Width of road segme
nt
Existing RoadConfiguration
Traffic From
Coastal Road,
PCU/h r
Design Capacity
of existing road,
PCU/hr
V/Cratio
LOS
Traffic From
Coastal Road,
PCU/hr
Design
of existing road,
V/Cratio
LOS
Linking Road Arterial Road 18m 4 lane divided 830 3600 0.23
B- AboveAverage
Minor improvements like installation
of road furniture‘s (Signages & Markings).
1150 3600 0.32
B- AboveAverage
Minor improvements like
furniture‘s (Signages &
Chitrakar DhurandarRoad
Arterial Road 12m 2 lane undivided 830 3600 0.23
B- Above Average
4 lane divided road
1150 3600 0.32
B-
Average

CONSULTANCY SERVICES FOR PREPARATION OFFEASIBILITY REPORT, DPR PREPARATION, REPORT ONENVIRONMENTAL STUDIES AND OBTAINING MOEF
STUP Consultants Pvt. Ltd CLEARANCE AND BID PROCESS MANAGMENT FOR MUMBAI
COASTAL ROAD PROJECT
xiii. Linking Road- Juhu Road Junction (Arya Samaj Chowk)
Capacity of
road,
Excellent
Capacity of
road,
Excellent
Capacity
Average
Detailed Project Report 63
Junction Name xv. Linking Road- Juhu Road Junction (Arya Samaj Chowk)
Road Details LOS - Existing road (2024)
Proposed development
Scheme (2024)
LOS - After improvement (2034)
Proposed development
Scheme (2034)Road Segment
Type ofRoad
Width of road
segment
Existing RoadConfiguration
Traffic From
Coastal Road,
PCU/hr
Design Capacity of
existing road,
PCU/hr
V/C ratio LOS
Traffic From
Coastal Road,
PCU/hr
Design
of existing road,
PCU/hr
V/C ratio LOS
Linking Road Arterial Road 18m 4 lane divided 830 5400 0.15A-
Excellent
Minor improvements like installation
of road
furniture‘s (Signages & Markings).
1115 5400 0.21B
- AboveAverage
-
Juhu Road Arterial Road 14m 4 lane divided 830 3600 0.23
B-
AboveAverage
1115 3600 0.31B
- Above -
Junction Name xiv. Linking Road- Juhu Road Junction (Arya Samaj Chowk)
Road Details LOS - Existing road (2019)
Proposed development
Scheme (2019)
LOS - After improvement (2019)
Road SegmentType of
Road
Width of road
segment
Existing RoadConfiguration
Traffic From Coastal Road,
PCU/hr
Design Capacity of
existing road, PCU/hr
V/Cratio
LOS
Traffic From Coastal Road,
PCU/hr
Design
existing
PCU/hr
V/C ratio LOSRemarks
Linking RoadArterialRoad
18m 4 lane divided 716 3600 0.20A-
Excellent
Minor improvements
like installation of road furniture‘s
(Signages & Markings).
716 3600 0.20A- -
Juhu RoadArterialRoad
14m 4 lane divided 716 3600 0.20A-
Excellent716 3600 0.20
A-
Excellent-
Road Details LOS - Existing road (2014)
Proposed development
Scheme (2014)
LOS - After improvement (2014)
RemarksRoad Segment
Type ofRoad
Width of road
segment
Existing RoadConfiguration
Traffic From Coastal Road,
PCU/hr
Design Capacity of
existing road,
PCU/hr
V/C ratio LOS
Traffic From Coastal Road,
PCU/hr
Design
existing
PCU/hr
V/C ratio LOS
Linking RoadArterialRoad
18m 4 lane divided 618 3600 0.17A-
Excellent
Minor improvements like installation of road
furniture‘s (Signages & Markings).
618 3600 0.17A- -
Juhu RoadArterialRoad
14m 4 lane divided 618 3600 0.17A-
Excellent
Minor improvements like installation of road
furniture‘s (Signages & Markings).
618 3600 0.17A-
Excellent-

CONSULTANCY SERVICES FOR PREPARATION OFFEASIBILITY REPORT, DPR PREPARATION, REPORT ONENVIRONMENTAL STUDIES AND OBTAINING MOEF
STUP Consultants Pvt. Ltd CLEARANCE AND BID PROCESS MANAGMENT FOR MUMBAI
COASTAL ROAD PROJECT
availability of land
availability of land
Detailed Project Report 64
Junction Name xvi. Linking Road- Juhu Road Junction (Arya Samaj Chowk)
RoadSegment
LOS- Horizon Year (2043)
Proposed development
Scheme (2043)
LOS- After Improvement Horizon Year (2043)
Traffic from Coastal Road,
PCU/hr
Design Capacity of existing road,
PCU/hrV/C ratio LOS
Traffic From Coastal Road,
PCU/hr
Design Capacity of existing road,
PCU/hrV/C ratio LOS
Remarks
LinkingRoad
1499 5400 0.28
B- Above
Average
Minor improvements like installation of road
furniture‘s (Signages& Markings).
1499 5400 0.28B -Above Average
Site visit requested to check the
for the proposed improvement
Juhu Road 1499 3600 0.42D -Below Average
4 lane divided to 6 lane divided
1499 5400 0.28B -
Above Average
Site visit requested to check the
for the proposed improvement

CONSULTANCY SERVICES FOR PREPARATION OFFEASIBILITY REPORT, DPR PREPARATION, REPORT ONENVIRONMENTAL STUDIES AND OBTAINING MOEF
STUP Consultants Pvt. Ltd CLEARANCE AND BID PROCESS MANAGMENT FOR MUMBAI
COASTAL ROAD PROJECT
5.4.1 Ritumbara College Interchange
Interchange passing near to Moragaon Juhu and merging to the road in front of Ritumbara collage in Juhu
west. Entry and exit ramp provided for both sides moving traffic on proposed alignment. This interchange
provides the connectivity for Andheri east & west and Juhu area. This interchange has 4 conflict free traffic
movement between exiting road and proposed alignment. Figure 5-45 shows the connectivity and
directional traffic movement between existing road and
presents the traffic dispersal scheme for the interchange.
proposed coastal road network. Figure 5-46
Figure 5-46: Traffic Dispersal Scheme – Ritumbara College Interchange
Proposed network
Comprehensive
development
Mobility
scheme
Plan
for the
has
catchment
been
of Ritumbhara
reproduced
College
in
Interchange
Figure
from
5-47
Figure 5-45: Directional Traffic Movement – Ritumbhara College Interchange
Figure 5-47: Network Development Scheme –Ritumbara College Interchange
Detailed Project Report 65

CONSULTANCY SERVICES FOR PREPARATION OFFEASIBILITY REPORT, DPR PREPARATION, REPORT ONENVIRONMENTAL STUDIES AND OBTAINING MOEF
STUP Consultants Pvt. Ltd CLEARANCE AND BID PROCESS MANAGMENT FOR MUMBAI
COASTAL ROAD PROJECT
Table 5-35: Summary of Network Development Scheme
Junction Development Scheme
xvii.
xviii.
Junction which need to be developed :
New Versova - Cosmopolitan Education Society Marg
Capacity
road,
Excellent
Excellent
Excellent
Detailed Project Report 66
Road Details LOS - Existing road (2019)
Proposed development
Scheme (2019)
LOS - After improvement (2019)
Road Segment Type of Road
Width of road
segment
Existing RoadConfiguration
Traffic From
Coastal Road,
PCU/hr
Design Capacity of
existing road,
PCU/hr
V/C ratio LOS
Traffic From
Coastal Road,
PCU/hr
DesignCapacity
of existing road,
PCU/hr
V/C ratio LOSRemarks
New Versova Link Road Arterial Road 18m 4 lane divided 586 3600 0.16A-
Excellent
Minor improvements like installation of road furniture‘s
(Signages & Markings).
586 3600 0.16A-
-
Cosmopolitan Education Society Marg Arterial Road 20m 6 lane divided 586 5400 0.11A-
Excellent
586 5400 0.11A-
Excellent
-
Road Details LOS - Existing road (2014)
Proposed development Scheme
(2014)
LOS - After improvement (2014)
RemarksRoad Segment Type of Road
Width of road
segment
Existing RoadConfiguration
Traffic From
Coastal Road,
PCU/hr
Design Capacity of
existing road,
PCU/hr
V/C ratio LOS
Traffic From
Coastal Road,
PCU/hr
Design
of existing
PCU/hr
V/C ratio LOS
New Versova Link Road Arterial Road 18m 4 lane divided 506 3600 0.14
A-
Excellent
Minor improvements like installation of road furniture‘s (Signages &
Markings).
506 3600 0.14
A- -
Cosmopolitan Education Society Marg Arterial Road 20m 6 lane divided 506 5400 0.09
A-
Excellent
Minor improvements like installation of road furniture‘s (Signages &
Markings).
506 5400 0.09
A- -
Name of
Interchange
Ritumbara college
Interchange
Sl No. Name of Road Proposed Road Width
2019 Widening Scheme
1 New Link Road 36.6m
2024 Widening Scheme
2 Jai Prakash Road 27.45m
St Louis Marg 18.30m
Jai Praksh Marg 18.3
Mahada Road 18.30m
Road Behind The Club Mumbai 18.30m
2034 Widening Scheme
3
RTO Road 18.30m
Achuthrao Patwardhan Road 27.45m
New D N Nagar Road 18.30m
T M Mandi Road 18.30m

CONSULTANCY SERVICES FOR PREPARATION OFFEASIBILITY REPORT, DPR PREPARATION, REPORT ONENVIRONMENTAL STUDIES AND OBTAINING MOEF
STUP Consultants Pvt. Ltd CLEARANCE AND BID PROCESS MANAGMENT FOR MUMBAI
COASTAL ROAD PROJECT
Capacity of
road,
Average
the availability of land for
the availability of land for
xx. New Versova – JP Road
Capacity of
road,
Detailed Project Report 67
Road Details LOS - Existing road (2014)
Proposed developmentScheme (2014)
LOS - After improvement (2014)
Road Segment Type of RoadWidth of
road segment
Existing RoadConfiguration
Traffic From Coastal Road,
PCU/hr
Design Capacity of
existing road, PCU/hr
V/C ratio LOS
Traffic From
Coastal Road,
PCU/hr
Design
existing
PCU/hr
V/C ratio LOSRemarks
New Versova Link Road Arterial Road 18m 4 lane divided 506 3600 0.14A-
Excellent
Minor improvements like installation of road
furniture‘s (Signages & Markings).
506 3600 0.14A-
Excellent
-
J P Road Arterial Road 20m 4 lane divided 506 3600 0.14A-
Excellent506 3600 0.14
A-
Excellent-
Junction Name xix. New Versova - Cosmopolitan Education Society Marg
Road Segment
LOS- Horizon Year (2043)
Proposed development
Scheme (2043)
LOS- After Improvement Horizon Year (2043)
Traffic from Coastal Road,
PCU/hr
Design Capacity of existing road,
PCU/hrV/C ratio LOS
Traffic From CoastalRoad, PCU/hr
Design Capacity of existing road, PCU/hr
V/C ratio LOSRemarks
New Versova LinkRoad
1227 3600 0.34B -Above Average
6 lane divided 1227 5400 0.23B-
Above Average
Site visit requested to check
the proposed improvement
Cosmopolitan Education Society
Marg
1227 5400 0.23B -Above Average
6 lane divided to 8 lane divided
1227 7200 0.17A-
Excellent
Site visit requested to check
the proposed improvement
Road Details LOS - Existing road (2024)
Proposed development
Scheme (2024)
LOS - After improvement (2034)
Proposed development Scheme (2034)Road Segment Type of Road
Width of road
segment
Existing RoadConfiguration
Traffic
From Coastal Road,
PCU/hr
Design
Capacity of existing
road, PCU/hr
V/C ratio LOSTraffic From Coastal Road,
PCU/hr
Design
existing
PCU/hr
V/C ratio LOS
New Versova Link Road Arterial Road 18m 4 lane divided 679 3600 0.19A-
Excellent
Minor improvements like installation of road furniture‘s
(Signages & Markings).
912 3600 0.25
B
-Above
-
Cosmopolitan Education Society Marg Arterial Road 20m 6 lane divided 679 5400 0.13
A
-Excellent
912 5400 0.17
A
-Excellent
-
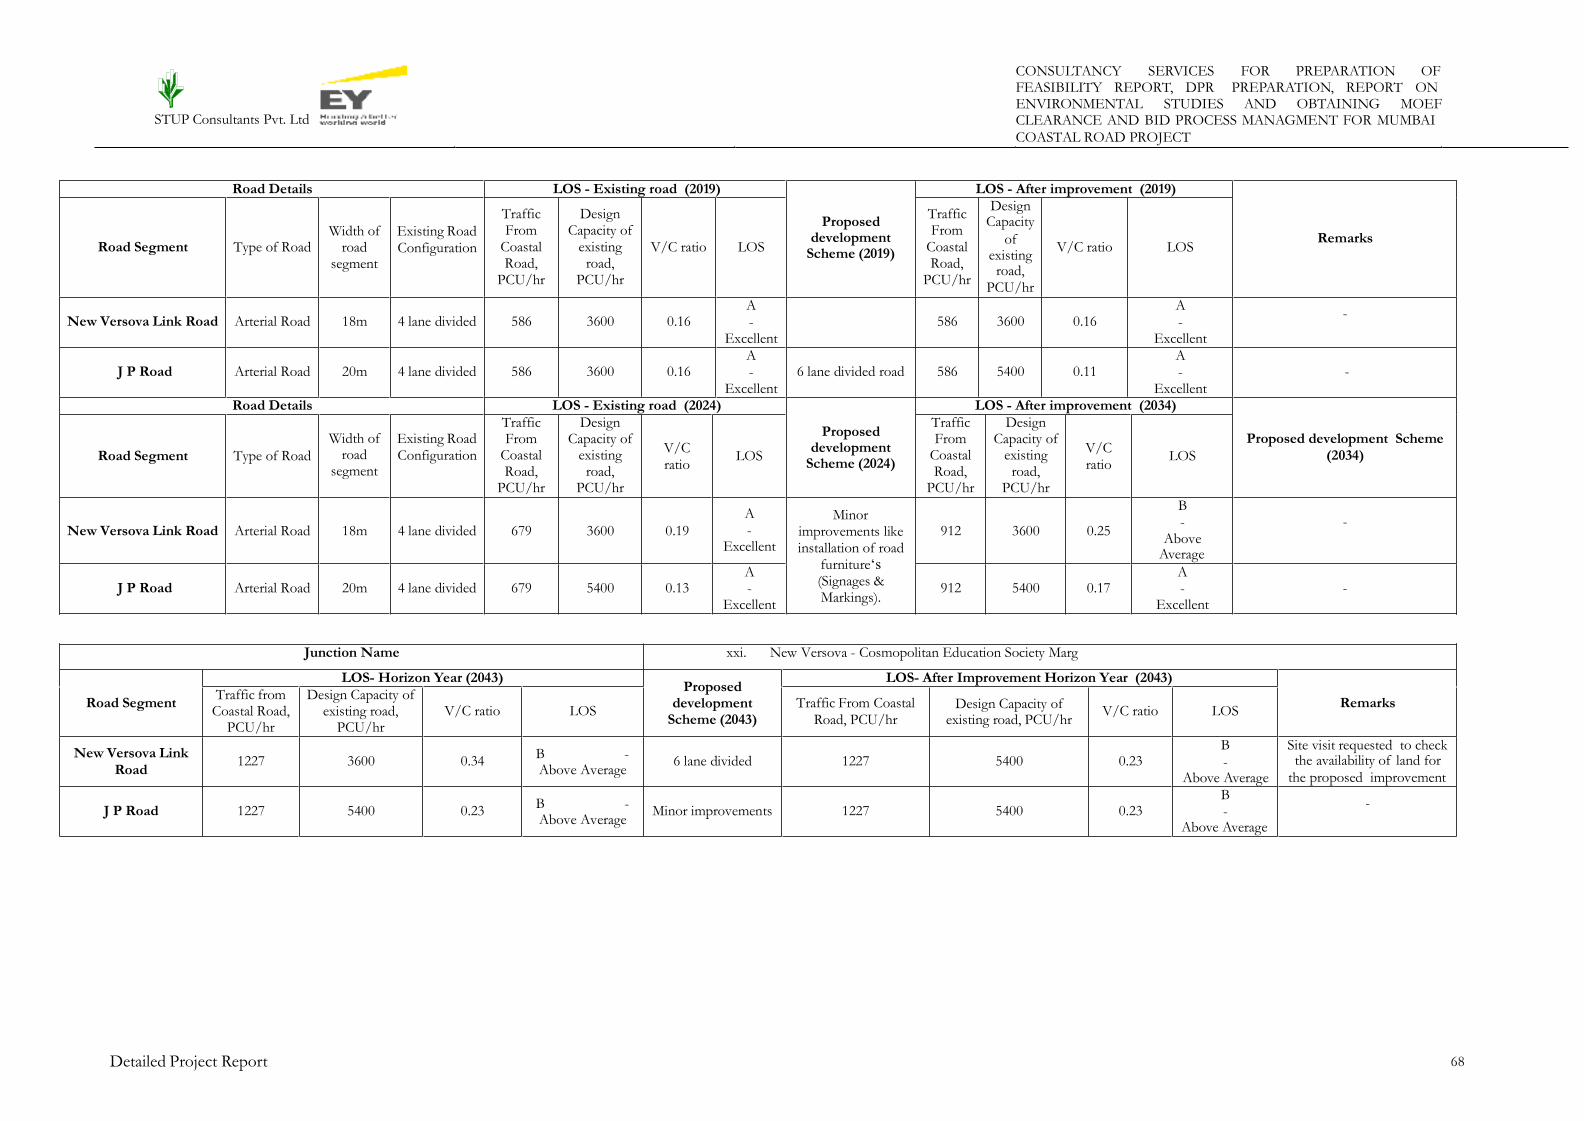
CONSULTANCY SERVICES FOR PREPARATION OFFEASIBILITY REPORT, DPR PREPARATION, REPORT ONENVIRONMENTAL STUDIES AND OBTAINING MOEF
STUP Consultants Pvt. Ltd CLEARANCE AND BID PROCESS MANAGMENT FOR MUMBAI
COASTAL ROAD PROJECT
Capacity
road,
Average
the availability of land for
Above Average
Detailed Project Report 68
Junction Name xxi. New Versova - Cosmopolitan Education Society Marg
Road Segment
LOS- Horizon Year (2043)Proposed
development Scheme (2043)
LOS- After Improvement Horizon Year (2043)
Traffic from Coastal Road,
PCU/hr
Design Capacity of existing road,
PCU/hrV/C ratio LOS
Traffic From CoastalRoad, PCU/hr
Design Capacity of existing road, PCU/hr
V/C ratio LOSRemarks
New Versova LinkRoad
1227 3600 0.34B -Above Average
6 lane divided 1227 5400 0.23B-
Above Average
Site visit requested to check
the proposed improvement
J P Road 1227 5400 0.23B -Above Average
Minor improvements 1227 5400 0.23B-
-
Road Details LOS - Existing road (2019)
Proposed development
Scheme (2019)
LOS - After improvement (2019)
RemarksRoad Segment Type of Road
Width of road
segment
Existing RoadConfiguration
Traffic From
Coastal Road,
PCU/hr
Design Capacity of
existing road,
PCU/hr
V/C ratio LOS
Traffic From
Coastal Road,
PCU/hr
Design
of existing
PCU/hr
V/C ratio LOS
New Versova Link Road Arterial Road 18m 4 lane divided 586 3600 0.16A-
Excellent
586 3600 0.16A-
Excellent
-
J P Road Arterial Road 20m 4 lane divided 586 3600 0.16A-
Excellent
6 lane divided road 586 5400 0.11A-
Excellent
-
Road Details LOS - Existing road (2024)
Proposed development
Scheme (2024)
LOS - After improvement (2034)
Proposed development Scheme(2034)Road Segment Type of Road
Width of road
segment
Existing RoadConfiguration
Traffic From
Coastal Road,
PCU/hr
Design Capacity of
existing road,
PCU/hr
V/Cratio
LOS
Traffic From
Coastal Road,
PCU/hr
Design Capacity of
existing road,
PCU/hr
V/Cratio
LOS
New Versova Link Road Arterial Road 18m 4 lane divided 679 3600 0.19
A-
Excellent
Minor improvements like installation of road
furniture‘s (Signages & Markings).
912 3600 0.25
B-
Above
-
J P Road Arterial Road 20m 4 lane divided 679 5400 0.13A-
Excellent912 5400 0.17
A-
Excellent-

CONSULTANCY SERVICES FOR PREPARATION OFFEASIBILITY REPORT, DPR PREPARATION, REPORT ONENVIRONMENTAL STUDIES AND OBTAINING MOEF
STUP Consultants Pvt. Ltd CLEARANCE AND BID PROCESS MANAGMENT FOR MUMBAI
COASTAL ROAD PROJECT
5.4.2 MADH Island
This interchange provides connectivity to MADH ISLAND using entry and exit for north and south
Mumbai. This interchange has 4 conflict free traffic movement between existing and proposed roads. Road
on stilts connects proposed coastal road and Madh Island. It is assumed that 2000 PCU/ day vehicle will
diverts to Madh Island from Coastal road. Figure 5-48 shows the connectivity and directional movement
of traffic between Madh Island and proposed coastal road. Figure 5-49 shows the traffic network dispersal
scheme.
Figure 5-49: Traffic Dispersal Scheme – Madh Island Interchange
Proposed network development scheme for the catchment of Madh Island Interchange from
Comprehensive Mobility Plan has been reproduced in Figure 5-50. Summary of network development
scheme is given inTable 5-36.
Figure 5-48: Directional Traffic Movement - Madh Island Interchange
Figure 5-50: Network Development Scheme – Madh Island Interchange
Detailed Project Report 69

CONSULTANCY SERVICES FOR PREPARATION OFFEASIBILITY REPORT, DPR PREPARATION, REPORT ONENVIRONMENTAL STUDIES AND OBTAINING MOEF
STUP Consultants Pvt. Ltd CLEARANCE AND BID PROCESS MANAGMENT FOR MUMBAI
COASTAL ROAD PROJECT
Table 5-36: Summary of Network Development Scheme
Junction Development Scheme
xxii.
xxiii.
Junction which need to be developed :
Lokhandwala Roundabout
road,
Excellent
Excellent
Excellent
road,
Detailed Project Report 70
Road Details LOS - Existing road (2019)
Proposed developmentScheme (2019)
LOS - After improvement (2019)
Road Segment Type of RoadWidth of
road segment
Existing RoadConfiguration
Traffic From
Coastal Road,
PCU/hr
Design Capacity of
existing road,
PCU/hr
V/C ratio LOS
Traffic From
Coastal Road,
PCU/hr
DesignCapacity
of existing
PCU/hr
V/C ratio LOSRemarks
Lokhandwala Back Road Arterial Road 20m 4 lane divided 463 3600 0.13A-
Excellent6 lane divided 463 5400 0.09
A-
Excellent-
Road Details LOS - Existing road (2014)
Proposed developmentScheme (2014)
LOS - After improvement (2014)
RemarksRoad Segment Type of Road
Width of road segment
Existing RoadConfiguration
Traffic From
Coastal Road,
PCU/hr
Design Capacity of
existing road,
PCU/hr
V/C ratio LOS
Traffic From
Coastal Road,
PCU/hr
DesignCapacity
of existing
PCU/hr
V/C ratio LOS
Lokhandwala Back Road Arterial Road 20m 4 lane divided 400 3600 0.11
A-
Excellent
Minor improvements like installation of road
furniture‘s (Signages & Markings).
400 3600 0.11
A- -
Lokhandwala Complex Road Arterial Road 14m 4 lane divided 400 3600 0.11
A-
Excellent
Minor improvements like installation of road
furniture‘s (Signages & Markings).
400 3600 0.11
A- -
P Tandon Marg Arterial Road 20m 4 lane divided 400 3600 0.11
A-
Excellent
Minor improvements like installation of road
furniture‘s (Signages & Markings).
400 3600 0.11
A- -
Name of Interchange Madh Island
Interchange
Sl No. Name of Road Proposed Road Width
2019 Widening Scheme
1 New Link Road 36.6m
2024 Widening Scheme
2
Main Road 18.30m
New Link Road 18.30m
Flyovers are also proposed -
Main Road 18.30m
2034 Widening Scheme
3Lokhandwala Complex Road 27.45m
BMC Road 36.60m

CONSULTANCY SERVICES FOR PREPARATION OFFEASIBILITY REPORT, DPR PREPARATION, REPORT ONENVIRONMENTAL STUDIES AND OBTAINING MOEF
STUP Consultants Pvt. Ltd CLEARANCE AND BID PROCESS MANAGMENT FOR MUMBAI
COASTAL ROAD PROJECT
Excellent
Excellent
Capacity
road,
Excellent
Excellent
the availability of land for the
the availability of land for the
Detailed Project Report 71
Junction Name xxiv. Lokhandwala Roundabout
Road Segment
LOS- Horizon Year (2043)
Proposed development
Scheme (2043)
LOS- After Improvement Horizon Year (2043)
Traffic from Coastal Road,
PCU/hr
Design Capacity of existing road,
PCU/hrV/C ratio LOS
Traffic From CoastalRoad, PCU/hr
Design Capacity of existing road, PCU/hr
V/C ratio LOSRemarks
Lokhandwala BackRoad
971 5400 0.18A -
Excellent- 971 5400 0.18
A-
Excellent-
LokhandwalaComplex Road
971 3600 0.27B -Above Average
6 lane divided 971 5400 0.18A-
Excellent
Site visit requested to check
proposed improvement
P Tandon Marg 971 3600 0.27B -Above Average
6 lane divided 971 3600 0.27B -Above Average
Site visit requested to check
proposed improvement
Road Details LOS - Existing road (2024)
Proposed developmentScheme (2024)
LOS - After improvement (2034)
Road Segment Type of RoadWidth of
road segment
Existing RoadConfiguration
Traffic From
Coastal Road,
PCU/hr
Design Capacity
of existing road,
PCU/hr
V/C ratio LOS
Traffic From
Coastal Road,
PCU/hr
Design
of existing
PCU/hr
V/C ratio LOSProposed development Scheme (2034)
Lokhandwala Back Road Arterial Road 20m 4 lane divided 537 5400 0.10A-
Excellent
6 lane divided 722 5400 0.13A-
Excellent
-
Lokhandwala Complex Road Arterial Road 14m 4 lane divided 537 3600 0.15
A-
Excellent
Minor improvements like installation of road
furniture‘s (Signages & Markings).
722 3600 0.20
A- -
P Tandon Marg Arterial Road 20m 4 lane divided 537 3600 0.15
A-
Excellent
Minor improvements like installation of road
furniture‘s (Signages & Markings).
722 3600 0.20
A- -
Lokhandwala Complex Road Arterial Road 14m 4 lane divided 463 3600 0.13
A-
Excellent
Minor improvements like installation of road
furniture‘s (Signages & Markings).
463 3600 0.13
A- -
P Tandon Marg Arterial Road 20m 4 lane divided 463 3600 0.13
A-
Excellent
Minor improvements like installation of road
furniture‘s (Signages & Markings).
463 3600 0.13
A- -

CONSULTANCY SERVICES FOR PREPARATION OFFEASIBILITY REPORT, DPR PREPARATION, REPORT ONENVIRONMENTAL STUDIES AND OBTAINING MOEF
STUP Consultants Pvt. Ltd CLEARANCE AND BID PROCESS MANAGMENT FOR MUMBAI
COASTAL ROAD PROJECT
Proposed network development scheme for the catchment of Oshiwara Interchange from Comprehensive
Mobility Plan has been reproduced in Figure 5-53. Network development scheme is summarised in Table
5-37.
5.4.3 Oshiwara Interchange
This interchange provides connectivity to Goregaon east and west, Jogeshwari west area traffic. Entry and
exit ramps connect to existing road near Park paradise Apartments. Figure 5-51 shows the connectivity and
directional movement of traffic between Madh Island and proposed coastal road. Figure 5-52 shows the
traffic network dispersal scheme.
Figure 5-51 : Directional Traffic Movement – Oshiwara Interchange
Figure 5-53: Network Development scheme – Oshiwara Interchange
Table 5-37: Summary of Network Development Scheme
Figure 5-52: Traffic Dispersal Scheme – Oshiwara Interchange
Detailed Project Report 72
Name of Interchange Oshiwara Interchange
Sl No. Name of Road Proposed Road Width
2019 Widening Scheme
1 Chincholi Bunder Link Road 36.60m
2024 Widening Scheme
2Bhau Tatoba Toraskar Marg 36.60m
Road No 5 -M G Road 18.30m
2034 Widening Scheme
3Creek Road 36.60m
Water Pump House Road 18.30m

CONSULTANCY SERVICES FOR PREPARATION OFFEASIBILITY REPORT, DPR PREPARATION, REPORT ONENVIRONMENTAL STUDIES AND OBTAINING MOEF
STUP Consultants Pvt. Ltd CLEARANCE AND BID PROCESS MANAGMENT FOR MUMBAI
COASTAL ROAD PROJECT
Junction Development Scheme
xxv.
xxvi.
Junction which need to be developed :
T -Junction (Best Colony Road - Bhau Tatoba Toraskar Marg)
road,
Capacity of
road,
Capacity
road,
Average
Detailed Project Report 73
Road Details LOS - Existing road (2024)
Proposed development
Scheme (2024)
LOS - After improvement (2034)
Road Segment Type of RoadWidth of road segment
Existing RoadConfiguration
Traffic From
Coastal Road,
PCU/hr
Design Capacity
of existing road,
PCU/hr
V/C ratio LOS
Traffic From
Coastal Road,
PCU/hr
Design
of existing
PCU/hr
V/C ratio LOSProposed development Scheme (2034)
Best Colony Road Arterial Road 14m 4 lane divided 1232 3600 0.34
B- AboveAverage
Minor improvements like installation
of road furniture‘s (Signages & Markings).
1656 3600 0.46
B-
Above
Minor improvements like installation of road furniture‘s
Road Details LOS - Existing road (2019)
Proposed developmentScheme (2019)
LOS - After improvement (2019)
Road Segment Type of RoadWidth of
road segment
Existing RoadConfiguration
Traffic From Coastal Road,
PCU/hr
Design Capacity of
existing road, PCU/hr
V/C ratio LOSTraffic From Coastal Road,
PCU/hr
Design
existing
PCU/hr
V/C ratio LOSRemarks
Best Colony Road Arterial Road 14m 4 lane divided 1063 3600 0.30
B-
AboveAverage
Minor improvements like installation of road
furniture‘s (Signages & Markings).
1063 3600 0.30
B-
AboveAverage
-
Bhau Tatoba Toraskar Marg Arterial Road 18m 4 lane divided 1063 3600 0.30
B- AboveAverage
Minor improvements like installation of road
furniture‘s (Signages & Markings).
1063 3600 0.30
B- AboveAverage
-
Road Details LOS - Existing road (2014)
Proposed developmentScheme (2014)
LOS - After improvement (2014)
RemarksRoad Segment Type of Road
Width of road segment
Existing RoadConfiguration
Traffic From
Coastal Road,
PCU/hr
Design Capacity of
existing road,
PCU/hr
V/C ratio LOS
Traffic From
Coastal Road,
PCU/hr
DesignCapacity
of existing
PCU/hr
V/C ratio LOS
Best Colony Road Arterial Road 14m 4 lane divided 917 3600 0.25
B- Above Average
Minor improvements like installation of road
furniture‘s (Signages & Markings).
917 3600 0.25
B- Above Average
-
Bhau Tatoba Toraskar Marg Arterial Road 18m 4 lane divided 917 3600 0.25
B- AboveAverage
Minor improvements like installation of road
furniture‘s (Signages & Markings).
917 3600 0.25
B- AboveAverage
-

CONSULTANCY SERVICES FOR PREPARATION OFFEASIBILITY REPORT, DPR PREPARATION, REPORT ONENVIRONMENTAL STUDIES AND OBTAINING MOEF
STUP Consultants Pvt. Ltd CLEARANCE AND BID PROCESS MANAGMENT FOR MUMBAI
COASTAL ROAD PROJECT
Capacity
road,
the availability of land for the
the availability of land for the
xxviii. Link Road - Best Colony Road Junction
Capacity of
PCU/hr
Average
Average
Detailed Project Report 74
Road Details LOS - Existing road (2014)
Proposed developmentScheme (2014)
LOS - After improvement (2014)
RemarksRoad Segment Type of Road
Width of road segment
Existing RoadConfiguration
Traffic From Coastal Road,
PCU/hr
Design Capacity of
existing road, PCU/hr
V/C ratio LOS
Traffic From
Coastal Road,
PCU/hr
Design
existing road,
V/C ratio LOS
Link Road Arterial Road 18m 4 lane divided 917 3600 0.25
B- AboveAverage
Minor improvements like installation of road furniture‘s
(Signages & Markings).917 3600 0.25
B-
Above-
Best Colony Road Arterial Road 14m 4 lane divided 917 3600 0.25
B- AboveAverage
Minor improvements like installation of road furniture‘s
(Signages & Markings).917 3600 0.25
B-
Above-
Junction Name xxvii. T -Junction (Best Colony Road - Bhau Tatoba Toraskar Marg)
RoadSegment
LOS- Horizon Year (2043)
Proposed developmentScheme (2043)
LOS- After Improvement Horizon Year (2043)
Traffic from Coastal Road,
PCU/hr
Design Capacity of existing road,
PCU/hrV/C ratio LOS
Traffic From CoastalRoad, PCU/hr
Design Capacity of existing road, PCU/hr
V/C ratio LOSRemarks
Best ColonyRoad
2226 3600 0.62D -Below Average
6 lane divided 2226 5400 0.41B -Above Average
Site visit requested to check
proposed improvement
Bhau Tatoba Toraskar
Marg2226 7200 0.31
B -Above Average
9 lane divided 2226 7200 0.31B -Above Average
Site visit requested to check
proposed improvement
Road Details LOS - Existing road (2024)
Proposed development
Scheme (2024)
LOS - After improvement (2034)
Proposed development Scheme (2034)Road Segment Type of Road
Width of road segment
Existing RoadConfiguration
Traffic From
Coastal Road,
PCU/hr
Design Capacity
of existing road,
PCU/hr
V/C ratio LOS
Traffic From
Coastal Road,
PCU/hr
Design
of existing
PCU/hr
V/C ratio LOS
Bhau Tatoba Toraskar Marg Arterial Road 18m 4 lane divided 1232 7200 0.17A-
Excellent8 lane divided 1656 7200 0.23
A-
Excellent

CONSULTANCY SERVICES FOR PREPARATION OFFEASIBILITY REPORT, DPR PREPARATION, REPORT ONENVIRONMENTAL STUDIES AND OBTAINING MOEF
STUP Consultants Pvt. Ltd CLEARANCE AND BID PROCESS MANAGMENT FOR MUMBAI
COASTAL ROAD PROJECT
Capacity of
PCU/hr
-
Average
Capacity
road,
-
Average
road furniture‘s (Signages & Markings).
availability of land for the
availability of land for the
Detailed Project Report 75
Junction Name xxix. Link Road - Best Colony Road Junction
LOS- Horizon Year (2043)
Proposed developmentScheme (2043)
LOS- After Improvement Horizon Year (2043)
Traffic from Coastal Road,
PCU/hr
Design Capacity of existing road,
PCU/hrV/C ratio LOS
Traffic From CoastalRoad, PCU/hr
Design Capacity of existing road, PCU/hr
V/C ratio LOSRemarks
2226 7200 0.31B -Above Average
- 2226 7200 0.31B -Above Average
Site visit requested to check the
proposed improvement
2226 3600 0.62D -Below Average
6 lane divided 2226 5400 0.41B -Above Average
Site visit requested to check the
proposed improvement
Road Details LOS - Existing road (2024)Proposed
developme nt Scheme
(2024)
LOS - After improvement (2034)
Road SegmentType of
Road
Width of road
segment
Existing RoadConfiguration
Traffic From
Coastal Road,
PCU/hr
Design Capacity of
existing road, PCU/hr
V/C ratio LOS
Traffic From
Coastal Road,
PCU/hr
Design
of existing
PCU/hr
V/C ratio LOSProposed development Scheme (2034)
Link RoadArterialRoad
18m 4 lane divided 1232 7200 0.17
A-
Excellent
Minor improveme
nts like installation
of road furniture‘s (Signages & Markings).
1656 7200 0.23
B
Above
Best ColonyRoad
ArterialRoad
14m 4 lane divided 1232 3600 0.34
B-
AboveAverage
1656 3600 0.46
B-
AboveAverage
Minor improvements like installation of
Road Details LOS - Existing road (2019)
Proposed developmentScheme (2019)
LOS - After improvement (2019)
RemarksRoad Segment Type of Road
Width of road segment
Existing RoadConfiguration
Traffic From Coastal Road,
PCU/hr
Design Capacity of
existing road, PCU/hr
V/C ratio LOS
Traffic From
Coastal Road,
PCU/hr
Design
existing road,
V/C ratio LOS
Link Road Arterial Road 18m 4 lane divided 1063 3600 0.30
B- Above Average
8 lane divided 1063 7200 0.15
A
Excellent
Best Colony Road Arterial Road 14m 4 lane divided 1063 3600 0.30
B- AboveAverage
Minor improvements like installation of road furniture‘s
(Signages & Markings).1063 3600 0.30
B-
Above-

CONSULTANCY SERVICES FOR PREPARATION OFFEASIBILITY REPORT, DPR PREPARATION, REPORT ONENVIRONMENTAL STUDIES AND OBTAINING MOEF
STUP Consultants Pvt. Ltd CLEARANCE AND BID PROCESS MANAGMENT FOR MUMBAI
COASTAL ROAD PROJECT
5.4.4 Malad Interchange
Malad interchange of north costal road alignment provides the connection on Chinchowali Bandra Link
Road near to Inorbit mall Malad west. Entry and exit ramp provides in this intersection for both side
movements with free flow traffic movement. Traffic movement area covered from Goregaon east & west,
Malad east & west location. This interchange has 4 conflict free traffic movement between existing and
proposed road network. Figure 5-54 shows the connectivity and directional movement of traffic between
Madh Island and proposed coastal road. Figure 5-55 shows the traffic network dispersal scheme.
Figure 5-54: Directional Traffic Movement – Malad Interchange
Figure 5-55: Traffic Dispersal Scheme –Malad Interchange
Detailed Project Report 76
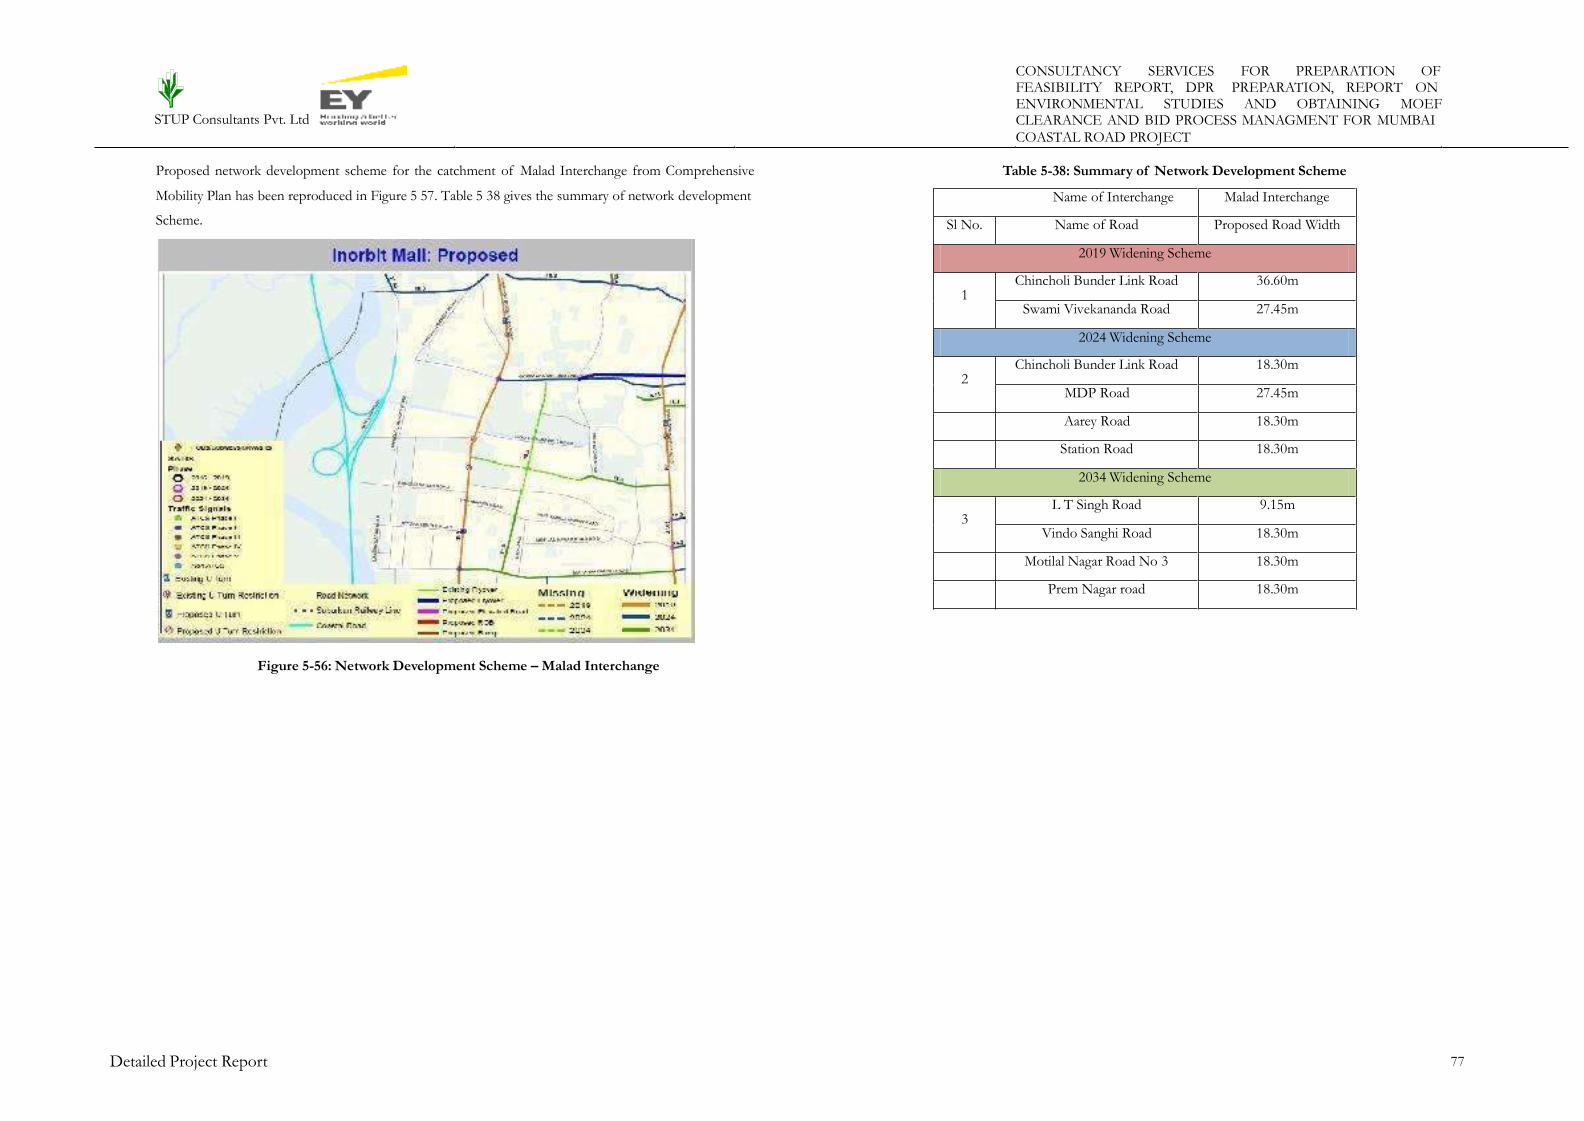
CONSULTANCY SERVICES FOR PREPARATION OFFEASIBILITY REPORT, DPR PREPARATION, REPORT ONENVIRONMENTAL STUDIES AND OBTAINING MOEF
STUP Consultants Pvt. Ltd CLEARANCE AND BID PROCESS MANAGMENT FOR MUMBAI
COASTAL ROAD PROJECT
Proposed network development scheme for the catchment of Malad Interchange from Comprehensive
Mobility Plan has been reproduced in Figure 5 57. Table 5 38 gives the summary of network development
Scheme.
Table 5-38: Summary of Network Development Scheme
Figure 5-56: Network Development Scheme – Malad Interchange
Detailed Project Report 77
Name of Interchange Malad Interchange
Sl No. Name of Road Proposed Road Width
2019 Widening Scheme
1Chincholi Bunder Link Road 36.60m
Swami Vivekananda Road 27.45m
2024 Widening Scheme
2Chincholi Bunder Link Road 18.30m
MDP Road 27.45m
Aarey Road 18.30m
Station Road 18.30m
2034 Widening Scheme
3L T Singh Road 9.15m
Vindo Sanghi Road 18.30m
Motilal Nagar Road No 3 18.30m
Prem Nagar road 18.30m

CONSULTANCY SERVICES FOR PREPARATION OFFEASIBILITY REPORT, DPR PREPARATION, REPORT ONENVIRONMENTAL STUDIES AND OBTAINING MOEF
STUP Consultants Pvt. Ltd CLEARANCE AND BID PROCESS MANAGMENT FOR MUMBAI
COASTAL ROAD PROJECT
Junction Development Scheme
xxx.
xxxi.
Junction which need to be developed :
T -Junction ( MDP Road - Inorbit Side Road Junction )
Capacity of
road,
Average
Average
Capacity of
road,
Average
Average
Capacity
road,
road furniture‘s (Signages & Markings).furniture‘s
Detailed Project Report 78
Road Details LOS - Existing road (2024)Proposed
developme nt Scheme
(2024)
LOS - After improvement (2034)
Road SegmentType of
Road
Width of road
segment
Existing RoadConfiguration
Traffic From
Coastal Road,
PCU/hr
Design Capacity of
existing road, PCU/hr
V/C ratio LOS
Traffic From
Coastal Road,
PCU/hr
Design
of existing
PCU/hr
V/C ratio LOSProposed development Scheme (2034)
MDP Road
Sub Arterial Road
18m 4 lane divided 1232 2900 0.42
C-
Average
Minor improveme
nts like installation
of road
(Signages & Markings).
1656 2900 0.57C
- AverageMinor improvements like installation of
Road Details LOS - Existing road (2019)
Proposed developmentScheme (2019)
LOS - After improvement (2019)
Road Segment Type of RoadWidth of road
segmentExisting RoadConfiguration
Traffic From Coastal Road,
PCU/hr
Design Capacity of
existing road, PCU/hr
V/C ratio LOS
Traffic From
Coastal Road,
PCU/hr
Design
existing
PCU/hr
V/C ratio LOSRemarks
MDP RoadSub
Arterial Road18m 4 lane divided 1063 2900 0.37
B- Above Average
Minor improvements like installation of road furniture‘s
(Signages & Markings).1063 2900 0.37
B-
Above-
Inorbit Side RoadSub
Arterial Road20m 4 lane divided 1063 2900 0.37
B- AboveAverage
Minor improvements like installation of road furniture‘s
(Signages & Markings).1063 2900 0.37
B-
Above-
Road Details LOS - Existing road (2014)
Proposed developmentScheme (2014)
LOS - After improvement (2014)
RemarksRoad Segment Type of Road
Width of road segment
Existing RoadConfiguration
Traffic From Coastal Road,
PCU/hr
Design Capacity of
existing road, PCU/hr
V/C ratio LOS
Traffic From
Coastal Road,
PCU/hr
Design
existing
PCU/hr
V/C ratio LOS
MDP RoadSub
Arterial Road18m 4 lane divided 917 2900 0.32
B- AboveAverage
Minor improvements like installation of road furniture‘s
(Signages & Markings).917 2900 0.32
B-
Above-
Inorbit Side RoadSub
Arterial Road20m 4 lane divided 917 2900 0.32
B- Above Average
Minor improvements like installation of road furniture‘s
(Signages & Markings).917 2900 0.32
B-
Above-
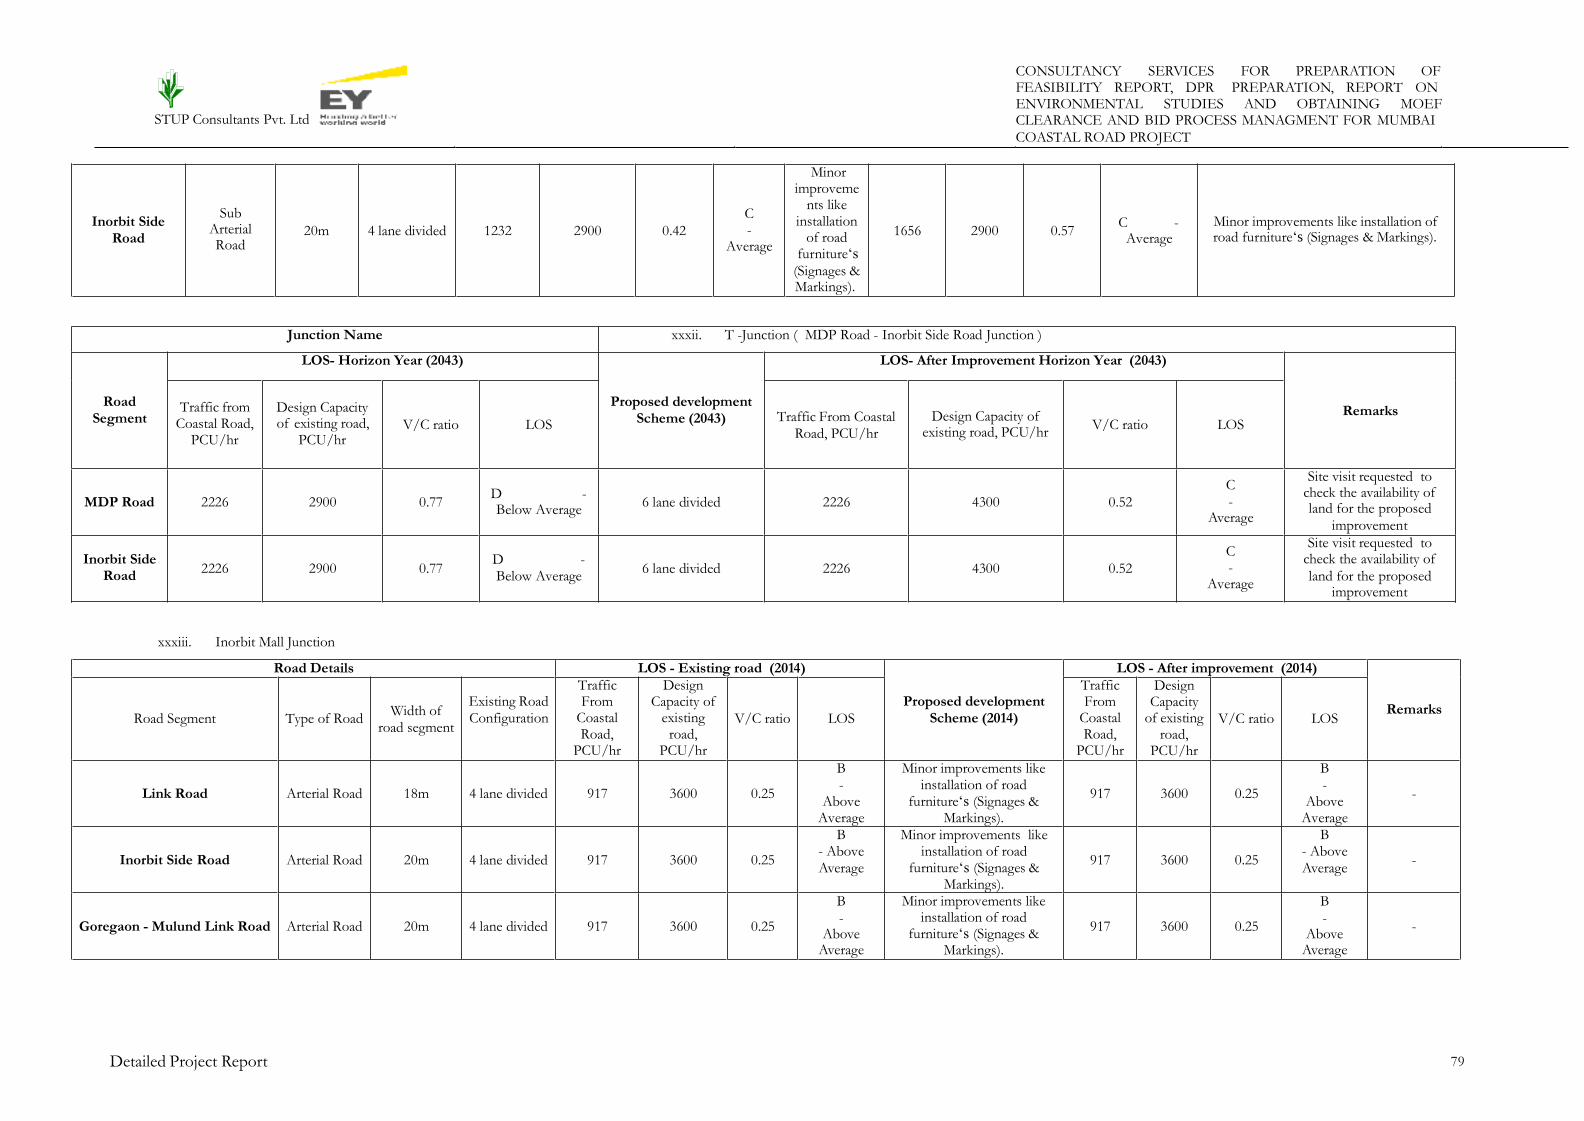
CONSULTANCY SERVICES FOR PREPARATION OFFEASIBILITY REPORT, DPR PREPARATION, REPORT ONENVIRONMENTAL STUDIES AND OBTAINING MOEF
STUP Consultants Pvt. Ltd CLEARANCE AND BID PROCESS MANAGMENT FOR MUMBAI
COASTAL ROAD PROJECT
road furniture‘s (Signages & Markings).furniture‘s
of existing road,
check the availability of
improvement
check the availability of
improvement
xxxiii. Inorbit Mall Junction
Detailed Project Report 79
Road Details LOS - Existing road (2014)
Proposed developmentScheme (2014)
LOS - After improvement (2014)
RemarksRoad Segment Type of Road
Width of road segment
Existing RoadConfiguration
Traffic From
Coastal Road,
PCU/hr
Design Capacity of
existing road,
PCU/hr
V/C ratio LOS
Traffic From
Coastal Road,
PCU/hr
DesignCapacity
of existing road,
PCU/hr
V/C ratio LOS
Link Road Arterial Road 18m 4 lane divided 917 3600 0.25
B-
AboveAverage
Minor improvements like installation of road
furniture‘s (Signages & Markings).
917 3600 0.25
B-
AboveAverage
-
Inorbit Side Road Arterial Road 20m 4 lane divided 917 3600 0.25
B- AboveAverage
Minor improvements like installation of road
furniture‘s (Signages & Markings).
917 3600 0.25
B- AboveAverage
-
Goregaon - Mulund Link Road Arterial Road 20m 4 lane divided 917 3600 0.25
B-
AboveAverage
Minor improvements like installation of road
furniture‘s (Signages & Markings).
917 3600 0.25
B-
AboveAverage
-
Junction Name xxxii. T -Junction ( MDP Road - Inorbit Side Road Junction )
RoadSegment
LOS- Horizon Year (2043)
Proposed developmentScheme (2043)
LOS- After Improvement Horizon Year (2043)
RemarksTraffic from Coastal Road,
PCU/hr
Design Capacity
PCU/hrV/C ratio LOS
Traffic From CoastalRoad, PCU/hr
Design Capacity of existing road, PCU/hr
V/C ratio LOS
MDP Road 2226 2900 0.77D -Below Average
6 lane divided 2226 4300 0.52
C-
Average
Site visit requested to
land for the proposed
Inorbit SideRoad
2226 2900 0.77D -Below Average
6 lane divided 2226 4300 0.52
C-
Average
Site visit requested to
land for the proposed
Inorbit SideRoad
Sub Arterial Road
20m 4 lane divided 1232 2900 0.42
C-
Average
Minor improveme
nts like installation
of road
(Signages & Markings).
1656 2900 0.57C -
Average
Minor improvements like installation of
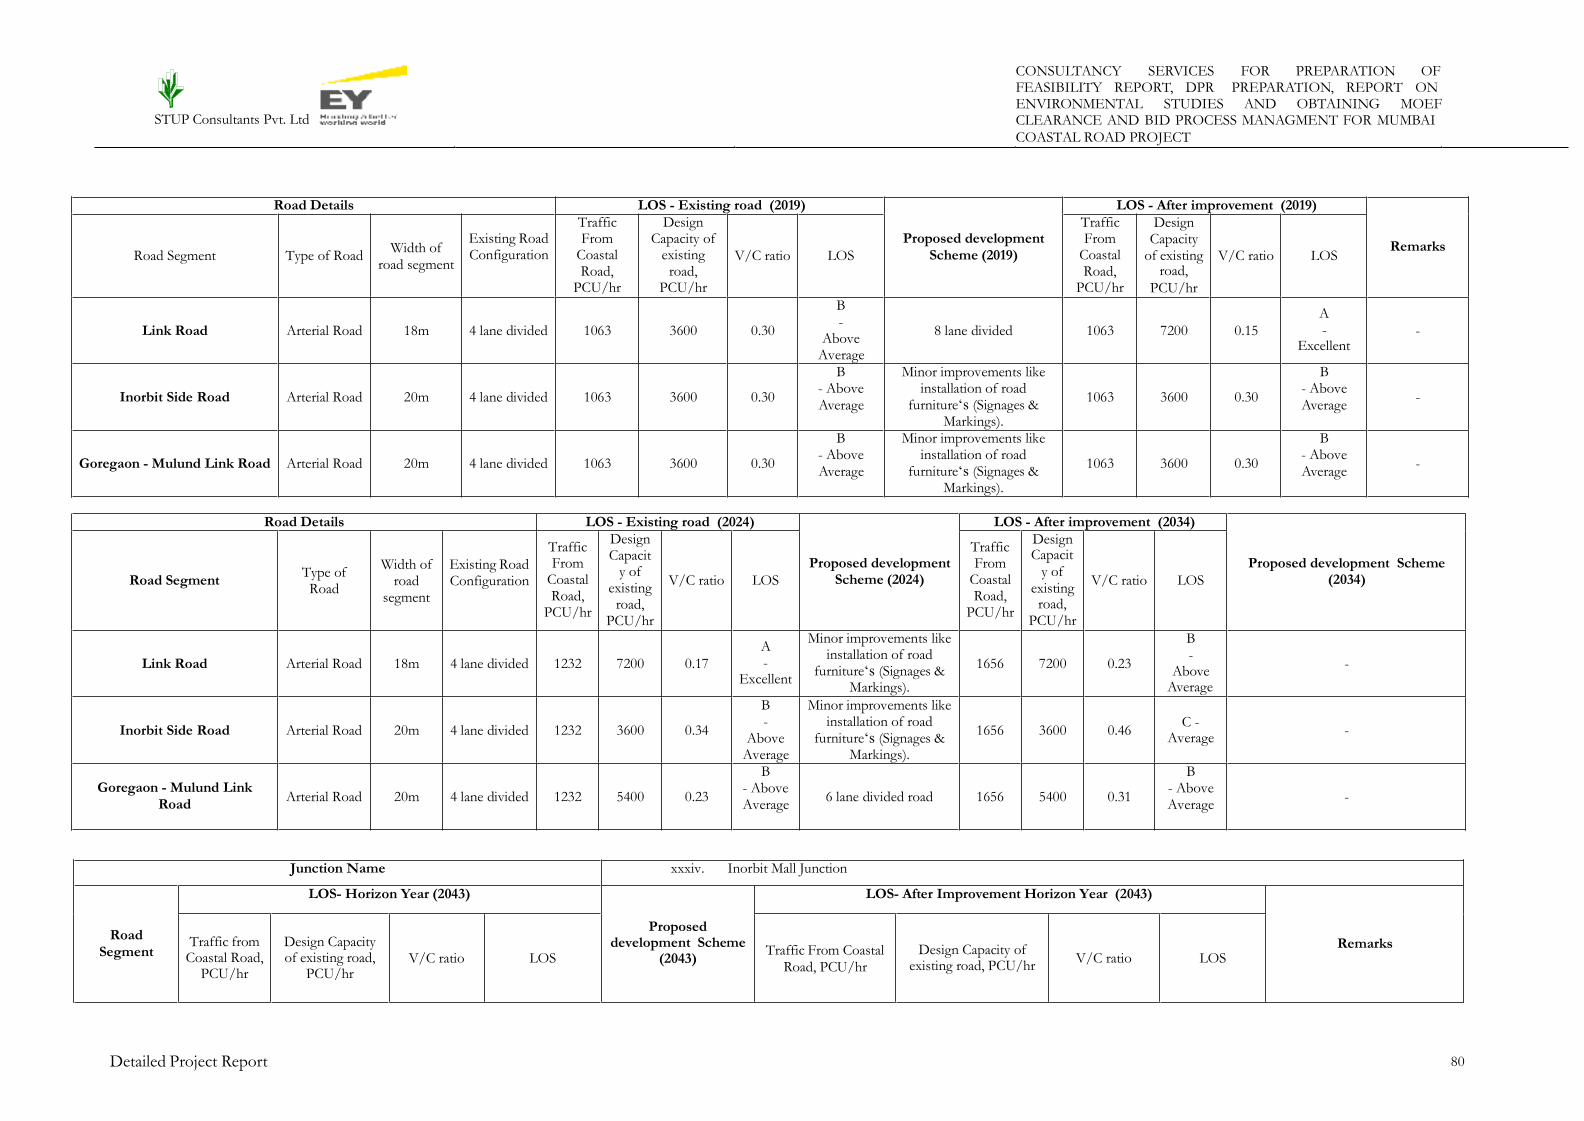
CONSULTANCY SERVICES FOR PREPARATION OFFEASIBILITY REPORT, DPR PREPARATION, REPORT ONENVIRONMENTAL STUDIES AND OBTAINING MOEF
STUP Consultants Pvt. Ltd CLEARANCE AND BID PROCESS MANAGMENT FOR MUMBAI
COASTAL ROAD PROJECT
road,
Excellent
Capacit
road,
Average
Detailed Project Report 80
Junction Name xxxiv. Inorbit Mall Junction
RoadSegment
LOS- Horizon Year (2043)
Proposed development Scheme
(2043)
LOS- After Improvement Horizon Year (2043)
Traffic from Coastal Road,
PCU/hr
Design Capacity of existing road,
PCU/hrV/C ratio LOS
Traffic From CoastalRoad, PCU/hr
Design Capacity of existing road, PCU/hr
V/C ratio LOSRemarks
Road Details LOS - Existing road (2024)
Proposed developmentScheme (2024)
LOS - After improvement (2034)
Proposed development Scheme(2034)Road Segment
Type ofRoad
Width of road
segment
Existing RoadConfiguration
Traffic From
Coastal Road,
PCU/hr
Design Capacit
y of existing
road,PCU/hr
V/C ratio LOS
Traffic From
Coastal Road,
PCU/hr
Design
y of existing
PCU/hr
V/C ratio LOS
Link Road Arterial Road 18m 4 lane divided 1232 7200 0.17
A-
Excellent
Minor improvements like installation of road
furniture‘s (Signages & Markings).
1656 7200 0.23
B-
Above-
Inorbit Side Road Arterial Road 20m 4 lane divided 1232 3600 0.34
B-
AboveAverage
Minor improvements like installation of road
furniture‘s (Signages & Markings).
1656 3600 0.46C -
Average-
Goregaon - Mulund LinkRoad
Arterial Road 20m 4 lane divided 1232 5400 0.23
B- AboveAverage
6 lane divided road 1656 5400 0.31
B- AboveAverage
-
Road Details LOS - Existing road (2019)
Proposed developmentScheme (2019)
LOS - After improvement (2019)
RemarksRoad Segment Type of Road
Width of road segment
Existing RoadConfiguration
Traffic From
Coastal Road,
PCU/hr
Design Capacity of
existing road,
PCU/hr
V/C ratio LOS
Traffic From
Coastal Road,
PCU/hr
DesignCapacity
of existing
PCU/hr
V/C ratio LOS
Link Road Arterial Road 18m 4 lane divided 1063 3600 0.30
B-
AboveAverage
8 lane divided 1063 7200 0.15
A- -
Inorbit Side Road Arterial Road 20m 4 lane divided 1063 3600 0.30
B- AboveAverage
Minor improvements like installation of road
furniture‘s (Signages & Markings).
1063 3600 0.30
B- AboveAverage
-
Goregaon - Mulund Link Road Arterial Road 20m 4 lane divided 1063 3600 0.30
B- AboveAverage
Minor improvements like installation of road
furniture‘s (Signages & Markings).
1063 3600 0.30
B- AboveAverage
-

CONSULTANCY SERVICES FOR PREPARATION OFFEASIBILITY REPORT, DPR PREPARATION, REPORT ONENVIRONMENTAL STUDIES AND OBTAINING MOEF
STUP Consultants Pvt. Ltd CLEARANCE AND BID PROCESS MANAGMENT FOR MUMBAI
COASTAL ROAD PROJECT
Above Average
availability of land for the
availability of land for the
xxxv. S V Road -Goregaon Mulund Link Road Junction
road,
road,
Excellent
Detailed Project Report 81
Road Details LOS - Existing road (2019)
Proposed developmentScheme (2019)
LOS - After improvement (2019)
Road Segment Type of RoadWidth of
road segment
Existing RoadConfiguration
Traffic From
Coastal Road,
PCU/hr
Design Capacity of
existing road,
PCU/hr
V/C ratio LOS
Traffic From
Coastal Road,
PCU/hr
DesignCapacity
of existing
PCU/hr
V/C ratio LOSRemarks
S V Road Arterial Road 18m 4 lane divided 1063 3600 0.30
B- Above Average
6 lane divided 1063 5400 0.20
A- -
Goregaon - Mulund Link Road Arterial Road 20m 4 lane divided 1063 3600 0.30
B- AboveAverage
Minor improvements like installation of road
furniture‘s (Signages & Markings).
1063 3600 0.30
B- AboveAverage
-
Road Details LOS - Existing road (2014)
Proposed developmentScheme (2014)
LOS - After improvement (2014)
RemarksRoad Segment Type of Road
Width of road segment
Existing RoadConfiguration
Traffic From
Coastal Road,
PCU/hr
Design Capacity of
existing road,
PCU/hr
V/C ratio LOS
Traffic From
Coastal Road,
PCU/hr
DesignCapacity
of existing
PCU/hr
V/C ratio LOS
S V Road Arterial Road 18m 4 lane divided 917 3600 0.25
B- AboveAverage
Minor improvements like installation of road
furniture‘s (Signages & Markings).
917 3600 0.25
B- AboveAverage
-
Goregaon - Mulund Link Road Arterial Road 20m 4 lane divided 917 3600 0.25
B-
Above
Average
Minor improvements like installation of road
furniture‘s (Signages & Markings).
917 3600 0.25
B-
Above
Average
-
Link Road 2226 7200 0.31B -Above Average
- 2226 7200 0.31
B- -
Inorbit SideRoad
2226 3600 0.62D -Below Average
6 lane divided 2226 5400 0.41B-
Above Average
Site visit requested to check the
proposed improvement
Goregaon -Mulund Link
Road
2226 5400 0.41D -Below Average
8 lane divided 2226 7200 0.31B-
Above Average
Site visit requested to check the
proposed improvement

CONSULTANCY SERVICES FOR PREPARATION OFFEASIBILITY REPORT, DPR PREPARATION, REPORT ONENVIRONMENTAL STUDIES AND OBTAINING MOEF
STUP Consultants Pvt. Ltd CLEARANCE AND BID PROCESS MANAGMENT FOR MUMBAI
COASTAL ROAD PROJECT
Capacit
road,
availability of land
availability of land
Detailed Project Report 82
Junction Name xxxvi. S V Road -Goregaon Mulund Link Road Junction
Road Segment
LOS- Horizon Year (2043)
Proposed developmentScheme (2043)
LOS- After Improvement Horizon Year (2043)
Traffic from Coastal Road,
PCU/hr
Design Capacity of existing road,
PCU/hrV/C ratio LOS
Traffic From CoastalRoad, PCU/hr
Design Capacity of existing road, PCU/hr
V/C ratio LOSRemarks
S V Road 2226 5400 0.41B -Above Average
8 lane divided 2226 7200 0.31B -Above Average
Site visit requested to check the
for the proposed improvement
Goregaon -Mulund Link
Road2226 5400 0.41
D -Below Average
8 lane divided 2226 7200 0.31B -Above Average
Site visit requested to check the
for the proposed improvement
Road Details LOS - Existing road (2024)
Proposed developmentScheme (2024)
LOS - After improvement (2034)
Proposed development Scheme(2034)Road Segment Type of Road
Width of road
segment
Existing RoadConfiguration
Traffic From
Coastal Road,
PCU/hr
Design Capacit
y of existing
road,PCU/hr
V/C ratio LOS
Traffic From
Coastal Road,
PCU/hr
Design
y of existing
PCU/hr
V/C ratio LOS
S V Road Arterial Road 18m 4 lane divided 1232 5400 0.23
B- AboveAverage
1656 5400 0.31
B- AboveAverage
-
Goregaon - Mulund LinkRoad
Arterial Road 20m 4 lane divided 1232 5400 0.23
B- Above Average
6 lane divided1656 5400 0.31
B- Above Average
-

CONSULTANCY SERVICES FOR PREPARATION OFFEASIBILITY REPORT, DPR PREPARATION, REPORT ONENVIRONMENTAL STUDIES AND OBTAINING MOEF
STUP Consultants Pvt. Ltd CLEARANCE AND BID PROCESS MANAGMENT FOR MUMBAI
COASTAL ROAD PROJECT
5.5.1 Kandivali Interchange
This interchange is end point of proposed north costal alignment. One of the entry ramp of the
interchange starts from Malad –Marve road. Likewise one of the exit ramp ends at Link road. It gives
connectivity of entry and exit on proposed alignment with required acceleration and deceleration. This
interchange covered traffic from Malad east & west, Kandiwali east &west, Boriwali east & west area.
Figure 5-57 shows the connectivity and directional movement of traffic between
proposed coastal road. Figure 5-58 shows the traffic network dispersal scheme.
Madh Island and
Figure 5-58: Traffic Dispersal Scheme – Kandivali Interchange
Proposed network development scheme for the catchment of Kandivali Interchange from Comprehensive
Mobility Plan has been reproduced in Figure 5-59. Table 5 39 gives the summary of network development
scheme.
Figure 5-57: Directional Traffic Movement – Kandivali Interchange
Figure 5-59: Network Development Scheme – Kandivali Interchange
Detailed Project Report 83

CONSULTANCY SERVICES FOR PREPARATION OFFEASIBILITY REPORT, DPR PREPARATION, REPORT ONENVIRONMENTAL STUDIES AND OBTAINING MOEF
STUP Consultants Pvt. Ltd CLEARANCE AND BID PROCESS MANAGMENT FOR MUMBAI
COASTAL ROAD PROJECT
Table 5-39 : Summary of Traffic Development Scheme
Junction Development Scheme
xxxvii.
xxxviii.
Junction which need to be developed :
Mithchowky Junction (Malad -Marve Road and Link Road junction)
Capacity of
PCU/hr
Capacity of
road,
Detailed Project Report 84
Road Details LOS - Existing road (2019)
Proposed developmentScheme (2019)
LOS - After improvement (2019)
Road Segment Type of RoadWidth of road
segment
Existing RoadConfiguration
Traffic From Coastal Road,
PCU/hr
Design Capacity of
existing road, PCU/hr
V/C ratio LOS
Traffic From
Coastal Road,
PCU/hr
Design
existing
PCU/hr
V/C ratio LOSRemarks
Malad- Marve Road Arterial Road 18m 4 lane divided 570 3600 0.16A-
Excellent
6 lane divided 570 5400 0.11A-
Excellent
-
Link Road Arterial Road 18m 4 lane divided 570 3600 0.16A-
Excellent
8 lane divided 570 7200 0.08A-
Excellent
-
Road Details LOS - Existing road (2014)
Proposed developmentScheme (2014)
LOS - After improvement (2014)
RemarksRoad Segment Type of Road
Width of road segment
Existing RoadConfiguration
Traffic From Coastal Road,
PCU/hr
Design Capacity of
existing road, PCU/hr
V/C ratio LOS
Traffic From
Coastal Road,
PCU/hr
Design
existing road,
V/C ratio LOS
Malad- Marve Road Arterial Road 18m 4 lane divided 492 3600 0.14A-
Excellent
Minor improvements like installation of road furniture‘s
(Signages & Markings).492 3600 0.14
A-
Excellent
-
Link Road Arterial Road 18m 4 lane divided 492 3600 0.14A-
Excellent
Minor improvements like installation of road furniture‘s
(Signages & Markings).492 3600 0.14
A-
Excellent
-
Name of Interchange Kandivali Interchange
Sl No. Name of Road Proposed Road Width
2019 Widening Scheme
1
Malad Marve Road 18.30m
Chincholi Bunder Link Road 36.60m
Chunilala Giridharilal Marg 27.45m
Shankar Lane 18.30m
2024 Widening Scheme
2
Shri Sevanth Lokhandwala Marg 27.45m
D Monte Lane 18.30m
Mahatma Gandhi Road 27.45m
2034 Widening Scheme
3
Baf Hira Nagar Road 18.30m
D P Road 18.30m
Ramachndra Ln 18.30m

CONSULTANCY SERVICES FOR PREPARATION OFFEASIBILITY REPORT, DPR PREPARATION, REPORT ONENVIRONMENTAL STUDIES AND OBTAINING MOEF
STUP Consultants Pvt. Ltd CLEARANCE AND BID PROCESS MANAGMENT FOR MUMBAI
COASTAL ROAD PROJECT
Capacity
PCU/hr
Excellent
Excellent
xl. Mahatma Gandhi Road - Link Road junction
Capacity
road,
Excellent
Excellent
Detailed Project Report 85
Road Details LOS - Existing road (2014)
Proposed developmentScheme (2014)
LOS - After improvement (2014)
Road Segment Type of RoadWidth of road
segment
Existing RoadConfiguration
Traffic From Coastal Road,
PCU/hr
Design Capacity of
existing road, PCU/hr
V/C ratio LOS
Traffic From
Coastal Road,
PCU/hr
Design
of existing
PCU/hr
V/C ratio LOSRemarks
Mahatma Gandhi Road Arterial Road 18m 4 lane divided 492 3600 0.14A-
Excellent
Minor improvements like installation of road
furniture‘s (Signages & Markings).
492 3600 0.14A- -
Link Road Arterial Road 18m 4 lane divided 492 3600 0.14
A-
Excellent
Minor improvements like installation of road
furniture‘s (Signages & Markings).
492 3600 0.14
A- -
Junction Name xxxix. Mithchowky Junction (Malad -Marve Road and Link Road junction)
LOS- Horizon Year (2043)
Proposed development
Scheme (2043)
LOS- After Improvement Horizon Year (2043)
RoadSegment
Traffic from Coastal Road,
PCU/hr
Design Capacity of existing road,
PCU/hrV/C ratio LOS
Traffic From CoastalRoad, PCU/hr
Design Capacity of existing road, PCU/hr
V/C ratio LOSRemarks
Malad-Marve Road
1195 5400 0.22B -Above Average
Minor improvements like installation of road furniture‘s (Signages &
Markings).
1195 5400 0.22B -Above Average
-
Link Road 1195 7200 0.17A -
Excellent1195 7200 0.17
A -Excellent
-
Road Details LOS - Existing road (2024)
Proposed developmentScheme (2024)
LOS - After improvement (2034)
Proposed developmentScheme (2034)Road Segment
Type ofRoad
Width of road
segment
Existing Road
Configuratio n
Traffic From Coastal Road,
PCU/hr
DesignCapacity
of existing road,
PCU/hr
V/Cratio
LOS
Traffic From
Coastal Road,
PCU/hr
Design
of existing road,
V/Cratio
LOS
Malad- MarveRoad
Arterial Road 18m4 lane
divided661 5400 0.12
A-
Excellent
Minor improvements like installation of road furniture‘s
(Signages & Markings).889 5400 0.16
A-
-
Link Road Arterial Road 18m4 lane
divided661 7200 0.09
A-
Excellent889 7200 0.12
A-
-

CONSULTANCY SERVICES FOR PREPARATION OFFEASIBILITY REPORT, DPR PREPARATION, REPORT ONENVIRONMENTAL STUDIES AND OBTAINING MOEF
STUP Consultants Pvt. Ltd CLEARANCE AND BID PROCESS MANAGMENT FOR MUMBAI
COASTAL ROAD PROJECT
Capacity
PCU/hr
Scheme (2034)
PCU/hr
Excellent
Detailed Project Report 86
Junction Name xli. Mithchowky Junction (Malad -Marve Road and Link Road junction)
LOS- Horizon Year (2043)
Proposed development
Scheme (2043)
LOS- After Improvement Horizon Year (2043)
RoadSegment
Traffic from Coastal Road,
PCU/hr
Design Capacity of existing road,
PCU/hrV/C ratio LOS
Traffic From CoastalRoad, PCU/hr
Design Capacity of existing road, PCU/hr
V/C ratio LOSRemarks
MahatmaGandhi Road
1195 5400 0.22B -Above Average
Minor improvements like installation of road furniture‘s
(Signages & Markings).
1195 5400 0.22B -Above Average
-
Link Road 1195 7200 0.17A -
Excellent1195 7200 0.17
A -Excellent
-
Road Details LOS - Existing road (2024)
Proposed developmentScheme (2024)
LOS - After improvement (2034)
Road SegmentType ofRoad
Width of road
segment
Existing RoadConfiguration
Traffic From Coastal Road,
PCU/hr
Design Capacity of
existing road, PCU/hr
V/Cratio
LOS
Traffic From
Coastal Road,
PCU/hr
Design Capacity
of existing
road,
V/Cratio
LOSProposed development
Mahatma GandhiRoad
Arterial Road 18m 4 lane divided 661 5400 0.12A-
Excellent
Minor improvements like installation of road
furniture‘s (Signages & Markings).
889 5400 0.16A-
-
Link Road Arterial Road 18m 4 lane divided 661 7200 0.09A-
Excellent
889 7200 0.12A-
Excellent
-
Road Details LOS - Existing road (2019)
Proposed developmentScheme (2019)
LOS - After improvement (2019)
RemarksRoad Segment Type of Road
Width of road segment
Existing RoadConfiguration
Traffic From Coastal Road,
PCU/hr
Design Capacity of
existing road, PCU/hr
V/C ratio LOS
Traffic From
Coastal Road,
PCU/hr
Design
of existing road,
V/C ratio LOS
Mahatma Gandhi Road Arterial Road 18m 4 lane divided 570 3600 0.16A-
Excellent
6 lane divided 570 5400 0.11A-
Excellent
-
Link Road Arterial Road 18m 4 lane divided 570 3600 0.16A-
Excellent8 lane divided 570 7200 0.08
A-
Excellent-

CONSULTANCY SERVICES FOR PREPARATION OFFEASIBILITY REPORT, DPR PREPARATION, REPORT ONENVIRONMENTAL STUDIES AND OBTAINING MOEF
STUP Consultants Pvt. Ltd CLEARANCE AND BID PROCESS MANAGMENT FOR MUMBAI
COASTAL ROAD PROJECT
•
•
•
•
•
•
•
•
Alignment in CRZ/ coastal area
Climate change/ sea level rise
High pollution due to vehicular congestion
Aesthetic and social aspects
Land Availability
Storm water and sewage discharges
Locations of Archaeological and religious importance
Social Aspects
6. Alignment Studies
6.1 Project Influence Area
In order to formulate alignment options it is necessary to identify various site constraints that may affect
the outcome of the alignment options studies. Site constraints for a road project can be of the following
nature singly or in combinations:
Engineering constraint
Socio-Environmental constraint
Financial constraint
Based on estimated capacity the coastal road is proposed as a eight lane road. Various site constraints are
defined in subsequent paragraphs.
Figure 6.1: Section 1: Jagannath Bhosale Road to Priya Darshini Park
6.1.1 Project Sections
Based on traffic pattern and probable construction aspects following broad sections were identified:
Part A: South (Jagannath Bhosale Road to Worli end of Sea Link)
Section 1: Jagannath Bhosale Road to Priya Darshini Park
Section 2: Priya Darshini Park to Mahalaxmi
Section 3: Mahalaxmi to Baroda Palace
Section 4: Baroda Palace to Worli End of Sea Link
Part B: North (Bandra end of Sea Link to Kandivali Junction)
Section 5: Bandra End of Sea Link to Juhu Sea Side Garden
Section 6: Juhu Sea Side Garden to Ritumbhara College
Section 7: Ritumbhara College to Kandivali Junction and Central Institute of Fisheries, Versova to Madh
Island
6.1.2 Engineering and Social ConstraintsIn this section the main constraints are Fisherman route near Manora, Ganpati visarjan area of Girgaon
Chowpati and slum areas near Bimla House, as shown in Figure 6.1. Also note that there are many
structures of Archaeological importance having heritage value along the Marine Drive, which are
highlighted with red colour.
Alignment passing through tidal zone would require protection from waves and storm surge;
Highway to be designed to expressway standards considering its functionality;
Providing adequate cross sectional standards to accommodate future developments
Environmental Constraints:
Detailed Project Report 87

CONSULTANCY SERVICES FOR PREPARATION OFFEASIBILITY REPORT, DPR PREPARATION, REPORT ONENVIRONMENTAL STUDIES AND OBTAINING MOEF
STUP Consultants Pvt. Ltd CLEARANCE AND BID PROCESS MANAGMENT FOR MUMBAI
COASTAL ROAD PROJECT
Figure 6.2: Section 2: Priya Darshini Park to Mahalaxmi Figure 6.4: Section 4: Baroda Palace to Worli End of Sea Link
In this section the main constraints are religious area at Baroda Palace; slum areas at near Poonam
Chambers and near Worli Dairy, drainage outfall of Worli Dairy are shown in figure 6.4.In this section the main constraints are slums near Clinical Diagnostic Centre, Heritage structure at
Lincoln House (Grade II-B) and religious area of Mahalaxmi Temple as shown in Figure 6.2. Figure 6.5: Section 5: Bandra End of Sea Link to Juhu Sea Side Garden
Figure 6.3: Section 3: Mahalaxmi to Baroda Palace
In this section the main constraints are fishermen routes near Bandra Worli sea link toll plaza,
Bandra Band Stand, Chimbai Village, near Khar Danda village. There are large slum areas near Sea
Link and Khar Danda village. Presence of protected mangroves forest was observed abutting existing
shore line from Bandra Jogger‘s Park till Khar Danda village. These are depicted in figure 6.5.In this section the main constraints are slums near Haji Ali, religious area of Haji Ali and at Baroda
Palace, as shown in figure6.3.
Detailed Project Report 88

CONSULTANCY SERVICES FOR PREPARATION OFFEASIBILITY REPORT, DPR PREPARATION, REPORT ONENVIRONMENTAL STUDIES AND OBTAINING MOEF
STUP Consultants Pvt. Ltd CLEARANCE AND BID PROCESS MANAGMENT FOR MUMBAI
COASTAL ROAD PROJECT
Figure 6.6:Section 6: Juhu Sea Side Garden to Ritumbhara College 6.1.3 Environmental Constraints
The proposed coastal road from Nariman point to Kandivali junction link road passes near to
densely populated areas of Greater Mumbai. Presently traffic moves at an average speed of 20 kmph
due to congestion on roads. Pedestrian facilities are lacking the basic serviceability needs. This has
resulted in air and noise pollution. Noise levels in most parts of city during day and night time have
exceeded 65 decibels. Such high level of noise pollution results in long term impacts on citizens
including degradation of mental health and loss of hearing. The air pollution at such high levels also
results in various diseases. There are very few green spaces and public areas. Citizens of Mumbai also
spend three hours on an average every day in commuting for work in overcrowded public transport.
All these aspects have resulted in the degradation of the quality of life of citizens.
Therefore, the issues involved are:
•
•
•
•
•
•
•
•
Significant reduction in travel time is necessary;
Project must also provide for speedy public transport
Alignment passing through Coastal Regulation Zones
Impacts of climate change and sea level rise
Pedestrian movement along and across the proposed road;
Aesthetic issues related to flyovers or any other road structures;
Aesthetic and social aspects
Noise and air pollution due to fast moving, breaking and stationary vehicles.
In this section the main constraints are fishermen route near Juhu Sea Side Garden, Juhu airport
Flight path and presence of numerous slum areas near Leela Bunglow, Indra Nagar, Juhu Koliwada,
Moragaon Juhu and Mangroves area near Versova , Juhu beach, Rajiv Gandhi Institute of
Technology, Bharatnagar as shown in figure 6.6.
Figure 6.7:Section 7: Ritumbhara College to Kandivali Junction and Central Institute ofFisheries, Versova to Madh Island
6.1.4 Financial Constraints
The proposed coastal road is an expressway standard road. Therefore, it will be necessary to provide
traffic connectivity i.e. Interchanges/at grade junctions wherever necessary, and protection against
tidal impact. This also will have to cater to Environmental mitigation measures. It is also necessary to
optimize the cost of road in order to achieve financial viability. Therefore, road alignment design will
be constrained by the cost of construction, maintenance and operation. The following prime
objectives are considered for selecting alignment options:
•
•
•
•
•
Minimum length of tunnel
Minimum length of flyovers, bridges and viaducts
Maximum use of existing infrastructure and land
Minimum rehabilitation and resettlement
Minimum impact on Mangroves and other environmentally sensitive areasIn this section the main constraints are slum areas, drainage outfalls, and protected mangroves forest
area as presented in figure 6.7.
Detailed Project Report 89
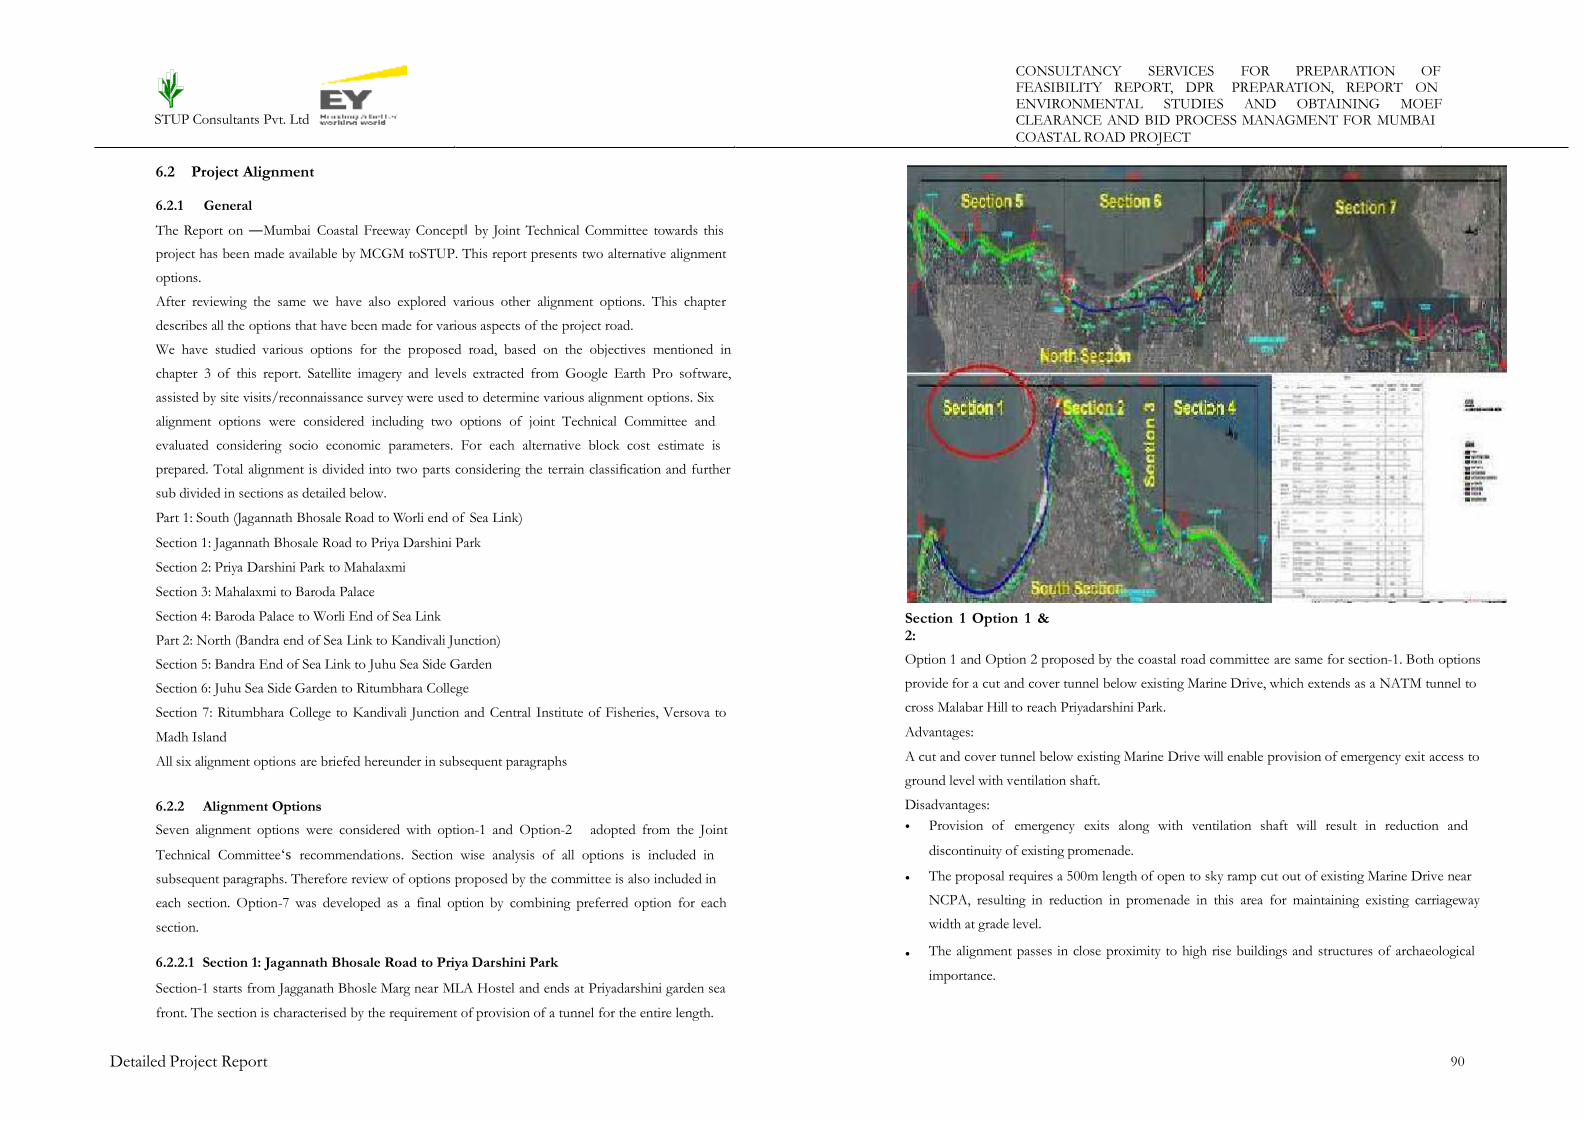
CONSULTANCY SERVICES FOR PREPARATION OFFEASIBILITY REPORT, DPR PREPARATION, REPORT ONENVIRONMENTAL STUDIES AND OBTAINING MOEF
STUP Consultants Pvt. Ltd CLEARANCE AND BID PROCESS MANAGMENT FOR MUMBAI
COASTAL ROAD PROJECT
6.2 Project Alignment
6.2.1 General
The Report on ―Mumbai Coastal Freeway Concept‖ by Joint Technical Committee towards this
project has been made available by MCGM toSTUP. This report presents two alternative alignment
options.
After reviewing the same we have also explored various other alignment options. This chapter
describes all the options that have been made for various aspects of the project road.
We have studied various options for the proposed road, based on the objectives mentioned in
chapter 3 of this report. Satellite imagery and levels extracted from Google Earth Pro software,
assisted by site visits/reconnaissance survey were used to determine various alignment options. Six
alignment options were considered including two options of joint Technical Committee and
evaluated considering socio economic parameters. For each alternative block cost estimate is
prepared. Total alignment is divided into two parts considering the terrain classification and further
sub divided in sections as detailed below.
Part 1: South (Jagannath Bhosale Road to Worli end of Sea Link)
Section 1: Jagannath Bhosale Road to Priya Darshini Park
Section 2: Priya Darshini Park to Mahalaxmi
Section 3: Mahalaxmi to Baroda Palace
Section 4: Baroda Palace to Worli End of Sea Link
Part 2: North (Bandra end of Sea Link to Kandivali Junction)
Section 5: Bandra End of Sea Link to Juhu Sea Side Garden
Section 6: Juhu Sea Side Garden to Ritumbhara College
Section 7: Ritumbhara College to Kandivali Junction and Central Institute of Fisheries, Versova to
Madh Island
All six alignment options are briefed hereunder in subsequent paragraphs
Section 1 Option 1 &2:
Option 1 and Option 2 proposed by the coastal road committee are same for section-1. Both options
provide for a cut and cover tunnel below existing Marine Drive, which extends as a NATM tunnel to
cross Malabar Hill to reach Priyadarshini Park.
Advantages:
A cut and cover tunnel below existing Marine Drive will enable provision of emergency exit access to
ground level with ventilation shaft.
Disadvantages:6.2.2 Alignment Options
Seven alignment options were considered with option-1 and Option-2 adopted from the Joint
Technical Committee‘s recommendations. Section wise analysis of all options is included in
subsequent paragraphs. Therefore review of options proposed by the committee is also included in
each section. Option-7 was developed as a final option by combining preferred option for each
section.
• Provision of emergency exits along with ventilation shaft will result in reduction and
discontinuity of existing promenade.
The proposal requires a 500m length of open to sky ramp cut out of existing Marine Drive near
NCPA, resulting in reduction in promenade in this area for maintaining existing carriageway
width at grade level.
The alignment passes in close proximity to high rise buildings and structures of archaeological
importance.
•
•6.2.2.1 Section 1: Jagannath Bhosale Road to Priya Darshini Park
Section-1 starts from Jagganath Bhosle Marg near MLA Hostel and ends at Priyadarshini garden sea
front. The section is characterised by the requirement of provision of a tunnel for the entire length.
Detailed Project Report 90

CONSULTANCY SERVICES FOR PREPARATION OFFEASIBILITY REPORT, DPR PREPARATION, REPORT ONENVIRONMENTAL STUDIES AND OBTAINING MOEF
STUP Consultants Pvt. Ltd CLEARANCE AND BID PROCESS MANAGMENT FOR MUMBAI
COASTAL ROAD PROJECT
Section 1 Option -3:
Option-3 comprised of provision of at grade road parallel to existing Marine Drive with new
promenade. However, the alignment shall permanently impact Girgaon chowpati for reclamation
necessary to provide approach for tunnel through Malabar Hill. Considering religious importance of
Girgaon chowpati for Ganesh Festival and heritage value of existing Marine Drive the option was
• Alignment requires provision of three sharp curves inside tunnel, thus adversely impacting user
safety.
• The option also will involve high traffic management during construction, utility relocation and
disruption to storm water drainage.
considered as not feasible.
Detailed Project Report 91
Sr.
NoSection
Type of Road /
Structure
Start of
Road/Structure
End of
Road/Struct
ure
Length
of
Alignme
nt (m)
Reclam
ation
Area (
ha)
No of
Heritag
e
structu
res
1
Jagannath
Bhosale Road
to
Priyadarshini
Park
Land Filled
Road
Jagannath Bhosale
MargNCPA 900 11.15
10
Ramp Portion
Tunnel EntryNCPA
Oberoi
Tower300 1.80
Tunnel Oberoi TowerNepean Sea
Road5200 8
Ramp Portion
Tunnel ExitNepean Sea Road
Priyadarshini
Park200 1.20
Sr. No SectionType of Road /
Structure
Start of
Road/Structure
End of
Road/Structure
Length of
Alignment
(m)
Reclamat
ion Area
(ha)
No of
Heritag
es in
each
section
1
Jagannat
h Bhosale
Road to
Priyadars
hini Park
Land Filled
Road
Jagannath
Bhosale MargChowpati Beach 5000 57.29
10
Ramp Portion
Tunnel EntryChowpati Beach Walkeshwar 400 2.40
Tunnel WalkeshwarRussian
Consulate1200
Ramp Portion
Tunnel Exit
Russian
Consulate
Clinical
Diagnostic
Center
400 2.40

CONSULTANCY SERVICES FOR PREPARATION OFFEASIBILITY REPORT, DPR PREPARATION, REPORT ONENVIRONMENTAL STUDIES AND OBTAINING MOEF
STUP Consultants Pvt. Ltd CLEARANCE AND BID PROCESS MANAGMENT FOR MUMBAI
COASTAL ROAD PROJECT
Section 1 Option -4:
The option considers a tunnel parallel to existing Marine Drive outside existing shore protection
wall. The alignment shall require reclamation in front of NCPA for a length of 1km for provision of
ramp approach to the tunnel.
Advantages:•
•
Does not require traffic management, utility relocation and reduced impact on Marine Drive
Provision of emergency exits with ventilation ducts to ground using existing promenade
possible
is
Disadvantages:
Section 1 Option -5
The option makes provision for two straight under sea tunnels for south bound and north bound
traffic separately as per project traffic requirement.
Advantages:
•
•
•
•
The alignment is curved reducing user safety and increasing operation requirement.
Provision of ventilation and emergency exit shaft will impact on existing promenade
The alignment has sharp curves at entry and exit.
Tunnel length is more as compared to a straight alignment thus increasing cost. • This option has probably the best alignment, with smooth curves to desired standards thus
improving safety and minimising operational requirements
Straight alignment of tunnel is easy to construct by using Tunnel Boring Machine thus reducing
construction time significantly
The alignment is away from structures of archeological importance, roads and buildings
Option requires minimal traffic management during construction.
•
•
•
Disadvantages:•
•
Option requires Sump and pump arrangement at the foot of Malabar Hill inside sea
The option requires high ventilation requirement
Detailed Project Report 92
S.No SectionType of Road /
Structure
Start of
Road/Structure
End of
Road/Structure
Length of
Alignment
(m)
Reclamati
on Area(
Hectare)
No of
Heritages in
each section
1 Jaganna Bridge on Sea Jagannath NCPA 1200 3.10 10
th
Bhosale
Road to
Priyada
rshini
Park
Bhosale Marg
Ramp Portion
Tunnel EntryNCPA Oberoi Tower 400 2.40
Tunnel Oberoi TowerRussian
Consulate5000
Ramp Portion
Tunnel Exit
Russian
Consulate
Clinical
Diagnostic
Center
400 2.40

CONSULTANCY SERVICES FOR PREPARATION OFFEASIBILITY REPORT, DPR PREPARATION, REPORT ONENVIRONMENTAL STUDIES AND OBTAINING MOEF
STUP Consultants Pvt. Ltd CLEARANCE AND BID PROCESS MANAGMENT FOR MUMBAI
COASTAL ROAD PROJECT
Section 1 Option -6
The option is similar to Option-5 however, additional provision of two tunnel for capturing traffic at
Tambe chowk and taking to Priyadarshini Park was incorporated.
Section 1 Option -7
The option is similar to option-6, however the tunnels leading to Tambe Chowk were realigned to
provide entry and exit on Marine Drive near Princess Street Flyover. This will not only avoid the
traffic congestion at Tambe Chowk during peak hour, it will also serve as a bypass to Pedder Road.
However, provision of this connectivity does not diminish requirement of direct connectivity to
Nariman Point and connectivity towards formation of ring road. Hence it is proposed to
accommodate provision for tunnels as proposed in option-6 for future connectivity. After study of
all options for section-1 of proposed alignment it was decided to adopt option-7 with two uni-
directional tunnels to Marine Drive with provision for additional two tunnels for future growth and
connectivity for Nariman Point. Due to constraints on Marine Drive, tunnels from Priyadarshini
Park to Marine drive can only be constructed as 2+2 lanes only.
6.2.2.2 Section 2: Priya Darshini Park to Mahalaxmi
The section runs from Priyadarshini park to Mahalaxmi temple area and is characterised by land-fill
road in inter-tidal zone. All options are similar with variation to area of reclamation and geometry
Detailed Project Report 93
S.No SectionType of Road
/ Structure
Start of
Road/Structure
End of
Road/Structure
Length of
Alignment
(m)
Reclamatio
n Area(
Hectare)
No of
Heritages
in each
section
1
Jagannath
Bhosale
Road to
Priyadars
hini Park
Land Filled
Road
Jagannath
Bhosale MargRaheja Center 410 7.94
10
Ramp Portion
Tunnel EntryRaheja Center NCPA 400
Tunnel NCPANepean Sea
Road4400 8
Tunnel Entry
and Exit at
walkeshwar
Nepean Sea
Road
Walkeshwar
junction960 6.28
Ramp Portion
Tunnel Exit
Nepean Sea
Road
Clinical
Diagnostic
Center
600
S.No SectionType of Road
/ Structure
Start of
Road/Structure
End of
Road/Structure
Length of
Alignment
(m)
Reclamatio
n Area(
Hectare)
No of
Heritages
in each
section
1
Jagannath
Bhosale
Road to
Priyadarshi
ni Park
Land Filled
Road
Jagannath
Bhosale MargRaheja Center 410 7.94
10
Ramp Portion
Tunnel EntryRaheja Center NCPA 400
Tunnel NCPANepean Sea
Road4400
Ramp Portion
Tunnel Exit
Nepean Sea
Road
Clinical
Diagnostic
Center
600

CONSULTANCY SERVICES FOR PREPARATION OFFEASIBILITY REPORT, DPR PREPARATION, REPORT ONENVIRONMENTAL STUDIES AND OBTAINING MOEF
STUP Consultants Pvt. Ltd CLEARANCE AND BID PROCESS MANAGMENT FOR MUMBAI
COASTAL ROAD PROJECT
of the alignment. Advantages and disadvantages of each option is presented in figures below. Based
on the analysis it was decided to adopt option 5 for the section for detailed design.
Section 2 Option-3 and 4
Priya Darshini Park to Mahalaxmi
Section 2 Option -1 & 2
Priya Darshini Park to Mahalaxmi
Section 2 Option-5 & 6
Priya Darshini Park to Mahalaxmi
Detailed Project Report 94
S.No Section
Type of
Road /
Structure
Start of
Road/Structure
End of
Road/Structure
Length
of
Align
ment
(m)
Reclamati
on Area
(ha)
No of
Heritag
es in
each
section
2
Priyadarshini
Park to
Mahalaxmi
Land Filled
Road
Clinical
Diagnostic
Center
Mahalakshmi
Temple1500 38.42 2
S.NoSection
Type of
Road /
Structure
Start of
Road/Structure
End of
Road/Structure
Length
of
Alignme
nt (m)
Reclamati
on Area(
Hectare)
No of
Heritages
in each
section
2
Priyadarshi
ni Park to
Mahalaxmi
Land Filled
Road
Priyadarshini
Park
Mahalakshmi
Temple
2400 35.77 2

CONSULTANCY SERVICES FOR PREPARATION OFFEASIBILITY REPORT, DPR PREPARATION, REPORT ONENVIRONMENTAL STUDIES AND OBTAINING MOEF
STUP Consultants Pvt. Ltd CLEARANCE AND BID PROCESS MANAGMENT FOR MUMBAI
COASTAL ROAD PROJECT
Section -3 is characterised by presence of structures of religious importance i.e. Mahalaxmi temple
and Haji Ali along with Baroda Palace. The religious centres attract huge crowds of devotees. Thus
there would be a high pedestrian circulation requirement. All options are described pictorially with
their advantages and disadvantages in figures below. After due analysis and considering religious
value of the area it was decided to adopt Option-1 as proposed by the JTC with provision of
Pedestrian circulation and minimum obstruction to view of Haji Ali from existing road.
6.2.2.3 Section 3 Mahalaxmi to Baroda Palace
Section 3 Option -1 & 2
Mahalaxmi to Baroda Palace
Detailed Project Report 95
S.No Section
Type of
Road /
Structure
Start of
Road/Structure
End of
Road/Structure
Length of
Alignment
(m)
Reclamation
Area
( Hectare)
No of
Heritag
es in
each
section
2
Priyadars
hini Park
to
Mahalax
mi
Land Filled
Road
Clinical
Diagnostic
Center
Mahalakshmi
Temple1490 36.64 1

CONSULTANCY SERVICES FOR PREPARATION OFFEASIBILITY REPORT, DPR PREPARATION, REPORT ONENVIRONMENTAL STUDIES AND OBTAINING MOEF
STUP Consultants Pvt. Ltd CLEARANCE AND BID PROCESS MANAGMENT FOR MUMBAI
COASTAL ROAD PROJECT
Heritages
section
Heritages
This option was dropped mainly due to fact that it impacts on religious value of Haji Ali. Also as the
proposed interchange at the location is a major point of dispersal for the success of proposed project
road, connecting same on a bridge was not feasible without major impact on aesthetic view and
heritage of the area.
Section 3 Option-3 & 4:
Mahalaxmi to Baroda Palace
Detailed Project Report 96
S.No Section
Type of Road /
Structure
Start ofRoad/Structure
End of Road/Structur
e
Length of Alignment
(m)
ReclamationArea( Hectare)
No of
in each
section
3
Mahalaxmi to Baroda
Palace
LandFilledRoad
Mahalakshmi NSCI 1350 19.90
1Bridge on
SeaNSCI Baroda Palace 450 8
S.No Section
Type of Road /
Structure
Start ofRoad/Structure
End ofRoad/Structure
Length of Alignment
(m)
Reclamation Area(
Hectare)
No of
in each
3
Mahalaxmi to Baroda
Palace
Bridge onSea
MahalakshmiTemple
Baroda Palace 1400 1

CONSULTANCY SERVICES FOR PREPARATION OFFEASIBILITY REPORT, DPR PREPARATION, REPORT ONENVIRONMENTAL STUDIES AND OBTAINING MOEF
STUP Consultants Pvt. Ltd CLEARANCE AND BID PROCESS MANAGMENT FOR MUMBAI
COASTAL ROAD PROJECT
Section 3 Option-5 & 6
Mahalaxmi to Baroda Palace6.2.2.4 Section 4 Baroda Palace to Worli End of Sea Link
Section 4 is characterised by proposal to reclaim on sea ward side of existing shore protection. The
area is marked by open rock outcrop and construction of embankment over same is proposed for all
options. All options propose reclamation with varied geometry of the alignment for this area.
Advantages and disadvantages of each option is depicted in figures below. Based on the option
analysis, it is decided to adopt option-5 with direct a connection to the existing Bandra Worli Sea
Link.
The option provides for a continuous bridge inside sea abutting existing shore line. Although the
option does not impact on religious value of Haji Ali dagrah, it will not create any public facilities
which are necessary at the locations.
Detailed Project Report 97
S.No Section
Type of
Road /
Structure
Start of
Road/Stru
cture
End of
Road/Stru
cture
Length of
Alignmen
t (m)
Reclamation
Area(
Hectare)
No of
Heritages
in each
section
3
Mahalaxmi
to Baroda
Palace
Bridge on
Sea
Mahalaksh
mi Temple
Baroda
Palace2000 2

CONSULTANCY SERVICES FOR PREPARATION OFFEASIBILITY REPORT, DPR PREPARATION, REPORT ONENVIRONMENTAL STUDIES AND OBTAINING MOEF
STUP Consultants Pvt. Ltd CLEARANCE AND BID PROCESS MANAGMENT FOR MUMBAI
COASTAL ROAD PROJECT
Section 4 Option-3 & 4
Baroda Palace to Worli End of Sea LinkSection 4 Option 1 & 2
Baroda Palace to Worli End of Sea Link
Road
Detailed Project Report 98
S.No SectionType of Road
/ Structure
Start of
Road/Structure
End of
Road/Structure
Length of
Alignment
(m)
Reclamati
on Area(
Hectare)
No of
Heritages
in each
section
4
Baroda
Palace to
BWSL
(Start)
Land Filled
RoadBaroda Palace
Markandeshwar
temple400 30.07
Bridge on SeaMarkandeshwar
templeDairy Colony 200
Land FilledDairy Colony Near BWSL 2100
Bridge on Sea Near BWSLMerging with
BWSL250
S.No Section
Type of
Road /
Structure
Start of
Road/Structure
End of
Road/Structure
Length of
Alignment
(m)
Reclamation
Area(
Hectare)
No of
Heritages
in each
section
4
Baroda
Palace to
BWSL
(Start)
Land Filled
Road Baroda Palace
Markandeshwar
temple550 37.00
Bridge on
Sea
Markandeshwar
temple Dairy Colony200
Land Filled
Road Dairy Colony Near BWSL2050
Bridge on
Sea Near BWSL
Merging with
BWSL200
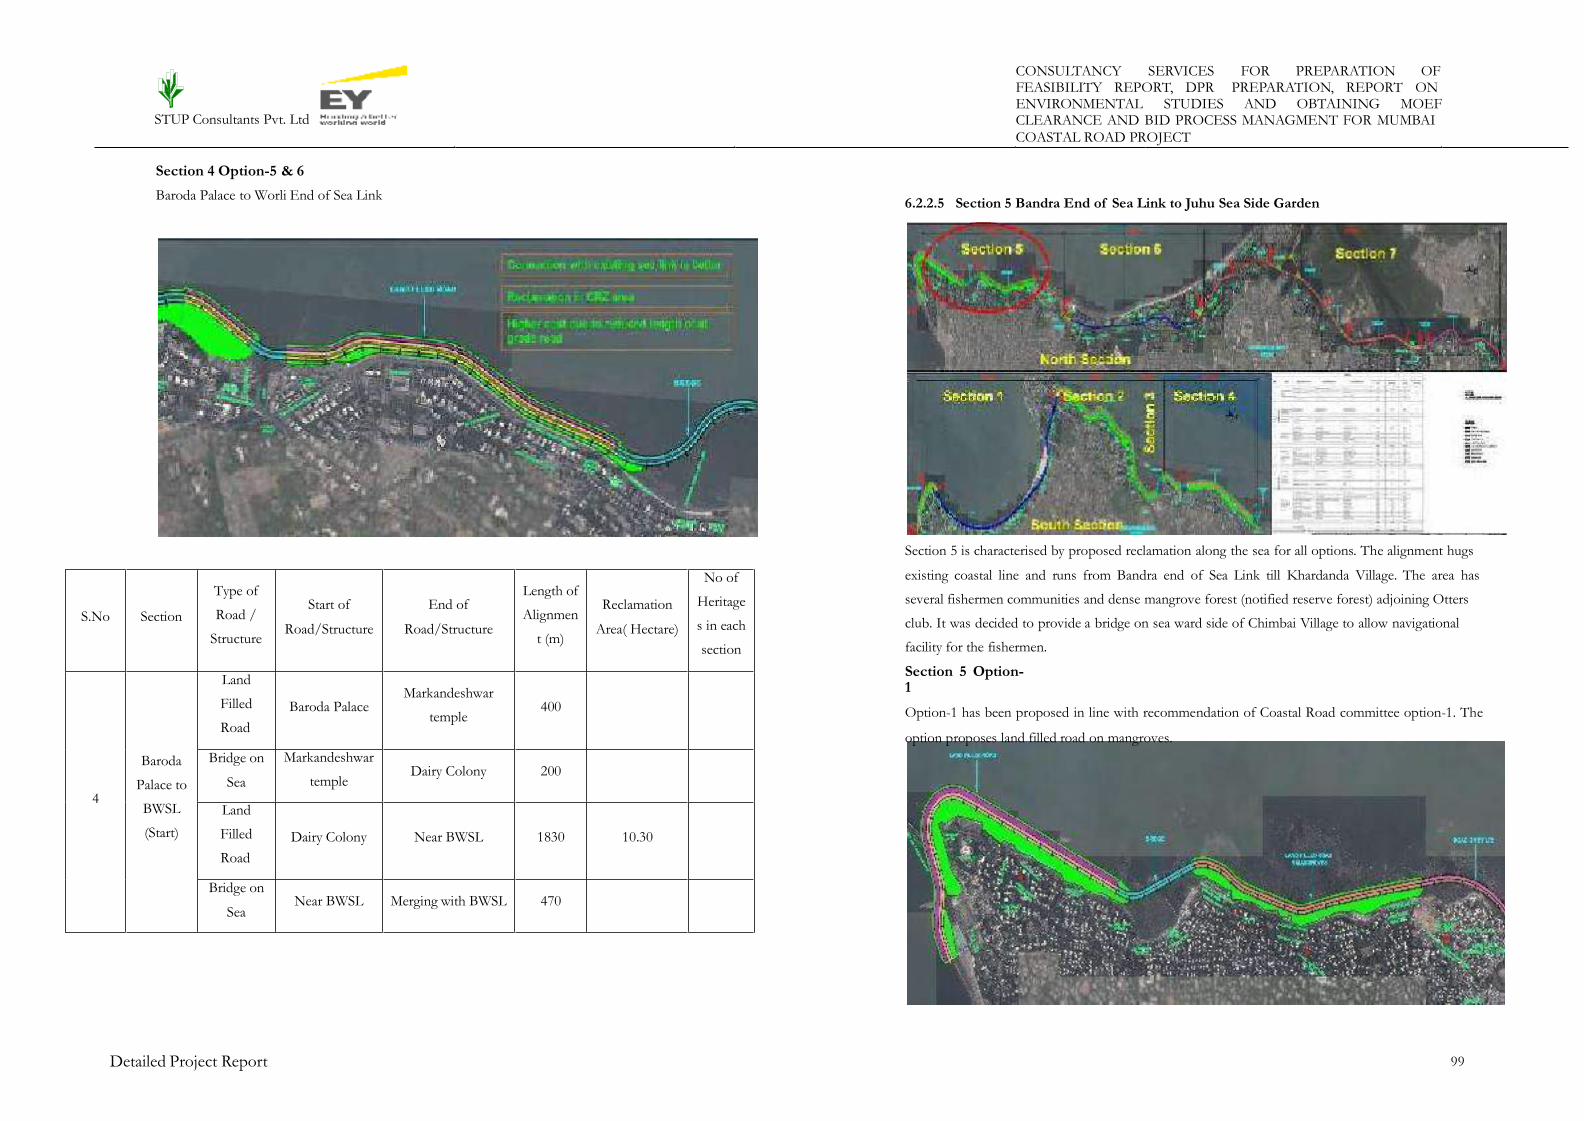
CONSULTANCY SERVICES FOR PREPARATION OFFEASIBILITY REPORT, DPR PREPARATION, REPORT ONENVIRONMENTAL STUDIES AND OBTAINING MOEF
STUP Consultants Pvt. Ltd CLEARANCE AND BID PROCESS MANAGMENT FOR MUMBAI
COASTAL ROAD PROJECT
Section 4 Option-5 & 6
Baroda Palace to Worli End of Sea Link6.2.2.5 Section 5 Bandra End of Sea Link to Juhu Sea Side Garden
Section 5 is characterised by proposed reclamation along the sea for all options. The alignment hugs
existing coastal line and runs from Bandra end of Sea Link till Khardanda Village. The area has
several fishermen communities and dense mangrove forest (notified reserve forest) adjoining Otters
club. It was decided to provide a bridge on sea ward side of Chimbai Village to allow navigational
facility for the fishermen.
Section 5 Option-1
Option-1 has been proposed in line with recommendation of Coastal Road committee option-1. The
option proposes land filled road on mangroves.
Detailed Project Report 99
S.No Section
Type of
Road /
Structure
Start of
Road/Structure
End of
Road/Structure
Length of
Alignmen
t (m)
Reclamation
Area( Hectare)
No of
Heritage
s in each
section
4
Baroda
Palace to
BWSL
(Start)
Land
Filled
Road
Baroda PalaceMarkandeshwar
temple400
Bridge on
Sea
Markandeshwar
templeDairy Colony 200
Land
Filled
Road
Dairy Colony Near BWSL 1830 10.30
Bridge on
SeaNear BWSL Merging with BWSL 470

CONSULTANCY SERVICES FOR PREPARATION OFFEASIBILITY REPORT, DPR PREPARATION, REPORT ONENVIRONMENTAL STUDIES AND OBTAINING MOEF
STUP Consultants Pvt. Ltd CLEARANCE AND BID PROCESS MANAGMENT FOR MUMBAI
COASTAL ROAD PROJECT
Section 5 Option-2
Option-2 has been proposed in line with recommendation of Coastal Road committee option-2. The
option proposes road on stilts in mangrove areas.
Section 5 Option-3 & 4
Option 3 is similar to option-1 with improved geometry.
Detailed Project Report 100
S.No Section
Type of
Road /
Structure
Start of
Road/Structure
End of
Road/Structure
Length of
Alignment
(m)
Reclamation
Area(
Hectare)
No of
Heritages in
each section
S.No SectionType of Road /
Structure
Start of
Road/Structure
End of
Road/Structure
Length of
Alignment
(m)
Reclamation
Area( Hectare)
No of
Heritages
in each
section
5
BWSL
(End) to
Juhu Sea
Side
Garden
(Start of
Tunnel)
Land Filled Road BWSL Toll Plaza Band Stand 1500 22.88
3
Road on Stilts Band StandSt‘Andrews
Church900
Bridge on SeaSt‘Andrews
Church
Bandra Joggers
Park500
Road on StiltsBandra Joggers
ParkKhar Danda 2700
Land Filled Road
on Mangroveskhar Danda
Juhu seaside
Garden200 1.20
S.No SectionType of Road
/ Structure
Start of
Road/Structure
End of
Road/Structure
Length of
Alignment
(m)
Reclamation
Area(
Hectare)
No of
Heritages in
each section
5
BWSL
(End) to
Juhu Sea
Side
Garden
(Start of
Tunnel)
Land Filled
Road
Merging with
BWSL
St‘Andrew
Church2300 52.66
3
Bridge
St‘Andrew
Church
Bandra Joggers
Park600
Land Filled
Road on
Mangroves
Bandra Joggers
Park
Dandekar
Chowk
1700 10.20
Road on Stilts
Dandekar
Chowk Khar Danda1025
Land Filled
Road on
Mangroves Khar Danda
Juhu seaside
Garden
200 1.20

CONSULTANCY SERVICES FOR PREPARATION OFFEASIBILITY REPORT, DPR PREPARATION, REPORT ONENVIRONMENTAL STUDIES AND OBTAINING MOEF
STUP Consultants Pvt. Ltd CLEARANCE AND BID PROCESS MANAGMENT FOR MUMBAI
COASTAL ROAD PROJECT
An option of direct connection to the Sea-Link near Bandra Fort is under study including contractual
modalities and corresponding changes may be incorporated at bid stage.
6.2.2.6 Section 6 Juhu Sea Side Garden to Ritumbhara CollegeSection 5 Option-5 & 6
Bandra End of Sea Link to Juhu Sea Side Garden
Section 6 is discussed below, for all the Alignment Options
Section 6 Option 1 & 2
Juhu Sea Side Garden to Ritumbhara College
The options recommended by Coastal Road Committee was to provide tunnels initially passing
through the Juhu Sea Side Garden followed by Juhu Airport and then following existing roads as
shown in Figure---. This would require a poor geometry of tunnels. In case the proposed tunnels are
built with cut and cover type of construction, it will require high traffic management with heavy
disruption to public utilities, In case deep tunnels are provided with TBM method, the path is likely
to interfere with other TBM tunnels planned for sewage disposal, water supply and metro line. With
four tunnels necessary to carry planned eight lanes, this will require construction equipment
Detailed Project Report 101
S.No Section
Type of
Road /
Structure
Start of
Road/Structure
End of
Road/Structure
Length of
Alignment
(m)
Reclamation
Area(
Hectare)
No of
Heritages in
each section
5BWSL(End
Land Filled
Road
Merging with
BWSL
St‘Andrews
Church2180 2
5
BWSL
(End) to
Juhu Sea
Side
Garden
(Start of
Tunnel)
Bridge on
Sea
Merging with
BWSLBandra Fort 775
3
Land Filled
RoadBandra Fort
St‘Andrews
Church2075
Bridge on
Sea
St‘ Andrews
Church
Bandra Joggers
Park600 47.24
Land Filled
Road on
Mangroves
Bandra Joggers
ParkKhar Danda 2400
) to Juhu
Sea Side
Garden
(Start of
Tunnel)
Bridge on
Sea
St‘Andrews
Church
Bandra Joggers
Park600
Land Filled
Road on
Mangroves
Bandra Joggers
Park
Dandekar
Chowk1810 10.86
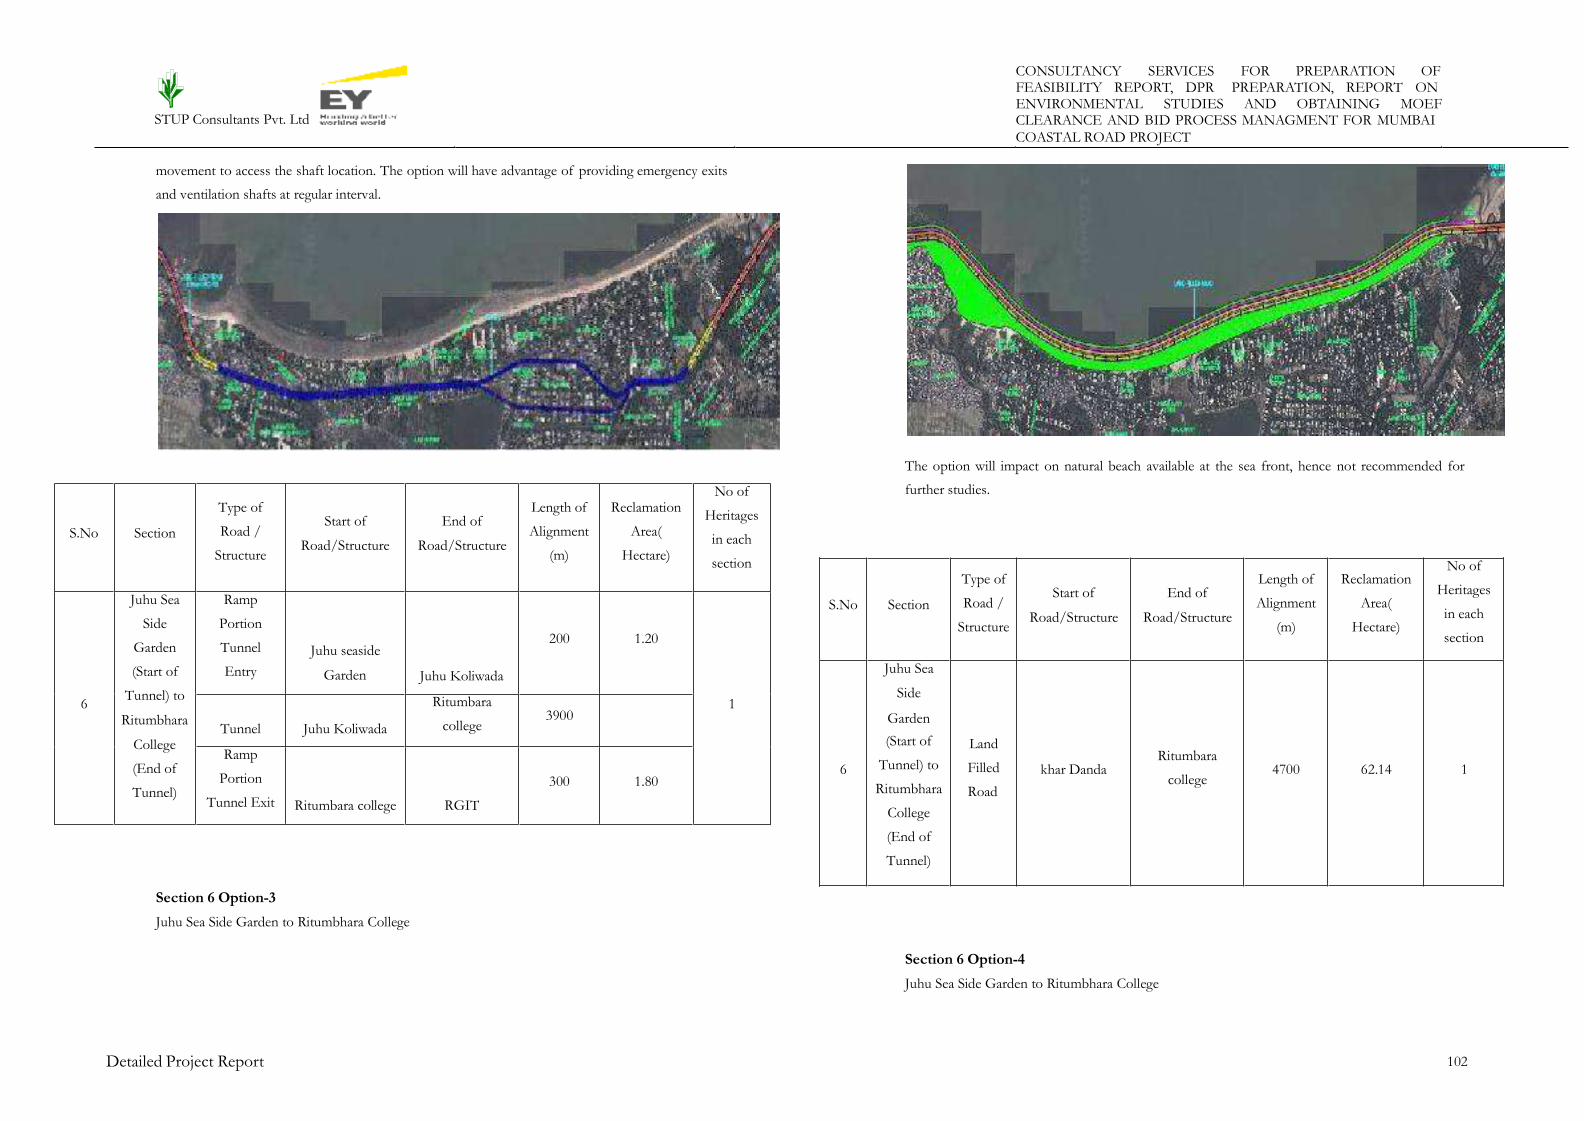
CONSULTANCY SERVICES FOR PREPARATION OFFEASIBILITY REPORT, DPR PREPARATION, REPORT ONENVIRONMENTAL STUDIES AND OBTAINING MOEF
STUP Consultants Pvt. Ltd CLEARANCE AND BID PROCESS MANAGMENT FOR MUMBAI
COASTAL ROAD PROJECT
movement to access the shaft location. The option will have advantage of providing emergency exits
and ventilation shafts at regular interval.
The option will impact on natural beach available at the sea front, hence not recommended for
further studies.
Garden
Section 6 Option-3
Juhu Sea Side Garden to Ritumbhara College
Section 6 Option-4
Juhu Sea Side Garden to Ritumbhara College
Detailed Project Report 102
S.No Section
Type of
Road /
Structure
Start of
Road/Structure
End of
Road/Structure
Length of
Alignment
(m)
Reclamation
Area(
Hectare)
No of
Heritages
in each
section
6
Juhu Sea
Side
(Start of
Tunnel) to
Ritumbhara
College
(End of
Tunnel)
Land
Filled
Road
khar DandaRitumbara
college4700 62.14 1
S.No Section
Type of
Road /
Structure
Start of
Road/Structure
End of
Road/Structure
Length of
Alignment
(m)
Reclamation
Area(
Hectare)
No of
Heritages
in each
section
6
Juhu Sea
Side
Garden
(Start of
Tunnel) to
Ritumbhara
College
(End of
Tunnel)
Ramp
Portion
Tunnel
Entry
Juhu seaside
Garden Juhu Koliwada
200 1.20
1
Tunnel Juhu Koliwada
Ritumbara
college3900
Ramp
Portion
Tunnel Exit Ritumbara college RGIT
300 1.80

CONSULTANCY SERVICES FOR PREPARATION OFFEASIBILITY REPORT, DPR PREPARATION, REPORT ONENVIRONMENTAL STUDIES AND OBTAINING MOEF
STUP Consultants Pvt. Ltd CLEARANCE AND BID PROCESS MANAGMENT FOR MUMBAI
COASTAL ROAD PROJECT
Option of cut and cover tunnels each per direction of traffic was studied. The option will require
heavy disruption to sea front during construction. Presence of rock outcrop at sea bed level will
result in difficult excavation activity, requiring blasting operation close to populated beach front.
Therefore the option is not considered as viable.
The option proposes four TBM tunnels with straight alignment with cut and cover portion limited to
start and end of tunnel. TBM entry shafts shall be located near Ritumbara College by forming a
temporary platform to +6m GTS level through reclamation. A shaft of 130m x 80m will be
constructed to adequate depth for entry of TBM. Vertical faces shall be constructed and retained
with touching piles/Diaphragm walls. Necessary dewatering arrangements shall be made to tackle
water seepage. Similarly exit shaft shall be constructed near tunnel end near Khar Danda Village. The
options was chosen on its merits for adoption.
6.2.2.7 Section 7 Ritumbhara College to Kandivali JunctionSection 6 Option-5 & 6
Juhu Sea Side Garden to Ritumbhara College
Detailed Project Report 103
S.No Section
Type of
Road /
Structure
Start of
Road/Structure
End of
Road/Structure
Length of
Alignment
(m)
Reclamation
Area(
Hectare)
No of
Heritages in
each
section
6
Juhu Sea
Side
Garden
(Start of
Tunnel) to
Ritumbhar
a College
(End of
Tunnel)
Ramp
Portion
Tunnel
Entry
Dandekar
ChowkKhar Danda 400 4.00
2Tunnel khar DandaRitumbara
college4350
Ramp
Portion
Tunnel
Exit
Ritumbara
collegeRGIT 400 4.00
S.No Section
Type of
Road /
Structure
Start of
Road/Structure
End of
Road/Structure
Length of
Alignment
(m)
Reclamation
Area(
Hectare)
No of
Heritages in
each section
6
Juhu Sea
Side
Garden
(Start of
Tunnel)
to
Ritumbh
ara
College
(End of
Tunnel)
Ramp
Portion
Tunnel
Entry
Khar DandaJuhu seaside
Garden500 9.40
1Tunnel
Juhu seaside
GardenRitumbara college 3800
Ramp
Portion
Tunnel
Exit
Ritumbara
collegeRGIT 400

CONSULTANCY SERVICES FOR PREPARATION OFFEASIBILITY REPORT, DPR PREPARATION, REPORT ONENVIRONMENTAL STUDIES AND OBTAINING MOEF
STUP Consultants Pvt. Ltd CLEARANCE AND BID PROCESS MANAGMENT FOR MUMBAI
COASTAL ROAD PROJECT
The section of project road alignment traverses through Nana Nani Park, slum area of Andheri
West, followed by Mangrove Area up to Kandivali. The alignment is very well defined due to non
availability of any other option. In all the options it is proposed to construct a double deck elevated
corridor up to Institute of Fisheries on existing road. This will affect very few structures erected on
existing road land. However, minimum resettlement and rehabilitation will be necessary. The project
road will then traverse through dense mangrove area at the rear of the Institute of Fisheries to
include spur to Madh island. Continuity of the double deck bridge over existing road will lead in to
Central Institute of Fisheries, Versova to Madh Island
road on stilts in this dense mangrove area, also crossing various perennial water
sections of land fill over mangroves are proposed in this area for cost reduction.
bodies. Small
6.2.2.8 Section 7 Option 1, 2, 3, 4, 5 & 6
Ritumbhara College to Kandivali Junction
Section 7 Option 1, 2, 3, 4, 5 & 6
Detailed Project Report 104
S.No Section
Type of
Road /
Structure
Start of
Road/Structure
End of
Road/Structure
Length of
Alignment
(m)
Reclamation
Area(
Hectare)
No of
Heritages
in each
section
7 Ritumbh
ara
College
(End of
Tunnel)
to
Kandival
i
Land Filled
Road on
Mangroves
RGITSeven
Bungalows1100 6.60
Elevated
Road
Seven
Bungalows
Central Institute
of Fisheries
Education
1100 ??
Land Filled
Road on
Mangroves
Central Institute
of Fisheries
Education
Millat Nagar 4545 27.27
Land Filled
RoadMillat Nagar Prakash Nagar 800 4.80
Land Filled
Road onPrakash Nagar Morgan Stanley 1800 10.80

CONSULTANCY SERVICES FOR PREPARATION OFFEASIBILITY REPORT, DPR PREPARATION, REPORT ONENVIRONMENTAL STUDIES AND OBTAINING MOEF
STUP Consultants Pvt. Ltd CLEARANCE AND BID PROCESS MANAGMENT FOR MUMBAI
COASTAL ROAD PROJECT
The proposed project road alignment starts by providing acceleration or deceleration at entry and
exit to connect the existing road. Entry and exit road of proposed alignment will connect to the
Marine Drive road and Free Press Journal road respectively.
Entry Exit on Marine Drive near Pricess Streetflyover:
The proposed project road alignment starts by widening of existing promenade on an catilever
maintaining the curved geometry of the marine drive. This is necessary to widen the existing road by
8m to provide for entry/exit of proposed tunnels on the Marine Drive. The proposed tunnels will
start with a cut and cover section to be constructed by driving secant piles and providing a temporary
steel structure to support traffic while excavation is carried out from top to bottom for cut and cover
section.
Amarsons GardenInterchange:
The proposed interchange connects the traffic to proposed alignment just after end of the tunnel and
ramp section. This trumpet interchange will connect the traffic on Bhula Bhai Desai Marg (Warden
Road). This interchange will provide connectivity to traffic from Kalbadevi, Girgaon, Bhuleshwar,
Malabar Hill, Kemp‘s Corner Area. Entry ramp of this junction starts from Tara Garden and exit
ramp ends near the U. S. Federal Government Building on existing Bhula Bhai Desai Road.
6.2.3 Recommended Alignment Option- Option 7
Based on above analysis alignment option-7 was formed and presented to the MCZMA. Based on
the observations and suggestions received from the MCZMA the final option for section-7 has been
formulated and presented in the figure below.
6.3 Interchange Design and Dispersal Scheme
6.3.1 Coastal Road Interchange (South Mumbai)
Jagannath Bhosale Marg Interchange:
This interchange has 8 free flow movement of traffic between existing road and proposed costal
road without any traffic conflict. Interchange location is near to Ch. 6+250 of proposed costal road
south alignment just after end of marin drive tunnel section.
Detailed Project Report 105
S.No Section
Type of
Road /
Structure
Start of
Road/Structure
End of
Road/Structure
Length of
Alignment
(m)
Reclamation
Area(
Hectare)
No of
Heritages
in each
section
Mangroves
Land Filled
RoadMorgan Stanley Ram Nagar 480 2.88
Land Filled
Road on
Mangroves
Ram Nagar Rajan Pada 300 1.80
Road on
StiltsRajan Pada
Kandivali
Junction2450
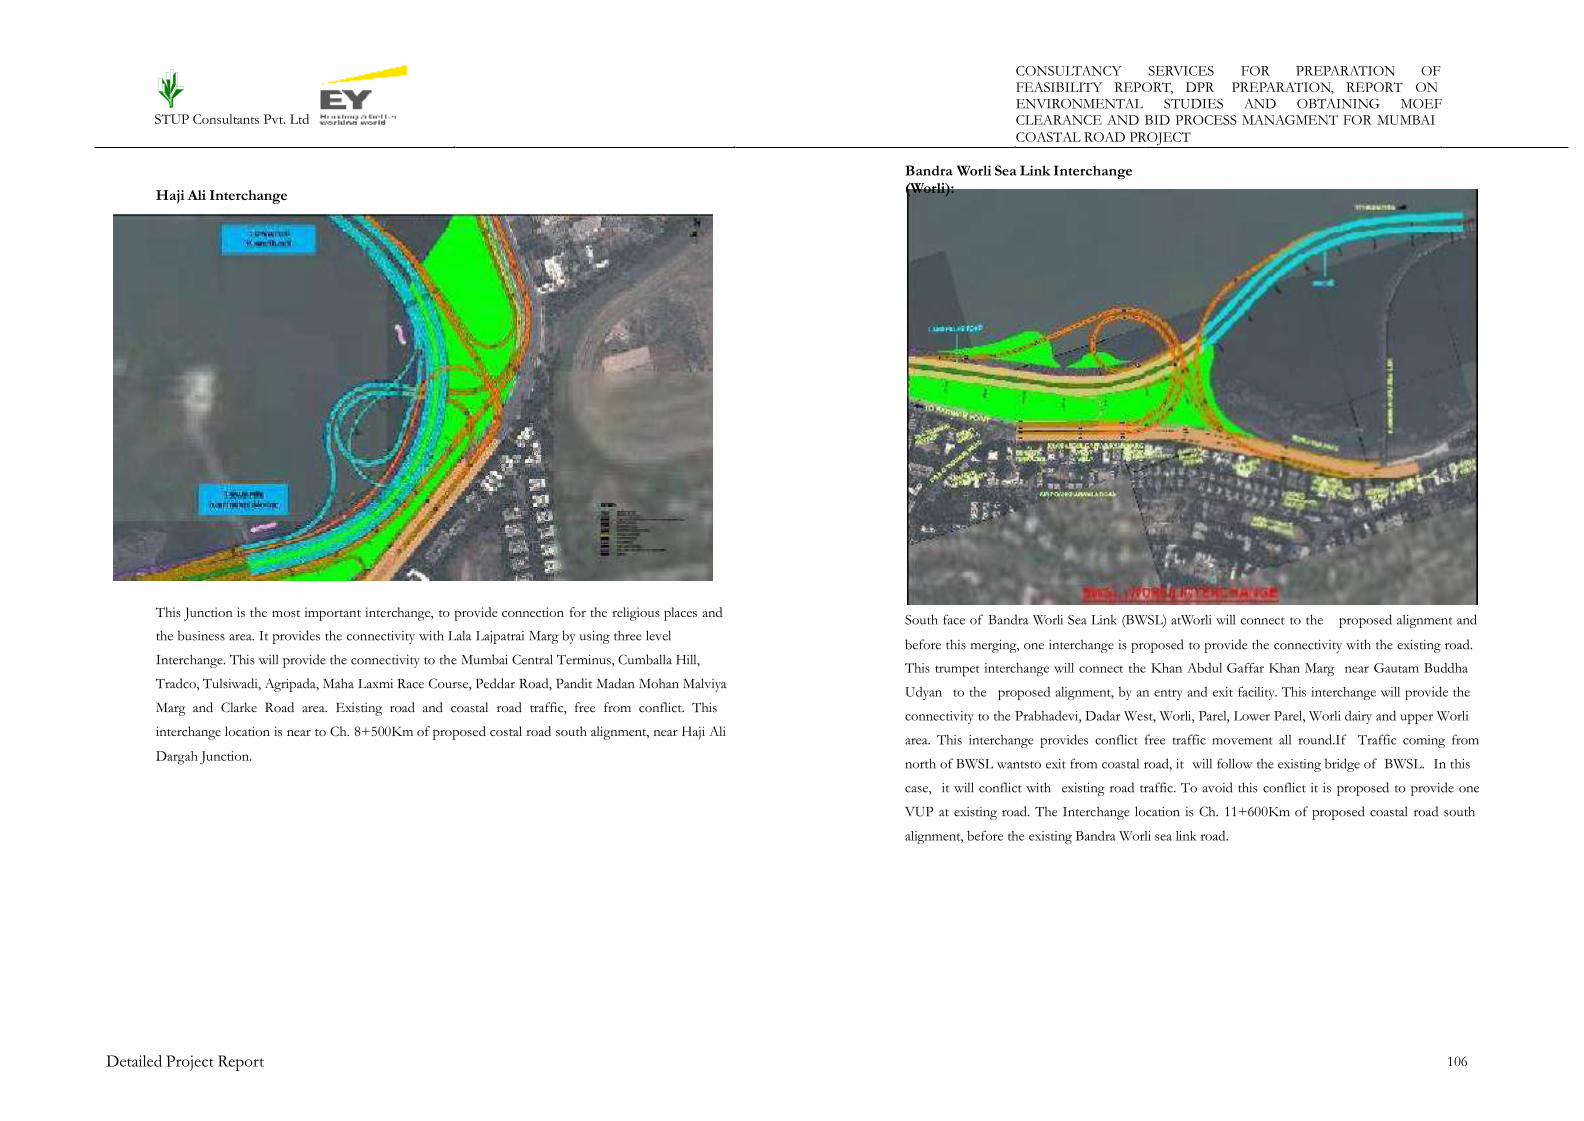
CONSULTANCY SERVICES FOR PREPARATION OFFEASIBILITY REPORT, DPR PREPARATION, REPORT ONENVIRONMENTAL STUDIES AND OBTAINING MOEF
STUP Consultants Pvt. Ltd CLEARANCE AND BID PROCESS MANAGMENT FOR MUMBAI
COASTAL ROAD PROJECT
Bandra Worli Sea Link Interchange(Worli):
Haji Ali Interchange
This Junction is the most important interchange, to provide connection for the religious places and
the business area. It provides the connectivity with Lala Lajpatrai Marg by using three level
Interchange. This will provide the connectivity to the Mumbai Central Terminus, Cumballa Hill,
Tradco, Tulsiwadi, Agripada, Maha Laxmi Race Course, Peddar Road, Pandit Madan Mohan Malviya
Marg and Clarke Road area. Existing road and coastal road traffic, free from conflict. This
interchange location is near to Ch. 8+500Km of proposed costal road south alignment, near Haji Ali
Dargah Junction.
South face of Bandra Worli Sea Link (BWSL) atWorli will connect to the proposed alignment and
before this merging, one interchange is proposed to provide the connectivity with the existing road.
This trumpet interchange will connect the Khan Abdul Gaffar Khan Marg near Gautam Buddha
Udyan to the proposed alignment, by an entry and exit facility. This interchange will provide the
connectivity to the Prabhadevi, Dadar West, Worli, Parel, Lower Parel, Worli dairy and upper Worli
area. This interchange provides conflict free traffic movement all round.If Traffic coming from
north of BWSL wantsto exit from coastal road, it will follow the existing bridge of BWSL. In this
case, it will conflict with existing road traffic. To avoid this conflict it is proposed to provide one
VUP at existing road. The Interchange location is Ch. 11+600Km of proposed coastal road south
alignment, before the existing Bandra Worli sea link road.
Detailed Project Report 106
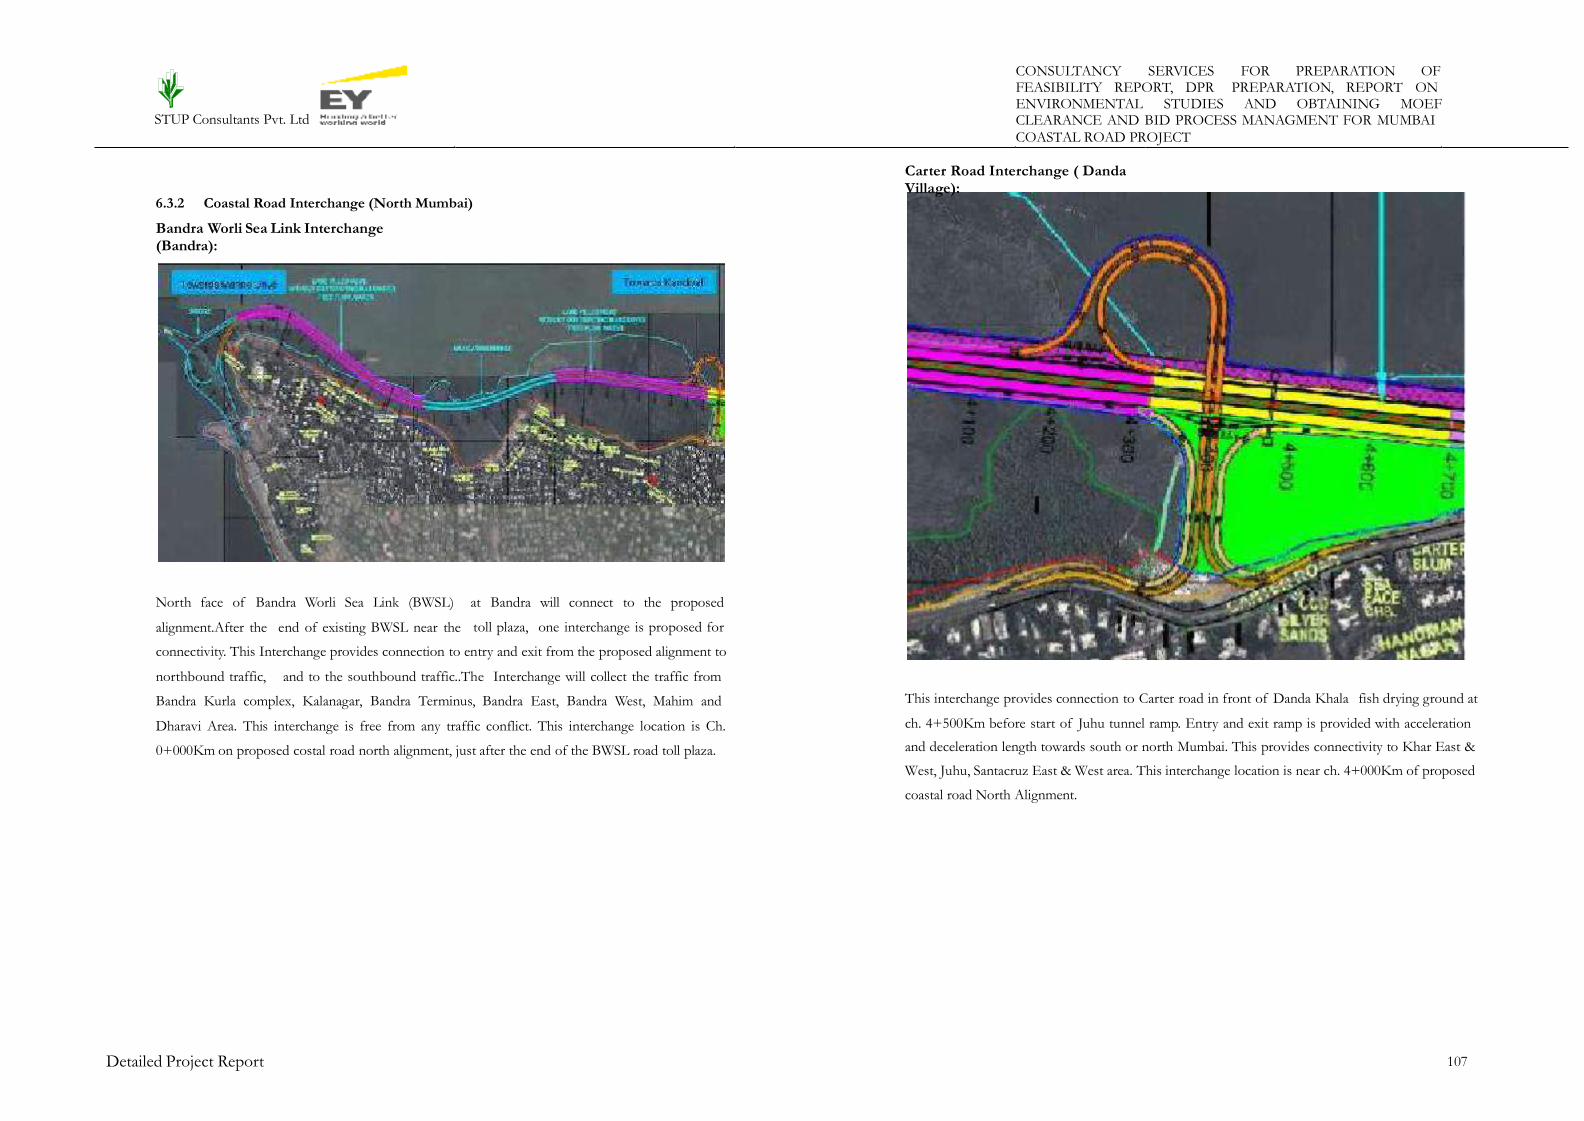
CONSULTANCY SERVICES FOR PREPARATION OFFEASIBILITY REPORT, DPR PREPARATION, REPORT ONENVIRONMENTAL STUDIES AND OBTAINING MOEF
STUP Consultants Pvt. Ltd CLEARANCE AND BID PROCESS MANAGMENT FOR MUMBAI
COASTAL ROAD PROJECT
Carter Road Interchange ( DandaVillage):
6.3.2 Coastal Road Interchange (North Mumbai)
Bandra Worli Sea Link Interchange(Bandra):
North face of Bandra Worli Sea Link (BWSL)
alignment.After the end of existing BWSL near the
at Bandra will connect to the proposed
toll plaza, one interchange is proposed for
connectivity. This Interchange provides connection to entry and exit from the proposed alignment to
northbound traffic, and to the southbound traffic..The Interchange will collect the traffic from
This interchange provides connection to Carter road in front of Danda Khala fish drying ground atBandra Kurla complex, Kalanagar, Bandra Terminus, Bandra East, Bandra West, Mahim and
Dharavi Area. This interchange is free from any traffic conflict. This interchange location is Ch.
0+000Km on proposed costal road north alignment, just after the end of the BWSL road toll plaza.
ch. 4+500Km before start of Juhu tunnel ramp. Entry and exit ramp is provided with acceleration
and deceleration length towards south or north Mumbai. This provides connectivity to Khar East &
West, Juhu, Santacruz East & West area. This interchange location is near ch. 4+000Km of proposed
coastal road North Alignment.
Detailed Project Report 107

CONSULTANCY SERVICES FOR PREPARATION OFFEASIBILITY REPORT, DPR PREPARATION, REPORT ONENVIRONMENTAL STUDIES AND OBTAINING MOEF
STUP Consultants Pvt. Ltd CLEARANCE AND BID PROCESS MANAGMENT FOR MUMBAI
COASTAL ROAD PROJECT
Ritumbra Interchangecollage:
Madh Island Interchange (Institute of FisheriesEducation):
This Interchange passes near to Moragaon Juhu and merges with the road in front of Ritumbra
college in Juhu west. Entry and exit ramps are provided for both sides, moving traffic on proposed
alignment. This interchange provides the connectivity for Andheri East & West and Juhu area.
Interchange location is near to Ch. 10+600Km of proposed coastal road north alignment just after
end of Juhu tunnel.
This interchange provides connectivity to MADH ISLAND using entry and exit for north and south
Mumbai. Only one side connection towards MADH Island is provided by this interchange located at
ch. 12+600 of coastal road north alignment.
Detailed Project Report 108

CONSULTANCY SERVICES FOR PREPARATION OFFEASIBILITY REPORT, DPR PREPARATION, REPORT ONENVIRONMENTAL STUDIES AND OBTAINING MOEF
STUP Consultants Pvt. Ltd CLEARANCE AND BID PROCESS MANAGMENT FOR MUMBAI
COASTAL ROAD PROJECT
Malad Interchange:
Oshiwara Interchange
Malad interchange at ch. 16+000Km of north coastal road alignment provides the connection on
Chinchowali Bandra Link Road near to Inorbit mall Malad West. Entry and exit ramp provides, in
this intersection, for both side movement, with free flow of traffic. Traffic movement areas are
covered from Goregaon East & West, Malad East & West location.
This interchange provides connectivity to Goregaon east and west, Jogeshwari west area traffic.
Entry ramp taper starts from Park paradise Aparrments and exit ramp taper end near to Windmere
CHS. This interchange provides free traffic flow in all directions at ch. 14+200Km of north coastal
road alignment.
Detailed Project Report 109

CONSULTANCY SERVICES FOR PREPARATION OFFEASIBILITY REPORT, DPR PREPARATION, REPORT ONENVIRONMENTAL STUDIES AND OBTAINING MOEF
STUP Consultants Pvt. Ltd CLEARANCE AND BID PROCESS MANAGMENT FOR MUMBAI
COASTAL ROAD PROJECT
Kandivliinterchange:
This interchange is at the end point of the proposed north coastal Road alignment at ch
19+450Km, which merges with the existing link road by providing trumpet interchange. It gives
connectivity of entry and exit on to proposed alignment, with required acceleration and deceleration.
This interchange coversed traffic from Malad East & West, Kandivli East & West, Borivli East &
West area
Detailed Project Report 110

CONSULTANCY SERVICES FOR PREPARATION OFFEASIBILITY REPORT, DPR PREPARATION, REPORT ONENVIRONMENTAL STUDIES AND OBTAINING MOEF
STUP Consultants Pvt. Ltd CLEARANCE AND BID PROCESS MANAGMENT FOR MUMBAI
COASTAL ROAD PROJECT
The Topographic survey report is presented in Volume II of Detailed Project Report
Geotechnical Investigations
Bore holes at each abutment and at locations across the structure at not more than 200m intervals,
subject to there being at least two intermediate bores for structures of more than one span will be
taken. Findings of Geotechnical Investigations are presented in Geotechnical Report. Additional
investigations are to be undertaken for tunnel alignments and separate additional reports shall be
submitted for these investigations.
7. Engineering Survey and Investigations
7.1 Site Investigation
The Field investigations were conducted on the alignment of Project Corridor approved at feasibility
stage. Various engineering surveys related to pavement investigations, traffic, topography, and soil
investigations will be carried out, to have various input variables for the detailed pavement design,
capacity for lane configuration and structural design. The surveys carried out are listed below.
Stage 1:
Topographic Survey
Traffic Surveys
Classified Volume Count Survey
Origin-Destination Survey
Stage 2:
Geological mapping for tunnel
Geo-Technical Investigation
Material Investigation
Bathymetric survey
Hydrological Survey
Utilities Survey
7.2 Hydraulic and Hydrological Investigations
This data is vital in deciding the bridge waterway, depth and type of foundations and protective
works. The Catchment‘s area from the Topo Sheets was used to compute the discharge. The
discharges computed as per guidelines in IRC: SP-13-1998 and reccomondation of BRIMSTOWAD
report are presented in the Drainage report.
7.3 Utilities Services
During the Road Inventory Survey, details of utility services such as Water lines, Telephone Cables,
Power Cables etc., running along the project roads are being collected from various agencies along
with planned relocation of these utilities.
7.4 Land acquisition plans
Cadastral maps were prepared wherein the lands and properties which are getting affected on
account of implementation of the project corridor. For preparation of maps for land acquisition the
relevant information such as survey number, name of owners, and area etc were collected for
preparation of Land acquisition proposals. Also land acquisition proposal has been prepared for
MCGM and assistance rendered to comply with remarks which the competent authority during the
process of Land Acquisition. The land acquisition plans are provided as appendix to Rehabilitation
and Resettlement Report
7.1.1 Topographical Survey
General
To know the topographical conditions within the proposed roadway boundary a topographic survey
is necessary and hence, this survey work has been carried out along the preferred alignment.
Topography Survey along the preferred alignment
Once the route/alignment was selected by MCGM through feasibility stage and recommendations
therein , a topographic survey (a large scale instrument survey by running a traverse along the
selected route/alignment) was conducted to capture all physical features which affect the location on
the selected new route/improvement alignment. Longitudinal and cross sections shall be taken for a
width covering proposed cross section along the proposed alignment and Bench Marks were
established. Total station / Global positioning system were used for conducting survey. In order to
collect sea bed levels (bathymetry), the surveys were conducted during low tide in such areas to cover
entire area where road is planned. Permanent Control pillars and Bench Marks shall be established at
suitable intervals. Based on the data collected, centre line of the road was finalized.
7.5 Material Survey and Investigation
Material investigations were carried out to determine available quality and quantities of materials with
their lead from the proposed site of construction. The findings are presented in the Material Report.
Detailed Project Report 111
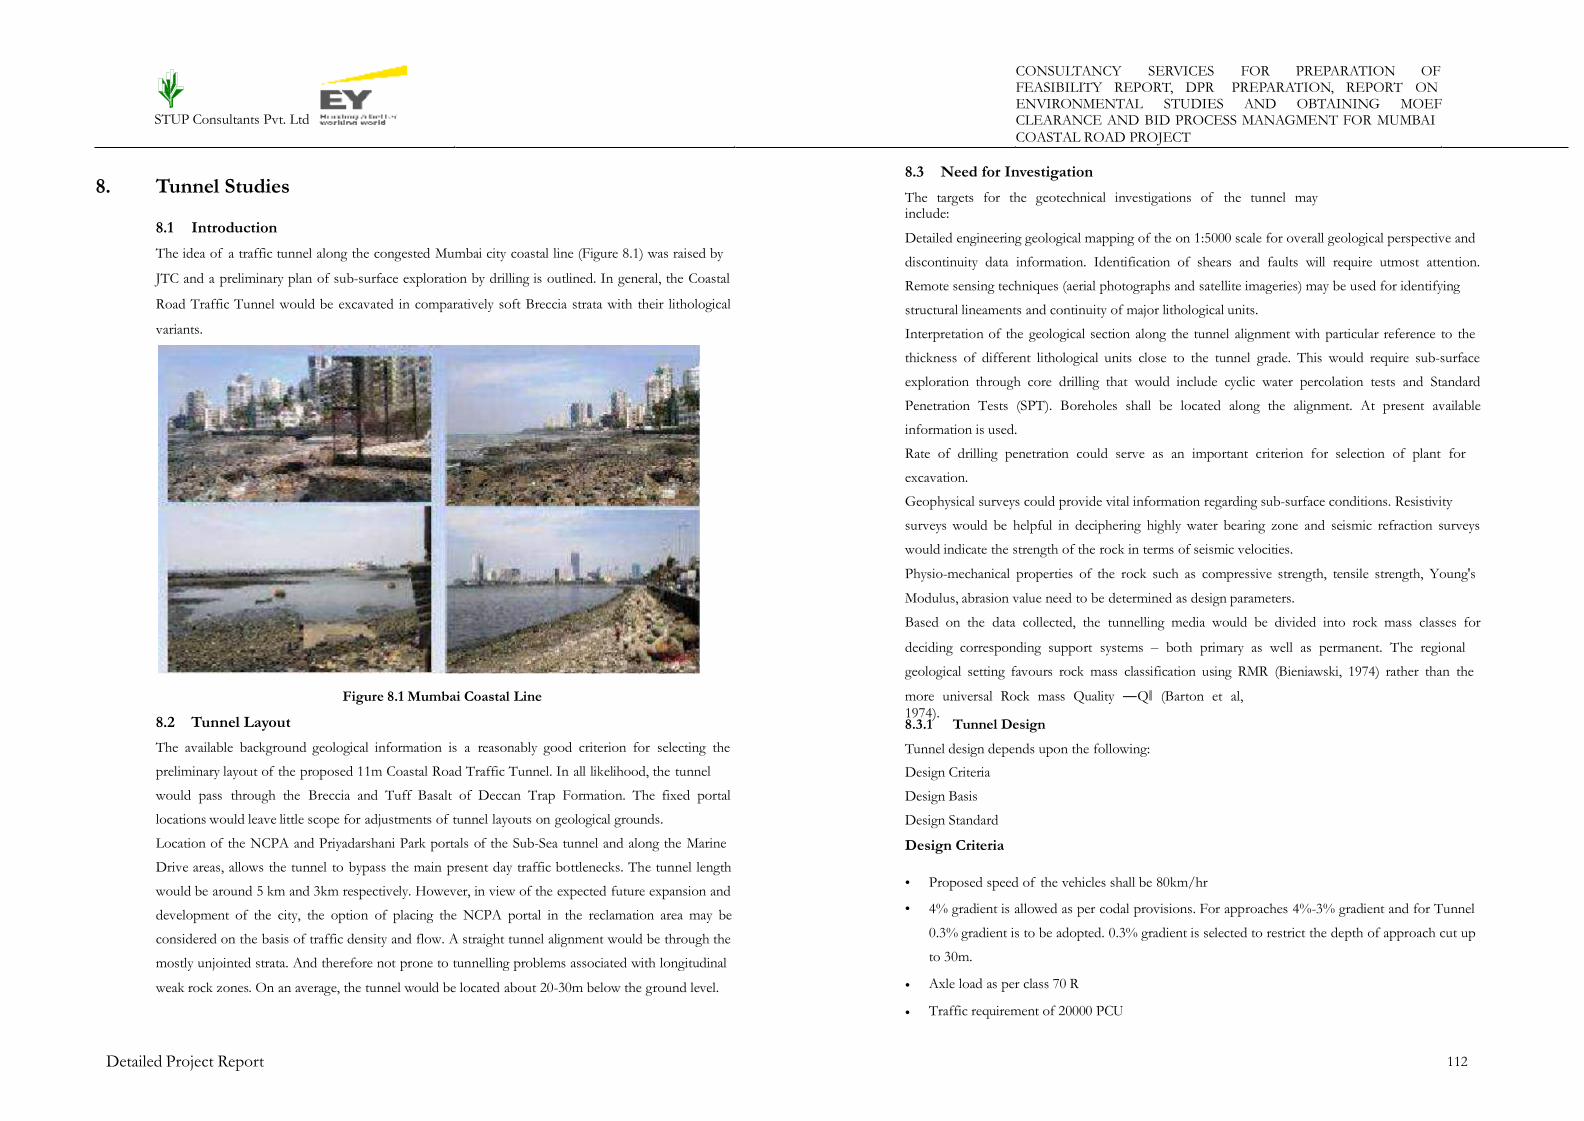
CONSULTANCY SERVICES FOR PREPARATION OFFEASIBILITY REPORT, DPR PREPARATION, REPORT ONENVIRONMENTAL STUDIES AND OBTAINING MOEF
STUP Consultants Pvt. Ltd CLEARANCE AND BID PROCESS MANAGMENT FOR MUMBAI
COASTAL ROAD PROJECT
8.3 Need for Investigation8. Tunnel Studies
The targets for the geotechnical investigations of the tunnel mayinclude:
Detailed engineering geological mapping of the on 1:5000 scale for overall geological perspective and
discontinuity data information. Identification of shears and faults will require utmost attention.
Remote sensing techniques (aerial photographs and satellite imageries) may be used for identifying
structural lineaments and continuity of major lithological units.
Interpretation of the geological section along the tunnel alignment with particular reference to the
thickness of different lithological units close to the tunnel grade. This would require sub-surface
exploration through core drilling that would include cyclic water percolation tests and Standard
Penetration Tests (SPT). Boreholes shall be located along the alignment. At present available
information is used.
Rate of drilling penetration could serve as an important criterion for selection of plant for
excavation.
Geophysical surveys could provide vital information regarding sub-surface conditions. Resistivity
surveys would be helpful in deciphering highly water bearing zone and seismic refraction surveys
would indicate the strength of the rock in terms of seismic velocities.
Physio-mechanical properties of the rock such as compressive strength, tensile strength, Young's
Modulus, abrasion value need to be determined as design parameters.
Based on the data collected, the tunnelling media would be divided into rock mass classes for
deciding corresponding support systems – both primary as well as permanent. The regional
geological setting favours rock mass classification using RMR (Bieniawski, 1974) rather than the
more universal Rock mass Quality ―Q‖ (Barton et al,
1974).
8.1 Introduction
The idea of a traffic tunnel along the congested Mumbai city coastal line (Figure 8.1) was raised by
JTC and a preliminary plan of sub-surface exploration by drilling is outlined. In general, the Coastal
Road Traffic Tunnel would be excavated in comparatively soft Breccia strata with their lithological
variants.
Figure 8.1 Mumbai Coastal Line
8.2 Tunnel Layout
The available background geological information is a reasonably good criterion for selecting the
preliminary layout of the proposed 11m Coastal Road Traffic Tunnel. In all likelihood, the tunnel
would pass through the Breccia and Tuff Basalt of Deccan Trap Formation. The fixed portal
locations would leave little scope for adjustments of tunnel layouts on geological grounds.
Location of the NCPA and Priyadarshani Park portals of the Sub-Sea tunnel and along the Marine
Drive areas, allows the tunnel to bypass the main present day traffic bottlenecks. The tunnel length
would be around 5 km and 3km respectively. However, in view of the expected future expansion and
development of the city, the option of placing the NCPA portal in the reclamation area may be
considered on the basis of traffic density and flow. A straight tunnel alignment would be through the
mostly unjointed strata. And therefore not prone to tunnelling problems associated with longitudinal
weak rock zones. On an average, the tunnel would be located about 20-30m below the ground level.
8.3.1 Tunnel Design
Tunnel design depends upon the following:
Design Criteria
Design Basis
Design Standard
Design Criteria
•
•
Proposed speed of the vehicles shall be 80km/hr
4% gradient is allowed as per codal provisions. For approaches 4%-3% gradient and for Tunnel
0.3% gradient is to be adopted. 0.3% gradient is selected to restrict the depth of approach cut up
to 30m.
Axle load as per class 70 R
Traffic requirement of 20000 PCU
•
•
Detailed Project Report 112

CONSULTANCY SERVICES FOR PREPARATION OFFEASIBILITY REPORT, DPR PREPARATION, REPORT ONENVIRONMENTAL STUDIES AND OBTAINING MOEF
STUP Consultants Pvt. Ltd CLEARANCE AND BID PROCESS MANAGMENT FOR MUMBAI
COASTAL ROAD PROJECT
8.5 Tunnel Geometric Design•
•
Signalling system beyond entry & exit points.
Number of Lanes = 2 lanes in each tube. Shape of the Tunnel:-
For underwater urban traffic tunnel, circular sections are ideally suited especially as the tunnel is to
be excavated with tunnel boring machine. Diameter of the tunnel is fixed as per the requirements for
two lane traffic.
The space above shall be sufficient to accommodate ventilation fans, lighting and other features. The
minimum function requirements that have been accommodated are given below as per SP-91.
Design Basis
The key data shall be derived from different reports as follows;
•
•
•
•
•
Traffic Data
Geotechnical Data
Gradient details as per the approved profile of the alignment
Percentage share of different category vehicles
Future traffic growth as per traffic study report
•
•
•
•
•
CP – Cross Passage
VN – Ventilation
LG – Lighting
TE – Telephone at spacing about 200 m
FS – Fire safety – Fire extinguishers at a spacing of 50 m
Design Standard
•
•
•
PIARC
SP-91
European Directive on Tunnel Design, operation and maintenance
Alignment: -
All the Alignment options have been studied in detail and Recommended alignment is proposed for
following reasons;8.4 Design Basis for Tunnel
This project involves designing of the tunnel cross section alignment, •
•
•
•
•
•
gradient drainage, fire Efficient and safe highway geometry
Reduced ventilation and lighting load
Increased visibility distance
Far away from the existing infrastructure.
Below the sea: reducing risk of damage to existing coastal Protection & heritage of marine drive.
Reduced risk during construction
ventilation lighting etc. The diameter of Tunnel is considered 11 m to accommodate 2 lane traffic
and adequate headroom. Initial portion shall be cut and cover to accommodate up ramp and down
ramps at entry and exit of tunnel.
Key Components
Lining: - Temporary support as and where required during construction is to be provided for safe
construction. This shall be in the form of shotcrete, ribs etc. Permanent lining shall be RCC either
precast or cast insitu depending on construction methodology to be adopted.Retaining Wall/
Diaphragms Wall: - In the ramp portion, diaphragm wall shall be constructed as enabling work to
restrict width of excavation and also to provide safety to adjoining structures.
Sump & Pump House: - A deep sump shall be provided to collect drain water in tunnel and pump
out enabling shaft shall be provided.
Cross Passage: - At every 500m a mandatory connection shall be provided between adjacent
tunnels.
Safety Provisions: - Tunnel Lighting, Fire safety, ventilation shall be provided by twin fans located
overhead, of diameter 1.2m
Service buildings and ancillary spaces shall be as per requirements.
Space for casting yard and other mechanical, electric set ups would need to be provided.
Geometry of the tunnel:-
The safety of the traffic is of primary concern while deciding Geometrics of the tunnel i.e.
•
•
•
•
•
Cross section
Gradient
Curvature
Width of the tunnel:
Height of the tunnel:
The finished height of the tunnel is decided to accommodate minimum vertical clearance of5.5m.
Vertical Alignment: -
Detailed Project Report 113

CONSULTANCY SERVICES FOR PREPARATION OFFEASIBILITY REPORT, DPR PREPARATION, REPORT ONENVIRONMENTAL STUDIES AND OBTAINING MOEF
STUP Consultants Pvt. Ltd CLEARANCE AND BID PROCESS MANAGMENT FOR MUMBAI
COASTAL ROAD PROJECT
Gentle gradient along the tunnel length is proposed. Maximum gradient for major tunnel projects,
adopted are as below;
The case studies of projects executed in Tertiary formations in the Himalayan terrain, provide
excellent information about the general features of tunnelling in soft rocks that could be indicative of
the ground conditions for the tunnelling project at Aizawl. The Siwalik and Murree Group of rocks
in NW Himalaya, confined between the Indo- Gangetic alluvium towards south and the MBF (Main
Boundary Fault) in the north, include several important hydroelectric projects. In the northeast,
hydroelectric projects have been executed in the rocks of Surma Group and Disang Formation.
• Two parallel, circular tunnels (each 1.3 km long, 6.2 m dia), were and sandrock with subordinate
siltstone, claystone and grit at the Khara Hydel Project.
Seven free-flowing tunnels (61-1896 m length, 2.13-2.43 m section) in Chenani Hydel Project
have been driven in alternate bands of claystone, sandstone and siltstone the Yamuna Hydel
Project. The crumpled red shales and siltstone with subordinate quartzite and black plastic clay
of the 9m diameter tunnel
For the 9m diameter tunnels in (sandstone) at Tuirial Hydroelectric Project in Mizoram, At
Doyang in Nagaland, for the 12m diameter tunnel located in sandstone over a 100m length
The 6.778 km long and 3.81 m diameter of Loktak Hydroelectric Project in Manipur, located in
sandstone.
•For this project 0.3% gradient shall be adopted in viewing the length of the tunnel being 5km to
break the monotony after 2.5 km reverse gradient shall be provided. Design speed is considered as
80 km/hr.
Horizontal Alignment:-
•At the entry point alignment shall be straight. In the tunnel portion alignment shall
straight.
be mostly
•
Crown Level of Tunnel:
The crown level of the tunnel shall be kept 6 m below the competent rock. The feasibility has been adjudged in the absence of geological information along the alignment. Fora
MCGM project, Tunnelling had been done between S.K. Patil and Kilachand Marg about which
information is available.. This site is nearest to the water supply Tunnel alignment. Hence this data is
used.
Tunnel between S.K. Patil-Kilachand shafts between chainage 009 and 1679 i.e. between Kilachand
shaft and S.K. PAtil Shaft 2.8m diameter water supply tunnel is excavated. Partly it is excavated
below sea. The strata encountered are Tuff Breccia and Basalt as can be seen from the sketch
attached.
Tunneling option is preferred for following consideration:
• Road Tunnel is a feasible alternative to cross the water body, in view of the geological set up in
the continental shelf.
This satisfies environmental and ecological requirements.
Girgaon chowpatty is of special social and religious importance as a Ganesh idol immersion
location and other festivals. This is to be preserved.
Tunnel minimizes potential environment impact viz traffic congestion, pedestrian movement, air
quality, noise pollutions.
•
•8.6 Assessment of Technical Feasibility
Geology: - Typical bore log near Marine lines is considered for preliminary assessment.
The detailed geotechnical assessment based on the studies made is in progress.
Soft Rock Tunnels in India
•
Detailed Project Report 114
Tunnel Gradient (%)
Seikan Tunnel Japan 1.2
Kanmon Tunnel Japan 2.2Shin – Kanmon Tunnel Japan 1.8
English Channel Tunnel 1.1
Mersey Tunnel England 3.7
Severn Tunnel England 1.1
Mt. Macdonald Tunnel Canada 0.7
Bosphorus Tunnel, Turkey (Proposed ) 1.8

CONSULTANCY SERVICES FOR PREPARATION OFFEASIBILITY REPORT, DPR PREPARATION, REPORT ONENVIRONMENTAL STUDIES AND OBTAINING MOEF
STUP Consultants Pvt. Ltd CLEARANCE AND BID PROCESS MANAGMENT FOR MUMBAI
COASTAL ROAD PROJECT
rock bolting and, if necessary, steel supports. These methods may have to be used in isolation or in
combination depending upon the rock condition. For reinforced shotcrete, use of steel fibres may be
considered as an alternative to coarse aggregate, for which there are few quarry sources within a
reasonable haul distance.
In TBM method, precast liners shall be providing adequate support both during construction as well
as in operation.
•
•
It minimizes visual intrusion to the bay watchers.
Drainage details shall be shown in good for construction drawings. These drainages shall
accommodated at either edge of the road cross section.
be
TunnelExcavation
The depth of tunnel excavation, more than 20 to 30m, is of paramount importance in taking a
decision regarding the preferred mode of excavation technique and installation of supports – both
primary as well as permanent – with factor of safety kept at a high level.
Considering the shallow depth of the tunnel, it would be advisable to avoid conventional modes of
tunnel excavation by drilling and blasting (DBM). The soft lithological assemblage could be an ideal
sub- surface media for excavation using road headers. As an alternative, 4 TBMs (Tunnel Boring
machines) may be deployed.
TBM can produce up to 20-22 m of progress per day, as is the experience in earlier project.
Table 8.1: Parameter Comparison between NATM and TBM
Supports
Simultaneous support erection and lining would be the key to a smooth and incident-free tunnelling
operation. The need for a high level of safety would permit no compromise on design and
implementation of support systems.
In general, the application of NATM (New Austrian Tunnelling Method) could be an economical
and practical approach to the execution of the Tunnel. The method involves creation of a load-
bearing ring of supported rock around the excavation, where the ground itself becomes an integra
part of the support system. In general, steel supports are not used in this method and rock bolting
and shotcreting form the main support elements.
To begin with, pre-excavation umbrella coverage for the overt portion of the tunnel may be provided
through forepoling in the usual 3m long segments. The spacing of spile bolts would conform to the
rock condition. The consecutive spile-bolted or forepoled segments would have appropriate overlap.
For a 3m long segment under umbrella support, excavation may be carried out for an approximate 2-
2.5 m length by road-header, followed by erection of primary supports in the form of shotcreting,
Tunnel Boring Machine
Details of TBM Technique8.7
TBM Technique for Tunnelling. TBM technique has high potential and versatility tunnel drivage by
altering the physical size and strength of Tunnelling machines to match the wider range of rock
hardness and geologically difficult conditions. Following aspects have significant bearing in selection
of this technique..
TBM excavation represents a big investment in an inflexible but potentially very fast method of
excavating and supporting a rock tunnel (Barton, 1996). When unfavorable conditions are
encountered without warning, time schedule and practical consequences are often far greater in a
TBM driven tunnel than in a drill and blast tunnel.
Detailed Project Report 115
Parameter NATM TBM
Suitability in Breccia Yes Yes
Shape D Circular
Support Shotcrete, Ribs, Bolts Precast Segments
Progress 22m per month 500m per month
Cost 120 Crore per Km 150 Crore per Km
Lead Time 3 Month 10 Month
Construction Time 110 Months 20 Months + 6 Months
No. of Set of Equipments 16 4

CONSULTANCY SERVICES FOR PREPARATION OFFEASIBILITY REPORT, DPR PREPARATION, REPORT ONENVIRONMENTAL STUDIES AND OBTAINING MOEF
STUP Consultants Pvt. Ltd CLEARANCE AND BID PROCESS MANAGMENT FOR MUMBAI
COASTAL ROAD PROJECT
The unfavorable conditions can be produced by either a rock mass of very poor quality causing
instability of the tunnel or a rock mass of very good quality (i.e. strong and massive rock mass)
determining very low penetration rates. However, it is to be observed that when using the full face
mechanized excavation method, the influence of the rock mass quality on the machine performance
has not an absolute value: the influence is in fact to be referred to both the TBM type used and the
tunnel diameter.
Following are the technical advantages of TBM:
Comparison of NATM and TBM techniques is presented below:Table 8.3: Comparison of
NATM and TBM technique
•
•
•
Reduction of over breaks
Minimum surface and ground disturbance
Reduced ground vibration eliminates damage to nearby structures which is an important
consideration for Metropolis.
Reduced rock excavation reduces handling cost
The speed of work is several times that of conventional drill and blast technique
Least disruption of traffic flow
Unaffected public safety
•
•
•
• NATM involves slow speed of construction due to PPV controlled progress which will result in cost
over runs and time over runs. Because of this reason TBM which will give 6m per day progress even
with 32% efficiency of TBM utilization this TBM is strongly recommended.
Observations for Tunnel
Soft strata consisting of Breccia, Tuff is likely to be encountered which is suitable for cutting by road
header as well as TBM.
8.8 Design of the tunnel in the TBM alternative
8.8.1 General
Contractor shall be solely responsible for the selection, design and supply of a tunnel boring machine
and auxiliary equipment and for the design and execution of the reinforced concrete precast
segmental lining system compatible complying with the characteristics of the TBM .The design work
and shall be submitted for approval The tunnel boring machine (TBM) shall comply with the
requirements of the country of manufacture, The machine shall be of a double-shield type supported
by the precast lining rings or a machine with a side stabilizer (gripper) supported by the breccia rock
The machine shall be new or shall have undergone refurbishment at an experienced plant specializing
in this field that has brought it to a "like new" condition and will be compatible for all of the types of
breccias/basalt rock as specified in the geological report. During construction, the Contractor shall
enable and assist the Supervisory Agency and his representatives to reach the tunnelling machine
with all of its various components at any time that he deems fit and shall assist him in all matters
related to inspection and verification of the tunnel alignment including independent survey of the
work of the Contractor's surveyor and the performance of geological mapping of the rock as actually
exposed. Such assistance shall be included in the Contractor's work and will not be paid for
separately.
•
•
•
•
•
The likely progress shall be 20-22 m per day by each of the TBMs.
In general subsea tunnelling is feasible geologically.
For fast progress TBM tunnel is recommended.
Diameter of Tunnel shall be 11m.
Flat Gradient is to be adopted 0.3%.
In general feasibility of subsea tunnelling is feasible at this location. On completion of geotechnical
investigations and additional studies on new alignment of proposed tunnel a separate Tunnel Report
as an appendix to this report shall be submitted.
Detailed Project Report 116
PARAMETER NATM TBM
quality geologically dictated acceptably
Chance of cost and time over run high low
Duration of Capital locking Long short
interest High low
Equipment utilization period High low
Commercial benefit delayed early
Overall profitability Very low highOwner‘s image destroys improves
Geological set up at tunnel site Does not necessitate on account of special rock
condition
Preferred considering high PR at manageable energy
level
Damage to existing structure PPV induced during drilling blasting may be a deterrent
and major adverse parameters
Continuous support by erecting the segmental lining ensures safety. No drilling blasting
involved
Recommendation Not advised Strongly recommended

CONSULTANCY SERVICES FOR PREPARATION OFFEASIBILITY REPORT, DPR PREPARATION, REPORT ONENVIRONMENTAL STUDIES AND OBTAINING MOEF
STUP Consultants Pvt. Ltd CLEARANCE AND BID PROCESS MANAGMENT FOR MUMBAI
COASTAL ROAD PROJECT
8.9 Tunnel Safety Services • Provide emergency response facilities in accordance with operational standards required by the
authority;8.9.1 Introduction
Mumbai Coastal Road is proposed to decongest Western Expressway in order to reduce travel time,
allow bus rapid transport and eventually raise quality of the citizens. The road is planned to also
create new public places and redefine western coast line characteristics. Final alignment consists of
two sections of tunnels with 3.2km length and 5.7km. First twin tube tunnel starts near Princess
Street flyover and ends at Priyadarshini Park and second four tube tunnel starts at Khar Danda
village and ends near Ritumbhara College. Both proposed tunnels will be constructed by boring with
Tunnel Boring Machines with 11m diameter predominantly under sea bed.
Safety in tunnels requires a number of measures relating, amongst other things, to the geometry of
the tunnel and its design, safety equipment, including road signs, traffic management, training of the
emergency services, incident management, the provision of information to users on how best to
behave in tunnels, and better communication between the authorities in charge and emergency
services such as the police, fire-brigades and rescue teams.
• Minimize whole life costs;
• Incorporate mitigation measures from risk analysis as per EU directive
• The strategy for design of tunnel services shall be to adopt minimum acceptable provisions, with
due regard to international best practices. The design of tunnel services shall achieve safe tunnel
environment for following stake holders:
• Road users;
• Local residents;
• Tunnel owner and operator;
• Maintenance staff;
• Police and civil defence• Design standards
The requirement of tunnel services is based on best international practices and following codes have
been referred:
• Fire Authority;
• Emergency services;
• United Kingdom: Highway agency standard BD78/99 design of Road Tunnels• Government control authorities;
• PIARC Tunnel Design Manual• Basis of tunnel services design
• European Directive 2004/EC/54 of the European Parliament and council Members• The length of tunnels are as follows:
• Indian Road Congress Code IRC 92• Tunnel-1: Princess Street Flyover to Priyadarshini Garden with length of 3200m with
maximum gradient of 4%8.9.2 Design Objectives:
The design of tunnel services shall meet following design objectives:• Tunnel-2: Khar Danda to Rutumbhara College with length of 5700m and maximum gradient of
4%• Provide continuous control of internal air quality to meet the specified requirement;
• Provide adequate visibility levels in all conditions at all times of the day and night; • Traffic Volumes:
• Provide appropriate collection, treatment and desposal of ground water and surface wash waters; • The design of tunnels shall be based on traffic volumes provided in Traffic Report.
• Provide mechanical ventilation and smoke control systems capable of fully functional
continuous operation for a range of fire events;
• Average age of vehicles considered as 14 years.
• With respect to above traffic conditions, the design of tunnel services is based on
assumption that, no motorcycles, pedestrians and dangerous goods vehicles shall be
allowed to enter the tunnels. These vehicles shall use alternative routes available.
• Provide emergency egress from all areas of tunnels;
Detailed Project Report 117

CONSULTANCY SERVICES FOR PREPARATION OFFEASIBILITY REPORT, DPR PREPARATION, REPORT ONENVIRONMENTAL STUDIES AND OBTAINING MOEF
STUP Consultants Pvt. Ltd CLEARANCE AND BID PROCESS MANAGMENT FOR MUMBAI
COASTAL ROAD PROJECT
• Design Life: • Event Impact:
Design life is defined as the period over which the asset must perform its functional requirements
without replacement with adequate
services shall be as per table below:
maintenance. The design life for various aspects of tunnel
• Risk Assessment
Risk assessment is essential part of tunnel services and structural design. This has been considered in
related to various incident scenarios which may occur during operation of the proposed tunnels. Risk
analysis is based on risk rating of various incidents and their impact on the proposed tunnel structure
and users.
• Event Probability:
Detailed Project Report 118
Asset Design Life
Inaccessible elements of drainage, fire protection, lighting, mechanical,
electrical, traffic management and control system
100 years
Tunnel lining and structures 100 years
Buildings 50 years
Signs structures and road furniture 40 years
Drainage elements that are accessible for replacement 20 years
Mechanical and electrical equipments 20 years
Lighting 20 years
Fire protection system 20 years
Traffic management and control system 20 years

CONSULTANCY SERVICES FOR PREPARATION OFFEASIBILITY REPORT, DPR PREPARATION, REPORT ONENVIRONMENTAL STUDIES AND OBTAINING MOEF
STUP Consultants Pvt. Ltd CLEARANCE AND BID PROCESS MANAGMENT FOR MUMBAI
COASTAL ROAD PROJECT
• Breakdown and debris on road:
Risk of occurrence of such event is similar to accidents. Automatic incident detection system shall be
implemented to reduce the impact of such event.• Risk response strategies
• Oversize vehicles:
It is proposed to restrict entry of all over sized vehicles to coastal road to eliminate such risk.
Non Vehicle related incidences
• Animals in Tunnel:
It is proposed to provide guard rails along entire costal road to restrict entry of animals on the traffic
lanes. Therefore, risk of such event is extremely unlikely.
Vandalism: considering that this is an urban tunnel, it is necessary to provide for securitization of
likely entry points to the tunnels by pedestrians. Such a vandalism event may have very high impact
on tunnel services. Therefore control room shall be provided with automatic incident detection
system to report stoppage of vehicles and pedestrian inside tunnel. Control rooms shall be manned
24x7 to register and act on such incidence. However to eliminate risk of this high impact event, the
SCADA software shall be capable of sending message to enforcement agency automatically with
details of location.
Vehicle related incidents: Tunnels are being design to carry traffic loading and there are events of
varying probability which may affect safe operation of the tunnel.
• Terrorist Attack:
Impact of such event on tunnel operation would be disastrous and would require immediate action
by local police. The method of reducing risk of such event shall be discussed with the authority.
• Fire in the Tunnel:
Fires in tunnel are a serious risk and the probability of such incidence is based on likelihood of a
serious accident occurring inside the proposed tunnel and the vehicle involved catching fire. Tunnel
alignment for tunnels have been maintained as straight alignment with maximum grade of 4%
allowing high visibility distance. It is proposed to reject all vehicles carrying flammable and
dangerous goods on entire coastal road. This is to eliminate risk of such vehicle entering in to
tunnels and getting involved in to an accident. Such type of vehicles may cause fires of up to 100MW
having disastrous effect on tunnel structure. Based on present traffic volumes the HGV percentage is
likely to be less than 5% of overall traffic volume. Hence a 50MW fire (BD 78/99 table 8.2) is
adopted for design of ventilation to bring the impact to an acceptable level.
• Traffic Queues:
Risk of occurrence of traffic queues is unlikely considering adequate number of lanes have been
proposed with adequate distances from tunnel entry/ exit points from proposed interchanges.
However, event of traffic queuing is unlikely to impact on tunnel services. Environmental
monitoring sensors are proposed to adjust level of tunnel services such as lighting and ventilation.
• Accidents:
Probability of occurrence of accident in an uni-directional tunnel is very unlikely. To reduce the
probability of same to extremely unlikely event, alignment of the tunnels has been designed as
straights with maximum grade of 4%. This will ensure high visibility to stopping vehicle/ debris on
road. It is also proposed to restrict the vehicle speeds to 80Kmph for entire coastal road and enforce
the same through speed detection cameras.
Detailed Project Report 119

CONSULTANCY SERVICES FOR PREPARATION OFFEASIBILITY REPORT, DPR PREPARATION, REPORT ONENVIRONMENTAL STUDIES AND OBTAINING MOEF
STUP Consultants Pvt. Ltd CLEARANCE AND BID PROCESS MANAGMENT FOR MUMBAI
COASTAL ROAD PROJECT
Compliance of EU Directive
Detailed Project Report 120
Structural measures Twin tubes Mandatory where a
15-year forecast shows that traffic
> 10 000 veh./lane.
Twin/ Multiple uni-directional tunnels
proposed
Gradients less than 5% are
mandatory
Gradients shall be restricted to 4%
Emergency walkways are
mandatory where no emergency
lane is provided
Provision of emergency walkway is
proposed
Emergency exits every 500m are
mandatory
Cross connections proposed at every
500m
Mandatory cross-connections for
emergency services at least every 1
500 m
Cross connections proposed at every
500m
Crossing of the central reserve
outside each portal (mandatory
requirement)
It is proposed to provide continuous cut
section to adopt the same
Drainage for flammable and toxic
liquids is mandatory where such
goods vehicles are allowed
Although such inflammable and toxic
goods carrying vehicles will be rejected.
Drainage provisions have been made
underneath the pavement
Fire resistance of structures is
mandatory where local collapse of
structure may have disastrous
effect
Complied by making such provisions
Lighting Normal Lighting Proposed as per CIE 88, 2004
Safety lighting Proposed as per CIE 88, 2004
Evacuation lighting Provided over footways
Ventilation Mechanical ventilation Proposed longitudinal ventilation by
providing jet fans
Mandatory semi transverse
ventilation for tunnels of more
than 3000m length
Provisions made through supply ducts and
ventilation shafts.
Emergency stations Mandatory provision of
emergency stations at 150m
equipped with telephone and two
fire extinguishers necessary
Provision to be made at every 150m.
Water supply At every 250m Water supply pipe attached to water tank
to be provided with supply point at every
150m to match location of emergency
station.
Road signs Mandatory Provided with road signs
Control center Surveillance of several tunnels
may be 120entralized into a
single control centre.
Two control centers shall be provided first
near Priyadarshini Park and second near
Rutumbhara college to cover two tunnel
sections. The control centers are located at
start of tunnel as well as center of south
and north section of coastal road to
respond to incident on entire stretch with
provision of SCADA.
Monitoring systems Video CCTV cameras shall be provided along
tunnels as well as highway
Automatic incident detection
and/or fire detection
SCADA system connected to CCTV
equipped with automatic incident
detection system and response is
proposed.
Equipment to close
tunnel
Traffic signals before the
entrances
The mandatory provision is to be
complied by provision of gate controlled
from Control center
Traffic signals inside the tunnel
at least every 1 000 m
It is propsed to provide traffic signals at
every 500m before every cross connection
to enable traffic diversion to parallel
tunnel in case of incident.
Communications
system
Radio re-broadcasting for
emergency services
Provisions made connected to SCADA
system
Emergency radio messages for Provisions made connected to SCADA

CONSULTANCY SERVICES FOR PREPARATION OFFEASIBILITY REPORT, DPR PREPARATION, REPORT ONENVIRONMENTAL STUDIES AND OBTAINING MOEF
STUP Consultants Pvt. Ltd CLEARANCE AND BID PROCESS MANAGMENT FOR MUMBAI
COASTAL ROAD PROJECT
The proposed tunnels are being constructed in two sections, i.e. the South Portal and North Portal.
The Electro-Mechanical Services considered for both the sections is covered in this report.
The design of all Electro-Mechanical and Safety Systems shall be as per the guidelines laid down
under;
1.
2.
3.
4.
5.
IRC: SP: 91 (2010).
PIARC
SOLIT2
ASHRAE
NFPA
In this report the services that shall be covered area Ventilation, Electrical, Lighting, Fire Protection
Systems& Detection Systems, Video Surveillance and Access Control Systems, Public Address and
Emergency Telecommunication Systems, Traffic Control Systems and SCADA.
8.9.3 Ventilation System
8.9.3.1 Introduction
Internal combustion engines used for powering most of the vehicles are either of spark-ignition type
or of compression ignition type. These types of engines generate exhaust fumes and smoke with
different characteristics. Major constituents of these obnoxious exhaust fumes and smoke are carbon
monoxide, carbon dioxide, oxides of nitrogen and sulphur dioxide. In addition to these components,
spark-ignition type engines also emit small amounts of un-burnt hydrocarbons.
8.9.3.2 Carbon monoxide (CO)
Carbon Monoxide is an odorless toxic gas which when inhaled readily combines with blood
hemoglobin in preference to oxygen, reducing the oxygen carrying capacity of the blood. This has
very toxic effects which could be fatal on extended exposure to CO. The process gets reversed upon
timely exposure to fresh air.The electrical and mechanical utilities have been planned in accordance with International practice
followed as per standard codes of practice. It is intended to present in the following, an overall view
of the design criteria adopted for the various services for the road tunnels proposed along the
Coastal Road Project.
In order to optimize the cost of services, the location of HT Substation, Fire & Water Supply
pumps, and the Nodal Operation Centers (NOC) play a very important role in terms of saving in
cost of expensive cables length & minimizing the line losses and similarly piping between water tanks
and pumps including location of various load centres in the tunnel.
8.9.3.3 Carbon Dioxide (C02)
Carbon Dioxide is a very stable compound which does not readily react with other compounds and
is toxic only at very high levels of concentration. These levels of CO2 which are found in vehicular
traffic tunnels are generally well within the human threshold level of CO2.
Nitric Oxide (NO) and Nitrogen Dioxide (N02)
These oxides unite with water and form nitrous and nitric acid in the lungs and destroy the
functioning of lungs.
Detailed Project Report 121
tunnel users system
Loudspeakers in shelters and
exits
Provisions made connected to SCADA
system
Emergency power
supply
Mandatory It is proposed to equip control center with
necessary capacity of standby generators
with necessary fuel storage
Fire resistance of
equipment
Mandatory All tunnel fixtures and fitting shall be fire
resistance compliant.
Additional
Provisions
Drainage It is proposed to provide sump and
pumping arrangement to collect seepage/
storm water at lowest point of tunnels and
dispose the same to sea.
Leaky feeder cable It is proposed to provide leaky feeder
cable to enable use of mobile services
within tunnels.
Environmental monitoring
censors
It is proposed to provide environmental
monitoring censors to monitor visibility
levels, air quality and smoke detection
Linear Heat Detection Linear heat detection is proposed through
adoption of OFC cables cross looped to
detect exact location of fire.
Varibale Message signs It is proposed to provide VMS system
attached to SCADA at control center to
enable safe tunnel operation.

CONSULTANCY SERVICES FOR PREPARATION OFFEASIBILITY REPORT, DPR PREPARATION, REPORT ONENVIRONMENTAL STUDIES AND OBTAINING MOEF
STUP Consultants Pvt. Ltd CLEARANCE AND BID PROCESS MANAGMENT FOR MUMBAI
COASTAL ROAD PROJECT
8.9.3.4 Sulphur Dioxide (S02) Where technically feasible, provision of a vertical shaft near about the center of a tunnel would
effectively improve natural ventilation because of additional chimney stack effect created by it. If
such a shaft is fitted with an exhaust fan, the chimney stack effect will not be affected by change in
atmospheric conditions.
Sulphur Dioxide in presence of water forms sulphuric acid and causes toxic effects. However, the
levels of S02 found in vehicular emissions are very small to be of any major concern.
8.9.3.5 Hydrocarbons
Hydrocarbons are also a very small component of vehicular emissions. To ensure a safe environment
within the tunnels, these compounds need to be removed. This can be done either by oxidation or
8.9.3.8 Mechanical System of Ventilation
In case of all tunnels more than 500 m. in length, Mechanical System of Ventilation should be
provided unless the traffic volume is very low.
The two types of ventilation systems used separately or in combination are as linear system and
transverse system. In this case as both the tubes are unidirectional with ventilation shafts provided at
either ends, linear system of ventilation is being proposed.
Two speed, truly reversible jet fans are proposed for these tunnels.
For South Portal (Left Tube)
physical replacement in cases of stable compounds like CO2. Both these can be achieved through
ventilation. The main intention of ventilation is to create user-friendly healthy environment inside a
tunnel.
When a vehicle travels on an up-gradient, it needs extra power causing increased fuel consumption
and resulting in increased quantum of pollutants, as compared to a vehicle moving on level road. A
vehicle may have to slow down and move in low gears causing slightly increased emission of
pollutants while traveling upgrade. When traffic comes to a halt and the vehicles are required to idle,
production of CO increases. However, during idling, the rate of consumption of fuel is very low and
the total emission of CO is generally not more than that for normal traffic.
Characteristics of Traffic are of paramount consideration for the designers of ventilation system.
Traffic Volume, Traffic Density and Traffic Composition have a direct bearing on the vehicular
exhaust emissions.
In vehicles with spark-ignition engines, at higher elevations, air fuel mixture becomes richer due to
lack of oxygen in the atmosphere. This results in higher concentration of CO in the exhaust.
In case of compression-ignition engines, lack of oxygen in the atmosphere causes increase in smoke
production.For South Portal (Right Tube)
8.9.3.6 Methods of Ventilation
Ventilation in tunnels is either done through by natural means or by mechanical means.
8.9.3.7 Natural Ventilation
Natural Ventilation is caused by movement of air due to chimney stack effect created by the
difference in level between two portals of a tunnel. Difference between the ambient temperature at
the two portals and wind also plays a part in creating natural draft. Piston effect created by the
vehicular traffic creates additional draft.
As per IRC: SP: 91 (2010), normally, for tunnels shorter than 500 m. in length, natural ventilation is
enough. Exception would be urban tunnels with heavy traffic volume having possibility of
congestion during peak hours, tunnels in high altitudes and tunnels longer than 500 m. having very
low traffic volume.
Detailed Project Report 122
Sn. No. Particulars L1 (Left Wall)m L2 (Right Wall)m L (Total)m
1.0 Ramp 325.89 325.92 325.91
2.0 Cut & Cover 528.10 533.07 530.59
3.0 Tunnel 1988.55 1985.81 1987.18
4.0 Cut & Cover 374.73 369.55 372.14
5.0 Ramp 250.00 250.03 250.02
6.0 Total 3467.27 3464.38 3465.83
Sn. No. Particulars L1 (Left Wall) m L2 (Right Wall) m L (Total) m
1.0 Ramp 269.39 269.87 269.63
2.0 Cut & Cover 495.54 500.27 497.91
3.0 Tunnel 1997.17 1994.43 1995.80
4.0 Cut & Cover 390.44 385.26 387.85
5.0 Ramp 250.03 250.00 250.02
6.0 Total 3402.57 3399.83 3401.20

CONSULTANCY SERVICES FOR PREPARATION OFFEASIBILITY REPORT, DPR PREPARATION, REPORT ONENVIRONMENTAL STUDIES AND OBTAINING MOEF
STUP Consultants Pvt. Ltd CLEARANCE AND BID PROCESS MANAGMENT FOR MUMBAI
COASTAL ROAD PROJECT
For North Portal (Left Tube T1)
8.9.3.9 Tunnel Ventilation Calculation
• Tunnel South Portal (L)
1. Effective cross-sectional Area of Tunnel = 63.35 m2
2. Total Length of Tunnel = 1995.80 mFor North Portal (Left Tube T2)
3. Effective Volume of Tunnel,(V) = Effective C/S Area of Tunnel * Total Length of
Tunnel = 63.35 * 1995.80 = 1,26,433.93 m3
• Tunnel South Portal (R)
4. Effective cross-sectional Area of Tunnel = 63.35 m2
5. Total Length of Tunnel = 1987.18 m
6. Effective Volume of Tunnel,(V) = Effective C/S Area of Tunnel * Total Length of
Tunnel = 63.35 * 1987.18 = 1,25,887.853 m3
• Tunnel North Portal (LT1)For North Portal (Right Tube T3)
7. Effective cross-sectional Area of Tunnel = 63.35 m2
8. Total Length of Tunnel = 4326.81 m
9. Effective Volume of Tunnel,(V) = Effective C/S Area of Tunnel * Total Length of
Tunnel = 63.35 * 4326.81 = 2,73,874.08 m3
• Tunnel North Portal (LT2)
10. Effective cross-sectional Area of Tunnel = 63.35 m2
11. Total Length of Tunnel = 4324.39 m
For North Portal (Right Tube T4)12. Effective Volume of Tunnel,(V) = Effective C/S Area of Tunnel * Total Length of
Tunnel = 63.35 * 4324.39 = 2,73,950.10 m3
• Tunnel North Portal (RT3)
13. Effective cross-sectional Area of Tunnel = 63.35 m2
Detailed Project Report 123
Sn. No. Particulars L1 (Left Wall) m L2 (Right Wall)m L (Total)m
1.0 Ramp 376.23 376.31 376.27
2.0 Cut & Cover 499.44 500.35 499.90
3.0 Tunnel 4326.61 4327.00 4326.81
Sn. No. Particulars L1 (Left Wall) m L2 (Right Wall)m L (Total)m
1.0 Ramp 376.23 376.31 376.27
2.0 Cut & Cover 499.03 499.94 499.49
3.0 Tunnel 4325.41 4325.79 4325.60
4.0 Cut & Cover 375.05 374.54 374.80
5.0 Ramp 200.00 200.37 200.19
6.0 Total 376.23 376.31 376.27
Sn. No. Particulars L1 (Left Wall) m L2 (Right Wall)m L (Total)m
1.0 Ramp 376.07 376.16 376.12
2.0 Cut & Cover 497.31 498.23 497.77
3.0 Tunnel 4324.20 4324.58 4324.39
4.0 Cut & Cover 374.90 374.91 374.91
5.0 Ramp 200.00 200.00 200.00
6.0 Total 5772.48 5773.88 5773.18
4.0 Cut & Cover 375.54 375.23 375.39
5.0 Ramp 200.00 200.37 200.19
6.0 Total 5777.82 5779.26 5778.54
Sn. No. Particulars L1 (Left Wall)m L2 (Right Wall)m L (Total)m
1.0 Ramp 376.07 376.16 376.12
2.0 Cut & Cover 497.72 498.64 498.18
3.0 Tunnel 4322.99 4323.38 4323.19
4.0 Cut & Cover 375.12 375.16 375.14
5.0 Ramp 200.00 200.00 200.00
6.0 Total 5771.90 5773.34 5772.62
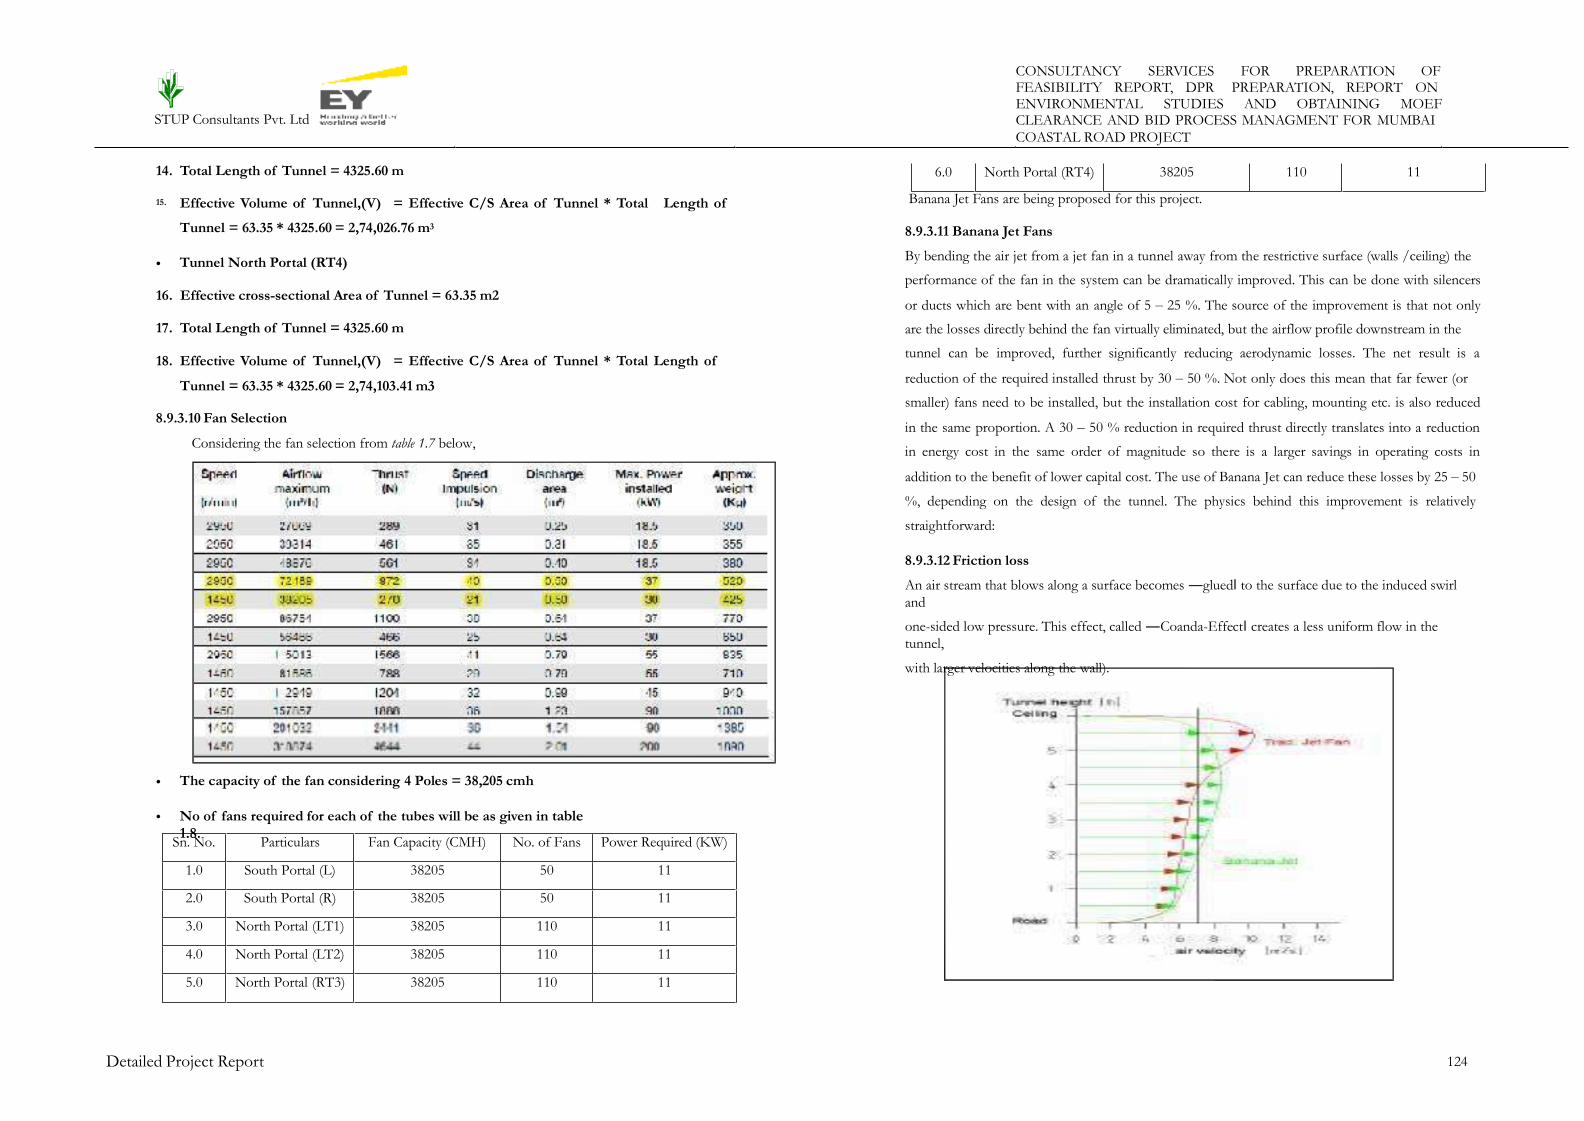
CONSULTANCY SERVICES FOR PREPARATION OFFEASIBILITY REPORT, DPR PREPARATION, REPORT ONENVIRONMENTAL STUDIES AND OBTAINING MOEF
STUP Consultants Pvt. Ltd CLEARANCE AND BID PROCESS MANAGMENT FOR MUMBAI
COASTAL ROAD PROJECT
14. Total Length of Tunnel = 4325.60 m
Banana Jet Fans are being proposed for this project.Effective Volume of Tunnel,(V) = Effective C/S Area of Tunnel * Total
Tunnel = 63.35 * 4325.60 = 2,74,026.76 m3
Length of15.
8.9.3.11 Banana Jet Fans
By bending the air jet from a jet fan in a tunnel away from the restrictive surface (walls /ceiling) the
performance of the fan in the system can be dramatically improved. This can be done with silencers
or ducts which are bent with an angle of 5 – 25 %. The source of the improvement is that not only
are the losses directly behind the fan virtually eliminated, but the airflow profile downstream in the
tunnel can be improved, further significantly reducing aerodynamic losses. The net result is a
reduction of the required installed thrust by 30 – 50 %. Not only does this mean that far fewer (or
smaller) fans need to be installed, but the installation cost for cabling, mounting etc. is also reduced
in the same proportion. A 30 – 50 % reduction in required thrust directly translates into a reduction
in energy cost in the same order of magnitude so there is a larger savings in operating costs in
addition to the benefit of lower capital cost. The use of Banana Jet can reduce these losses by 25 – 50
%, depending on the design of the tunnel. The physics behind this improvement is relatively
straightforward:
• Tunnel North Portal (RT4)
16. Effective cross-sectional Area of Tunnel = 63.35 m2
17. Total Length of Tunnel = 4325.60 m
18. Effective Volume of Tunnel,(V) = Effective C/S Area of Tunnel * Total Length of
Tunnel = 63.35 * 4325.60 = 2,74,103.41 m3
8.9.3.10 Fan Selection
Considering the fan selection from table 1.7 below,
8.9.3.12 Friction loss
An air stream that blows along a surface becomes ―glued‖ to the surface due to the induced swirl
and
one-sided low pressure. This effect, called ―Coanda-Effect‖ creates a less uniform flow in the
tunnel,
with larger velocities along the wall).
• The capacity of the fan considering 4 Poles = 38,205 cmh
No of fans required for each of the tubes will be as given in table1.8.
•
Detailed Project Report 124
Sn. No. Particulars Fan Capacity (CMH) No. of Fans Power Required (KW)
1.0 South Portal (L) 38205 50 11
2.0 South Portal (R) 38205 50 11
3.0 North Portal (LT1) 38205 110 11
4.0 North Portal (LT2) 38205 110 11
5.0 North Portal (RT3) 38205 110 11
6.0 North Portal (RT4) 38205 110 11
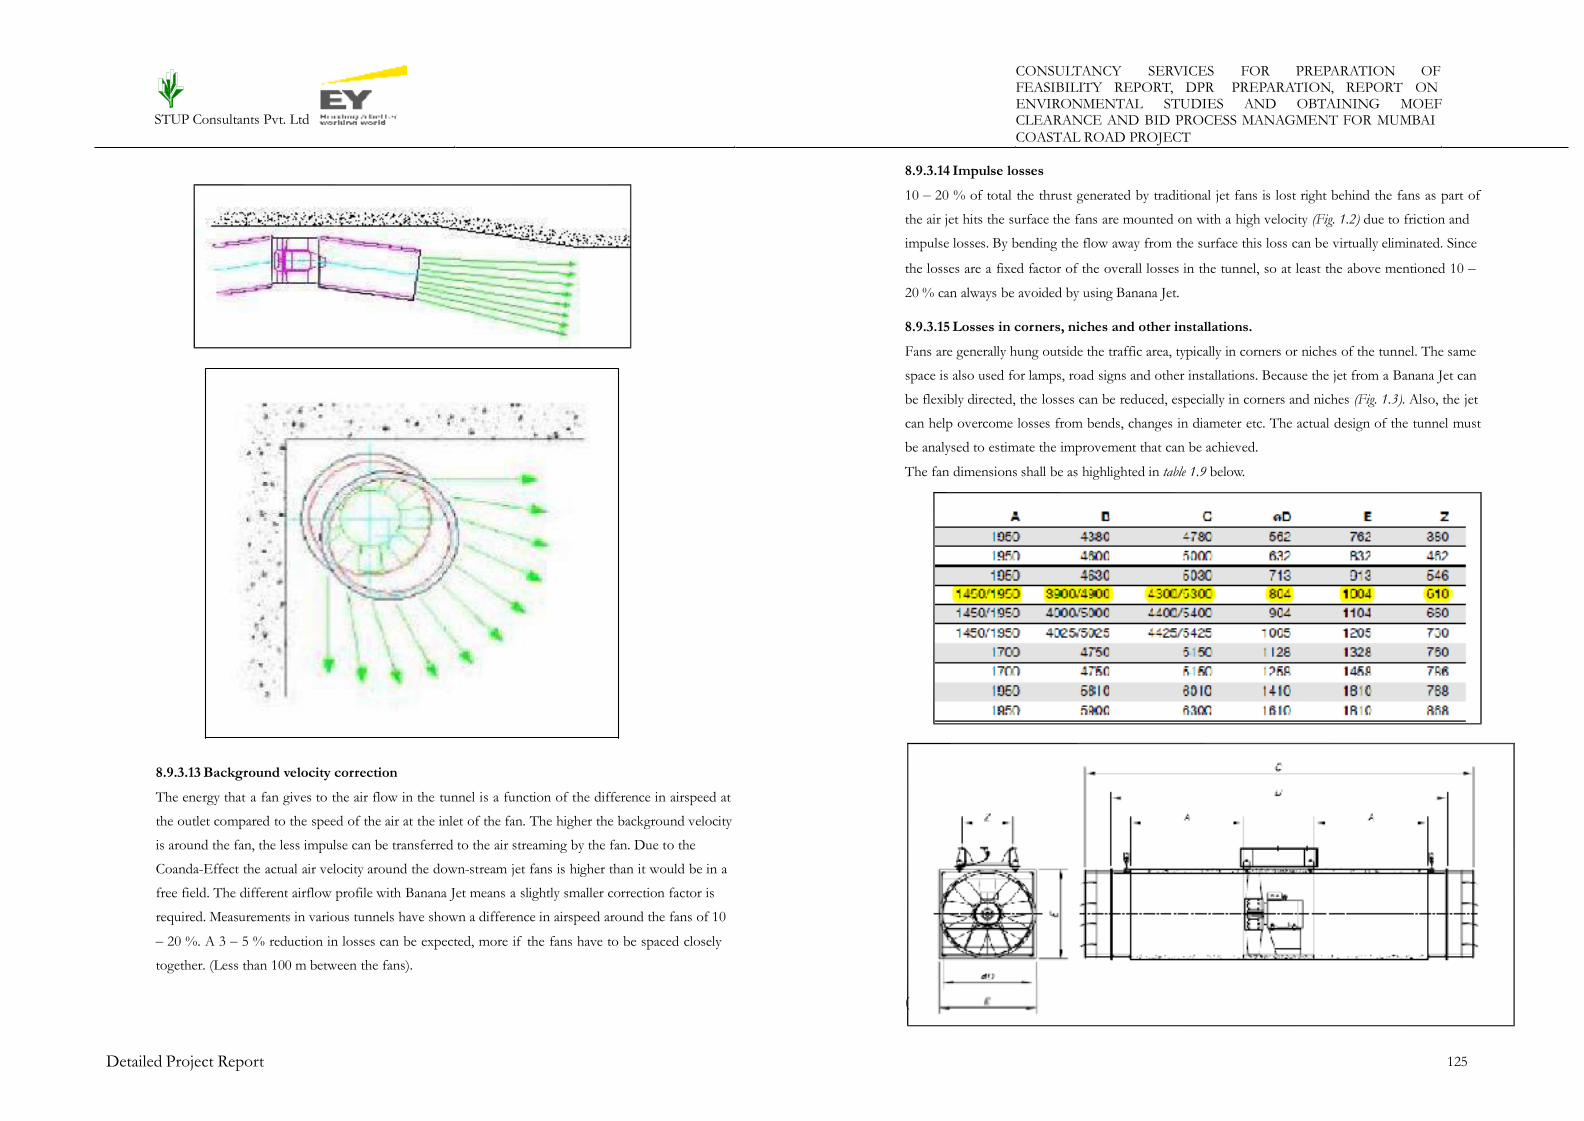
Fig 1.4)
CONSULTANCY SERVICES FOR PREPARATION OFFEASIBILITY REPORT, DPR PREPARATION, REPORT ONENVIRONMENTAL STUDIES AND OBTAINING MOEF
STUP Consultants Pvt. Ltd CLEARANCE AND BID PROCESS MANAGMENT FOR MUMBAI
COASTAL ROAD PROJECT
8.9.3.14 Impulse losses
10 – 20 % of total the thrust generated by traditional jet fans is lost right behind the fans as part of
the air jet hits the surface the fans are mounted on with a high velocity (Fig. 1.2) due to friction and
impulse losses. By bending the flow away from the surface this loss can be virtually eliminated. Since
the losses are a fixed factor of the overall losses in the tunnel, so at least the above mentioned 10 –
20 % can always be avoided by using Banana Jet.
8.9.3.15 Losses in corners, niches and other installations.
Fans are generally hung outside the traffic area, typically in corners or niches of the tunnel. The same
space is also used for lamps, road signs and other installations. Because the jet from a Banana Jet can
be flexibly directed, the losses can be reduced, especially in corners and niches (Fig. 1.3). Also, the jet
can help overcome losses from bends, changes in diameter etc. The actual design of the tunnel must
be analysed to estimate the improvement that can be achieved.
The fan dimensions shall be as highlighted in table 1.9 below.
8.9.3.13 Background velocity correction
The energy that a fan gives to the air flow in the tunnel is a function of the difference in airspeed at
the outlet compared to the speed of the air at the inlet of the fan. The higher the background velocity
is around the fan, the less impulse can be transferred to the air streaming by the fan. Due to the
Coanda-Effect the actual air velocity around the down-stream jet fans is higher than it would be in a
free field. The different airflow profile with Banana Jet means a slightly smaller correction factor is
required. Measurements in various tunnels have shown a difference in airspeed around the fans of 10
– 20 %. A 3 – 5 % reduction in losses can be expected, more if the fans have to be spaced closely
together. (Less than 100 m between the fans).
(
Detailed Project Report 125

CONSULTANCY SERVICES FOR PREPARATION OFFEASIBILITY REPORT, DPR PREPARATION, REPORT ONENVIRONMENTAL STUDIES AND OBTAINING MOEF
STUP Consultants Pvt. Ltd CLEARANCE AND BID PROCESS MANAGMENT FOR MUMBAI
COASTAL ROAD PROJECT
8.9.3.21 Building HVAC
The basis of design for air conditioning of the Nodal Operation Centres is as follows:-
Outside Weather Data:
8.9.3.16 Fan Construction
The jet fans should be manufactured in a simple and sturdy manner. To avoid corrosion the jet fans
and the mounting structure should be manufactured in stainless steel 1.4571(V4A). The fans should
be exchangeable. The jet fans should be designed to run in both directions. The volume flow has to
reach at least 95% of the forward mode duty. In the event of emergency it should be possible to
change the direction with a de-energized period of 15 seconds. Under normal duties the jet fan has
to be constructed to run at temperatures between –20 and +40°C. In the event of fire, the jet fan has
to withstand a temperature up to 250°C for 90 minutes.
i.
a)
Location
Latitude (oN)
-
-
Mumbai
27.10oN
Outside Thermal Data
8.9.3.17 Casing
The casing and the motor support should be manufactured from heavy construction 6mm stainless
steel. To avoid corrosion in cracks the flanges have to be formed at the fan casing (no welded
construction). Welds must be continuous. The external terminal box in stainless steel 1.4571 is heavy
duty and corrosion resistant in IP65.
Inside Design Conditions
8.9.3.18 Impeller
The impeller is made of corrosion-resistant, cast aluminium. The nucleus of the hub is made from
stainless steel 1.4571.
8.9.3.19 Silencers
Due to corrosion protection, all components of the silencers are manufactured in stainless steel
1.4571. At the inlet and the outlet side, an aerodynamically shaped cone has to be provided.
Inside dry bulb temperature shall be maintained within + 2ºF (or + 1ºC) by using suitable controls.
8.9.3.20 Motor
Three-phase, fully enclosed, squirrel cage motors according to IEC standards in IP 55 should be
used.
8.9.3.22Design Basis For Cooling Load Calculation
(Table 1.12)
Note: Lighting, Equipment & Fresh Air requirement considered as per standard design practices
followed. Some assumptions were made where the information was not available.
Detailed Project Report 126
DescriptionOccupancy
(Sqft/Person)
Fresh Air
(cfm/Person)
Lighting/
Equipment Load (W/Sqft)
Admin. Offices 100 25 4
Meeting Room 15 20 6
Area DescriptionDry Bulb Temperature
Relative HumiditySummer Winter
Office Area 72 + 2ºF (22 + 1ºC)70+2ºF
(21+1ºC)Not exceeding 65%
Corridors 76 + 2ºF (24 + 1ºC)
Summer Monsoon Winter
a. Dry Bulb 90.32ºF (32.4ºC) 87.08oF (30.6oC) 84.38oF (29.1oC)
b. Wet Bulb 82.76ºF (28.2ºC) 81.86oF (27.7oC) 75.56oF (24.2oC)

CONSULTANCY SERVICES FOR PREPARATION OFFEASIBILITY REPORT, DPR PREPARATION, REPORT ONENVIRONMENTAL STUDIES AND OBTAINING MOEF
STUP Consultants Pvt. Ltd CLEARANCE AND BID PROCESS MANAGMENT FOR MUMBAI
COASTAL ROAD PROJECT
Plant Rooms: 8.10.1 Access Zone
It is the portion of the open/approach cut of the tunnel immediately adjacent to Tunnel Portal. The
Luminance Level in this zone is generally kept at around 70 candelas/ sqm of road surface.
a)
b)
c)
d)
General Ventilation : 15 Air Changes / Hr.
15 Air Changes / Hr.
30 Air Changes / Hr.
12 - 15 Air Changes / Hr.
Additional in case of fire :
Total in case of fire
Toilets
:
:
8.10.2 Threshold Zone
It is the first zone next to the entrance to a tunnel. In the Threshold Zone, the intensity of lighting is
gradually adjusted from that outside the entrance to that in the beginning of the transition zone. The
Luminance Level in this zone is generally kept at around 40 candelas/ sqm of road surface.
8.9.3.23 Noise Criterion
All air conditioning equipment and materials (like pumps, chillers, motors, ducts, grilles, acoustic
lining etc.) shall be selected, designed and installed in such a manner that the inside noise criterion
for all conditioned spaces will be in the range NC- 35 to NC- 40.8.10.3 Transition Zone
It is the zone next to the Threshold Zone. In the Transition Zone, the intensity of lighting is
gradually adjusted to that in the Interior Zone.It is proposed to install wall/ ceiling mounted unitary split type
airconditioning requirements.
air conditioners for the NOC
8.10.4 Interior Zone
It is the zone beyond the transition Zone. It is sometimes also termed as Normal Lighting Day
Zone. In the Interior Zone, the vision of a motorist needs no further adaptation. This is the longest
zone in case of very long tunnels. The Luminance Level in this zone is generally kept at around 15 to
20 candelas/ sqm. of road surface.
It would be good practice in the case of very long tunnels to provide some variations in lighting at
regular intervals, through variation in intensity or colour of lighting etc., so as to break the monotony
of traveling under the same conditions for a long distance. Extra lighting is required in lay-bys,
emergency parking locations and at locations of escape paths and emergency services access
locations.
8.10 Lighting
A tunnel is a linear enclosed space, covered by ground all around. Thus even in broad daylight inside
a tunnel is always dark.
It is, therefore, necessary to create a well-lit environment inside a road tunnel. During daytime when
a vehicle approaches and enters a tunnel, a motorist has to travel from a brightly lit area into a lightly
lit area. Thereafter when the motorist leaves the tunnel, he has to travel from a lightly lit area to a
brightly lit area.
At night the situation gets totally reversed. When a motorist approaches and enters a tunnel, he has
to travel from a dark area to a brighter lit area. Thereafter when the motorist leaves the tunnel, he
has to travel from a brighter lit area to a dark area.
Thus when a motorist travels through a tunnel, his vision has to get adapted to changing lighting
conditions. This adaptation is not instantaneous but takes a short time. Such adaptation has to be a
smooth transition. Such smooth transition can be produced only by suitably designed lighting
conditions at the entry and exit areas of the tunnel and the portion of the tunnel in between these
areas.
Properly designed tunnel lighting ensures smooth transition of lighting environment between
approaches to the tunnel and the tunnel itself. This helps the vision of a motorist to get smoothly
adapter to changing lighting environment. This time for such smooth adjustment is generally
considered as about 4 seconds. At a speed of 60 kmph, the length traveled in 4 seconds would be
about 70 m.
To enable the vision of a motorist to get smoothly adjusted to changing lighting environment, the
approaches to a tunnel and the tunnel itself are divided into various zones as given below. For design
speed of 60 kmph, length of these zones would be about 70 m.
8.10.5 Exit Zone
It is the zone beyond the Interior Zone and between/before the exit portal of the tunnel. In the Exit
zone, the intensity of lighting is gradually adjusted to that in the portion just beyond the Exit Portal.
8.10.6 Street Lighting
In Mumbai, street lighting is required only during the night. The Luminance Level in this zone is
generally kept at around 15 to 20 candelas/ sqm. of road surface. At all major intersections high mast
LED flood lights are proposed. Extra lighting is required in lay-bys and emergency parking locations.
8.10.7 Lighting installations
The purpose of properly designed tunnel lighting is to ensure smooth transition of lighting
environment so as to enable smooth adjustment in the vision of a motorist.
Since requirement of intensity in the Threshold, Transit and Exit Zones during day time is different
than that during night time, required intensity can be achieved by putting the luminaries in two
Detailed Project Report 127

CONSULTANCY SERVICES FOR PREPARATION OFFEASIBILITY REPORT, DPR PREPARATION, REPORT ONENVIRONMENTAL STUDIES AND OBTAINING MOEF
STUP Consultants Pvt. Ltd CLEARANCE AND BID PROCESS MANAGMENT FOR MUMBAI
COASTAL ROAD PROJECT
different circuits. Alternatively, luminaries that can give variable output by use of dimmers can also
be used.
Gradual increase or decrease in the intensity of lighting within different zones, as described above,
can be achieved by installing different types of luminaries or by using one or two types of luminaries
at a closer or wider spacing as required. For easier adjustment in spacing, the luminaries can be
mounted on sets of ladders arranged in longitudinal direction and hung from the crown of the
tunnel.
Tunnel lighting has to be highly reliable. Tunnel lighting is required round the clock. It is therefore
necessary to install and maintain a 100 percent back-up system.
The amount of maintenance required would depend on where the tunnel is located, the type and
volume of traffic it is required to handle, quality of ventilation and the size and grade of the tunnel
itself.
The luminary units should be sealed so as to prevent entry of water from water sprays, dust and
smoke. The luminaries have to be cleaned frequently to clear dust and soot that may collect on their
outer surface. Proper routine maintenance programme should be conceived and implemented.
Instead of waiting for the luminaries to fail before replacement, systematic replacement and renewal
programme should be conceived and implemented.
(Fig 2.2)
A combination of 90 watt, 120 watt and 200 watt LED luminary units are proposed for the tunnel
lighting. For street lighting 60 watt solar powered LED luminaries are proposed.
8.11 Electrical
8.11.1 Design Standards & Codes
Electrical system design shall be in confirmation to the requirement of:
• Indian Electricity Rule 1956.
• Standards & Code Practice of Bureau of Indian Standard for various
Systems.
equipments &
• National Building Code of India -2005 (Part -8)
• National Electricity Code of India
Detailed Project Report 128
Space Served Luminaire Nos. Lighting Load (W) Total Load (KW)
Tunnel Wall/Ceiling Mounted 2060 90 185.40
Tunnel Wall/Ceiling Mounted 5005 120 600.60
Tunnel Wall/Ceiling Mounted 590 200 11.80
Road Street Light 3190 60 191.4
Road High Mast 25 5000 125.00

CONSULTANCY SERVICES FOR PREPARATION OFFEASIBILITY REPORT, DPR PREPARATION, REPORT ONENVIRONMENTAL STUDIES AND OBTAINING MOEF
STUP Consultants Pvt. Ltd CLEARANCE AND BID PROCESS MANAGMENT FOR MUMBAI
COASTAL ROAD PROJECT
8.11.2 Design Criteria 8.11.3 Electrical Load Estimates
Based on the above parameters and design brief for M & E services, the load requirement of whole
complex works out as below;
8.11.4 Source of Power
Total electrical power requirement for the project (overall maximum demand) shall be 3720 kW. It is
proposed to source the power from 2 different power sources to have redundancy in the system to
have emergency source of power also. The required power may be made available through DG Sets.
8.11.5 Backup Power Supply
100% Power backup is planned for the in the case of power outage and transformer maintenance. In
case DG Sets are being provided, sets of 415 Volt are proposed in the DG Plant Room at Basement.
As per the load calculations, the DG Sets of a total capacity of 14.86 ≈ 15 mVA are required.
All DG Sets shall be air cooled. DG Plant Room shall be acoustically treated to arrest the noise
pollution as per CPCB Norm. DG Sets are envisaged to be operated in synchronizaion mode.
Provision of PLC shall be done with Manual override facility, so that auto as well as manual
synchronization can be done. PLC shall have in-built feature of synchronization, auto load sharing
and auto load shading for the DG Sets.
Exhaust piping for the DG Sets shall be taken up to the highest point as per CPCB guidelines.
Following design parameters are considered while estimating the NOC electrical loads:-
8.11.6 Power Distribution System
8.11.6.1 LT Distribution
• Power supply shall be terminated to the MV switchgear panel. MV switchgear panel shall have
cubical type construction, multi-tier designed MV switchgears MDO / EDO / ACB/ MCCBs
provided with short circuit and earth fault protection are being envisaged. These will be located
Detailed Project Report 129
Sn. No. DescriptionLight
(Watt/Sqft)
Convenience
Power
(Watt/Sqft)
Ups/Equipment
(Watt/Sqft)
1 Stair case 0.7 - -
2 Corridors, Toilets, Elec. Room 2.0 0.2 -
3 Office/Meeting Rooms 2.5 4.0 2.0
Sn. No Description Estimated Connected Load
(kW)
Overall Max. Demand (mW)
1 Tunnel Ventilation 5940 10.51 (mW) Approximately
6.3 mW at 0.9
P.F. say ≈ 5.67 mW
2 NOC 48.6
3 Tunnel Lighting 797.8
4 High Mast Lighting 125
5 Street Lighting Nil (Solar)
6 Fire Panel Room 3600
Design Criteria Proposal to Achieve Same
Energy Efficiency Use of energy efficient light fittings, ballast and LED light fixtures
shall be considered.
Provisions of SCADA to allow energy saving in off-peak operation.
Safety of the passengers
and end users
Strict compliance with Indian Electricity Rules & other safety code
requirements.
All lighting and power circuits shall be protected by the circuit
breakers and ELCBs.
Surge Arrestor shall be provided at the Main Panel and other
SDBs/FDBs which has external in/out cable connections.
NOC building shall be protected by the Lightening Protection
System.
Reliability of the
Installation
Transformers with power from 2 different sources shall be
considered for redundancy.
Additionally provision for the DG Sets can be considered.
Flexibility and Adaptability Planning shall be in such a way that distribution system will not have
major change in case of change in design of utilities.
Maintainability Space planning shall be done with consideration of regular service,
maintenance; and future replacement.
Expandability Sufficient spare capacity (about 20-25%) in the design of
switchboard and distribution network to meet future load growth.

CONSULTANCY SERVICES FOR PREPARATION OFFEASIBILITY REPORT, DPR PREPARATION, REPORT ONENVIRONMENTAL STUDIES AND OBTAINING MOEF
STUP Consultants Pvt. Ltd CLEARANCE AND BID PROCESS MANAGMENT FOR MUMBAI
COASTAL ROAD PROJECT
in the NOC buildings and will be feeding power to different floors through L.T Cables/Rising
Mains.
wiring/point wiring shall be carried out with 2.5 Sqmm copper conductor while power wiring
shall be carried out with 4 Sq.mm. copper conductor wires. Colour code shall be maintained for
the entire wiring installation i.e. Red, Yellow and Blue for the phases and black for the neutral
and green for earthing.• There are two methods for distribution of power;
Option-I: Through cables. Here we propose to have Main Distribution Board at the NOC and
distribute the power to each load center through cables.
Option-II: Through Rising Mains. This system is not envisaged for this project as it is technically
unviable.
8.11.6.4 Earthing System
Safety in using electrical energy is of paramount importance considering its dangers. The earthing
system will be in conformity with the IS: 3043. All non-current carrying metal parts forming part of
the electrical system shall be connected to the grounding system. The requirement of Indian
Electricity Rules and statutory requirement of local Electricity Authority shall also be met fully.• Further distribution from will be through DBs located near the equipment / individual area load
centers. These DBs will be fed from the specific utility panels located in the NOC.a) The earthing system is divided into two sections;
• Power Factor Control
In order to achieve the economy due to improvement in P.F, it is proposed to install required
capacitor banks on each bus of the substations switch gears. Capacitors of required Capacity will be
provided in capacitor panel / bank to take care of the reactive load and also meet the power factor of
system 0.95 or better.
• For Electricity Measurement, Energy Meters shall be provided in the incoming and outgoing
feeders of MV Switchgear panels. However, Electrical panels for each utility shall be provided
with sub energy meters.
b) Separate Earth stations shall be provided for all IT, electronic equipment and communication
system.
8.11.6.2 Cabling/ Wiring
• MV Power Cable
Adequately sized PVC sheathed, XLPE insulated Aluminum conductor, 1100 V grade armoured
power cables conforming to IS-7098 Part-I shall be provided for power distribution in pipe /cable
trays. For outdoor application wherever required, cables shall be installed underground as per BIS
and road crossing etc shall be through already laid GI /RCC Hume pipes. Copper Conductor Cable
shall be used upto 25 Sq.mm size and above 25 Sq.mm size, Aluminium conductor cable shall be
used.
8.11.7 Lightning Protection System
Lightning protection is required only for the NOCs. Since this is not a high rise complex, sprawling
over large area, conventional lightening protection system shall be provided. The lightning protection
system shall consist of adequate lightning rods/ arrestors at terrace level, connected directly to earth
station by 70 sq. mm single core PVC insulated flexible copper conductor. Required number of
earthing Stations shall be provided for lightening protection.
8.12 Plumbing and Sanitary System8.11.6.3 Wiring Installation
8.12.1 Codes and Regulation
Plumbing/Sanitary systems will be designed and installed conforming to the following codes and
standards:
• Generally, the electrical wiring installation will conform to IS standard (IS:732-1989). The
complete wiring installation concealed or exposed will be installed in heavy gauge rigid steel
conduit (black steel).
•
•
Regulations of the local authority.
NBC 2005 (National Building Code of India) Part-9.• The wiring for light and small convenience power outlets within the NOC shall be with PVC
insulated (HRFR) copper conductor wires conforming to IS:694. The lighting circuit
Detailed Project Report 130
1 Substation Earthing (Copper) a. Transformer neutral solidly earthed
b. DG Set neutral solidly earthed
2 Protective Earthing (GI) a. HT panel body earthing
b. Transformer & DG Set body earthing
c. LT Panels
d. Power Panel
e. Equipment

CONSULTANCY SERVICES FOR PREPARATION OFFEASIBILITY REPORT, DPR PREPARATION, REPORT ONENVIRONMENTAL STUDIES AND OBTAINING MOEF
STUP Consultants Pvt. Ltd CLEARANCE AND BID PROCESS MANAGMENT FOR MUMBAI
COASTAL ROAD PROJECT
• Manual on water supply and treatments published by Central Public Health and Environment
Engineering Organization Ministry of Urban Development, Govt. of India.
Manual on sewerage and sewage treatment published by Central Public Health and
Environment Engineering Organization Ministry of Urban Development, Govt. of India.
SP 35 (Hand Book of Water Supply and Drainage)
Relevant BIS Codes.
IS: 10500 for drinking water specification, BIS.
IS: 1172 - Code of basic requirement for water supply drainage & sanitation, BIS
Good Engineering Practice.
8.12.4 Basis of Design for Sewerage
• The sewer lines have been designed for three times average dry weather flow in relation to the
water supply demand.
It has been assumed that 90% of the domestic water supply (non-flushing) shall find its way
into the proposed sewer, 100% of the flushing water supply shall find its way into proposed
Sewer.
All the sewers have been designed to run half full.
Necessary provision for laying S.W. sewer lines and half flow condition.
Storm Water Drainage System
Storm water drainage systems will be designed based on a rainfall intensity of 150 mm per
hour. Rainwater harvesting pits of size 4m diameter x 3.5m effective depth shall be provided.
Storm water drainage system will be provided for the building roof drainage and the site
drainage.
Required earth filling shall be provided to rain storm water pipes through catch basins and
manholes.
The Storm water will be collected by gravity through catch basin, storm water manhole and
RCC pipe and finally discharged into the municipal drainage system.
•
•
•
•
•
•
•
•
•
4.4
•8.12.2 Water Supply System
The water supply from City Water (Municipal Main) shall be brought to underground fire storage
tank and overflow from fire storage tank shall be taken to domestic water storage tanks in order to
replenish the fire storage water. The truck fill points provision shall be made to meet emergency
requirement.
Water from domestic water storage tank shall be pumped through to the overhead tank and shall be
distributed from there to meet the domestic/ flushing water requirement.
•
•
•
8.12.3 Sewerage
Drainage system for soil & waste is based on the most efficient, functional design & considering,
minimum maintenance after installation and available site topography to minimize the excavation
work in laying the pipes. Two pipe systems (soil and waste) are proposed to carry soil and waste
separately from the building under gravity.
Waste pipes are connected to manhole through gully trap and soil pipes are to be directly connected
to the manhole.
Each fixture in the system shall be vented to the atmosphere to provide protection of trap seals
against siphonage and gas leak due to positive pressure, to promote rapid and silent flow of waste,
and to ventilate the sanitary system to reduce corrosion.
Floor drain in guest room bathrooms should be avoided. If required, provide traps with trap primers
to eliminate the potential for methane gas entering guestrooms.
Air-gaps on sanitary system drains for food service equipment shall be provided.
When sewer ejectors are required, duplex submersible sump pump system with each pump sized at
65% of peak load shall be provided. System includes control panel for alternating pumps, pump
failure alarm and high water level. Sewer pump shall be connected to backup power.
8.13 Fire Suppression System
8.13.1 High Pressure Water Mist Fire Suppression System
• Scope
This specification sets off the minimum requirements for the high pressure mist system to be
installed for the proposed tunnel project.
The works outlined shall cover the design, supply of all materials, equipment and labour necessary
for the complete installation, testing, commissioning and handing over a completed, approved and
working high pressure mist system.
8.13.2 Technical Specifications
The detailed calculation and design data shall be submitted at the tender stage as a minimum
requirement.
The design, supply and installation shall be made in strict accordance with codes, regulations and
applicable standards.
The high pressure mist system is intended to control and suppress the fire.
Detailed Project Report 131

CONSULTANCY SERVICES FOR PREPARATION OFFEASIBILITY REPORT, DPR PREPARATION, REPORT ONENVIRONMENTAL STUDIES AND OBTAINING MOEF
STUP Consultants Pvt. Ltd CLEARANCE AND BID PROCESS MANAGMENT FOR MUMBAI
COASTAL ROAD PROJECT
8.13.3 Codes and Standards 8.13.5 System Description and Operation
The high pressure water mist system has to be a zoned system. Whole tunnel has to be divided to the
multiple fire zones/ sections. In case of fire, the fire zone will be detected and activated by the
installed detection and control system. Additionally, the two adjacent sections will be activated. So in
a fire scenario 3 sections can be activated. The minimum length of each section has to be 18mtrs.
As more detailed system operation, the system has three basic modes:
8.13.3.1 The following Codes and Standards shall apply with respective parts applicable to
tunnels.
a)
b)
NFPA 502 Standard for Road Tunnels, Bridges and Other Limited Access Highways, 2014.
SOLIT Engineering Guidance for a Comprehensive Evaluation of Tunnels with Fixed Fire
Fighting Systems, 2012- Annex 3. Engineering guidance and – Annex 7. Fire testing
specifications. 8.13.6 Stand-by
During stand-by the system waits the fire alarm, detection and localization. The jockey pump will
pressurize the wet main pipes to approx. 5-15 bar pressure. The pressure at the main pipe will be
monitored continuously. This is due to avoid delays filling the main pipe. The section valves stays
closed in all sections and the access of water is stopped to the zones.
8.13.3.2 References
The following documents are references as guidance:
a) Uptun, Engineering Guidance for Water Based Fire Fighting Systems for the Protection of
Tunnels and Sub Surface Facilities, September 2007.
PIARC World Road Associationb) 8.13.7 Detection and Activation
During detection, the system will recognize and localize the fire. This will trigger through the control
system the respective section valves and sends an activation command to the pump station. First the
booster pumps (providing the pre-pressure) will start and then the high-pressure pumps will start in a
cascade mode and the water will be pumped through the main pipes to the activated sections.
The system remains activated for 60 minutes or until qualified staff or the fire brigade has manually
shut off the system. The system should operate in the specified way so that the farthest nozzle
should operate at a minimum at 45 bar pressure.
Deactivation:
System deactivation will happen on the command of the fire services or the operator. The pump
station will be switched off and section valves will be closed with the control system. Finally the
system will be returned to the stand-by mode.
i.
ii.
iii.
iv.
Road Tunnels: Vehicle Emissions and Demand for Ventilation, latest edition.
Fire and Smoke Control in Road Tunnels, latest edition.
Systems and Equipment for Fire and Smoke Control in Road Tunnels, latest edition.
Transport of Dangerous Goods
8.13.4 System Design Basis
8.13.4.1 Requirements
The water mist shall comply in every aspect with the National Fire Protection Association (NFPA)
502, SOLIT2 guideline including Annex 3. Only open type nozzles shall be used. All tests shall be
carried out in accordance to SOLIT2 guideline Annex 7 and shall be witnessed by an independent
surveyor being experienced in the field of full scale fire testing for vehicular tunnels. Provide a
minimum reduction on heat release rate of fire of 50% for a potential 200 mW un-sprinkled. Details
of testing that has been conducted, engineering analysis and calculations or cited references in
support of the reduced heat release rate shall be provided. The system shall be capable of application
to heavy good vehicle fires. Excluded vehicles shall require further consideration for escorted travel
by the tunnel user group. The water mist system shall ensure that prevention of fire from spreading
from one to another vehicle, demonstrated by using a fire target consisting wooden pallets
positioned in 5m distance downstream from the main fire load measuring temperatures in this
location. The water mist system shall be high pressure, operating between 45-140 bar. The operation
time of the water mist system shall be calculated for a minimum of 60 minutes and the tank capacity
shall be dimensioned accordingly.
8.13.8 System Components
8.13.8.1 Pumps and Accessories
The pump station should consist of multiple pump units having a combination of N +1 unit with
each pump having a capacity of minimum 100 lpm capacity. Every pump is started in a star delta
mode to avoid high requirement of current.
The excess water will be drained through an overflow valve at the pump station. Along the main pipe
vent valves, drain valves and service valves will be installed.
The pump type is a plunger pump. All pumps are totally identical and their parts interchangeable.
The pump lubrication should be done by oil. Water lubricated pump is not acceptable.
Detailed Project Report 132

CONSULTANCY SERVICES FOR PREPARATION OFFEASIBILITY REPORT, DPR PREPARATION, REPORT ONENVIRONMENTAL STUDIES AND OBTAINING MOEF
STUP Consultants Pvt. Ltd CLEARANCE AND BID PROCESS MANAGMENT FOR MUMBAI
COASTAL ROAD PROJECT
The high pressure pump unit consists of the following main components: i) Automatic self-cleaning filter (100 µm)
i)
ii)
iii)
iv)
v)
vi)
Plunger pump
Combined safety valve, overflow and unloading valve
Safety valve
Each Electric driven motor approx. 30 kW
Direct coupling between electric motor and pump
Base frame for pump unit
ii)
iii)
iv)
v)
vi)
Triplex plunger pump
Electric motor
Pressure gauge
Safety valve
Pressure accumulator.
Material specification:
Material Specification i)
ii)
iii)
Pump head: brass
Inner pump head parts: high grade stainless steel
Plungers: ceramic
i)
ii)
iii)
iv)
Pump head: stainless steel
Plungers: ceramics or non-corrosive steel
Crankshaft / Pinion shaft: forged carbon steel
Gear casing: carbon steel8.13.8.2 Nozzles
The high pressure mist nozzles shall be made out of stainless steel material. The Nozzle should have
imbedded micro nozzles with filters. The Nozzles shall be installed in accordance with the
manufacturer‘s approved listing/fire test. The droplet size shall be in the range of between 20 to
1000µm. Each nozzle will have a Filter. Operating pressure shall be minimum 45 bar at Nozzle. The
nozzles shall not be glass bulb type nozzles. The nozzle shall consist of multiple orifices that are
dismountable from the nozzle body. The number of orifices shall be 5 or 7 and k factor should be
either 4.7 or 7.3. The nozzle shall be installed with separate installation socket to the pipe work for
easy removal for maintenance purpose. The nozzles shall be screwed into the sockets. The sockets
will be welded to the pipe.
Suitable 100µm stainless steel filters shall be installed at the suction end of the high pressure mist
system pump. They shall be installed in such that they are accessible for operation, maintenance and
inspection.
All high-pressure pumps shall be installed on steel skids with anti-vibration mounts. All pumps shall
be delivered complete with factory test certificate.
Control Panel
A local pump control panel shall be provided to provide control of all pumps (high-pressure pump
units, booster pumps and jockey pump) and shall provide local control within the pump room.
Manual control shall be possible. The control panel shall have alarm indication of on/off/fault. The
control panel shall be interfaced to the SCADA system to provide notification of pump status.
Booster Pump
Booster pump units (two) shall be provided a duty & standby, and shall be centrifugal type pumps
providing the minimum suction condition as required by high-pressure pumps.
Basket Filter
Filters shall be provided and shall be manufactured from stainless steel. A pressure differential switch
shall be provided to the main filter to provide notification of when the filter requires cleaning. An
alarm shall be raised to indicate the filter requires maintenance. Visual indication shall also be
provided. The size of the filter apertures shall be in accordance with the manufacturer‘s
requirements. Jockey pumps shall be provided with self-flushing filters. The filters shall allow the
continuous operation of the system for 60 minutes at the required flow rate.
Jockey Pump
The jockey pump pre-pressurizes the wet main supply pipes in the stand-by operation and it consists
of the following main components:
8.13.8.3 Section Valve
The section valve that controls the release of suppression water to each dry-pipe zone from the wet
main pipe shall be in accordance with SOLIT2 guideline Annex 3. The valve shall be a ball valve type
and the parts that are in contact with water shall be made of stainless steel. (AISI 316). The time
taken for opening / closing of the valve shall reduce the water hammer effect.
The section valve shall be capable of remote opening / closing via electric motor actuator using 24
Volt signal. The solenoid operated or other actuator types are not allowed. Actuator shall have self-
diagnostics for possible faults. The valve shall have visible indication of the position of the valve and
electric monitoring of the position. Manual override locally at the valve shall be possible. The valve
shall be monitored by SCADA and shall be able to be tested without discharging the water.
Lockable isolation valve(s) shall be provided to enable maintenance of the each section valve. This
shall be installed on the upstream side of the section valve. The valve shall be a ball valve type and
the parts that are in contact with water shall be made of stainless steel. (AISI 316). The diameter of
isolation valve shall be same as the used section valve.
Detailed Project Report 133

CONSULTANCY SERVICES FOR PREPARATION OFFEASIBILITY REPORT, DPR PREPARATION, REPORT ONENVIRONMENTAL STUDIES AND OBTAINING MOEF
STUP Consultants Pvt. Ltd CLEARANCE AND BID PROCESS MANAGMENT FOR MUMBAI
COASTAL ROAD PROJECT
All valves shall be rated to withstand operating pressures and shall be tested to 1.5 times the design
pressures.
Factory test certification for the integrated section valve including actuator shall be provided by the
manufacturer, providing evidence of accepted functional testing within the factory. The valve shall
be delivered as a complete, integrated unit.
Section valves shall be located within protected stainless steel box enclosures to protect against
damage within the tunnel. The enclosures shall be sized to allow for maintenance activities and shall
be constructed of fire retardant material. Fire test certificates shall be produced for the completed
enclosure.
Valve boxes and pipework shall be installed in locations which avoid damage to the suppression
All pipework shall be properly flushed prior to before commissioning. Hydrostatic pressure testing
shall be undertaken which shall be witnessed by the client. Records of all hydrostatic testing shall be
forwarded to the client.
8.13.9 Co-ordination with the Tunnel Ventilation System
1) The design shall consider the effects that the tunnel ventilation system will have on the
performance of the suppression system. The contractor shall take into account the velocitygenerated
by the tunnel ventilation system within the tunnel in order to select a suitable discharge nozzle.
Trajectory analysis is required to be undertaken and discharge spray patterns assessed in both non-
emergency tunnel ventilation and emergency tunnel ventilation mode conditions to ensure that
adequate fire suppression is maintained to the fire suppression zones operated in a fire. The analysis
may be carried out by CFD based on full scale fire test data.
system in the event of an accident. All fire control equipment shall be monitored
systems (i.e. valves, pressure switches, flow switches etc.) at the control room.
via SCADA
2) The maximum tunnel ventilation velocity that the suppression system is capable of operating
8.13.8.4 Control System
All section valves will be connected to the control system and can be monitored. The control system
is furthermore connected to the detection system and the pump system.
The control unit allows to operate the system in a fully automatic mode as well as in a manual mode,
e.g. for maintenance, test runs or when fire fighters and trained staff shall modify or stop the
activation mode of the high pressure water mist system.
The installation of control cabling shall be coordinated with the SCADA system design.
successfully shall be determined by the contractor and this shall be coordinated with the ventilation
system design.
3) The design of the suppression system and ventilation system are inherently linked. The
suppression system will reduce the size of the chemical heat release rate and will cool its fumes and
will reduce the heat convection to the air of fire which benefits the ventilation system.
These shall be taken into account for the design of the ventilation system. Additionally the effects
that the ventilation system has on the suppression system must be considered. Therefore the design
of both systems is linked and each shall take consideration of the other.8.13.8.5 Water Tank
The high pressure water mist pumps are connected to a tank. The total capacity of the water tank
shall be sufficient to provide water supply for 60 minutes of operation. The tanks shall be placed
closed to the pump room.
8.13.10 Co-Ordination with Other Services
Coordination with all other services shall be undertaken to determine termination points /interface
points with the water mist suppression system. This shall include, but not be limited to the following:
a)
b)
c)
d)
e)
f)
g)
The electrical services power requirements.
The ventilation systems.
The detection system.
SCADA control systems.
The lining of the tunnel.
The civil works including construction of the tanks that supply the suppression systems.
Drainage.
8.13.8.6 Pipes and Fittings
The wet main pipe-works shall have a pressure rating of at least 140 bar and be made of stainless
steel duplex type (1.4462). The manifold and branch pipes shall be of AISI316 (1.4571/1.4404),
PN140bar. The dimensions must be calculated so that the pressure at all nozzles is at least 45 bar,
taking into account the pressure losses due to flow resistance. The pipe-work must be flushed after
installation and tested to at least 1.5 times the working pressure. The pipes will be connected by
welding. The main pipe is equipped with thermal compensation loops to deal with dilations.
The main pipe is equipped with the drain/flushing valves. The purpose of the valves is to allow the
pipe flushing to be carried out in various locations of the main pipe. Additionally the main pipe can
be drained through these valves.
Detailed Project Report 134

CONSULTANCY SERVICES FOR PREPARATION OFFEASIBILITY REPORT, DPR PREPARATION, REPORT ONENVIRONMENTAL STUDIES AND OBTAINING MOEF
STUP Consultants Pvt. Ltd CLEARANCE AND BID PROCESS MANAGMENT FOR MUMBAI
COASTAL ROAD PROJECT
8.13.11 Reliability Of The System
Particularly high requirements are established regarding the availability of a fire suppression system.
The same requirements must therefore be met for all individual components and units, e.g. for the
Pump system.
Thus, e.g. in a unit consisting of more than one pump, each pump must be furnished with a drive
motor of its own. Multiple drives, e.g. one motor / two pumps as well as gears or V-belt drives are
not permissible. In order to keep the susceptibility to failure and the amount of maintenance of the
pump units as low as possible, the number of individual components used must be limited. For
safety purposes, every high pressure pump must be equipped with a safety valve.
2)
3)
4)
5)
24 Copper & 2 Fiber port Layer 2 Network Switch- 2 nos.
24 Copper & 2 Fiber port Aggregation Switch- 2 nos.
Patch Panel- 1 no.
42U Network Rack- 4 no.
At South Portal of Tunnel/Ventilation building
1) 24 Copper & 2 Fiber port Layer 2 Network Switch- 2 nos.
2) Patch Panel- 1no.
3) 15U Network Rack- 1no.
At South Portal Round About
1)
2)
3)
24 Copper & 2 Fiber port Layer 2 Network Switch- 2 nos.
Patch Panel- 1no.
15U Network Rack- 1no.
At North Portal of Tunnel/Ventilation building
1)
2)
3)
24 Copper & 2 Fiber port Layer 2 Network Switch- 2 nos.
Patch Panel- 1no.
15U Network Rack- 1no.
At North Portal Round About
1)
2)
3)
24 Copper & 2 Fiber port Layer 2 Network Switch- 2 nos.
Patch Panel- 1no.
15U Network Rack- 1no.
At Cross Passage LV Room at All Locations
1)
2)
3)
24 Copper & 2 Fiber port Layer 2 Network Switch- 2 nos.
Patch Panel- 1 no.
15U Network Rack- 1 no.
At SOS Boxes Junction Box at All Locations
8.14 Integrated Tunnel Control System (SCADA) 1) 4/8 Copper & 2 Fiber port PoE Managed Network Switch- 2 nos. per Box
Dual fiber ring is proposed inside the tunnel for ITCS. Fiber Ring-A will start from Layer-3 Network
Switch in South Portal Control Room, will move through the Tunnel T1 cross-passage LV rooms,
North Portal Control Room and return to South Portal Control Room through a different path from
Tunnel T2. The same scheme will be used for the Fiber Ring-B i.e. Fiber Ring-B will start from
Layer-3 Network Switch in North Portal Control Room, will move through the Tunnel T2 cross-
passage LV rooms, South Portal Control Room and return to North Portal Control Room through a
different path from Tunnel T1
8.14.1 Network Architecture
At South Portal Control Room
1)
2)
3)
4)
5)
24 Copper & 2 Fiber port Layer 3 Network Switch- 2 nos.
24 Copper & 2 Fiber port Layer 2 Network Switch- 2 nos.
24 Copper & 2 Fiber port Aggregation Switch- 2 nos.
Patch Panel- 1 no.
42U Network Rack- 4 no.
At North Portal Control Room
1) 24 Copper & 2 Fiber port Layer 3 Network Switch- 2 nos.
Detailed Project Report 135

Vai CAT6
CONSULTANCY SERVICES FOR PREPARATION OFFEASIBILITY REPORT, DPR PREPARATION, REPORT ONENVIRONMENTAL STUDIES AND OBTAINING MOEF
STUP Consultants Pvt. Ltd CLEARANCE AND BID PROCESS MANAGMENT FOR MUMBAI
COASTAL ROAD PROJECT
8.14.1.1 System Architecture
SYSTEM ARCHITECTURE FOR INTEGRATE TUNNEL CONTROL SYSTEM(ITCS)
2) HLI Module- 1 no.
We are proposing PLC for Integrated Tunnel Control System (ITCS). Main PLC with CPU at south
portal and Redundant PLC with CPU at north portal has been proposed. We are proposing Remote
I/O (RIO) at the LV rooms at ECP/VCP cross passages inside the tunnel & at Portals. The PLCs at
South and North Portal have fiber Optic synchronization link /bus between them. PLCs have
dedicated dual redundant Fiber Optic network to connect the RIOs at all LV rooms in VCP/ECP.
Both main and redundant PLC will be connected to a dual redundant TCP/IP network. SCADA
servers at South and North portal will also connect to the same TCP/IP network. SCADA Server at
both South and North Portals are in redundant hot standby mode. In normal condition, the main
server at South Portal will monitor and control the entire system. Real time database synchronization
between main and redundant server would enable both the servers to be on the same platform at any
given point of time.
TCCEMERGENCYCALLSW TI CHBOARD -01
MAINEMERGENCYTEL EPHONE SERVER
CA DA Wo rkst ation ( MM I)
n ITCS SCAD A Ser ve rCCTVDa ta ba seSERVER
RECORDING SERVERNETWORK SW ITCH- 01 A
AIDSERVER/ MODUL ES
FIRE PANEL fo rBui ld ing
TWORK SWITCH– 01B
MASTER PL CPANEL(CPU-01)
DE
FiberRing-A Fib erRi ng-A
NETW ORK SW ITCH– 11A
l
SW ITCH– 14B
8.14.1.3 Network Architecture At ECP/VCP Cross Passages inside Tunnel
PLC System ArchitectureVia Remote IO
ess Cont
Integr ation
le dComm u ni c ati on Sy s tem
um C
lb o
Varia bl e Sig ns
Dyn amic Ro ad
8.14.1.2 PLC Solution Overview
At South Portal Control Room
1)
2)
Main PLC with CPU- 1 no.
HLI Module- 1 no.
At North Portal Control Room
1)
2)
Redundant PLC with CPU- 1 no.
HLI Module- 1 no.
At South Portal
1)
2)
PLC Remote IO Modules- 1 set
HLI Module- 1 no.
At North Portal
1)
2)
PLC Remote IO Modules- 1 set
HLI Module- 1 no.
At Cross Passage LV Room at All Locations
1) PLC Remote IO Modules- 1 set
Detailed Project Report 136
c
6
A
T C
Thre eCo l ore
EDCS
lb
m
o
TCP/IP CAT 6
T6
NETWORK
RIO Pane
NETWORK SW ITCH– 11B NETW ORKSWITCH– 12B
NETWORK SW ITCH– 13B C
AccSystem
rol
6T AC ACS
Reade r c um c o ntro ller
e
a Em e rge n cyCn Do o
r io
in
mm Pu s hBu tonoC EM L ock
VideoSurve illanceSyste m
6T AC Fix ed IP
Camera
Re vo lv in g IP
Camera
6TAC
FireAl arm Syste m
6T A
LocalF i re C
Al a rm Pa ne l
e
C Sm o ke ,He a t
n
cio
Po i nt/So und um
Fl a sh er
C M o du les MM CM
EFSL ine
D et e ct o r Vi a Mod
bus
Emergency CallSystem
Em egr e ncy Sp e ak er ph one w itho n e b u tto ns
Traffic Control System
it
ai
b
mC
Spee d L imi t
T
C Tun ne l L a ne
Varia bl e Sig ns
In fo .Pa n el
Lum ino us Tra fifc
Sig ns
Subsyste m/Th ird and S oftParty Syst em
6
A
Ven ti lati on Sys te m
Li gh itng/Po we rSu p p ly Sys tem
Fire Hyd rant Sy ste m
Tol lPl a za Sys tem /HTMS
A3PRNI TER
BCC
ITCS SCAD A Wor kst at ion
(MM I)
R edundant ITCS SCA DA
NETWORK SW ITCH- 02 A
NETWORK SW ITCH– 02B
EMERG SW ITCH
ENCY CALL SYSTEM BOARD-02
REDUNDANT EMERGENCY TELEPHONE SERVER
CCTVDa ta bas eSERVER
RECORDING SERVER
AID SERVER/ MODULES
PANEL for BCCng
REDUNDANT PLC PANEL (CPU-02)
SYSTEM
CAT6
ITCSS
CAT 6
CAT6
TCC
Server
CAT6
Mai
NE
FIRE Bu lidi
CAT 6
DEDICATEDSYNCRONIS ING LINKDEDICATED SYNCRONISIN G LINK
FiberRi ng-A
NETWORKSW ITCH– 14A
FiberRin g-B
NETW ORK SW ITCH– 1 2A NETW ORKSW ITCH–13A
FiberRi ng-BFiberRin g-B

CONSULTANCY SERVICES FOR PREPARATION OFFEASIBILITY REPORT, DPR PREPARATION, REPORT ONENVIRONMENTAL STUDIES AND OBTAINING MOEF
STUP Consultants Pvt. Ltd CLEARANCE AND BID PROCESS MANAGMENT FOR MUMBAI
COASTAL ROAD PROJECT
Note – Fixed cameras shall be installed inside the tunnel under ventilation slab at a height of 5 m –5.5 m
above the road level. The distance between individual cameras shall be about 50 m. All fixed cameras
inside tunnel shall be installed at the/close to centre of tunnel to monitor traffic lane of tunnel.
Purpose of having camera at centre shall not only able to view and detect the incidents but also
minimize the vehicle being occluded in the adjacent lanes. All cameras inside tunnel shall be installed
watching towards one direction to view carriage way, SOS box and lay bays surrounding areas.
One Fixed Camera on each side of tunnel at portal shall be installed to monitor traffic entering
tunnel. Also, one camera shall be installed on each side of tunnel entrance for Traffic count data
collection application. To detect different vehicles in view of vehicle classification, the detection
system shall be able to distinguish the gap between different vehicles. This condition implies that a
camera should be mounted at sufficient height 9m and under an angle of typically 45° with a lens
between 3 to 8 mm. System shall have feature to generate reports of Historical traffic data for further
analysis. Classification: recognize 5 distinct vehicle classes during daytime, based on length of
vehicles at day-time. 2 classes during night-time based on headlight position of upcoming traffic.
1. Redundant set of PLCs with CPU considered at TCC and BCC wherein primary PLC will be
installed with CPU at TCC and its Backup PLC with CPU will be installed in BCC.
Remote IO (RIO) will be provided in each cross passage, portal, Ventilation building and
roundabout.
PLC will be connected to RIOs using dual redundant communication with optical fibre cables.
Optical fiber cable path will be physically separate to ensure high availability of network from
2.
3.
4.
TCC, BCC to Tunnel T1 and T2
8.14.2 Video Surveillance System
8.14.2.1 System Overview
We are proposing Video Surveillance System with Automatic Incident Detection System. IP based
Fixed cameras with Video Incident Detection System inside both the tunnels are proposed. All these
cameras will connect through CAT6 on TCP/IP network which in turn connects to Video
Management System for live view and recording purpose. Proposed System provides server level
redundancy. The system has the capacity to store all the cameras for upto 24 hours. The Video
Management System has seamless integration with SCADA.
• PTZ Cameras
PTZ cameras shall be installed outside the tunnel on both ends which is north and south portals. It
shall be installed on 6 m pole at a distance of 60 m away from South and North Portals. Revolving
Cameras shall be used for monitoring traffic & surveillance, building surrounding etc at portals.8.14.2.2 Video Surveillance System Components
1. Fixed Cameras
We have proposed Fixed IP based 720p camera with varifocal lens (5-50mm) with Video
compression H.264 and resolution 1280 x 720 support 25 FPS Frame rate.
• Automatic Incident Detection (AID)
Automatic Incident Detection (AID) devices shall be installed at LV rooms at cross passages inside
tunnel and LV room in ventilation building. One AID device shall be associated per fixed camera.
Alternate AID associated with camera shall be connected with network switches Ring A & Ring B
respectively for example Camera# 1 associated AID#1 shall be connected with Ring A switch and
Camera# 2 associated with AID#2 shall be connected with Ring B switch and so on. These devices
shall be installed in 19‖ rack and the rack shall be mounted in respective location LV rooms.
AID device shall also provide hardwired output for interface with PLC-RIO digital input module
and with monitor module of Fire Detection for monitoring Heat alarm.
2. PTZ Cameras
PTZ camera is an IP based 1080p camera with Pan/Tilt/Zoom feature, Video compression H.264
and resolution 1920 x 1080 support 25 FPS Frame rate.
3. Traffic Counting System
Fixed IP based 720p camera with varifocal lens (5-50mm) with Video compression H.264 and
resolution 1280 x 720 support 25 FPS Frame rate.
4. Automatic Incident Detection
AID DEVICE is an IP based Automatic Incident detection (AID) device with feature of In-built
detection system. It captures streaming video from IP cameras, support H.264 video compression
and provides real-time streaming video over IP.
• Video Surveillance & Automatic Incident Detection Server application
Main Automatic Incident detection server shall be installed at south portal NOC and its redundant
AID server shall also installed at north portal NOC. Video surveillance database & Camera server
main & redundant shall be installed at Control Switch Room south portal.
Network Video Recording Servers shall be installed at south and north portal NOCs.
8.14.2.3 Equipment & System deployment locations
• Fixed Cameras
Detailed Project Report 137
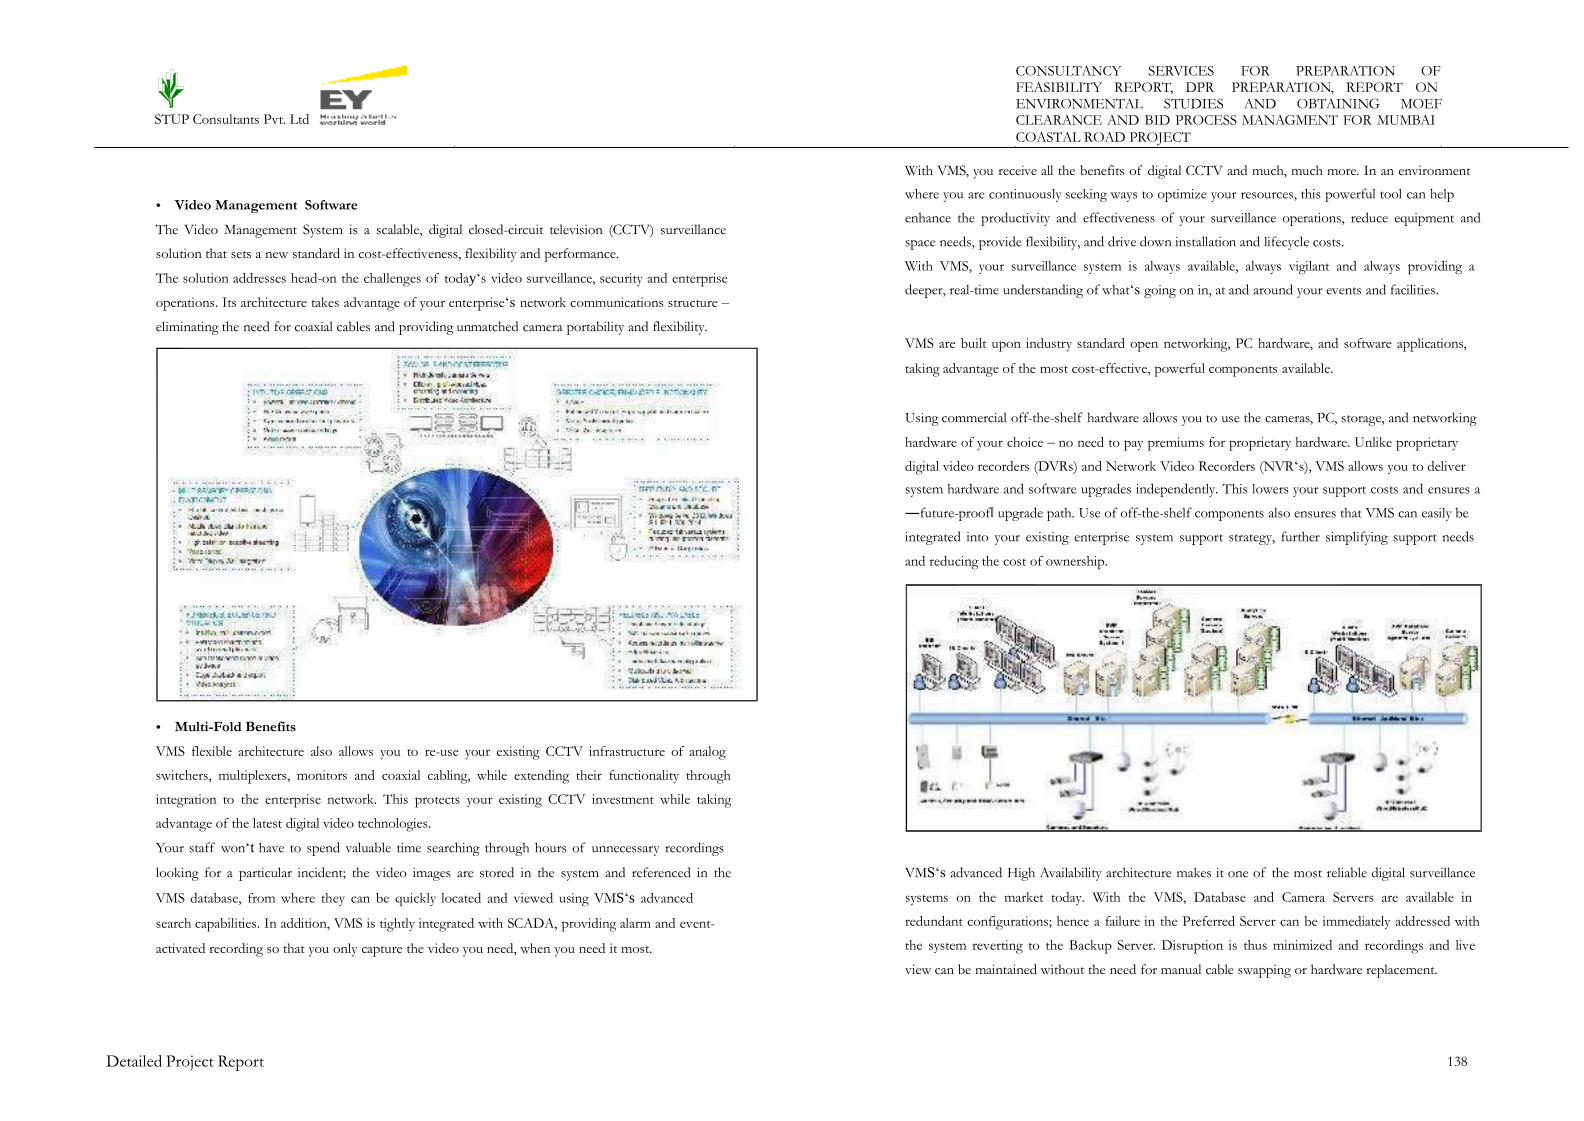
CONSULTANCY SERVICES FOR PREPARATION OFFEASIBILITY REPORT, DPR PREPARATION, REPORT ONENVIRONMENTAL STUDIES AND OBTAINING MOEF
STUP Consultants Pvt. Ltd CLEARANCE AND BID PROCESS MANAGMENT FOR MUMBAI
COASTAL ROAD PROJECT
With VMS, you receive all the benefits of digital CCTV and much, much more. In an environment
where you are continuously seeking ways to optimize your resources, this powerful tool can help
enhance the productivity and effectiveness of your surveillance operations, reduce equipment and
space needs, provide flexibility, and drive down installation and lifecycle costs.
With VMS, your surveillance system is always available, always vigilant and always providing a
deeper, real-time understanding of what‘s going on in, at and around your events and facilities.
• Video Management Software
The Video Management System is a scalable, digital closed-circuit television (CCTV) surveillance
solution that sets a new standard in cost-effectiveness, flexibility and performance.
The solution addresses head-on the challenges of today‘s video surveillance, security and enterprise
operations. Its architecture takes advantage of your enterprise‘s network communications structure –
eliminating the need for coaxial cables and providing unmatched camera portability and flexibility.VMS are built upon industry standard open networking, PC hardware, and software applications,
taking advantage of the most cost-effective, powerful components available.
Using commercial off-the-shelf hardware allows you to use the cameras, PC, storage, and networking
hardware of your choice – no need to pay premiums for proprietary hardware. Unlike proprietary
digital video recorders (DVRs) and Network Video Recorders (NVR‘s), VMS allows you to deliver
system hardware and software upgrades independently. This lowers your support costs and ensures a
―future-proof‖ upgrade path. Use of off-the-shelf components also ensures that VMS can easily be
integrated into your existing enterprise system support strategy, further simplifying support needs
and reducing the cost of ownership.
• Multi-Fold Benefits
VMS flexible architecture also allows you to re-use your existing CCTV infrastructure of analog
switchers, multiplexers, monitors and coaxial cabling, while extending their functionality through
integration to the enterprise network. This protects your existing CCTV investment while taking
advantage of the latest digital video technologies.
Your staff won‘t have to spend valuable time searching through hours of unnecessary recordings
looking for a particular incident; the video images are stored in the system and referenced in the
VMS database, from where they can be quickly located and viewed using VMS‘s advanced
search capabilities. In addition, VMS is tightly integrated with SCADA, providing alarm and event-
activated recording so that you only capture the video you need, when you need it most.
VMS‘s advanced High Availability architecture makes it one of the most reliable digital surveillance
systems on the market today. With the VMS, Database and Camera Servers are available in
redundant configurations; hence a failure in the Preferred Server can be immediately addressed with
the system reverting to the Backup Server. Disruption is thus minimized and recordings and live
view can be maintained without the need for manual cable swapping or hardware replacement.
Detailed Project Report 138

CONSULTANCY SERVICES FOR PREPARATION OFFEASIBILITY REPORT, DPR PREPARATION, REPORT ONENVIRONMENTAL STUDIES AND OBTAINING MOEF
STUP Consultants Pvt. Ltd CLEARANCE AND BID PROCESS MANAGMENT FOR MUMBAI
COASTAL ROAD PROJECT
• Intelligent Recording • Digitally Signed Recordings and Audit Trail (LOG)
The Video Management System helps incident investigation by recording not only the video after an
event trigger (post-event recording), but also what happened prior to the event (pre-event recording).
This provides a complete picture of the entire event, significantly enhancing investigations, evidence
and outcomes.
The Video Management should provide for the ability to export recordings (or segments of
recordings) into standard Windows Media files (MPEG4 format). Every exported recording is
digitally signed to provide authentication (of the origin of the recording) and integrity (prove that the
recording has not been tampered with).
The alternative to Digital Signatures is ―Watermarking‖, which is used by some digital videosystems.
Digital Signatures provides many inherent advantages over watermarking. A visible watermark may
obscure part of an image, whilst an invisible watermark can potentially introduce visual artifacts. In
either case, the original file is altered, which could reduce the evidential weight of the digital image.
Digital Signatures, on the other hand, do not alter the original files, ensuring that there is no loss of
evidential weight.
VMS should also provide a complete audit trail (log) of all operator actions and system events. This
audit trail provides you with a record of all changes made to the VMS configuration, as well as when
and who controlled cameras, viewed cameras, initiated and viewed recordings. It also documents
VMS‘s condition at the time of the recording. As with the exported recordings, the exported
audit
logs are also digitally signed.
The audit trail can be exported when exporting a recording, and then saved with the recording.
When used in conjunction with site chain-of-custody processes and procedures, digital signatures
and the audit trail greatly enhance the evidentiary weight of a recording in a legal proceeding.
We have proposed unified storage for 1 day storage for all cameras at 4CIF resolution and 25fps.
The storage will be installed at south and north portal NOCs.
• Video Management System provides multiple options for recording video:
i. Alarm/Event-activated Recordings: Integration with SCADA enables activation of a
recording when an alarm or event occurs. Your SCADA system determines when
recordings should be made on any camera, with video prior to the alarm or event also
captured using the pre-record feature.
Video Analytics Recordings: Video is recorded when VMS detects motion or receives
notification from the video analytics subsystem of an event of interest. Again, video prior
to the event can also be stored with the recording using the pre-record feature.
Camera Tamper Recordings: Video is recorded when VMS detects potential tampering on
a camera. Video prior to the event can also be stored with the recording using the pre-
record feature – since the tamper event may result in unusable video, the pre-event record
feature may be very useful in providing evidence of the actual tampering.
Device Input/ Output Recordings: Video is recorded when an input device connected to
an IP camera or video encoder is triggered or an output is activated on configured devices.
Video prior to the event can also be stored with the recording using the pre-record
feature.
Operator-initiated Recordings: These recordings are initiated by an operator during
viewing of the camera. An operator, who has noticed an incident, simply clicks the record
button to record the video. Video prior to the record button being pressed is also stored
in the recording using the pre-record feature. Manual recordings can either run for a pre-
determined length of time or can be terminated by the operator.
Scheduled Recordings: Recordings are scheduled on particular cameras at specified times.
Each camera has its own schedule, which can be configured for any time in the future. Re-
current (repeated) scheduling is also provided on a daily, weekly and monthly basis.
Continuous Background Recordings: Video and audio if applicable can be continuously
recorded on any camera at configurable frame rates without the need to enable complex
schedules. This type of recording is resilient to network communication errors between
the Camera and Database Server.
ii.
iii.
iv.
v. • Video Incident Detection System
AID System software is an intelligent software platform for use with an Incident video detection
system. AID System software collects traffic data, events, alarms and video images generated by the
video detectors. The main goal of AID System software is to manage and control all traffic
information generated by these various detectors and to make it useful, meaningful and relevant to
the user. Communication with the video detection system goes over Ethernet. AID System software
stores all traffic data, events and alarms in a relational database.
AID System software provides a user-friendly interface composed of a monitoring and a reporting
application. AID System software enables real-time monitoring of events and alarms. All event info
is automatically documented and visualized in a straightforward way, allowing managing each traffic
situation efficiently.
vi.
vii.
Detailed Project Report 139
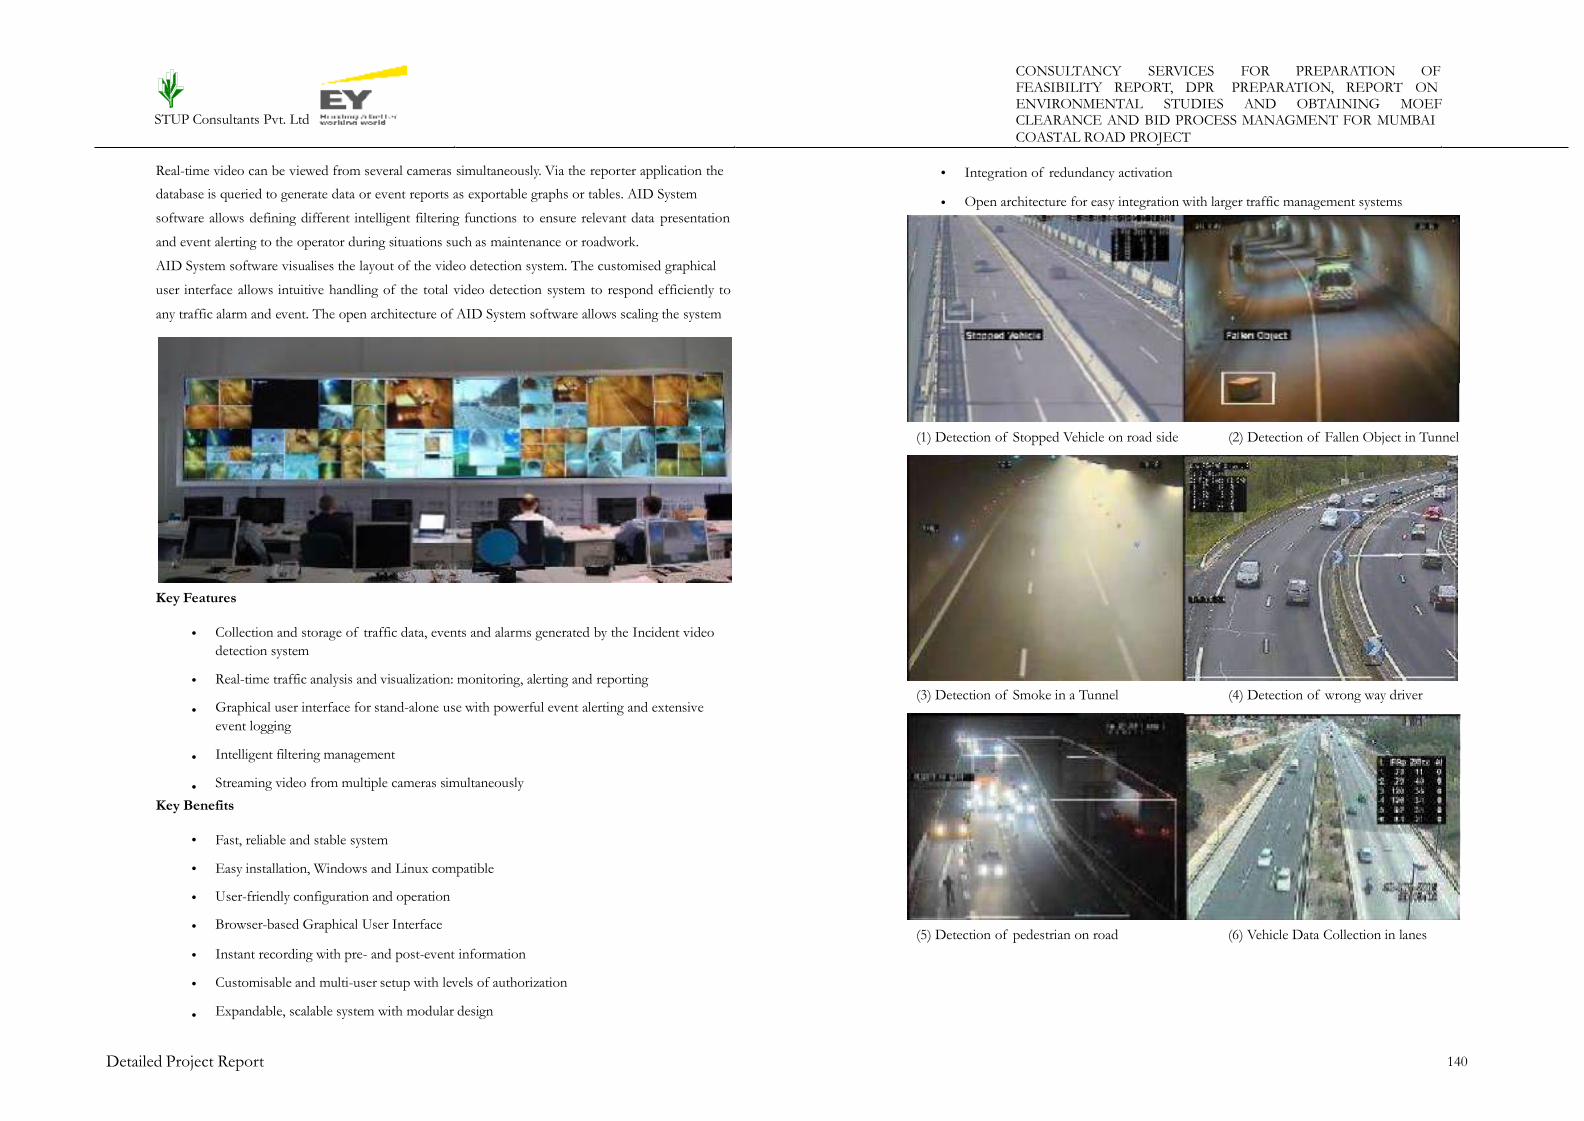
CONSULTANCY SERVICES FOR PREPARATION OFFEASIBILITY REPORT, DPR PREPARATION, REPORT ONENVIRONMENTAL STUDIES AND OBTAINING MOEF
STUP Consultants Pvt. Ltd CLEARANCE AND BID PROCESS MANAGMENT FOR MUMBAI
COASTAL ROAD PROJECT
Real-time video can be viewed from several cameras simultaneously. Via the reporter application the
database is queried to generate data or event reports as exportable graphs or tables. AID System
software allows defining different intelligent filtering functions to ensure relevant data presentation
and event alerting to the operator during situations such as maintenance or roadwork.
AID System software visualises the layout of the video detection system. The customised graphical
user interface allows intuitive handling of the total video detection system to respond efficiently to
any traffic alarm and event. The open architecture of AID System software allows scaling the system
• Integration of redundancy activation
Open architecture for easy integration with larger traffic management systems•
(1) Detection of Stopped Vehicle on road side (2) Detection of Fallen Object in Tunnel
Key Features
• Collection and storage of traffic data, events and alarms generated by the Incident video
detection system
Real-time traffic analysis and visualization: monitoring, alerting and reporting
Graphical user interface for stand-alone use with powerful event alerting and extensive
event logging
Intelligent filtering management
Streaming video from multiple cameras simultaneously
•(3) Detection of Smoke in a Tunnel (4) Detection of wrong way driver
•
•
•
Key Benefits
•
•
•
•
•
•
Fast, reliable and stable system
Easy installation, Windows and Linux compatible
User-friendly configuration and operation
Browser-based Graphical User Interface
Instant recording with pre- and post-event information
Customisable and multi-user setup with levels of authorization
Expandable, scalable system with modular design
(5) Detection of pedestrian on road (6) Vehicle Data Collection in lanes
•
Detailed Project Report 140

CONSULTANCY SERVICES FOR PREPARATION OFFEASIBILITY REPORT, DPR PREPARATION, REPORT ONENVIRONMENTAL STUDIES AND OBTAINING MOEF
STUP Consultants Pvt. Ltd CLEARANCE AND BID PROCESS MANAGMENT FOR MUMBAI
COASTAL ROAD PROJECT
Detection Performance for Coastal Tunnel Project
Below is an indication on the detection reliability that can be expected for the various algorithms in
different circumstances. This data is based on both internal performance tests and field experience
based on over 500 tunnels worldwide. This data assumes;
•
•
•
•
Incidents occurring in the field of view of thecamera
Normal weather conditions
No occlusion
Constant lighting levelNote that camera position (height, position in the road, angle), configuration of the detection zones
and camera specifications can affect detection performance. These performance specifications are
valid for a detection range up to 15 times the camera mounting height except when indicated
differently in table below.
Smoke detection is based on a deteriorating image quality. There is a predefined detection area over
the camera image. This area is divided into a cell matrix. Each cell functions as a smoke zone.
• Aid System Software System Architecture
AID device is a multi-functional Video Image Processing module for traffic control. AID device
provides automatic incident detection, data collection and digital recording of incident video
sequences. AID device works with networked video and -displays.
• Automatic Incident Detection (AID)
AID DEVICE is an IP based Automatic Incident detection (AID) device with feature of In-built
detection system. It captures streaming video from IP cameras, support H.264 video compression
and provides real-time streaming video over IP.
AID shall have a high detection rate, a short time to detect, fast incident verification and a low false
alarm rate. It performs below mentioned Traffic and Non Traffic incidents detection;
Traffic Incidents are as follows;
•
•
•
Stopped Vehicle
Wrong Direction
Speed dropIrrespective of technologies being used, Video Analytics has inherent limitation on the accuracy of
detection of incidences and is highly dependent on site conditions; hence our proposal incorporates
the requested technology without any assurances as to the performance or fitness for purpose of the
video analytics for the applications specified.
Non Traffic Incidents are as follows;
•
•
•
Smoke detection
Pedestrians
Fallen object
Detailed Project Report 141
Event Detection Rate
In %
False Alarm Rate
Per Camera /Day
Time to Detect
In Sec
Stopped Vehicle >98 0.05 12
Vehicle Queue >98 0.025 10
Wrong Way Driver >95 0.025 10
Smoke >99 0.025 10
Pedestrian >90 0.05 10
Fallen Object >90 0.05 20
Under speed >90 0.15 10
Over speed >90 0.15 10

CONSULTANCY SERVICES FOR PREPARATION OFFEASIBILITY REPORT, DPR PREPARATION, REPORT ONENVIRONMENTAL STUDIES AND OBTAINING MOEF
STUP Consultants Pvt. Ltd CLEARANCE AND BID PROCESS MANAGMENT FOR MUMBAI
COASTAL ROAD PROJECT
Video Surveillance System Architecture networked control panels. The panel shall have the ability to measure the sensitivity of each sensor
and to determine its status: alarm, pre-alarm, normal and trouble.
• Multi Criteria Intelligent Smoke Detector
The smoke detector shall be intelligent, addressable, multi-sensing, low-profile detector. The multi
criteria detector shall be capable of immunity to false alarms. Unlike traditional intelligent detectors,
the Multisensor detector has a microprocessor in the detector head that processes alarm data. The
multi criteria detector shall be capable of adjusting its sensitivity automatically, without needing
operator intervention or control panel programming. As these are multi criteria devices, they shall
have the capability of smoke as well as heat detection. It shall have both rate of rise as well as fixed
temperature sensors. These detectors are proposed for the NOC building. The detectors shall have a
state-of-the-art thermistor sensing circuit for fast response. These detectors shall provide open area
protection with 50 foot spacing capability.
The intelligent smoke detectors shall be capable of providing two-way communication with the fire
alarm systems. The fire alarm panel loop controller shall have communication protocol containing
both digital and analog signals that allow each sensor to communicate its individual address, sensor
type and an analog value.
mer a
• Addressable Manual Call Point
MCP shall have an addressable interface compatible with the intelligent control panels. Because the
MCP is addressable, the control panel can display the exact location of the activated manual station.
This leads fire personnel quickly to the location of the alarm.8.14.3 Fire Alarm System
• Isolator Module
This may be a part of the smoke detector, however separate fault isolator modules may also be
provided. The fault isolator module shall be used with fire alarm panel SLC‘s to protect the system
against wire-to-wire short circuits. The fault isolator modules shall be spaced between groups of
sensors in a loop to protect the rest of the loop. It is used to isolate short circuit problems within a
section of a loop so that other sections can continue to operate normally. It includes yellow LED
indicator that pulses when normal and illuminates steady when a short is detected. If a short occurs
between any two isolators, then both isolators immediately switch to an open circuit state and isolate
the groups of sensors between them. The remaining units on the loop continue to fully operate.
8.14.3.1 Fire Alarm System Components
• Fire Alarm Panel
Fire emergency detection and evacuation are extremely critical to life safety; therefore intelligent fire
alarm control panel designed for medium- to large-scale facilities shall be used in this project. The
fire alarm control panel shall be of modular design that is configured per project requirements. It
shall have one to ten Signaling Line Circuits (SLCs), to support up to 3,000 intelligent addressable
devices.
Information is critical to fire evacuation personnel, and hence the panel shall have large 640-
character Liquid Crystal Display (LCD) capable of presenting vital information to operators
concerning a fire situation, fire progression, and evacuation details. The panels shall have the ability
to communicate directly with one another, enabling peer to- peer communication between
• Monitor Module
This may be a part of the smoke detector, however separate monitor modules may also be provided.
Monitor modules supervise a circuit of dry-contact input device. Each Monitor Module uses one of
the available module addresses on an SLC loop. It responds to regular polls from the fire alarm panel
Detailed Project Report 142
6CAT
PTZCaFiber Ring-A
SYSTEM ARCH ITECTURE FOR VIDEO SURVEIL LANCE CONTROL SY STEMTCC BUI LDING BCC B UILDING
CAT6 CAT6
CCTV DB Ser ve r CCT V DB
S e rve r
R ec ord in g Serve r ITCS SC AD A/ VSS/ A ID I TCSSCA D A/ VSS/ AI D Re co rd in g Serv
er
W orks tat ion (M MI ) W orks tat ion (M MI)
DVA Se rve r DVAServe r
Main I TCS SC AD A Server Redun dant ITC SSCA DA Server
ViaCAT6
Fiber Ring-A Fiber Ring-A
AI D M od ule sCAT 6 Fiber Ring-B Fiber Ring-B
AID Modu les
Aut omat ic Inc ident
Det ect ion (A ID) Ser ver Aut omat ic Inc ident Det ect ion
(AID ) Red undant Ser ver
Fiber Ring-B Fiber Ring-A
Fiber Ring-A Fiber Ring-B
Fiber Ring-A
Fiber Ring-A
PTZCamer a F iber Ring-B CR-02
CR-01 Fiber Ring-B Fiber Ring-B
Via CA T6 Via CAT6ViaCAT 6 V ai CAT 6

CONSULTANCY SERVICES FOR PREPARATION OFFEASIBILITY REPORT, DPR PREPARATION, REPORT ONENVIRONMENTAL STUDIES AND OBTAINING MOEF
STUP Consultants Pvt. Ltd CLEARANCE AND BID PROCESS MANAGMENT FOR MUMBAI
COASTAL ROAD PROJECT
and reports its type and the status (open/normal/short) of its Initiating Device Circuit (IDC). A
flashing LED indicates that the module is in communication with the control panel. The LED
latches steady on alarm. Below are the deployment locations
and the fiber is a relatively inert and dielectric (non-conducting) medium, it is a safe technology to
use in hazardous environments.
•
•
•
•
Break Glass at CP inside Tunnel
Fire Extinguisher – 2 Nos inside SOS Box
For LHS fire Zones
Admin Building at portal
• Control Relay Module
This may be a part of the smoke detector, however separate control modules may also be provided.
Addressable control module provides intelligent fire alarm panel a circuit for notification appliances
(horns, strobes, etc.). Addressability allows the control relay module to be activated, either manually
or through panel programming, on a select (zone or area of coverage) basis. This may be
programmed to operate dry contacts for applications. Below are the deployment locations
The linear heat device shall be a 19‖ rack-mounted model, or in secure IP66 outdoor housings. It
shall have up to 2/4 channels per device, so that monitoring of 2 loops redundantly with one device
is possible at lower costs. It shall have a crystal-clear alphanumeric display screen showing the
current status information. It shall have sufficient internal relays in a single device, so that there is no
need for an external relay extension.
The linear heat detection system shall be capable of the following activities:
•
•
Control Module for PLC at CP inside tunnel
Control Module for Hooter at CP inside tunnel
• Warning Light and Warning Horn (Sounder/Flasher)
This may be a part of the smoke detector, however separate sounder/ flasher may also be provided.
Addressable indicating equipment with sounder & flasher shall get activated/sounded and will be
clearly recognizable as danger signal in case of any detected fire event. They shall be externally
powered. It shall be mounted on the wall outside LV room and in the local control centre.• Detect different fires in sufficient time with precise indication of the fire location without
being influenced by high speed air currents.
Provide functional integrity over widely extended period of time.
Enable heat spread and size assessment at the scene of accident to activate and supervise e.g.
evacuation / ventilation /suppression system adaptively.
Give vital information‘s to the fire fighting forces and to control the success of
countermeasures
•
•
• Fire Alarm System Proposed for Coastal Road Tunnel Project
FAS proposed at the site will have multi-criteria detectors including photo, smoke, heat etc placed
strategically in LV rooms, and NOCs. It will also be connected to the SCADA software which can
graphically represent the placement of detectors and pop up alarms as and when raised. •
• Fiber Optic Linear Heat Detection SystemSystem Sensor Cable
The system sensor cable shall have the following characteristics;The LHS SYSTEM is a linear heat detection system specifically designed for fire protection
applications. It is able to measure temperature profiles at thousands of points simultaneously along a
sensor cable which may be up to 6 km in length. In fire prevention, the LHS SYSTEM is able to
determine not only the current position but also the progression of the fire by measuring the
temperature along the sensor cable in real time.
Optical fiber offers several important advantages as a sensing medium. Signals are immune to
electromagnetic interference thereby ensuring integrity of readings from electrically noisy areas, for
example around power cables and transformers. As no electric current is used in the sensing fiber
•
•
•
•
•
•
•
Sensor Cable - Steel FRNC (m)
Loose Steel Tube Design / Steel Armored
Flame Retardant Non Corrosive Jacket
2 x MM GI 50/125 µm Fibers
3,8 mm Diameter / 25 kg/km
Crush Resistance 960 N/cm
Tensile Strength 1.100 N
Detailed Project Report 143

CONSULTANCY SERVICES FOR PREPARATION OFFEASIBILITY REPORT, DPR PREPARATION, REPORT ONENVIRONMENTAL STUDIES AND OBTAINING MOEF
STUP Consultants Pvt. Ltd CLEARANCE AND BID PROCESS MANAGMENT FOR MUMBAI
COASTAL ROAD PROJECT
8.14.3.2 LHS System Architecture
Specifications
Description
Fire alarm panel shall be installed in admin buildings of South portal & north portal respectively.
Local fire alarm panels shall be installed inside the tunnel in LV control rooms of cross passages
strategically placed at approximately a distance of 1 km from each other and in turn will be
connected with main fire alarm panels over its own optical fibre network. Typical loop diagram is
shown above where all addressable devices will be connected over class A wiring i.e. loop in and
loop out.
Integration with SCADA system over Ethernet shall be enabled.
Linear heat sensing system comprising of evaluation unit which shall be installed inside the tunnel in
LV control room no. 1, 7,16. Optical linear heat sensing cable shall be connected with respective
evaluation unit. Zone alarms will be raised by evaluation unit which will be communicated to
SCADA system.
Monitor module shall be connected to limit switch for monitor fire extinguisher status in SOS boxes.
Monitor module with dual input shall be also being used to monitor AID devices, linear heat
detection zones. Control modules shall be used to interlock with escape exit door, Evacuative
broadcasting system for global announcements at south & north portals.
•
•
•
•
•
•
•
•
•
•
•
•
•
Range - 6 Km
Operating temperature range: -10 to +60°C
Power supply: 10 to 30 V DC
Power consumption: 15 W typically
Number of measurement channels: 1, 2
Integrated Relay Borad:
4 x Opto-Coupled Reset Inputs
Potential Free Outputs
1 x System Error Output
43 x Configurable Alarm Outputs
256 free definable zones per channel
USB / Ethernet /RS232 interface, RS422 /485 external
19‖ inch rack, 2HU
8.14.4 Access Control System
8.14.4.1 System Overview
Access Control System (ACS) is an integrated solution that consists of hardware and software
designed to control entry into selected areas and manage movement within. The system is designed
to increase security by defining access permissions based on area and time for each user and
maintaining a log of all events.
ACS is used to adjust all parameters of the system, control hardware, display events related to
movement of users, alarms, and operation of hardware devices. The software is also used for storing
all events in the database and generating reports based on requirements defined by an operator.
Sensors shall be executed in the form of contact switches. An entry permit shall be realized by
individual chip cards.
8.14.4.2 Access Control System Components
1) Reader with built-in controller for single door. IP based smart card readers for the access
control inside tunnel at LV room doors, Admin Building, Ventilation Buildings. HID readers with a
powerful built in controller so there is only one device to install and connected with network.
Detailed Project Report 144
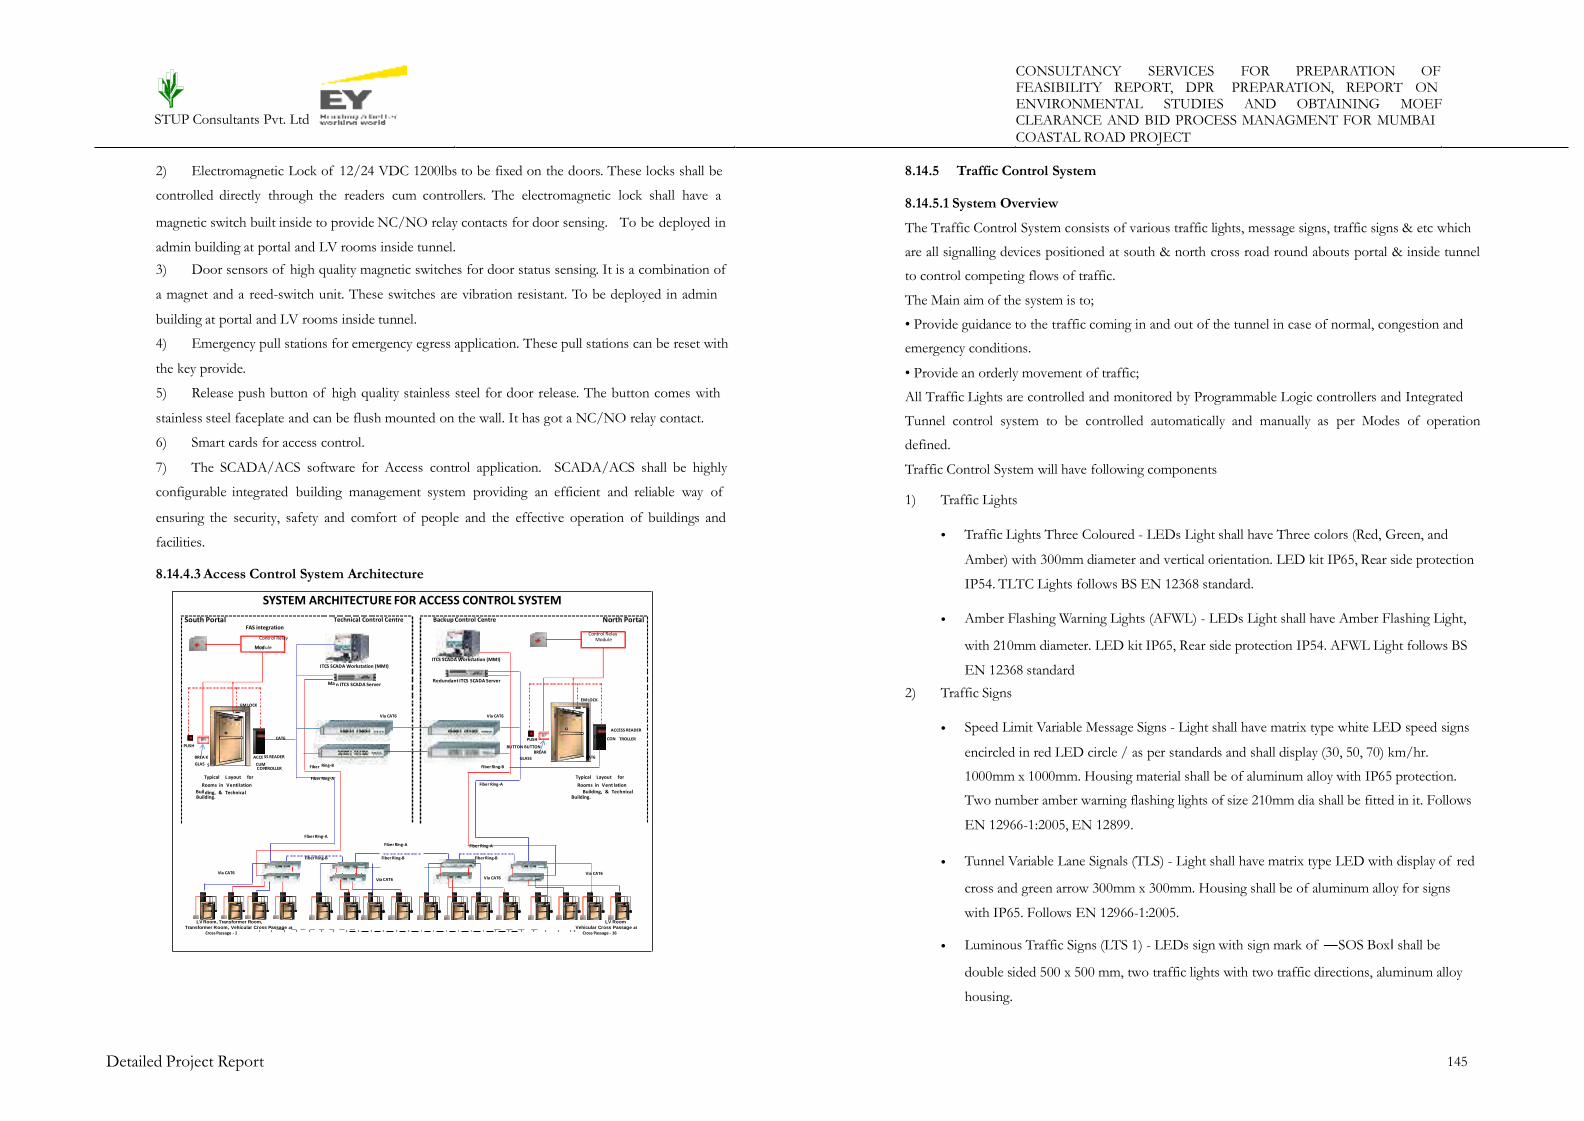
CONSULTANCY SERVICES FOR PREPARATION OFFEASIBILITY REPORT, DPR PREPARATION, REPORT ONENVIRONMENTAL STUDIES AND OBTAINING MOEF
STUP Consultants Pvt. Ltd CLEARANCE AND BID PROCESS MANAGMENT FOR MUMBAI
COASTAL ROAD PROJECT
2) Electromagnetic Lock of 12/24 VDC 1200lbs to be fixed on the doors. These locks shall be 8.14.5 Traffic Control System
controlled directly through the readers cum controllers. The electromagnetic lock shall have a
magnetic switch built inside to provide NC/NO relay contacts for door sensing. To be deployed in
admin building at portal and LV rooms inside tunnel.
8.14.5.1 System Overview
The Traffic Control System consists of various traffic lights, message signs, traffic signs & etc which
are all signalling devices positioned at south & north cross road round abouts portal & inside tunnel
to control competing flows of traffic.
The Main aim of the system is to;
• Provide guidance to the traffic coming in and out of the tunnel in case of normal, congestion and
emergency conditions.
• Provide an orderly movement of traffic;
All Traffic Lights are controlled and monitored by Programmable Logic controllers and Integrated
Tunnel control system to be controlled automatically and manually as per Modes of operation
defined.
Traffic Control System will have following components
3) Door sensors of high quality magnetic switches for door status sensing. It is a combination of
a magnet and a reed-switch unit. These switches are vibration resistant. To be deployed in admin
building at portal and LV rooms inside tunnel.
4) Emergency pull stations for emergency egress application. These pull stations can be reset with
the key provide.
5) Release push button of high quality stainless steel for door release. The button comes with
stainless steel faceplate and can be flush mounted on the wall. It has got a NC/NO relay contact.
6)
7)
Smart cards for access control.
The SCADA/ACS software for Access control application. SCADA/ACS shall be highly
configurable integrated building management system providing an efficient and reliable way of
ensuring the security, safety and comfort of people and the effective operation of buildings and
facilities.
1) Traffic Lights
• Traffic Lights Three Coloured - LEDs Light shall have Three colors (Red, Green, and
Amber) with 300mm diameter and vertical orientation. LED kit IP65, Rear side protection
IP54. TLTC Lights follows BS EN 12368 standard.8.14.4.3 Access Control System Architecture
• Amber Flashing Warning Lights (AFWL) - LEDs Light shall have Amber Flashing Light,
with 210mm diameter. LED kit IP65, Rear side protection IP54. AFWL Light follows BS
EN 12368 standard
Mod
n ITCS SCADA Server
2) Traffic Signs
• Speed Limit Variable Message Signs - Light shall have matrix type white LED speed signs
encircled in red LED circle / as per standards and shall display (30, 50, 70) km/hr.
1000mm x 1000mm. Housing material shall be of aluminum alloy with IP65 protection.
Two number amber warning flashing lights of size 210mm dia shall be fitted in it. Follows
EN 12966-1:2005, EN 12899.
TROLLER
GLAS
Buil hnical
• Tunnel Variable Lane Signals (TLS) - Light shall have matrix type LED with display of red
cross and green arrow 300mm x 300mm. Housing shall be of aluminum alloy for signs
with IP65. Follows EN 12966-1:2005.
• Luminous Traffic Signs (LTS 1) - LEDs sign with sign mark of ―SOS Box‖ shall be
double sided 500 x 500 mm, two traffic lights with two traffic directions, aluminum alloy
housing.
Detailed Project Report 145
a CAT6Vi
PUSH CON
Fiber Ring-B
Building, & Tec
Via CAT6
Mod
S CUM
ding, & Technical
ule
Ma
Ring-BFiber
SYSTEM ARCHITECTURE FOR ACCESS CONTROL SYSTEM
South Portal Technical Control Centre Backup Control Centre North PortalFAS integration
Control RelayControl Relay Module
ITCS SCADA Workstation (MMI)
ITCS SCADA Workstation (MMI)
Redundant ITCS SCADA Server
EMLOCK EM LOCK
Via CAT6 Via CAT6
ACCESS READER
CAT6 CUM
PUSH BUTTON BUTTONBREAK
BREA K ACCE SS READER GLASS CAT6
CONTROLLER
Typical L ayout for Fiber Ring-A Typical Layout for
Rooms in Ventilation Fiber Ring-A Rooms in Vent lation
Building. Building.
Fiber Ring-A
Fiber Ring-A Fiber Ring-A
Fiber Ring-B Fiber Ring-B Fiber Ring-B
Via CAT6 Via CAT6
LV Room, Transformer Room, LV Room
Transformer Room, Vehicular Cross Passage at Vehicular Cross Passage atCross Passage - 1 Cross Passage - 16

CONSULTANCY SERVICES FOR PREPARATION OFFEASIBILITY REPORT, DPR PREPARATION, REPORT ONENVIRONMENTAL STUDIES AND OBTAINING MOEF
STUP Consultants Pvt. Ltd CLEARANCE AND BID PROCESS MANAGMENT FOR MUMBAI
COASTAL ROAD PROJECT
• Luminous Traffic Signs (LTS 2) - LEDs sign shall sign mark of ―Escape Exit‖ bedouble
sided 500 x 500 mm, aluminum alloy housing.
• Type B - Switch Vehicle Lights On with standard font as per NHAI guidelines. It shall be
pasted on galvanized sheet.
• Luminous Traffic Signs (LTS 3 & 4) - LEDs sign shall sign mark of ―Escape Exit with
direction‖ 50 m right & left arrow, 100 m right & left arrow, 150 m right & left arrow be
single sided 500 x 700 mm, aluminum alloy housing.
Information Panels
• Type C - Switch Vehicle Lights Off with standard font as per NHAI guidelines. It shall be
pasted on galvanized sheet.
• Type D - Limits Cancelled Overtaking prohibited with standard font as per NHAI
guidelines. It shall be pasted on galvanized sheet.3)
• Dynamic Road Information Panel (DRIP )/ Variable Message Sign Board - DRIP Cabinet
size shall be 4000 mm (W) X 2000mm (H), Full Matrix, LED Display Area 3800mm (W)
X 1800mm (H) with pixel pitch of 25mm and the resolution of 152 (W) x 72 (H),
Enclosed in Hot Dipped Galvanised (GPSP Alloy)
• Information Plate (Tunnel Name Plate) - Tunnel Length and Tunnel Name shall be
mentioned with reflective sign on aluminum alloy sheet size 2m x 1.5m.
• Information Traffic Sign (Radio Broadcast Frequency) - Transmitted broadcasting station
frequency and name shall be mentioned with reflective foil on aluminum alloy sheet.• Entrance Variable Message Signs (EVS) - Light shall have Matrix Type LED Green
Arrow, Red Cross, Crossover Yellow Arrow, Traffic Prohibited. 960mm x 960mm.
Housing shall be of Aluminum Alloy with IP65 protection. Follows EN 12966-1:2005,
standard
• Lay-bays Ahead - Lay-bays ahead shall be mentioned with reflective foil on aluminum
alloy sheet.
• Fire Fighting Niche - Fire Fighting Niche sign as per mentioned in the concession
agreement drawing.• Entrance Detection Control System (EDCS):
8.14.5.2 Equipment & System deployment locations• Entrance Height Excessive Vehicle Control System (EHD) - It shall be based on a light
barrier detection principle. It shall have a Set of IR Beam Transmitter and Receiver.
Transmitter shall be mounted at certain height on pole on one side of road and Receiver
shall be mounted at equal height on the other side of the road on pole. In addition to it
Magnetic Vehicle Loop Detector shall be installed under the road to detect vehicle
physically available at particular area.
1. The Traffic Lights Three Coloured shall be used for closing the tunnel traffic. The amber light
of the TLTC shall serve also as flashing warning signal in exceptional traffic situations. Inside Main
tunnel TLTC Lights shall be installed 2.5 mtrs above floor level towards emergency sidewalk at every
500 meter gap. Lights shall guide the road users to act as per traffic situations inside tunnel.
2. Dynamic Road Information Panels (DRIP)/ Variable Message Sign Board shall be installed
near the entrance to provide necessary textual information to road users to take appropriate action
accordingly.
4) Barriers
• Mechanical Barrier - Electromechanical Barrier shall be provided with Boom length of 5
mtrs with IP64 protection. Boom barrier shall be connected to PLC to operate in auto
mode as well in manual mode to restrict the entry of vehicles into tunnel.
3. Speed Limit Variable Message Signs (SL) with AFWL shall be installed inside the tunnel at
every 600 meter gap to guide the road users to drive the vehicle at desired speed limits. Outside
tunnel SLs shall be installed before tunnel entrance and SLs with entryway prohibited shall be
installed at the cross road location to restrict the vehicle entry inside the tunnel route.• Rigid Height Barrier - Rigid Height Barrier shall be of galvanized material with height of
5mtrs and shall be gantry type to physically restrict entry of over height vehicles to tunnel. 4. Entrance Variable Message Signs (EVS) with entryway prohibited" symbols shall support a
tunnel closing, regular traffic operation and make possible automatic redirection of the tunnel traffic.
The EVS shall be located on outside entrance road gantries of a bridge type near the tunnel portals
above centres of traffic lanes.
5) Reflective signs
• Type A - Overtaking prohibited with standard font as per NHAI guidelines. It shall be
pasted on galvanized sheet.
Detailed Project Report 146

CONSULTANCY SERVICES FOR PREPARATION OFFEASIBILITY REPORT, DPR PREPARATION, REPORT ONENVIRONMENTAL STUDIES AND OBTAINING MOEF
STUP Consultants Pvt. Ltd CLEARANCE AND BID PROCESS MANAGMENT FOR MUMBAI
COASTAL ROAD PROJECT
5. Tunnel Variable Lane Signals (TLS) shall be installed inside the tunnel at every 430 meter gap
above the middle of the traffic lanes.
6. Amber Flashing Warning Lights (AFWL) of the Traffic Control System shall serve as flashing
warning signal in exceptional traffic situation like a vehicle breakdown, etc and shall be installed on
SOS box and with Speed Limit Variable Signs (SL‘s).F ib e rR in g -A
7. Entrance Detection Control System (EDCS) - Entrance Height Excessive Vehicle Control
System (EHD) – IR beam transmitter and receiver shall be mounted on pole. In addition, Induction
loop cables shall be installed inside road to check physical availability of vehicle on road.
8. Mechanical barriers shall be assigned to support closing of the tunnel for traffic. Barrier shall
be installed at every 500 meter gap near ECP/VCP to restrict vehicles to enter inside tunnel in case
of emergency.
o
n
9. Rigid Height barriers shall be installed on outside entrance road gantries located in front of
tunnel portals, together with TLTC, EVS‘s and TCS.
10. Luminous Traffic Signs shall be installed inside tunnel and mounted on one side tunnel wall to
guide the road users in case of emergency condition.
11. Standing reflective traffic signs (―Overtaking Prohibition‖, ―Switch Vehicle Lights On‖,
―Switch Vehicle Lights Off‖, ―Limits Cancelled‖, Transmitted Broadcasting Station Frequencyand
Name and Tunnel Name Plate, Fire fighting niche) shall be located by standard regulations on
outside public lighting poles. Standing reflective traffic signs marking ECP/VCP ahead shall be
installed in the tunnel tube in distance of 100 m in front of appropriate ECP/VCP. The distance
shall be marked on the signs with descriptive number of individual ECP/VCP.
8.14.6 Emergency Call Box and PA Communication System for Tunnel
8.14.6.1 System Overview
The emergency call system consists of an emergency switch board on the workplace o operators and
SOS boxes situated in front of the tunnel tube at both portals (one no. at each portal) and inside the
tunnel tube installed at every 250m spacing on both sides of main tunnel. The main purpose of the
system is to assure verbal communication in between operator and a traffic participant for
announcement and explanation/clarification of the appropriate emergency situation. The entry of
any person to some SOS box shall activate telephonic communication with using emergency speaker
phone and an amber warning flashing light above the SOS box, which is signalling some traffic
problem. All the emergency calls shall be recorded and archived for the time of one month (30 days).
12. Information Sign with VMS - Information signs with VMS shall be installed at the entrance at
cross road.
8.14.5.3 System Architecture of Traffic Control System
8.14.6.2 System Components
1) SOS Box
The SOS boxes are sound-tight cabinets, made from stainless steel with degree of protection IP 65.
SOS boxes shall be installed inside the main tunnel in emergency call niches located 250 m on
Emergency lane side of main tunnel. SOS box cabinet shall have Emergency speakerphone, One
Detailed Project Report 147
SL TL S
T LT C
AF WL
t
C
n
le a
o ca
m
C
AF W L
F ib e r R in g- A
6TC
6
A le TC S b a C
n
E V S it aac
in
u m
o C
C
it
m
Port al( Typ ical)
B AR R IER
b
VM S n
n
h Port al (Typical)Nort
SYSTEM ARCHITECTURE FOR TRAFFIC CONTROL SYSTEM
South Portal N orth Portal
Main ITCS SCAD A Ser ve r R edundant ITCS SCA DA Server
Fibe rR ing -A
Fibe r Ri n g-B
IT CS S CA DA Wo rk sta tio n IT C S S C ADA Wo rk s tat io n
F ib e r R in g- A
Fib e r R in g -B F ib er R in g -B F ibe r R in g -A
F ib er R in g -B F ib er R in g -B
P LC /R IO C AT 6 CA T6P LC /R IO P L C/ R IO
T P LC /R I O
Cle b b
a C T LS n no ti
i
A i u u
S L m m mT LT C
le m o o
a C T LT C
o TL TC (A)iac
u
S L m
D R IP
E HD
N ear Ro und Cros s road Typical Co nnec tion On Cros s Typ ical Conn ect ion On Cr os s
L oc ation N ear Sout h & Sout h& N ort h
Pass age P as s age

CONSULTANCY SERVICES FOR PREPARATION OFFEASIBILITY REPORT, DPR PREPARATION, REPORT ONENVIRONMENTAL STUDIES AND OBTAINING MOEF
STUP Consultants Pvt. Ltd CLEARANCE AND BID PROCESS MANAGMENT FOR MUMBAI
COASTAL ROAD PROJECT
emergency push-button (for call of help for drivers with immobile car, health trouble and by an ECS shall serve as the software for implementing the same. The workstation shall also host the
Open protocol for integration to transfer alarm which shall be used to transfer alarm and event
messages from ECS System to the ITCS System over the IP network.
The state of art Emergency communication system for roadways is designed to meet the
communication & safety requirements for roads. System cabling is designed on redundant IP
backbone to make system availability 100 % in all situations. System is built with following elements
to meet the requirement,
accident) and two manual fire extinguishers of capacity 6 kg each and tools (Axe with crow-bar) for
fast extrication of persons from a stopped car. Emergency call stations contain also beside
Emergency Call Speakerphone, power distribution units.
The SOS box interior is permanently alight with an orientation light. Entry to SOS box is indicated
optically and acoustically on operator‘s workplace. In addition, main interior lighting of a SOS box &
amber warning flashing lights (for both traffic directions) above box shall be activated. Emergency
functions of SOS boxes, traffic signs with SOS symbols and amber warning flashing lights shall be
supplied from uninterruptible power source – UPS.
The SOS boxes shall be marked by expressive numeral labelling (readable from a CCTV camera and
by outstanding inscription with the following text in local and English languages: ―This area does
not
provide protection from fire!!‖
a)
b)
IP Based Primary and redundant server.
Weather & Vandal proof IP Emergency Call stations at every 250 meter distance in both of
tunnels at ECP/VCP side.
PA speakers with built in microphone for background noise sensing and intelligent volume
control at every transit rooms for making announcements at individually or multiple locations
from Control room.
Control room call Stations for answering Emergency calls, making PA announcements,
monitoring & diagnostics all ECB and PA points.
GUI software for providing interface for SCADA system to monitoring, control the ECB &
PA system through common workstation of Tunnel system. With interface it is possible to do
diagnosis, keep log of events, and generate automatic system status reports, GUI
representation of ECB & PA element status.
Audio recording for all Control station calls with time & date stamp and web interface for
stored files for analysis.
c)
2) Main & Redundant Emergency Telephone Server
Main Emergency Telephone Server shall be installed in South Control Centre and redundant server
in North Control Centre. In case of failure of one server, the other server shall take control of all
Emergency Call System operations. The recording of the voice calls shall be maintained for 30 days.
SOS Box Emergency Speaker Phone‘s critical inputs are monitored by the Emergency Telephone
Server.
The Emergency Telephone Server shall be capable of communicating with ITCS over the IP
network.
d)
e)
f)
3) Emergency Call System Switchboard
Emergency call system switchboard shall be used as the Master Station. They are placed at South and
North Tunnel Portals and are able to control, monitor and communicate to any Intercom at the
tunnel through IP backbone network. Master Station comprises of VoIP telephone console &
handling desk and shall be able to receive and make emergency calls from/to SOS box Emergency
Speaker Phone. Emergency calls can be recognized in the control room by special ring tone. On the
handling desk panel the according lamp shall illuminate.
8.14.6.3 System Design
All system elements are connected to each other via IP network with redundant fiber optic and
copper cables. Servers are placed in two different control rooms and configured to work one as
Primary and other as Secondary server. Both servers will in ON state and Emergency call stations
and PA Stations are configured to work on primary server and as fall back arrangement on secondary
server. Emergency call box and PA speakers are POE operated; as well it can be powered with local
DC power supply.4) Emergency Speaker Phone (SOS Box)
The Emergency Speaker Phone located in the Emergency call box (SOS Box) shall be used by tunnel
commuters to forward the information to the Master Station after an incident is detected. The
operator at the Master Station shall decide the activation of a suitable control system response to the
reported incident and calls in the rescue service if needed.
• Functionality
System will provide utility to manage the harmony at roads / Tunnel by monitoring and controlling
the emergency situations efficiently. In emergency, people can access the nearest Emergency call
points, to get the help from the control room. For this, person needs to go and press the help button
on the emergency station. After pressing the button, person will get prompt recorded audio message
response from system indicating call has been connected. Call will be instantly (less than 100 mS)
5) Emergency Telephone System Workstation
The workstations shall provide the graphical information about the ECS System. The visualisation
software installed for Emergency call System shall display status of connected equipments.
Detailed Project Report 148

CONSULTANCY SERVICES FOR PREPARATION OFFEASIBILITY REPORT, DPR PREPARATION, REPORT ONENVIRONMENTAL STUDIES AND OBTAINING MOEF
STUP Consultants Pvt. Ltd CLEARANCE AND BID PROCESS MANAGMENT FOR MUMBAI
COASTAL ROAD PROJECT
connected to control room(s). Control room person will get audiovisual alerts of calls; display of
control station will give details of calling station i.e. Name, Location etc. Control room attendant can
select the call and communicate with person seeking help and provide the desired help. Control
room station can get multiple calls simultaneously, operator will get visual display of calls and he/she
can select calls as per priority.
Control room persons can make announcement to any desired Emergency call point or PA points
for general announcements. There is facility to record the announcements and play it again and again
from control desk, at desired time. Announcements can be broadcasted to specific location, group of
stations or entire system as per selection.
IP Cameras on field can be linked with Emergency call points. When call is connected to control
room, logically linked camera video will be automatically streamed to control room screen, giving live
video of calling station.
All voice communication and PA announcements & events at control rooms can be recorded for
later review centrally, with proper database backup.
g)
h)
i)
2)
Various connection board is available to easy mounting/installation
All Cards, modules/paging consoles are closely monitored.
All cards and paging consoles are easily replaceable without re-configuration.
Emergency Call station
8.14.6.4 Technical Details
Technical details of System elements are as below: IP station with one programmable, back-lit emergency call button, electret microphone with
1) ECS Server multifunction LED, loudspeakers 2 x 8 Ω,
(connection as ―make‖ or ―break‖
contact),
stainless steel
3) Master Control Room Station
3 inputs for floating contacts
protection classification IP 65
and 2 relay outputs
and IK 08, material
Basic Digital Central Unit which include power supply card (GEN), Processor card (GEP) and
Connection Card (NET). It supports 14 plug-in slots for various functions. One ECS SERVER can
support up to 112 subscribers (Paging consoles / zones), and different interfaces in accordance to
user needs.
The following is a list of key benefits:
a)
b)
c)
Digital Server for Audio, 2 Way communication, video, indication and control.
Integration of other systems via Ethernet and V24 interfaces with own protocol converter
Latest intercom technology: microprocessor-controlled, high density design, SMD production,
object-orientated programming.
Digital networking over IP, 2 or 4-wire lines, E1, ISDN, SIP etc.
Expandable from 2 to 5760 subscribers (paging console / Zones channel) without restriction,
and up to 30,000 subscribers with restrictions.
User-friendly configuration with PC Software
d)
e)IP station with Mono-LCD display with white backlight, backlit alphanumeric standard keypad,
function buttons, electret microphone with multifunction LED, loudspeakers 2 x 8 Ω, 3 inputs for
floating contacts and 2 relay outputs (connection as ―make‖ or ―break‖ contact),
protectionf)
Detailed Project Report 149

CONSULTANCY SERVICES FOR PREPARATION OFFEASIBILITY REPORT, DPR PREPARATION, REPORT ONENVIRONMENTAL STUDIES AND OBTAINING MOEF
STUP Consultants Pvt. Ltd CLEARANCE AND BID PROCESS MANAGMENT FOR MUMBAI
COASTAL ROAD PROJECT
classification IP 65, polycarbonate construction. Multifunctional master stations for internal and
outdoor areas made in polycarbonate construction. Besides communication the stations can carry out
control functions in other systems. The amplifier provides the necessary volume in areas with high
ambient noise. The stations are protected against dust, dirt or water jets which may occur in
industrial environments. The special foil on the front panel has a dirt-repellent effect and can be
quickly and easily cleaned using normal cleaning agents and disinfectants. Large foil-type buttons
make operation with protective gloves easy.
k) Forward compatible (unlike classic PA systems), as new functions can easily be added via
software download
l) Combinable with virtual server landscapes via VirtuoSIS – provides all the benefits without the
need for extra hardware
4)
a)
b)
c)
IP PA Speakers
Each loudspeaker can be addressed and configured individually
End-to-end monitoring of connection and loudspeaker functionality
High volume capacity and superior speech quality, thanks to integrated 10 watt class-D
amplifier
d) IVC (Intelligent Volume Control) automatically adjusts the
noise level
Conversation and talk-back over integrated microphone
Audio Monitoring enables ambient acoustic surveillance and
such as voice announcements or emergency calls
volume setting to the ambient5) Central Visualization and recording software: –
ECS software is the new generation of visualisation software for control desks in client-server
structure. All control desk functions of the Intercom system are displayed on one or multiple
monitors.
ECS software contained modules Visualization, Video, Scheduler and the separately available ECS
server applications REPORT and SDK open the path into a new dimension of Security and
Communication Systems.
In standardized reporting, scheduled automation of intercom functionality, video integration and the
development of professional custom applications, possibilities are nearly boundless.
e)
f) automatic triggering of actions
g) Built-in inputs and outputs, e.g. for monitoring and controlling third-party sub-sections or
triggering pre-defined actions
Power supply via PoE (Power over Ethernet) – only one Ethernet cable required
No need for central amplifiers – ideal also for small-sized and remote PA zones
Loudspeakers can be allocated to groups and zones without modifying the hardware or wiring
h)
i)
j)
Detailed Project Report 150

8.14.7 Modes of operation & Cause & Effect Matrix for Tunnel Ventilation System
8.14.7.1 Emergency Call System
151
SYSTEM DEVICE LOCATIONALARM /
STATUSCAUSE
(EFFECT) AUTOMATIC ACTION FROM INTEGRATED TUNNEL CONTROL (SCADA) OR MANUAL ACTION
FROM OPERATOR
AUTOMATIC(*)
/ MANUAL(#)
EM
ER
GE
NC
YC
AL
LSY
ST
EM
ALARM
MANUAL
BUTTON
SOS Box Internal
To Main TunnelAlarm
1) Immobile
Vehicle2) Health
Trouble 3)
Accident
1) Alarm transmitted to operator at main/redundant control centre *
2) Amber flashing lights above SOS box for both traffic direction already activated at SOS box door opening *
3) Intercom communication and emergency call control unit recording system at main control centre already activated at SOS box door
opening *
4) SOS box interior lighting already activated at SOS box door opening using Occupancy sensor *
5) CCTV camera shall capture the image of surrounding of respective SOS box and same shall be available on operator CCTV
monitors at main/redundant control centre *
6) Alarm confirmation/authentication by operator at main control centre from camera live pictures, on basis alarm incident operator
shall activate predefined mode of operation #
7) Traffic external to tunnel stopped before entering inside tunnel, using TLTC on red light (if vehicle breakdown occurs with vehicle
stopped inside tunnel out of lay-bay), traffic external to tunnel stopped before entering inside tunnel, using EVS on red cross symbol (if
vehicle breakdown occurs with vehicle stopped inside tunnel (out of lay-by)
TLTCs inside tunnel on red light to stop traffic before arriving to stopped vehicle, and on green light after stopped vehicle (if vehicle
breakdown occurs with vehicle stopped inside tunnel out of lay-by), mechanical barrier at tunnel portal at closed position (if vehicle
breakdown occurring with vehicle stopped inside tunnel out of lay-by) *
8) Activation of tunnel communication system: transmission of message from Evacuative Broadcasting system by operator #
9) Application of all the emergency standards procedures according with emergency response plan (ambulance, police or breakdown
truck are informed in order to give assistance to involved users) by the operator at main control centre #
10) Operator shall reset the system based on confirmation from emergency team #

8.14.7.2 Access Control System
8.14.7.3 Video Surveillance System
152
SYSTEM DEVICE LOCATIONALARM /
STATUSCAUSE
(EFFECT) AUTOMATIC ACTION FROM INTEGRATED TUNNEL CONTROL (SCADA) OR MANUAL ACTION
FROM OPERATOR
AUTOMATIC(*)
/ MANUAL(#)
VID
EO
SU
RV
EIL
LA
NC
ESY
ST
EM
AID
DEVICE
PER
CAMERA
INSIDE
TUNNEL
Main tunnel (Fire
zone every 75 m)
Stopped
vehicle
detected –
Alarm
1) vehicle
breakdown/
Accident
1) Alarm shall be transmitted to operator at main/redundant control centre *
2) alarm confirmation/authentication from operator at main control centre through CCTV system, on basis of alarm incident operator
shall activate mode of operation #
3) speed limit reduced externally and internally to tunnel using SLV lights with amber flashing lights *
4)Traffic external to tunnel stopped before incident location inside tunnel, using TLTC on red light (if vehicle breakdown occurring with
vehicle stopped inside tunnel out of lay-bay), traffic external to tunnel stopped before entering inside tunnel, using EVS on red cross
symbol (if vehicle breakdown occurring with vehicle stopped inside tunnel (out of lay-by). TLTCs inside tunnel on red light to stop
traffic before arriving to stopped vehicle, and on green light after stopped vehicle (if vehicle breakdown occurring with vehicle stopped
inside tunnel out of lay-by), mechanical barrier at tunnel portal at closed position (if vehicle breakdown occurring with vehicle stopped
inside tunnel out of lay-by). Message shall be sent to stop the vehicle entry into tunnel and EVS both side of tunnel shall turn to red
cross to stop vehicles
*
Rise of 2) Fire incident 1) Alarm shall be transmitted to operator at main/redundant control centre *
SYSTEM DEVICE LOCATIONALARM /
STATUSCAUSE
(EFFECT) AUTOMATIC ACTION FROM INTEGRATED TUNNEL CONTROL (SCADA) OR MANUAL ACTION
FROM OPERATOR
AUTOMATIC(*)
/ MANUAL(#)
AC
CE
SS C
ON
TR
OL
SY
ST
EM
Door
Position
Sensor
Cross Passage Door
Door
Opening
Alarm
Emergency
Condition
1) Announcement / visualization and alarm transmitted to operator at main/redundant control centre *
2) Alarm confirmation/authentication by operator at main control centre through CCTV system, on basis alarm incident operator shall
activate predefined mode of operation #
3) Activation of cross passage & escape tunnel emergency lighting system
4) In case of Alarm:
- Traffic external to tunnel stopped before entering inside tunnel, using TLTC on red light.
- Signal to toll collection system to stop traffic
- Traffic external to tunnel stopped before entering inside tunnel, using EVS on red cross symbol, message on DRIP to divert traffic to
old route and SLVS for vehicle entry prohibition. Speed limit shall be reduced for SL installed inside tunnel.
- TLTCs inside tunnel on red light to stop traffic before arriving to incident location, and on green light after incident location
- Mechanical barrier at tunnel portal at closed position (only for entrance lanes)
- Activation of tunnel communication system: alarm to be broadcast by operator in main via Evacuative Broadcasting System
- Application of all the emergency standards procedures according with emergency response plan (ambulance, police or breakdown truck
are informed in order to give assistance to involved users) by the operator at main control centre
*
*
#
5) If either MCP or ACS break glass is operated, emergency lighting shall be activated in escape tunnel after authentication by operator *
6) Operator shall reset the system based on confirmation from emergency team #

153
SYSTEM DEVICE LOCATIONALARM /
STATUSCAUSE
(EFFECT) AUTOMATIC ACTION FROM INTEGRATED TUNNEL CONTROL (SCADA) OR MANUAL ACTION
FROM OPERATOR
AUTOMATIC(*)
/ MANUAL(#)
smoke
Alarm
2) Automatic prompt (POP-UP) of appropriate mode of operation for respective fire zone for confirmation by operator. If operator
does not take any action within pre-defined time i.e. delay of 5min, system shall automatically activate the appropriate fire mode #/*
3) alarm confirmation/authentication from operator at main control centre through CCTV system #
4) Activation of escape tunnel pressurization fans of respective side of tunnel automatically after 1.5 minute of incident *
5) Activation of second escape tunnel pressurization fan manually by operator for fire mode. #
6) Motorized smoke damper (MSD) - 01, 02, 03 near fire location are fully open and all others will be closed ( Typical scheme is
followed for different fire zones as per mode of operation) *
7) TVS-S-01 / TVS-S-02 / TVS-N-01 / TVS-N-02 axial fans for fresh air supply are stopped (Typical scheme is followed for different
fire zones as per mode of operation) immediately after confirmation. *
8) TVE-S-02 / TVE-N-01 / TVE-N-02 axial fans for air/smoke extraction are stopped (Typical scheme is followed for different fire
zones as per mode of operation) immediately after confirmation. *
TVE-S-01 axial fan for air/smoke extraction is activated (Typical scheme is followed for different fire zones as per mode of operation).
TVE-S-01 shall operate at 100%. *
Jet Fan control shall be enabled in fire mode only. Please refer Mode Table & Annexure 1 provided below:
JF-S-01 / JF-S-02 / JF-S-03 / JF-S-04 jet fans for longitudinal air speed control not activated *
AN-01 to AN-05 detect the air speed velocity and direction inside tunnel *
10) Anemometer/Velocity sensor from S to North and N to South detect the air velocity and direction inside the tunnel. If the velocity
from both side of tunnel is equal between 1.0 to 1.6 m/sec, there is no activation of Jet Fans. *
11) If longitudinal air velocities from S to fire site and N to Fire site are different the following operation shall be applied; *
a) Air velocity from S to fire site is higher than the air velocity from N to fire site; *
— JF-N-01 & N-02 are activated *
— System shall keep observing the measurement for 3 mins with defined limits i.e. above 1.6 m/sec *
— If air velocity from S to fire site is still higher than the air velocity from N to fire site JF-N-03 & N-04 are also activated *
b) Air velocity from N to fire site is higher than the air velocity from S to fire site; *
— JF-S-01 & S-02 are activated *
— System shall keep observing the measurement *
— If air velocity from N to fire site is higher than the air velocity from S to fire site JF-S-03 & S-04 are also activated *
12) JF at respective portal do not operate if fire event happen within 300m zone from the portal entrance *
13 ) JF at other portal will operate manually if needed #
14) traffic external to tunnel stopped before entering inside tunnel, using TLTC on red light *
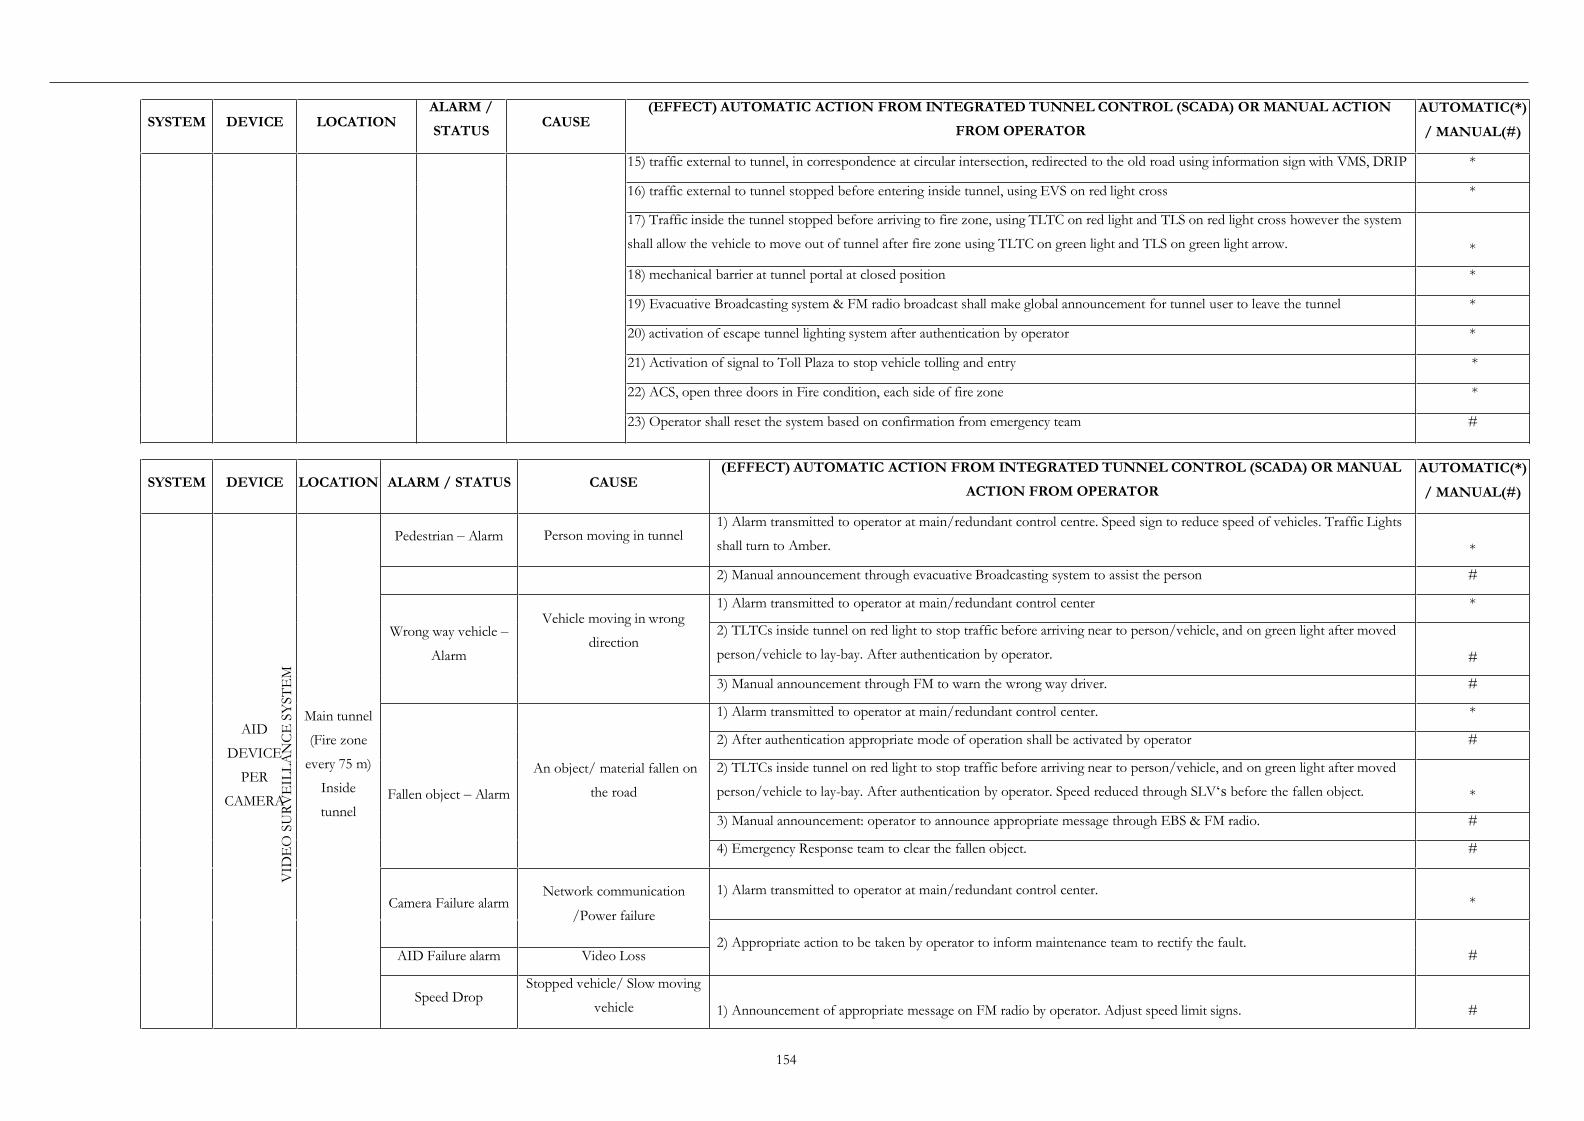
154
SYSTEM DEVICE LOCATION ALARM / STATUS CAUSE(EFFECT) AUTOMATIC ACTION FROM INTEGRATED TUNNEL CONTROL (SCADA) OR MANUAL
ACTION FROM OPERATOR
AUTOMATIC(*)
/ MANUAL(#)
VID
EO
SU
RV
EIL
LA
NC
ESY
ST
EM
AID
DEVICE
PER
CAMERA
Main tunnel
(Fire zone
every 75 m)
Inside
tunnel
Pedestrian – Alarm Person moving in tunnel1) Alarm transmitted to operator at main/redundant control centre. Speed sign to reduce speed of vehicles. Traffic Lights
shall turn to Amber. *
2) Manual announcement through evacuative Broadcasting system to assist the person #
Wrong way vehicle –
Alarm
Vehicle moving in wrong
direction
1) Alarm transmitted to operator at main/redundant control center *
2) TLTCs inside tunnel on red light to stop traffic before arriving near to person/vehicle, and on green light after moved
person/vehicle to lay-bay. After authentication by operator. #
3) Manual announcement through FM to warn the wrong way driver. #
Fallen object – Alarm
An object/ material fallen on
the road
1) Alarm transmitted to operator at main/redundant control center. *
2) After authentication appropriate mode of operation shall be activated by operator #
2) TLTCs inside tunnel on red light to stop traffic before arriving near to person/vehicle, and on green light after moved
person/vehicle to lay-bay. After authentication by operator. Speed reduced through SLV‘s before the fallen object. *
3) Manual announcement: operator to announce appropriate message through EBS & FM radio. #
4) Emergency Response team to clear the fallen object. #
Camera Failure alarmNetwork communication
/Power failure
1) Alarm transmitted to operator at main/redundant control center.*
2) Appropriate action to be taken by operator to inform maintenance team to rectify the fault.AID Failure alarm Video Loss #
Speed DropStopped vehicle/ Slow moving
vehicle 1) Announcement of appropriate message on FM radio by operator. Adjust speed limit signs. #
SYSTEM DEVICE LOCATIONALARM /
STATUSCAUSE
(EFFECT) AUTOMATIC ACTION FROM INTEGRATED TUNNEL CONTROL (SCADA) OR MANUAL ACTION
FROM OPERATOR
AUTOMATIC(*)
/ MANUAL(#)
15) traffic external to tunnel, in correspondence at circular intersection, redirected to the old road using information sign with VMS, DRIP *
16) traffic external to tunnel stopped before entering inside tunnel, using EVS on red light cross *
17) Traffic inside the tunnel stopped before arriving to fire zone, using TLTC on red light and TLS on red light cross however the system
shall allow the vehicle to move out of tunnel after fire zone using TLTC on green light and TLS on green light arrow. *
18) mechanical barrier at tunnel portal at closed position *
19) Evacuative Broadcasting system & FM radio broadcast shall make global announcement for tunnel user to leave the tunnel *
20) activation of escape tunnel lighting system after authentication by operator *
21) Activation of signal to Toll Plaza to stop vehicle tolling and entry *
22) ACS, open three doors in Fire condition, each side of fire zone *
23) Operator shall reset the system based on confirmation from emergency team #

8.14.7.4 Ventilation System
155
SYSTEM DEVICE LOCATIONALARM /
STATUSCAUSE
(EFFECT) AUTOMATIC ACTION FROM INTEGRATED TUNNEL
CONTROL (SCADA) OR MANUAL ACTION FROM OPERATORAUTOMATIC(*) / MANUAL(#)
VE
NT
ILA
TIO
N S
YST
EM
CARBON MONOXIDE
DETECTOR cum
OPACITY (VISIBILITY)
DETECTOR
CPs 02-04-06
(Zone1), CP‘s
08-10 (Zone-
2), CP‘s 12-14
(Zone-3) CP‘s
16-18 (Zone-4)
CP‘s 20-22
Measured Value
Of
Concentration
Of CO/ OP
Level
CO Concentration ≥
85 ppm/ OP
Extinction Factor ≥
0.0065m-¹ for
Duration T > 3
Min
1) Alarm transmitted to operator at main/redundant control centre *
2) Smoke extract dampers (from MSD-01 to MSD-45 if detected CMD/OPD at CPs
02,04,…….14)/(from MSD-46 to MSD-90 if detected CMD/OPD at CPs
16,18,…….28) in normal open mode *
3) Opening of Non Return Damper (NRD) for TVE-S-1 (CPs 02,04,…….14) / TVE-
N-1 (CPs 16,18,…….28) as per mode of operation *
4) Feedback from limit switch of Non Return damper (NRD) for TVE-S-1 (CPs
02,04,…….14) / TVE-N-1 (CPs 16,18,…….28) *
SYSTEM DEVICE LOCATIONALARM /
STATUSCAUSE
(EFFECT) AUTOMATIC ACTION FROM INTEGRATED TUNNEL CONTROL (SCADA) OR
MANUAL ACTION FROM OPERATOR
AUTOMATIC(*)
/ MANUAL(#)
VE
NT
ILA
TIO
N S
YST
EM
NORMAL OPERATING CONDITIONS
CARBON
MONOXIDE
DETECTOR cum
OPACITY
(VISIBILITY)
DETECTOR
CPs 02-04-06
(Zone1), CP‘s
08-10 (Zone-
2), CP‘s 12-14
(Zone-3) CP‘s 16-
18 (Zone-4) CP‘s
20-22 (Zone-5)
CP‘s-24-26-28
(Zone-6)
Measured
Value Of
Concentration
Of CO/ OP
Level
CO
Concentration ≥
70ppm/ OP
Extinction Factor
≥ 0.006m-¹ For
Duration T > 3
Min
1) Alarm transmitted to operator at main/redundant control centre *
2) Smoke extract dampers (from MSD-01 to MSD-45 if detected CMD/OPD at CPs 02,04,…….14)/(from
MSD-46 to MSD-90 if detected CMD/OPD at CPs 16,18,…….28) in normal open mode *
3) Opening of Non Return Damper (NRD) for TVE-S-1 (CPs 02,04,…….14) / TVE-N-1 (CPs
16,18,…….28) as per mode of operation *
4) Feedback from limit switch of Non Return damper (NRD) for TVE-S-1 (CPs 02,04,…….14) / TVE-N-1
(CPs 16,18,…….28) *
5) Activate FAN at 25 % speed TVE-S-1 (CPs 02,04,…….14) / TVE-N-1 (CPs 16,18,…….28) *
6) Fan run/stop status via air flow switch *
7) Opening of Non Return Damper (NRD) for TVS-S-1 (CPs 02,04,…….14) / TVS-N-1 (CPs
16,18,…….28) *
8) Feedback from limit switch of Non Return damper (NRD) for TVS-S-1 (CPs 02,04,…….14) / TVS-N-1
(CPs 16,18,…….28) *
9) Activate FAN at 25 % speed TVS-S-1 (CPs 02,04,…….14) / TVS-N-1 (CPs 16,18,…….28) *
10) Fan run/stop status via air flow switch *
11) TVS-S-1 and TVE-S-1 (CPs 02,04,…….14) / TVS-N-1 and TVE-N-1 (CPs 16,18,…….28) stopped
when CO concentration/OP extinction staying at ≤ 50ppm/0.004m-¹ for more than 3 mins. *
12) If CO level is < 50 ppm and OP < 0.0040 then all TVE & TVS FAN shall be switched off. *

156
SYSTEM DEVICE LOCATIONALARM /
STATUSCAUSE
(EFFECT) AUTOMATIC ACTION FROM INTEGRATED TUNNEL
CONTROL (SCADA) OR MANUAL ACTION FROM OPERATORAUTOMATIC(*) / MANUAL(#)
(Zone-5)
CP‘s-24-26-28
(Zone-6)
5) Activate FAN at 40 % speed TVE-S-1 (CPs 02,04,…….14) / TVE-N-1 (CPs
16,18,…….28) *
6) Fan run/stop status via air flow switch *
7) Opening of Non Return Damper (NRD) for TVS-S-1 (CPs 02,04,…….14) / TVS-
N-1 (CPs 16,18,…….28) *
8) Feedback from limit switch of Non Return damper (NRD) for TVS-S-1 (CPs
02,04,…….14) / TVS-N-1 (CPs 16,18,…….28) *
9) Activate FAN at 40 % speed TVS-S-1 (CPs 02,04,…….14) / TVS-N-1 (CPs
16,18,…….28) *
10) Fan run/stop status via air flow switch *
11) TVS-S-1 and TVE-S-1 (CPs 02,04,…….14) / TVS-N-1 and TVE-N-1 (CPs
16,18,…….28) stopped when CO concentration/OP extinction staying at ≤
50ppm/0.004m-¹ for more than 3 mins *
NORMAL OPERATING CONDITIONS - CONGESTED TRAFFIC
CARBON MONOXIDE
DETECTOR cum
OPACITY (VISIBILITY)
DETECTOR
CPs 02-04-06
(Zone1), CP‘s
08-10 (Zone-
2), CP‘s 12-14
(Zone-3) CP‘s
16-18 (Zone-4)
CP‘s 20-22
(Zone-5)
CP‘s-24-26-28
(Zone-6)
Measured Value
Of
Concentration
Of CO/ OP
Level
CO Concentration ≥
100 Ppm/ OP
Extinction Factor ≥
0.0070m-¹ For
Duration T > 10
Min
1) Alarm transmitted to operator at main/redundant control centre *
2) Smoke extract dampers (from MSD-01 to MSD-45 if detected CMD/OPD at CPs
02,04,…….14)/(from MSD-46 to MSD-90 if detected CMD/OPD at CPs
16,18,…….28) in normal open mode *
3) Opening of Non Return Damper for TVE-S-1 (CPs 02,04,…….14) / TVE-N-1 (CPs
16,18,…….28) as per mode of operation *
4) Feedback from limit switch of Non Return damper (NRD) for TVE-S-1 (CPs
02,04,…….14) / TVE-N-1 (CPs 16,18,…….28) *
5) Activate FAN at 60 % speed TVE-S-1 (CPs 02,04,…….14) / TVE-N-1 (CPs
16,18,…….28) *
6) Fan Run/stop status via air flow switch *
7) Opening of Non Return Damper for TVS-S-1 (CPs 02,04,…….14) / TVS-N-1 (CPs
16,18,…….28) *
8) Feedback from limit switch of Non Return damper (NRD) for TVS-S-1 (CPs
02,04,…….14) / TVE-N-1 (CPs 16,18,…….28) *
9) Activate FAN at 60 % speed TVS-S-1 (CPs 02,04,…….14) / TVS-N-1 (CPs
16,18,…….28) *
10) Fan run/stop status via air flow switch *

157
SYSTEM DEVICE LOCATIONALARM /
STATUSCAUSE
(EFFECT) AUTOMATIC ACTION FROM INTEGRATED TUNNEL
CONTROL (SCADA) OR MANUAL ACTION FROM OPERATORAUTOMATIC(*) / MANUAL(#)
11) TVS-S-1 and TVE-S-1 (CPs 02,04,…….14) / TVS-N-1 and TVE-N-1 (CPs
16,18,…….28) stopped when CO concentration/OP extinction staying at ≤
50ppm/0.004m-¹ for more than 3 mins. *
CARBON MONOXIDE
DETECTOR cum
OPACITY (VISIBILITY)
DETECTOR
CPs 02-04-06
(Zone1), CP‘s
08-10 (Zone-
2), CP‘s 12-14
(Zone-3) CP‘s
16-18 (Zone-4)
CP‘s 20-22
(Zone-5)
CP‘s-24-26-28
(Zone-6)
Measured Value
Of
Concentration
Of CO/ OP
Level
CO Concentration ≥
115 ppm/ OP
Extinction Factor ≥
0.0075m-¹ For
Duration T > 10
Min
1) Alarm transmitted to operator at main/redundant control centre *
2) Smoke extract dampers (from MSD-01 to MSD-45 if detected CMD/OPD at CPs
02,04,…….14)/(from MSD-46 to MSD-90 if detected CMD/OPD at CPs
16,18,…….28) in normal open mode *
3) Opening of Non Return Damper for TVE-S-1 (CPs 02,04,…….14) / TVE-N-1 (CPs
16,18,…….28) as per mode of operation *
4) Feedback from limit switch of Non Return damper (NRD) for TVE-S-1 (CPs
02,04,…….14) / TVE-N-1 (CPs 16,18,…….28) *
5) Activate FAN at 100 % speed TVE-S-1 (CPs 02,04,…….14) / TVE-N-1 (CPs
16,18,…….28) *
6) Fan run/stop status via air flow switch *
7) Opening of Non Return Damper for TVS-S-1 (CPs 02,04,…….14) / TVS-N-1 (CPs
16,18,…….28) *
VE
NT
ILA
TIO
N S
YST
EM
8) Feedback from limit switch of Non Return damper (NRD) for TVS-S-1 (CPs
02,04,…….14) / TVS-N-1 (CPs 16,18,…….28) *
9) Activate FAN at 100 % speed TVS-S-1 (CPs 02,04,…….14) / TVS-N-1 (CPs
16,18,…….28) *
10) Fan run/stop status via air flow switch *
11) TVS-S-1 and TVE-S-1 (CPs 02,04,…….14) / TVS-N-1 and TVE-N-1 (CPs
16,18,…….28) stopped when CO concentration/OP extinction staying at ≤
50ppm/0.004m-¹ for more than 3 mins. *
CARBON MONOXIDE
DETECTOR cum
OPACITY (VISIBILITY)
DETECTOR
CPs 02-04-06
(Zone1), CP‘s
08-10 (Zone-
2), CP‘s 12-14
(Zone-3) CP‘s
16-18 (Zone-4)
CP‘s 20-22
(Zone-5)
Measured Value
Of
Concentration
Of CO/ OP
Level
CO Concentration ≥
130 ppm/ OP
Extinction Factor ≥
0.0080m-¹ For
Duration T > 10
Min
1) Alarm transmitted to operator at main/redundant control centre *
2) Smoke extract dampers (from MSD-01 to MSD-45 if detected CMD/OPD at CPs
02,04,…….14)/(from MSD-46 to MSD-90 if detected CMD/OPD at CPs
16,18,…….28) in normal open mode *
3) Opening of Non Return Damper for TVE-S-1 & TVE-S-2 (CPs 02,04,…….14) /
TVE-N-1 & TVE-N-2 (CPs 16,18,…….28) as per mode of operation *
4) Feedback from limit switch of Non Return damper (NRD) for TVE-S-1 & TVE-S-2
(CPs 02,04,…….14) / TVE-N-1 & TVE-N-2 (CPs 16,18,…….28) *
5) Activate FAN at 75 % speed TVE-S-1 (CPs 02,04,…….14) / TVE-N-1 (CPs *

158
SYSTEM DEVICE LOCATIONALARM /
STATUSCAUSE
(EFFECT) AUTOMATIC ACTION FROM INTEGRATED TUNNEL
CONTROL (SCADA) OR MANUAL ACTION FROM OPERATORAUTOMATIC(*) / MANUAL(#)
CP‘s-24-26-28
(Zone-6)
16,18,…….28) and FAN at 75 % TVE-S-2 (CPs 02,04,…….14) / TVE-N-2 (CPs
16,18,…….28)
6) Fan run/stop status via air flow switch *
7) Non Return Damper for TVS-S-1 & TVS-S-2 (CPs 02,04,…….14) / TVS-N-1 &
TVS-N-2 (CPs 16,18,…….28) *
8) Feedback from limit switch of Non Return damper (NRD) for TVS-S-1 & TVS-S-2
(CPs 02,04,…….14) / TVS-N-1 & TVS-N-2 (CPs 16,18,…….28) *
9) Activate FAN at 75 % speed TVS-S-1 (CPs 02,04,…….14) / TVS-N-1 (CPs
16,18,…….28) and FAN at 75 % TVS-S-2 (CPs 02,04,…….14) / TVS-N-2 (CPs
16,18,…….28) *
10) Fan run/stop status via air flow switch *
11) TVS-S-1 and TVE-S-1 (CPs 02,04,…….14) / TVS-N-1 and TVE-N-1 (CPs
16,18,…….28) stopped when CO concentration/OP extinction staying at ≤
50ppm/0.004m-¹ for more than 3 mins. *
CARBON MONOXIDE
DETECTOR cum
OPACITY (VISIBILITY)
DETECTOR
CPs 02-04-06
(Zone1), CP‘s
08-10 (Zone-
2), CP‘s 12-14
(Zone-3) CP‘s
16-18 (Zone-4)
CP‘s 20-22
(Zone-5)
CP‘s-24-26-28
(Zone-6)
Measured Value
Of
Concentration
Of CO/ OP
Level
CO Concentration ≥
150 Ppm/ OP
Extinction Factor ≥
0.0090m-¹ For
Duration T > 10
Min
1) Alarm transmitted to operator at main/redundant control centre *
2) Smoke extract dampers (from MSD-01 to MSD-45 if detected CMD/OPD at CPs
02,04,…….14)/(from MSD-46 to MSD-90 if detected CMD/OPD at CPs
16,18,…….28) in normal open mode *
3) Opening of Non Return Damper for TVE-S-1 & TVE-S-2 (CPs 02,04,…….14) /
TVE-N-1 & TVE-N-2 (CPs 16,18,…….28) as per mode of operation *
4) Feedback from limit switch of Non Return Damper (NRD) for TVE-S-1 & TVE-S-2
(CPs 02,04,…….14) / TVE-N-1 & TVE-N-2 (CPs 16,18,…….28) *
5) Activate FAN at 100 % speed TVE-S-1 (CPs 02,04,…….14) / TVE-N-1 (CPs
16,18,…….28) and FAN at 100 % TVE-S-2 (CPs 02,04,…….14) / TVE-N-2 (CPs
16,18,…….28) *
6) Fan run/stop status via air flow switch *
7) Opening of Non Return Damper for TVS-S-1 & TVS-S-2 (CPs 02,04,…….14) /
TVS-N-1 & TVS-N-2 (CPs 16,18,…….28) *
8) Feedback from limit switch of Non Return damper (NRD) for TVS-S-1 & TVS-S-2
(CPs 02,04,…….14) / TVS-N-1 & TVE-N-2 (CPs 16,18,…….28) *
9) Activate FAN at 100 % speed TVS-S-1 (CPs 02,04,…….14) / TVS-N-1 (CPs
16,18,…….28) and FAN at 100 % TVS-S-2 (CPs 02,04,…….14) / TVS-N-2 (CPs
16,18,…….28) *

159
SYSTEM DEVICE LOCATIONALARM /
STATUSCAUSE
(EFFECT) AUTOMATIC ACTION FROM INTEGRATED TUNNEL
CONTROL (SCADA) OR MANUAL ACTION FROM OPERATORAUTOMATIC(*) / MANUAL(#)
VE
NT
ILA
TIO
N S
YST
EM
NORMAL OPERATING CONDITIONS - STOPPED TRAFFIC (TUNNEL CLOSURE)
CARBON MONOXIDE
DETECTOR cum
OPACITY (VISIBILITY)
DETECTOR
CPs 02-04-06
(Zone1), CP‘s
08-10 (Zone-
2), CP‘s 12-14
(Zone-3) CP‘s
16-18 (Zone-4)
CP‘s 20-22
(Zone-5)
CP‘s-24-26-28
(Zone-6)
Measured Value
Of
Concentration
Of CO/ OP
Level
CO
Concentration ≥
200ppm/ OP
Extinction Factor
≥ 0.012m-¹
Duration Of
Detection T ≥
3min
1) Alarm transmitted to operator at main/redundant control centre *
2) Image of spot will be captured by CCTV and will be available at operators monitor *
3) Alarm confirmation/authentication from operator at main control centre through
CCTV system #
4) Traffic stopped in front of tunnel portal using TLTC on red light *
5) Traffic stopped in front of tunnel portal using EVS on red cross symbol *
6) Traffic redirected to the old road using information sign with VMS at circular
intersection & DRIP to divert traffic to old route *
7) Using of mechanical barrier for closing tunnel to traffic *
8) Activation of tunnel communication system: transmission of predefined phonetic
messages on FM radio and EBS (users informed to shut off the vehicle engine in case
of stopped traffic) via Evacuative Broadcasting system and FM Radio. #
9) Alarm sent to toll plaza to stop tolling and vehicle entry to tunnel *
10) Application of all the emergency standards procedures according with emergency
response plan (ambulance, police or breakdown truck are informed in order to give
assistance to involved users) by the operator at main control centre. #
11) Operator shall reset the system based on confirmation from emergency team #
12) All MT supply & Exhaust fans operate at 100% until the sensor measure lower
levels & the fans can be adjusted accordingly *
SYSTEM DEVICE LOCATIONALARM /
STATUSCAUSE
(EFFECT) AUTOMATIC ACTION FROM INTEGRATED TUNNEL
CONTROL (SCADA) OR MANUAL ACTION FROM OPERATORAUTOMATIC(*) / MANUAL(#)
10) Fan run/stop status via air flow switch *
11) TVS-S-1 and TVE-S-1 (CPs 02,04,…….14) / TVS-N-1 and TVE-N-1 (CPs
16,18,…….28) stopped when CO concentration/OP extinction staying at ≤
50ppm/0.004m-¹ for more than 3 mins *

8.14.7.5 Electrical Fire Signalling System
160
SYSTEM DEVICE LOCATIONALARM /
STATUSCAUSE
(EFFECT) AUTOMATIC ACTION FROM INTEGRATED TUNNEL
CONTROL (SCADA) OR MANUAL ACTION FROM OPERATORAUTOMATIC(*) / MANUAL(#)
EF
SS
LINEAR HEAT
DETECTOR
Main Tunnel (
Fire zone at
every 75 m
Typical)
Heat
Detection
Alarm
Heat Raised Or
Fire Occurred
1) Alarm shall be transmitted to operator at main/redundant control centre *
2) Automatic prompt(POP-UP) of appropriate mode of operation for respective fire
zone for confirmation by operator. If operator does not take any action within pre-
defined time i.e. delay of 5min, system shall automatically activate the appropriate fire
mode #/*
3) Alarm confirmation/authentication from operator at main control centre through
CCTV system #
4) Activation of escape tunnel pressurization fans respective side of tunnel shall be
automatically start after 1.5 minute of fire incident *
5) Activation of second escape tunnel pressurization fans manually by operator for
fire mode #
6) Motorized smoke damper (MSD) - 01, 02, 03 near fire location are fully open and
all others will be closed ( Typical scheme is followed for different fire zones as per
mode of operation) *
7) TVS-S-01 / TVS-S-02 / TVS-N-01 / TVS-N-02 axial fans for fresh air supply are
stopped ( Typical scheme is followed for different fire zones as per mode of
operation) immediately after confirmation *
8) TVE-S-02 / TVE-N-01 / TVE-N-02 axial fans for air/smoke extraction are
stopped ( Typical scheme is followed for different fire zones as per mode of
operation) immediately after confirmation *
9) TVE-S-01 axial fan for air/smoke extraction is activated ( Typical scheme is
followed for different fire zones as per mode of operation). TVE operates at 100% . *
Jet Fan control shall be enabled in fire mode only. Please refer Mode Table &
Annexure 1 provided below:
— JF-S-01 / JF-S-02 / JF-S-03 / JF-S-04 jet fans for longitudinal air speed
control
not activated*
— AN-01 to AN-05 detect the air speed velocity and direction inside tunnel *
10) Anemometer/Velocity sensor from S to North and N to South detect the air
velocity and direction inside the tunnel. If the velocity from both side of tunnel is
equal between 1.0 to 1.6 m/sec, there is no activation of Jet Fans. *
11) If longitudinal air velocities from S to fire site and N to Fire site are different the
following operation shall be applied; *
a) Air velocity from S to fire site is higher than the air velocity from N to fire site; *

161
SYSTEM DEVICE LOCATIONALARM /
STATUSCAUSE
(EFFECT) AUTOMATIC ACTION FROM INTEGRATED TUNNEL
CONTROL (SCADA) OR MANUAL ACTION FROM OPERATORAUTOMATIC(*) / MANUAL(#)
— JF-N-01 & N-02 are activated *
— System shall keep observing the measurement for 3 mins with defined
limits i.e.
above 1.6 m/sec
*
— If air velocity from S to fire site is still higher than the air velocity from N
to fire
site JF-N-03 & N-04 are also activated
*
b) Air velocity from N to fire site is higher than the air velocity from S to fire site; *
— JF-S-01 & S-02 are activated *
— System shall keep observing the measurement *
— If air velocity from N to fire site is higher than the air velocity from S to firesite
JF-S-03 & S-04 are also activated*
12) JF at respective portal do not operate if fire event happen within 300m zone
from the portal entrance *
13) JF at other portal will operate manually if needed
14) Traffic external to tunnel stopped before entering inside tunnel, using TLTC on
red light *
15) Traffic external to tunnel, in correspondence of at circular intersection, redirected
to the old road using information sign with VMS, DRIP *
16) Traffic external to tunnel stopped before entering inside tunnel, using EVS on red
cross symbol *
17) Traffic inside the tunnel stopped before arriving to fire zone, using TLTC on red
light and TLS on red cross symbol however the system shall allow the vehicle to
move out of tunnel after fire zone using TLTC on green light and TLS on green
arrow symbol *
18) Mechanical barrier at tunnel portal at closed position *
19) FM rebroadcasting system and Evacuative Broadcasting system shall announce
global announcement for tunnel user to leave the tunnel *
20) Activation of escape tunnel lighting system *
21) Activation of signal to Toll Plaza to stop vehicle tolling and entry *
22) ACS, open three doors in Fire condition, each side of fire zone *
23) Operator shall reset the system based on confirmation from emergency team #

162
SYSTEM DEVICE LOCATIONALARM /
STATUSCAUSE
(EFFECT) AUTOMATIC ACTION FROM INTEGRATED TUNNEL
CONTROL (SCADA) OR MANUAL ACTION FROM OPERATORAUTOMATIC(*) / MANUAL(#)
EF
SS
MANUAL CALL POINT
SOS boxes
02/03
internal to
main tunnel (
Typical for
rest)
Manually
Generated
Fire Alarm
1) Fire Event
1) Alarm shall be transmitted to operator at main/redundant control centre *
2) Automatic prompt(POP-UP) of appropriate mode of operation for respective fire
zone for confirmation by operator. If operator does not take any action within pre-
defined time i.e. delay of 5min, system shall automatically activate the appropriate fire
mode #/*
3) Alarm confirmation/authentication from operator at main control centre through
CCTV system #
4) Activation of escape tunnel pressurization fans respective side of tunnel shall be
automatically start after 1.5 minute of fire incident *
5) Activation of second escape tunnel pressurization fans manually by operator #
6) Motorized smoke damper (MSD) - 01, 02, 03 near fire location are fully open and
all others will be closed ( Typical scheme is followed for different fire zones as per
mode of operation) *
7) TVS-S-01 / TVS-S-02 / TVS-N-01 / TVS-N-02 axial fans for fresh air supply are
stopped ( Typical scheme is followed for different fire zones as per mode of
operation) immediately after confirmation *
8) TVE-S-02 / TVE-N-01 / TVE-N-02 axial fans for air/smoke extraction are
stopped ( Typical scheme is followed for different fire zones as per mode of
operation) immediately after confirmation *
— TVE-S-01 axial fan for air/smoke extraction is activated ( Typical
scheme is
followed for different fire zones as per mode of operation) after 1.5min of
confirmation*
Jet Fan control shall be enabled in fire mode only. Please refer Mode Table &
Annexure 1 provided below:
— JF-S-01 / JF-S-02 / JF-S-03 / JF-S-04 jet fans for longitudinal air
speed control
not activated*
— AN-01 / AN-02 detect the air speed velocity and direction insidetunnel
*
9) Anemometer/Velocity sensor from S to North and N to South detect the air
velocity and direction inside the tunnel. If the velocity from both side of tunnel is
equal between 1.0 to 1.6 m/sec, there is no activation of Jet Fans. *
10) If longitudinal air velocities from S to fire site and N to Fire site are different the
following operation shall be applied; *
a) Air velocity from S to fire site is higher than the air velocity from N to fire site; *

163
SYSTEM DEVICE LOCATIONALARM /
STATUSCAUSE
(EFFECT) AUTOMATIC ACTION FROM INTEGRATED TUNNEL
CONTROL (SCADA) OR MANUAL ACTION FROM OPERATORAUTOMATIC(*) / MANUAL(#)
— JF-N-01 & N-02 are activated *
— System shall keep observing the measurement *
MANUAL FIRE
EXTINGUISHER (
LIMIT SWITCH)
SOS BOX
02/03 (Inside
Main tunnel
and typical for
rest)
— If air velocity from S to fire site is still higher than the air velocity
from N to
fire site JF-N-03 & N-04 are also activated
*
b) Air velocity from N to fire site is higher than the air velocity from S to fire site; *
— JF-S-01 & S-02 are activated *
— System shall keep observing the measurement *
— If air velocity from N to fire site is higher than the air velocity
from S to fire
site JF-S-03 & S-04 are also activated
*
11) JF at respective portal do not operate if fire event happen within 300m zone
from the portal entrance *
12) JF at other portal will operate manually if needed
13) Traffic external to tunnel stopped before entering inside tunnel, using TLTC on
red light *
14) Traffic external to tunnel, in correspondence of at circular intersection, redirected
to the old road using information sign with VMS, DRIP *
15) Traffic external to tunnel stopped before entering inside tunnel, using EVS on red
cross symbol *
16) Traffic inside the tunnel stopped before arriving to fire zone, using TLTC on red
light and TLS on red cross symbol however the system shall allow the vehicle to
move out of tunnel after fire zone using TLTC on green light and TLS on green
arrow symbol *
17) Mechanical barrier at tunnel portal at closed position *
18) FM rebroadcasting system and Evacuative Broadcasting system shall announce
global announcement for tunnel user to leave the tunnel *
19) Activation of escape tunnel lighting system *
20) Activation of signal to Toll Plaza to stop vehicle tolling and entry *
21 ACS, Open three doors in Fire condition, each side of fire zone. *
23) Operator shall reset the system based on confirmation from emergency team #

164
SYSTEM DEVICE LOCATIONALARM /
STATUSCAUSE
(EFFECT) AUTOMATIC ACTION FROM INTEGRATED TUNNEL
CONTROL (SCADA) OR MANUAL ACTION FROM OPERATORAUTOMATIC(*) / MANUAL(#)
EF
SS
Manual Call point
Escape door,
inside Main
tunnel
Manually
Generated
Fire Alarm
Fire event
1) Fire alarm announced in the main/redundant control centre by alarm facilities *
2) Alarm confirmation/authentication through emergency team visit to respective
location #
a) EFS central resetted, in case of false alarm
b) In case of real alarm, operator shall take manual action as per standard operating
procedure in emergency response plan like call fire brigade #
c) Switch on escape tunnel lights
d) Traffic external to tunnel stopped before entering inside tunnel, using TLTC on
red light and EVS on red cross symbol
e) Traffic external to tunnel at circular intersection, redirected to the old road using
information sign with VMS, DRIP
f) Traffic inside the tunnel stopped before arriving to fire site, using TLTC on red
light and TLS on red cross symbol, traffic after the fire site will be let out of tunnel
using TLTC on green light and TLS on green arrow symbol
g) Mechanical barrier at tunnel portal at closed position (only for entrance lanes)
h) FM rebroadcasting system and Evacuative Broadcasting system shall announce
global announcement for tunnel user to leave the tunnel
*
i) Activation of signal to Toll Plaza to stop vehicle tolling and entry
j) ACS, open three doors in Fire condition, each side of fire zone *
Operator shall reset the system based on confirmation from emergency team #
EF
SS EFS DISCRETE
DETECTORS
Technical
Rooms, LV
Rooms
External/Inter
nal To Tunnel
Automatic
Fire/Smoke
Alarm
Smoke Occurred
1) Fire alarm announced in the main/redundant control centre by alarm facilities *
2) Alarm confirmation/authentication through emergency team visit to respective
location #
a) EFS central resetted, in case of false alarm
b) In case of real alarm, operator shall take manual action as per standard operating
procedure in emergency response plan like call fire brigade #
c) Switch on escape tunnel lights
d) Traffic external to tunnel stopped before entering inside tunnel, using TLTC on
red light and EVS on red cross symbol
e) Traffic external to tunnel at circular intersection, redirected to the old road using
information sign with VMS, DRIP
f) Traffic inside the tunnel stopped before arriving to fire site, using TLTC on red *

8.14.7.6 Electrical System Cause & Effect Matrix
165
DEVICE LOCATION MODEALARM /
STATUSCAUSE
(EFFECT) AUTOMATIC ACTION FROM INTEGRATED TUNNEL
CONTROL (SCADA) OR MANUAL ACTION FROM OPERATORAUTOMATIC(*) / MANUAL(#)
PLC inside HT PanelHT-SS1, HT-SS2, HT-SS3,
HT-SS4, HT-SS5NORMAL
Normal Mode (Power supply from South Grid HEALTHY; North Grid
HEALTHY):
Power supply from South Grid feeds the entire tunnel. The Main incomer breaker at
HT-SS1 CLOSE. Main-incomer breaker at HT-SS5 OPEN. All Tie-breakers CLOSE.
*
VOLTAGE =
0 at HT-SS1
Incomer
Breaker
(Power supply from South Grid FAIL; North Grid HEALTHY):
Action PSS PLC:
1. Check grid-supply from South FAIL. The Main incomer breaker at HT-SS1
OPEN. Check grid-supply from North HEALTHY. Main-incomer breaker at HT-
SS5 CLOSE. All Tie-breakers CLOSE.
*
SYSTEM DEVICE LOCATIONALARM /
STATUSCAUSE
(EFFECT) AUTOMATIC ACTION FROM INTEGRATED TUNNEL
CONTROL (SCADA) OR MANUAL ACTION FROM OPERATORAUTOMATIC(*) / MANUAL(#)
light and TLS on red cross symbol, traffic after the fire site will be let out of tunnel
using TLTC on green light and TLS on green arrow symbol
g) Mechanical barrier at tunnel portal at closed position (only for entrance lanes)
h) FM rebroadcasting system and Evacuative Broadcasting system shall announce
global announcement for tunnel user to leave the tunnel
i) Activation of signal to Toll Plaza to stop vehicle tolling and entry
j) ACS, open three doors in Fire condition, each side of fire zone *
Operator shall reset the system based on confirmation from emergency team #
Tra
ffic
con
trol sy
stem
ESD/EOD/EHD
In the way of
the bridge road
gantry at both
north and
south portal
Smoking
vehicle
detected/Exce
ssive heated
vehicle
detected/Exce
ssive height
vehicle
detected
Excessive Smoke
generated by
vehicle/ Heat
generated by
vehicle greater than
defined value
/height of vehicle
greater than
defined value
Alarm announced in the main/redundant control centre by alarm facilities *
Alarm confirmation/authentication through emergency team visit to respective
location #
Mechanical barrier to closed position
*
vehicle redirected to the old road using TLTC with direction symbol
traffic signs shall glow and Appropriate message shall be displayed on DRIP
alarm to security staff #
Operator shall check the authenticity of alarm and reset the system to open the Boom
Barrier #
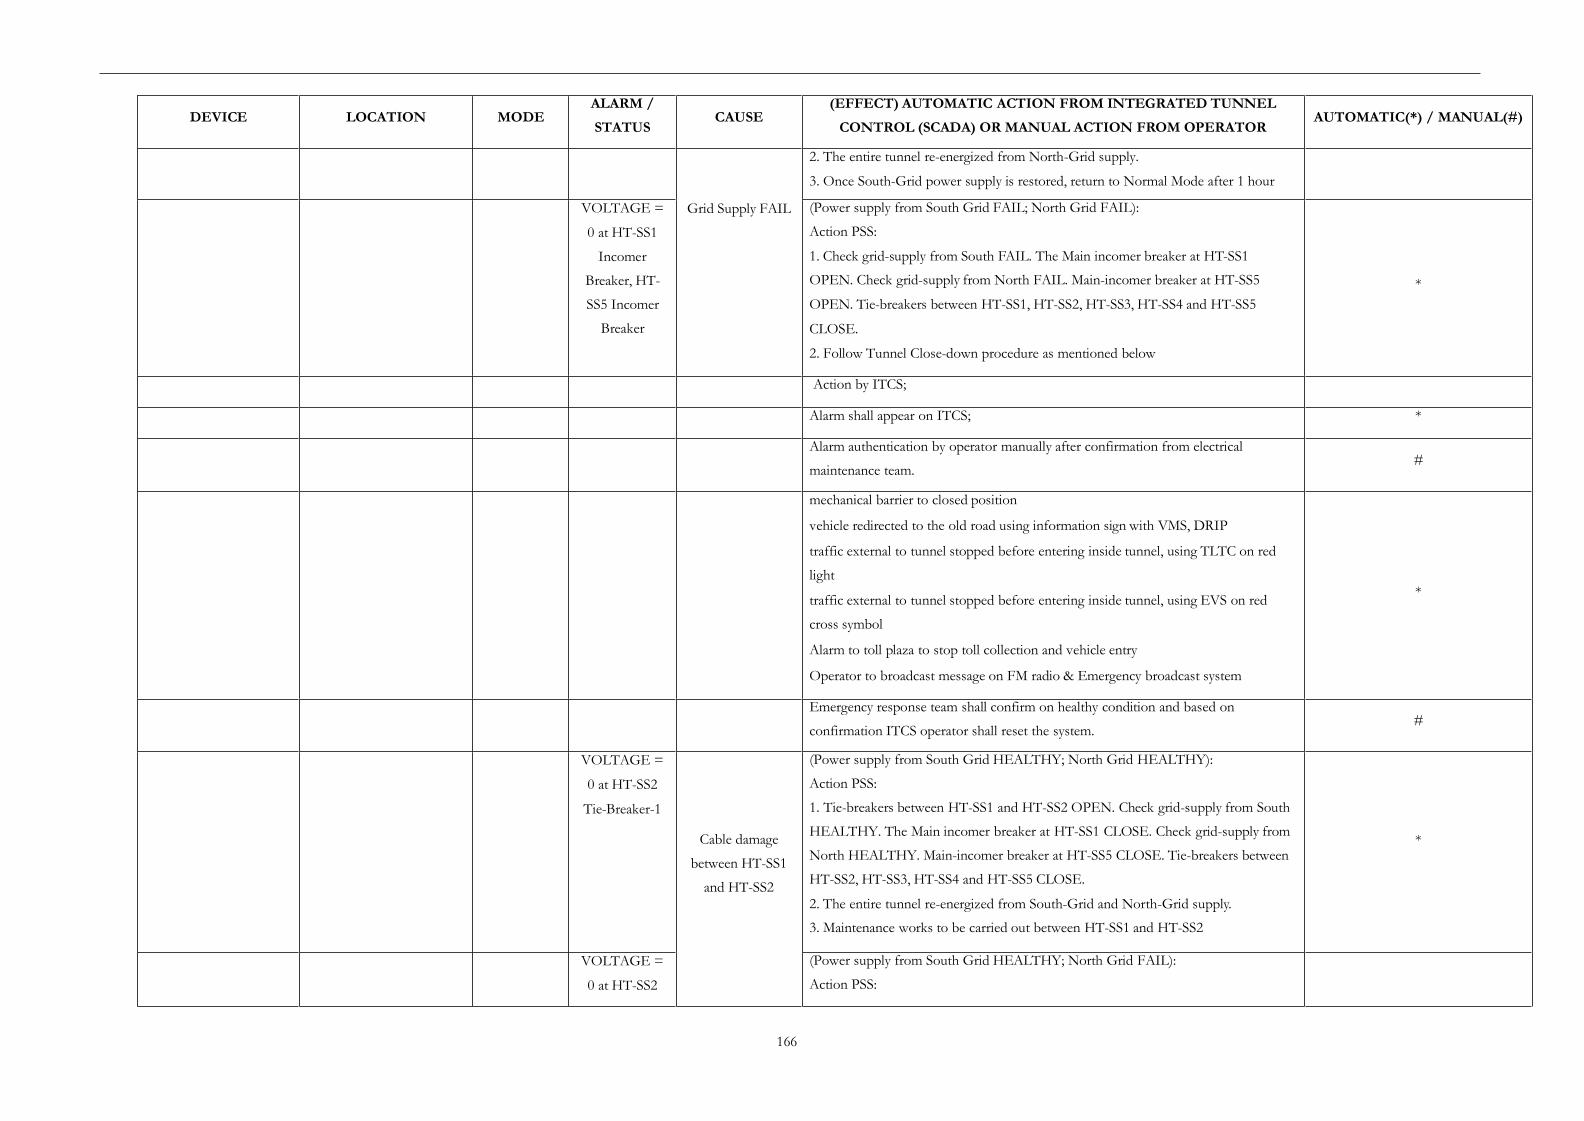
166
DEVICE LOCATION MODEALARM /
STATUSCAUSE
(EFFECT) AUTOMATIC ACTION FROM INTEGRATED TUNNEL
CONTROL (SCADA) OR MANUAL ACTION FROM OPERATORAUTOMATIC(*) / MANUAL(#)
Grid Supply FAIL
2. The entire tunnel re-energized from North-Grid supply.
3. Once South-Grid power supply is restored, return to Normal Mode after 1 hour
VOLTAGE =
0 at HT-SS1
Incomer
Breaker, HT-
SS5 Incomer
Breaker
(Power supply from South Grid FAIL; North Grid FAIL):
Action PSS:
1. Check grid-supply from South FAIL. The Main incomer breaker at HT-SS1
OPEN. Check grid-supply from North FAIL. Main-incomer breaker at HT-SS5
OPEN. Tie-breakers between HT-SS1, HT-SS2, HT-SS3, HT-SS4 and HT-SS5
CLOSE.
2. Follow Tunnel Close-down procedure as mentioned below
*
Action by ITCS;
Alarm shall appear on ITCS; *
Alarm authentication by operator manually after confirmation from electrical
maintenance team.#
mechanical barrier to closed position
vehicle redirected to the old road using information sign with VMS, DRIP
traffic external to tunnel stopped before entering inside tunnel, using TLTC on red
light
traffic external to tunnel stopped before entering inside tunnel, using EVS on red
cross symbol
Alarm to toll plaza to stop toll collection and vehicle entry
Operator to broadcast message on FM radio & Emergency broadcast system
*
Emergency response team shall confirm on healthy condition and based on
confirmation ITCS operator shall reset the system.#
VOLTAGE =
0 at HT-SS2
Tie-Breaker-1
Cable damage
between HT-SS1
and HT-SS2
(Power supply from South Grid HEALTHY; North Grid HEALTHY):
Action PSS:
1. Tie-breakers between HT-SS1 and HT-SS2 OPEN. Check grid-supply from South
HEALTHY. The Main incomer breaker at HT-SS1 CLOSE. Check grid-supply from
North HEALTHY. Main-incomer breaker at HT-SS5 CLOSE. Tie-breakers between
HT-SS2, HT-SS3, HT-SS4 and HT-SS5 CLOSE.
2. The entire tunnel re-energized from South-Grid and North-Grid supply.
3. Maintenance works to be carried out between HT-SS1 and HT-SS2
*
VOLTAGE =
0 at HT-SS2
(Power supply from South Grid HEALTHY; North Grid FAIL):
Action PSS:

167
DEVICE LOCATION MODEALARM /
STATUSCAUSE
(EFFECT) AUTOMATIC ACTION FROM INTEGRATED TUNNEL
CONTROL (SCADA) OR MANUAL ACTION FROM OPERATORAUTOMATIC(*) / MANUAL(#)
Tie-Breaker-1,
HT-SS5
Incomer
Breaker
1. Tie-breakers between HT-SS1 and HT-SS2 OPEN. Check grid-supply from South
HEALTHY. The Main incomer breaker at HT-SS1 CLOSE. Check grid-supply from
North FAIL. Main-incomer breaker at HT-SS5 OPEN. Tie-breakers between HT-
SS2, HT-SS3, HT-SS4 and HT-SS5 CLOSE.
2. Follow Tunnel Close-down procedure.
*
Action by ITCS;
Alarm shall appear on ITCS; *
Alarm authentication by operator manually after confirmation from electrical
maintenance team.#
mechanical barrier to closed position
vehicle redirected to the old road using information sign with VMS, DRIP
traffic external to tunnel stopped before entering inside tunnel, using TLTC on red
light
traffic external to tunnel stopped before entering inside tunnel, using EVS on red
cross symbol
Alarm to toll plaza to stop toll collection and vehicle entry
Operator to broadcast message on FM radio & Emergency broadcast system
*
Emergency response team shall confirm on healthy condition and based on
confirmation ITCS operator shall reset the system.#
VOLTAGE =
0 at HT-SS3
Tie-Breaker-1
Cable damage
between HT-SS2
and HT-SS3
(Power supply from South Grid HEALTHY; North Grid HEALTHY):
Action PSS:
1. Tie-breakers between HT-SS2 and HT-SS3 OPEN. Check grid-supply from South
HEALTHY. The Main incomer breaker at HT-SS1 CLOSE. Check grid-supply from
North HEALTHY. Main-incomer breaker at HT-SS5 CLOSE. Tie-breakers between
HT-SS1 and HT-SS2 CLOSE, between HT-SS3, HT-SS4 and HT-SS5 CLOSE.
2. The entire tunnel re-energized from South-Grid and North-Grid supply.
3. Maintenance works to be carried out between HT-SS2 and HT-SS3
*
VOLTAGE =
0 at HT-SS3
Tie-Breaker-1,
HT-SS5
Incomer
Breaker
(Power supply from South Grid HEALTHY; North Grid FAIL):
Action PSS:
1. Tie-breakers between HT-SS2 and HT-SS3 OPEN. Check grid-supply from South
HEALTHY. The Main incomer breaker at HT-SS1 CLOSE. Check grid-supply from
North FAIL. Main-incomer breaker at HT-SS5 OPEN. Tie-breakers between HT-
SS1 and HT-SS2 CLOSE. Tie-breakers between HT-SS3, HT-SS4 and HT-SS5
*

168
DEVICE LOCATION MODEALARM /
STATUSCAUSE
(EFFECT) AUTOMATIC ACTION FROM INTEGRATED TUNNEL
CONTROL (SCADA) OR MANUAL ACTION FROM OPERATORAUTOMATIC(*) / MANUAL(#)
CLOSE.
2. Follow Tunnel Close-down procedure
Action by ITCS;
Alarm shall appear on ITCS; *
Alarm authentication by operator manually after confirmation from electrical
maintenance team.#
mechanical barrier to closed position
vehicle redirected to the old road using information sign with VMS, DRIP
traffic external to tunnel stopped before entering inside tunnel, using TLTC on red
light
traffic external to tunnel stopped before entering inside tunnel, using EVS on red
cross symbol
Alarm to toll plaza to stop toll collection and vehicle entry
Operator to broadcast message on FM radio & Emergency broadcast system
*
Emergency response team shall confirm on healthy condition and based on
confirmation ITCS operator shall reset the system.#
VOLTAGE =
0 at HT-SS4
Tie-Breaker-1
Cable damage
between HT-SS3
and HT-SS4
(Power supply from South Grid HEALTHY; North Grid HEALTHY):
Action PSS:
1. Tie-breakers between HT-SS3 and HT-SS4 OPEN. Check grid-supply from South
HEALTHY. The Main incomer breaker at HT-SS1 CLOSE. Check grid-supply from
North HEALTHY. Main-incomer breaker at HT-SS5 CLOSE. Tie-breakers between
HT-SS1 HT-SS2 and HT-SS3 CLOSE, between HT-SS4 and HT-SS5 CLOSE.
2. The entire tunnel re-energized from South-Grid and North-Grid supply.
3. Maintenance works to be carried out between HT-SS3 and HT-SS4
*
VOLTAGE =
0 at HT-SS4
Tie-Breaker-1,
HT-SS5
Incomer
Breaker
(Power supply from South Grid HEALTHY; North Grid FAIL):
Action PSS:
1. Tie-breakers between HT-SS3 and HT-SS4 OPEN. Check grid-supply from South
HEALTHY. The Main incomer breaker at HT-SS1 CLOSE. Check grid-supply from
North FAIL. Main-incomer breaker at HT-SS5 OPEN. Tie-breakers between HT-
SS1, HT-SS2 and HT-SS3 CLOSE. Tie-breakers between HT-SS4 and HT-SS5
CLOSE.
2. Follow Tunnel Close-down procedure
*
Action by ITCS;

169
DEVICE LOCATION MODEALARM /
STATUSCAUSE
(EFFECT) AUTOMATIC ACTION FROM INTEGRATED TUNNEL
CONTROL (SCADA) OR MANUAL ACTION FROM OPERATORAUTOMATIC(*) / MANUAL(#)
Alarm shall appear on ITCS; *
Alarm authentication by operator manually after confirmation from electrical
maintenance team.#
mechanical barrier to closed position
vehicle redirected to the old road using information sign with VMS, DRIP
traffic external to tunnel stopped before entering inside tunnel, using TLTC on red
light
traffic external to tunnel stopped before entering inside tunnel, using EVS on red
cross symbol
Alarm to toll plaza to stop toll collection and vehicle entry
Operator to broadcast message on FM radio & Emergency broadcast system
*
Emergency response team shall confirm on healthy condition and based on
confirmation ITCS operator shall reset the system.#
9
VOLTAGE =
0 at HT-SS5
Tie-Breaker
Cable damage
between HT-SS4
and HT-SS5
(Power supply from South Grid HEALTHY; North Grid HEALTHY):
Action PSS:
1. Tie-breakers between HT-SS4 and HT-SS5 OPEN. Check grid-supply from South
HEALTHY. The Main incomer breaker at HT-SS1 CLOSE. Check grid-supply from
North HEALTHY. Main-incomer breaker at HT-SS5 CLOSE. Tie-breakers between
HT-SS1, HT-SS2, HT-SS3 and HT-SS4 CLOSE.
2. The entire tunnel re-energized from South-Grid and North-Grid supply.
3. Maintenance works to be carried out between HT-SS4 and HT-SS5
*
10
VOLTAGE =
0 at HT-SS5
Tie-Breaker,
HT-SS5
Incomer
Breaker
(Power supply from South Grid HEALTHY; North Grid FAIL):
Action PSS:
1. Tie-breakers between HT-SS4 and HT-SS5 OPEN. Check grid-supply from South
HEALTHY. The Main incomer breaker at HT-SS1 CLOSE. Check grid-supply from
North FAIL. Main-incomer breaker at HT-SS5 OPEN. Tie-breakers between HT-
SS1, HT-SS2, HT-SS3 and HT-SS4 CLOSE.
2. Follow Tunnel Close-down procedure
*
Action by ITCS;
Alarm shall appear on ITCS; *
Alarm authentication by operator manually after confirmation from electrical
maintenance team.#
mechanical barrier to closed position *

170
DEVICE LOCATION MODEALARM /
STATUSCAUSE
(EFFECT) AUTOMATIC ACTION FROM INTEGRATED TUNNEL
CONTROL (SCADA) OR MANUAL ACTION FROM OPERATORAUTOMATIC(*) / MANUAL(#)
vehicle redirected to the old road using information sign with VMS, DRIP
traffic external to tunnel stopped before entering inside tunnel, using TLTC on red
light
traffic external to tunnel stopped before entering inside tunnel, using EVS on red
cross symbol
Alarm to toll plaza to stop toll collection and vehicle entry
Operator to broadcast message on FM radio & Emergency broadcast system
Emergency response team shall confirm on healthy condition and based on
confirmation ITCS operator shall reset the system.#
Normal Mode (All Transformers HEALTHY at Technology Building):
ACB Nos B1, B3, B5, B7, B9, B11 CLOSE; B2, B4, B6, B8, B10 OPEN*
PLC inside LT Panel MDB-SS1 NORMAL
VOLTAGE =
0 at MDB-SS1
ACB-B1 TRIP/
OPEN
(TRANSFORMER TX-SS1-1 (750kVA FAIL):
Action PSS PLC:
1. Check TX-SS1-1 parameters, TRIP. ACB B1 OPEN. VCB-HT-SS1-2 OPEN.
2. Check power supply at ACB B3 - HEALTHY. Check ACBs B4, B6, B8 and B10
OPEN. If YES, CLOSE ACB B2.
3. Power supply restored to MDB-SS1.
4. Maintenance works to be carried out at TX-SS1-1
*
VOLTAGE =
0 at MDB-SS1
ACB-B1 TRIP/
OPEN
(TRANSFORMER TX-SS1-1 (750kVA FAIL):
Action PSS PLC:
1. Check TX-SS1-1 parameters, TRIP. ACB B1 OPEN. VCB-HT-SS1-2 OPEN.
2. Check power supply at ACB B3 - HEALTHY. Check ACBs B4, B6, B8 and B10
OPEN - if any breaker CLOSE, ACB B2 remains OPEN.
3. Follow Tunnel Close-down procedure
*
Action by ITCS;
Alarm shall appear on ITCS; *
Alarm authentication by operator manually after confirmation from electrical
maintenance team.#
mechanical barrier to closed position
vehicle redirected to the old road using information sign with VMS, DRIP
traffic external to tunnel stopped before entering inside tunnel, using TLTC on red
light
*

171
DEVICE LOCATION MODEALARM /
STATUSCAUSE
(EFFECT) AUTOMATIC ACTION FROM INTEGRATED TUNNEL
CONTROL (SCADA) OR MANUAL ACTION FROM OPERATORAUTOMATIC(*) / MANUAL(#)
traffic external to tunnel stopped before entering inside tunnel, using EVS on red
cross symbol
Alarm to toll plaza to stop toll collection and vehicle entry
Operator to broadcast message on FM radio & Emergency broadcast system
Emergency response team shall confirm on healthy condition and based on
confirmation ITCS operator shall reset the system.#
Maintenance personnel to inspect TX-SS1-1 and restore power supply to MDB-SS1 *
VOLTAGE =
0 at MCP-AF1-
VB1
ACB-B5 TRIP/
OPEN
(TRANSFORMER TX-SS1-3 (1250kVA FAIL):
Action PSS PLC:
1. Turn-off MCP-AF3-VB1 (Exhaust Fan-1)
2. Check TX-SS1-3 parameters, TRIP. ACB B5 OPEN. VCB-HT-SS1-4 OPEN.
3. Check power supply at ACB B3 - HEALTHY. Check ACBs B2, B6, B8 and B10
OPEN. If YES, CLOSE ACB B4.
4. Power supply restored to MCP-AF1-VB1.
5. Check ventilation parameters - if TWO FANS RUN, Turn-on MCP-AF1-VB1 and
MCP-AF3-VB1
6. Maintenance works to be carried out at TX-SS1-3
*
VOLTAGE =
0 at MCP-AF1-
VB1
ACB-B5 TRIP/
OPEN
(TRANSFORMER TX-SS1-3 (1250kVA FAIL):
Action PSS PLC:
1. Turn-off MCP-AF3-VB1 (Exhaust Fan-1)
2. Check TX-SS1-3 parameters, TRIP. ACB B5 OPEN. VCB-HT-SS1-4 OPEN.
3. Check power supply at ACB B3 - HEALTHY. Check ACBs B2, B6, B8 and B10
OPEN. If NO, ACB B4 remains OPEN.
4. Check if Tunnel can run with one number Supply Fan. If YES, alarm Toll-Plaza to
maintain/ restrict traffic flow. If NO, follow TRAFFIC CONTROL procedure to
restrict tunnel traffic so that it can run with one Supply/ Exhaust fan
*
Action by ITCS;
Alarm shall appear on ITCS; *
Alarm authentication by operator manually after confirmation from electrical
maintenance team.#
Mechanical barrier to closed position
vehicle redirected to the old road using information sign with VMS, DRIP
traffic external to tunnel stopped before entering inside tunnel, using TLTC on red
*

172
DEVICE LOCATION MODEALARM /
STATUSCAUSE
(EFFECT) AUTOMATIC ACTION FROM INTEGRATED TUNNEL
CONTROL (SCADA) OR MANUAL ACTION FROM OPERATORAUTOMATIC(*) / MANUAL(#)
light
traffic external to tunnel stopped before entering inside tunnel, using EVS on red
cross symbol
Alarm to toll plaza to stop toll collection and vehicle entry
Operator to broadcast message on FM radio & Emergency broadcast system
Emergency response team shall confirm on healthy condition and based on
confirmation ITCS operator shall reset the system.#
Maintenance works to be carried out at TX-SS1-3
VOLTAGE =
0 at MCP-AF2-
VB1
ACB-B7 TRIP/
OPEN
(TRANSFORMER TX-SS1-4 (1250kVA FAIL):
Action PSS PLC:
1. Turn-off MCP-AF4-VB1 (Exhaust Fan-2)
2. Check TX-SS1-4 parameters, TRIP. ACB B7 OPEN. VCB-HT-SS1-5 OPEN.
3. Check power supply at ACB B3 - HEALTHY. Check ACBs B2, B4, B8 and B10
OPEN. If YES, CLOSE ACB B6.
4. Power supply restored to MCP-AF2-VB1.
5. Check ventilation parameters - if TWO FANS RUN, Turn-on MCP-AF2-VB1 and
MCP-AF4-VB1.
6. Maintenance works to be carried out at TX-SS1-4
*
VOLTAGE =
0 at MCP-AF2-
VB1
ACB-B7 TRIP/
OPEN
(TRANSFORMER TX-SS1-4 (1250kVA FAIL):
Action PSS PLC:
1. Turn-off MCP-AF4-VB1 (Exhaust Fan-2)
2. Check TX-SS1-4 parameters, TRIP. ACB B7 OPEN. VCB-HT-SS1-5 OPEN.
3. Check power supply at ACB B3 - HEALTHY. Check ACBs B2, B4, B8 and B10
OPEN. If NO, ACB B6 remains OPEN.
4. Check if Tunnel can run with one number Supply Fan. If YES, alarm Toll-Plaza to
maintain/ restrict traffic flow. If NO, follow TRAFFIC CONTROL procedure to
restrict tunnel traffic so that it can run with one Supply/ Exhaust fan.
*
Action by ITCS;
Alarm shall appear on ITCS; *
Alarm authentication by operator manually after confirmation from electrical
maintenance team.#
Mechanical barrier to closed position
vehicle redirected to the old road using information sign with VMS, DRIP*

173
DEVICE LOCATION MODEALARM /
STATUSCAUSE
(EFFECT) AUTOMATIC ACTION FROM INTEGRATED TUNNEL
CONTROL (SCADA) OR MANUAL ACTION FROM OPERATORAUTOMATIC(*) / MANUAL(#)
traffic external to tunnel stopped before entering inside tunnel, using TLTC on red
light
traffic external to tunnel stopped before entering inside tunnel, using EVS on red
cross symbol
Alarm to toll plaza to stop toll collection and vehicle entry
Operator to broadcast message on FM radio & Emergency broadcast system
Emergency response team shall confirm on healthy condition and based on
confirmation ITCS operator shall reset the system.#
5. Maintenance works to be carried out at TX-SS1-4 *
VOLTAGE =
0 at MCP-AF3-
VB1
ACB-B9 TRIP/
OPEN
(TRANSFORMER TX-SS1-5 (1250kVA FAIL):
Action PSS PLC:
1. Turn-off MCP-AF1-VB1 (Supply Fan-1)
2. Check TX-SS1-5 parameters, TRIP. ACB B9 OPEN. VCB-HT-SS1-6 OPEN.
3. Check power supply at ACB B3 - HEALTHY. Check ACBs B2, B4, B6 and B10
OPEN. If YES, CLOSE ACB B6.
4. Power supply restored to MCP-AF3-VB1.
5. Check ventilation parameters - if TWO FANS RUN, Turn-on MCP-AF1-VB1 and
MCP-AF3-VB1.
6. Maintenance works to be carried out at TX-SS1-5
*
VOLTAGE =
0 at MCP-AF3-
VB1
ACB-B9 TRIP/
OPEN
(TRANSFORMER TX-SS1-5 (1250kVA FAIL):
Action PSS PLC:
1. Turn-off MCP-AF1-VB1 (Supply Fan-1)
2. Check TX-SS1-5 parameters, TRIP. ACB B9 OPEN. VCB-HT-SS1-6 OPEN.
3. Check power supply at ACB B3 - HEALTHY. Check ACBs B2, B4, B6 and B10
OPEN. If NO, ACB B8 remains OPEN.
4. Check if Tunnel can run with one number Supply Fan. If YES, alarm Toll-Plaza to
maintain/ restrict traffic flow. If NO, follow TRAFFIC CONTROL procedure to
restrict tunnel traffic so that it can run with one Supply/ Exhaust fan.
*
Action by ITCS;
Alarm shall appear on ITCS; *
Alarm authentication by operator manually after confirmation from electrical
maintenance team.#

174
DEVICE LOCATION MODEALARM /
STATUSCAUSE
(EFFECT) AUTOMATIC ACTION FROM INTEGRATED TUNNEL
CONTROL (SCADA) OR MANUAL ACTION FROM OPERATORAUTOMATIC(*) / MANUAL(#)
Mechanical barrier to closed position
vehicle redirected to the old road using information sign with VMS, DRIP
traffic external to tunnel stopped before entering inside tunnel, using TLTC on red
light
traffic external to tunnel stopped before entering inside tunnel, using EVS on red
cross symbol
Alarm to toll plaza to stop toll collection and vehicle entry
Operator to broadcast message on FM radio & Emergency broadcast system
*
Emergency response team shall confirm on healthy condition and based on
confirmation ITCS operator shall reset the system.#
5. Maintenance works to be carried out at TX-SS1-5 *
VOLTAGE =
0 at MCP-AF4-
VB1
ACB-B11 TRIP/
OPEN
(TRANSFORMER TX-SS1-6 (1250kVA FAIL):
Action PSS PLC:
1. Turn-off MCP-AF2-VB1 (Supply Fan-2)
2. Check TX-SS1-6 parameters, TRIP. ACB B11 OPEN. VCB-HT-SS1-7 OPEN.
3. Check power supply at ACB B3 - HEALTHY. Check ACBs B2, B4, B6 and B8
OPEN. If YES, CLOSE ACB B10.
4. Power supply restored to MCP-AF4-VB1.
5. Check ventilation parameters - if TWO FANS RUN, Turn-on MCP-AF2-VB1 and
MCP-AF4-VB1.
6. Maintenance works to be carried out at TX-SS1-6
*
VOLTAGE =
0 at MCP-AF4-
VB1
ACB-B11 TRIP/
OPEN
(TRANSFORMER TX-SS1-6 (1250kVA FAIL):
Action PSS PLC:
1. Turn-off MCP-AF2-VB1 (Supply Fan-2)
2. Check TX-SS1-6 parameters, TRIP. ACB B11 OPEN. VCB-HT-SS1-7 OPEN.
3. Check power supply at ACB B3 - HEALTHY. Check ACBs B2, B4, B6 and B8
OPEN. If NO, ACB B10 remains OPEN.
4. Check if Tunnel can run with one number Supply Fan. If YES, alarm Toll-Plaza to
maintain/ restrict traffic flow. If NO, follow TRAFFIC CONTROL procedure to
restrict tunnel traffic so that it can run with one Supply/ Exhaust fan.
*
Action by ITCS;
Alarm shall appear on ITCS; *

175
DEVICE LOCATION MODEALARM /
STATUSCAUSE
(EFFECT) AUTOMATIC ACTION FROM INTEGRATED TUNNEL
CONTROL (SCADA) OR MANUAL ACTION FROM OPERATORAUTOMATIC(*) / MANUAL(#)
Alarm authentication by operator manually after confirmation from electrical
maintenance team.#
Mechanical barrier to closed position
vehicle redirected to the old road using information sign with VMS, DRIP
traffic external to tunnel stopped before entering inside tunnel, using TLTC on red
light
traffic external to tunnel stopped before entering inside tunnel, using EVS on red
cross symbol
Alarm to toll plaza to stop toll collection and vehicle entry
Operator to broadcast message on FM radio & Emergency broadcast system
*
Emergency response team shall confirm on healthy condition and based on
confirmation ITCS operator shall reset the system.#
5. Maintenance works to be carried out at TX-SS1-6 *
VOLTAGE =
0 at MCP-AF3-
VB1
ACB-B9 TRIP/
OPEN
(FIRE INSIDE TUNNEL - TRANSFORMER TX-SS1-5 (1250kVA FAIL):
Action PSS PLC:
1. Check TX-SS1-5 parameters, TRIP. ACB B9 OPEN. VCB-HT-SS1-6 OPEN.
2. Check MCP-AF4-VB1 ACB B11 HEALTHY. If YES, Turn ON MCP-AF4-VB1.
3. Maintenance works to be carried out at TX-SS1-5
*
VOLTAGE =
0 at MCP-AF3-
VB1
ACB-B9 TRIP/
OPEN
(FIRE INSIDE TUNNEL - TRANSFORMER TX-SS1-5 (1250kVA FAIL):
Action PSS PLC:
1. Check TX-SS1-5 parameters, TRIP. ACB B9 OPEN. VCB-HT-SS1-6 OPEN.
2. Check MCP-AF4-VB1 ACB B11 HEALTHY. If NO, check power supply at ACB
B3 - HEALTHY. Check ACBs B2, B4, B6 and B10 OPEN. If NO, OPEN the
CLOSED Breaker. CLOSE ACB B8.
4. Power supply to MCP-AF3-VB1 restored
5. Turn-on MCP-AF3-VB1 and run Exhaust Fan-1 to 100% speed.
6. Maintenance works to be carried out at TX-SS1-5
*
PLC inside LT Panel MDB-SS5 NORMALNormal Mode (All Transformers HEALTHY at Technology Building):
ACB Nos B1, B3, B5, B7, B9, B11 CLOSE; B2, B4, B6, B8, B10 OPEN*
VOLTAGE =
0 at MDB-SS5
ACB-B1 TRIP/
OPEN
(TRANSFORMER TX-SS5-1 (750kVA FAIL):
Action PSS PLC:
1. Check TX-SS5-1 parameters, TRIP. ACB B1 OPEN. VCB-HT-SS5-2 OPEN.
2. Check power supply at ACB B3 - HEALTHY. Check ACBs B4, B6, B8 and B10
OPEN. If YES, CLOSE ACB B2.
*

176
DEVICE LOCATION MODEALARM /
STATUSCAUSE
(EFFECT) AUTOMATIC ACTION FROM INTEGRATED TUNNEL
CONTROL (SCADA) OR MANUAL ACTION FROM OPERATORAUTOMATIC(*) / MANUAL(#)
3. Power supply restored to MDB-SS5.
4. Maintenance works to be carried out at TX-SS5-1
VOLTAGE =
0 at MDB-SS5
ACB-B1 TRIP/
OPEN
(TRANSFORMER TX-SS5-1 (750kVA FAIL):
Action PSS PLC:
1. Check TX-SS5-1 parameters, TRIP. ACB B1 OPEN. VCB-HT-SS5-2 OPEN.
2. Check power supply at ACB B3 - HEALTHY. Check ACBs B4, B6, B8 and B10
OPEN - if any breaker CLOSE, ACB B2 remains OPEN.
3. Follow Tunnel Close-down procedure
*
Action by ITCS;
Alarm shall appear on ITCS; *
Alarm authentication by operator manually after confirmation from electrical
maintenance team.#
Mechanical barrier to closed position
vehicle redirected to the old road using information sign with VMS, DRIP
traffic external to tunnel stopped before entering inside tunnel, using TLTC on red
light
traffic external to tunnel stopped before entering inside tunnel, using EVS on red
cross symbol
Alarm to toll plaza to stop toll collection and vehicle entry
Operator to broadcast message on FM radio & Emergency broadcast system
*
Emergency response team shall confirm on healthy condition and based on
confirmation ITCS operator shall reset the system.#
4. Maintenance personnel to inspect TX-SS5-1 and restore power supply to MDB-SS5 *
VOLTAGE =
0 at MCP-AF1-
VB2
ACB-B5 TRIP/
OPEN
(TRANSFORMER TX-SS5-3 (1250kVA FAIL):
Action PSS PLC:
1. Turn-off MCP-AF3-VB2 (Exhaust Fan-1)
2. Check TX-SS5-3 parameters, TRIP. ACB B5 OPEN. VCB-HT-SS5-4 OPEN.
3. Check power supply at ACB B3 - HEALTHY. Check ACBs B2, B6, B8 and B10
OPEN. If YES, CLOSE ACB B4.
4. Power supply restored to MCP-AF1-VB2.
5. Check ventilation parameters - if TWO FANS RUN, Turn-on MCP-AF1-VB2 and
MCP-AF3-VB2
*

177
DEVICE LOCATION MODEALARM /
STATUSCAUSE
(EFFECT) AUTOMATIC ACTION FROM INTEGRATED TUNNEL
CONTROL (SCADA) OR MANUAL ACTION FROM OPERATORAUTOMATIC(*) / MANUAL(#)
6. Maintenance works to be carried out at TX-SS5-3
VOLTAGE =
0 at MCP-AF1-
VB2
ACB-B5 TRIP/
OPEN
(TRANSFORMER TX-SS5-3 (1250kVA FAIL):
Action PSS PLC:
1. Turn-off MCP-AF3-VB2 (Exhaust Fan-1)
2. Check TX-SS5-3 parameters, TRIP. ACB B5 OPEN. VCB-HT-SS5-4 OPEN.
3. Check power supply at ACB B3 - HEALTHY. Check ACBs B2, B6, B8 and B10
OPEN. If NO, ACB B4 remains OPEN.
4. Check if Tunnel can run with one number Supply Fan. If YES, alarm Toll-Plaza to
maintain/ restrict traffic flow. If NO, follow TRAFFIC CONTROL procedure to
restrict tunnel traffic so that it can run with one Supply/ Exhaust fan.
*
Action by ITCS;
Alarm shall appear on ITCS; *
Alarm authentication by operator manually after confirmation from electrical
maintenance team.#
Mechanical barrier to closed position
vehicle redirected to the old road using information sign with VMS, DRIP
traffic external to tunnel stopped before entering inside tunnel, using TLTC on red
light
traffic external to tunnel stopped before entering inside tunnel, using EVS on red
cross symbol
Alarm to toll plaza to stop toll collection and vehicle entry
Operator to broadcast message on FM radio & Emergency broadcast system
*
Emergency response team shall confirm on healthy condition and based on
confirmation ITCS operator shall reset the system.#
5. Maintenance works to be carried out at TX-SS5-3 *
VOLTAGE =
0 at MCP-AF2-
VB2
ACB-B7 TRIP/
OPEN
(TRANSFORMER TX-SS5-4 (1250kVA FAIL):
Action PSS PLC:
1. Turn-off MCP-AF4-VB2 (Exhaust Fan-2)
2. Check TX-SS5-4 parameters, TRIP. ACB B7 OPEN. VCB-HT-SS5-5 OPEN.
3. Check power supply at ACB B3 - HEALTHY. Check ACBs B2, B4, B8 and B10
OPEN. If YES, CLOSE ACB B6.
4. Power supply restored to MCP-AF2-VB2.
*

178
DEVICE LOCATION MODEALARM /
STATUSCAUSE
(EFFECT) AUTOMATIC ACTION FROM INTEGRATED TUNNEL
CONTROL (SCADA) OR MANUAL ACTION FROM OPERATORAUTOMATIC(*) / MANUAL(#)
5. Check ventilation parameters - if TWO FANS RUN, Turn-on MCP-AF2-VB2 and
MCP-AF4-VB2.
6. Maintenance works to be carried out at TX-SS5-4
VOLTAGE =
0 at MCP-AF2-
VB2
ACB-B7 TRIP/
OPEN
(TRANSFORMER TX-SS5-4 (1250kVA FAIL):
Action PSS PLC:
1. Turn-off MCP-AF4-VB2 (Exhaust Fan-2)
2. Check TX-SS5-4 parameters, TRIP. ACB B7 OPEN. VCB-HT-SS5-5 OPEN.
3. Check power supply at ACB B3 - HEALTHY. Check ACBs B2, B4, B8 and B10
OPEN. If NO, ACB B6 remains OPEN.
4. Check if Tunnel can run with one number Supply Fan. If YES, alarm Toll-Plaza to
maintain/ restrict traffic flow. If NO, follow TRAFFIC CONTROL procedure to
restrict tunnel traffic so that it can run with one Supply/ Exhaust fan.
*
Action by ITCS;
Alarm shall appear on ITCS; *
Alarm authentication by operator manually after confirmation from electrical
maintenance team.#
Mechanical barrier to closed position
vehicle redirected to the old road using information sign with VMS, DRIP
traffic external to tunnel stopped before entering inside tunnel, using TLTC on red
light
traffic external to tunnel stopped before entering inside tunnel, using EVS on red
cross symbol
Alarm to toll plaza to stop toll collection and vehicle entry
Operator to broadcast message on FM radio & Emergency broadcast system
*
Emergency response team shall confirm on healthy condition and based on
confirmation ITCS operator shall reset the system.#
5. Maintenance works to be carried out at TX-SS5-4 *
VOLTAGE =
0 at MCP-AF3-
VB2
ACB-B9 TRIP/
OPEN
(TRANSFORMER TX-SS5-5 (1250kVA FAIL):
Action PSS PLC:
1. Turn-off MCP-AF1-VB2 (Supply Fan-1)
2. Check TX-SS5-5 parameters, TRIP. ACB B9 OPEN. VCB-HT-SS5-6 OPEN.
3. Check power supply at ACB B3 - HEALTHY. Check ACBs B2, B4, B6 and B10
OPEN. If YES, CLOSE ACB B6.
*

179
DEVICE LOCATION MODEALARM /
STATUSCAUSE
(EFFECT) AUTOMATIC ACTION FROM INTEGRATED TUNNEL
CONTROL (SCADA) OR MANUAL ACTION FROM OPERATORAUTOMATIC(*) / MANUAL(#)
4. Power supply restored to MCP-AF3-VB2.
5. Check ventilation parameters - if TWO FANS RUN, Turn-on MCP-AF1-VB2 and
MCP-AF3-VB2.
6. Maintenance works to be carried out at TX-SS5-5
VOLTAGE =
0 at MCP-AF3-
VB2
ACB-B9 TRIP/
OPEN
(TRANSFORMER TX-SS5-5 (1250kVA FAIL):
Action PSS PLC:
1. Turn-off MCP-AF1-VB2 (Supply Fan-1)
2. Check TX-SS5-5 parameters, TRIP. ACB B9 OPEN. VCB-HT-SS5-6 OPEN.
3. Check power supply at ACB B3 - HEALTHY. Check ACBs B2, B4, B6 and B10
OPEN. If NO, ACB B8 remains OPEN.
4. Check if Tunnel can run with one number Supply Fan. If YES, alarm Toll-Plaza to
maintain/ restrict traffic flow. If NO, follow TRAFFIC CONTROL procedure to
restrict tunnel traffic so that it can run with one Supply/ Exhaust fan.
*
Action by ITCS;
Alarm shall appear on ITCS; *
Alarm authentication by operator manually after confirmation from electrical
maintenance team.#
Mechanical barrier to closed position
vehicle redirected to the old road using information sign with VMS, DRIP
traffic external to tunnel stopped before entering inside tunnel, using TLTC on red
light
traffic external to tunnel stopped before entering inside tunnel, using EVS on red
cross symbol
Alarm to toll plaza to stop toll collection and vehicle entry
Operator to broadcast message on FM radio & Emergency broadcast system
*
Emergency response team shall confirm on healthy condition and based on
confirmation ITCS operator shall reset the system.#
5. Maintenance works to be carried out at TX-SS5-5 *
VOLTAGE =
0 at MCP-AF4-
VB2
ACB-B11 TRIP/
OPEN
(TRANSFORMER TX-SS5-6 (1250kVA FAIL):
Action PSS PLC:
1. Turn-off MCP-AF2-VB2 (Supply Fan-2)
2. Check TX-SS5-6 parameters, TRIP. ACB B11 OPEN. VCB-HT-SS5-7 OPEN.
*

180
DEVICE LOCATION MODEALARM /
STATUSCAUSE
(EFFECT) AUTOMATIC ACTION FROM INTEGRATED TUNNEL
CONTROL (SCADA) OR MANUAL ACTION FROM OPERATORAUTOMATIC(*) / MANUAL(#)
3. Check power supply at ACB B3 - HEALTHY. Check ACBs B2, B4, B6 and B8
OPEN. If YES, CLOSE ACB B10.
4. Power supply restored to MCP-AF4-VB2.
5. Check ventilation parameters - if TWO FANS RUN, Turn-on MCP-AF2-VB2 and
MCP-AF4-VB2.
6. Maintenance works to be carried out at TX-SS5-6
VOLTAGE =
0 at MCP-AF4-
VB2
ACB-B11 TRIP/
OPEN
(TRANSFORMER TX-SS5-6 (1250kVA FAIL):
Action PSS PLC:
1. Turn-off MCP-AF2-VB2 (Supply Fan-2)
2. Check TX-SS5-6 parameters, TRIP. ACB B11 OPEN. VCB-HT-SS5-7 OPEN.
3. Check power supply at ACB B3 - HEALTHY. Check ACBs B2, B4, B6 and B8
OPEN. If NO, ACB B10 remains OPEN.
4. Check if Tunnel can run with one number Supply Fan. If YES, alarm Toll-Plaza to
maintain/ restrict traffic flow. If NO, follow TRAFFIC CONTROL procedure to
restrict tunnel traffic so that it can run with one Supply/ Exhaust fan.
*
Action by ITCS;
Alarm shall appear on ITCS; *
Alarm authentication by operator manually after confirmation from electrical
maintenance team.#
Mechanical barrier to closed position
vehicle redirected to the old road using information sign with VMS, DRIP
traffic external to tunnel stopped before entering inside tunnel, using TLTC on red
light
traffic external to tunnel stopped before entering inside tunnel, using EVS on red
cross symbol
Alarm to toll plaza to stop toll collection and vehicle entry
Operator to broadcast message on FM radio & Emergency broadcast system
*
Emergency response team shall confirm on healthy condition and based on
confirmation ITCS operator shall reset the system.#
5. Maintenance works to be carried out at TX-SS5-6 *
VOLTAGE =
0 at MCP-AF3-
ACB-B9 TRIP/
OPEN
(FIRE INSIDE TUNNEL - TRANSFORMER TX-SS5-5 (1250kVA FAIL):
Action PSS PLC:*
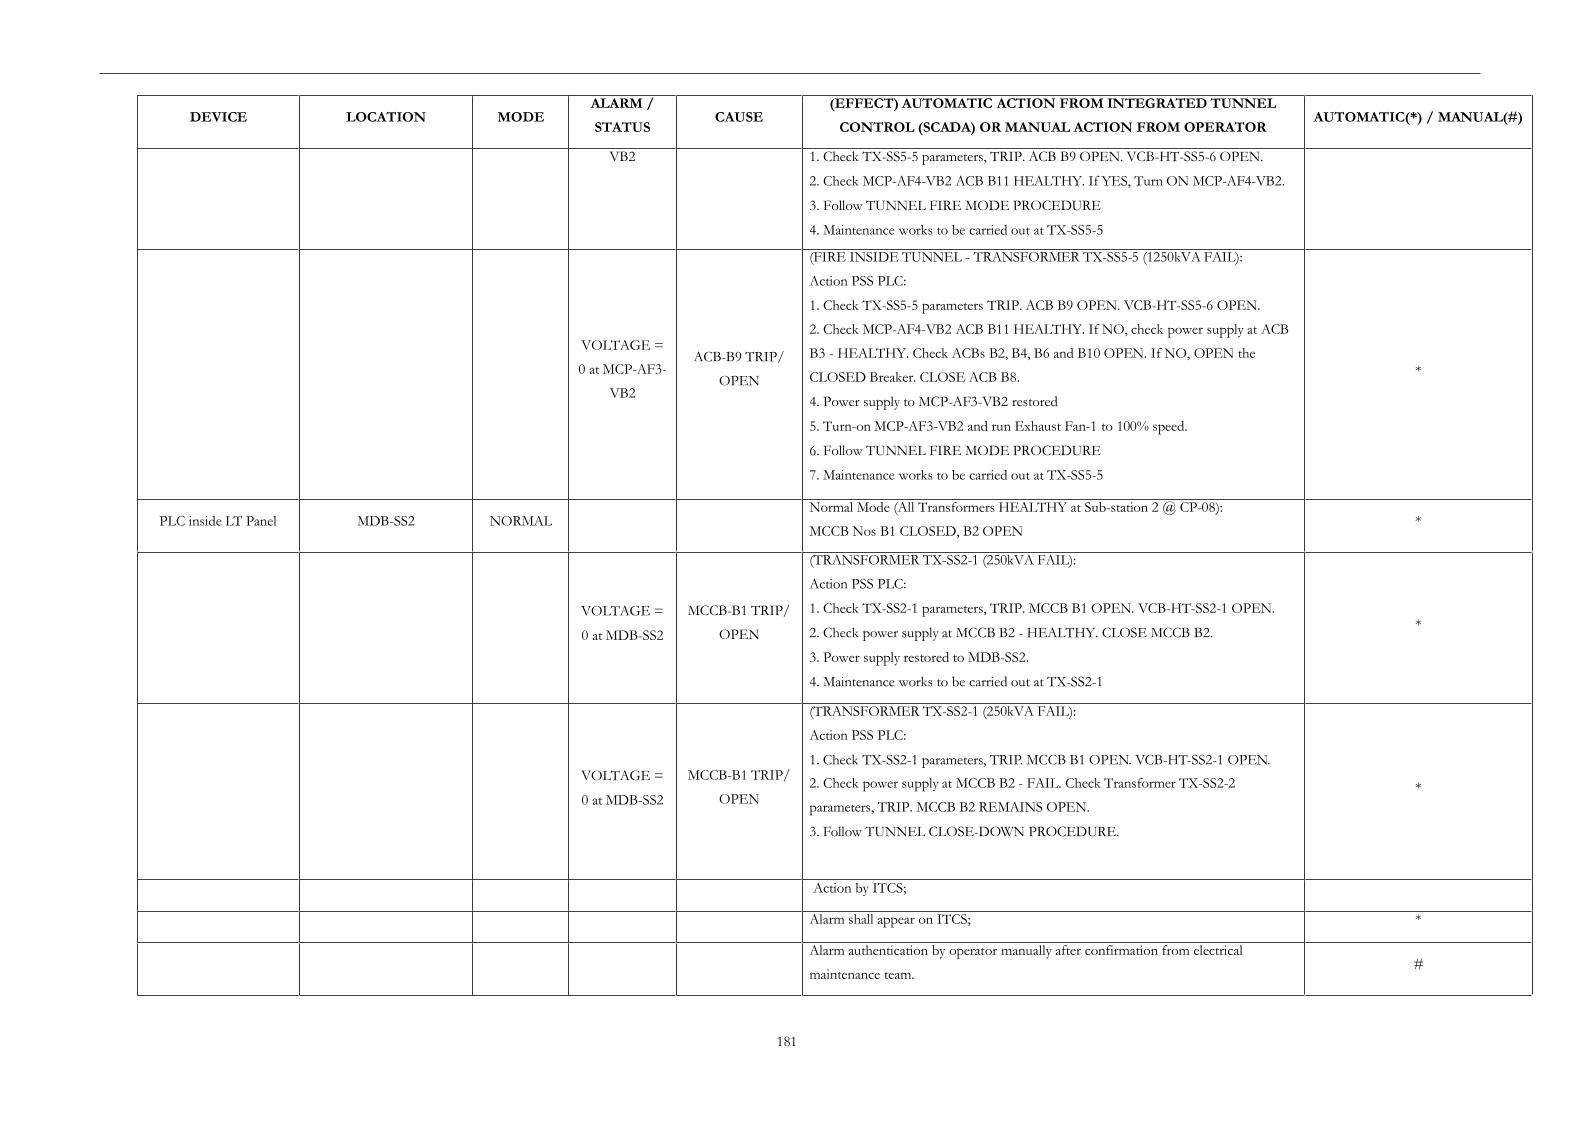
181
DEVICE LOCATION MODEALARM /
STATUSCAUSE
(EFFECT) AUTOMATIC ACTION FROM INTEGRATED TUNNEL
CONTROL (SCADA) OR MANUAL ACTION FROM OPERATORAUTOMATIC(*) / MANUAL(#)
VB2 1. Check TX-SS5-5 parameters, TRIP. ACB B9 OPEN. VCB-HT-SS5-6 OPEN.
2. Check MCP-AF4-VB2 ACB B11 HEALTHY. If YES, Turn ON MCP-AF4-VB2.
3. Follow TUNNEL FIRE MODE PROCEDURE
4. Maintenance works to be carried out at TX-SS5-5
VOLTAGE =
0 at MCP-AF3-
VB2
ACB-B9 TRIP/
OPEN
(FIRE INSIDE TUNNEL - TRANSFORMER TX-SS5-5 (1250kVA FAIL):
Action PSS PLC:
1. Check TX-SS5-5 parameters TRIP. ACB B9 OPEN. VCB-HT-SS5-6 OPEN.
2. Check MCP-AF4-VB2 ACB B11 HEALTHY. If NO, check power supply at ACB
B3 - HEALTHY. Check ACBs B2, B4, B6 and B10 OPEN. If NO, OPEN the
CLOSED Breaker. CLOSE ACB B8.
4. Power supply to MCP-AF3-VB2 restored
5. Turn-on MCP-AF3-VB2 and run Exhaust Fan-1 to 100% speed.
6. Follow TUNNEL FIRE MODE PROCEDURE
7. Maintenance works to be carried out at TX-SS5-5
*
PLC inside LT Panel MDB-SS2 NORMALNormal Mode (All Transformers HEALTHY at Sub-station 2 @ CP-08):
MCCB Nos B1 CLOSED, B2 OPEN*
VOLTAGE =
0 at MDB-SS2
MCCB-B1 TRIP/
OPEN
(TRANSFORMER TX-SS2-1 (250kVA FAIL):
Action PSS PLC:
1. Check TX-SS2-1 parameters, TRIP. MCCB B1 OPEN. VCB-HT-SS2-1 OPEN.
2. Check power supply at MCCB B2 - HEALTHY. CLOSE MCCB B2.
3. Power supply restored to MDB-SS2.
4. Maintenance works to be carried out at TX-SS2-1
*
VOLTAGE =
0 at MDB-SS2
MCCB-B1 TRIP/
OPEN
(TRANSFORMER TX-SS2-1 (250kVA FAIL):
Action PSS PLC:
1. Check TX-SS2-1 parameters, TRIP. MCCB B1 OPEN. VCB-HT-SS2-1 OPEN.
2. Check power supply at MCCB B2 - FAIL. Check Transformer TX-SS2-2
parameters, TRIP. MCCB B2 REMAINS OPEN.
3. Follow TUNNEL CLOSE-DOWN PROCEDURE.
*
Action by ITCS;
Alarm shall appear on ITCS; *
Alarm authentication by operator manually after confirmation from electrical
maintenance team.#

182
DEVICE LOCATION MODEALARM /
STATUSCAUSE
(EFFECT) AUTOMATIC ACTION FROM INTEGRATED TUNNEL
CONTROL (SCADA) OR MANUAL ACTION FROM OPERATORAUTOMATIC(*) / MANUAL(#)
Mechanical barrier to closed position
vehicle redirected to the old road using information sign with VMS, DRIP
traffic external to tunnel stopped before entering inside tunnel, using TLTC on red
light
traffic external to tunnel stopped before entering inside tunnel, using EVS on red
cross symbol
Alarm to toll plaza to stop toll collection and vehicle entry
Operator to broadcast message on FM radio & Emergency broadcast system
*
Emergency response team shall confirm on healthy condition and based on
confirmation ITCS operator shall reset the system.#
4. Maintenance works to be carried out at TX-SS2-1 *
PLC inside LT Panel MDB-SS3 NORMALNormal Mode (All Transformers HEALTHY at Sub-station 2 @ CP-08):
MCCB Nos B1 CLOSED, B2 OPEN*
VOLTAGE =
0 at MDB-SS3
MCCB-B1 TRIP/
OPEN
Mode-1 (TRANSFORMER TX-SS3-1 (250kVA FAIL):
Action PSS PLC:
1. Check TX-SS3-1 parameters, TRIP. MCCB B1 OPEN. VCB-HT-SS3-1 OPEN.
2. Check power supply at MCCB B2 - HEALTHY. CLOSE MCCB B2.
3. Power supply restored to MDB-SS3.
4. Maintenance works to be carried out at TX-SS3-1
*
VOLTAGE =
0 at MDB-SS3
MCCB-B1 TRIP/
OPEN
Mode-2 (TRANSFORMER TX-SS3-1 (250kVA FAIL):
Action PSS PLC:
1. Check TX-SS3-1 parameters, TRIP. MCCB B1 OPEN. VCB-HT-SS3-1 OPEN.
2. Check power supply at MCCB B2 - FAIL. Check Transformer TX-SS3-2
parameters, TRIP. MCCB B2 REMAINS OPEN.
3. Follow TUNNEL CLOSE-DOWN PROCEDURE.
*
Action by ITCS;
Alarm shall appear on ITCS; *
Alarm authentication by operator manually after confirmation from electrical
maintenance team.#
Mechanical barrier to closed position
vehicle redirected to the old road using information sign with VMS, DRIP
traffic external to tunnel stopped before entering inside tunnel, using TLTC on red
*

183
DEVICE LOCATION MODEALARM /
STATUSCAUSE
(EFFECT) AUTOMATIC ACTION FROM INTEGRATED TUNNEL
CONTROL (SCADA) OR MANUAL ACTION FROM OPERATORAUTOMATIC(*) / MANUAL(#)
light
traffic external to tunnel stopped before entering inside tunnel, using EVS on red
cross symbol
Alarm to toll plaza to stop toll collection and vehicle entry
Operator to broadcast message on FM radio & Emergency broadcast system
Emergency response team shall confirm on healthy condition and based on
confirmation ITCS operator shall reset the system.#
4. Maintenance works to be carried out at TX-SS3-1 *
PLC inside LT Panel MDB-SS4 NORMALNormal Mode (All Transformers HEALTHY at Sub-station 2 @ CP-08):
MCCB Nos B1 CLOSED, B2 OPEN*
VOLTAGE =
0 at MDB-SS4
MCCB-B1 TRIP/
OPEN
(TRANSFORMER TX-SS4-1 (250kVA FAIL):
Action PSS PLC:
1. Check TX-SS4-1 parameters, TRIP. MCCB B1 OPEN. VCB-HT-SS4-1 OPEN.
2. Check power supply at MCCB B2 - HEALTHY. CLOSE MCCB B2.
3. Power supply restored to MDB-SS4.
4. Maintenance works to be carried out at TX-SS4-1
*
VOLTAGE =
0 at MDB-SS4
MCCB-B1 TRIP/
OPEN
(TRANSFORMER TX-SS4-1 (250kVA FAIL):
Action PSS PLC:
1. Check TX-SS4-1 parameters, TRIP. MCCB B1 OPEN. VCB-HT-SS4-1 OPEN.
2. Check power supply at MCCB B2 - FAIL. Check Transformer TX-SS4-2
parameters, TRIP. MCCB B2 REMAINS OPEN.
3. Follow TUNNEL CLOSE-DOWN PROCEDURE.
*
Action by ITCS;
Alarm shall appear on ITCS; *
Alarm authentication by operator manually after confirmation from electrical
maintenance team.#
Mechanical barrier to closed position
vehicle redirected to the old road using information sign with VMS, DRIP
traffic external to tunnel stopped before entering inside tunnel, using TLTC on red
light
traffic external to tunnel stopped before entering inside tunnel, using EVS on red
cross symbol
*

Vi a CAT6
T
8.14.8 System Architecture of Emergency Call System
F
Vi a CAT6
184
Vi a CA
Teleph oneS e rv e r Vi a CAT6
FiberRi ng-A
NW Swi tc h
iber Ri ngA-
SYSTEM ARCHITECTURE FOR EMERGENCY CALL SYSTEM (ECS)
TCC BCC
M ain Em er genc yRed unda nt Em er genc y
elephon eSer v e r
ITCS SCAD A W or ks tat ion (M MI) ITCS SCAD A W orks tat io n (MM I)
M ain I TCSSCA DA Server R edundant ITCS SCA DA Ser ver
Vi a CAT6
Vi a CAT6
Vi a CAT6 Vi aCAT6
Fiber Ri ng -B
Fiber Ring -A
EM E RG EN CY CAL L EM ER G EN CY C ALL SYS TEM SWIT CH BO ARD S YST EM SWITC
HB OA RD
FiberRin g-A
Fiber Ring B-
Fi ber Ring -B Fib erRi
ng-B Vi aCAT 6
Vi a CAT6 Vi aCAT6
Em er ge n c y Ca ll Eme rg e ncy Ca llSp e ak erphone Sp e ake rphone w ith three with three PushButot ns at SO S Pu shButtons a t SOS Bo x 1 Bo x 1 6
DEVICE LOCATION MODEALARM /
STATUSCAUSE
(EFFECT) AUTOMATIC ACTION FROM INTEGRATED TUNNEL
CONTROL (SCADA) OR MANUAL ACTION FROM OPERATORAUTOMATIC(*) / MANUAL(#)
Alarm to toll plaza to stop toll collection and vehicle entry
Operator to broadcast message on FM radio & Emergency broadcast system
Emergency response team shall confirm on healthy condition and based on
confirmation ITCS operator shall reset the system.#
4. Maintenance works to be carried out at TX-SS4-1 *
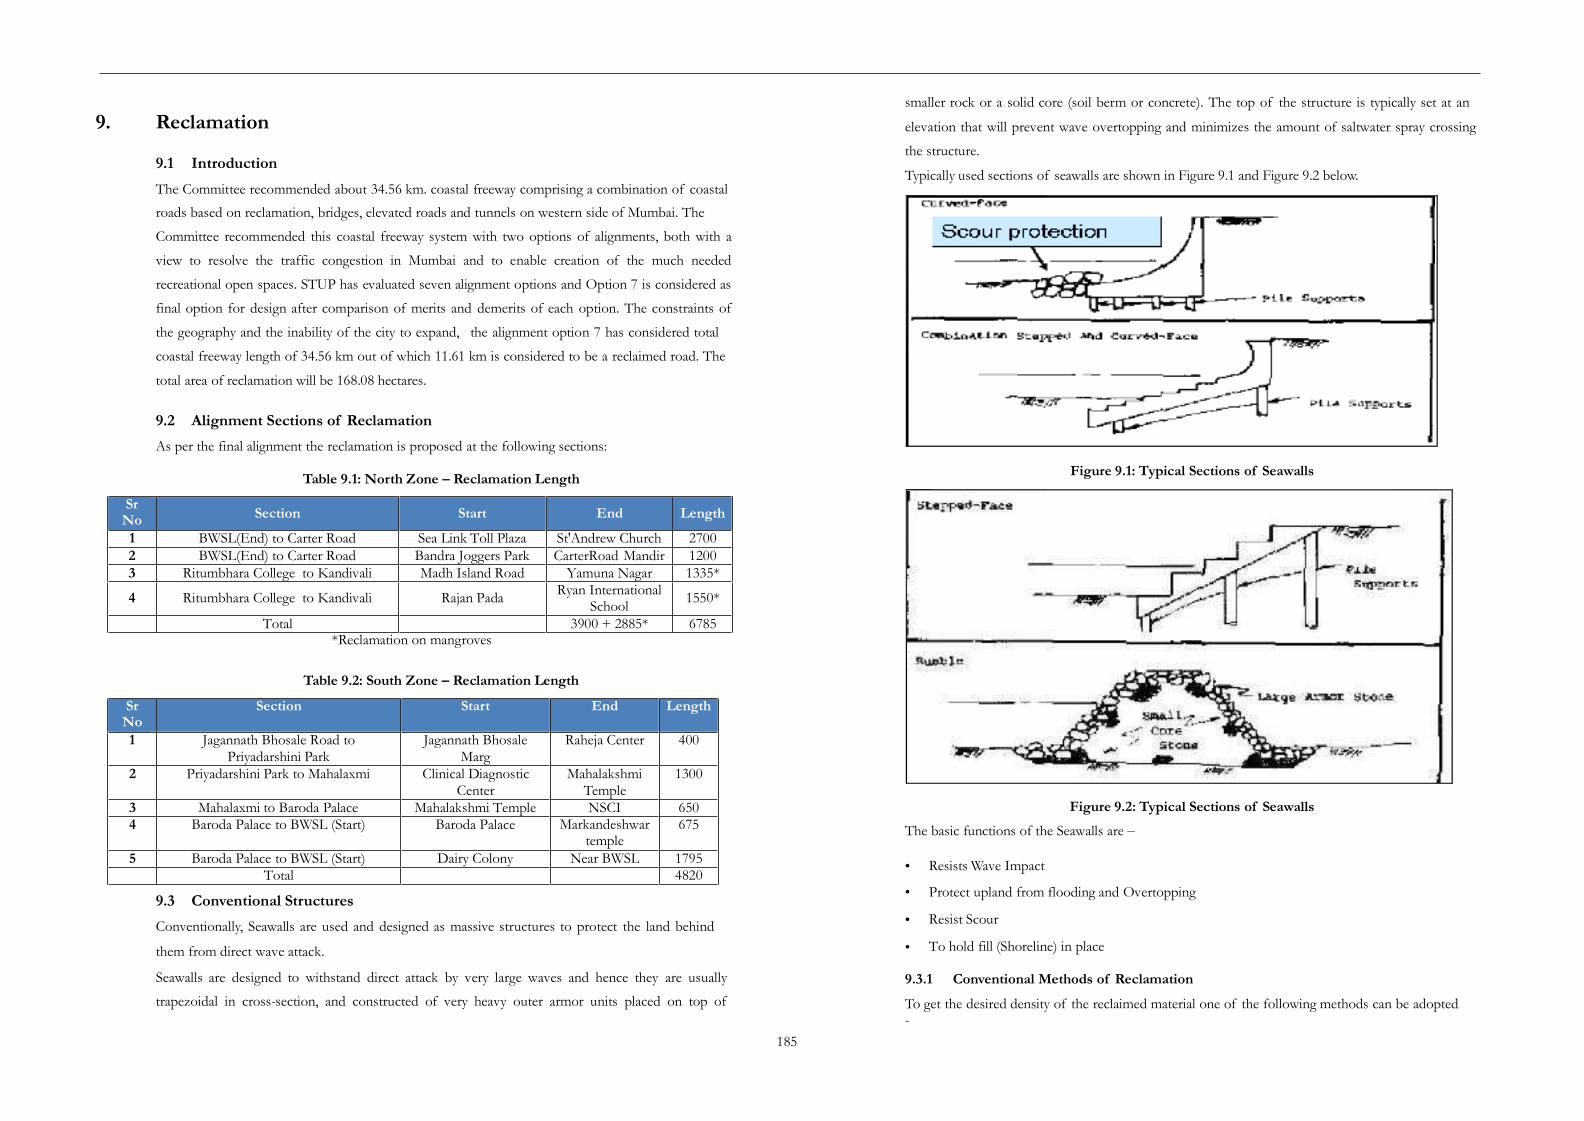
smaller rock or a solid core (soil berm or concrete). The top of the structure is typically set at an
elevation that will prevent wave overtopping and minimizes the amount of saltwater spray crossing
the structure.
Typically used sections of seawalls are shown in Figure 9.1 and Figure 9.2 below.
9. Reclamation
9.1 Introduction
The Committee recommended about 34.56 km. coastal freeway comprising a combination of coastal
roads based on reclamation, bridges, elevated roads and tunnels on western side of Mumbai. The
Committee recommended this coastal freeway system with two options of alignments, both with a
view to resolve the traffic congestion in Mumbai and to enable creation of the much needed
recreational open spaces. STUP has evaluated seven alignment options and Option 7 is considered as
final option for design after comparison of merits and demerits of each option. The constraints of
the geography and the inability of the city to expand, the alignment option 7 has considered total
coastal freeway length of 34.56 km out of which 11.61 km is considered to be a reclaimed road. The
total area of reclamation will be 168.08 hectares.
9.2 Alignment Sections of Reclamation
As per the final alignment the reclamation is proposed at the following sections:
Figure 9.1: Typical Sections of SeawallsTable 9.1: North Zone – Reclamation Length
*Reclamation on mangroves
Table 9.2: South Zone – Reclamation Length
Figure 9.2: Typical Sections of Seawalls
The basic functions of the Seawalls are –
•
•
•
•
Resists Wave Impact
Protect upland from flooding and Overtopping
Resist Scour
To hold fill (Shoreline) in place
9.3 Conventional Structures
Conventionally, Seawalls are used and designed as massive structures to protect the land behind
them from direct wave attack.
Seawalls are designed to withstand direct attack by very large waves and hence they are usually
trapezoidal in cross-section, and constructed of very heavy outer armor units placed on top of
9.3.1 Conventional Methods of Reclamation
To get the desired density of the reclaimed material one of the following methods can be adopted-
185
SrNo
Section Start End Length
1 Jagannath Bhosale Road toPriyadarshini Park
Jagannath BhosaleMarg
Raheja Center 400
2 Priyadarshini Park to Mahalaxmi Clinical DiagnosticCenter
MahalakshmiTemple
1300
3 Mahalaxmi to Baroda Palace Mahalakshmi Temple NSCI 650
4 Baroda Palace to BWSL (Start) Baroda Palace Markandeshwar temple
675
5 Baroda Palace to BWSL (Start) Dairy Colony Near BWSL 1795
Total 4820
SrNo
Section Start End Length
1 BWSL(End) to Carter Road Sea Link Toll Plaza St'Andrew Church 2700
2 BWSL(End) to Carter Road Bandra Joggers Park CarterRoad Mandir 1200
3 Ritumbhara College to Kandivali Madh Island Road Yamuna Nagar 1335*
4 Ritumbhara College to Kandivali Rajan PadaRyan International
School1550*
Total 3900 + 2885* 6785

Place the material and compact in layers
This method will be feasible if the height of reclamation is less. The dredge fill / borrow fill shall be
placed in layers of 300 mm / 500 mm and shall be compacted in layers. However, if the height of
reclamation is high or if the compaction is required below the water level this method will not be
feasible.
Use of Vibro-compaction
In this method the desired degree of compaction is achieved by vibrations produced by probe.
Vibro-compaction can be done for the loose sandy deposits having less than 15% of fines for depths
up to 10 m. Compaction is carried out by inserting the probe up to the design depth of improvement
and allowing the soil around the probe to get compacted for certain time interval. Then the probe is
raised by about 0.5m to compact the soil around the vibrator and the process is repeated.
Use of Preload with Prefabricated Vertical Drains (PVDs)
This method may be useful when the percentage fines is more and height of reclamation is high. In
this method the drains are installed into the fill by stitcher and the preload is applied above the
reclamation. The application of load drains out the pore water through the drains and the
densification is achieved. However the handling of preload is a major concern in this method.
The choice of the method will depend on
–
Type of material used for reclamation – Sand or Fly Ash
Time available
Height of reclamation
The major problems involved in the reclamation by conventional methods, are – Heavy magnitude
of filling material and armour stones of specific size and weights requires more construction time
the tubes can be either dumped in position similar to the Geotextile containers or can be filled in
position with the help of divers. This decision depends on the wave nature and wave height, the
possibility of fewer disturbances to the barge during installation would be criteria in selection of
placing technique. If the disturbances and wave heights are more than dumping the Geotextile tubes
in position using split barge would be the appropriate method of installation
The Filling ports are sewn together with proper thread through which discharge pipe is inserted.
Since the tubes are being installed underwater, temporary guides or stacks are installed on either side
of the tube. Once the tube is secured with anchorages along the proper alignment the slurry is filled
into the tube from the filing ports. The slurry contains 5-15 % of sand and the filling is carried out as
per the pressure required. The fill ports are closed once the tube is filled up to its desired height and
the top of the port is sewed or tied up. Once the bottom tube is filled and it achieves its desired
height after consolidation the hydraulic filling of second tube is started.
9.4 Modern Methods of Reclamation
Considering the problems involved in the conventional methods of reclamation, the other options
can be considered for reclamation are –
Use of Geotubes or Geotextile Tubes
Geotextile tubes are tubular containers that are formed in situ on land or in water. Geotextile tubes
are laid out and filled on site to their required geometrical form. The tubes are filled by hydraulically
pumping fill into the tube. Geotextile tubes range in size from 1m to 5m in diameter, and up to 50m
in length.
The Geotextile tubes are factory made tubular units which are supplied at site in lay flat manner. The
tubes have filler ports at the top in order to fill the sand hydraulically into the tubes. The sand
required for slurry preparation should be fine sand with % fines passing standard 600 micron sieve,
should be less than 15%. The sand used for the sand slurry, should be free from organic matter and
other toxic impurities. The reasons for using sand in this type of fill are, fill can be placed with good
density for hydraulic fill and it has good internal shear strength. Once filled the Geotextile tube
behaves as mass gravity unit and can be considered in the designs accordingly. In this particular case
The typical section considering the Geotubes is shown below.
Use of Geobags or Geotextile bags
186

Geotextile bags are small volume containers that are filled on land or above water and then pattern-
placed either near water or below water level. The function of these bags is similar to Geotextile
tubes but the smaller size makes the ease in handling, placing and anchoring.
The typical section considering the Geobags is shown below
Based on the geotechnical investigations, for majority of the area hard rock is available at surface,
over which the proposed sea wall can be constructed.
9.5 Methods of treatment for sub-soil improvement
9.5.1 Improvement by increasing the strength
In this technique the improvement is achieved by increasing the in-situ stress within the soil mass.
The methods such as excavate and replace the in-situ soil with good engineering material or provide
surcharge at the toe of the slope or embankment are used for this purpose. These are the simplest
method to execute and cost effective solutions where the depth of treatment is less (i.e. 2 – 3 m) and
the improvement ratio is small.
In this method the soil is excavated up to the required depth. The excavated portion is then
backfilled with the good engineering material. The backfilling is done in layers of 150 / 200 mm
thickness and compacted. The next layer is placed and compacted and the excavated area is
backfilled up to OGL.
This is very fast and economical method. However the disadvantages with this technique are that
while excavation the precautions are required to take care of dewatering or stability of adjacent
structures if any. The disposal of excavated material is also major problem.The construction of sea wall needs to be undertaken as an independent activity and then muck from
tunnel construction either for the Coastal Road or planned Metro Line Phase-3 and phase 4 shall be
used to back fill behind the walls. The quantity of tunnel muck expected from Coastal Road is 3.0
million cubic meter, whereas the expected quantity required for the project is in the range of 8.0
million cubic meter. Hence the rest of the quantity shall be procured from the tunnel construction
for phase-3 and phase 4 metro rail projects.
A option of sea wall is proposed through precast caisson type of segmental wall. As shown in figure-
--. The precast sections shall be constructed on main land and would have to be transported to the
site using barges requiring temporary jetties to be constructed near casting yard and point of delivery.
Precast units shall be lifted through cranes and placed at ready platform and filled with suitable
material. These units will be constructed to have locking arrangements with adjoining sections.
9.5.2 Improvement by Densification
The principle involved in this technique is that the soil particles are rearranged to tighter
configuration and density increased. The densification can be achieved by way of vibrations /
impact. The densification of weak soil increases the ability of soils to carry the loads safely.
The Dynamic Compaction is method which can be adopted to increase the safe bearing capacity of
the existing soil. Dynamic Compaction also helps to reduce the liquefaction Potential. Dynamic
Compaction is useful in silty / sandy deposits present upto a depth of 5 to 7 m. This method is also
less expensive, faster and easy to construct for large plan area.
Dynamic Compaction involves the application of high levels of impact energy at the ground surface.
The energy is applied by raising and dropping a dead weight of 10 to 50 T from heights of 5 to 30 m.
The energy is applied in grid pattern and alternate passes are given to achieve the required
densification.
9.5.3 Improvement by drainage
For the soils with low permeability, this technique is very useful, where the high permeability
drainage elements are installed to decrease the drainage path in soil mass and providing the faster
rate of dissipation for excess pore pressure.
Use of Prefabricated Vertical Drains (PVD) or Band Drains and Stone Columns are two methods
which can be considered for improvement by drainage.
The construction of stone columns involves partial replacement of weak soil with the stones
(aggregates). The stones are compacted by ramming or vibrations. General practice is to replace 15 –
187

35 % of weak soil by stones. The installation of stone column creates a composite material ofoverall
lower compressibility and higher shear strength than the virgin weak soil. Also as stones are free
draining material helps to drain the pore water and reduces the possibility of liquefaction.
When the soft clays are present up to a greater depth, the treatment is required to increase the safe
bearing capacity, reduce the settlements and accelerate the time required to achieve these settlements.
This can be achieved by providing Prefabricated Vertical drains (PVD) or Band Drains.
In soft Clays the time required to expel the pore water is very high due to very low permeability of
soils. However, the permeability or in turn coefficient of consolidation in horizontal direction is 1 to
3 times more than in the vertical direction. The use of band drains reduces the drainage path and also
helps the consolidation in vertical as well as horizontal direction. The combined effect of the same
reduces the time required for the settlements drastically. The time required for consolidation in soft
clays is usually 3 to 20 years which can be reduced to 6 to 12 months depending on the spacing of
band drains.
Table 9.3: Normal Temperature Range (0C)
9.6 Design
Design of reclamation will depend upon the following:
•
•
•
•
•
•
•
•
•
•
Height of reclamation
Design wave height
Properties of proposed fill
Wave Period
Slope angle of bed
Depth of the water
Wind Direction
Wave Direction (Monsoon Period, Non Monsoon Period)
Wave Velocity (m/sec)
Beach Material (Sand Gradation from D10 – D90)
From the above observations, it may conclude that hottest months in the year are April, May and
June, When the temperature reaches about 370 C. The temperature is optimum.
Wind:
Prevailing wind direction is from NW. Seasonal variation in the wind speed and direction is given in
the following table:
Table 9.4: Seasonal Wind distribution
Substantial 40 to 62 kmph9.7 Marine Aspects of Coastal Road
Substantial 7 to 50 kmph9.7.1 Meteorological data:
Temperature
Range of variation: The diurnal range of temperature is around 4deg centigrade.
The maximum temperature recorded in the island of Mumbai is Max. 42.2 and min.7.4.
Humidity
Range of variation: The diurnal range of humidity is around 50%
Max. is 95% in July and Min. 86% around Jan around the year
Visibility
In general, on the West Coast, above latitude 160 N mist sometimes develops during sunrise but
disperses thereafter. At Mumbai from November to March smog hangs over the land, obscuring
188
Month Direction Speed
Feb – May NWMax. 62 to 102 kmphSubstantial 20 to 50 kmph
June – Sep WNWMax. 62 to 102 kmph
Oct – Jan NNWMax. 40 to 62 kmph
Month Maximum Minimum
January 31 16
February 32 17
March 33 21
April 33 24
May 34 26
June 32 26
July 30 25
August 29 25
September 30 24
October 33 23
November 33 21
December 32 18

everything in view. This happens only for short periods most often shortly after sunrise but also
occasionally in the evenings. Visibility is generally good for most part of the year.
Rainfall
Nearly all the rainfall in Mumbai occurs in the SW monsoon. Average Rainfall in the Mumbai is as
tabulated below:
Admiralty chart:
Table 9.4: Monthly Rainfall
Cyclones
These may occur in the period of May/June or October/November. The storms are mostly confined
to the months of June and September, and the months of July and August are almost free of storms.
The last severe cyclonic storm having winds of above 48 knots was experienced in 1982.
Occasionally, sudden high winds also occur during the fine weather periods, from the NE direction.
Oceanographic Condition:
189
Month Rainfall (mm)
January 15.1
February 1
March 0.1
April 0.5
May 20.6
June 504.2
July 819.4
August 546.8
September 325.2
October 81.1
November 113.2
December 4.1

Tides:
The Project Datum Level is Chart Datum as defined by the Bombay Port Authority measured by the
tide gauge located at Apollo Bunder. All land and sea levels in construction work shall be set out
relative to Chart Datum. The relationships between Chart Datum, sea levels and infrastructure levels
shall be taken as :-
The tidal flow is unsteady and the magnitude and direction of the currents varies with respect to
location, time and depth. Generally, the ebb currents are stronger than flood currents.
Siltation:
The average rate of siltation shall be taken as 3mm per day. The maximum rate of Siltation will occur
during monsoon months and will be taken as 7mm per day. The siltation is maximum during the
monsoon seasons. The rate reduces in the month‘s preceding and succeeding the monsoon. In the
rest of months the phenomenon reverses and erosion occurs to a similar extent of siltation. The net
effect of siltation over the entire year is minimal.
LittoralDrift
Longshore drift consists of the transportation of sediments (clay, silt, sand and shingle) along a coast
at an angle to the shoreline, which is dependent on prevailing wind direction, swash and backwash.
This process occurs in the littoral Zone, and in or close to the surf zone. The process is also known
as littoral drift, long-shore current or long-shore transport.
Recent changes seen in sea behaviour patters:
•
•
•
•
•
•
•
•
Highest recorded tide (HRT) + 5.040 CD
Highest astronomical tide (HAT) + 5.400 CD
Mean High Water Springs (MHWS) + 4.420 CD
Mean High Water Neaps (MHWN) +3.300 CD
Mean Sea Level (MSL) + 2.510 CD
Mean Low Water Neaps (MLWN) +1.860 CD
Mean Low Water Springs (MLWS) + 0.760 CD
Lowest Low Water Recorded (-) 0.46CD
The chart datum is 2.51m below the GTS benchmark.
adjusted to GTS datum are as below:
The CD levels mentioned above when
Table 9.5: Net Sea- level rise trends from past tide gauge data
•
•
•
•
•
•
•
•
Highest recorded tide (HRT) + 2.53 R.L.
Highest astronomical tide (HAT) + 2.89 R.L.
Mean High Water Springs (MHWS) + 1.91 R.L.
Mean High Water Neaps (MHWN) +0.79 R.L.
Mean Sea Level (MSL) + 0.00 R.L.
Mean Low Water Neaps (MLWN) - 0.65 R.L.
Mean Low Water Springs (MLWS) - 1.75 R.L.
Lowest Low Water Recorded - 2.97 R.L.
Waves:
The predominant waves are the swell waves generated by deep sea storms. These mainly arise just
before and during the South West monsoon. The statistical analysis indicates that most wave periods
fall between 6 seconds and 10 seconds. During the continuance of the North-East monsoon, North-
Easterly winds known as "Elephantas" blow for short durations during the months of October-
November. Significant Wave height with return period of 100years for the Mumbai coast shall be
taken as 4.5m. (Ref. Indan Journal of Marine Sciences Issue: June 1991).
Current
In December and January sets north-westerly with the rates of upto 1knot. In July and August, when
the S W Monsoon is well established, south easterly sets with rates of upto 2 Knots are experienced.
Exceptionally onshore sets of upto 1.5Knots are experienced during the N E Monsoon and upto
3Knots during the S W Monsoon.
Sea Level Changes – past, present and future
190
No of Years of data
Trends(mm/Year)
GIA (Glacial IsostaticAdjustment) Corrections
Net Sea level rise (mm/Yr)
133 0.77 -0.43 1.20

Table 9.6: Matrix showing Structures inserted and effects on marine environment
Gymkhana, 4.Islam Gymkhana, 5.Hindu Gymkhana,
8.Zaver Mansion, 9.Wilson College
2. Mahalaxmi
Breakwater may be
link toll plaza
2.19/19-A Cartar Road
Khar danda
in the Design of Bridge.
191
Sr. No
SectionProposed
support for road
Effect on wave energy Access for fishing boatsObstruction to
fish landing points
Presence of fishing villages
Area of religious activity along the
shoreMangroves Heritage monument in the vicinity
1 Section -1 Tunnel NoneAccess of fishing boats to sea should be considered in the Design of Bridge.
Alternative route is required.
Manora
Ganpati Imersion/Religious area nearGirgaon Chowpati
No evident dense MangroveVisible.
1.Govind Mahal, 2.Parijat, Meghdoot, 3.Parsi.
6.Wilson College, 7.Police Gymkhana Ground,
2 Section -2Land filled
Road
Energy absorption measures i.e.
Breakwater may be required
Not applicableNo landing
points are visibleNot in close
vicinity MahalaxmiNo evident dense Mangrove
Visible.1.Lincoln House
3 Section -3Land Filled Road and
Bridge on Sea
Partially reflects energy / Breakwater
may be required
Not applicableNo landing
points are visibleNot in close
vicinityHaji Ali
No evident dense MangroveVisible.
1. Haji Ali
4 Section -4
Land FilledRoad and
Energy absorption measures i.e.
required for Land filled Road. . Not applicable
No landing points are visible
Not in close vicinity
Baroda PalaceNo evident dense Mangrove
Visible.Not applicable
2nos of Bridges on
Sea
Reflects the Energy in the Pile Foundation
Locations
5 Section -5
Land filled Road, Bridge
and Land filled Road
on Mangroves
Energy absorption measures i.e.
Breakwater may be required for Land
filled Road.
Access of fishing boats to sea should be considered in the Design of Bridge.
Alternative arrangement during the
construction stage is required.
Bandra Worli sea
Bandra Band Stand, Chambai
Village, near
village
DandeshwarShankar Mandir
Evidence of Mangrove Observed1.Kekee Manzil
3.Dandeshwar Shankar Mandir
6 Section -6 Tunnel
Flow of under bottom currents required during Detailed Design Stage
Access of fishing boats to sea should be considered Juhu Sea Garden Not applicable Evidence of Mangrove Observed Theosophical society precincts
7 Section -7Land filled
RoadRoad on Land side Not applicable Not applicable
Not in close vicinity
Not applicable Evidence of Mangrove Observed Not applicable

10. Environmental Impact Assessmentapplicability
10.1 Introduction
This section covers the feasibility of preparing an Environment Impact Assessment Report for
Mumbai Coastal Road Project.
10.2 Role of Environment screening into the overall project preparation
The environmental screening exercise is undertaken to determine the key environmental
issues/concerns and the nature and magnitude of the potential environmental impacts that are likely
to arise on account of proposed project interventions. The major or key environmental issues to be
identified will be determined by the type, location, sensitivity and scale of the project. The
results/findings from this exercise are/will be used to determine:
The extent and type of Environmental (Impact) Assessment requirement
The environmental category of the project/sub-project
The screening result will also be an important input for analyzing the ‗feasibility‘ of the project/sub-
project along with engineering/economics and social criteria.
10.3 Legal Framework
In 1976, the 42nd Constitutional Amendment introduced Article 48A and 51A, placing an obligation
on every citizen of the country to attempt to conserve the environment. The
legal framework
for environmental issues related to road projects can be best described as National level and State
level legislation:
The Government of India has laid out various policy guidelines, acts and regulations pertaining to
sustenance of environment. The Environment (Protection) Act, 1986 provides umbrella legislation
for the protection of environment. As per this Act, the responsibility to administer the legislation has
been jointly entrusted to the Central Ministry of Environment and Forests (MOEF) and the Central
Pollution Control Board (CPCB) / State Pollution Control Board (SPCB).
The lists of all applicable Government of India / State Government regulations are provided below
with most relevant details. 10.4 List of Vulnerable Eco-system Components
Following is a list of important ecosystem components that were identified as the valued eco system
in the stretch during the field survey.Table 10.1:Summary of Applicable Regulations
•
•
•
•
•
•
•
On-shore /off-shore marine bio-diversity
Impact on terrestrial and aquatic marine bio-diversity
Mangrove Forests
Impact on flora and fauna. Considered as reserve forest in Maharashtra.
Road side Plantations
Disturbance of flora having fruit bearing and fodder capability,
Land
192
Sl. No
Applicable GOI Policies & Regulations
Year ObjectiveReason for applicability
1 Environmental (protection) Act
1986 To protect and improve overall environment
Environment in general
2 Environment ImpactAssessment (EIA) notification
1994 Requirement of Environmental impact
Assessment
Direct
3 Environment ImpactAssessment (EIA) notification
2006/20092013
For impact assessment of infrastructure projects
Environmental clearance
Sl.
No
Applicable GOI
Policies & RegulationsYear Objective
Reason for
4. Coastal Regulation ZoneNotification
2011 To conserve and protect coastal stretches, its unique, environment and its marine
area
CRZ Clearance
4 Air (prevention and control of pollution) Act as amended in
1987
1981 To control air pollution by controlling emission and air
pollutants according to prescribed standards
Air pollution
5 Water (Prevention and Control of Pollution) Act and Cess Act of 1977 as amended
in 1988
1974 To control water pollution by controlling emission & Water
pollutants as per the prescribed standards
Water pollution
6 Indian Forest (Conservation) Act
1980 Protection of Mangrove forests
Forests
7 The Wildlife (Protection) Act 1972 Protection of Wild Life Wildlife
8 Ancient Monuments and Archaeological sites &
Remains Act
1958 Conservation of Cultural and Historical remains found in
India
Archaeological remains
9 The Land Acquisition Act 1894 &1989
Set out rule for acquisition of land by Government. Land
acquisition
10 Noise Pollution (Regulation and Control) rules 2000
2001 Noise pollution regulation and controls
Control ofNoise pollution
11 NOC from Honorable HighCourt
Refere nce to PIL 87 of 2006
Conservation of MangrovesMangrove protection
12 Maharashtra Maritime BoardAct 1996
1996 Permission for activities using water front
The proposed coastal road
project involves activities using the waterfront,
hence permission is
required.

10.6 Methodology Adopted for Environmental Screening Exercise
As a part of the project feasibility study, Environmental Impact Screening is undertaken in parallel
with the Economic and Engineering Analysis in order to determine any significant economic, social
or environmental issues which could require further analysis (including the analysis of alternative
alignments) issues. The environmental screening analyze critical natural habitats (e.g. national parks,
wildlife reserves, sanctuaries, sacred groves, protected areas, forests, water bodies etc.), major rivers
and waterways, recorded cultural heritage sites and any other potentially sensitive areas, based on
recent GOI census official data and information from NGOs and site visits. The results of this
analysis plotted on maps and tabulated to clearly identify any major conflicts with proposed road
improvements. The nature and extent of such conflicts and recommendations concerning how to
resolve them (including recommendation for exclusion, analysis of alternative alignment and/or
mitigation) as a precursor to preliminary engineering design and undertaking the required for
environmental assessment studies.
•
•
•
•
•
•
•
•
•
•
•
•
•
•
•
•
•
•
•
•
Consumption of valuable coastal land and loss of top soil,
Settlements
Houses likely to be affected both residential and Business (Commercial),
Trees within the corridor
Matured and socially and culturally valuable trees,
Water
Water quality of ocean /river/stream/canal.
Community water resources (wells, Tube wells)
Construction water
Drainage
Distributed drainage system and flooding areas
Cultural / Religious / Heritage Buildings
Temples, mosques and Church
Places of Pilgrimage and Tourism
Landscape and the natural scenic beauty of the place
Other sensitive issues identified along the proposed road are:
fisherman route,
drain out fall areas,
slum area
flight landing area in Juhu ,
10.7 Objectives of Environmental Screening
The objectives of the preliminary Environmental Screening are:
• To determine the magnitude of actual and potential impact
• To ensure that environmental consideration are given adequate weight in the selection of
subsequent design of proposed highway improvements.
The results of the preliminary screening will enable us toidentify:
Those stretches of the road with major environmental issues impacts which would require detailed
EA in order to determine appropriate mitigation measures and
Those stretch with little to no potential impact and hence would require a limited environmental
analysis.
The environmental screening has made with the use of available information from official and non-
official (e.g. Consultation with local people, NGOs etc.) sources concerning the location, type and
sensitivity of all critical natural habitats (such as conservation areas, wildlife sanctuaries, sacred
groves, , wetlands, side tree lines, etc.). These are also supplemented by adequate site visits. All this
information were plotted on maps in such a manner as to identify any major potential environmental
conflicts with the proposed road improvements.
10.5 Indicators used in selecting alignment
Impact on biodiversity
•
•
•
•
•
•
•
•
•
•
Percentage of plantation land, orchards to be consumed;
Mangrove forest area and amount mangrove forest land to be acquired
Wildlife sanctuary
Number of points over which the alignment crosses ocean, streams and drainage channels;
Water resources near the proposed alignment within 200 m;
Amount of coastal/commercial /private land likely to be acquired
Percentage of kilometer stretches of the road cutting through the settlements
Number of individual trees those are old, matured and traditional species.
Heritage Buildings is getting affected due to the project
Impact on community
10.8 Existing Baseline Environmental and Social Scenario
10.8.1 Location
Greater Mumbai district is located on the western most periphery of the Maharashtra State. Greater
Mumbai district comprises South Salsete, Trombay and Bombay islands having a geographical area
of 603 sq. km. (Mumbai City- 69 sq. km. and Mumbai Suburbs- 534 sq. km.). The district is bounded
193

by north latitude 18°53‘ and 19°19‘ and east longitude 72°47‘ and 72°58‘. Arabian Sea lies on the
southern and western side of the district while it borders Thane district in the north and eastern side.
The proposed coastal road project (approximately 35 km) falls within Greater Mumbai district .It
starts from Princess street flyover and ends at Kandivali. It is proposed to be extended further north
connecting Madh Island, Gorai and Dahisar
Mumbai lies at the mouth of the Ulhas River on the western coast of India, Many parts of the citylie
just above sea level, with elevations ranging from 10 m (33 ft) to 15 m (49 ft); the city has an average
elevation of 14 m (46 ft). Northern Mumbai (Salsette) is hilly, and the highest point in the city is 450
m (1,476 ft) at Salsette in the Powai–Kanheri ranges.
Map of Greater Mumbai Region
10.8.2 Climatic Conditions
Mumbai, being on the seacoast, experiences a tropical savanna climate with a heavy southwest
monsoon rainfall of more than 2100 millimeters a year. Mumbai experiences three seasons– summer
from March to May, monsoon between June and September and winter during October to February.
The city receives heavy rainfall during monsoon and relative humidity is quite high during this
season. Similarly, winds are generally moderate but pick up during monsoon months
The mean minimum temperature is 16.3°C and the mean maximum temperature is 32.2°C at
Santacruze. The normal annual rainfall over the district varies from about 1800 mm to about 2400
mm. It is minimum in the central part of the district around Kurla (1804.9 mm). It gradually
increases towards north and reaches a maximum around Santacruze (2382.0 mm).
Water resources
Apart from the Bhatsa Dam, there are six major lakes that supply water to the city: Vihar, Lower
Vaitarna, Upper Vaitarna, Tulsi, Tansa and Powai. Tulsi Lake and Vihar Lake are located in Borivili
National Park, within the city's limits. The supply from Powai lake, also within the city limits, is used
only for agricultural and industrial purposes. Three small rivers, the Dahisar River, Poinsar (or
Poisar) and Ohiwara (or Oshiwara) originate within the park, while the polluted Mithi
194

River originates from Tulsi Lake and gathers water overflowing from Vihar and Powai Lakes. The
City is prone to water shortages in years of scanty rainfall .
Two types of soils have been observed in the district viz., medium to deep black and reddish colored
soil. Soil cover in the city region is predominantly sandy due to its proximity to the sea. In the
suburbs, the soil cover is largely alluvial and loamy.
10.8.4 Geology and Geomorphology
The entire Greater Mumbai area is occupied by Deccan basalt flows and their acid and basic variants,
poured out between the late Cretaceous and Early Eocene time. The basaltic flows are horizontally
bedded and are more or less uniform in character over wide areas. Certain extrusive and intrusive
mafic types are associated with basalts and are found in Mumbai Island and its vicinity. Further some
fossiliferous sediments, mainly of tufaceous origin and partly of fresh water origin, rich in fauna, are
also found in Mumbai area.
Mumbai Island has ridges along its western and eastern side. The city of Mumbai is built on central
low-lying part of the Island. The western ridges comprise stratified ash beds.
10.8.5 Ground Water Scenario
The entire area is underlain by basaltic lava flows of upper Cretaceous to lower Eocene age. The
shallow Alluvium formation of recent age also occurs as narrow stretch along the major river flowing
in the area
In hard rock areas the ground water exists in fractures, joints, vesicles and in weathered zone of
Basalt. The occurrence and circulation of ground water is controlled by vesicular unit of lava flows
and through secondary porosity and permeability developed due to weathering, jointing, fracturing
etc., of Basalt. The ground water occurs under phreatic, semi confined and confined conditions.
The leaky confined conditions are also observed in deeper aquifers. Generally the phreatic aquifer
ranges down to depth of 15 m BGL.. The water bearing zone down to depth of 35 m BGL forms
the semi confined aquifer and below this deeper aquifer down to depth of 60 m BGL is observed.
The yield of the dug wells varies from 10 to 1000 m3/day, whereas that of bore wells ranges between
50 and 1000 m3/day. It is expected that the potential of deeper aquifers would be much more
limited as compared to the unconfined/phreatic aquifer.
In soft rock areas which constitutes most the study area , the river Alluvium patches along the course
of rivers, the and Marine Alluvium in the coastal area are highly potential aquifers but with limited
areal extent. The ground water occurs under water table condition in sandy / gritty layers. The
alluvial fill of low lying areas underlain by weathered basalt has relatively better ground water
potential.
10.8.3 Physiography and Soil Types
The broad physiographic features of are broad and flat terrain flanked by north – south trending hill
ranges. The hill ranges form almost parallel ridges in the eastern and western part of the area. The
Powai – Kanheri hill ranges are the other hill ranges, extending in the eastern and central part
running NNE – SSW. The maximum elevation of the area is 450 m above mean sea level ( MSL ) at
some of the peaks of hill ranges. Trombay Island has north – south running hills with maximum
elevation of 300 m above man sea level (MSL). Malabar, Colaba, Worli and Pali hills are the isolated
small ridges trending north – south in the western part of the district. The Powai – Kanheri hills
form the largest hilly terrain in the central part of the Salsette Island, and are the feeder zone for the
three lakes viz., Powai, Vihar and Tulsi.
There are a number of creeks, dissecting the area. Among them, Thane is the longest creek. Other
major creeks are Manori, Malad and Mahim which protrude into the main land and give rise to
mudflats and swamps. The area is drained by Mahim, Mithi, Dahisar and Poisar rivers. These small
rivers near the coast form small rivulets which inter mingle with each other, resulting in swamps and
mud flats in the low lying areas.
195

Seismic Hazard Map showing Mumbai
Source : Central Gouundwater Board
Major Ground Water Problems and Issues
The pollution of ground water as well as surface water is the major problem in the area. The creeks
in the region have become the dumping ground of sewage and industrial effluents. In addition to
this, various industrial effluents from oil refineries, reactors, fertilizers plants at Chembur have
polluted the sea water in eastern part and are hazardous to marine life.
The data of Maharashtra Pollution Control Board (MPCB) indicate higher concentration of Mercury
(Hg) than the prescribed limit of 1.90 ppm. The higher Arsenic (As) concentration of more than 2.00
ppm and slightly more is observed in fishes from Thane and Chembur. The other heavy metals like
Lead (0.60 ppm), Cadmium (12.60 ppm) and Copper (8.84 ppm) are also reported from creek water.
Ground water exploitation for commercial purpose is carried out in entire district and the water is
extracted from existing dugwells and borewells, even new borewells are also being drilled for this
purpose. The ground water is used for construction purposes, hotel industry and for domestic
purpose of the housing societies. Excessive ground water development in the beach and coastal areas
can lead to saline water intrusion as observed in some parts of Colaba, Dharavi and Khar from BMC
data.
10.8.7 National Park
Sanjay Gandhi National Park (Borivali National Park) is located partly in the Mumbai suburban
district, and partly in the Thane district, and it extends over an area of 103.09 km2 (39.80 sq mi) falls
within 10 km radius area of the proposed alignment.
10.8.6 Seismic Hazards
Mumbai sits on a seismically active zone owing to the presence of 23 fault lines in the vicinity. The
area is classified as a Seismic Zone III region, which means an earthquake of up to magnitude 6.5 on
the Richter-scale may be expected.
196
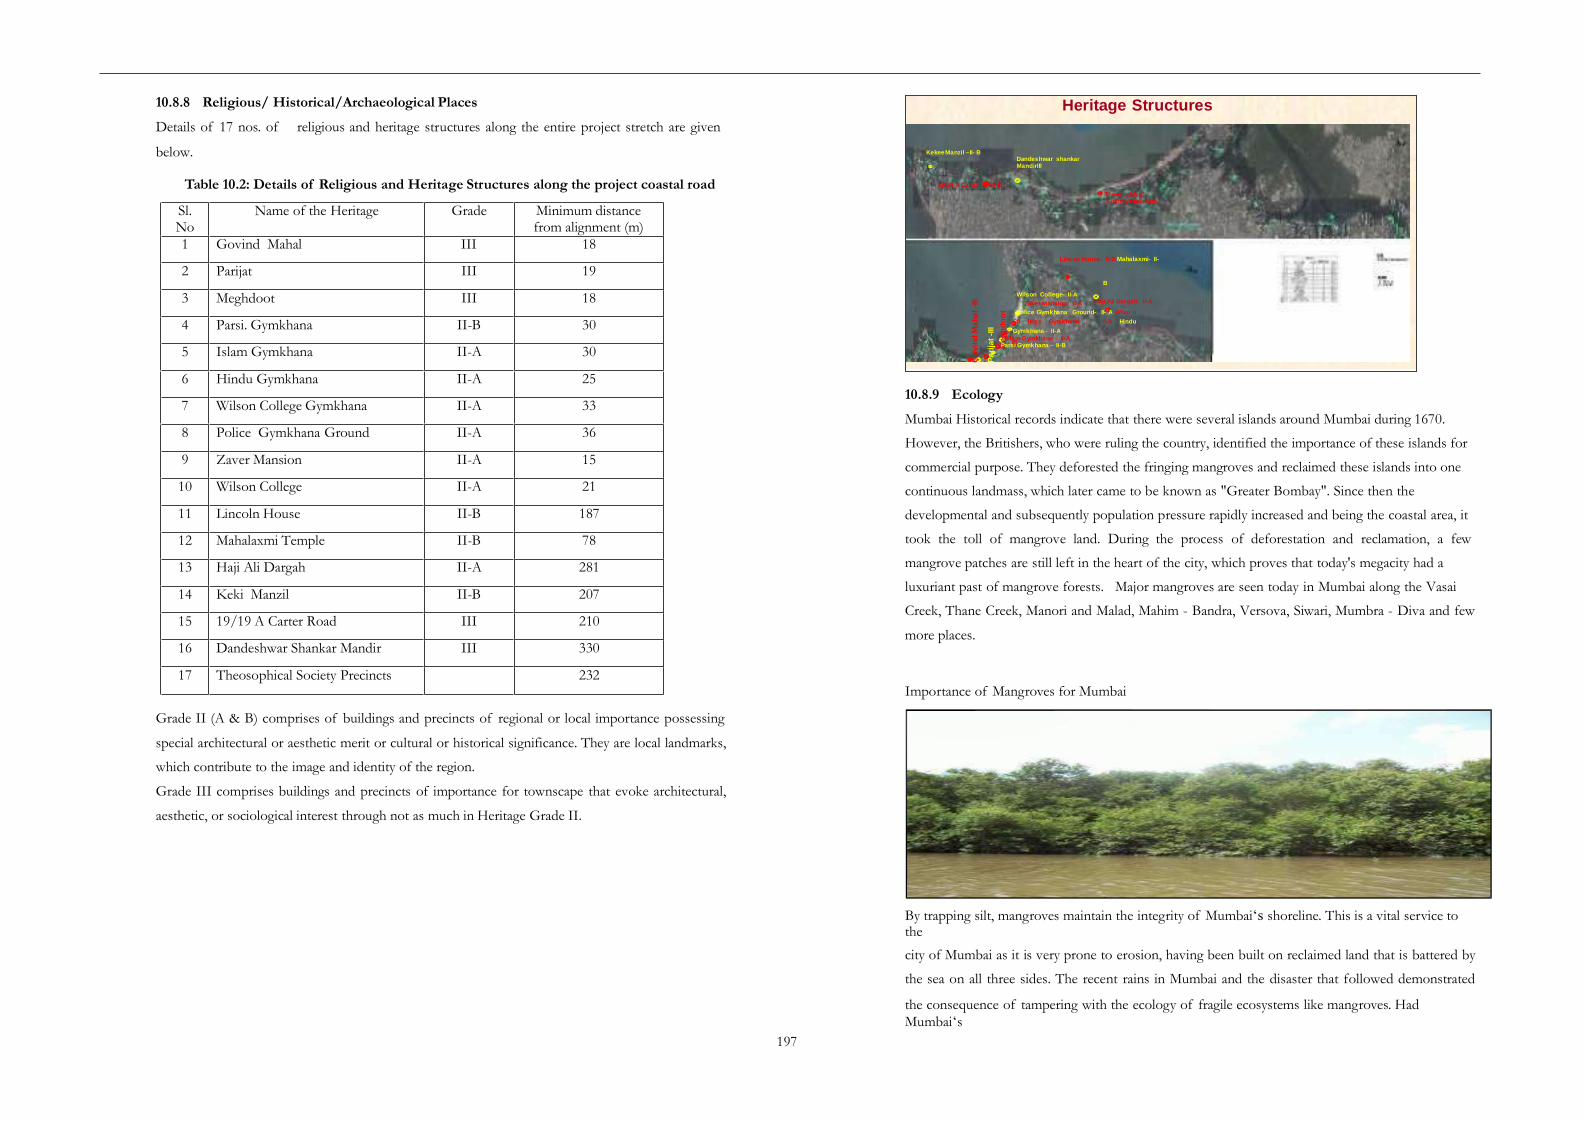
11
10.8.8 Religious/ Historical/Archaeological Places
Details of 17 nos. of
below.
religious and heritage structures along the entire project stretch are given
Table 10.2: Details of Religious and Heritage Structures along the project coastal road
10.8.9 Ecology
Mumbai Historical records indicate that there were several islands around Mumbai during 1670.
However, the Britishers, who were ruling the country, identified the importance of these islands for
commercial purpose. They deforested the fringing mangroves and reclaimed these islands into one
continuous landmass, which later came to be known as "Greater Bombay". Since then the
developmental and subsequently population pressure rapidly increased and being the coastal area, it
took the toll of mangrove land. During the process of deforestation and reclamation, a few
mangrove patches are still left in the heart of the city, which proves that today's megacity had a
luxuriant past of mangrove forests. Major mangroves are seen today in Mumbai along the Vasai
Creek, Thane Creek, Manori and Malad, Mahim - Bandra, Versova, Siwari, Mumbra - Diva and few
more places.
Importance of Mangroves for Mumbai
Grade II (A & B) comprises of buildings and precincts of regional or local importance possessing
special architectural or aesthetic merit or cultural or historical significance. They are local landmarks,
which contribute to the image and identity of the region.
Grade III comprises buildings and precincts of importance for townscape that evoke architectural,
aesthetic, or sociological interest through not as much in Heritage Grade II.
By trapping silt, mangroves maintain the integrity of Mumbai‘s shoreline. This is a vital service to the
city of Mumbai as it is very prone to erosion, having been built on reclaimed land that is battered by
the sea on all three sides. The recent rains in Mumbai and the disaster that followed demonstrated
the consequence of tampering with the ecology of fragile ecosystems like mangroves. Had
Mumbai‘s
197
Go
vin
dM
ah
al
-III
Pa
rija
t-I
II
Meg
hd
oo
t
-III
Sl. No
Name of the Heritage Grade Minimum distance from alignment (m)
1 Govind Mahal III 18
2 Parijat III 19
3 Meghdoot III 18
4 Parsi. Gymkhana II-B 30
5 Islam Gymkhana II-A 30
6 Hindu Gymkhana II-A 25
7 Wilson College Gymkhana II-A 33
8 Police Gymkhana Ground II-A 36
9 Zaver Mansion II-A 15
10 Wilson College II-A 21
11 Lincoln House II-B 187
12 Mahalaxmi Temple II-B 78
13 Haji Ali Dargah II-A 281
14 Keki Manzil II-B 207
15 19/19 A Carter Road III 210
16 Dandeshwar Shankar Mandir III 330
17 Theosophical Society Precincts 232
Heritage Structures
KekeeManzil –II- BDandeshwar shankarMandirIII
19/19-ACarter Road III
TheosophicalSociety Precincts
Lincon House- II-B Mahalaxmi- II-
B
Wilson College- II-A
Zaver Mansion- II-A Haji Ali Dargah- II-A
Police Gymkhana Ground- II- A Wilso n
Co llege Gymkhana - II-A Hindu
Gymkhana - II-A
Islam Gymkhana - II-AParsi Gymkhana - II-B
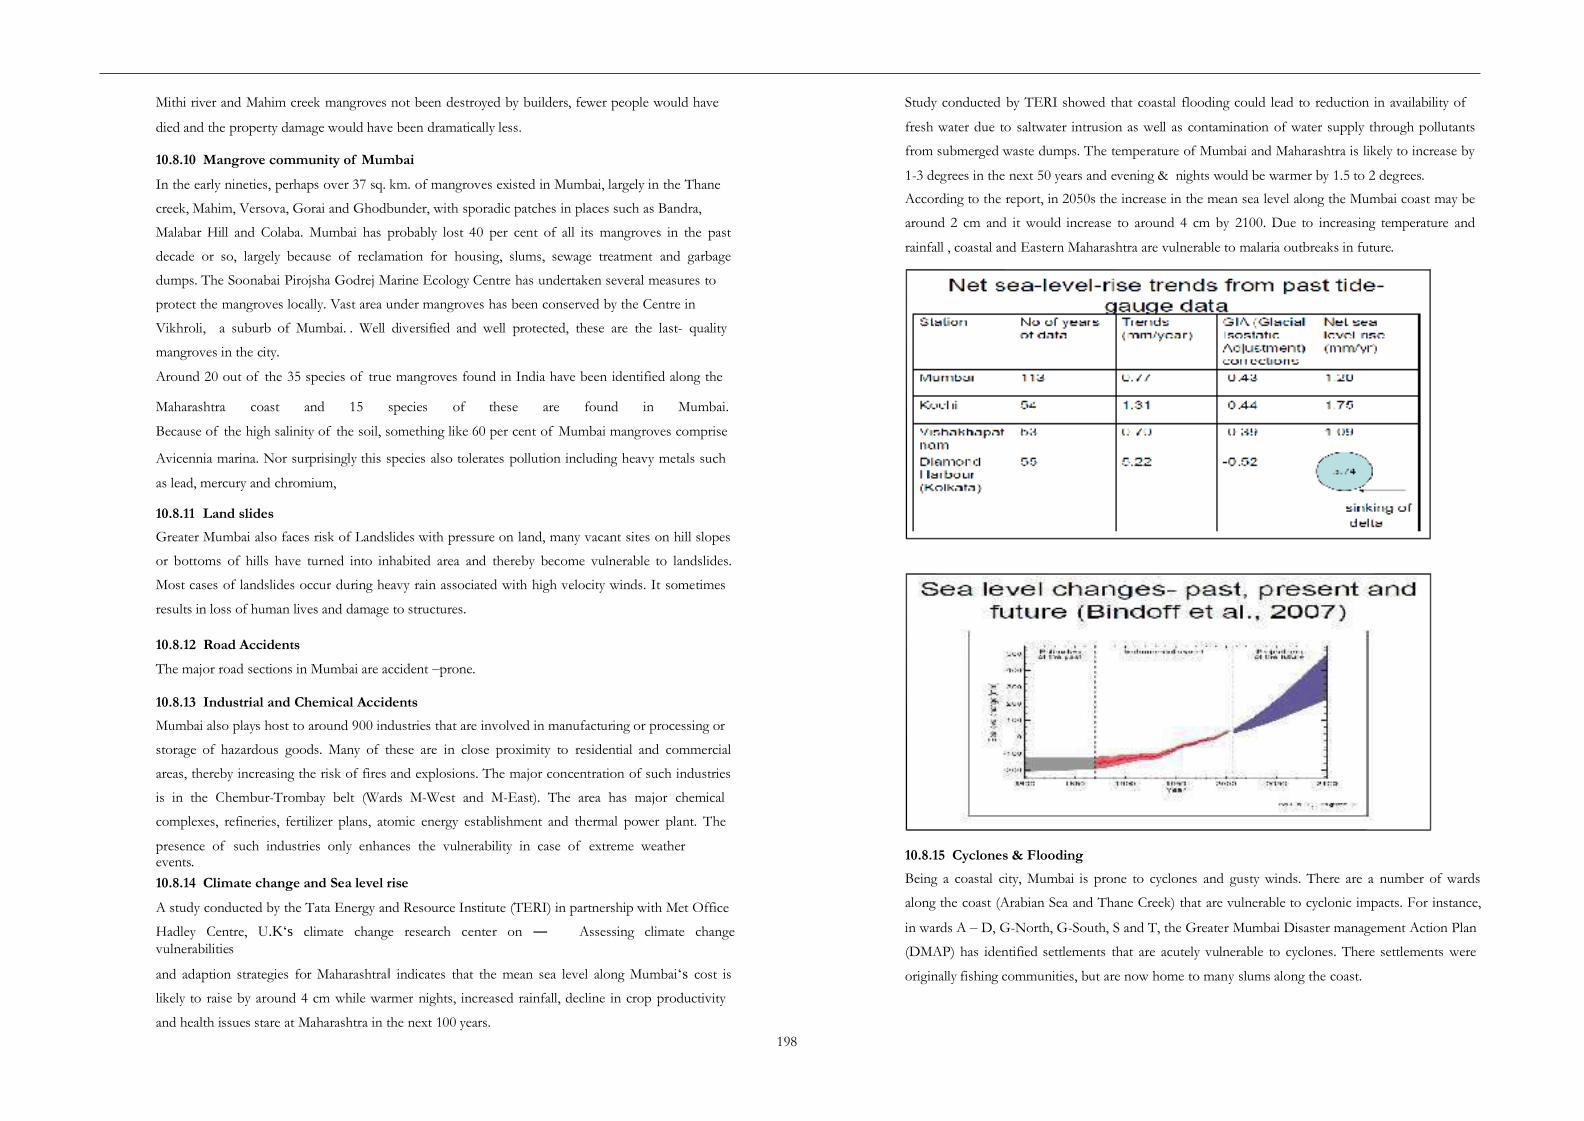
Mithi river and Mahim creek mangroves not been destroyed by builders, fewer people would have
died and the property damage would have been dramatically less.
Study conducted by TERI showed that coastal flooding could lead to reduction in availability of
fresh water due to saltwater intrusion as well as contamination of water supply through pollutants
from submerged waste dumps. The temperature of Mumbai and Maharashtra is likely to increase by
1-3 degrees in the next 50 years and evening & nights would be warmer by 1.5 to 2 degrees.
According to the report, in 2050s the increase in the mean sea level along the Mumbai coast may be
around 2 cm and it would increase to around 4 cm by 2100. Due to increasing temperature and
rainfall , coastal and Eastern Maharashtra are vulnerable to malaria outbreaks in future.
10.8.10 Mangrove community of Mumbai
In the early nineties, perhaps over 37 sq. km. of mangroves existed in Mumbai, largely in the Thane
creek, Mahim, Versova, Gorai and Ghodbunder, with sporadic patches in places such as Bandra,
Malabar Hill and Colaba. Mumbai has probably lost 40 per cent of all its mangroves in the past
decade or so, largely because of reclamation for housing, slums, sewage treatment and garbage
dumps. The Soonabai Pirojsha Godrej Marine Ecology Centre has undertaken several measures to
protect the mangroves locally. Vast area under mangroves has been conserved by the Centre in
Vikhroli, a suburb of Mumbai. . Well diversified and well protected, these are the last- quality
mangroves in the city.
Around 20 out of the 35 species of true mangroves found in India have been identified along the
Maharashtra coast and 15 species of these are found in Mumbai.
Because of the high salinity of the soil, something like 60 per cent of Mumbai mangroves comprise
Avicennia marina. Nor surprisingly this species also tolerates pollution including heavy metals such
as lead, mercury and chromium,
10.8.11 Land slides
Greater Mumbai also faces risk of Landslides with pressure on land, many vacant sites on hill slopes
or bottoms of hills have turned into inhabited area and thereby become vulnerable to landslides.
Most cases of landslides occur during heavy rain associated with high velocity winds. It sometimes
results in loss of human lives and damage to structures.
10.8.12 Road Accidents
The major road sections in Mumbai are accident –prone.
10.8.13 Industrial and Chemical Accidents
Mumbai also plays host to around 900 industries that are involved in manufacturing or processing or
storage of hazardous goods. Many of these are in close proximity to residential and commercial
areas, thereby increasing the risk of fires and explosions. The major concentration of such industries
is in the Chembur-Trombay belt (Wards M-West and M-East). The area has major chemical
complexes, refineries, fertilizer plans, atomic energy establishment and thermal power plant. The
presence of such industries only enhances the vulnerability in case of extreme weatherevents. 10.8.15 Cyclones & Flooding
Being a coastal city, Mumbai is prone to cyclones and gusty winds. There are a number of wards
along the coast (Arabian Sea and Thane Creek) that are vulnerable to cyclonic impacts. For instance,
in wards A – D, G-North, G-South, S and T, the Greater Mumbai Disaster management Action Plan
(DMAP) has identified settlements that are acutely vulnerable to cyclones. There settlements were
originally fishing communities, but are now home to many slums along the coast.
10.8.14 Climate change and Sea level rise
A study conducted by the Tata Energy and Resource Institute (TERI) in partnership with Met Office
Hadley Centre, U.K‘s climate change research center on ― Assessing climate change
vulnerabilities
and adaption strategies for Maharashtra‖ indicates that the mean sea level along Mumbai‘s cost is
likely to raise by around 4 cm while warmer nights, increased rainfall, decline in crop productivity
and health issues stare at Maharashtra in the next 100 years.
198

In addition to this, there are 40 chronic flooding locations identified in the DMAP report that are
spread over the island city, eastern and western suburbs. The problem of flooding is acute when
heavy rainfall coincides with high tide; i.e. more than 4.5 meters (average: 20 times during the
monsoon)
migration and urbanization put stress on resources. Increasing economic activity and per capita
income further stresses the resources and has resulted into changing land-uses pattern.
10.8.16 Coastal Protection
Mumbai area as a whole is a lowland area on the west of Sayhadri Hills ranges. The area region has a
167 km long coastline that has estuaries bays, creeks, and beaches. The city of Mumbai needs to
prepare itself against any natural calamities likely to occur in future. The city due to its peculiar
geography acts as a natural breakwater of its own. The existing sea wall which is weakening due to
wave attack requires strengthening and protection.
Table 9.9: Coastal Stretches proposed for Protection
Source: -Mumbai city development plan 2005-25)
This development process changed the character of the natural environment of the region. Land
reclamation, vegetation clearances, changes in land use etc. created a new man-made environment.
The ecology of the region also adapted to these changes. In the last four decades the population of
Mumbai has been increasing rapidly. To cater this sudden rise in population, rapid and unplanned
development took place, which has led to serious environmental degradation.
In the past 10 years alone, built-up land in Mumbai has soared nearly 114 percent, in the same
period, forest and wetland areas shrank by 35 percent (H.P.Sawant.2004). Mangrove ecosystems
which exist along the Mithi River and Mahim creek are being destroyed and replaced with
construction. Hundreds of acres of swamps in Mahim creek have been reclaimed and put to use for
construction by builders. The Bandra-kurla complex was created by replacing such swamps. The
systematic destruction of about 1,000 acres of the city's mangrove cover - what's left, about 5,000
acres, is under threat - has deprived Mumbai of its natural flood-barrier and silt trap. July 2005
flooding is a result of ecosystem change.
Source: Mumbai City Development Plan (2005 – 2025)
10.8.17 Demographic profile
According to the 2011 census, the population of Mumbai was 12,479,608. The population density is
estimated to be about 20,482 persons per square kilometre. The living space is 4.5sq metre per
person. As Per 2011 census, Greater Mumbai, the area under the administration of the MCGM, has
a literacy rate of 94.7%, higher than the national average of 86.7%. The number of slum-dwellers is
estimated to be 9 million; up from 6 million in 2001, that is, 62% of all Mumbaikers live in informal
slums.
The sex ratio was 838 (females per 1,000 males) in the island city, 857 in the suburbs, and 848 as a
whole in Greater Mumbai, all numbers lower than the national average of 914 females per 1,000
males. The low sex ratio is partly because of the large number of male migrants who come to the city
to work.
There are in all 2335 slum settlements as per 1985 data in Mumbai. These slums are considered as
vulnerable settlements due to their location and access to infrastructure.
10.8.19 Status of Air, water and noise pollution
The latest Environment Status Report of Greater Mumbai 2012-13 observes that with widespread
construction activities and increasing number of vehicles, suspended particulates in the ambient air
exceed the air quality standards set by Central Pollution Control Board (CPCB).
The report, prepared by the municipal corporation, also suggests that the contamination level found
in the water supplied to the city too has gone up, by 19%. Noise pollution has exceeded the
prescribed CPCB standards all over the city. And the irony is that the highest noise levels, especially
during evening and night, have been recorded in silence zones.
In the report, of National Environmental Engineering Research Institute it shows that rapid
population growth has contributed to some serious environmental problems in Mumbai. "Some of
10.8.18 Land use pattern
The Mumbai Metropolitan Region (MMR) is one of the fastest growing regions of India. Its
population increased from 7.7 million in 1971 to 18.3 million in 2001 (Census of India, 2001) and is
projected to increase to 22.4 million by 2011(MMRDA, 1999). High population growth, inward
199
Coastal Stretches proposed for Protection
Description
Island city (km) Mumbai Suburban (km) Total length (km)
Total coast line 29.430 43.785 73.215
Artificially protected 14.745 11.075 25.820Naturally protected including beaches
8.300 25.650 33.950
To be protected 6.385 7.060 13.445
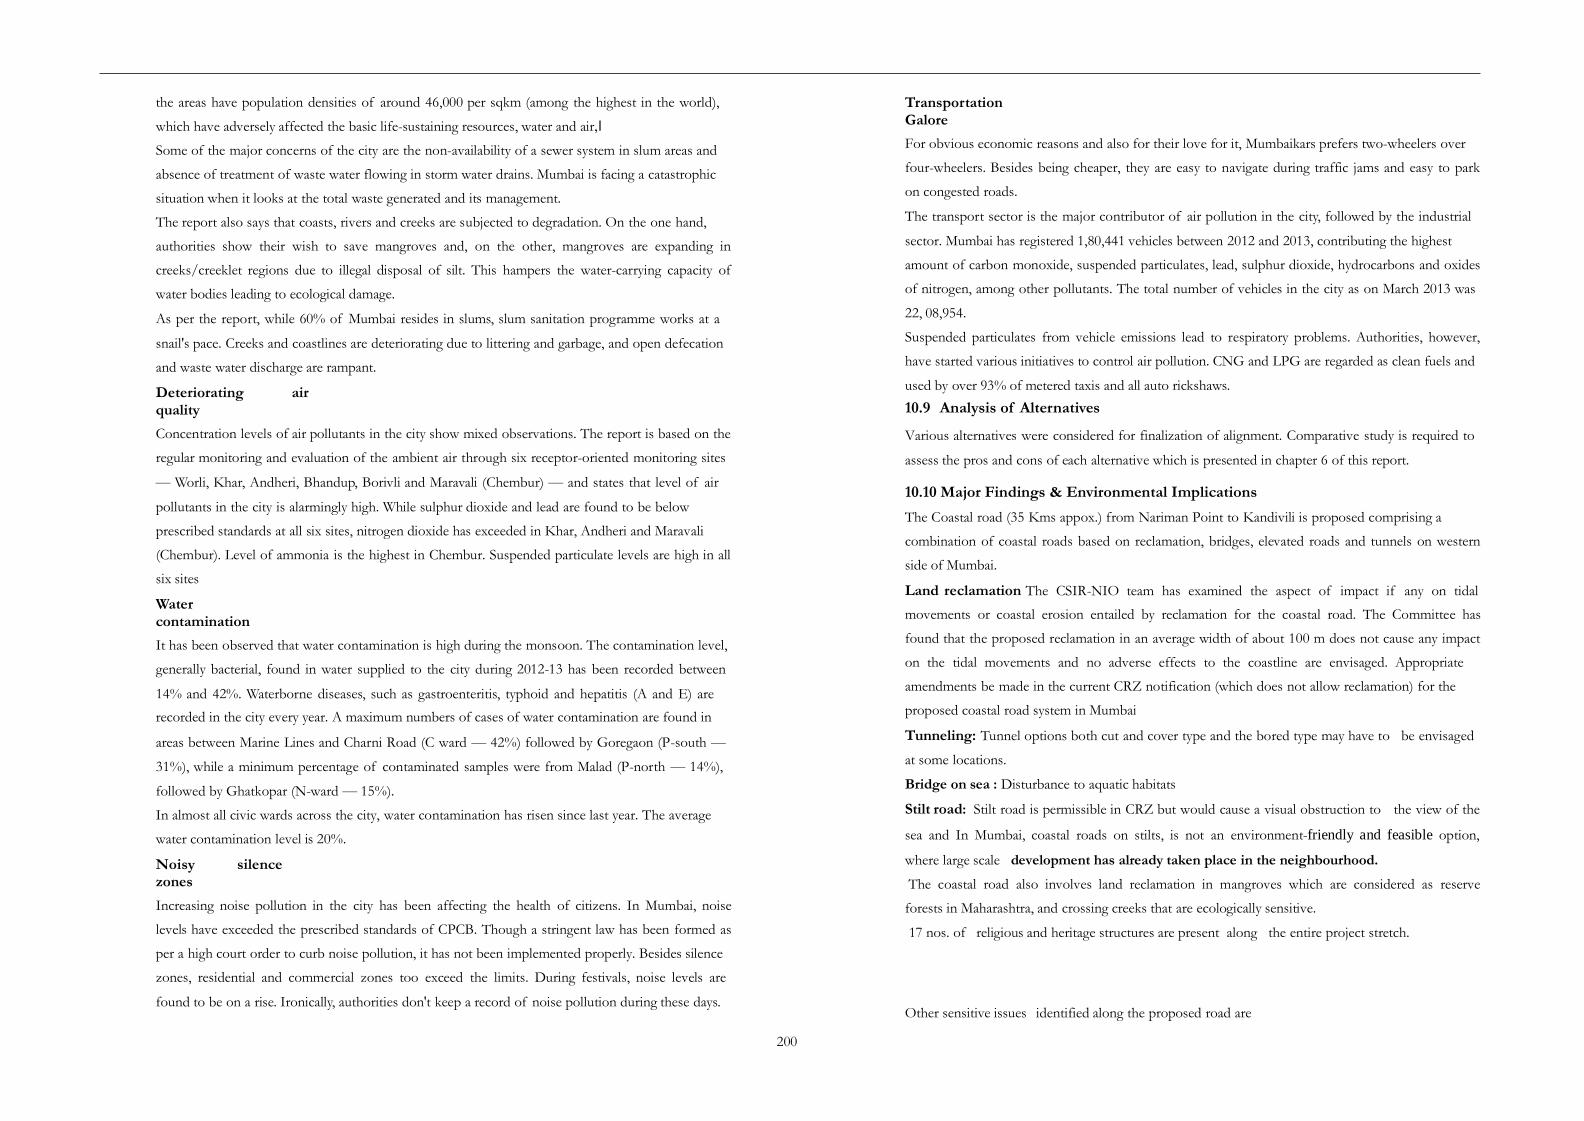
TransportationGalore
For obvious economic reasons and also for their love for it, Mumbaikars prefers two-wheelers over
four-wheelers. Besides being cheaper, they are easy to navigate during traffic jams and easy to park
on congested roads.
The transport sector is the major contributor of air pollution in the city, followed by the industrial
sector. Mumbai has registered 1,80,441 vehicles between 2012 and 2013, contributing the highest
amount of carbon monoxide, suspended particulates, lead, sulphur dioxide, hydrocarbons and oxides
of nitrogen, among other pollutants. The total number of vehicles in the city as on March 2013 was
22, 08,954.
Suspended particulates from vehicle emissions lead to respiratory problems. Authorities, however,
have started various initiatives to control air pollution. CNG and LPG are regarded as clean fuels and
used by over 93% of metered taxis and all auto rickshaws.
the areas have population densities of around 46,000 per sqkm (among the highest in the world),
which have adversely affected the basic life-sustaining resources, water and air,‖
Some of the major concerns of the city are the non-availability of a sewer system in slum areas and
absence of treatment of waste water flowing in storm water drains. Mumbai is facing a catastrophic
situation when it looks at the total waste generated and its management.
The report also says that coasts, rivers and creeks are subjected to degradation. On the one hand,
authorities show their wish to save mangroves and, on the other, mangroves are expanding in
creeks/creeklet regions due to illegal disposal of silt. This hampers the water-carrying capacity of
water bodies leading to ecological damage.
As per the report, while 60% of Mumbai resides in slums, slum sanitation programme works at a
snail's pace. Creeks and coastlines are deteriorating due to littering and garbage, and open defecation
and waste water discharge are rampant.
Deteriorating airquality
Concentration levels of air pollutants in the city show mixed observations. The report is based on the
regular monitoring and evaluation of the ambient air through six receptor-oriented monitoring sites
— Worli, Khar, Andheri, Bhandup, Borivli and Maravali (Chembur) — and states that level of air
pollutants in the city is alarmingly high. While sulphur dioxide and lead are found to be below
prescribed standards at all six sites, nitrogen dioxide has exceeded in Khar, Andheri and Maravali
(Chembur). Level of ammonia is the highest in Chembur. Suspended particulate levels are high in all
six sites
Watercontamination
It has been observed that water contamination is high during the monsoon. The contamination level,
generally bacterial, found in water supplied to the city during 2012-13 has been recorded between
14% and 42%. Waterborne diseases, such as gastroenteritis, typhoid and hepatitis (A and E) are
recorded in the city every year. A maximum numbers of cases of water contamination are found in
areas between Marine Lines and Charni Road (C ward — 42%) followed by Goregaon (P-south —
31%), while a minimum percentage of contaminated samples were from Malad (P-north — 14%),
followed by Ghatkopar (N-ward — 15%).
In almost all civic wards across the city, water contamination has risen since last year. The average
water contamination level is 20%.
Noisy silencezones
Increasing noise pollution in the city has been affecting the health of citizens. In Mumbai, noise
levels have exceeded the prescribed standards of CPCB. Though a stringent law has been formed as
per a high court order to curb noise pollution, it has not been implemented properly. Besides silence
zones, residential and commercial zones too exceed the limits. During festivals, noise levels are
found to be on a rise. Ironically, authorities don't keep a record of noise pollution during these days.
10.9 Analysis of Alternatives
Various alternatives were considered for finalization of alignment. Comparative study is required to
assess the pros and cons of each alternative which is presented in chapter 6 of this report.
10.10 Major Findings & Environmental Implications
The Coastal road (35 Kms appox.) from Nariman Point to Kandivili is proposed comprising a
combination of coastal roads based on reclamation, bridges, elevated roads and tunnels on western
side of Mumbai.
Land reclamation The CSIR-NIO team has examined the aspect of impact if any on tidal
movements or coastal erosion entailed by reclamation for the coastal road. The Committee has
found that the proposed reclamation in an average width of about 100 m does not cause any impact
on the tidal movements and no adverse effects to the coastline are envisaged. Appropriate
amendments be made in the current CRZ notification (which does not allow reclamation) for the
proposed coastal road system in Mumbai
Tunneling: Tunnel options both cut and cover type and the bored type may have to be envisaged
at some locations.
Bridge on sea : Disturbance to aquatic habitats
Stilt road: Stilt road is permissible in CRZ but would cause a visual obstruction to the view of the
sea and In Mumbai, coastal roads on stilts, is not an environment-friendly and feasible option,
where large scale development has already taken place in the neighbourhood.
The coastal road also involves land reclamation in mangroves which are considered as reserve
forests in Maharashtra, and crossing creeks that are ecologically sensitive.
17 nos. of religious and heritage structures are present along the entire project stretch.
Other sensitive issues identified along the proposed road are
200

Execution of the project will have direct impact on the Environment. It is therefore necessary to
undertake Environment Impact Assessment (EIA) study for the project to assess the potential
critical impact of the project on environment in order to suggest mitigation measures, which are
required to be incorporated during the initial planning stage. Environment Impact Assessment and
Management Plan shall be prepared in conformity with TOR.
Purpose of EIA report preparation is to establish the baseline environmental aspects of the Project
road corridor and to analyze all the expected impacts, required avoidance and the possible cost
effective mitigation measures. Further these mitigation measures need to be stream lined with the
engineering design and the contracting process for effective implementation.
The objectives of the environmental study will be achieved adopting the methodology outlined
below:
Study Corridor
The study corridor will comprise a 10 km wide strip on either side of the proposed alignment.
Secondary Data Collection & Analysis
The work on data collection from the secondary sources has been initiated. The objective is to gather
information on the regional orientation of the basic elements of environment, like lithology,
drainage, climate (the wind speed, wind direction, relative humidity, temperature, rainfall, etc.),
archaeological places, biotic wealth including forests, wetlands, wildlife reserves, sanctuaries,
sensitive, critical natural habitats, if any.
The data on human environment, the demographic profile and occupational pattern will be collected
from Census of India. The data collection on social attributes and amenities available such as literacy
rate and utilities, incidence of scheduled tribes and castes, general land use pattern and settlement
systems, major market centers and transport system, etc., has been initiated.
Review of Policy, Legal and AdministrativeFramework
This step discussed the policy, legal framework within which the Environmental Assessment (EA) is
prepared and also reviewed the existing institutions and legislations relevant to the project corridor,
at the, national level and at the state level.
Assessment of Baseline EnvironmentalStatus
Baseline conditions within the defined area have to be determined as per MoEF requirements for
infrastructure projects. The database for working out the baseline status was from both secondary
and primary sources.
Field surveys for assessment of baseline levels will be taken up subsequently. These will include:
Air Quality &Meteorology
The ambient air quality monitoring at selected locations of the road will be carried out to establish
the baseline concentrations of various parameters like Particulate Matter (PM10 & PM 2.5), Sulphur
Dioxide (SO2), Oxides of Nitrogen (NOx), Hydrocarbon (HC), Carbon-monoxide (CO) and Lead
(Pb) at residential, commercial, and sensitive areas. Meteorological parameters like wind direction,
•
•
•
•
fisherman route,
drain outfall areas
slum area
flight landing area in Juhu
Rapid developments like housing, industrialization, pollution and increasing population of Mumbai
has resulted into degradation of mangroves. The worst affected area in Mumbai is the entire western
front excepting Carter Road where the mangroves have grown and have also registered an increase in
height in the last 10 years. This has been possible due to the participation of citizen‘s forums fighting
individually. In India, a legal protection is afforded to this ecosystem by way of legislation in the
form of Coastal Regulation Zone Notification. Recently Mumbai High Court has ordered freeze on
destruction of mangrove forests in Maharashtra and has banned construction within 50 metres of
them. The court has also directed to notify mangrove areas as protected forests.
Deteriorating air, water and noise quality.
Environment Impact assessment study should be conducted and an Environmental Management
plan is to be prepared to get CRZ Clearance and to minimize the environmental impact during
construction and operation of the project .
Forest clearance from Forest Department/MoEF is required as construction in mangrove area is
involved. NOC from High Court is also required in reference to PIL 87 of 2006
The project falls within 10 km radius area of Sanjay Gandhi National Park (Borivali National Park)
hence SBWL and NBWL clearances are necessary.
Management plan for reclamation area, coastal protection and mangroves should be formulated.
Future scope of work
Steps of future scope of work are summarized below:
•
•
Screening and Feasibility report
Base line Environmental data generation and preparation of Environmental Impact Assessment
(EIA) report
Preparation of Environmental Management Plan report
Public Consultation
Project layout superimposed on the CRZ map indicating HTL and LTL in 1:4000 scale and
submission of FORM 1 to MCZMA for CRZ clearance
Submission of documents for Forest Clearance
NOC from NWBL
Submission of necessary documents to obtain of High Court permission.
•
•
•
•
•
•
10.10.1 Environmental Impact Assessment Study
201

wind speed, relative humidity, temperature and rainfall will be collected during the entire monitoring
period. The air quality data will be used for developing a suitable model for the future air quality
prediction.
Water Quality
Water quality sampling locations will include various groundwater and surface water sources along
the alignment such as rivers, ponds, canals and ground water. The samples will be analyzed for
various physical, chemical and biological parameters.
Noise Level
Background noise level will be monitored for both day time and night time values at various
residential, industrial and sensitive areas, equivalent sound level (Leq) values will be computed.
Soil / SedimentQuality
institutional arrangements required and (e) cost of implementation of mitigation and monitoring
requirements.
10.10.2 Considerations for EIA study
Environmental Impact Assessment Guidance Manual for Highways and Port & Harbours prepared
by Administrative Staff College of India, Hyderabad in February 2010 will be considered as model
ToR for Preparation of EIA/EMP report. During EIA study consideration will be given to:
•
•
•
•
•
•
•
•
•
•
•
•
•
•
Impact on land to be acquired for construction of the road.
Impact on Mangrove forest land and eco- system
Analysis of alternative alignments.
Assessment of the environmental impacts on the virgin areas due to the proposed alignment.
Impact on road side trees and orchards
Impact on religious/heritage structures
Impact on water resources and water storage structures
Impact on natural drainage pattern due to the high embankments.
Analysis of alternative materials for embankment construction
Impact on quality of life of the Project Affected Persons (PAPs)
Road safety and safety during construction and operation of the road.
Documentation of land ownerships and updating the land records.
Disbursement of compensation to the title holders
Identification of sites for relocation of Mangroves
Soil/sediment samples will be collected from agricultural and dry lands, river banks and
sediments. Samples will be analyzed for various physical, chemical and biological parameters.
Assessment of Alternatives
river
Assessment of various environmental
carried out.
Assessment of Potential Impacts
issues due to various cross sections alternatives has been
Based on the baseline conditions, the significant impacts needing mitigation have to be identified.
The direct and indirect impacts likely to be induced due to the project need to be adequately
identified and addressed.
Integration of Environmental Assessments in the Design Process
The design and decision-making process integrated with environmental, resettlement and
rehabilitation issues to be carried out. This has prompted the early identification of appropriate
actions. Such actions included, for example, shifts in alignments based on awareness of the locations
of cultural resources, and biological resources.
CommunityConsultations
Public participation and community consultation to be taken up involving public understanding of
the processes and mechanisms through which developmental problems and needs are investigated
and solved.
Mitigation & Environmental Enhancement Measures
Positive actions to not only avoid adverse impacts, but also to capitalize on opportunities to correct
environmental degradation or improve environmental conditions to be determined.
Preliminary Environmental Management Plan (EMP)
Environmental Management Plan (EMP) to be prepared to specify the steps necessary to ensure that
the mitigation measures have been suggested. A suitable environmental management plan shall be
prepared containing (a) mitigation measures against impacts during construction and operation
phases (b) monitoring requirement of mitigation measures (c) environmental enhancement plans (d)
10.10.3 Generic Structure of EIA report
This EIA report will be organized as per guidelines of Environmental Impact Assessment
Notification of 14th September 2006 (EIA notification 2006), of MOEF Environmental. Accordingly
the entire document is organized as follows:
•
•
•
•
•
•
•
•
•
Introduction
Project Description
Description of the Environment
Anticipated Environmental Impacts & Mitigation Measures
Analysis of Alternatives (Technology & Site)
Environmental Monitoring Program
Additional Studies (Community Participation and Public Consultation)
Environmental Enhancement
Environment Management Plan (EMP)
202

10.11 Conclusion & Recommendations
Mumbai is a linear city which is expanding in the northern and eastern sides with decentralization of
business activities and Government functions. The transportation needs have become very complex,
though north-south corridors still play the major role. With major North-South arterials being
saturated and no possibility for any capacity augmentation. The Coastal Freeway (33 Kms appox.)
from Nariman Point to Kandivili is proposed comprising a combination of coastal roads based on
reclamation, bridges, elevated roads and tunnels on western side of Mumbai. . The Coastal road is
proposed to be extended further north connecting Madh Island, Gorai and Dahisar.
The present CRZ notification issued in January 2011does not allow coastal roads on reclamation
.The MoEF, Central Government of India, is continuously instrumental in strengthening existing
policies for protecting and improving the quality of the coastal environment. The legal formal?
system of coastal zone management in India came into force in 1991. The Coastal Regulation Zone
(CRZ) notification, under the environment Act, is one of the major norms limiting the activities in
the coastal zone. It includes various laws for regulation of anthropogenic interferences by permitting
environmental friendly developments. The Notification was later amendment in January 2001.
Coastal stretches of seas bays, estuaries, creeks, rivers and backwaters influenced by tidal action up to
500 m from High Tide Line (HTL) and the area between HTL and low tide line (LTL) is classified as
CRZ Distance from HTL, applied to both sides in rivers, creeks, backwaters, and distance shall not
be less than 100 m or width of water bodie,s whichever is less.
CRZ I Zone consists of ecologically sensitive and important areas, and includes mangrove wetlands,
national parks, sanctuaries, and wild life habitats, places of outstanding natural beauty or historical
heritage. Areas close to breeding and spawning grounds of fish, those likely to be inundated due to
sea level rise (consequent upon global warming), and the area between LTL and HTL are covered
under this category.
Land reclamation, bunding or disturbing the natural course of seawater is not allowed in CRZ I area.
The CSIR-NIO team has examined the aspect of impact if any on tidal movements or coastal
erosion entailed by reclamation for the coastal road. The Committee has found that the proposed
reclamation in an average width of about 100 m does not cause any impact on the tidal movements
and no adverse effects to the coastline are envisaged. Appropriate amendments are required to be
made in the current CRZ notification (which does not allow reclamation) for the proposed coastal
road system in Mumbai
Most of the road passes through coastal area; hence CRZ notification 6th January 2011 is applicable.
The EIA notification September 14, 2006, states that prior environmental clearance from the
concerned authority is required only for National, State Highways and Expressways. The coastal road
is yet to be notified; depending on the type of the proposed road the EIA Notification 2006 will be
applicable.
• The Summary EIA shall be a summary of the full EIA Report condensed to few pages. It
should necessarily cover in brief the following Chapters of the full EIA Report:
Project Description
Description of the Environment
Anticipated Environmental impacts and mitigation measures
Environmental Monitoring Programme
Public Consultation
Project Benefits
Environment Management Plan
•
•
•
•
•
•
•
10.10.4 Procedure for clearance of project attracting CRZ notification
Procedure for clearance of project attracting CRZ notification shall be considered for CRZ clearance
as per the following procedure, namely:-
To apply with the following documents seeking prior clearance under CRZ
concerned State or the Union territory Coastal Zone Management Authority,-
notification to the
(a)
(b)
(c)
(d)
Form-1:
Rapid EIA Report including marine and terrestrial component
Disaster Management Report, Risk Assessment Report and Management Plan;
CRZ map indicating HTL and LTL demarcated by one of the authorized agency ( in
1:4000 scale;
Project layout superimposed on the above map indicated at (d) above;
The CRZ map normally covering 7km radius around the project site.
The CRZ map indicating the CRZ-I, II, III and IV areas including other notified
ecologically sensitive areas;
(e)
(f)
(g)
The MCZMA shall examine the above documents in accordance with the approved CZMP and in
compliance with CRZ notification and make recommendations within a period of sixty days from
date of receipt of complete application:
(a) MoEF or State Environmental Impact Assessment Authority (hereinafter referred to
as the SEIAA) as the case may be for the project attracting EIA notification, 2006;
MoEF for the projects not covered in the EIA notification, 2006 but attracting para
4 (ii) of the CRZ notification:
(b)
MoEF or SEIAA shall consider such projects for clearance based on the recommendations of the
concerned CZMA within a period of sixty days.
The clearance accorded to the projects under the CRZ notification shall be valid for the period of
five years from the date of issue of the clearance for commencement of construction
203

But an Environment Impact assessment study should be conducted and an Environmental
Management plan is to be prepared to get CRZ Clearance and to minimize the environmental
impact during construction and operation of the project.
Forest clearance from Forest Department/MoEF is required as construction in mangrove area is
involved. NOC from High Court is also required in reference to PIL 87 of 2006
The project falls within 10 km radius area of Sanjay Gandhi National Park (Borivali National Park)
hence SBWL and NBWL clearances are necessary.
Management plan for reclamation area, coastal protection and mangrove are to be formulated.
204

Table11.2 Cost Estimate of the Alignments Options 1 to 3
11. Initial Construction Cost Estimates
11.1 General
The primary project cost has been proposed considering the various items of work associated with
identified improvements, so as to assess for evaluating visibility of the project.
11.2 Methodology
All broad work items have been identified. Unit rate of different work items have been derived on
the basis of available schedules of rate of MCGM / Thane and experience of consultants in project
of similar nature. Quantities of different work have been worked out considering the typical cross
section, proposed improvements of the road alignment.
11.3 Estimation of Quantities and Cost
The quantities of following major items of work were considered for preliminary cost estimation.
Table 111.1 List of Major Items of work
Cost Estimate for finally recommended alignment is presented in Table 11.4 below for comparison
purpose. Based on Typical cross section, sample BOQ and Cost Estimate is prepared and further
converted to per Km cost. Details pertaining to these are given in Appendix C. Table 11.3 Cost Estimate of the Alignments Options 4 to 6
205
Sr. No Items of work
1 Site Clearance
2 Earthwork, Erosion Control And Drainages
3 Sub-Bases, Bases (Non-Bituminous) and Shoulders
4 Bases and Surface Courses (Bituminons)
5 Cement Concrete Pavement
6 Pipe/Box Culverts
7 Major Bridge
8 Minor Bridge
9 Fly Over
10 Break water wall
11 Railway Over Bridge
12 Vehicular Underpass
13 Pedestrian Underpass
14 Foot over bridges
15 River/Channel (Creek) Training & Protection works
16 Geosynthetic & Reinforced Earth Wall
17 Junctions
18 Traffic Signs, Marking and other Road Appurtenances
19 Miscellaneous
20 Promenades
21 Horticulture
22 Construction of Tube Tunnel
23 Interchanges
OPTION 1 OPTION 2 OPTION 3
Sec
tio
n.N
o
Sec
tio
nW
ise
Len
gth
of
Alig
nm
ent
(m)
Rec
lam
atio
nA
rea
(Hec
tare
)
Pro
ject
Co
st(C
rore
s)
Len
gth
of
Alig
nm
ent
(m)
Rec
lam
atio
nA
rea
(Hec
tare
)
Pro
ject
Co
st(C
rore
s)
Len
gth
of
Alig
nm
ent
(m)
Rec
lam
atio
nA
rea
(Hec
tare
)
Pro
ject
Co
st(C
rore
s)
1Jagannath Bhosale Road to Priyadarshini Park
6600 14.15 1525.5 6600 14.15 1526 7000 62.09 1978
2Priyadarshini Park to Mahalaxmi
2400 35.77 739.2 2400 35.77 739 1500 38.42 462
3Mahalaxmi toBaroda Palace
1800 19.90 522.45 1800 19.90 522 1400 0.00 332
4Baroda Palace toBWSL (Start)
3000 37.00 895.6 3000 37.00 896 2950 30.07 877
5
BWSL(End) to Juhu Sea Side Garden (Start of Tunnel)
5825 64.06 1588.1 5800 22.88 1598 5850 47.24 1575
6
Juhu Sea Side Garden (Start of Tunnel) to Ritumbhara College (End of Tunnel)
4400 3.00 1909.6 4400 3.00 1910 4700. 62.14 1401
7
Ritumbhara College (End of Tunnel) to Kandivali
12575 54.15 3842.3 12625 18.60 399312200
.0052.14 3722
Interchanges18no's
18 1350 18 1350 18 1350
TOTAL 36600 228 12373 36625 151 12533 35600 292 11695

Table 11.4 Cost Estimate of the Alignments Options 7 (Package Wwise)
206
OPTION 4 OPTION 5 OPTION 6Sec
tio
n.N
o
Sec
tio
nW
ise
Len
gth
of
Alig
nm
ent
(m)
Rec
lam
atio
nA
rea
(Hec
tare
)
Pro
ject
Co
st(C
rore
s)
Len
gth
of
Alig
nm
ent
(m)
Rec
lam
atio
nA
rea
(Hec
tare
)
Pro
ject
Co
st(C
rore
s)
Len
gth
of
Alig
nm
ent
(m)
Rec
lam
atio
nA
rea
(Hec
tare
)
Pro
ject
Co
st(C
rore
s)
1
Jagannath Bhosale Road toPriyadarshini Park
7000 7.9 1555 5810 7.9 1309 6770 14.2 1519
2
Priyadarshini Park toMahalaxmi
1500 38.5 462 1490 36.6 459 1490 36.6 459
3
Mahalaxmi to Baroda Palace
1400 0.0 332 2000 0.0 474 2000 0.0 474
4
Baroda Palace to BWSL (Start)
2950 27.0 877 2900 10.3 846 2900 10.3 846
5
BWSL(End) to Juhu Sea SideGarden (Start of Tunnel)
5850 45.8 1699 4590 10.9 1255 4590 10.9 1255
6
Juhu Sea Side Garden (Start ofTunnel) to Ritumbhara
College (End of Tunnel)4700 9.4 2040 5150 8.0 2235 5150 8.0 2235
7
Ritumbhara College (End ofTunnel) to Kandivali
12200 52.2 3716 12210 52.0 3747 12210 52.0 3747
Interchanges 18no's
18 1350 18 1350 18 1350
TOTAL
35600 180 12030 34150 126 11674 35110 132 11884

207

Table 12.1: ADT (One Way) and Assigned Traffic on Southern Part of Coastal Road
12. Economic Analysis including Sensitivity Analysis
12.1 Introduction
The construction of the Coastal Road along with the interchanges is to be examined for
implementation with respect to its economic viability. However, since the project of this nature
involves certain social costs in terms of utilization of scarce resources and public investment, to have
significant benefits flowing to the society, it becomes imperative to undertake an economic analysis
to examine whether such projects are significantly beneficial to the society or the economy.
Construction of the new link connecting Nariman Point and Kandivili brings about a reduction in
vehicle operating costs, travel time, accidents, environmental pollution, etc. In the present analysis
the cost stream comprises land acquisition, resettlement and rehabilitation, environmental costs,
construction and maintenance costs required for the proposed alignment whereas the savings
constitute vehicle operating costs (VOC) and travel time savings for passengers and goods. The
following sections describe the steps followed in the economic analysis considering inputs from the
prevailing ground situation, considering a design life of 30 years including the construction. The
analysis has been carried out as per the IRC-SP 30-2009 guidelines. As the equations presented in the
IRC code is limited to 4-lane roads, the economic analysis has been done taking one-way traffic
(assumed 50% of ADT) and 50% cost, which may not have any impact on the results. Table 11.2: ADT (One Way) and Assigned Traffic on Northen Part of Coastal Road
TrafficAssignment
The section-wise traffic assignment along the proposed alignment has already been carried out based
on the traffic volume survey, origin-destination surveys and interchange location/ layout. For
economic analysis, the southern section (between Nariman Point and BWSL) and northern section
(between BWSL and Kandivili) have been considered separately. The average traffic along existing
roads (S V Road/ Western Expressway/ Link Road/ Pedder Road/ Gokhale Road etc) has been
estimated considering representative survey locations (approximately matching with the average
assigned traffic). The alternatives considered are;
Alternative I: Existing Road through above mentioned roads – without Coastal Road (Do Nothing
situation)
Alternative II: Existing Road through above mentioned roads – with Coastal Road (With Project)
Alternative III: Construction of Coastal Road (With Project)
It may be noted that while Alternative-I can be considered as the base alternative (Do Nothing),
Alternative-II and Alternative-III together are ‗with project‘ alternative. The assigned traffic
for
northern and southern parts has been presented in Table 12.1 and Table 12.2.
12.2 Traffic Forecast
The overall growth rate for various categories of traffic along the Coastal Road has been taken as 2%
per annum upto 2043, as discussed in the projection of traffic. Due to abutting land use and limited
208
ADT-One way
Alternative-I Alternative-II Alternative-III
Airport-one way
50%
InfinityMall-oneway 50%
Average Average-49%diversion of cars
Average-51%of cars
Standard Bus 1172 550 861 861 0
Mini Bus 71 58 65 65 0
Cars/Jeeps 92,229 20,271 56,250 29,250 27,000
2-Wheeler 5,219 15,399 10,309 10,309 0
Auto Rickshaw 30,722 2,1612 26,167 26,167 0
2Ax Truck 972 169 571 571 0
3Ax Truck 291 52 172 172 0
MAV 3 19 11 11 0
LCV 4,753 1,989 3,371 3,371 0
Total No. 135,432 60,119 97,776 70,776 27,000
Total PCU 129,156 102,156 27,000
Peak Hour (PCU)-6.5% assumed
8,395 6,640 1,755
ADT-One way
Alternative-I Alternative-II Alternative-III
Pedder Road -
one way50%
Mahim -one way
50%
Average Average-49%diversion of cars
Average-51%of cars
Standard Bus 565 2,611 1,588 1,588 0
Mini Bus 46 53 50 50 0
Cars/Jeeps 36,006 64,395 50,201 25,602 24,598
2-Wheeler 3,987 34,965 19,476 19,476 0
Auto Rickshaw 0 4 2 2 0
2Ax Truck 30 114 72 72 0
3Ax Truck 6 3 5 5 0
MAV 0 0 0 0 0
LCV 332 4,739 2,536 2,536 0
Total No. 40,972 106,884 73,928 49,330 24,598
Total PCU 76,140 51,542 24,598
Peak Hour (PCU)-6.68% as observed 5,086 3,443 1,643

access to the facility, the growth rate will be lower along this proposed road, while traffic along
existing roads will grow at 5.5% per annum (10% higher). It has been assumed that the road will be
mainly used by cars and taxis, hence other vehicles in the assignment have been ignored. The
estimated projected traffic in three different alternatives as described earlier is presented in Table
12.3 to Table 12.8.
Table 12.3: Traffic Projection for the Proposed Coastal Road-Southern Part–Alternative I: Existing Road through above mentioned roads – without Coastal Road (Do Nothing situation)
Table 12.4: Traffic Projection for the Proposed Coastal Road-Southern Part–Alternative II:Existing Road through above mentioned roads – with Coastal Road (With Project)
Table 12.5: Traffic Projection for the Proposed Coastal Road-Southern Part–Alternative III:
Construction of Coastal Road (With Project)
Truck
209
Year Car 2-Wheeler Bus LCV 2/3- Axle MAV
2014 24,598 0 0 0 0 0
2015 25,090 0 0 0 0 0
Year Car 2-Wheeler Bus LCV2/3- Axle
Truck MAV
2014 50,201 19,476 1,588 2,536 72 5
2015 51,205 19,866 1,620 2,587 73 5
2016 52,229 20,263 1,652 2,638 75 5
2017 53,274 20,668 1,685 2,691 76 5
2018 54,339 21,081 1,719 2,745 78 5
2019 55,426 21,503 1,753 2,800 79 6
2020 56,534 21,933 1,788 2,856 81 6
2021 57,665 22,372 1,824 2,913 83 6
2022 58,818 22,819 1,861 2,971 84 6
2023 59,995 23,276 1,898 3,031 86 6
2024 61,195 23,741 1,936 3,091 88 6
2025 62,419 24,216 1,974 3,153 90 6
2026 63,667 24,700 2,014 3,216 91 6
2027 64,940 25,194 2,054 3,281 93 6
2028 66,239 25,698 2,095 3,346 95 7
2029 67,564 26,212 2,137 3,413 97 7
2030 68,915 26,736 2,180 3,481 99 7
2031 70,294 27,271 2,224 3,551 101 7
2032 71,699 27,817 2,268 3,622 103 7
2033 73,133 28,373 2,313 3,694 105 7
2034 74,596 28,940 2,360 3,768 107 7
2035 76,088 29,519 2,407 3,844 109 8
2036 77,610 30,110 2,455 3,921 111 8
2037 79,162 30,712 2,504 3,999 114 8
2038 80,745 31,326 2,554 4,079 116 8
2039 82,360 31,952 2,605 4,161 118 8
2040 84,007 32,591 2,657 4,244 120 8
2041 85,687 33,243 2,711 4,329 123 9
2042 87,401 33,908 2,765 4,415 125 9
2043 89,149 34,586 2,820 4,504 128 9
2043 90,932 35,278 2,876 4,594 130 9
Year Car 2-Wheeler Bus LCV 2/3- AxleTruck
MAV
2014 25,602 19,476 1,588 2,536 72 5
2015 26,114 19,866 1,620 2,587 73 5
2016 26,636 20,263 1,652 2,638 75 5
2017 27,169 20,668 1,685 2,691 76 5
2018 27,712 21,081 1,719 2,745 78 5
2019 28,267 21,503 1,753 2,800 79 6
2020 28,832 21,933 1,788 2,856 81 6
2021 29,409 22,372 1,824 2,913 83 6
2022 29,997 22,819 1,861 2,971 84 6
2023 30,597 23,276 1,898 3,031 86 6
2024 31,209 23,741 1,936 3,091 88 6
2025 31,833 24,216 1,974 3,153 90 6
2026 32,470 24,700 2,014 3,216 91 6
2027 33,119 25,194 2,054 3,281 93 6
2028 33,781 25,698 2,095 3,346 95 7
2029 34,457 26,212 2,137 3,413 97 7
2030 35,146 26,736 2,180 3,481 99 7
2031 35,849 27,271 2,224 3,551 101 7
2032 36,566 27,817 2,268 3,622 103 7
2033 37,297 28,373 2,313 3,694 105 7
2034 38,043 28,940 2,360 3,768 107 7
2035 38,804 29,519 2,407 3,844 109 8
2036 39,580 30,110 2,455 3,921 111 8
2037 40,372 30,712 2,504 3,999 114 8
2038 41,179 31,326 2,554 4,079 116 8
2039 42,003 31,952 2,605 4,161 118 8
2040 42,843 32,591 2,657 4,244 120 8
2041 43,700 33,243 2,711 4,329 123 9
2042 44,574 33,908 2,765 4,415 125 9
2043 45,465 34,586 2,820 4,504 128 9
2043 46,374 35,278 2,876 4,594 130 9

Table 12.7: Traffic Projection for the Proposed Coastal Road-Northern Part–Alternative II :
Existing Road through above mentioned roads – with Coastal Road (With Project)
Table 12.6: Traffic Projection for the Proposed Coastal Road-Northern Part–Alternative I:Existing Road through above mentioned roads – without Coastal Road (Do Nothing
situation)
210
Year Car 2-Wheeler Bus LCV 2/3- AxleTruck
MAV
2014 56,250 10,309 861 3,371 571 183
2015 57,375 10,515 878 3,438 582 187
2016 58,523 10,725 896 3,507 594 190
Year Car 2-Wheeler Bus LCV 2/3- AxleTruck
MAV
2014 29,250 10,309 861 3,371 571 183
2015 29,835 10,515 878 3,438 582 187
2016 30,432 10,725 896 3,507 594 190
2017 31,040 10,940 914 3,577 606 194
2018 31,661 11,159 932 3,649 618 198
2019 32,294 11,382 951 3,722 630 202
2020 32,940 11,610 970 3,796 643 206
2021 33,599 11,842 989 3,872 656 210
2022 34,271 12,079 1,009 3,950 669 214
Year Car 2-Wheeler Bus LCV 2/3- AxleTruck
MAV
2017 59,693 10,940 914 3,577 606 194
2018 60,887 11,159 932 3,649 618 198
2019 62,105 11,382 951 3,722 630 202
2020 63,347 11,610 970 3,796 643 206
2021 64,614 11,842 989 3,872 656 210
2022 65,906 12,079 1,009 3,950 669 214
2023 67,224 12,320 1,029 4,029 682 219
2024 68,568 12,567 1,050 4,109 696 223
2025 69,940 12,818 1,071 4,191 710 228
2026 71,339 13,074 1,092 4,275 724 232
2027 72,765 13,336 1,114 4,361 739 237
2028 74,221 13,603 1,136 4,448 753 241
2029 75,705 13,875 1,159 4,537 768 246
2030 77,219 14,152 1,182 4,628 784 251
2031 78,764 14,435 1,206 4,720 800 256
2032 80,339 14,724 1,230 4,815 816 261
2033 81,946 15,018 1,254 4,911 832 267
2034 83,585 15,319 1,279 5,009 848 272
2035 85,256 15,625 1,305 5,109 865 277
2036 86,961 15,938 1,331 5,211 883 283
2037 88,701 16,256 1,358 5,316 900 289
2038 90,475 16,581 1,385 5,422 918 294
2039 92,284 16,913 1,413 5,530 937 300
2040 94,130 17,251 1,441 5,641 956 306
2041 96,012 17,596 1,470 5,754 975 312
2042 97,933 17,948 1,499 5,869 994 319
2043 99,891 18,307 1,529 5,986 1,014 325
2043 1,01,889 18,673 1,560 6,106 1,034 331
Year Car 2-Wheeler Bus LCV 2/3- AxleTruck
MAV
2016 25,592 0 0 0 0 0
2017 26,104 0 0 0 0 0
2018 26,626 0 0 0 0 0
2019 27,158 0 0 0 0 0
2020 27,701 0 0 0 0 0
2021 28,255 0 0 0 0 0
2022 28,820 0 0 0 0 0
2023 29,397 0 0 0 0 0
2024 29,985 0 0 0 0 0
2025 30,585 0 0 0 0 0
2026 31,196 0 0 0 0 0
2027 31,820 0 0 0 0 0
2028 32,457 0 0 0 0 0
2029 33,106 0 0 0 0 0
2030 33,768 0 0 0 0 0
2031 34,443 0 0 0 0 0
2032 35,132 0 0 0 0 0
2033 35,835 0 0 0 0 0
2034 36,551 0 0 0 0 0
2035 37,282 0 0 0 0 0
2036 38,028 0 0 0 0 0
2037 38,789 0 0 0 0 0
2038 39,564 0 0 0 0 0
2039 40,356 0 0 0 0 0
2040 41,163 0 0 0 0 0
2041 41,986 0 0 0 0 0
2042 42,826 0 0 0 0 0
2043 43,682 0 0 0 0 0
2043 44,556 0 0 0 0 0

12.3 Assumptions for Analysis
The approach to the economic analysis along with various assumptions is as follows;
The economic cost is considered as 90% of financial cost.
The design life for the analysis is taken as 30 years including the construction period.
The existing road length for the southern part is taken as 15.4 Kms, while the length of the proposed
road is 12.6 Kms.
The existing road length for the northern part is taken as 25 Kms, while the length of the proposed
road is 21.94 Kms.
For the entire stretch the width of existing road in one direction is taken as 2-lane, while the same for
the proposed road considered as 4-lane.
The Rise and Fall (RF) for existing and proposed road is assumed as 6m/Km and 4m/Km
respectively. The Roughness (RG) is considered as 4000mm/ Km and 2000mm/Km respectively.
As per the WPI, the escalation between 2009 and 2014 has been worked out as 1.33.
All the parameters for VOC are calculated as per IRC SP-30-2009 guidelines. Distance related and
Time related congestion factors has been worked out using the equations and considering the
capacities of 2-lane and 4-lane roads as 3,400 PCU/Hr and 5,100 PCU/Hr respectively (Refer IRC
106-1990).
Discount rate is taken as 12%.
Table 12.8: Traffic Projection for the Proposed Coastal Road-Northern Part–Alternative III:
Construction of Coastal Road (With Project)
12.4 Project Cost and Scheduling
For the purpose of carrying out the economic analysis, a detailed cost estimate of the road has been
prepared considering road, structures and other amenities and facilities separately. Land acquisition
costs and costs for environmental mitigation measures have been added to arrive at the total cost
211
Year Car 2-Wheeler Bus LCV 2/3- AxleTruck
MAV
2014 27,000 0 0 0 0 0
2015 27,540 0 0 0 0 0
2016 28,091 0 0 0 0 0
2017 28,653 0 0 0 0 0
2018 29,226 0 0 0 0 0
2019 29,810 0 0 0 0 0
2020 30,406 0 0 0 0 0
2021 31,015 0 0 0 0 0
2022 31,635 0 0 0 0 0
2023 32,267 0 0 0 0 0
2024 32,913 0 0 0 0 0
2025 33,571 0 0 0 0 0
2026 34,243 0 0 0 0 0
2027 34,927 0 0 0 0 0
2028 35,626 0 0 0 0 0
2029 36,338 0 0 0 0 0
2030 37,065 0 0 0 0 0
2031 37,807 0 0 0 0 0
2032 38,563 0 0 0 0 0
2033 39,334 0 0 0 0 0
2034 40,121 0 0 0 0 0
2035 40,923 0 0 0 0 0
2036 41,741 0 0 0 0 0
2037 42,576 0 0 0 0 0
2038 43,428 0 0 0 0 0
2039 44,296 0 0 0 0 0
2040 45,182 0 0 0 0 0
2041 46,086 0 0 0 0 0
2042 47,008 0 0 0 0 0
2043 47,948 0 0 0 0 0
2043 48,907 0 0 0 0 0
Year Car 2-Wheeler Bus LCV 2/3- Axle
Truck
MAV
2023 34,956 12,320 1,029 4,029 682 219
2024 35,656 12,567 1,050 4,109 696 223
2025 36,369 12,818 1,071 4,191 710 228
2026 37,096 13,074 1,092 4,275 724 232
2027 37,838 13,336 1,114 4,361 739 237
2028 38,595 13,603 1,136 4,448 753 241
2029 39,367 13,875 1,159 4,537 768 246
2030 40,154 14,152 1,182 4,628 784 251
2031 40,957 14,435 1,206 4,720 800 256
2032 41,776 14,724 1,230 4,815 816 261
2033 42,612 15,018 1,254 4,911 832 267
2034 43,464 15,319 1,279 5,009 848 272
2035 44,333 15,625 1,305 5,109 865 277
2036 45,220 15,938 1,331 5,211 883 283
2037 46,124 16,256 1,358 5,316 900 289
2038 47,047 16,581 1,385 5,422 918 294
2039 47,988 16,913 1,413 5,530 937 300
2040 48,947 17,251 1,441 5,641 956 306
2041 49,926 17,596 1,470 5,754 975 312
2042 50,925 17,948 1,499 5,869 994 319
2043 51,943 18,307 1,529 5,986 1,014 325
2043 52,982 18,673 1,560 6,106 1,034 331

estimate of the project. Some of the activities will start in 2015 and the construction is expected tobe
completed in the year 2018, construction period being estimated as 48 months.
The total financial cost of the new link has been worked out as Rs 2,999 crores for southern part and
Rs 6,661 crores for northern part at current financial prices. The distribution of cost has been
estimated as 10% in first year, 30% in second year 30% in third year and 30% in fourth year. The
economic cost for all the items has been assumed as 90% of the financial cost. It may be noted half
the cost is considered for the analysis as one way traffic volume is taken.
MaintenanceCost
The facility is to be maintained in good condition to ensure that the level of service provided to the
users is not below their expectation. It normally consists of different maintenance packages provided
in the program and its periodicity. The economic cost of the construction, maintenance like crack
Table 12.9: Economic Costs for Vehicle Operating and Travel Time – Southern Part
sealing, patch works etc has been incorporated
maintenance has been considered as;
Existing Road (2 Lane-One way width)
in recurring cost. The financial cost various
Routine maintenance (Yearly)
Periodic maintenance (Every fifth year)
Proposed Road (4 Lane-One way width)
Routine maintenance (Yearly)
Periodic maintenance (Every fifth year)
-
-
Rs 1,200,000/ Km
Rs 3,500,000/ Km
-
-
Rs 2,000,000/ Km
Rs 6,000,000/ Km
12.5 Project Benefits
Road user benefits will be from vehicle operating cost (VOC) savings, travel time saving, accident
cost saving and saving in maintenance costs. The benefits are likely to accrue from 2019 onwards.
Vehicle Operating Cost
For various types of vehicles the cost for fuel and lubricant and tyre has been worked out from the
equations developed in IRC: SP-30-2009. The 2009 prices have been escalated for the base year 2014
using WPI.
Travel TimeSaving
The average journey speed along the proposed link has been assumed as 75 Kmph for cars, whereas
for the existing road it is around 21 Kmph. However, for the existing road with reduced traffic in
Alternative II, the average journey speed is assumed as 45 Kmph. To have an estimate of value of
travel time for passengers and cargo, the guidelines from the IRC code has been followed as far as
possible. The total economic cost including VOC, travel time cost etc in three Alternatives for the
southern and northern part separately is shown in Table 12.9 and Table 12.10.
212
Year
Economic Costs for Various Categories of Vehicles (Rs/ Km)
Alternative - I Alternative - II Alternative - III
Car2-
WhBus LCV
2Ax
TruckMAV Car
2-
WhBus LCV
2Ax
TruckMAV Car
2-
WhBus LCV
2Ax
TruckMAV
2014 8.1 2.5 33.2 12.0 13.4 21.5 8.1 2.5 33.2 12.0 13.4 21.5 7.2 2.4 29.2 11.2 12.0 19.8
2015 10.0 3.3 54.8 20.0 18.1 36.2 9.2 2.9 44.2 16.4 15.3 32.3 7.2 2.4 29.2 11.2 12.0 20.1
2016 10.2 3.4 56.1 20.6 18.5 36.6 9.3 3.0 45.5 16.8 15.7 33.3 7.2 2.4 29.3 11.2 12.0 20.2
2017 10.4 3.5 56.7 21.0 19.0 37.0 9.4 3.0 46.7 17.2 16.0 34.2 7.2 2.4 29.4 11.3 12.0 20.4
2018 10.7 3.6 57.4 21.2 19.5 37.5 9.4 3.1 48.1 17.7 16.3 34.7 7.2 2.4 29.6 11.3 12.1 20.7
2019 10.9 3.7 58.1 21.5 20.1 37.9 9.6 3.1 49.5 18.2 16.7 35.1 7.2 2.4 29.8 11.4 12.2 21.0
2020 11.1 3.8 58.8 21.8 20.6 38.4 9.7 3.2 51.0 18.7 17.1 35.4 7.2 2.4 29.9 11.4 12.3 21.3
2021 11.4 3.8 59.6 22.1 21.2 38.9 9.8 3.3 52.6 19.3 17.5 35.7 7.2 2.4 30.1 11.5 12.4 21.6
2022 11.7 3.8 60.4 22.4 21.9 39.5 10.0 3.3 54.3 19.9 17.9 36.1 7.2 2.4 30.3 11.6 12.4 22.0
2023 12.0 3.8 61.3 22.7 22.5 40.1 10.2 3.4 55.9 20.5 18.4 36.5 7.2 2.5 30.5 11.6 12.5 22.3
2024 12.3 3.8 62.2 23.1 23.2 40.7 10.4 3.5 56.6 20.9 18.9 36.9 7.2 2.5 30.7 11.7 12.6 22.7
2025 12.6 3.8 63.2 23.4 24.0 41.3 10.6 3.6 57.2 21.2 19.4 37.3 7.2 2.5 31.1 11.8 12.9 23.1
2026 12.9 3.8 64.2 23.8 24.8 42.0 10.8 3.6 57.9 21.4 19.9 37.8 7.2 2.5 31.4 12.0 13.1 23.5
2027 13.3 3.8 65.3 24.0 25.6 42.7 11.1 3.7 58.6 21.7 20.5 38.3 7.3 2.5 31.8 12.1 13.3 24.0
2028 13.5 3.8 66.4 24.0 26.2 42.9 11.3 3.8 59.4 22.0 21.1 38.8 7.3 2.5 32.2 12.3 13.6 24.4
2029 13.7 3.8 66.5 24.0 26.6 42.9 11.6 3.8 60.2 22.3 21.7 39.3 7.4 2.5 32.6 12.5 13.8 24.9
2030 13.8 3.8 66.5 24.0 26.8 42.9 11.9 3.8 61.0 22.6 22.3 39.9 7.4 2.6 33.1 12.7 14.1 25.4
2031 14.0 3.8 66.5 24.0 26.8 42.9 12.2 3.8 61.9 23.0 23.0 40.5 7.5 2.6 33.5 12.9 14.4 26.0
2032 14.1 3.8 66.5 24.0 26.8 42.9 12.5 3.8 62.9 23.3 23.8 41.1 7.5 2.6 34.0 13.1 14.7 26.6
2033 14.3 3.9 66.5 24.0 26.8 42.9 12.8 3.8 63.9 23.7 24.5 41.8 7.6 2.6 34.5 13.3 15.0 27.1
2034 14.5 3.9 66.5 24.0 26.8 42.9 13.2 3.8 64.9 24.0 25.4 42.5 7.7 2.6 35.0 13.5 15.4 27.8
2035 14.7 3.9 66.5 24.0 26.8 42.9 13.5 3.8 66.1 24.0 26.0 42.9 7.7 2.7 35.6 13.8 15.7 28.4
2036 14.9 3.9 66.5 24.0 26.8 42.9 13.6 3.8 66.5 24.0 26.5 42.9 7.8 2.7 36.2 14.0 16.1 29.1
2037 15.1 4.0 66.5 24.0 26.8 42.9 13.8 3.8 66.5 24.0 26.8 42.9 7.9 2.7 36.8 14.3 16.5 29.8
2038 15.3 4.0 66.5 24.0 26.8 42.9 13.9 3.8 66.5 24.0 26.8 42.9 8.0 2.7 37.4 14.5 16.9 30.6
2039 15.6 4.0 66.5 24.0 26.8 42.9 14.1 3.8 66.5 24.0 26.8 42.9 8.0 2.8 38.1 14.8 17.3 31.4
2040 15.8 4.1 66.5 24.0 26.8 42.9 14.3 3.9 66.5 24.0 26.8 42.9 8.1 2.8 38.8 15.1 17.7 32.2
2041 16.1 4.1 66.5 24.0 26.8 42.9 14.4 3.9 66.5 24.0 26.8 42.9 8.2 2.8 39.6 15.5 18.2 33.1
2042 16.2 4.1 66.5 24.0 26.8 42.9 14.6 3.9 66.5 24.0 26.8 42.9 8.3 2.9 40.4 15.8 18.7 34.0
2043 16.2 4.2 66.5 24.0 26.8 42.9 14.8 3.9 66.5 24.0 26.8 42.9 8.4 2.9 41.2 16.1 19.2 35.0
2043 16.2 4.2 66.5 24.0 26.8 42.9 15.0 4.0 66.5 24.0 26.8 42.9 8.5 2.9 42.1 16.5 19.8 36.0

Table 12.10: Economic Costs for Vehicle Operating and Travel Time – Northern Part 12.6 Economic Internal Rate of Return (EIRR)
Based on the assumptions the saving from vehicle operating costs and travel time costs have been
calculated separately. The year-wise cost and benefit streams are presented in Table 12.11.
It has been observed that EIRR values for southern and northern parts work out to be 15.19% and
12.86% respectively. The Net Present Values (NPV) in these Alternatives are Rs 384.46 crores and
Rs 205.65 crores respectively. For the total combined stretch the EIRR and NPV values for are
13.64% and Rs 590.11 crores respectively.
213
Year Economic Costs for Various Categories of Vehicles (Rs/ Km)
Alternative - I Alternative - II Alternative - III
Car 2-W h
Bus LCV 2A x Tr uc k
MAV Car 2-Wh
Bus LCV 2A x
Tru ck
MAV Car 2-Wh
Bus LCV
2Ax Truc
k
MAV
2014 8.1 2.5 33.2 12.0 13.4 21.5 8.1 2.5 33.2 12.0 13.4 21.5 7.2 2.4 29.2 11.2 12.0 19.8
2015 12.4 3.8 62.6 23.2 23.5 40.9 11.1 3.7 58.8 21.8 20.6 38.4 7.2 2.4 29.3 11.3 12.0 20.3
2016 12.7 3.8 63.5 23.6 24.3 41.6 11.4 3.8 59.6 22.1 21.2 38.9 7.2 2.4 29.5 11.3 12.1 20.5
2017 13.0 3.8 64.6 24.0 25.1 42.2 11.7 3.8 60.4 22.4 21.9 39.5 7.2 2.4 29.7 11.4 12.1 20.8
2018 13.4 3.8 65.7 24.0 25.9 43.0 11.9 3.8 61.3 22.7 22.5 40.1 7.2 2.4 29.8 11.4 12.2 21.1
2019 13.6 3.8 66.5 24.0 26.3 42.9 12.3 3.8 62.2 23.1 23.2 40.7 7.2 2.4 30.0 11.5 12.3 21.4
2020 13.7 3.8 66.5 24.0 26.7 42.9 12.6 3.8 63.2 23.4 24.0 41.3 7.2 2.4 30.2 11.5 12.4 21.7
2021 13.9 3.8 66.5 24.0 26.8 42.9 12.9 3.8 64.2 23.8 24.8 42.0 7.2 2.4 30.4 11.6 12.5 22.1
2022 14.0 3.8 66.5 24.0 26.8 42.9 13.3 3.8 65.2 24.0 25.6 42.7 7.2 2.5 30.6 11.6 12.6 22.5
2023 14.2 3.8 66.5 24.0 26.8 42.9 13.5 3.8 66.4 24.0 26.1 42.9 7.2 2.5 30.8 11.7 12.7 22.8
2024 14.4 3.9 66.5 24.0 26.8 42.9 13.7 3.8 66.5 24.0 26.6 42.9 7.2 2.5 31.2 11.9 12.9 23.3
2025 14.6 3.9 66.5 24.0 26.8 42.9 13.8 3.8 66.5 24.0 26.8 42.9 7.2 2.5 31.6 12.0 13.2 23.7
2026 14.8 3.9 66.5 24.0 26.8 42.9 14.0 3.8 66.5 24.0 26.8 42.9 7.3 2.5 31.9 12.2 13.4 24.1
2027 15.0 3.9 66.5 24.0 26.8 42.9 14.1 3.8 66.5 24.0 26.8 42.9 7.3 2.5 32.3 12.4 13.7 24.6
2028 15.2 4.0 66.5 24.0 26.8 42.9 14.3 3.9 66.5 24.0 26.8 42.9 7.4 2.6 32.8 12.6 13.9 25.1
2029 15.4 4.0 66.5 24.0 26.8 42.9 14.5 3.9 66.5 24.0 26.8 42.9 7.4 2.6 33.2 12.7 14.2 25.6
2030 15.6 4.0 66.5 24.0 26.8 42.9 14.7 3.9 66.5 24.0 26.8 42.9 7.5 2.6 33.7 12.9 14.5 26.2
2031 15.9 4.1 66.5 24.0 26.8 42.9 14.9 3.9 66.5 24.0 26.8 42.9 7.6 2.6 34.2 13.2 14.8 26.8
2032 16.2 4.1 66.5 24.0 26.8 42.9 15.1 4.0 66.5 24.0 26.8 42.9 7.6 2.6 34.7 13.4 15.1 27.4
2033 16.2 4.1 66.5 24.0 26.8 42.9 15.3 4.0 66.5 24.0 26.8 42.9 7.7 2.7 35.2 13.6 15.5 28.0
2034 16.2 4.2 66.5 24.0 26.8 42.9 15.6 4.0 66.5 24.0 26.8 42.9 7.8 2.7 35.8 13.8 15.8 28.7
2035 16.2 4.2 66.5 24.0 26.8 42.9 15.8 4.1 66.5 24.0 26.8 42.9 7.8 2.7 36.4 14.1 16.2 29.4
2036 16.2 4.3 66.5 24.0 26.8 42.9 16.1 4.1 66.5 24.0 26.8 42.9 7.9 2.7 37.0 14.4 16.6 30.1
2037 16.2 4.3 66.5 24.0 26.8 42.9 16.2 4.1 66.5 24.0 26.8 42.9 8.0 2.8 37.7 14.6 17.0 30.9
2038 16.2 4.4 66.5 24.0 26.8 42.9 16.2 4.2 66.5 24.0 26.8 42.9 8.1 2.8 38.4 14.9 17.4 31.7
2039 16.2 4.4 66.5 24.0 26.8 42.9 16.2 4.2 66.5 24.0 26.8 42.9 8.2 2.8 39.1 15.3 17.9 32.5
2040 16.2 4.5 66.5 24.0 26.8 42.9 16.2 4.3 66.5 24.0 26.8 42.9 8.2 2.8 39.8 15.6 18.4 33.4
2041 16.2 4.5 66.5 24.0 26.8 42.9 16.2 4.3 66.5 24.0 26.8 42.9 8.3 2.9 40.6 15.9 18.9 34.4
2042 16.2 4.6 66.5 24.0 26.8 42.9 16.2 4.3 66.5 24.0 26.8 42.9 8.4 2.9 41.5 16.3 19.4 35.4
2043 16.2 4.7 66.5 24.0 26.8 42.9 16.2 4.4 66.5 24.0 26.8 42.9 8.5 3.0 42.4 16.7 19.9 36.2
2043 16.2 4.7 66.5 24.0 26.8 42.9 16.2 4.5 66.5 24.0 26.8 42.9 8.7 3.0 43.3 17.0 20.5 36.7

Table 12.11: Economic Costs and Benefit Streams for the Project Case – II
Case – III
:
:
Benefit decreased by 15%
Cost increased by 15% and Benefit decreased by 15%(Rs in Crores)
It has been observed that IRR values are only moderately sensitive for cost and benefit changes,
more sensitivity has been observed for decrease in benefits. The results of sensitivity analysis for the
combined stretch are presented in Table 12.12.
Table 11.12: Sensitivity Analysis for the Project for the Project
Crores)
12.7 Conclusion for Economic Analysis
From the results it may be concluded that, the construction of the proposed Coastal road may be
considered as economically viable.
$ - As one way traffic (50%) is considered, cost is taken at 50%
Sensitivity Analysis
The sensitivity analysis is required to be done through three different situations as;
Case – I : Cost increased by 15%
214
Situation EIRR NPV (Rs in
Base situation 13.64% 590.11
Case –I : Cost increased by 15% 12.27% 106.87
Case –II: Benefits decreased by 15% 12.05% 18.36
Case –III: Cost increased by 15% + Benefit decreased by 15% 10.78% (-) 464.88
Year Southern Part Northern Part
Cost Stream$
BenefitStream $
Net Benefit Cost Stream $ BenefitStream $
Net Benefit
2015 135.00 0.00 -135.00 299.75 0.00 -299.75
2016 404.91 0.00 -404.91 899.24 0.00 -899.24
2017 404.91 0.00 -404.91 899.24 0.00 -899.24
2018 404.99 0.00 -404.99 899.24 0.00 -899.24
2019 0.04 142.17 142.13 0.00 296.70 296.70
2020 2.31 157.00 154.69 3.95 309.51 305.56
2021 2.31 171.53 169.22 3.95 322.29 318.34
2022 2.31 186.42 184.11 3.95 336.34 332.39
2023 2.39 202.89 200.50 3.95 356.71 352.76
2024 6.85 223.09 216.25 11.85 385.16 373.31
2025 2.31 245.75 243.44 3.95 415.87 411.92
2026 2.31 270.16 267.85 3.95 449.58 445.63
2027 2.31 296.38 294.07 3.95 486.31 482.36
2028 2.39 319.25 316.86 3.95 526.35 522.40
2029 6.85 334.57 327.72 11.85 570.05 558.20
2030 2.31 350.22 347.91 3.95 617.75 613.80
2031 2.31 366.37 364.05 3.95 669.85 665.91
2032 2.31 383.01 380.70 3.95 726.81 722.86
2033 2.39 400.13 397.74 3.95 757.11 753.16
2034 6.85 418.31 411.47 11.85 778.71 766.86
2035 2.31 440.27 437.96 3.95 799.16 795.21
2036 2.31 474.57 472.26 3.95 818.13 814.18
2037 2.31 513.14 510.83 3.95 845.84 841.89
2038 2.39 555.27 552.87 3.95 889.54 885.59
2039 6.85 601.24 594.39 11.85 935.25 923.41
2040 2.31 651.44 649.12 3.95 983.04 979.09
2041 2.31 706.29 703.98 3.95 1,032.96 1,029.02
2042 2.31 750.90 748.59 3.95 1,085.09 1,081.14
2043 2.39 776.54 774.15 3.95 1,139.47 1,135.52
2043 6.85 801.78 794.93 11.85 1,196.16 1,184.32

13. Financial Analysis and Funding Options for Development,
Maintenance and management
13.1 Approach & Methodology
For determining the viability of the Project, the capital cost involved in construction and operation &
maintenance cost has been matched against the total revenues accruing from the project. The
Discounted Cash Flow method has been used for working out the Project Internal Rate of Return
(IRR). This covers aspects like financing through debt and equity, loan repayment, debt servicing,
depreciation, etc.
The viability of the project is evaluated on the basis of:
Project IRR on total investment, and
Equity IRR on equity investment
13.4 Final Alignment Option
The financial projections and key indicators have been drawn for the Mumbai Coastal road project
encompassing a total length of 35.6 km. However Final Alignment option length is 34.54 km which
is adopted for calculation.
Total Project Cost
Based on the above assumptions, + 25 years period +7 years p.a.)assumptions have been made, The
Total Project Cost (TPC) has been calculated as follows:
13.2 Project Timelines
The Concession Period for the project as per CA is 30 years (up to 2043/44).
13.3 Total Investment Costs
13.3.1 Phasing of Construction
The project‘s construction is expected to be phased out over a period of 30 months (2.5 years). The
exact expenditure phasing adopted for the financial modelling purpose is detailed below:13.5 Operation and Maintenance Costs
The principal O&M expenses in the project include administrative expenses including salary, toll
collection expenses, routine repair expenses and periodic overlay costs. The assumptions with regard
to O&M expenses are as tabulated below:
13.3.2 Interest during construction (IDC)
During the construction period, interest accruing on debt during construction shall be capitalized
and included in Total Project Cost.
13.3.3 Means of Finance
As per the guidelines of National Highway Authority of India (NHAI), terms of financing for the
project has been assumed as follows for the financial analysis:
215
Year
Amount in Cr.
Routine Maintenance including tolling
Periodic Maintenance Total
1st 2014-15 - - -
2nd 2015-15 - - -
3rd 2016-17 - - -
Phasing of Construction
Ye FY 15 FY 16 FY 17 Total
Completion 10% 43% 47% 100%
Project Timelines
Event Date Comment
Construction Commencement Date Year 2014-15 Expected commencement date
Construction Completion Date Year, 2017-18 Construction Period of 30 months
Concession Period End Date Year 2043-44 Concession Period of 30 years (including construction)
S.No Project Cost (Millions INR) Cost
1 Civil Construction Cost 94,238.50
2 Contingencies 942.39
3 Base Cost (1+2) 95,180.89
4 IC/Pre-Operative Expenses 951.81
5 Total Cost (3+4) 96,132.69
6 Escalation in EPC during construction 6,638.87
7 Total Cost (with Escalation) (5+6) 102,771.56
8 Financing Expenses 767.15
9 Project Cost without IDC (7+8) 103,538.71
10 Interest During Construction (IDC) 9,443.93
11 Total Project Cost (9+10) 112,982.64
Terms of Financing
Debt Equity ratio 70:30
Interest Rate 11.75 % p.a.
Moratorium Period 2.5 Years (Construction period of 2years plus 6 months)
Loan Tenure 13 Years
Debt drawdown After 100% equity infusion

Toll income collected from vehicles using the facility is the principal income for the project over the
years. Toll income would be product of toll rates and traffic volumes. The traffic volume figures
have been provided to us by the Technical Consultant. The same have been used for the purpose of
computing the toll revenues.
The traffic volumes in terms of ADT for the year 2013 are described in the table below:
before NH4 (2013-14)
The traffic has been projected over the years with a year on year escalation of 5%.
Further, for revenue calculation, a leakage of 3% has been applied for Cars/Jeeps/Vans and traffic is
discounted by 20% for Cars/Jeeps/Vans and 10% for other vehicles. The local traffic who will pay
50% of toll has been taken as 15% for Car/Jeep/Man, 30% for Mini buses, Buses and LCVs, 20%
for Trucks and 3-Axles and 0% for other vehicles.
Toll Structure
The toll rates have been assumed as per the Maharashtra State Toll Policy NHAI Toll Policy 2008
and 2011. The base toll rates are as follows:
(Rs./Km/Vehicle)
The annual O & M cost of the project in the year of commencement is estimated at Rs 13080
million. The O & M cost (annual as well as periodic) over the operating period of 30 years are
presented in the table below. The rate of inflation assumed in updating the O & M cost is 5% p.a.
Note: As per NHAI Toll policy, additional fee for structures with civil construction cost greater than
Rs. 50 Cr has been considered.
Toll rates over the years are escalated based on the WPI index till the date is available. Later, the rates
are escalated by 5% p.a.13.6 Profitability Projections
Traffic Assumptions
216
S.No. Vehicle TypeFour Lane Highway
1 Car/ Jeep/Van/LMV 0.65
2 LCV/LGV/Mini Bus 1.05
3 Truck/Bus 2.20
4 3 Axle Commercial Vehicle 2.40
5 HCM/MAV 3.45
6 Over sized vehicle 4.20
S.No. Vehicle Type PCU FactorToll Plaza after the tunnel
1 Cars, passenger vans, jeep 1 184,458
2 LCV 2 9,506
3 Mini Buses 2 143
4 Buses 3.7 2,343
5 Trucks of 2 Axle 3.7 1,944
6 3 Axle trucks 3.7 582
7 MAV 3.7 5
8 Oversized vehicle 5 0
9 Total Traffic (in numbers) ADT 198982
Year
Amount in Cr.
Routine Maintenance including tolling
Periodic Maintenance Total
4th 2017-18 2.56 4.20 6.76
5th 2018-19 5.37 - 5.37
6th 2019-20 5.64 - 5.64
7th 2020-21 5.93 - 5.93
8th 2021-22 6.23 - 6.23
9th 2022-23 6.53 70.15 76.68
10th 2023-24 6.86 73.66 80.52
11th 2024-25 7.21 77.34 84.55
12th 2025-26 7.56 - 7.56
13th 2026-27 7.94 - 7.94
14th 2027-28 8.34 - 8.34
15th 2028-29 8.75 - 8.75
16th 2029-30 9.20 128.55 137.75
17th 2030-31 9.65 134.97 144.62
18th 2031-32 10.14 141.72 151.86
19th 2032-33 10.65 - 10.65
20th 2033-34 11.18 - 11.18
21st 2034-35 11.74 - 11.74
22nd 2035-36 12.32 - 12.32
23rd 2036-37 12.93 41.90 54.83
24th 2037-38 13.59 43.99 57.58
25th 2038-39 14.26 46.19 60.45
26th 2039-40 14.98 48.50 63.48
27th 2040-41 15.73 50.93 66.66
28th 2041-42 16.51 53.47 69.98
29th 2042-43 17.33 56.15 73.48
30th 2043-44 18.21 58.95 77.16
TOTAL 277.320 1030.680 1308.000

Total Revenues 13.7 Key Financial Indicators
Based on the above financial projections, profitability of the Project has been calculated as below:
217
Results
Concession Period 30.00 Years
Construction Period 2.50 Years
Moratorium Period 3.00 Years
Loan Repayment 10.00 Years
EIRR -2.55%
PIRR 1.47%
NPV at 12% discount rate -
TPC (Rs. in Crore) 11298.26
Grant in % 3.00%
Grant in Rs. 338.95
Premium quoted Annually(Rs. in Crore) -
From To Total In INR Million
1-Apr-17 31-Mar-18 3,511.04
1-Apr-18 31-Mar-19 3,868.06
1-Apr-19 31-Mar-20 4,270.29
1-Apr-20 31-Mar-21 4,713.55
1-Apr-21 31-Mar-22 5,211.58
1-Apr-22 31-Mar-23 5,749.26
1-Apr-23 31-Mar-24 6,351.00
1-Apr-24 31-Mar-25 7,011.90
1-Apr-25 31-Mar-26 7,749.32
1-Apr-26 31-Mar-27 8,557.73
1-Apr-27 31-Mar-28 9,468.68
1-Apr-28 31-Mar-29 10,453.30
1-Apr-29 31-Mar-30 11,559.13
1-Apr-30 31-Mar-31 12,783.38
1-Apr-31 31-Mar-32 14,137.62
1-Apr-32 31-Mar-33 15,633.21
1-Apr-33 31-Mar-34 17,300.36
1-Apr-34 31-Mar-35 19,138.37
1-Apr-35 31-Mar-36 21,181.62
1-Apr-36 31-Mar-37 23,448.80
1-Apr-37 31-Mar-38 25,962.88
1-Apr-38 31-Mar-39 28,745.15
1-Apr-39 31-Mar-40 27,144.92
1-Apr-40 31-Mar-41 30,055.28
1-Apr-41 31-Mar-42 33,276.10
1-Apr-42 31-Mar-43 36,863.10
1-Apr-43 31-Mar-44 40,827.95

14. Bus Rapid Transit
14.1 Introduction
Bus Rapid Transit is a public transportation system that provides faster, more efficient service than
an ordinary bus line. Often this is achieved by making improvements to existing infrastructure,
vehicles and scheduling. The goal is to approach the service quality of rail transit while still enjoying
the cost savings and flexibility of bus transit.
Bus Rapid Transit (BRT) is a high-quality bus based transit system that delivers fast, comfortable and
cost effective urban mobility through:
•
•
•
The provision of right-of-way infrastructure.
Rapid and frequent operations.
Excellence in marketing and customer service.
A BRT system can use existing road systems or be built with dedicated pathways and station systems
depending on the resources available for the project.
Key features of BRT systems include:Figure 14:1 Capital costs per mile of Light Rail versus BRT systems
•
•
Reliability: ensured by high frequency and real time information on buses
Security and comfort: ensured by secured, safe pedestrians access to all weather and secured bus
stops
Quality: improved riding quality by using quality buses with low floor;
Speed: dedicated bus lanes and supporting infrastructure
•
•
BRT offers cost effective, environmentally beneficial and high performance mass transit where
population density often does not justify the construction of costly fixed rail systems and the need
for greater flexibility in route mapping is better served by wheel-to-road transport systems.
How much does BRT cost?
A BRT system will typically cost 4 to 20 times less than an equivalent Light Rail system and up to
100 times less than an equivalent metro rail system.
There are a number of ways in which BRT can save on cost:
• BRT systems can save millions of dollars in cheaper initial build costs and construction times as
well as reductions in traffic and neighbourhood disruption during construction.
• BRT systems can carry the same number of people as light rail systems for a typical cost of four
to twenty less times than an LRT system and 10 to 100 times less than a heavy rail system.
• By using existing road systems BRT can be built in phases and integrated with existing road
systems.
• BRT offers almost immediate public transport solutions and comes with cost effective
expansion options.
218

•
•
Accessibility – increased accessibility to public transport along BRT corridors.
Modal shift to walking and cycling – increased pedestrianisation of land and consequent impacts
on mode share of active transport.
Employment – ancillary growth in employment as a result of BRT related development.
Time savings in bus operating times five minutes and eight to nine minutes generate secondary
benefits by causing mode shift.
Time savings above nine minutes acting to change land use in a positive manner.
•
•
•
Figure 14.2: Total infrastructure costs per kilometre of BRT systems
What are the Benefits of BRT?
In corridors where it has been implemented Bus Rapid Transit (BRT) has delivered well documented
modal shift travel time savings and operational benefits. (See table 1)
There has been less documentation of the secondary and co-benefits of BRT in relation to pre-
existing bus systems and in comparison with alternative modes such as light rail.
Secondary benefits flowing from the implementation of BRT include:
•
•
Land use – positive changes to land use including transit oriented development.
Land value – impacts of BRT on land value along corridors and in relation to distance from
station.
219

Table 14.1: Documentation of Transit Priority Mode Shift Impact Evidence (Currie and Sarvi, 2011) The predominant focus of research into the employment impacts of BRT is in spatial planning for
employment dispersion and the maintenance of low density housing in city areas.
In Ottawa, Ontario, decision makers and planners have developed a multi-centered regional structure
for the area.
Ottawa, the dominant center, is surrounded by primary and secondary employment centers. Under
the Official Plan, downtown Ottawa is to remain the dominant employment center for the region.
(Today, the downtown accounts for 28 percent of regional employment.) Nine primary employment
centers will incorporate 5,000 or more jobs; each of these employment centers must be within 400 m
of existing or future transit way stations.
Secondary employment centers will provide 2,000 to 5,000 jobs. These centers can be off the transit
way but must have access to efficient transit services. The cornerstone for achieving this vision is
Ottawa's exclusive busway system—the most extensive in North America—which captures 70
percent of CBD work-related trips.
The most comprehensive examination of the employment generation impacts of BRT presents an
analysis of construction phase and operational phase of systems and the quality of employment
stemming from the project.
A new BRT system will likely represent a dramatic transformation of the proposed corridors. As with
any project of this magnitude, the system will generate a considerable amount of employment
through the construction process.
Due to the emphasis on high-quality infrastructure and services, BRT employment can range from
artisan work on stations to the direct labour applied to road work. A BRT system also generally
brings with it significant improvements in the quality of the employment as well. The improved
efficiency and lower operating costs in the new system will improve overall profitability. A primary
difference between the BRT and non-BRT scenario in congested corridors would be that for the
non-BRT scenario, after a certain numbser of years, population and employment growth in the
corridor would stop, whereas in the BRT corridor it would continue at historical growth rates.
How does BRT Perform as MassTransit
• BRT has been very successful in attracting ridership growth on operating corridors throughout
the world and has demonstrated great success in moving existing public transport users and
motor vehicle users on to mass transit in Brisbane and Adelaide.
High performance BRT systems have the capacity to move around 40,000 passengers per hour
in one direction.
BRT offers operational flexibility by giving operators the opportunity to offer all-stop and
express services in urban corridors.
BRT roadways can be shared with high occupancy vehicles, taxis, off-peak freight vehicles and
emergency vehicles to help ease urban congestion and improve road safety.
•
•
•In measuring land use impacts of BRT the employment generation benefits of BRT has been
investigated, in a limited capacity.
220
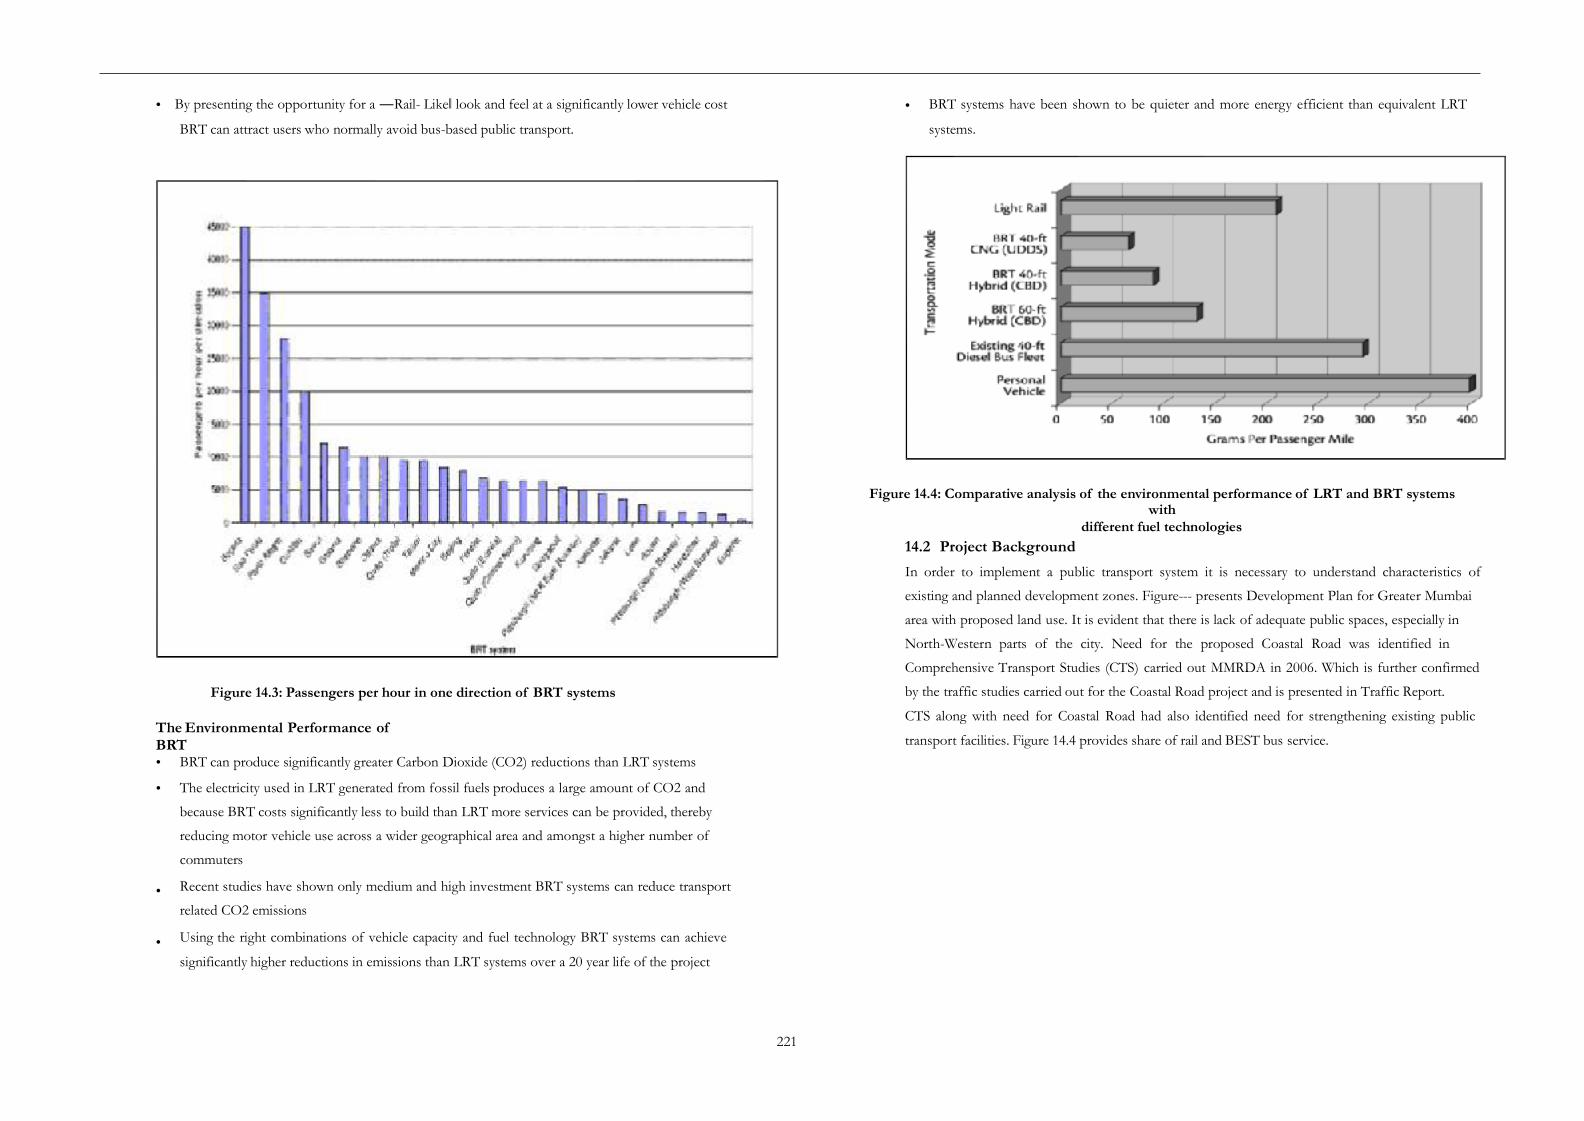
• By presenting the opportunity for a ―Rail- Like‖ look and feel at a significantly lower vehicle cost
BRT can attract users who normally avoid bus-based public transport.
• BRT systems have been shown to be quieter and more energy efficient than equivalent LRT
systems.
Figure 14.4: Comparative analysis of the environmental performance of LRT and BRT systemswith
different fuel technologies
14.2 Project Background
In order to implement a public transport system it is necessary to understand characteristics of
existing and planned development zones. Figure--- presents Development Plan for Greater Mumbai
area with proposed land use. It is evident that there is lack of adequate public spaces, especially in
North-Western parts of the city. Need for the proposed Coastal Road was identified in
Comprehensive Transport Studies (CTS) carried out MMRDA in 2006. Which is further confirmed
by the traffic studies carried out for the Coastal Road project and is presented in Traffic Report.
CTS along with need for Coastal Road had also identified need for strengthening existing public
transport facilities. Figure 14.4 provides share of rail and BEST bus service.
Figure 14.3: Passengers per hour in one direction of BRT systems
The Environmental Performance ofBRT•
•
BRT can produce significantly greater Carbon Dioxide (CO2) reductions than LRT systems
The electricity used in LRT generated from fossil fuels produces a large amount of CO2 and
because BRT costs significantly less to build than LRT more services can be provided, thereby
reducing motor vehicle use across a wider geographical area and amongst a higher number of
commuters
Recent studies have shown only medium and high investment BRT systems can reduce transport
related CO2 emissions
Using the right combinations of vehicle capacity and fuel technology BRT systems can achieve
significantly higher reductions in emissions than LRT systems over a 20 year life of the project
•
•
221

The CTS report also identifies that for existing bus services 99% of the passenger access/egress
stations by walk and rest by Auto Rickshaw. Where as in case of train the percentage of access by
walk is 82%, by bus is 13% and rest by other means like Auto Rickshaw or Taxi.
Growth centers for the island city are indicated in above figure, which is likely to add further
passenger trips on to public transport and on roads.
222

Figure 4.35 and 4.36 presents planned BRT stations along proposed coastal road and its influence
zones business districts and catchments of western line respectively. It is evident that the BRT
system shall provide for the passengers from catchment area away from the existing Western Rail
line, thus filling up gap for public transport. It is evident that any satisfactory provision of BRT
system will attract high number of passengers. Based on diversions observed for various similar
projects it is assumed that at least 10% of passengers will divert to BRT system requiring
ridership of 0.4million passengers with 32,000 passengers during peak hour.
Reference is drawn from various existing successful bus services around the world
daily
Western Line serving the project influence area is overcrowded and handles passengers in excess of
1.5million during peak hours with a daily ridership of 3.6million passengers. Passenger trips during
various times of day are presented in above figure as found by the CTS report.
223
City Istanbul Bogota Ahmadabad
Number of lines 112 12
Number of stations 45144 131
Daily ridership800,000 1,400,000 130,000
Began operation 20072000 2009
Operator(s) IETTTRANSMILENIO AJL
Number of vehicles 334 1265 560
Average Bus Capacity 200 220 60
Passenger per direction in peak hour 19500 40,000
System length 50 km87km 87km

• Considering that Coastal Road is being built to expressway standards with no at grade crossings, it is
essential to accommodate bus lanes on outer side of the carriageway to access intermediate stations.
One lane each on either side shall be in red colour to indicate bus only usage. Lanes shall be assisted by
CCTV system connected to SCADA for detection of violation and incident response;
Offline boarding points are recommended to ensure speed of bus lane. Each stopping point shall be
provided with minimum three platforms with provision for future platforms considering average
stopping time of one minute with frequency of 20seconds for station;
High capacity (190 to 250 passengers) articulated buses shall be used for plying on coastal road with
minimum four wide doors. The buses shall be equipped with low floor and GPS for real-time tracking;
Enclosed transparent bus stop shelters shall be provided at each platform with CCTV monitoring,
direct pedestrian access, real time information on next bus on each route
Various routes shall be derived based on operational demand
A fleet size of 600 high capacity buses is estimated.
Each bus station shall be provided with multi-level car park to enable park and ride facility. Each bus
stop shall also provide for public toilets, 24x7 security, Auto Rickshaw stand or Taxy stand or both as
per permits of the station area.
To provide equal accessibility to all, elevators/ ramps shall be used at all locations for grade separated
crossings
•
•
•
•
•
•
•
•
BRT Station
Influence Area (Walk)
In order to ensure successful BRT system following provisions are proposed:
224
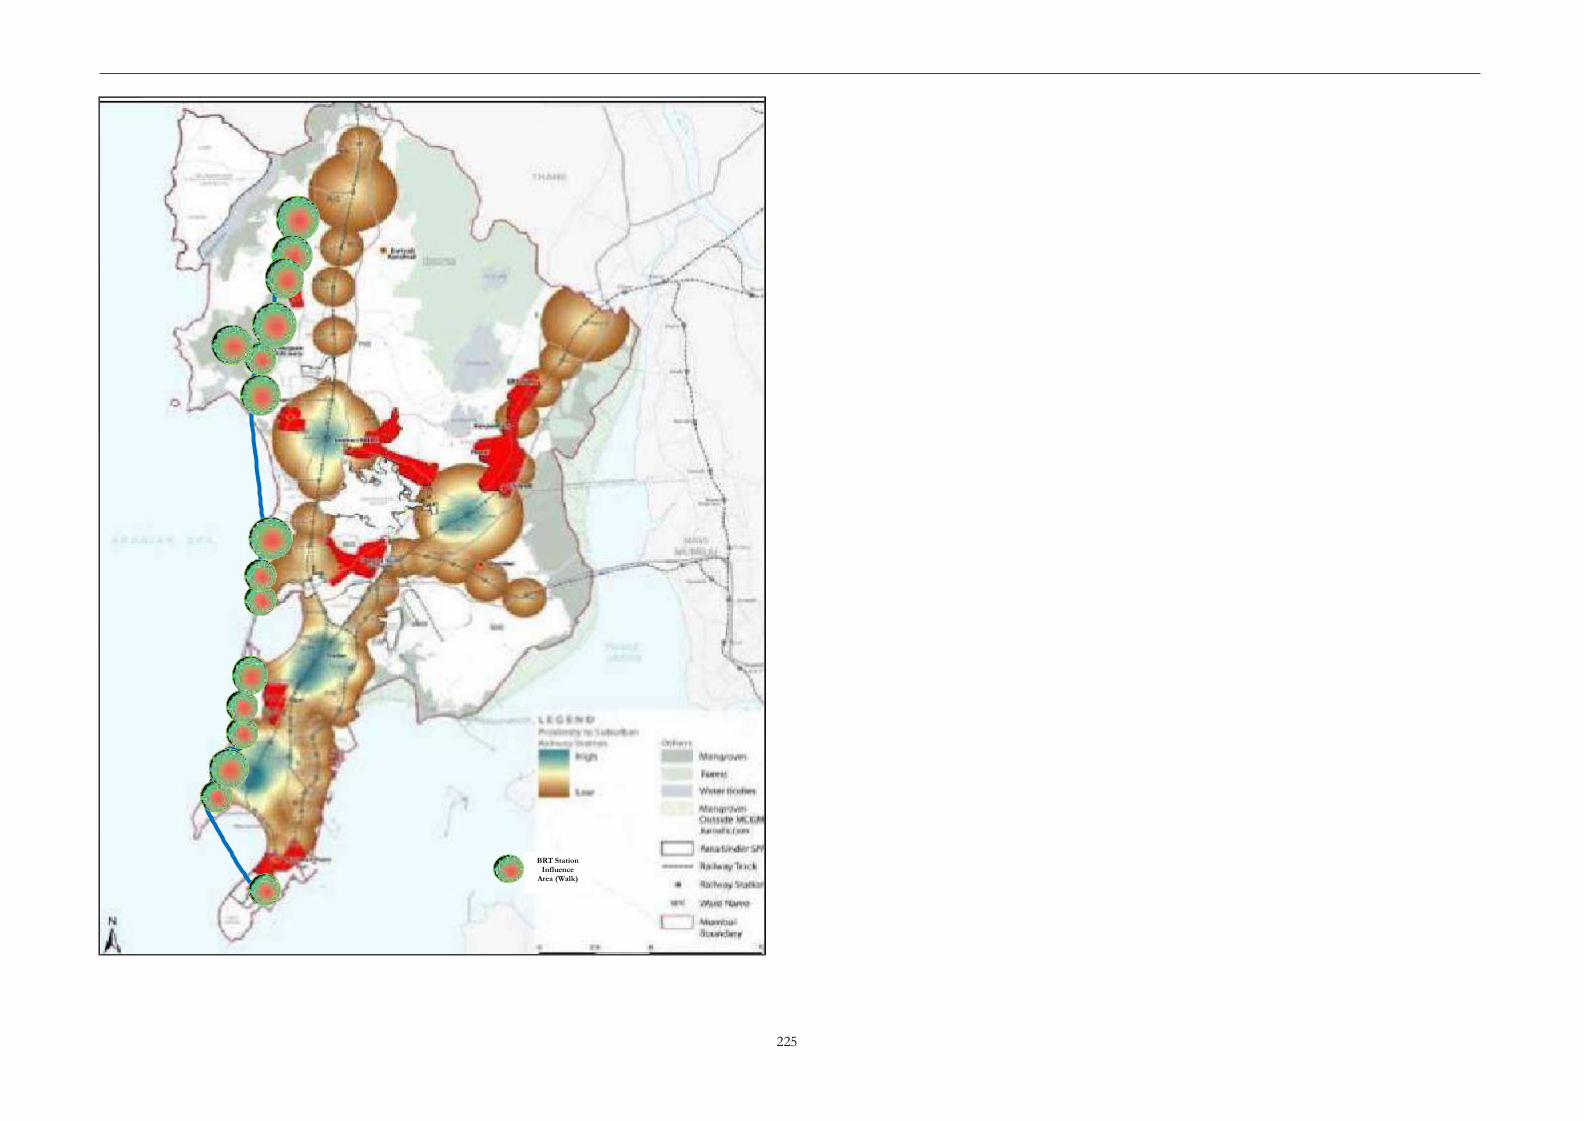
BRT Station Influence
Area (Walk)
225

15. Conclusions and Recommendations •
•
•
Section 5: Bandra End of Sea Link to Juhu Sea Side Garden
Section 6: Juhu Sea Side Garden to Ritumbhara College
Section7: Ritumbhara College to Kandivali Junction and Central Institute of Fisheries, Versova
to Madh Island
15.1 General
The preceding chapters of this report give detailed discussions on the various aspects of the study
carried out by the consultants for Mumbai Coastal road project.
15.4 Option Analysis
Six Alignment options are analyzed considering factors such as engineering standards, cost of
project, social impact and environmental impact.
15.2 Traffic Analysis
From the traffic survey analysis indicated earlier in Chapter 5, the following conclusions can be
made:
From the Traffic analysis we found out that lane requirement for the project are as under 15.5 Alignment Proposals
Chapter 6 presents comparison of various options on the basis of construction, engineering
standards, safety, environment and social impact of project. Comparing pros & cons of all the six
Alignment options as explained in Chapter 6, approval of Alignment Option 7 is recommendedl.
•
•
•
At the end of construction period (Yr 2019) 4 lanes are required
Four lane roads will be saturated in year 2029
Six lane roads will be saturated in year 204315.6 Conclusions & Recommendations for Environmental Impact Assessment
The present CRZ notification issued in January 2011does not allow coastal roads on reclamation
.The MoEF, Central Government of India, is constantly instrumental for strengthening existing
policies for protecting and improving the quality of the coastal environment. The legalFormal system
of coastal zone management in India came into force in 1991. The Coastal Regulation Zone (CRZ)
notification, under the environment Act, is one of the major norms limiting the activities in the
coastal zone. It includes various laws for regulation of anthropogenic interferences by permitting
environmental friendly developments. The Notification was later amendment in January 2001.
Coastal stretches of seas bays, estuaries, creeks, rivers and backwaters influenced by tidal action up to
500 m from High Tide Line (HTL) and the area between HTL and low tide line (LTL) is classified as
CRZ Distance from HTL applied to both sides in rivers, creeks, backwaters and distance shall not be
less than 100 m or width of water bodies whichever is less
CRZ I Zone consists of ecologically sensitive and important areas, and includes mangrove wetlands,
national parks, sanctuaries, and wild life habitats, places of outstanding natural beauty or historical
heritage. Areas close to breeding and spawning grounds of fish, those likely to be inundated due to
sea level rise (consequent upon global warming), and the area between LTL and HTL are covered
under this category. New construction are not permitted within 500 meters of the HTL of CRZ-I.
Land reclamation, bunding or disturbing the natural course of seawater is not allowed in CRZ I area
so appropriate amendments be made in the current CRZ notification (which does not allow
reclamation) for the proposed coastal road system in Mumbai. For this purpose, the state
government needs to move a proposal to the MOEF, GOI for the limited purpose of the proposed
reclamation Most of the road passes through coastal area; hence CRZ notification 6th January 2011
is applicable.
The EIA notification September 14, 2006, states that prior environmental clearance from the
concerned authority is required only for National, State Highways and Expressways. The coastal road
Road is required to be constructed as 4+4 lanes from Priyadarshani park to Kandivali and 2+2lanes
from Princess Street Flyover to Priyadarshini Park. However, the length of road planned as 2+2 lane
shall be constructed to accommodate future 2+2 lanes.
Assuming a balanced directional distribution it may be concluded that a 8-lane road will be able to
cater to the traffic needs satisfactorily till the horizon year.
A median of 11m shall be provided to accommodate 1+1 lanes for future widening in median or for
provision of Mass Rapid Transit Rail system.
A dedicated BRT lane shall be provided on outer most lane with offline bus stations.
The formation of additional east-west links will result in significant increase in traffic volume along
the proposed coastal road.
15.3 Project Constraints and Project Sections
Various Project Constraints have been presented in Chapter 6
Based on traffic pattern and various Engineering and Environmental constraints following broad
sections were identified for construction phasing:
Part 1: South (Princess Street Flyover to Worli end of Sea Link)
•
•
•
•
Section 1: Princess Street Flyover to Priya Darshini Park
Section 2: Priya Darshini Park to Mahalaxmi
Section 3: Mahalaxmi to Baroda Palace
Section 4: Baroda Palace to Worli End of Sea Link
Part 2: North (Bandra end of Sea Link to KandivaliJunction)
226

is yet to be notified; depending on the type of the proposed road the EIA Notification 2006 will be
applicable.
But an Environment Impact assessment study should be conducted and an Environmental
Management plan is to be prepared to get CRZ Clearance and to minimize the environmental
impact during construction and operation of the project.
The project area falls within 10 km of critically polluted area of Thane Belapur Industrial belt.
Therefore, General condition as per ―The Environmental Impact Assessment
Notification
2006‖applied to the project
Forest clearance from Forest Department/MoEF is required as construction in mangrove area is
involved. NOC from High court is also required in reference to PIL 87 of 2006
The project falls within 10sq.km of Sanjay Gandhi National Park (Borivali National Park) hence
SBWL and NBWL clearances are necessary.
Management plan for reclamation area, coastal protection and mangrove are to be formulated.
15.7 Facilities
Provision of following facilities are considered
BRTS as one of the dedicated lane of both carriageways to attract commuters to reduce private
vehicles.
At each bus stop proper entry/exit and connectivity on both carriageway through subway or
aesthetically pleasing foot over bridges to be proposed.
The toilet and drinking water facilities should be made available at suitable distances along the
promenade.
The garden and promenade spaces being very important recreational space, suitable design
landscapes, illumination and street furniture is provided.
The coastal erosion protection measures by providing tetra pods/sea walls at the end of sea side
promenade.
Connectivity to madh island shall provide significant economic benefits, hence shall be undertaken at
earliest.
15.8 Protection Wall (Break water wall)
Considering the storm surge impacts a well designed Break water wall on sea word side of proposed
coastal road is planned with an elevation of about 3.5 m above HHTL
Road level is planned in such a way that it will not impact aesthetic and sea side view of commuters
15.9 Conclusion from Economic analysis and Financial analysis
From the economic analysis results it may be concluded that, the construction of the proposed
Coastal road may be considered as economically viable.
From the Financial analysis results it may be concluded that, the construction of the proposed
Coastal road financially not viable on BOT Basis.
227