final timberland and agricultural impact assessment - 10...
TRANSCRIPT
FINAL REPORT
Timberland and Agricultural Land Impact Assessment For Selected Water Resource Options in the
Sulphur River Basin
Prepared for:
The Sulphur River Basin Authority (SRBA)
October 20, 2015
Prepared by:
Sulphur Basin Group, PLLC 5930 Summerhill Road Texarkana, Texas 75503
903.838‐8533 Project#: SBG15119
FinalTimberland&AgriculturalLandImpactAssessmentfor
SelectedWaterResourceOptionsintheSulphurRiverBasin
ContentsEXECUTIVE SUMMARY .................................................................................................................................. 1
Parcel Impact Analysis .......................................................................................................................... 1
Valuation Process .................................................................................................................................. 4
Summary and Conclusions .................................................................................................................... 9
1 Introduction ........................................................................................................................................ 10
1.1 Initial Assessment ....................................................................................................................... 10
1.2 Final Assessment ......................................................................................................................... 11
2 Collection of Available Data ................................................................................................................ 14
3 Parcel Area Impact .............................................................................................................................. 15
4 Market Volume and Value Impact ...................................................................................................... 28
5 Timber Resource User Impact ............................................................................................................. 37
6 Conclusions ......................................................................................................................................... 39
6.1 Market Value Conclusions .......................................................................................................... 39
6.2 User Impact Additional Conclusions ........................................................................................... 39
FIGURESFigure 1 ‐ WPLR Study Boundaries .............................................................................................................. 16
Figure 2 ‐ MNR Study Boundary .................................................................................................................. 17
Figure 3 ‐ WPLR Impacted Private Parcels .................................................................................................. 18
Figure 4 ‐ MNR Impacted Private Parcels ................................................................................................... 19
Figure 5 – Government‐Owned Parcels & Easements ................................................................................ 20
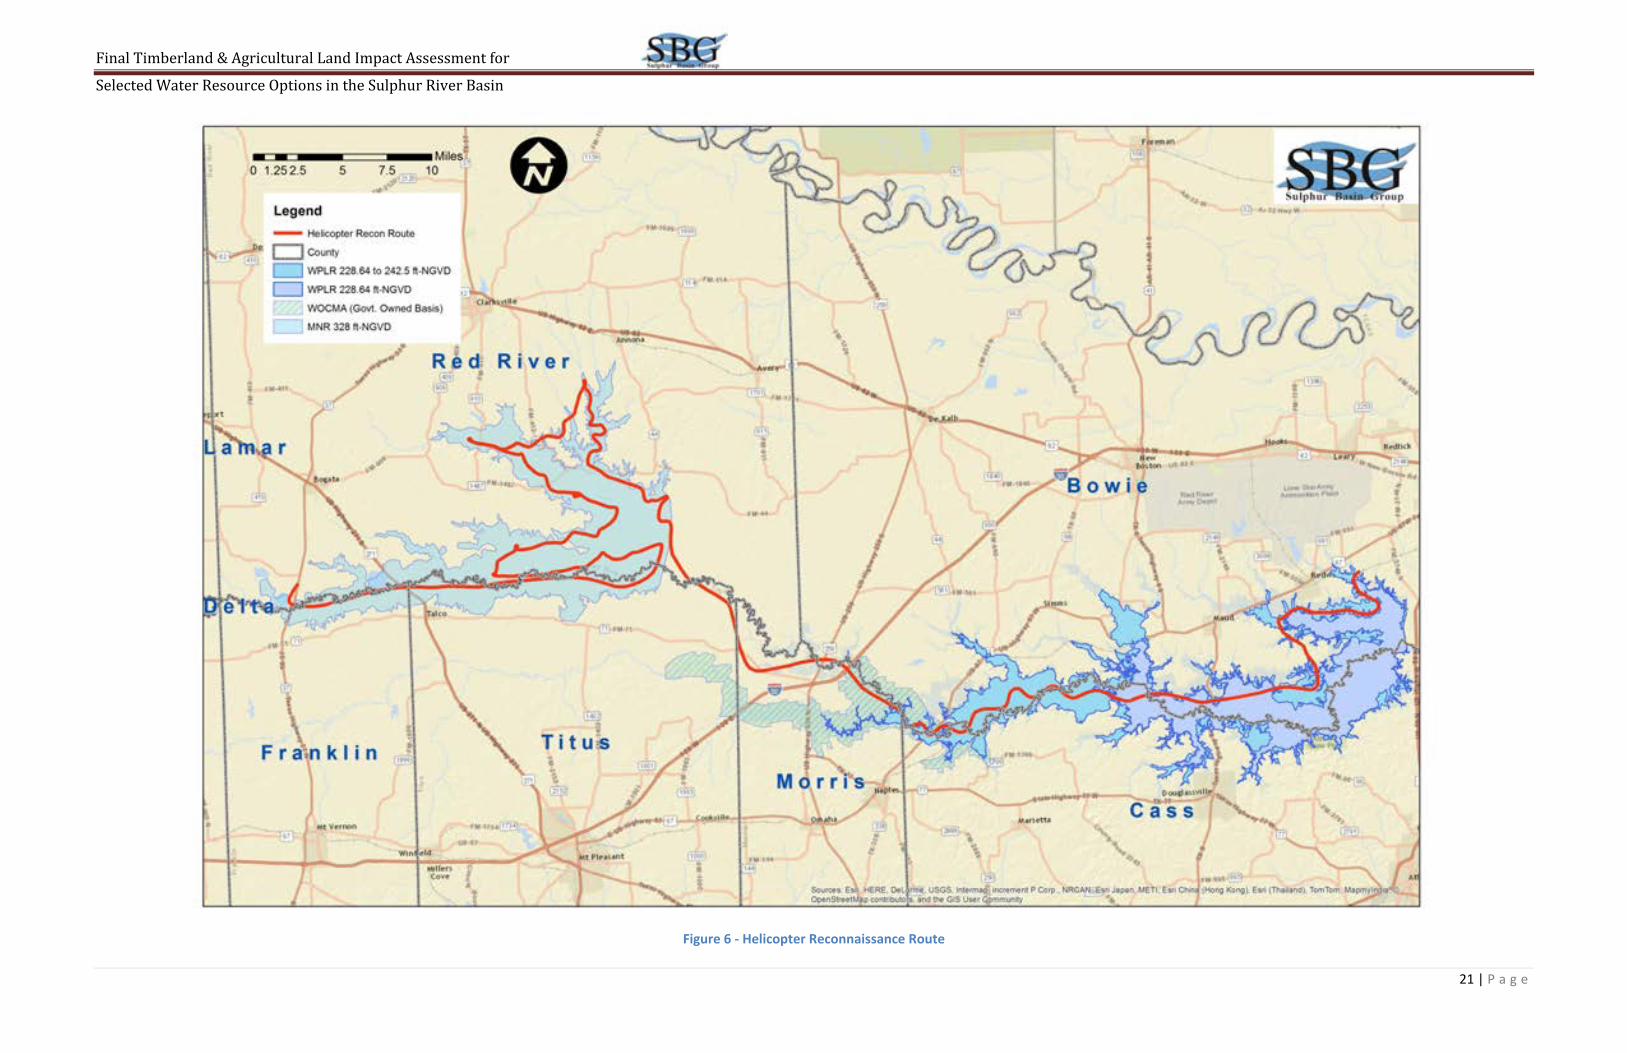
Figure 6 ‐ Helicopter Reconnaissance Route .............................................................................................. 21
Figure 7 ‐ WPLR Impact Classifications ....................................................................................................... 26
Figure 8 ‐ MNR Impact Classifications ......................................................................................................... 27
TABLESTable ES‐1 – General Land Use Classification ............................................................................................... 2 Table ES‐2 – Extent of Impacted Land by Classification at Wright Patman Lake (acres) .............................. 3 Table ES‐3 – Extent of Impacted Land by Classification at Marvin Nichols Reservoir (acres) ...................... 4 Table ES‐4 – Timber Assessment by Classification Type – Wright Patman Lake (tons) ................................ 5 Table ES‐5 – Timber Assessment by Classification Type – Marvin Nichols Reservoir (tons) ........................ 6 Table ES‐6 – Value per Acre Classification Type – Wright Patman Lake ....................................................... 7 Table ES‐7 – Value per acre by Classification Type – Marvin Nichols Reservoir ........................................... 7

FinalTimberland&AgriculturalLandImpactAssessmentfor
SelectedWaterResourceOptionsintheSulphurRiverBasin
Table ES‐8 – Estimated Value of Timber & Agriculture on Impacted Lands in Wright Patman Lake ........... 8 Table ES‐9 – Estimated Value of Timber & Agriculture on Impacted Lands in Marvin Nichols Reservoir ... 8 Table ES‐10 – Comparison of Impact Areas & Values ................................................................................... 9
Table 1 ‐ WPLR Parcel Area Impact Summary (Acres) ................................................................................ 24 Table 2 ‐ MNR Parcel Area Impact Summary (Acres).................................................................................. 24
Table 3 ‐ WPLR Itemized Parcel Area Impact (Acres) .................................................................................. 24
Table 4 ‐ MNR Itemized Parcel Area Impact (Acres) ................................................................................... 25
Table 5 ‐ WPLR Market Volume Impact Summary (Tons) ........................................................................... 29
Table 6 ‐ MNR Market Volume Impact Summary (Tons) ............................................................................ 29
Table 7 ‐ WPLR Itemized Market Volume Impact (Tons) ............................................................................ 30
Table 8 ‐ MNR Itemized Market Volume Impact (Tons) ............................................................................. 31
Table 9 ‐ WPLR Land Cover Category Value Per Acre ................................................................................. 32
Table 10 ‐ MNR Land Cover Category Value Per Acre ................................................................................ 33
Table 11 ‐ WPLR Overall Estimated Value .................................................................................................. 33
Table 12 ‐ MNR – Overall Estimated Value ................................................................................................. 33
Table 13 ‐ WPLR Itemized Timber Market Values ...................................................................................... 34
Table 14 ‐ MNR Itemized Timber Market Values ........................................................................................ 35
Table 15 ‐ Analysis of "Harvest Trends 2013" Table Excerpts .................................................................... 38
Table 16 ‐ WPLR Total Timberland & Agricultural Market Value Impact Summary ................................... 39
Table 17 ‐ MNR Total Timberland & Agricultural Market Value Impact Summary .................................... 39
Table 18 ‐ Resource Impact Analysis/Comparison ...................................................................................... 40
AppendicesA Corps of Engineers – Fort Worth District, Confidentiality Agreement B Pictorial Examples of Land Classifications C Quality Control and Assurance

FinalTimberland&AgriculturalLandImpactAssessmentfor
SelectedWaterResourceOptionsintheSulphurRiverBasin
1 | P a g e
EXECUTIVESUMMARY
During the summer of 2015, the Sulphur Basin Group (SBG) conducted a series of inspections and
analyses for the final assessment of impact for potential pool raise (reallocation) and reservoir
construction projects at Wright Patman Lake and the Marvin Nichols 1A damsite within the Sulphur
River Basin on timber and other agricultural production at those sites.
An initial assessment was conducted during the first quarter of 2015, limited in geographic scope to the
area within the 313.5 feet National Geodetic Vertical Datum (ft‐NGVD) contour at the Marvin Nichols
site; at the time, it was thought that this was the largest conservation pool that would be likely to be
necessary to meet targeted project yields. However, additional information developed during the spring
of 2015 indicated that the recent droughts had impacted the estimated firm yield of reservoirs within
the Sulphur Basin to a greater extent than anticipated and that a larger scope of the Marvin Nichols
project should be evaluated.
This need to expand the analysis, along with newly available aerial imagery, provided an opportunity to
better evaluate the study areas with new information and to address concerns developed in the initial
assessment relating to the general lack of public access to evaluate certain timber resources.
Additionally, we were also able to apply “lessons‐learned” from the initial analysis with respect to
developing a more robust and flexible GIS data base to better support a future scenario‐based
assessment. As a result, this final assessment used a more refined approach to evaluate the timber
resources. The final assessment includes estimates of the impacted land area, volume/value of
timberlands, and area/value of agricultural lands impacted within the following project boundaries:
Wright Patman Lake Reallocation: Between elevation 242.5 ft‐NGVD and 228.64ft‐NGVD; and
Marvin Nichols Reservoir: Below elevation 328 ft‐NGVD.
ParcelImpactAnalysisThe respective study area boundaries for both the Wright Patman Lake and Marvin Nichols Reservoir
projects correspond to the maximum anticipated water supply strategies. The initial timber and
agricultural land impact study relied significantly upon County Appraisal District (CAD) parcel appraisal
information in developing a database for each parcel appraised for agricultural land or timberland uses.
The initial assessment employed digitizing of impacts to verify or modify the CAD appraisal records used.
This final impact assessment, while relying upon CAD records somewhat for agricultural land, did not
rely on it at all for timberland, instead opting to focus more on supplementing field reconnaissance and
use of newly available 2015 digital aerial imagery in a GIS format.
As in the initial assessment, SBG again teamed with professional foresters from Kingwood Forestry
Services (KFS). Due to their expertise, KFS performed all impact analysis for the final assessment,

FinalTimberland&AgriculturalLandImpactAssessmentfor
SelectedWaterResourceOptionsintheSulphurRiverBasin
2 | P a g e
utilizing the newly available 2015 (leaf‐off) high resolution digital imagery and helicopter reconnaissance
of the study areas to augment the initial field investigations for timberland classifications. Unlike the
initial study, in this final impact assessment, KFS established GIS “shape files” of impacted parcels,
categorized by size/type of impact within the study area boundaries.
In the case of Wright Patman, the study area represents the difference in acreage between the 242.5 ft‐
NGVD contour and the 228.64 ft‐NGVD contour (top of ultimate rule curve proposed in the Corps
contract with the City of Texarkana). CAD information previously obtained for private parcels in Bowie
and Cass counties in the initial assessment was again used for comparison with map reviews. All
impacts in Morris County were found to occur on government‐owned land at Wright Patman Lake,
within the White Oak Creek Mitigation Area (WOCMA), so no private parcel impacts were assessed for
Morris County. All impacted parcels in Titus, Franklin and Red River counties are in private ownership
and additional CAD information was obtained for these parcels between elevation 313.5 ft‐NGVD (the
limits of initial study) and the 328 ft‐NGVD study limits of this final assessment.
Impacts were generally classified by qualities of Hardwood, Mixed Pine and Hardwood, Pine, Range,
Crop, Wildlife and Water. General land use for each project boundary derived from this process is
shown in Table ES‐1 below.
Table ES‐1 General Land Use Classification
WPLR MNR
Total Impacted Acreage
33,931
66,216
Classification %
Hardwood 59.0% 63.0%
Mixed 28.2% 0.0%
Pine 5.9% 0.4%
Range 2.2% 33.9%
Crop 0.0% 0.7%
Wildlife 4.0% 0.1%
Non‐Ag 0.7% 0.4%
Water 0.0% 1.5%
This schema for itemized land classification was further itemized to reflect the quality/commercial value of the timber in each category generally following the procedures used in the initial efforts. Itemized parcel area impacts used a land cover classification system for timberland of Hardwood (H)(categories 1‐4, with 1 being the highest and 4 having little to no merchantable value), Mixed pine and hardwood (M1‐M4), and Pine (P1‐P4). For agricultural land the system included Rangeland (R1‐R4), Tilled cropland (Crop), Wildlife (W1), Water (water covered land) or Other (Non‐Ag). All agricultural land classifications for the most part adhered to previous classification approach, based on the CAD appraisal system. Total acres of each classification within the project boundary for Wright Patman Lake and Marvin Nichols are shown in Tables ES‐2 and ES‐3, respectively.

FinalTimberland&AgriculturalLandImpactAssessmentfor
SelectedWaterResourceOptionsintheSulphurRiverBasin
3 | P a g e
Table ES‐2 Extent of Impacted Land by Classification at Wright Patman Lake (acres)
CLASS BOWIE CASS GOVERNMENT TOTAL
H1 270 80 13,503 13,853
H2 262 497 2,823 3,582
H3 640 111 1,119 1,870
H4 529 197 0 726
M1 4 56 8,762 8,822
M2 4 30 144 178
M3 68 9 442 519
M4 31 0 6 37
P1 3 0 1,935 1,938
P2 0 0 0 0
P3 32 3 0 35
P4 12 20 0 32
R1 341 56 0 397
R2 6 29 17 52
R3 61 0 0 61
R4 226 0 0 226
CROP 0 0 0 0
W1 0 241 1,102 1,343
NON‐AG 9 0 251 260
WATER 0 0 0 0
TOTAL 2,498 1,329 30,104 33,931
* All values rounded to nearest acre
FinalTimberland&AgriculturalLandImpactAssessmentfor
SelectedWaterResourceOptionsintheSulphurRiverBasin
4 | P a g e
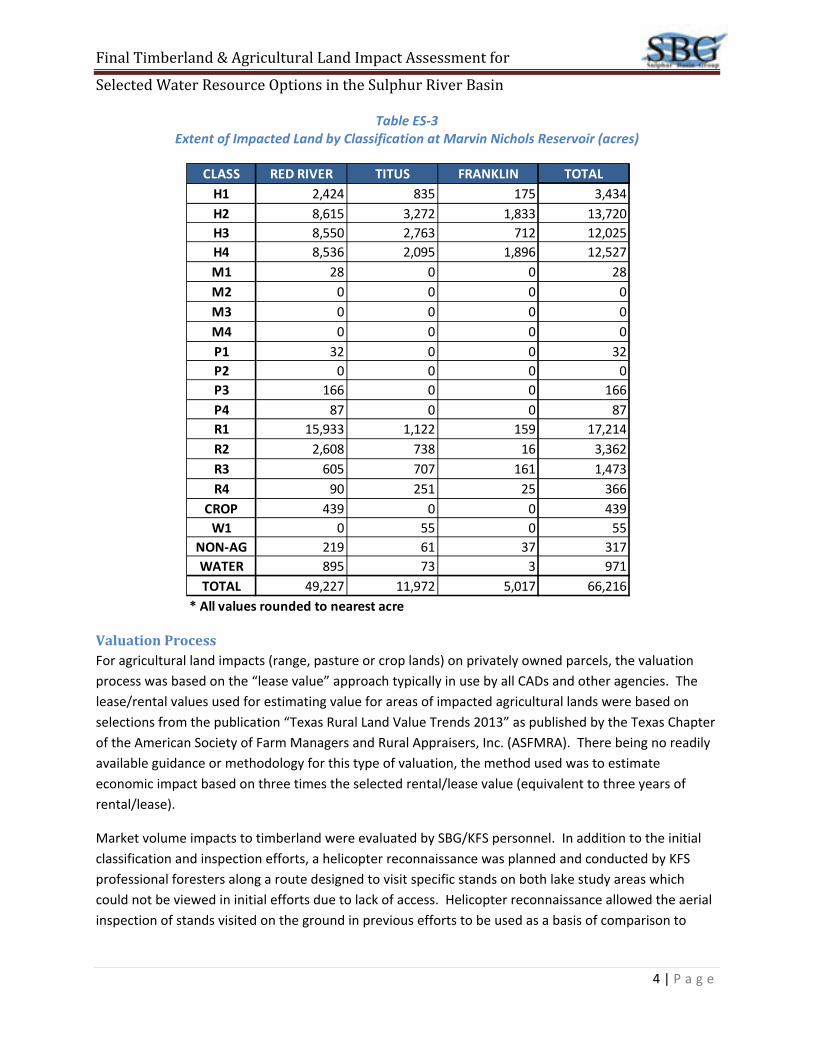
Table ES‐3 Extent of Impacted Land by Classification at Marvin Nichols Reservoir (acres)
ValuationProcessFor agricultural land impacts (range, pasture or crop lands) on privately owned parcels, the valuation
process was based on the “lease value” approach typically in use by all CADs and other agencies. The
lease/rental values used for estimating value for areas of impacted agricultural lands were based on
selections from the publication “Texas Rural Land Value Trends 2013” as published by the Texas Chapter
of the American Society of Farm Managers and Rural Appraisers, Inc. (ASFMRA). There being no readily
available guidance or methodology for this type of valuation, the method used was to estimate
economic impact based on three times the selected rental/lease value (equivalent to three years of
rental/lease).
Market volume impacts to timberland were evaluated by SBG/KFS personnel. In addition to the initial
classification and inspection efforts, a helicopter reconnaissance was planned and conducted by KFS
professional foresters along a route designed to visit specific stands on both lake study areas which
could not be viewed in initial efforts due to lack of access. Helicopter reconnaissance allowed the aerial
inspection of stands visited on the ground in previous efforts to be used as a basis of comparison to
CLASS RED RIVER TITUS FRANKLIN TOTAL
H1 2,424 835 175 3,434
H2 8,615 3,272 1,833 13,720
H3 8,550 2,763 712 12,025
H4 8,536 2,095 1,896 12,527
M1 28 0 0 28
M2 0 0 0 0
M3 0 0 0 0
M4 0 0 0 0
P1 32 0 0 32
P2 0 0 0 0
P3 166 0 0 166
P4 87 0 0 87
R1 15,933 1,122 159 17,214
R2 2,608 738 16 3,362
R3 605 707 161 1,473
R4 90 251 25 366
CROP 439 0 0 439
W1 0 55 0 55
NON‐AG 219 61 37 317
WATER 895 73 3 971
TOTAL 49,227 11,972 5,017 66,216
* All values rounded to nearest acre
FinalTimberland&AgriculturalLandImpactAssessmentfor
SelectedWaterResourceOptionsintheSulphurRiverBasin
5 | P a g e
other unfamiliar stands. Further, specific stands of various classification types were visited which could
not be seen from the ground which also aided in “calibrating” the use of 2015 digital aerial imagery.
The combined use of past inspection efforts, helicopter reconnaissance, and the 2015 digital aerial
imagery facilitated KFS being able to establish better estimates of timber volumes than was possible in
the initial assessment and to gather photo‐documentation of several representative stand types for
visual representation in this report to aid in both volume and value estimates by KFS.
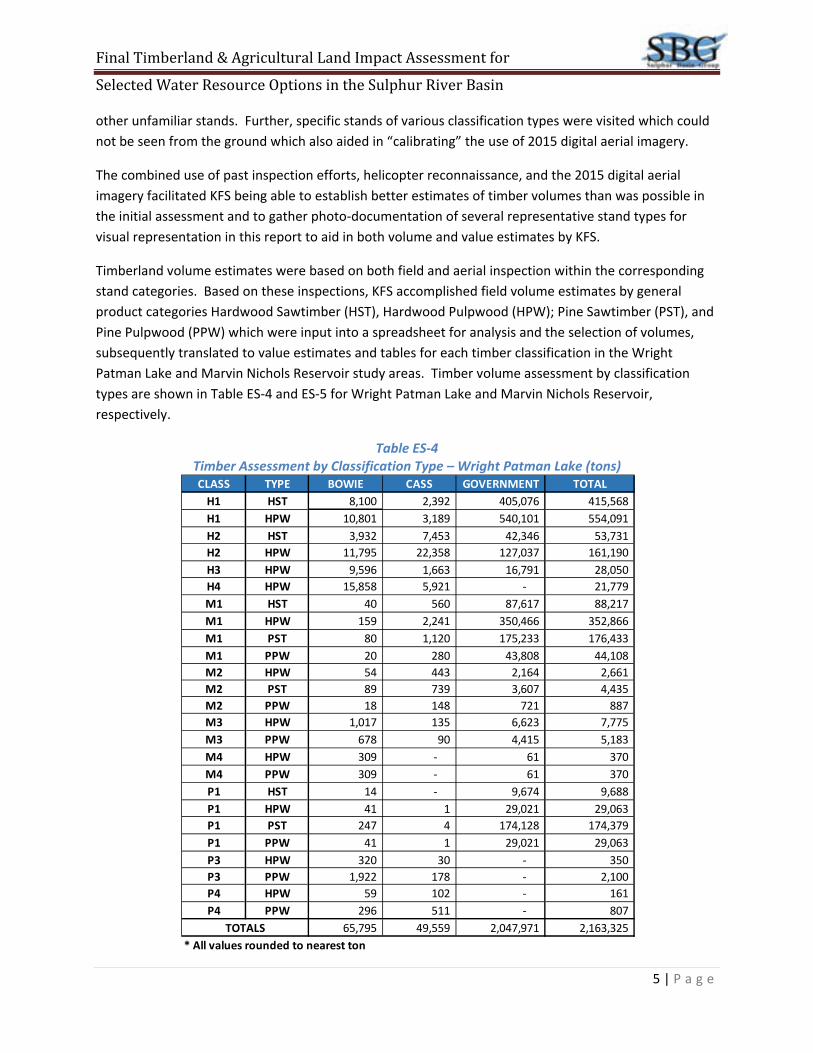
Timberland volume estimates were based on both field and aerial inspection within the corresponding
stand categories. Based on these inspections, KFS accomplished field volume estimates by general
product categories Hardwood Sawtimber (HST), Hardwood Pulpwood (HPW); Pine Sawtimber (PST), and
Pine Pulpwood (PPW) which were input into a spreadsheet for analysis and the selection of volumes,
subsequently translated to value estimates and tables for each timber classification in the Wright
Patman Lake and Marvin Nichols Reservoir study areas. Timber volume assessment by classification
types are shown in Table ES‐4 and ES‐5 for Wright Patman Lake and Marvin Nichols Reservoir,
respectively.
Table ES‐4 Timber Assessment by Classification Type – Wright Patman Lake (tons)
CLASS TYPE BOWIE CASS GOVERNMENT TOTAL
H1 HST 8,100 2,392 405,076 415,568
H1 HPW 10,801 3,189 540,101 554,091
H2 HST 3,932 7,453 42,346 53,731
H2 HPW 11,795 22,358 127,037 161,190
H3 HPW 9,596 1,663 16,791 28,050
H4 HPW 15,858 5,921 ‐ 21,779
M1 HST 40 560 87,617 88,217
M1 HPW 159 2,241 350,466 352,866
M1 PST 80 1,120 175,233 176,433
M1 PPW 20 280 43,808 44,108
M2 HPW 54 443 2,164 2,661
M2 PST 89 739 3,607 4,435
M2 PPW 18 148 721 887
M3 HPW 1,017 135 6,623 7,775
M3 PPW 678 90 4,415 5,183
M4 HPW 309 ‐ 61 370
M4 PPW 309 ‐ 61 370
P1 HST 14 ‐ 9,674 9,688
P1 HPW 41 1 29,021 29,063
P1 PST 247 4 174,128 174,379
P1 PPW 41 1 29,021 29,063
P3 HPW 320 30 ‐ 350
P3 PPW 1,922 178 ‐ 2,100
P4 HPW 59 102 ‐ 161
P4 PPW 296 511 ‐ 807
TOTALS 65,795 49,559 2,047,971 2,163,325
* All values rounded to nearest ton
FinalTimberland&AgriculturalLandImpactAssessmentfor
SelectedWaterResourceOptionsintheSulphurRiverBasin
6 | P a g e
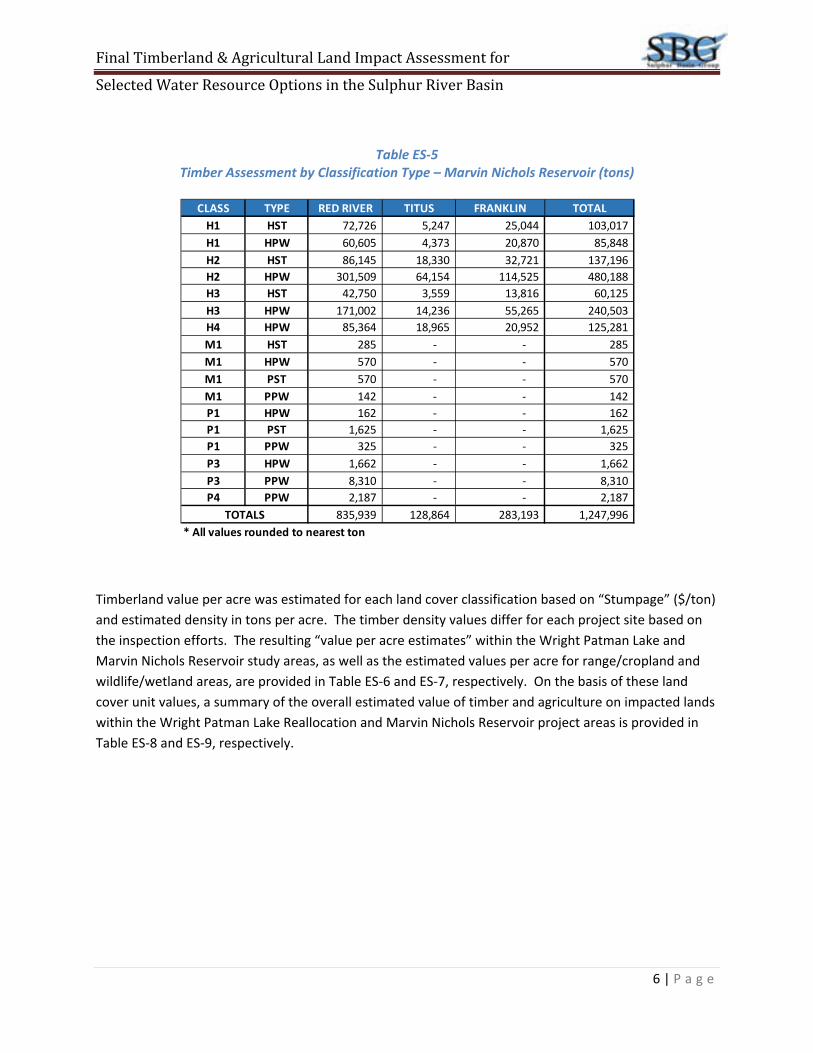
Table ES‐5 Timber Assessment by Classification Type – Marvin Nichols Reservoir (tons)
Timberland value per acre was estimated for each land cover classification based on “Stumpage” ($/ton)
and estimated density in tons per acre. The timber density values differ for each project site based on
the inspection efforts. The resulting “value per acre estimates” within the Wright Patman Lake and
Marvin Nichols Reservoir study areas, as well as the estimated values per acre for range/cropland and
wildlife/wetland areas, are provided in Table ES‐6 and ES‐7, respectively. On the basis of these land
cover unit values, a summary of the overall estimated value of timber and agriculture on impacted lands
within the Wright Patman Lake Reallocation and Marvin Nichols Reservoir project areas is provided in
Table ES‐8 and ES‐9, respectively.
CLASS TYPE RED RIVER TITUS FRANKLIN TOTAL
H1 HST 72,726 5,247 25,044 103,017
H1 HPW 60,605 4,373 20,870 85,848
H2 HST 86,145 18,330 32,721 137,196
H2 HPW 301,509 64,154 114,525 480,188
H3 HST 42,750 3,559 13,816 60,125
H3 HPW 171,002 14,236 55,265 240,503
H4 HPW 85,364 18,965 20,952 125,281
M1 HST 285 ‐ ‐ 285
M1 HPW 570 ‐ ‐ 570
M1 PST 570 ‐ ‐ 570
M1 PPW 142 ‐ ‐ 142
P1 HPW 162 ‐ ‐ 162
P1 PST 1,625 ‐ ‐ 1,625
P1 PPW 325 ‐ ‐ 325
P3 HPW 1,662 ‐ ‐ 1,662
P3 PPW 8,310 ‐ ‐ 8,310
P4 PPW 2,187 ‐ ‐ 2,187
TOTALS 835,939 128,864 283,193 1,247,996
* All values rounded to nearest ton

FinalTimberland&AgriculturalLandImpactAssessmentfor
SelectedWaterResourceOptionsintheSulphurRiverBasin
7 | P a g e
Table ES‐6 Value per Acre by Classification Type – Wright Patman Lake
Table ES‐7 Value per Acre by Classification Type – Marvin Nichols Reservoir
WRIGHT PATMAN LAKE ‐ DENSITIES & UNIT VALUES
STUMPAGE ($/TON) $35.00 $15.00 $30.00 $8.00 VALUE
PRODUCT (TONS/ACRE) HST (TONS/AC) HPW (TONS/AC) PST (TONS/AC) PPW (TONS/AC) ($/ACRE)
CATEGORY
H1 30 40 1,650$
H2 15 45 1,200$
H3 30 450$
H4 15 225$
M1 10 40 20 5 1,590$
M2 15 25 5 1,015$
M3 15 10 305$
M4 10 10 230$
P1 5 15 90 15 3,220$
P2 5 15 50 30 2,140$
P3 10 60 630$
P4 5 25 275$
R1 180$
R2 120$
R3 75$
R4 45$
W1 450$
WATER & NON ‐$
MARVIN NICHOLS RESERVOIR ‐ DENSITIES & UNIT VALUES
STUMPAGE ($/TON) $35.00 $15.00 $30.00 8.00 TOTAL
PRODUCT (TONS/ACRE) HST HPW PST PPW ($/ACRE)
CATEGORY
H1 30 25 1,425$
H2 10 35 875$
H3 5 20 475$
H4 10 150$
M1 10 20 20 5.00 1,290$
M2 5 30 5 10.00 855$
M3 30 450$
M4 10 5.00 190$
P1 5 50 10.00 1,655$
P2 10 25 30.00 1,140$
P3 10 50.00 550$
P4 25.00 200$
R1 180$
R2 120$
R3 75$
R4 45$
CROP 225$
W1 450$
WATER & NON ‐$

FinalTimberland&AgriculturalLandImpactAssessmentfor
SelectedWaterResourceOptionsintheSulphurRiverBasin
8 | P a g e
Table ES‐8 Estimated Value of Timber and Agriculture on Impacted Lands in Wright Patman Lake
Table ES‐9 Estimated Value of Timber and Agriculture on Impacted Lands in Marvin Nichols Reservoir
Tables ES‐8 and ES‐9 indicate that the majority of impacted value within the respective study areas is the result of timberland impacts. Based on these two tables, the impact to total timber and agriculture value within the WPLR is significantly higher than the value of that within the MNR. As previously stated, these are unadjusted figures and area based on the assumption that all of the timber would be considered “in the market”.
PARCELS TOTAL HST HPW PST PPW AGRICULTURE WILDLIFE
Bowie 1,288,720$ 423,010$ 750,135$ 12,480$ 26,272$ 76,823$ ‐$
Cass 1,092,882$ 364,175$ 541,245$ 55,890$ 9,664$ 13,597$ 108,311$
Government 46,860,189$ 19,064,955$ 16,083,960$ 10,589,040$ 624,208$ 1,998$ 496,028$
Totals 49,241,791$ 19,852,140$ 17,375,340$ 10,657,410$ 660,144$ 92,418$ 604,339$
PARCELS TOTAL HST HPW PST PPW AGRICULTURE WILDLIFE
Red River 19,763,711$ 7,066,710$ 9,313,110$ 65,850$ 87,712$ 3,230,329$ ‐$
Titus 2,519,540$ 949,760$ 1,525,920$ ‐$ ‐$ 43,860$ ‐$
Franklin 6,059,032$ 2,505,335$ 3,174,180$ ‐$ ‐$ 354,796$ 24,721$
Totals 28,342,283$ 10,521,805$ 14,013,210$ 65,850$ 87,712$ 3,628,985$ 24,721$

FinalTimberland&AgriculturalLandImpactAssessmentfor
SelectedWaterResourceOptionsintheSulphurRiverBasin
9 | P a g e
SummaryandConclusionsTable ES‐10 summarizes the impacted values on a percentage basis, both from the perspective of total
area of impact and the estimated value of that impact.
Table ES‐10 Comparison of Impact Areas & Values
Based on the information summarized in the upper portion of Table ES‐10, it is estimated that an area of
33,931 acres would be impacted by a Wright Patman Lake pool raise from the top of the rule curve at
228.64 ft‐NGVD to the 242.5 ft‐NGVD study elevation. This impact corresponds to 33.9% of the
combined total impact area of the Wright Patman Lake and Marvin Nichols Reservoir study areas;
however, the impacted area accounts for 63.5%, of the total value impact within the limits of the two
projects. In general, impacts to timber value are larger (66.3% of total) for the Wright Patman Lake
project and impacts to agricultural value are larger (97.5%) for the Marvin Nichols Reservoir project.
Further, as relates to timber and as discussed in Section 5 of this report, the summary finding of the
Wright Patman Lake project accounting for 66.3% of timber impact is fairly consistent with the 2013
Harvest Trends cited therein, which indicates that of the counties in which the study areas are located,
73.2% of 2013 stumpage‐based harvest values were harvested from Bowie and Cass Counties, in which
the largest portion of Wright Patman Lake is located.
Impact Impact Area (Acres) Impact Value ($)
Location Total Timber Agriculture Other Total Value Timber Value Agriculture Wildlife
Bowie 2,498 1,855 634 9 1,288,720$ 1,211,897$ 76,823$ ‐$
Cass 1,329 1,003 85 241 984,571$ 970,974$ 13,597$ 108,311$
Government 30,104 28,734 17 1,353 46,364,161$ 46,362,163$ 1,998$ 496,028$
WPLR Total 33,931 31,592 736 1,603 49,241,791$ 48,545,034$ 92,418$ 604,339$
Red River 49,227 28,438 19,675 1,114 19,763,711$ 16,533,382$ 3,230,329$ ‐$
Titus 11,972 8,965 2,818 189 2,519,540$ 2,475,680$ 43,860$ ‐$
Franklin 5,017 4,616 361 40 6,034,311$ 5,679,515$ 354,796$ 24,721$
MNR Total 66,216 42,019 22,854 1,343 28,342,283$ 24,688,577$ 3,628,985$ 24,721$
COMBINED TOTAL 100,147 73,611 23,590 2,946 77,584,074$ 73,233,611$ 3,721,403$ 629,060$
WPLR PERCENTAGE 33.9% 42.9% 3.1% 54.4% 63.5% 66.3% 2.5% 96.1%
MNR PERCENTAGE 66.1% 57.1% 96.9% 45.6% 36.5% 33.7% 97.5% 3.9%
FinalTimberland&AgriculturalLandImpactAssessmentfor
SelectedWaterResourceOptionsintheSulphurRiverBasin
10 | P a g e
1 Introduction
Under a Master Agreement and further authorized by Work Order Number One, both executed and
authorized on January 20, 2015 and subsequently amended, the Sulphur Basin Group PLLC (SBG) was
authorized and tasked by the Sulphur River Basin Authority (SRBA) to identify potential impacts to
timber production and other important agricultural activities. The identification of impacts was within
the limits of a proposed Wright Patman Lake Reallocation (WPLR) and Marvin Nichols Reservoir (MNR)
project limits.
1.1 InitialAssessmentThis initial assessment was scoped to include an estimation of the impacted land area, volume/value of
timberlands, and value of agricultural lands within study boundaries defined as follows:
Wright Patman Lake Reallocation (WPLR): Boundary limits are between elevation 242.5 feet
National Geodetic Vertical Datum (ft‐NGVD) and 227.5 ft‐NGVD; and
Marvin Nichols Reservoir (MNR): Boundary limit is elevation 313.5 ft‐NGVD.
The upper limit of each reservoir was chosen as a result of analyses performed during the period 2011‐
2014 by a variety of parties and suggested that those elevations represented the approximate scale of
each reservoir component necessary, in combination, to deliver the target yield for a Sulphur River Basin
Supply strategy. In the case of Wright Patman Lake, elevation 227.5 was a proxy for the existing level of
inundation of the reservoir. This elevation was developed in a prior study and was derived from the
average of the actual water surface elevation of the lake on a daily basis from February 2006 to February
2013. The difference between 227.5’ elevation and 242.5’ represents the area that would be newly
impacted by implementation of a reallocation project. Both government‐owned and privately held
parcels are found between these two elevations at Wright Patman Lake.
In order to fully understand and assess these impacts, the general tasks included the SBG accomplishing
the following:
Research County Appraisal District (CAD) parcel appraisal information to develop a database for
each parcel appraised for agricultural land or timberland uses and extract classification and appraisal
information, generally following methods that approximate the accepted State of Texas format for
type (Pine, Hardwood, or Mixed), age (variations of Mature, Intermediate, New), agricultural lands,
and other relevant information;
Meet with the Corps of Engineers to identify the location, amount, and value for timber harvesting
or agricultural production conducted by the Federal Government for fee‐owned lands at Wright
Patman Lake;
Assess the impact to the regional markets by removal of inundated land, categorized by land cover
(timberland & agricultural range, pasture or crops) using CAD records and other available

FinalTimberland&AgriculturalLandImpactAssessmentfor
SelectedWaterResourceOptionsintheSulphurRiverBasin
11 | P a g e
information, as well as studies and individuals/organizations with experience in these markets,
developing a geo‐referenced parcel map for the footprint of the WPLR & MNR study areas; and
Meet with up to three major timber users in the region to discuss the current distribution of their
timber sources, both inside and outside of the Sulphur River Basin.
The results of this initial assessment were produced in a draft report dated April 4, 2015. In order to
obtain input from the SRBA Board, a visual only presentation was made in the regularly scheduled SRBA
board meeting on May 19, 2015. During this presentation, some potential issues were noted by the
board members and others. Primarily these issues were associated with the degree of accuracy of the
CAD appraisal data and the often dated nature of same, as well as the inability to do field
inspections/verifications or impact classifications in the MNR study area.
Although these issues could not be addressed, a “final draft” of the initial assessment with corrections
from internal reviews dated July 29, 2015 was produced. All of the data and assessment methodologies
of the initial assessment/report “final draft” have been superseded. Therefore, no further discussion is
given to this initial assessment herein.
1.2 FinalAssessment
As previously mentioned, the initial assessment was limited in geographic scope to the area within the
313.5 contour at the Marvin Nichols site; at the time, it was thought that this was the largest
conservation pool that would be likely to be necessary to meet targeted project yields. However,
additional information developed during the spring of 2015 indicated that the recent droughts had
impacted the estimated firm yield of reservoirs within the Sulphur Basin to a greater extent than
anticipated and that a larger scope of the Marvin Nichols project should be evaluated.
This need to expand the analysis along with newly available aerial imagery, provided an opportunity to
better evaluate the study areas with new information and to address concerns developed in the initial
assessment relating to the general lack of public access to evaluate certain timber resources.
Additionally, the assessment team was also able to apply “lessons‐learned” from the initial analysis with
respect to developing a more robust and flexible GIS data base to better support future scenario‐based
assessment.
Although the initial timber and agricultural land impact assessment relied significantly upon CAD
appraisal information the final assessment study does not rely upon this data for land classifications.
Instead SBG teamed with professional foresters from Kingwood Forestry Service (KFS) and utilized newly
available 2015 high resolution leaf‐off digital imagery combined with a helicopter reconnaissance of the
study areas to augment previous field investigations made in the initial assessment, as basis for
classifications.

FinalTimberland&AgriculturalLandImpactAssessmentfor
SelectedWaterResourceOptionsintheSulphurRiverBasin
12 | P a g e
SBG was authorized for the final assessment timber and agricultural land impact study by the action of
the SRBA Board in the “Second Modification to Professional Services” dated June 15, 2015. This final
assessment uses a more refined approach to evaluate the timber resources and includes estimates of
the impacted land area, volume/value of timberlands, and area/value of agricultural lands impacted
within the following project boundaries:
Wright Patman Lake Reallocation: Between elevation 242.5 feet National Geodetic Vertical Datum (ft‐NGVD) and 228.64 ft‐NGVD; and
Marvin Nichols Reservoir: Below elevation 328 ft‐NGVD.
The scope of activities under the final assessment included:
Generate the study area shape files for WPLR and MNR;
Using the study area shape file for WPLR and MNR: o Generate the impacted privately‐owned parcel shape file for the WPLR and MNR Study
Areas; o Resolve conflicts between private and government‐owned parcels and any other
apparent conflicts; o Prior to classification of land coverage within the impacted parcels, determine
classification method for mixed land coverage (different from typical CAD methods): Private:
Predominately range with just a few trees = pasture; and
Continuous range within a forest will be addressed; Government –method worked out by SBG, KFS & the Corps of Engineers in the
initial efforts which was not changed for the final assessment; and Pictorial example of each type of classification per study area.
With the classification system established, accomplish the classification of the impacted parcels within each type of ownership per county/government and per study area, and develop attribute tables for the maximum study area for both WPLR and MNR, including :
o MNR Attribute Tables for impacted parcels within the Study area for Red River County; Titus County; Franklin County;
o WPLR Attribute Tables for impacted parcels within the Study area for: Bowie County; Cass County; Government Owned – Wright Patman Lake Fee Ownership;
o Parcel Identification Private: CAD Parcel ID; Government: Common Name of Land Cover for Fee‐owned parcels
o Areas ‐ Individual Classification Shapefiles for each Impacted Parcel, including: H1, H2, H3 & H4; P1, P2, P3 & P4; M1, M2 M3 & M4; R1, R2, R3 & R4; and Crop, Wildlife and other classifications.

FinalTimberland&AgriculturalLandImpactAssessmentfor
SelectedWaterResourceOptionsintheSulphurRiverBasin
13 | P a g e
Classification Specific Density Assessment ‐ For verification and adjustment of previous inspections/assumptions, a 6 hour videotaped helicopter tour will be conducted over areas selected from the GIS work described above for each classification followed by revisiting all values for each classification on this basis.
Provide analysis & valuation in each study area with tabular summaries for: o Impacted Area (Acres) Assessment; o Density (Tons/Acre) Assessment; o Unit Value ($/Acre) Assessment (based on density); o Volume (Tons) Assessment (based on density); and o Total Value (Present Summer Dollars) Assessment (based on unit value).
FinalTimberland&AgriculturalLandImpactAssessmentfor
SelectedWaterResourceOptionsintheSulphurRiverBasin
14 | P a g e
2 CollectionofAvailableData Data for the final study included:
CAD “appraisal data cards” for the increased study area for MNR (no new information required for WPLR as study area remained the same);
2015 digital imagery from Texas Natural Resource Information Service (TNRIS);
Helicopter reconnaissance and video recording of the study areas by professional foresters ;
Previously conducted forester assessments of WPLR and MNR;
Previously obtained GIS parcel data for privately owned parcels;
Previously obtained government‐owned parcel data within the WPLR study area and subsequent jointly agreed upon interpretations of same (Note: Confidentiality agreement for such data remains in effect and is provided as Appendix A); and
Analyze and generate the various study area limits; e.g., 328 ft‐NGVD for MNR and both 228.64 ft‐NGVD and 242.5 ft‐NGVD for WPLR, based on Digital Elevation Models (DEMs) prepared from previously collected LiDAR data, in accordance with National Map Accuracy Standards for DEMs.
All GIS data and analysis was conducted in ArcMap (ArcGIS 10.3) in the following projection:
Projection: Lambert Conformal Conic Zone: Texas North Central (FIPS 4202) Datum: NAD83 Planar Units: Feet (U.S. Survey)
All helicopter reconnaissance video is stamped with latitude and longitude location information which depicts the location of all recorded video data.

FinalTimberland&AgriculturalLandImpactAssessmentfor
SelectedWaterResourceOptionsintheSulphurRiverBasin
15 | P a g e
3 ParcelAreaImpact Both the WPLR and MNR water resource options impact timberland and agricultural land. The processes used to assess impacts to timberland and agricultural land, whether private or government‐owned, are covered herein with summaries of findings. The respective study area boundaries for both WPLR and MNR correspond to the maximum anticipated water supply strategies stipulated by SRBA and partner agencies when the scope of services was developed for this effort. This final impact assessment establishes impact GIS “shape files” categorized by size/type of impact within the study area boundaries. With shape files of impact accomplished, in the future, water supply strategies of lesser size can be analyzed through a much more streamlined process and impacts assessed. The process for determining impacts to privately owned parcels for final studies is summarized as follows:
In GIS, intersect the study area boundaries with private and/or government owned parcel maps to generate an impacted parcel database, as follows:
o WPLR Study Boundaries: A 33,922 acre area between the 228.64 ft‐NGVD and 242.5 ft‐NGVD contours shown as Figure 1.
o MNR Study Boundary: A 66,220 acres area within the 328 ft‐NGVD contour shown as Figure 2.
o It should be noted that there were small areas (islands) within both the WPLR and MNR Study Areas that exceeded the study area elevation basis. These areas were included in the overall Study Area.
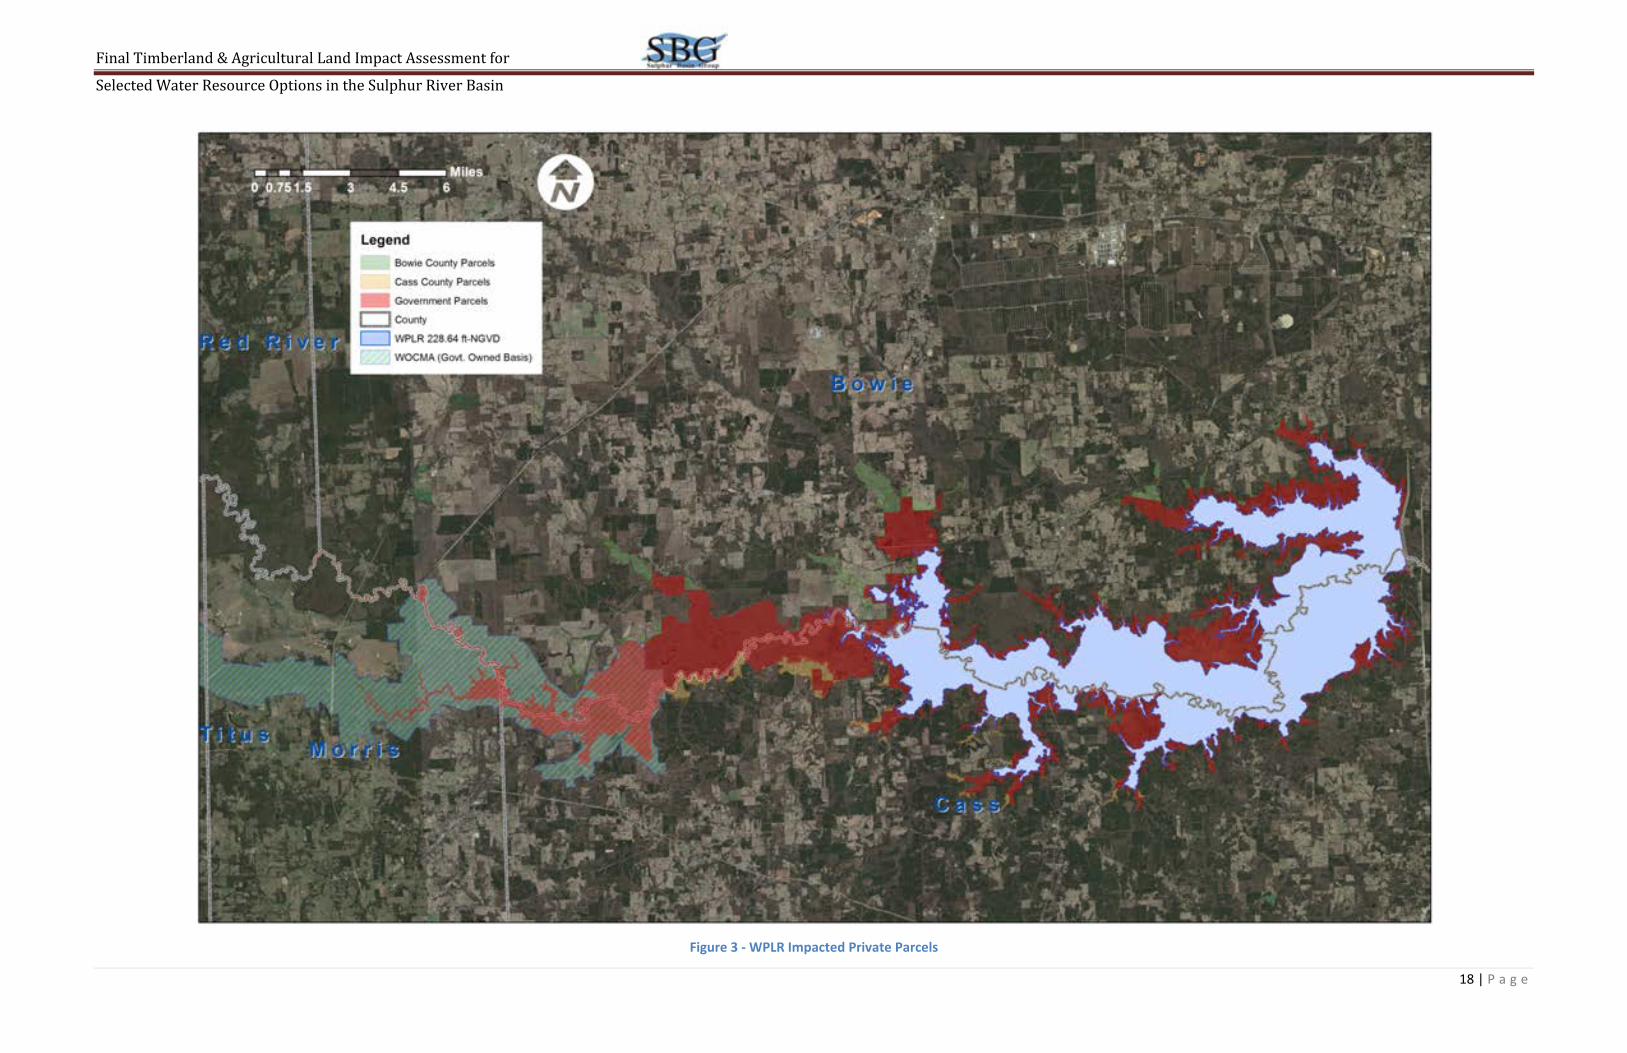
The resulting impacted parcel map for privately owned parcels within the WPLR Study Area is shown as Figure 3 and for the MNR Study Area is shown as Figure 4.
A map of Government‐owned Parcels and Easements within the WPLR is shown as Figure 5.
The impacted parcel database was exported to an Excel spreadsheet;
Land Cover (timber stand or range type) based evaluation of impacted properties was conducted based on the general approach as follows:
o Correcting boundary overlaps and gaps. o Delineating each tract with designated timber stand type or agricultural range type
categories and creating type/size impact shape files based on 2015 aerial imagery calibrated by field and helicopter reconnaissance;
o The route of helicopter reconnaissance is shown as Figure 6; and o The goal of all impact assessment efforts was to insure that all impacts within the study
areas were accounted.

FinalTimberland&AgriculturalLandImpactAssessmentfor
SelectedWaterResourceOptionsintheSulphurRiverBasin
16 | P a g e
Figure 1 ‐ WPLR Study Boundaries

FinalTimberland&AgriculturalLandImpactAssessmentfor
SelectedWaterResourceOptionsintheSulphurRiverBasin
17 | P a g e
Figure 2 ‐ MNR Study Boundary
FinalTimberland&AgriculturalLandImpactAssessmentfor
SelectedWaterResourceOptionsintheSulphurRiverBasin
18 | P a g e
Figure 3 ‐ WPLR Impacted Private Parcels

FinalTimberland&AgriculturalLandImpactAssessmentfor
SelectedWaterResourceOptionsintheSulphurRiverBasin
19 | P a g e
Figure 4 ‐ MNR Impacted Private Parcels

FinalTimberland&AgriculturalLandImpactAssessmentfor
SelectedWaterResourceOptionsintheSulphurRiverBasin
20 | P a g e
Figure 5 – Government‐Owned Parcels & Easements
FinalTimberland&AgriculturalLandImpactAssessmentfor
SelectedWaterResourceOptionsintheSulphurRiverBasin
21 | P a g e
Figure 6 ‐ Helicopter Reconnaissance Route

FinalTimberland&AgriculturalLandImpactAssessmentfor
SelectedWaterResourceOptionsintheSulphurRiverBasin
22 | P a g e
Impact results were incorporated into a spreadsheet and GIS database, as follows: o GIS Area of the Impacted lands based on intersection; and o GIS Classification of Impact Areas & Summations:
Hardwood impacts (maximally 4 classes); Pine, (maximally 4 classes); Mixed, (maximally 4 classes); Range (pasture) or Cropland with some types of class designation; and Other Classifications.
In order to insure a proper and consistent evaluation of the government‐owned timberlands, SBG teamed with KFS. After several meetings between local Corps of Engineers timber management personnel, SBG and KFS representatives, the timberland classification process jointly established by local Corps of Engineers timber management personnel and the SBG Team for the government‐owned parcels which resulted in intersecting GIS shape files for government‐owned (fee ownership) parcels and land cover classifications with the 242.5 ft‐NGVD upper limits outline and the 228.64 ft‐NGVD lower limits outline to generate impacted stand type database.
Assessment of Affected Landcover Parcels was accomplished by SBG/KFS, as follows: o After evaluating Government provided shape files, it was decided to merge shapes
based on the “Common Name” field.
Merged shapes, after aerial interpretation, into their unique Common Name for
consistent stand cover types.
Not all stands are consistently stocked and some stand types are incorrect in the
database. Initial inspections estimated that the largest stands have as much as
25% of swamp/water/buttonbush type of cover that will contribute no
merchantable value. Other stands are similar or have more variation, as much
as 50% difference. However, most of these differences occur on small acreage
stands, so statistically, the impact is minor.
Viewed most major acreages in each “Common Name” and ranked them
relative to all other Common Names in this shapefile. Rankings were given
similar to CAD land classifications and are as follows;
Pine (P)
Mixed pine and hardwood (M)
Hardwood (H)
Value of stands from 1‐4 with 1 being highest and 4 having little
merchantable value.
Analyzed the relative usable acreage based on ten 35 acre sample plots to help
determine how much acreage is in swamp/open water/brush on the largest
stand on Government lands. Found as much as 25% in non‐timber acreage.
o Additional coordination with Corps of Engineers Provided the above evaluation to the Corps of Engineers; Laid out inspection sites on USACE and private tracts in Bowie, Cass and Red
River Counties. (i.e. to compare H1 Bowie Co to H1 Red River County)

FinalTimberland&AgriculturalLandImpactAssessmentfor
SelectedWaterResourceOptionsintheSulphurRiverBasin
23 | P a g e
Visited with Corps to gain access and find best representative volume locations on Corps property.
o Conducted field inspections on Corps land, Bowie, Cass, Red River, Titus and Franklin Counties by truck, ATV and boat of the major stand types of significant size and most value potential, as well as the helicopter reconnaissance.
o Took field notes of volumes based on both field and aerial inspection and within the corresponding stand categories Hardwood Sawtimber (HST), Hardwood Pulpwood (HPW); Pine Sawtimber (PST), and Pine Pulpwood (PPW). Pictures of the most representative sites for various stands were taken to illustrate these volumes pictorially. GIS Aerial Imagery and pictures taken on the ground are from first quarter 2015 (leaf off). Pictures taken from helicopter reconnaissance are Summer 2015 (leaf on).
o Field notes of volume estimates per acre for various products were put into Excel to indicate volumes that will later be used to translate to a value.
o Created GIS shape files, dividing each impacted parcel by stand type classification, using a combination of field inspections and the 2015 digital aerials;;
o Confirmed this process with Corps of Engineers and got their agreement with this process.
A summary of impacted acreage (private or government owned) within the WPLR and MNR study areas is provided in Table 1 and Table 2, respectively. In both of these tables, a “checksum” is shown to compare the sum of the impacted areas to the total area of each respective Study Area. In the WPLR study area, the checksum was within 0.03% of agreement and in the MNR study area it was within 0.01% of agreement. In both instances the relatively low fraction of difference was considered statistically insignificant. Timber stand and agricultural range area impacts (rounded to the nearest acre) in these same study areas are summarized by classification in Table 3 and Table 4, respectively. In Table 3 and Table 4, the “Class” column is the land cover classification system. “H” is predominantly hardwood, “M” is mixed pine and hardwood with neither being the predominant type, “P” is predominantly pine, “R” is range, “W1” is a wildlife classification, “Crop” is tilled, and “Water” is Water covered land (ponds). These classifications are further shown for WPLR and MNR study areas in Figure 7 and Figure 8 (rounded to the nearest acre), respectively. Pictorial examples of the KFS analysis of impacts are provided in Appendix B. Quality Control and Assurance measures are contained in Appendix C. The numbers and letters next to the classification labels indicate a quality designation that originated with CADs but was further quantified/defined by KFS. “1” was generally the highest category and refers to mature timber, “2” is considered intermediate timber, “3” is considered regeneration or young growth and “4” is considered to be the poorest category and generally means pre‐merchantable, cutover or poorly established timber.

FinalTimberland&AgriculturalLandImpactAssessmentfor
SelectedWaterResourceOptionsintheSulphurRiverBasin
24 | P a g e
Table 1 ‐ WPLR Parcel Area Impact Summary (Acres)
Table 2 ‐ MNR Parcel Area Impact Summary (Acres)
Table 3 ‐ WPLR Itemized Parcel Area Impact (Acres)
CATEGORY TOTAL HARDWOOD MIXED PINE RANGE CROP WILDLIFE NON‐AG WATER
Bowie 2,498 1,701 107 47 634 ‐ ‐ 9 ‐
Cass 1,329 885 95 23 85 ‐ 241 ‐ ‐
Government 30,104 17,445 9,354 1,935 17 ‐ 1,102 251 ‐
Totals 33,931 20,031 9,556 2,005 736 ‐ 1,343 260 ‐
Checksum (9)
STUDY AREA 33,922
CATEGORY TOTAL HARDWOOD MIXED PINE RANGE CROP WILDLIFE NON‐AG WATER
Red River 49,227 28,125 28 285 19,236 439 ‐ 219 895
Titus 11,972 8,965 ‐ ‐ 2,818 ‐ 55 61 73
Franklin 5,017 4,616 ‐ ‐ 361 ‐ ‐ 37 3
Totals 66,216 41,706 28 285 22,415 439 55 317 971
Checksum 4
STUDY AREA 66,220
CLASS BOWIE CASS GOVERNMENT TOTAL
H1 270 80 13,503 13,853
H2 262 497 2,823 3,582
H3 640 111 1,119 1,870
H4 529 197 0 726
M1 4 56 8,762 8,822
M2 4 30 144 178
M3 68 9 442 519
M4 31 0 6 37
P1 3 0 1,935 1,938
P2 0 0 0 0
P3 32 3 0 35
P4 12 20 0 32
R1 341 56 0 397
R2 6 29 17 52
R3 61 0 0 61
R4 226 0 0 226
CROP 0 0 0 0
W1 0 241 1,102 1,343
NON‐AG 9 0 251 260
WATER 0 0 0 0
TOTAL 2,498 1,329 30,104 33,931
* All values rounded to nearest acre

FinalTimberland&AgriculturalLandImpactAssessmentfor
SelectedWaterResourceOptionsintheSulphurRiverBasin
25 | P a g e
Table 4 ‐ MNR Itemized Parcel Area Impact (Acres)
CLASS RED RIVER TITUS FRANKLIN TOTAL
H1 2,424 835 175 3,434
H2 8,615 3,272 1,833 13,720
H3 8,550 2,763 712 12,025
H4 8,536 2,095 1,896 12,527
M1 28 0 0 28
M2 0 0 0 0
M3 0 0 0 0
M4 0 0 0 0
P1 32 0 0 32
P2 0 0 0 0
P3 166 0 0 166
P4 87 0 0 87
R1 15,933 1,122 159 17,214
R2 2,608 738 16 3,362
R3 605 707 161 1,473
R4 90 251 25 366
CROP 439 0 0 439
W1 0 55 0 55
NON‐AG 219 61 37 317
WATER 895 73 3 971
TOTAL 49,227 11,972 5,017 66,216
* All values rounded to nearest acre

FinalTimberland&AgriculturalLandImpactAssessmentfor
SelectedWaterResourceOptionsintheSulphurRiverBasin
26 | P a g e
Figure 7 ‐ WPLR Impact Classifications

FinalTimberland&AgriculturalLandImpactAssessmentfor
SelectedWaterResourceOptionsintheSulphurRiverBasin
27 | P a g e
Figure 8 ‐ MNR Impact Classifications

FinalTimberland&AgriculturalLandImpactAssessmentfor
SelectedWaterResourceOptionsintheSulphurRiverBasin
28 | P a g e
4 MarketVolumeandValueImpact
For agricultural land impacts (range, pasture or crop lands) on privately owned parcels, the valuation
process was based on the “lease value” approach typically in use by all CADs and other agencies. The
lease/rental values used for estimating value for areas of impacted agricultural lands was based on
selections from the publication “Texas Rural Land Value Trends 2013” as published by the Texas Chapter
of the American Society of Farm Managers and Rural Appraisers, Inc. (ASFMRA). There being no readily
available guidance or methodology for this type of valuation, the method used was to estimate
economic impact based on three times the selected rental/lease value (equivalent to three years of
rental/lease). It should also be again noted that the Corps of Engineers GIS database predominately
addressed timberland classifications, with no indication of any market activity associated with pasture,
range or croplands, therefore no analysis of volume or value was performed on government‐owned
lands regarding these classifications. Any impacts from the Wright Patman reallocation on pasture,
range, or croplands on Government property are accordingly under‐represented in this analysis.
As previously noted, the professional services of KFS insured a proper and consistent estimate of
timberland volume and valuation for all private and government‐owned impacted parcels within the
study areas. Timber market volume impacts, as related herein are the professional opinion of KFS,
based on their extensive experience with timber in this region. Similarly, value impacts for timberland
are based on the volume estimates and market rates observed and recommended by KFS.
A summary of the resulting process for estimating timberland volumes and valuations is as follows:
Ground Inspections;
Helicopter reconnaissance was planned and conducted by KFS professional foresters along the route
depicted in Figure 6;
Planned and conducted activities by KFS professional foresters during and after the helicopter
reconnaissance included:
o Inspect stands which had been inspected from the ground to use as a basis of
comparison to other unfamiliar stands;
o Identify several specific stands, within flight time limitations, that could not be seen
from the ground;
o Establish a better estimate of MNR timber volumes and photograph several
representative stand types for visual representation in this report;
o Identify and photograph several sites from the air for comparison with ground photos;
o Adjust any estimates to timber volumes; and
o Adjust any estimates to stand type categories that may be different than what appeared
in previous aerial imagery.

FinalTimberland&AgriculturalLandImpactAssessmentfor
SelectedWaterResourceOptionsintheSulphurRiverBasin
29 | P a g e
Volume Estimates
o Volume estimates were based on both field and aerial inspection and the corresponding
stand categories;
o Field note volume estimates per acre for various products were input into a spreadsheet
for analysis and selection of volumes which were translated to value estimates;
o Based on KFS’s extensive expertise in such estimates and valuations, field notes were
recorded regarding field volume estimates by general product categories (1) Hardwood
Sawtimber (HST), Hardwood Pulpwood (HPW); Pine Sawtimber (PST), and Pine
Pulpwood (PPW); and
o Tables were developed for indicated timber volume and value for each timber
classification in each county for Wright Patman Lake and Marvin Nichols Reservoir study
areas.
The timber market volume within the WPLR and MNR study areas are summarized in Table 5 and Table 6, respectively (rounded to the nearest ton). Itemized market volume and value impacts in these same study areas are provided in Table 7 and Table 8, respectively (rounded to the nearest ton).
Table 5 ‐ WPLR Market Volume Impact Summary (Tons)
PRODUCT HST HPW PST PPW
ESTIMATED TONS
567,204
1,158,356
355,247
82,518
* All values rounded to the nearest ton
Table 6 ‐ MNR Market Volume Impact Summary (Tons)
PRODUCT HST HPW PST PPW
ESTIMATED TONS
300,623
934,214
2,195
10,964
* All values rounded to the nearest ton
For value estimates, adjustments were made for merchantability of the timber for summer‐time access only, which is typically slightly lower in value than all weather accessibility, and resulting values are based on historical timber sale experience for similar summer‐time accessible timber. Sawtimber markets have remained steady and are expected to stay that way, so no adjustment was made. As with any inventory estimate, actual volumes will be somewhat different from estimated volumes, especially on a project of this scale and with generalizations of the various timber volumes for each land impact classification.

FinalTimberland&AgriculturalLandImpactAssessmentfor
SelectedWaterResourceOptionsintheSulphurRiverBasin
30 | P a g e
Table 7 ‐ WPLR Itemized Market Volume Impact (Tons)
CLASS TYPE BOWIE CASS GOVERNMENT TOTAL
H1 HST 8,100 2,392 405,076 415,568
H1 HPW 10,801 3,189 540,101 554,091
H2 HST 3,932 7,453 42,346 53,731
H2 HPW 11,795 22,358 127,037 161,190
H3 HPW 9,596 1,663 16,791 28,050
H4 HPW 15,858 5,921 ‐ 21,779
M1 HST 40 560 87,617 88,217
M1 HPW 159 2,241 350,466 352,866
M1 PST 80 1,120 175,233 176,433
M1 PPW 20 280 43,808 44,108
M2 HPW 54 443 2,164 2,661
M2 PST 89 739 3,607 4,435
M2 PPW 18 148 721 887
M3 HPW 1,017 135 6,623 7,775
M3 PPW 678 90 4,415 5,183
M4 HPW 309 ‐ 61 370
M4 PPW 309 ‐ 61 370
P1 HST 14 ‐ 9,674 9,688
P1 HPW 41 1 29,021 29,063
P1 PST 247 4 174,128 174,379
P1 PPW 41 1 29,021 29,063
P3 HPW 320 30 ‐ 350
P3 PPW 1,922 178 ‐ 2,100
P4 HPW 59 102 ‐ 161
P4 PPW 296 511 ‐ 807
TOTALS 65,795 49,559 2,047,971 2,163,325
* All values rounded to nearest ton

FinalTimberland&AgriculturalLandImpactAssessmentfor
SelectedWaterResourceOptionsintheSulphurRiverBasin
31 | P a g e
Table 8 ‐ MNR Itemized Market Volume Impact (Tons)
The above estimated volume impacts and associated values estimated hereafter are provided with the following qualifiers and limitations by SBG/KFS:
SBG/KFS has not conducted land surveys of the subject properties and cannot attest to either the accuracy of the property lines or the total acreage. All acreages are based on study area and parcel map shape files in GIS.
As with any inventory estimate, actual volumes will be somewhat different from estimated volumes. This situation is further emphasized due to parcels that could not be viewed through this process and the fact this was an ocular based assessment.
The values appraised herein are based upon the assumption that the subject timber is prudently managed for sale using conventional management practices as exercised by knowledgeable timberland owners. Imprudent management or timber marketing practices may result in a substantial reduction in value without offsetting cash realizations.
Use of any part of this report out of context or apart from the whole is potentially misleading and therefore is prohibited by Kingwood Forestry Services, Inc.
SBG/KFS has not conducted a Phase I environmental study of the subject properties and makes no judgments in respect to possible environmental hazards or contaminants. There are no environmental problems on the subject properties known to or observed by Kingwood. For this report, it is assumed that no environmental hazards or contaminants exist on the subject properties.
CLASS TYPE RED RIVER TITUS FRANKLIN TOTAL
H1 HST 72,726 5,247 25,044 103,017
H1 HPW 60,605 4,373 20,870 85,848
H2 HST 86,145 18,330 32,721 137,196
H2 HPW 301,509 64,154 114,525 480,188
H3 HST 42,750 3,559 13,816 60,125
H3 HPW 171,002 14,236 55,265 240,503
H4 HPW 85,364 18,965 20,952 125,281
M1 HST 285 ‐ ‐ 285
M1 HPW 570 ‐ ‐ 570
M1 PST 570 ‐ ‐ 570
M1 PPW 142 ‐ ‐ 142
P1 HPW 162 ‐ ‐ 162
P1 PST 1,625 ‐ ‐ 1,625
P1 PPW 325 ‐ ‐ 325
P3 HPW 1,662 ‐ ‐ 1,662
P3 PPW 8,310 ‐ ‐ 8,310
P4 PPW 2,187 ‐ ‐ 2,187
TOTALS 835,939 128,864 283,193 1,247,996
* All values rounded to nearest ton

FinalTimberland&AgriculturalLandImpactAssessmentfor
SelectedWaterResourceOptionsintheSulphurRiverBasin
32 | P a g e
SBG/KFS, Inc. takes no responsibility for matters legal in nature, which may exist in connection with the properties such as senior contractual obligations, tax issues, etc.
The liability of SBG/KFS and employees is limited to the fee collected. There is no accountability, obligation, or liability to any third party. Kingwood assumes no responsibility for any cost incurred to discover or correct any deficiencies present in the properties.
The valuation assessment was not based on a requested minimum or maximum valuation, or a specific valuation.
SBG/KFS has no present or prospective interest in the properties that are the subject of this report, and we have no personal interest or bias with respect to the parties involved.
Employment in and compensation for this assessment was not contingent upon the reporting of a predetermined value or direction in value that favors the cause of the client, the amount of the value estimate, the attainment of a stipulated result, or the occurrence of a subsequent event.
Based on all of the aforementioned qualifiers and limitations, an estimated value per acre was performed for various land cover classifications in the Wright Patman Lake and Marvin Nichols Reservoir study areas, based on “Stumpage” ($/ton) and estimated volume (density) in tons per acre. It should be noted that the volume (density) values differ between the project areas as a result of the inspection. This difference is consistent with what is known to be typical of the respective locations. The resulting land cover area value per acre estimates within the Wright Patman Lake Reallocation and Marvin Nichols Reservoir study areas are provided in Table 9 and Table 10, respectively. On the basis of these land cover unit values, a summary of the overall estimated value of hardwood and pine sawtimber and pulpwood within the Wright Patman Lake Reallocation and Marvin Nichols Reservoir study areas is provided in Table 11 and Table 12, respectively (rounded to the nearest dollar).
Table 9 ‐ WPLR Land Cover Category Value Per Acre
WRIGHT PATMAN LAKE ‐ DENSITIES & UNIT VALUES
STUMPAGE ($/TON) $35.00 $15.00 $30.00 $8.00 VALUE
PRODUCT (TONS/ACRE) HST (TONS/AC) HPW (TONS/AC) PST (TONS/AC) PPW (TONS/AC) ($/ACRE)
CATEGORY
H1 30 40 1,650$
H2 15 45 1,200$
H3 30 450$
H4 15 225$
M1 10 40 20 5 1,590$
M2 15 25 5 1,015$
M3 15 10 305$
M4 10 10 230$
P1 5 15 90 15 3,220$
P2 5 15 50 30 2,140$
P3 10 60 630$
P4 5 25 275$
R1 180$
R2 120$
R3 75$
R4 45$
W1 450$
WATER & NON ‐$

FinalTimberland&AgriculturalLandImpactAssessmentfor
SelectedWaterResourceOptionsintheSulphurRiverBasin
33 | P a g e
Table 10 ‐ MNR Land Cover Category Value Per Acre
Table 11 ‐ WPLR Overall Estimated Value
VALUE HST HPW PST PPW TOTAL
ESTIMATED VALUE $ 19,852,140 $ 17,375,340 $ 10,657,410 $ 660,144 $ 48,545,034
Table 12 ‐ MNR – Overall Estimated Value
VALUE HST HPW PST PPW TOTAL
ESTIMATED VALUE $ 10,521,805 $ 14,013,210 $ 65,850 $ 87,712 $ 24,688,577
Itemized timber market values in these same study areas are provided in Table 13 and Table 14,
respectively (rounded to the nearest dollar).
MARVIN NICHOLS RESERVOIR ‐ DENSITIES & UNIT VALUES
STUMPAGE ($/TON) $35.00 $15.00 $30.00 8.00 TOTAL
PRODUCT (TONS/ACRE) HST HPW PST PPW ($/ACRE)
CATEGORY
H1 30 25 1,425$
H2 10 35 875$
H3 5 20 475$
H4 10 150$
M1 10 20 20 5.00 1,290$
M2 5 30 5 10.00 855$
M3 30 450$
M4 10 5.00 190$
P1 5 50 10.00 1,655$
P2 10 25 30.00 1,140$
P3 10 50.00 550$
P4 25.00 200$
R1 180$
R2 120$
R3 75$
R4 45$
CROP 225$
W1 450$
WATER & NON ‐$
FinalTimberland&AgriculturalLandImpactAssessmentfor
SelectedWaterResourceOptionsintheSulphurRiverBasin
34 | P a g e
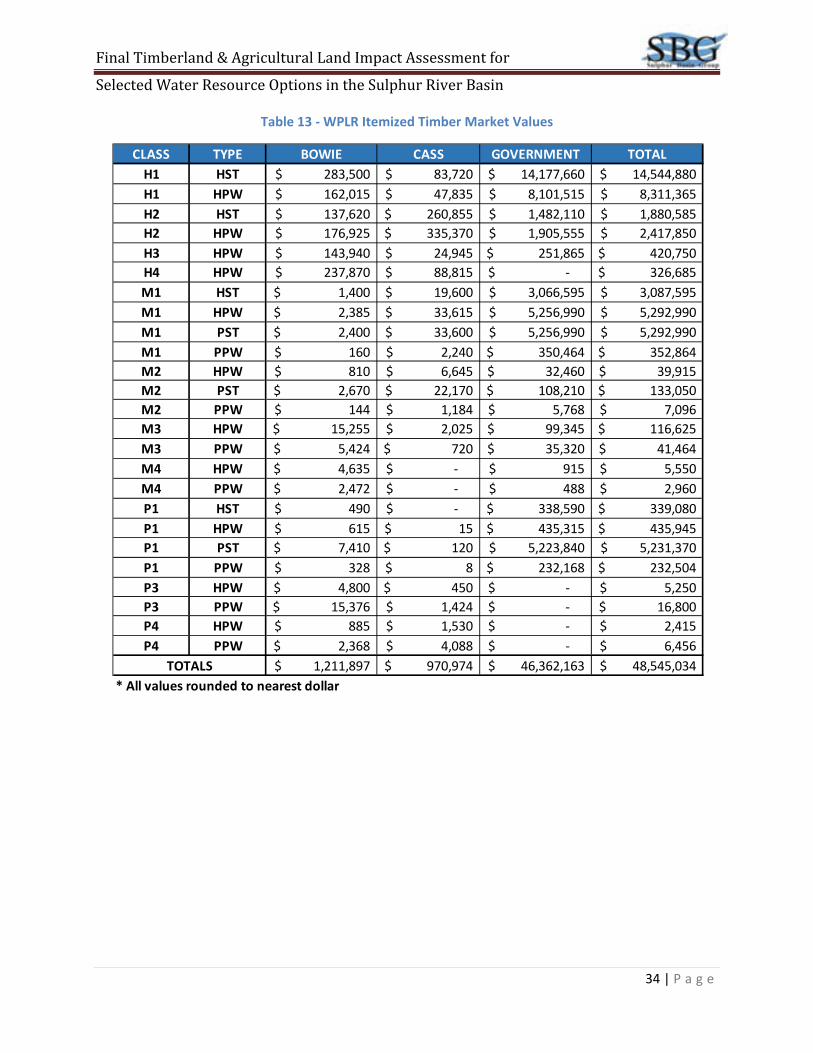
Table 13 ‐ WPLR Itemized Timber Market Values
CLASS TYPE BOWIE CASS GOVERNMENT TOTAL
H1 HST 283,500$ 83,720$ 14,177,660$ 14,544,880$
H1 HPW 162,015$ 47,835$ 8,101,515$ 8,311,365$
H2 HST 137,620$ 260,855$ 1,482,110$ 1,880,585$
H2 HPW 176,925$ 335,370$ 1,905,555$ 2,417,850$
H3 HPW 143,940$ 24,945$ 251,865$ 420,750$
H4 HPW 237,870$ 88,815$ ‐$ 326,685$
M1 HST 1,400$ 19,600$ 3,066,595$ 3,087,595$
M1 HPW 2,385$ 33,615$ 5,256,990$ 5,292,990$
M1 PST 2,400$ 33,600$ 5,256,990$ 5,292,990$
M1 PPW 160$ 2,240$ 350,464$ 352,864$
M2 HPW 810$ 6,645$ 32,460$ 39,915$
M2 PST 2,670$ 22,170$ 108,210$ 133,050$
M2 PPW 144$ 1,184$ 5,768$ 7,096$
M3 HPW 15,255$ 2,025$ 99,345$ 116,625$
M3 PPW 5,424$ 720$ 35,320$ 41,464$
M4 HPW 4,635$ ‐$ 915$ 5,550$
M4 PPW 2,472$ ‐$ 488$ 2,960$
P1 HST 490$ ‐$ 338,590$ 339,080$
P1 HPW 615$ 15$ 435,315$ 435,945$
P1 PST 7,410$ 120$ 5,223,840$ 5,231,370$
P1 PPW 328$ 8$ 232,168$ 232,504$
P3 HPW 4,800$ 450$ ‐$ 5,250$
P3 PPW 15,376$ 1,424$ ‐$ 16,800$
P4 HPW 885$ 1,530$ ‐$ 2,415$
P4 PPW 2,368$ 4,088$ ‐$ 6,456$
TOTALS 1,211,897$ 970,974$ 46,362,163$ 48,545,034$
* All values rounded to nearest dollar

FinalTimberland&AgriculturalLandImpactAssessmentfor
SelectedWaterResourceOptionsintheSulphurRiverBasin
35 | P a g e
Table 14 ‐ MNR Itemized Timber Market Values
This report did not adjust for several factors that will likely have an impact on the value and merchantability of timber. The broad assumption of this report is that all timber is considered “in the market” and that it could be harvested under normal conditions using usual and customary practices. Due to scope and data limitations, no adjustments were made for the following factors:
o Minimum merchantable harvest acreage ‐ For landowners with timber on less than approximately 10 acres, this small amount of timber is not typically considered merchantable due to the excessive cost to harvest that reduces the value of the timber. The exception to this is if an adjacent, ongoing timber harvest is occurring that might allow the small timber acreage to be harvested.
o Accessibility ‐ Much of the timber to be harvested is in seasonally flooded areas. This is depicted in a few of the pictures taken around Wright Patman where the lake level was at 232 ft‐NGVD. Accessing and harvesting timber would have to be done during dry or drought conditions due to the many small streams and creeks that would need to be crossed to access much of the timber. Again, timber values should be less than reported due to resultant increased harvest costs.
CLASS TYPE RED RIVER TITUS FRANKLIN TOTAL
H1 HST 2,545,410$ 183,645$ 876,540$ 3,605,595$
H1 HPW 909,075$ 65,595$ 313,050$ 1,287,720$
H2 HST 3,015,075$ 641,550$ 1,145,235$ 4,801,860$
H2 HPW 4,522,635$ 962,310$ 1,717,875$ 7,202,820$
H3 HST 1,496,250$ 124,565$ 483,560$ 2,104,375$
H3 HPW 2,565,030$ 213,540$ 828,975$ 3,607,545$
H4 HPW 1,280,460$ 284,475$ 314,280$ 1,879,215$
M1 HST 9,975$ ‐$ ‐$ 9,975$
M1 HPW 8,550$ ‐$ ‐$ 8,550$
M1 PST 17,100$ ‐$ ‐$ 17,100$
M1 PPW 1,136$ ‐$ ‐$ 1,136$
P1 HPW 2,430$ ‐$ ‐$ 2,430$
P1 PST 48,750$ ‐$ ‐$ 48,750$
P1 PPW 2,600$ ‐$ ‐$ 2,600$
P3 HPW 24,930$ ‐$ ‐$ 24,930$
P3 PPW 66,480$ ‐$ ‐$ 66,480$
P4 PPW 17,496$ ‐$ ‐$ 17,496$
TOTALS 16,533,382$ 2,475,680$ 5,679,515$ 24,688,577$
* All values rounded to nearest dollar

FinalTimberland&AgriculturalLandImpactAssessmentfor
SelectedWaterResourceOptionsintheSulphurRiverBasin
36 | P a g e
o Timber market fluctuations ‐ Markets are fluid and change with supply and demand. For example, expectations in 2016 are for a significant reduction in hardwood pulpwood consumption in the market areas, so it reasonable to assume future hardwood pulpwood markets will decline dramatically from the recent historical price range. Other products vary over time and since history is our only gauge to anticipate future markets, there are clearly limitations on the timber market values.
o Amount of affected timber considered “in the market” ‐ The assumption in this report is that all timber is “in the market”. Based on observations throughout this study, on private owned lands, much more of the timber is considered “in the market” than on government lands. Typically, private landowners will promptly harvest timber when it becomes financially prudent to do so, whereas the government delays these harvests based on other considerations. As a result, government lands generally have a much higher percentage of higher value timber than on private lands, and the timber on private lands is more typically and promptly harvested whereas a considerable amount of timber on government land is allowed to die naturally.
The conclusion to be drawn from these points is that all government‐owned and privately owned timber is assumed to be “in the market” and the amount of timber and value of timber is considered an un‐adjusted figure. Additional data collection would be required to better estimate the volume and value impact of these two study areas, but this methodology provides a best available estimate without significant further investigation.

FinalTimberland&AgriculturalLandImpactAssessmentfor
SelectedWaterResourceOptionsintheSulphurRiverBasin
37 | P a g e
5 TimberResourceUserImpactThe work scope for this item required consultation with up to three major timber users in the region to
discuss the current distribution of their timber sources, both inside and outside of the Sulphur River
Basin. The timber users selected for contact and information regarding same are:
International Paper – Texarkana Mill, 9978 FM 3129, Domino, TX 75572
o Construction of the Texarkana Mill began in 1969 and the mill came on line in November
1972.
o The mill was initiated to supply coated bleached board and liquid packaging board to
International Paper’s converting divisions and bleached pine pulp to produce disposable
diaper pulp.
o Today, the mill produces bleached board for packaging, hot and cold drink cupstock and
folding cartons.
Domtar ‐ Ashdown Mill, 285 Hwy 71 South, Ashdown, AR 71822
o Original mill opened in 1968.
o Second paper machine added in 1975.
o Third paper machine and new pulp line added in 1979.
o Fourth paper machine and new pulp line added in 1991.
o Became part of Domtar Inc. in 2001.
West Fraser – New Boston Lumber Mill, Highway 82 East, P.O. Box 578, New Boston, TX 75570
o SIC Code 2421, Sawmills and Planing Mills.
o NAICS Code 2191201, Cut Stock, Resawing Lumber & Planing.
o Business Category: Lumber (Rough, Sawed or Planed).
Attempts were made to meet and/or obtain timber resource distribution data from these three users.
Only West Fraser provided the requested data, with the provision that the “…information cannot be
shared with any competitors, consultants or appear in any publication, journal or public information
identifying West Fraser as the source of this information.” Both International Paper – Texarkana Mill and
Domtar – Ashdown Mill declined to provide data, citing matters of business confidentiality and, instead,
recommended a document produced by the Texas A&M Forest Service entitled “Harvest Trends 2013,”
dated September 2014. They indicated that data contained in Table 1 of this document was
representative of the region. Due to the confidentiality requirement of West Fraser, even this data
could not be published or even referenced by percentages within the Sulphur River Basin.
With no data from the local timber interests, all that is available is this overview of volumes and harvest
values of both pine and hardwood timber from the counties within the study areas for the year 2013,
based on the aforementioned “Harvest Trends 2013,” the results of which are presented in the tables,
as follows.

FinalTimberland&AgriculturalLandImpactAssessmentfor
SelectedWaterResourceOptionsintheSulphurRiverBasin
38 | P a g e
Table 15 ‐ Analysis of "Harvest Trends 2013" Table Excerpts
The following observations can be made based on this data:
The predominate harvesting of pine and hardwood timber within the two areas of study fall within
Bowie and Cass Counties, comprising the majority of the Wright Patman Lake Reallocation study
area; and
Bowie and Cass County accounted for:
o 63.8% of harvested hardwood timber;
o 77.3% of harvested pine timber;
o 73.2% of stumpage based harvest value; and
o 71.7% of delivery based harvest value.
Based on “Harvest Trends 2013” and the above table excerpts, it can be concluded that in 2013, timber
from within the Wright Patman Reallocation study area likely had a much higher volume and value than
that within the Marvin Nichols Reservoir study area. This lines up fairly well with what was observed in
the market volume portion of this report, above.
Volume Harvested (cubic feet)
County Pine Hardwood Total
Bowie 7,977,449 23.3% 6,612,207 26.5% 14,589,656 24.7%
Cass 18,477,965 54.0% 9,310,599 37.3% 27,788,564 47.0%
Franklin 326,276 1.0% 1,144,085 4.6% 1,470,361 2.5%
Morris 1,896,567 5.5% 1,160,139 4.7% 3,056,706 5.2%
Red River 4,509,199 13.2% 5,140,016 20.6% 9,649,215 16.3%
Titus 1,001,683 2.9% 1,566,883 6.3% 2,568,566 4.3%
Total 34,189,139 100.0% 24,933,929 100.0% 59,123,068 100.0%
Harvest Value (thousand dollars)
County Stumpage Delivered
Bowie 6,181 26.6% 16,175 25.3%
Cass 10,845 46.6% 29,629 46.4%
Franklin 539 2.3% 1,616 2.5%
Morris 1,078 4.6% 3,182 5.0%
Red River 3,546 15.2% 10,366 16.2%
Titus 1,077 4.6% 2,891 4.5%
Total 23,266 100.0% 63,859 100.0%

FinalTimberland&AgriculturalLandImpactAssessmentfor
SelectedWaterResourceOptionsintheSulphurRiverBasin
39 | P a g e
6 Conclusions
6.1 MarketValueConclusionsThe estimated market value impact to timberland and agricultural land is summarized in the following
Tables 16 and 17:
Table 16 ‐ WPLR Total Timberland & Agricultural Market Value Impact Summary
Table 17 ‐ MNR Total Timberland & Agricultural Market Value Impact Summary
Tables 16 and 17 indicate that the majority of impacts within the respective study areas, are the result of timberland impacts. Based on these two tables, the impact to total timber and agriculture value within the WPLR would be on the order of almost two times the value of that within the MNR. As previously stated, these are unadjusted figures and area based on the assumption that all of the timber would be considered “in the market”.
6.2 UserImpactAdditionalConclusionsIn section “5 Timber Resource User Impact,” above, the Texas A&M Forest Service publication, “Harvest
Trends 2013,” was used as the basis of observations on impacts on the timber users that depended
upon the resources of Bowie, Cass, Red River, Titus and Franklin Counties. Using the quantities of
estimated hardwood and pine sawtimber and pulpwood in tons, the following Table 18 summarizes a
similar impact analysis for the combined WPLR and MNR study areas:
PARCELS TOTAL HST HPW PST PPW AGRICULTURE WILDLIFE
Bowie 1,288,720$ 423,010$ 750,135$ 12,480$ 26,272$ 76,823$ ‐$
Cass 1,092,882$ 364,175$ 541,245$ 55,890$ 9,664$ 13,597$ 108,311$
Government 46,860,189$ 19,064,955$ 16,083,960$ 10,589,040$ 624,208$ 1,998$ 496,028$
Totals 49,241,791$ 19,852,140$ 17,375,340$ 10,657,410$ 660,144$ 92,418$ 604,339$
PARCELS TOTAL HST HPW PST PPW AGRICULTURE WILDLIFE
Red River 19,763,711$ 7,066,710$ 9,313,110$ 65,850$ 87,712$ 3,230,329$ ‐$
Titus 2,519,540$ 949,760$ 1,525,920$ ‐$ ‐$ 43,860$ ‐$
Franklin 6,059,032$ 2,505,335$ 3,174,180$ ‐$ ‐$ 354,796$ 24,721$
Totals 28,342,283$ 10,521,805$ 14,013,210$ 65,850$ 87,712$ 3,628,985$ 24,721$
FinalTimberland&AgriculturalLandImpactAssessmentfor
SelectedWaterResourceOptionsintheSulphurRiverBasin
40 | P a g e
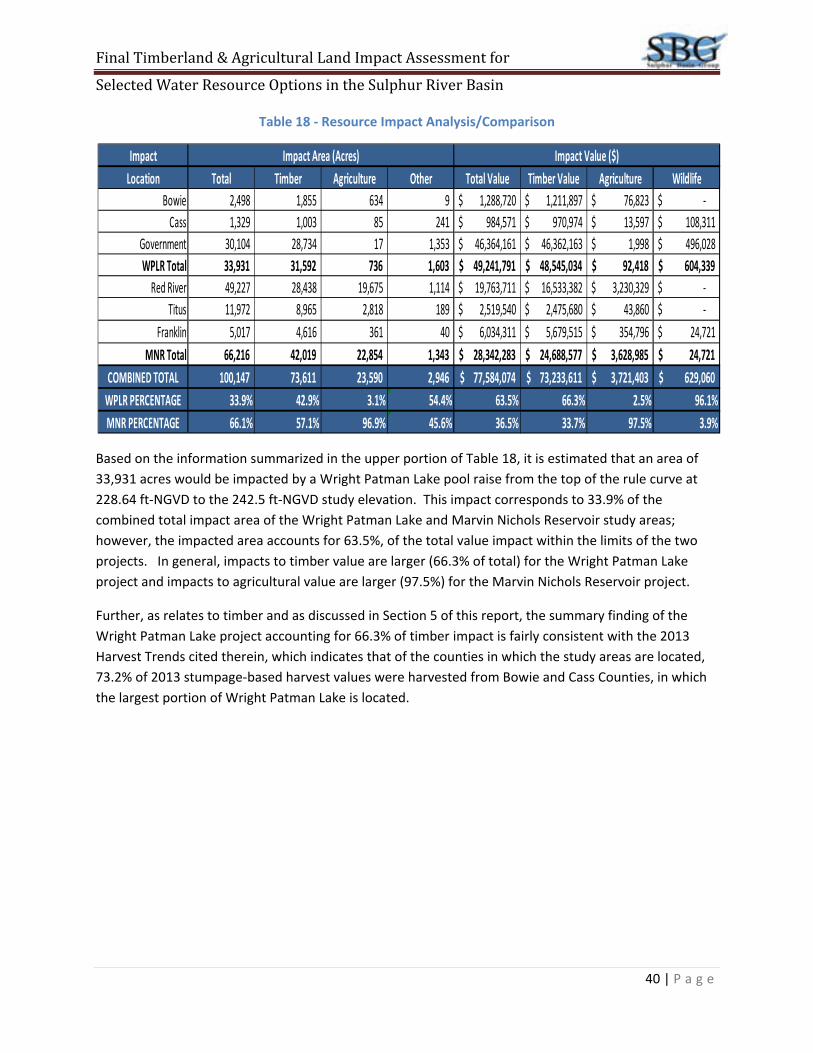
Table 18 ‐ Resource Impact Analysis/Comparison
Based on the information summarized in the upper portion of Table 18, it is estimated that an area of
33,931 acres would be impacted by a Wright Patman Lake pool raise from the top of the rule curve at
228.64 ft‐NGVD to the 242.5 ft‐NGVD study elevation. This impact corresponds to 33.9% of the
combined total impact area of the Wright Patman Lake and Marvin Nichols Reservoir study areas;
however, the impacted area accounts for 63.5%, of the total value impact within the limits of the two
projects. In general, impacts to timber value are larger (66.3% of total) for the Wright Patman Lake
project and impacts to agricultural value are larger (97.5%) for the Marvin Nichols Reservoir project.
Further, as relates to timber and as discussed in Section 5 of this report, the summary finding of the
Wright Patman Lake project accounting for 66.3% of timber impact is fairly consistent with the 2013
Harvest Trends cited therein, which indicates that of the counties in which the study areas are located,
73.2% of 2013 stumpage‐based harvest values were harvested from Bowie and Cass Counties, in which
the largest portion of Wright Patman Lake is located.
Impact Impact Area (Acres) Impact Value ($)
Location Total Timber Agriculture Other Total Value Timber Value Agriculture Wildlife
Bowie 2,498 1,855 634 9 1,288,720$ 1,211,897$ 76,823$ ‐$
Cass 1,329 1,003 85 241 984,571$ 970,974$ 13,597$ 108,311$
Government 30,104 28,734 17 1,353 46,364,161$ 46,362,163$ 1,998$ 496,028$
WPLR Total 33,931 31,592 736 1,603 49,241,791$ 48,545,034$ 92,418$ 604,339$
Red River 49,227 28,438 19,675 1,114 19,763,711$ 16,533,382$ 3,230,329$ ‐$
Titus 11,972 8,965 2,818 189 2,519,540$ 2,475,680$ 43,860$ ‐$
Franklin 5,017 4,616 361 40 6,034,311$ 5,679,515$ 354,796$ 24,721$
MNR Total 66,216 42,019 22,854 1,343 28,342,283$ 24,688,577$ 3,628,985$ 24,721$
COMBINED TOTAL 100,147 73,611 23,590 2,946 77,584,074$ 73,233,611$ 3,721,403$ 629,060$
WPLR PERCENTAGE 33.9% 42.9% 3.1% 54.4% 63.5% 66.3% 2.5% 96.1%
MNR PERCENTAGE 66.1% 57.1% 96.9% 45.6% 36.5% 33.7% 97.5% 3.9%

APPENDICES

Appendix A – Confidentiality Agreement


Appendix B
Pictorial Examples of Land Classifications

KFS PHOTOS
Pictures of the most representative sites for various stands were taken to illustrate these volumes pictorially. GIS Aerial Imagery and pictures taken on the ground are from first quarter 2015 (leaf off). Pictures taken from helicopter reconnaissance are Summer 2015 (leaf on).

Wright Patman Lake Examples

Aerial Imagery – H1
Most representative view of fully stocked H1

Typical H1
H1 with holes
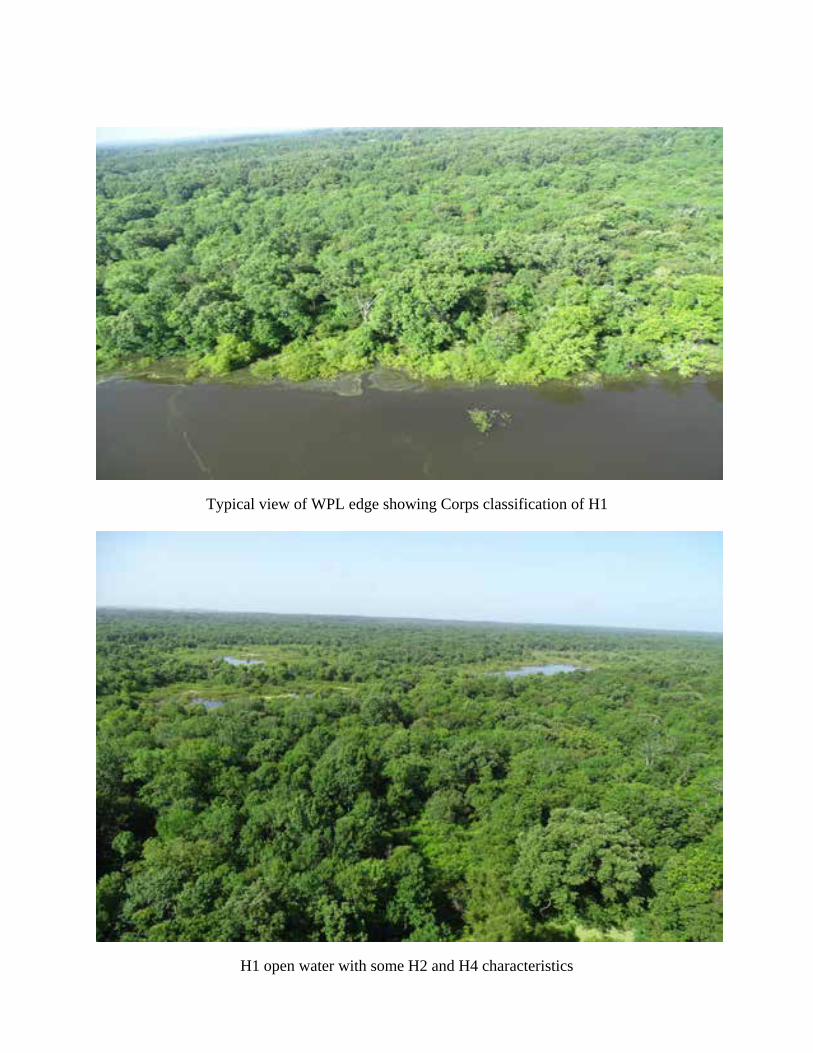
Typical view of WPL edge showing Corps classification of H1
H1 open water with some H2 and H4 characteristics

H1 with open water with some H2 and H4 characteristics
Open water within H1

Open water within H1
View of the main power line on upper end of lake at 242 level

H1 next to Sulphur River
Typical H1 – Wright Patman Lake

Open water surrounded by H1
White Oak Management H1

White Oak Management H1
Typical view of H1 land classification on Corp. of Engineers property
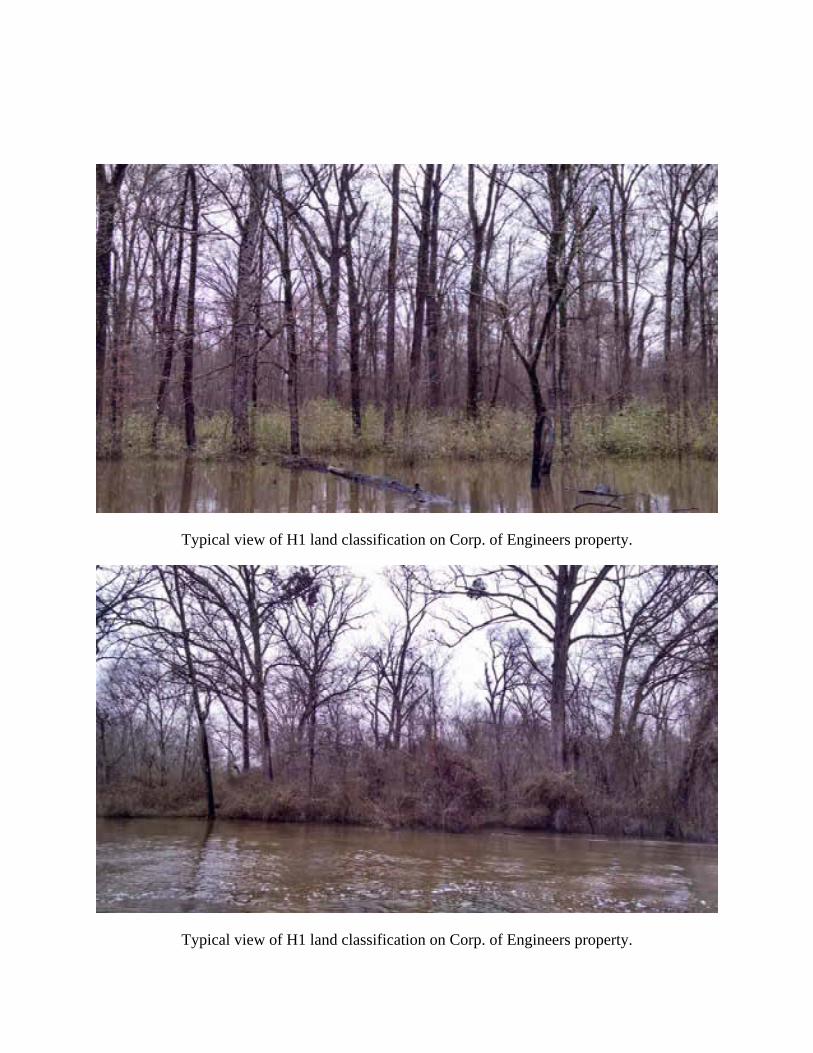
Typical view of H1 land classification on Corp. of Engineers property.
Typical view of H1 land classification on Corp. of Engineers property.

Typical view of H1 land classification on Corp. of Engineers property.
Typical view of H1 land classification on Corp. of Engineers property.

Aerial Imagery of H2
H2 and H3 along Sulphur River on private tracts

Typical view of H2 land classification on Corp. of Engineers property
Typical view of H2 land classification on Corp. of Engineers property.

Typical view of H2 land classification on Corp. of Engineers property.
Aerial Imagery H3
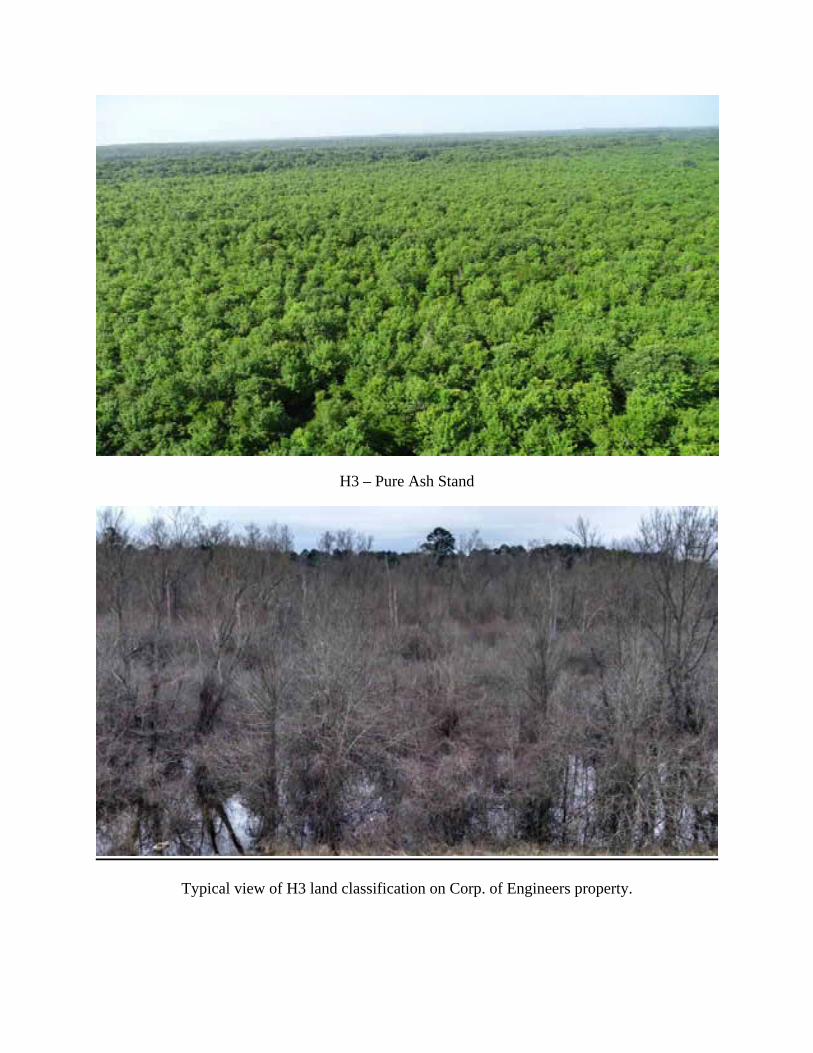
H3 – Pure Ash Stand
Typical view of H3 land classification on Corp. of Engineers property.
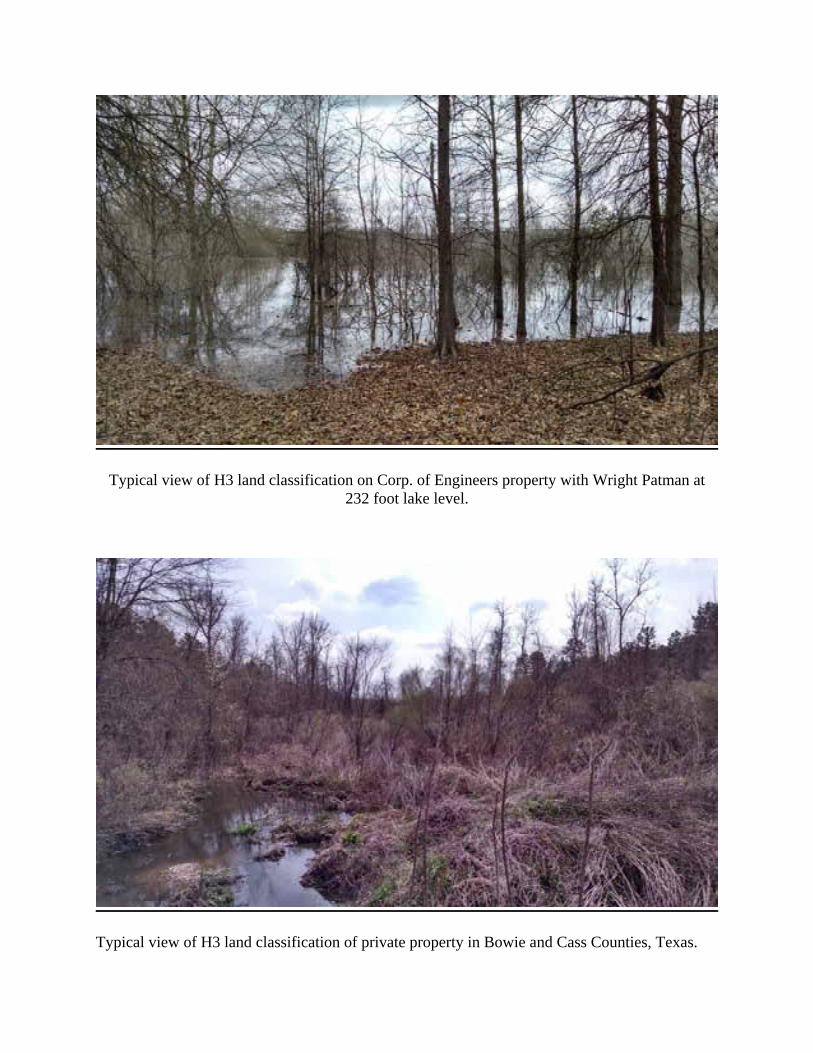
Typical view of H3 land classification on Corp. of Engineers property with Wright Patman at 232 foot lake level.
Typical view of H3 land classification of private property in Bowie and Cass Counties, Texas.
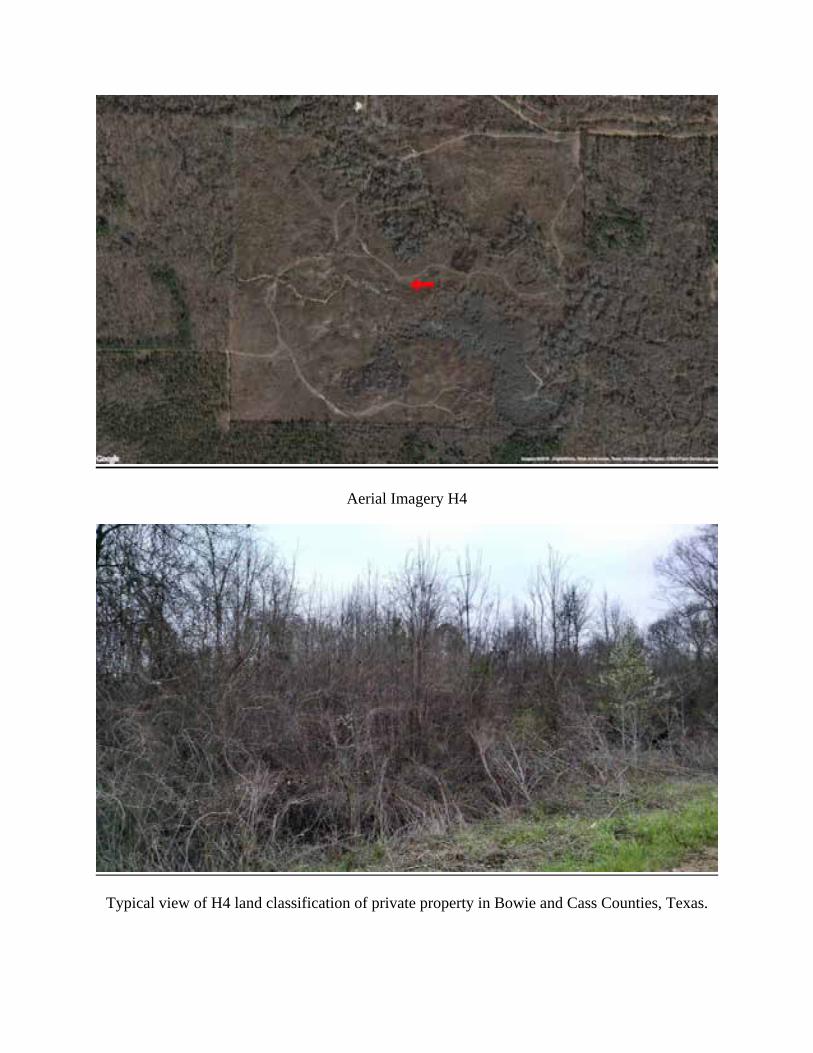
Aerial Imagery H4
Typical view of H4 land classification of private property in Bowie and Cass Counties, Texas.
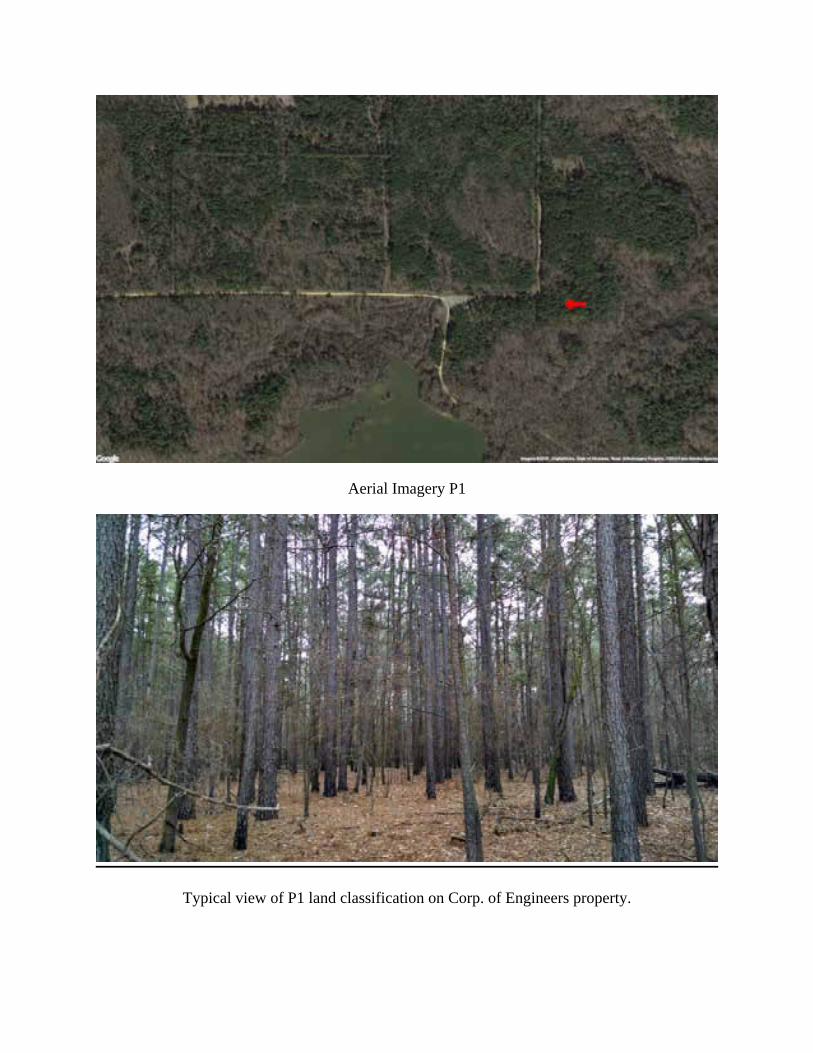
Aerial Imagery P1
Typical view of P1 land classification on Corp. of Engineers property.

Typical view of P1 land classification on Corp. of Engineers property.
Typical view of P1 land classification on Corp. of Engineers property.

Aerial Imagery P3
Aerial Imagery P4

Aerial Imagery M1
Typical view of M1 land classification on Corp. of Engineers property.

Typical view of M1 land classification on Corp. of Engineers property.
Typical view of M1 land classification on Corp. of Engineers property.

Typical view of M1 land classification on Corp. of Engineers property.
Aerial Imagery M2

Typical view of M2 land classification of private property in Bowie and Cass Counties, Texas.
Aerial Imagery M3

Aerial Imagery M4

Marvin Nichols Reservoir Examples

Aerial Imagery H1

H1 in foreground and H4 in background
H1

H1
H1

H1 on the Sulphur River
Typical view of H1 land classification of private property in Titus and Franklin Counties, Texas
Aerial Imagery H2

Typical view of H2 (Note: gaps and smaller trees)
MNR Dam- H2 at the proposed dam location

H2

Poor quality H2
Poor quality H2
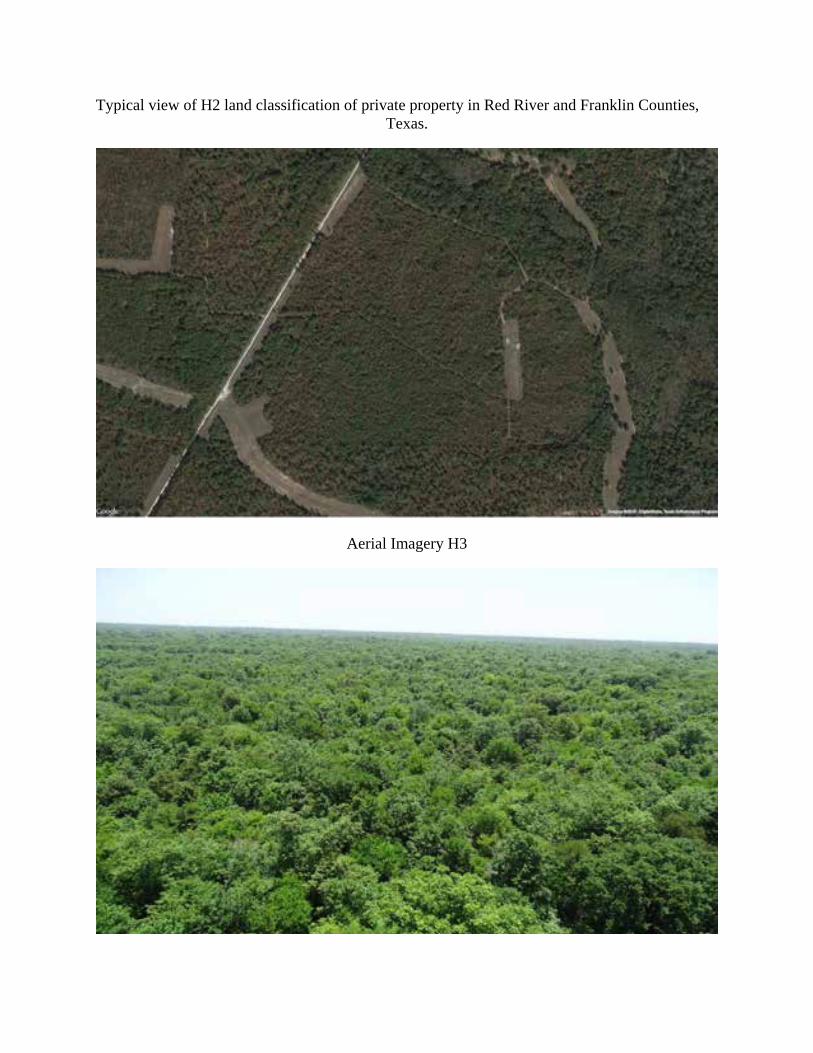
Typical view of H2 land classification of private property in Red River and Franklin Counties, Texas.
Aerial Imagery H3

Most typical view of an H3
H3 – Ash
H3 – recently thinned
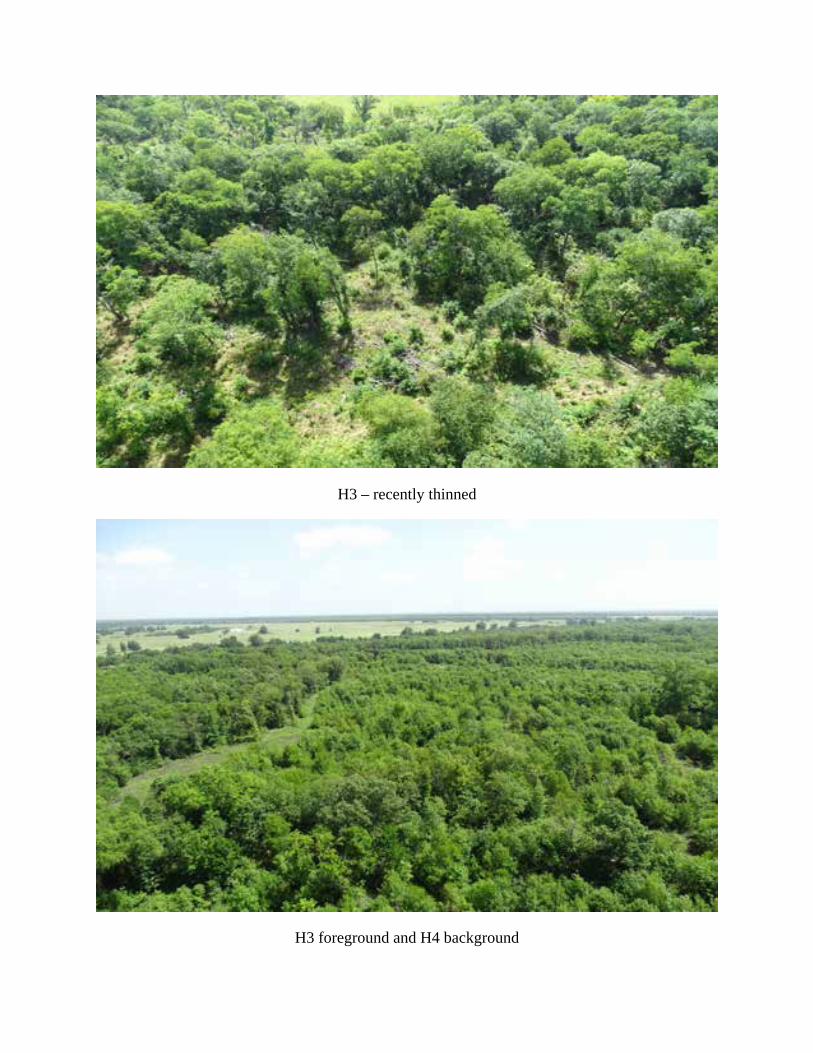
H3 – recently thinned
H3 foreground and H4 background

Aerial Imagery H4
H4

H4 foreground and H2 background
H4 foreground and H1 on the river

H4
Typical view of H1 land classification of private property in Titus County, Texas.

Recently cut and flooded H4

Aerial Imagery P1
Aerial Imagery P3
Aerial Imagery P4

Aerial Imagery M1
Typical view of M1 land classification of private property in Red River County, Texas.

Appendix C – QA/QC Process
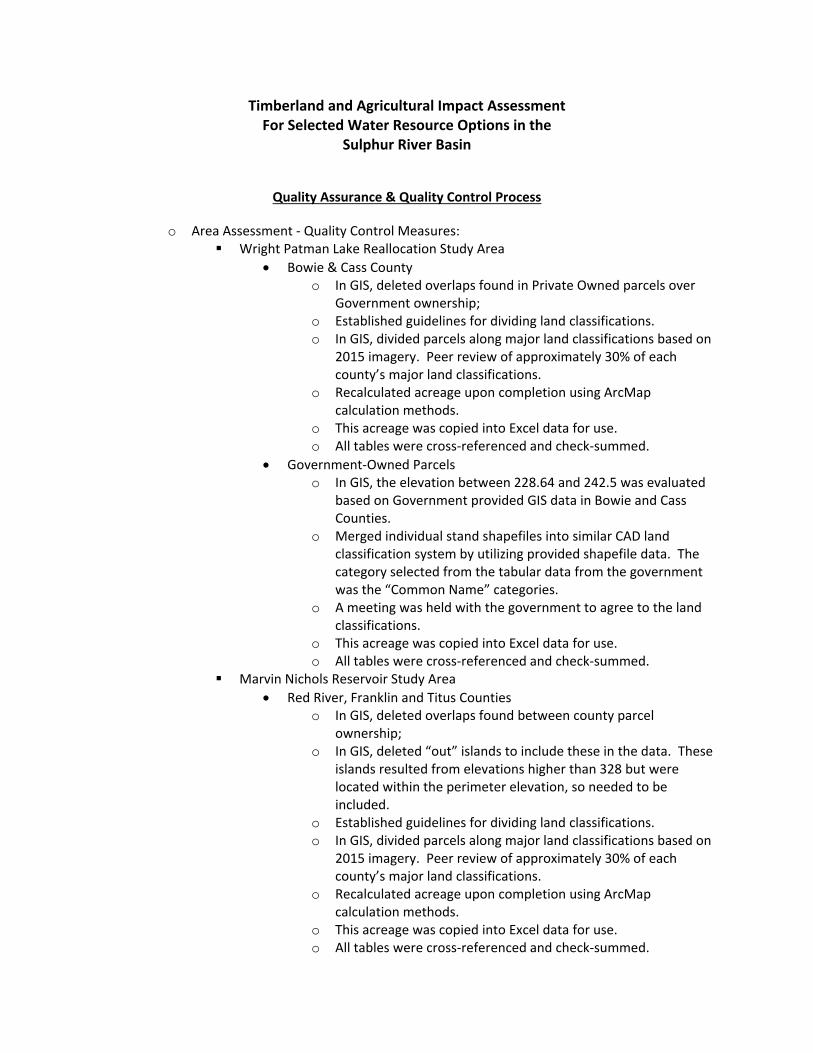
Timberland and Agricultural Impact Assessment For Selected Water Resource Options in the
Sulphur River Basin
Quality Assurance & Quality Control Process
o Area Assessment ‐ Quality Control Measures: Wright Patman Lake Reallocation Study Area
Bowie & Cass County o In GIS, deleted overlaps found in Private Owned parcels over
Government ownership; o Established guidelines for dividing land classifications. o In GIS, divided parcels along major land classifications based on
2015 imagery. Peer review of approximately 30% of each county’s major land classifications.
o Recalculated acreage upon completion using ArcMap calculation methods.
o This acreage was copied into Excel data for use. o All tables were cross‐referenced and check‐summed.
Government‐Owned Parcels o In GIS, the elevation between 228.64 and 242.5 was evaluated
based on Government provided GIS data in Bowie and Cass Counties.
o Merged individual stand shapefiles into similar CAD land classification system by utilizing provided shapefile data. The category selected from the tabular data from the government was the “Common Name” categories.
o A meeting was held with the government to agree to the land classifications.
o This acreage was copied into Excel data for use. o All tables were cross‐referenced and check‐summed.
Marvin Nichols Reservoir Study Area
Red River, Franklin and Titus Counties o In GIS, deleted overlaps found between county parcel
ownership; o In GIS, deleted “out” islands to include these in the data. These
islands resulted from elevations higher than 328 but were located within the perimeter elevation, so needed to be included.
o Established guidelines for dividing land classifications. o In GIS, divided parcels along major land classifications based on
2015 imagery. Peer review of approximately 30% of each county’s major land classifications.
o Recalculated acreage upon completion using ArcMap calculation methods.
o This acreage was copied into Excel data for use. o All tables were cross‐referenced and check‐summed.

o Market Value Assessment ‐ Quality Control Measures: Process for assigning market value and volume estimates on Private Owned and
Government Owned Parcels is as follows:
Several sites visited on the ground were chosen for aerial inspection to provide a baseline understanding of comparison of aerial observation to ground observation. Two KFS foresters performed this task to agree to observations.
Updated volume estimates to MNR study area for H1 & H2 categories to more accurately reflect the higher timber volumes observed from the aerial inspection.
Utilization of previous on‐the‐ground inspections to observe general forest conditions, quality and estimate volumes from most of the publically accessible sites.
On the Corps property, we were able to calculate that approximately 94% of the stands classifications were previously inspected.
Volume estimates were based on ocular estimates comparing experience with timber inventory, timber harvests and timber appraisals of similar quality timber in the market area.
o Estimates were copied into Excel data for use. o All tables were cross‐referenced and check‐summed.
Two KFS professional foresters jointly inspected several different stand types to ensure quality control of ground versus aerial observation.
Timber values were derived from a combination of o KFS experience in the market selling similar quality timber, o Knowledge of other timber sales from buyers and sellers, o Conversations with local timber buyers and mills, o Adjustments for quality of timber observed,
Adjustments were made for summer‐time accessibility only.