final technical report for the jea large-scale cfb ... library/research/coal/major... · jea...
TRANSCRIPT

Final Technical Report for the
JEA Large-Scale CFB Combustion Demonstration Project
Submitted to U.S. DEPARTMENT OF ENERGY National Energy Technology Laboratory (NETL) Pittsburgh, Pennsylvania 15236 Cooperative Agreement No. DE-FC21-90MC27403
June 24, 2005
DOE Issue, Final
Prepared by Black & Veatch for:

JEA Large-Scale CFB Combustion Demonstration Project
Final Technical Report TC-1
TABLE OF CONTENTS
1.0 OVERVIEW......................................................................................................................... 1 1.1 AWARDS AND REPORTS..................................................................................................................2 1.2 ABBREVIATIONS .............................................................................................................................2
2.0 PROJECT HISTORY .......................................................................................................... 7 2.1 BACKGROUND ................................................................................................................................7 2.2 PROJECT ORGANIZATIONAL STRUCTURE ........................................................................................7 2.3 PROJECT SCOPE ............................................................................................................................8 2.4 SUMMARY PROJECT SCHEDULE......................................................................................................8
3.0 PROJECT TECHNICAL OVERVIEW................................................................................. 9 3.1 CIRCULATING FLUIDIZED BED (CFB) BOILERS ...............................................................................9 3.2 NORTHSIDE CFB BOILERS DESIGN PARAMETERS ....................................................................... 11 3.3 LIMESTONE PREPARATION SYSTEM ............................................................................................. 15 3.4 AIR QUALITY CONTROL SYSTEM (AQCS).................................................................................... 15 3.5 TURBINE GENERATOR AND BALANCE OF PLANT SYSTEMS........................................................... 15 3.6 FUEL HANDLING SYSTEM (COAL, PETROLEUM COKE, AND LIMESTONE)....................................... 17 3.7 ASH HANDLING............................................................................................................................ 17 3.8 REUSE WATER ............................................................................................................................ 17 3.9 ASH PROCESSING AND STORAGE ................................................................................................ 18
4.0 START-UP........................................................................................................................ 19 4.1 MODIFICATIONS DURING START-UP AND INITIAL OPERATION ........................................................ 19
5.0 OPERATIONS AND MAINTENANCE.............................................................................. 20 5.1 UNIT 2 OPERATIONS SUMMARY ................................................................................................... 20 5.2 UNIT 2 MAINTENANCE SUMMARY ................................................................................................. 24 5.3 O&M STAFFING........................................................................................................................... 25 5.4 O&M COSTS ............................................................................................................................... 25
6.0 MODIFICATIONS AND UPGRADES (PHASE II) ............................................................ 26 6.1 INTREX DESIGN MODIFICATIONS................................................................................................... 26 6.2 EXPANSION JOINT MODIFICATIONS .............................................................................................. 27 6.3 STRIPPER COOLER MODIFICATIONS............................................................................................. 27 6.4 LIMESTONE SILO AND FEED SYSTEM MODIFICATIONS .................................................................. 27 6.5 LIMESTONE PREPARATION SYSTEM MODIFICATIONS .................................................................... 28
7.0 PERFORMANCE TESTING ............................................................................................. 29 7.1 INTRODUCTION....................................................................................................................... 29 7.2 TEST PROTOCOL ......................................................................................................................... 29 7.3 TEST SCHEDULE.......................................................................................................................... 29 7.4 SUMMARY OF TEST RESULTS....................................................................................................... 30 7.5 BOILER EFFICIENCY TESTS.......................................................................................................... 43 7.6 AQCS INLET AND STACK TESTS.................................................................................................. 44
8.0 CAPITAL COSTS ............................................................................................................. 46

JEA Large-Scale CFB Combustion Demonstration Project
Final Technical Report TC-2
8.1 CAPITAL COST HISTORY/OVERVIEW ............................................................................................ 46 8.2 CAPITAL IMPROVEMENT PROJECTS - PHASE 1 ............................................................................. 46 8.3 CAPITAL IMPROVEMENT PROJECTS - PHASE 2 ............................................................................. 47 8.4 CAPITAL IMPROVEMENT PROJECTS GOING FORWARD.................................................................. 47 8.5 COMMERCIALIZATION OF LARGE SCALE CFB COMBUSTION TECHNOLOGY .................................. 47
APPENDICES................................................................................................................................ 48
APPENDIX A - DRAWINGS........................................................................................................ A-1
APPENDIX B - MAJOR EQUIPMENT LIST ............................................................................... B-1
APPENDIX C - UNIT 2 OPERATING DATA............................................................................... C-1
APPENDIX D - CAPITAL COST DATA ...................................................................................... D-1
FIGURES
FIGURE 3-1 NORTHSIDE CFB PROCESS LAYOUT............................................................................10
TABLES
TABLE 3-1 BOILER DESIGN PARAMETERS.......................................................................................11 TABLE 3-2 FUEL SPECIFICATIONS .....................................................................................................12 TABLE 5-1 ANNUAL OPERATING AND AVAILABILITY DATA ..........................................................21 TABLE 5-2 COMPARISONS TO NERC DATA ......................................................................................22 TABLE 5-3 AVERAGE DAILY WATER FLOWS....................................................................................23 TABLE 5-4 STACK EMISSIONS DATA .................................................................................................23 TABLE 5-5 ASH PRODUCTION RATES................................................................................................24 TABLE 5-6 MAJOR UNIT 2 OUTAGES .................................................................................................24 TABLE 7-1 - 100% PITTBURGH 8 FUEL TESTS RESULTS ................................................................31 TABLE 7-2 - 50/50 BLEND PITT 8 COAL AND PET COKE TEST RESULTS .....................................33 TABLE 7-3 - ILLINOIS 6 COAL TEST RESULTS..................................................................................35 TABLE 7-4 - 80/20 BLEND PET COKE AND PITT 8 COAL TEST RESULTS .....................................37 TABLE 7-5 - SO2 REMOVAL EFFICIENCIES - 100% PITT 8 FUEL.....................................................39 TABLE 7-6 - SO2 REMOVAL EFFICIENCIES - 50/50 BLEND PITT 8 COAL AND PET COKE..........39 TABLE 7-7 - SO2 REMOVAL EFFICIENCIES - ILLINOIS 6 COAL.......................................................40 TABLE 7-8 - SO2 REMOVAL EFFICIENCIES - 80/20 BLEND PET COKE AND PITT 8 COAL..........40 TABLE 7-9 - PART LOAD TEST RESULTS - 100% PITTSBURGH 8 FUEL........................................41 TABLE 7-10 - PART LOAD TEST RESULTS - 50/50 BLEND PITT 8 COAL AND PET COKE...........41 TABLE 7-11 - PART LOAD TEST RESULTS - ILLINOIS 6 COAL........................................................42 TABLE 7-12 - PART LOAD TEST RESULTS - 80/20 BLEND PET COKE AND PITT 8 COAL...........42

JEA Large-Scale CFB Combustion Demonstration Project
Final Technical Report p-1
B&V Project 140895
1.0 OVERVIEW JEA is the largest public power company in Florida and the eighth largest public power company in the US, and is currently serving over 360,000 customers. Prior to the JEA Large-Scale CFB Demonstration Project, JEA’s Northside Generating Station (NGS) consisted of three oil/gas-fired steam electric generating units. NS Units 1 and 2 were each nominally rated at 275 megawatts (MW) and Unit 3 at 518 MW. Units 1 and 3 had been in service since 1966 and 1977 respectively. Unit 2 was completed in 1972, but had been inoperable since about 1983 due to major boiler problems. As part of its Integrated Resource Planning Study in 1996, JEA concluded that additional base load capacity was needed to support Jacksonville’s growing need for energy. The optimum source for that additional capacity was repowering NS Unit 2 with a nominal 300 MW state-of-the-art atmospheric circulating fluidized bed (CFB) boiler fueled by coal and/or petroleum coke. In order to provide the project with an overall environmental benefit, increase the economies of scale, and further diversify JEA’s overall fuel mix, a decision was made to repower NS Unit 1 with an identical CFB boiler as well. The environmental benefits included a reduction in emissions of nitrogen oxides, sulfur oxides and particulate matter by at least 10% compared to 1994/95 levels while increasing the net plant capacity by 250%. In early 1997, detailed Condition Assessments of Unit 1 and Unit 2 Balance of Plant (BOP) equipment and systems were conducted by JEA and Black & Veatch (B&V). The results of these assessments indicated that both Unit 1 and Unit 2 were good candidates for repowering and capable of operating for an additional twenty years, provided various equipment and system upgrades were made. In April 1997, JEA’s Board approved the project and authorized staff to proceed with contract negotiations and environmental permitting. Contract negotiations were subsequently initiated with Foster Wheeler (FW) and the United States Department of Energy (DOE) for participation in cost sharing for the first unit (Unit 2) as a Large-Scale CFB Combustion Demonstration Project. Cooperative Agreement DE-FC21-90MC27403 between JEA and the DOE was finalized in September 1997. The Agreement provided for cost sharing based on a total approved project budget of $305,773,774. This represented a DOE cost share of $73,072,464, with the remainder of the project cost paid by JEA. Environmental permitting work was initiated by FW Environmental in the latter part of 1997. The permitting work, and associated preliminary engineering, proceeded through 1998, and early 1999. FW began detailed engineering for the Boiler Island, including the Air Quality Control System (AQCS), Chimney, and Limestone Preparation System, in December 1998. B&V began detailed engineering for BOP systems, including the Fuel Handling System, in February 1999. Permits necessary to begin construction were issued in July 1999 with site clearing and construction beginning in August 1999. Initial synchronization of Unit 2 occurred on February 19, 2002, and initial synchronization of Unit 1 occurred on May 29, 2002. The purpose of this report is to provide a technical account of the total work performed for the project under the Cooperative Agreement between JEA and the DOE. Although the DOE participation was only in the Unit 2 and Common Facilities portion of the project, the project execution by JEA included design and construction for repowering of Unit 1 in the same time frame. Thus, while this report is primarily for Unit 2 and Common Facilities, it also contains some summary type information for the entire Unit 1 and 2 Repowering Project.

JEA Large-Scale CFB Combustion Demonstration Project
Final Technical Report p-2
B&V Project 140895
1.1 Awards and Reports The Northside Repowering Project received the 2002 Powerplant Award from Power magazine. In addition, during design and construction, a number of papers were presented on the JEA Large-Scale CFB Demonstration Project at various conferences. The Cooperative Agreement between DOE and JEA stipulated that a number of reports be prepared to document and summarize various aspects of the Demonstration Project. Following is a listing of the reports that were developed:
Title Detailed Public Design Report Start-up Modifications Report Topical Report 22: The JEA Large-Scale CFB Combustion Demonstration Project Topical Report: Air Quality Control System Topical Report: Ash Processing System Fuel Capability Demonstration Test Report 1: 100% Pittsburgh 8 Coal Fuel Fuel Capability Demonstration Test Report 2: 50/50 Blend Petroleum Coke and Pittsburgh 8 Coal Fuel Fuel Capability Demonstration Test Report 3: 100% Illinois 6 Coal Fuel Fuel Capability Demonstration Test Report 4: 80/20 Blend Petroleum Coke and Pittsburgh 8 Coal Fuel Final Technical Report (this report)
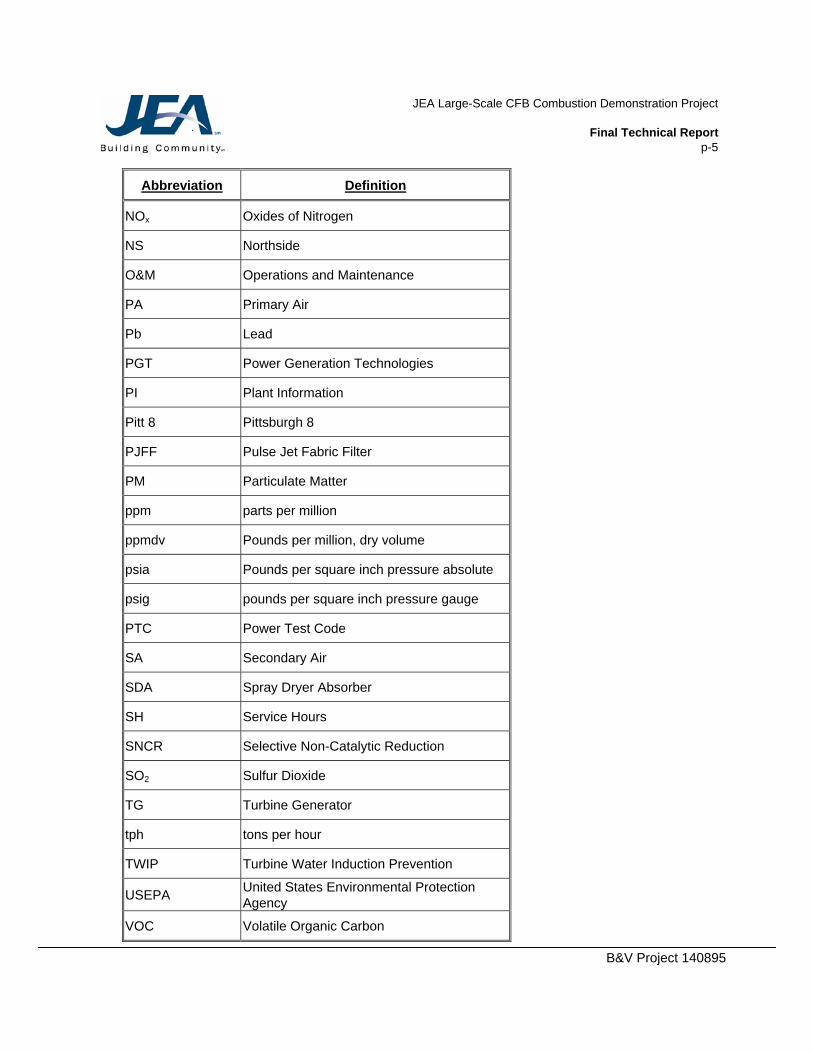
The above reports are available on the DOE Clean Coal Technology Compendium website at the following link: http://www.netl.doe.gov/cctc/resources/library/bibliography/demonstration/aepg/baepgfb_jackea.html 1.2 Abbreviations Following is a definition of abbreviations used in this report. Generally, at their first use, these terms are fully defined in the text of the report, followed by the abbreviation in the parenthesis. Subsequent references typically use the abbreviation only.
Abbreviation Definition
AQCS Air Quality Control System
B&V Black & Veatch Corporation
BOP Balance of Plant
BSA Byproduct Storage Area
Btu British Thermal Unit

JEA Large-Scale CFB Combustion Demonstration Project
Final Technical Report p-3
B&V Project 140895
Abbreviation Definition
CaCO3 wt. fraction CaCO3 in limestone
CAE Clean Air Engineering
CaO Lime
Ca:S Calcium to Sulfur Ratio
CEMS Continuous Emissions Monitoring System
CFB Circulating Fluidized Bed
CO Carbon Monoxide
CO2 Carbon Dioxide
CY Calendar Year
DAF Dry, ash free
DAHS Data Acquisition Handling System
DCS Distributed Control System
DOE Department of Energy
EAF Equivalent Availability Factor
F Fluorine or Degrees Fahrenheit
FF Fabric Filter
FGS Fluor Global Services
FW Foster Wheeler
FWEC Foster Wheeler Energy Corporation
FWUSA Foster Wheeler USA
GAG Gross Actual Generation
GCF Gross Capacity Factor
GE General Electric
GOF Gross Output Factor
GPD Gallons per Day

JEA Large-Scale CFB Combustion Demonstration Project
Final Technical Report p-4
B&V Project 140895
Abbreviation Definition
gpm gallons per minute
HF Fluoride
Hg Mercury
HHV Higher Heating Value
HP High-Pressure
HRA Heat Recovery Area
ID Induced Draft
IP Intermediate Pressure
lb Pounds
lb/hr Pounds per hour
lb/MMBtu pounds per million Btu
lb/TBtu pounds per trillion Btu
LP Low Pressure
MCR Maximum Continuous Rating
MFT Master Fuel Trip
MgCO3 wt. fraction MgCO3 in limestone
MgO Magnesium Oxide
MMBtu Million Btu
MW Megawatts
MWh Megawatt-hour
NCF Net Capacity Factor
NERC North American Electric Reliability Council
NGS Northside Generating Station
NH3 Ammonia
NOF Net Operating Factor
JEA Large-Scale CFB Combustion Demonstration Project
Final Technical Report p-5
B&V Project 140895
Abbreviation Definition
NOx Oxides of Nitrogen
NS Northside
O&M Operations and Maintenance
PA Primary Air
Pb Lead
PGT Power Generation Technologies
PI Plant Information
Pitt 8 Pittsburgh 8
PJFF Pulse Jet Fabric Filter
PM Particulate Matter
ppm parts per million
ppmdv Pounds per million, dry volume
psia Pounds per square inch pressure absolute
psig pounds per square inch pressure gauge
PTC Power Test Code
SA Secondary Air
SDA Spray Dryer Absorber
SH Service Hours
SNCR Selective Non-Catalytic Reduction
SO2 Sulfur Dioxide
TG Turbine Generator
tph tons per hour
TWIP Turbine Water Induction Prevention
USEPA United States Environmental Protection Agency
VOC Volatile Organic Carbon

JEA Large-Scale CFB Combustion Demonstration Project
Final Technical Report p-6
B&V Project 140895
Abbreviation Definition
WAPC Wheelabrator Air Pollution Control
WWGay W.W. Gay Mechanical Contractor
ZCC Zachry Construction Corp.

JEA Large-Scale CFB Combustion Demonstration Project
Final Technical Report p-7
B&V Project 140895
2.0 PROJECT HISTORY
2.1 Background In September 1997, the U.S. DOE and JEA entered into an agreement to repower JEA’s Northside Generating Station Unit 2 with CFB boiler technology from FW. The purpose of this agreement was to demonstrate CFB technology for coal firing in large-scale applications while providing increased plant electric output, reduced emissions and broad fuel flexibility. CFB technology is an advanced method for utilizing coal and other solid fuels in an environmentally acceptable manner. The low combustion temperature allows sulfur dioxide (SO2 ) capture via limestone injection while minimizing oxides of nitrogen (NOx ) emissions. The technology is flexible enough to handle a wide range of coals as well as petroleum coke and blends of coal and coke. CFB boilers have been installed in smaller, industrial-size plants but have only recently been considered for larger utility power plants. The DOE helped test a 110 MW CFB boiler at a power station in Colorado in one of its earliest and most successful Clean Coal Technology projects. At nearly 300 MW each, the JEA CFB boilers more than double the size of the Colorado unit and are among the world’s largest. The JEA Large-Scale CFB Demonstration Project involved repowering Northside (NS) Unit 2, an existing 275 MW oil/gas fired boiler which had been out of service since the early 80’s, with a 297.5 MW CFB boiler. The DOE contributed approximately $73 million from the Clean Coal Technology Program, and JEA provided the remainder of the total budget. The DOE cost sharing included two years of demonstration test runs, during which both coal and coal/petroleum coke blends were fired. JEA also repowered Northside Unit 1 with an identical CFB boiler. The DOE did not cost share in the Unit 1 repowering. 2.2 Project Organizational Structure JEA contracted with FW to supply the extended boiler island scope of the project. Foster Wheeler Energy Corporation (FWEC) provided the design and supply of the CFB boilers. Foster Wheeler USA (FWUSA) provided engineering, procurement, and construction management services on a cost reimbursable basis for installation of the boilers and for furnishing and erecting the air pollution control systems, chimney, limestone preparation system, and ash handling systems. Foster Wheeler Environmental Corporation, a subsidiary of FWUSA, provided environmental permitting services. The remaining portions of the project were implemented by JEA staff and supplemented by B&V through a pre-existing Alliance with JEA for engineering services. Procurement, construction and related services were provided through other pre-existing Alliances between JEA and Zachry Construction Corporation (ZCC), Fluor Global Services (FGS), W.W. Gay Mechanical Contractor, Inc.(WWGay), and Williams Industrial Services Inc. This work included upgrades of the existing turbine island equipment, construction of the receiving and handling facilities for the fuel and reagent required for solid fuel firing, upgrading of the electrical switchyard facilities, and construction of an ash management system.
JEA Large-Scale CFB Combustion Demonstration Project
Final Technical Report p-8
B&V Project 140895
2.3 Project Scope The project involved the construction and operation of two CFB boilers fueled by coal and petroleum coke to repower two existing steam turbines, each generating nearly 300 MW. CFB boilers are generally capable of removing over 98% of SO2. However, to improve the overall economics and environmental performance, a polishing scrubber was included to minimize reagent consumption while firing petroleum coke containing up to 8.0% sulfur. The relatively low furnace operating temperature of about 1600° F inherently results in appreciably lower NOx emissions compared to conventional coal-fired power plants. However, the project also included a new selective non-catalytic reduction (SNCR) system to further reduce emissions of NOx. Over 99.8% of particulate emissions are removed by a baghouse. In addition to the CFB combustor and the air pollution control systems, new equipment for the project included a chimney as well as fuel, limestone, and ash handling systems. The project also required overhaul and/or upgrades of existing systems such as the steam turbines, condensate and feedwater systems, circulating water systems, water treatment systems, plant electrical distribution systems, the switchyard, and the plant control systems. New construction associated with the Repowering Project occupies approximately seventy-five acres of land at the Northside Generating Station (see the Site Arrangement Drawing and Overall Plot Plan in Appendix A). Solid fuel delivery to the site required new receiving, handling, and storage facilities. Limestone and ash storage and handling facilities were also required. Wherever possible, existing facilities and infrastructure were used for the project. These include the intake and discharge system for cooling water, the wastewater treatment system, and the electric transmission lines and towers. Project activities included engineering and design, permitting, equipment procurement, construction, start-up, and demonstration of the commercial feasibility of the technology. During the demonstration period, Unit 2 was operated under normal dispatch conditions and also tested on several different types of coal and coal/petroleum coke blends to demonstrate the viability of the technology. Units 1 and 2 continue to operate successfully to provide a significant portion of JEA‘s power generation. 2.4 Summary Project Schedule The Summary Project Schedule on the following pages illustrates the major project activities and milestones for the JEA Large-Scale CFB Combustion Demonstration Project, from the signing of the Cooperative Agreement between DOE and JEA in September 1997 through the conclusion of this DOE Demonstration Project.

IDTa
sk N
ame
1C
oope
rativ
e A
gree
men
t Sig
ned
2D
OE
Phas
e 1
- Des
ign
3Pr
ojec
t Man
agem
ent
4 P
roje
ct M
anag
emen
t -P
hase
15
Pro
ject
Man
agem
ent P
lan
6E
nviro
nmen
tal M
onito
ring
Pla
n7
Perm
ittin
g
8O
vera
ll P
erm
ittin
g A
ctiv
ities
9N
EP
A C
ompl
etio
n
10FA
CE
Wat
er P
erm
it
11E
RP
Per
mit
12N
PD
ES
Wat
er P
erm
it
13Pr
elim
inar
y D
esig
n C
ompl
ete
14D
esig
n En
gine
erin
g
15N
TP -
Boi
ler/A
QC
SE
ngin
eerin
g16
NTP
- B
alan
ce o
f Pla
nt &
Mat
eria
l Han
dlin
gE
ngin
eerin
g17
Det
aile
d D
esig
nE
ngin
eerin
g18
40%
Des
ign
Rev
iew
1990
% D
esig
n R
evie
w
20D
OE
Phas
e 2
- Con
stru
ctio
n an
dSt
art-u
p21
Proj
ect M
anag
emen
t
22P
roje
ct M
anag
emen
t -P
hase
223
Uni
t 2 C
onst
ruct
ion
and
Star
t-up
9/29
9/30
8/13
5/7
12/2
2/2
12/8 12
/7
7/30
7/27
2/15
8/3
8/3
2/1
8/3
6/29
6/14
5/18
8/16
2/19
Q1
Q2
Q3
Q4
Q1
Q2
Q3
Q4
Q1
Q2
Q3
Q4
Q1
Q2
Q3
Q4
Q1
Q2
Q3
Q4
Q1
Q2
Q3
Q4
Q1
Q2
Q3
Q4
Q1
Q2
Q3
Q4
Q1
Q2
Q3
Q4
1997
1998
1999
2000
2001
2002
2003
2004
2005
Task
Pro
gres
s
Mile
ston
e
Sum
mar
y
Rol
led
Up
Task
Rol
led
Up
Mile
ston
e
Rol
led
Up
Pro
gres
s
Spl
it
Ext
erna
l Tas
ks
Pro
ject
Sum
mar
y
Gro
up B
y S
umm
ary
JEA
Nor
thsi
de U
nit 2
Rep
ower
ing
Sum
mar
y P
roje
ct S
ched
ule
Pag
e 1
Pro
ject
: NS
Rep
ower
ing
DO
E S
ched
Dat
e: T
hu 5
/5/0
5

IDTa
sk N
ame
24N
TP -
Boi
ler C
onst
ruct
ion
25C
onst
ruct
ion
Act
iviti
es
26D
rum
Lift
2750
% C
onst
ruct
ion
Rev
iew
28B
oile
r Hyd
ro
2910
0% C
onst
ruct
ion
Rev
iew
30Fi
rst F
ire -
Sol
id F
uel
31In
itial
Syn
cron
izat
ion
32D
OE
Phas
e 3
- Ope
ratio
n
33Pr
ojec
t Man
agem
ent
34P
roje
ct M
anag
emen
t -P
hase
335
Pub
lic D
esig
n R
epor
t
36E
nviro
nmen
tal
Mon
itorin
g/Te
st P
lan
37S
tart-
up M
odifi
catio
nsR
epor
t38
Fuel
Fle
xibi
lity
Test
ing
39Te
st P
roto
col
40Te
st R
epor
t 1 -
100%
Pitt
sbur
gh 8
Coa
l41
Test
Rep
ort 2
- 50
/50
Ble
ndP
itt 8
Coa
l and
Pet
Cok
e
42Te
st R
epor
t 3 -
100%
Illin
ois
6 C
oal
43Te
st R
epor
t 4 -
80/2
0 B
lend
Pet
Cok
e an
d P
itt 8
Coa
l
44Fi
nal T
echn
ical
Rep
ort
8/16
8/16
2/19
6/5
1/25
5/23
8/14
2/14
2/19
2/20
3/31
9/19
2/24 5/
4
3/1
9/3
12/3 2/
7 2/18 3/
31
Q1
Q2
Q3
Q4
Q1
Q2
Q3
Q4
Q1
Q2
Q3
Q4
Q1
Q2
Q3
Q4
Q1
Q2
Q3
Q4
Q1
Q2
Q3
Q4
Q1
Q2
Q3
Q4
Q1
Q2
Q3
Q4
Q1
Q2
Q3
Q4
1997
1998
1999
2000
2001
2002
2003
2004
2005
Task
Pro
gres
s
Mile
ston
e
Sum
mar
y
Rol
led
Up
Task
Rol
led
Up
Mile
ston
e
Rol
led
Up
Pro
gres
s
Spl
it
Ext
erna
l Tas
ks
Pro
ject
Sum
mar
y
Gro
up B
y S
umm
ary
JEA
Nor
thsi
de U
nit 2
Rep
ower
ing
Sum
mar
y P
roje
ct S
ched
ule
Pag
e 2
Pro
ject
: NS
Rep
ower
ing
DO
E S
ched
Dat
e: T
hu 5
/5/0
5

JEA Large-Scale CFB Combustion Demonstration Project
Final Technical Report p-9
B&V Project 140895
3.0 PROJECT TECHNICAL OVERVIEW
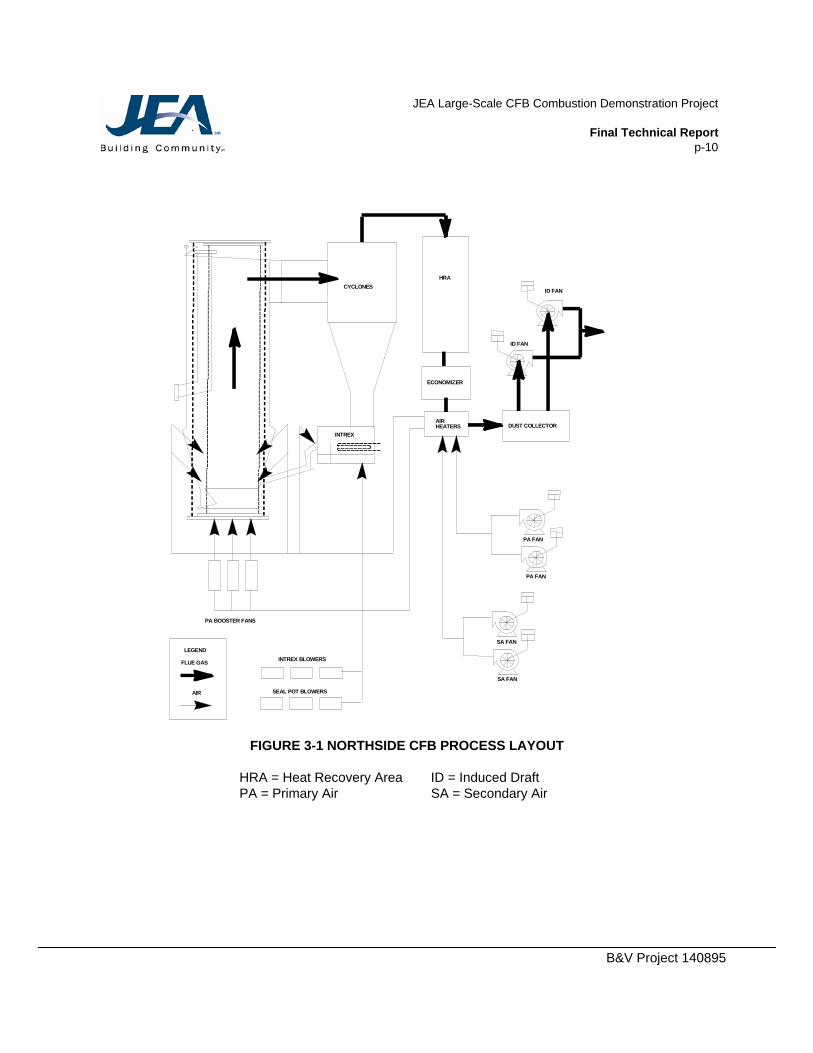
The CFB boiler technology selected by JEA for the Demonstration Project is an advanced method for utilizing coal and other solid fuels in an environmentally acceptable manner. The low combustion temperature allows SO2 capture via limestone injection, while minimizing NOx emissions. The technology provides the capability to burn a wide range of fuels including coal, petroleum coke, and blends of the two. Although CFB boilers are generally capable of removing over 98% of SO2, a polishing scrubber was included to minimize reagent consumption and improve environmental performance while firing petroleum coke containing up to 8.0% sulfur. Based on the incremental amount of SO2 removal required, dry scrubber technology, followed by a baghouse for particulate removal, was selected for the AQCS. Firing of solid fuels on the Northside site required the design and installation of a completely new system for receiving, handling, and storing coal and petroleum coke. The same system is used for receiving and handling limestone for CFB boiler reagent. Firing of solid fuels results in the production of ash byproducts, so new provisions had to be designed and installed for handling and processing these materials. Facilities were also included for storing the byproducts pending development of useful markets for these materials. A detailed condition assessment of existing systems and components was conducted during the conceptual design stage of the project. Based on that report, existing systems and components were either reused, upgraded, or replaced. Detailed System Descriptions of the major boiler, turbine, and balance of plant systems are contained in the Detailed Public Design Report for this project, which is available on the DOE website at the following link: http://www.netl.doe.gov/cctc/resources/pdfs/jacks/JEAmaster.pdf 3.1 Circulating Fluidized Bed (CFB) Boilers The need to improve the fluidized bed combustion efficiency (which also increases overall boiler efficiency and reduces operating costs) and the desire to burn a much wider range of fuels has led to the development and application of the CFB boiler. Through the years, boiler suppliers have been increasing the size of these high-efficiency steam generators. See Fig. 3-1 for the Northside CFB Process Layout.
JEA Large-Scale CFB Combustion Demonstration Project
Final Technical Report p-10
B&V Project 140895
ECONOMIZER
HRA
SA FAN
SA FAN
PA FAN
PA FAN
ID FAN
ID FAN
INTREX BLOWERS
SEAL POT BLOWERS
INTREX
AIRHEATERS
CYCLONES
DUST COLLECTOR
PA BOOSTER FANS
FLUE GAS
AIR
LEGEND
FIGURE 3-1 NORTHSIDE CFB PROCESS LAYOUT
HRA = Heat Recovery Area ID = Induced Draft PA = Primary Air SA = Secondary Air

JEA Large-Scale CFB Combustion Demonstration Project
Final Technical Report p-11
B&V Project 140895
The CFB process offers the means for efficiently burning a wide variety of fuels while maintaining low emissions. Fuel is fed to the lower furnace where it is burned in an upward flow of combustion air. Fuel, ash, and unburned fuel carried out of the furnace are collected by a separator and returned to the lower furnace. Limestone, which is used as a sulfur sorbent, is also fed to the lower furnace. Furnace temperature is maintained in the range of 1500° to 1700° F by suitable heat absorbing surface. This process offers the following advantages:
Fuel Flexibility – The relatively low furnace temperatures are below the ash softening temperature for nearly all fuels. As a result, the furnace design is independent of ash characteristics, which allows a given furnace to handle a wide range of fuels.
Low SO2 Emissions – Limestone is an effective sulfur sorbent in the temperature range of 1500° to 1700° F. SO2 removal efficiency of 95% and higher has been demonstrated in the industry along with good sorbent utilization.
Low NOX Emissions – Low furnace temperatures of 1500° to 1700° F plus staging of air feed to the furnace produces very low NOX emissions.
High Combustion Efficiency – The long solids residence time in the furnace resulting from the collection/recirculation of solids via the cyclone, plus the vigorous solids/gas contact in the furnace caused by the fluidization airflow, results in high combustion efficiency, even with difficult-to-burn fuels. The unburned carbon loss component of the combustion efficiency is typically in the 1% to 2% range. For the JEA Northside boilers, the predicted unburned carbon loss was 2% on coal and 1.25% on petroleum coke.
3.2 Northside CFB Boilers Design Parameters The design parameters at maximum continuous rating (MCR) for the Northside CFB Boilers are indicated in Table 3-1.
TABLE 3-1 BOILER DESIGN PARAMETERS
The performance fuel specifications for coal and petroleum coke, including ranges, are indicated in the following Table 3-2. Boiler Arrangement Drawings are included in Appendix A.
Parameter 100% MCR Main Steam Flow 1,994,000 lb/hr Main Steam Pressure at Superheater Outlet Header 2620 psig Main Steam Pressure at Turbine 2,500 psig Main Steam Temperature 1006° F Reheat Steam Flow 1,773,000 lb/hr Reheat Steam Pressure 555 psig Reheat Steam Temperature 1006° F Boiler Efficiency firing Performance Coal 88.1% Boiler Efficiency firing Performance Petroleum Coke 90%

JEA Large-Scale CFB Combustion Demonstration Project
Final Technical Report p-12
B&V Project 140895
TABLE 3-2 FUEL SPECIFICATIONS
Delayed Petroleum Coke Performance Range Minimum Maximum Performance Minimum Maximum Heat Content, Btu/lb (HHV) 13,000 na 14,000 13,900 na Hardgrove Grindability 25 80 wr wr wr As received Particle Size (inches) 0 4 na na na Proximate Analysis Volatile Matter 7.0 14.0 9.0 7.0 11.0 Fixed Carbon 71.0 88.0 81.6 na na Moisture na 15.0 (Note 7) 9.0 na 15.0 Ash na 3.0 0.4 na 3.0 Ultimate Analysis Carbon 78.0 89.0 79.0 79.0 85.0 Hydrogen 3.2 5.8 3.6 3.25 4.17 Nitrogen 0.4 2.0 1.0 .73 1.6 Oxygen 0.1 1.8 0.3 0.3 1.65 Sulfur 3.0 8.0 6.7 4.0 8.0 Moisture na 15.0 (Note 7) 9.0 na 15.0 Ash na 3.0 0.4 na 3.0 Vanadium, ppm na 3,500 (Note 8) na na na Nickel, ppm na 600 (Note 8) na na na Fluoride na (Note 5) na na na Lead na (Note 5) na na na Mercury na (Note 5) na na na Chlorine na (Note 10) na na na Alkalis na (Note 9) na na na Coal Performance Performance Range
(Note 11) Minimum Maximum Heat Content, Btu/lb (HHV) 12,690 11,600 13,959 Hardgrove Grindability na na naAs received Particle Size (inches) na na naAsh Fusion (reducing, soft, °F) na na naVolatile Matter (% DAF) 43.41 39.1 47.0 Proximate Analysis Volatile Matter 35.63 na (Note 4) Fixed Carbon 46.4 na na Moisture 5.2 (Note 8) na 12.0 Ash (Note 3) 12.8 7.0 15.0

JEA Large-Scale CFB Combustion Demonstration Project
Final Technical Report p-13
B&V Project 140895
Coal (continued) Performance Performance Range
(Note 11) Minimum Maximum Ultimate Analysis Carbon 68.6 66.6 70.6 Hydrogen 4.6 4.0 5.2 Nitrogen 1.3 0.8 1.6 Oxygen 4.11 3.98 4.2 Chlorine 0.09 na 0.1 Sulfur (Note 3) 3.3 2.97 3.6 Moisture 5.2 (Note 7) na 12.0 Ash (Note 3) 12.8 7.0 15.0 Fluoride na na naLead na na naMercury na na na Mineral Analysis of Coal Ash Phosphorous Pentoxide wr wr wrSilicon Oxide wr wr wrFerric Oxide wr wr wrAluminum Oxide wr wr wrTitanium Oxide wr wr wrCalcium Oxide wr wr wrMagnesium Oxide wr wr wrSulfur Trioxide wr wr wrPotassium Oxide wr wr wrSodium Oxide wr wr wr Coal 85% MCR Range 100% MCR Range Minimum Maximum Minimum Maximum Heat Content, Btu/lb (HHV) 10,000 na 11,600 na Hardgrove Grindability 35 80 35 80 As received Particle Size (inches) 0 4 0 4 Ash Fusion (reducing, soft, °F) 2,050 2,680 2,050 2,680 Volatile Matter (% DAF) na 47.0 na 47.0 Proximate Analysis Volatile Matter 20.0 40.0 (Note 4) 30 36 Fixed Carbon 37.0 na 42 na Moisture na 15.0 (Note 7) Na 13.0 (Note 7) Ash (Note 3) 7.0 15.0 7.0 15.0 Ultimate Analysis Carbon 49.3 86.0 59 72 Hydrogen 3.2 6.0 3.9 5.3 Nitrogen 0.4 1.9 0.8 1.6

JEA Large-Scale CFB Combustion Demonstration Project
Final Technical Report p-14
B&V Project 140895
Coal (continued) 85% MCR Range 100% MCR Range Minimum Maximum Minimum Maximum Oxygen 3.0 9.8 3.0 9.8 Chlorine na 0.3 (Note 10) na 0.3 (Note 10) Sulfur (Note 3) 0.5 4.5 0.5 4.5 Moisture na 15.0 (Note 7) na 13.0 (Note 7) Ash (Note 3) 7.0 15.0 7.0 15.0 Fluoride na (Note 5) na (Note 5)Lead na (Note 5) na (Note 5)Mercury na (Note 5) na (Note 5) Mineral Analysis of Coal Ash Phosphorous Pentoxide 0.04 3.0 0.04 3.0 Silicon Oxide 30.0 65.0 30.0 65.0 Ferric Oxide 2.9 45.0 2.9 45 Aluminum Oxide 18.0 36.0 18.0 36.0 Titanium Oxide 0.3 3.0 0.3 3.0 Calcium Oxide 0.5 9.0 0.5 9.0 Magnesium Oxide 0.1 2.0 0.1 2.0 Sulfur Trioxide 0.1 8.0 0.1 8.0 Potassium Oxide 0.1 4.0 (Note 9) 0.1 4.0 (Note 9) Sodium Oxide 0.1 2.0 (Note 9) 0.1 2.0 (Note 9)
Note:
1. na = no limit applicable 2. All data is for fuel “as received”, and is percent by weight unless otherwise noted. 3. Coal minimum sulfur content is 0.5% given at least 12.0% ash. Coal minimum ash content is 7.0%, given at least
1.0% sulfur. For coals with sulfur content between 0.5% and 1.0%, and ash content between 7% and 12%, the minimum coal ash content as a function of sulfur content shall be as shown in Fig. 3-5.
4. The maximum coal volatile matter is 47% on a dry-ash free basis. 5. The emissions guarantee shall be based upon uncontrolled emissions as resulting from the combined inputs from
fuel and limestone that do not exceed the following values: Lead - 0.00278 lb/MBtu (HHV) Mercury - 0.0000174 lb/MBtu (HHV) Fluorine (as HF) - 0.0106 lb/MBtu (HHV)
6. wr = within range 7. Surface moisture of the crushed fuel should be below 10% to avoid conveying and feeding hang-ups. 8. The total vanadium and nickel content in the fuel should not exceed 2,000 ppm. Operation at higher levels than
2,000 ppm will result in increased outages for unit cleaning and repairs. 9. The fuels fired in the boiler should have a combined acetic acid soluble sodium (Na) and potassium (K) content less
than 0.05% (500 ppm) on a dry fuel basis to prevent bed sintering and agglomeration. 10. The chlorine level in the fuel should be less than 0.1% on a dry fuel basis to avoid corrosion and agglomeration
problems. 11. Performance coal will be Eastern US coal.

JEA Large-Scale CFB Combustion Demonstration Project
Final Technical Report p-15
B&V Project 140895
3.3 Limestone Preparation System The limestone preparation system grinds and dries raw limestone and pneumatically transports it to the limestone storage silo for each unit. The limestone preparation system is designed for grinding limestone at a maximum feed size of 1 inch to a product size of -2000 microns meeting the CFB desired product distribution curve, with a residual moisture content of 1% maximum. Three pneumatic transfer systems, one for each unit, and a shared spare system, are provided to convey the prepared limestone from the preparation building to the unit’s silo. Each system is capable of transferring limestone to either Unit 1 or 2. 3.4 Air Quality Control System (AQCS) To optimize overall plant performance, a polishing SO2 scrubber was included in the design. The CFB boiler provides approximately 90% SO2 capture via limestone injection, with the remaining capture from a semi-dry polishing scrubber via injection of lime. Overall SO2 capture is over 98%. Although CFB boilers can achieve 98% SO2 removal, limestone utilization is reduced as removal efficiencies exceed 90% to 95%. The polishing scrubber allows reduction of the overall sorbent use, such that the savings in operating cost (sorbent, ash disposal) offset the capital and operating costs of the polishing scrubber. Another consideration in the decision to add the scrubber was the enhanced environmental performance regarding reductions of trace element emissions provided by the scrubber. The polishing scrubber is a spray dryer/baghouse combination. The spray dryer utilizes a dual fluid nozzle atomized with air, and the baghouse is a pulse-jet design. A key feature of the polishing scrubber is a recycle system which adds fly ash to the reagent feed, thus utilizing the unreacted lime in the fly ash from the CFB boiler and reducing the amount of fresh lime required. The polishing scrubber for each unit, provided by Wheelabrator Air Pollution Control (WAPC), consists of a Spray Dryer Absorber/Fabric Filter (SDA/FF) Dry Scrubbing System to control SO2 and acid gases, solid particulates, and heavy metals. Each system consists of:
• A Two Fluid Nozzle Spray Dryer Absorber (SDA) • A Medium-Pressure Pulse Jet Fabric Filter (FF) • A Feed Slurry Preparation System • A common Absorbent Preparation System for both units, consisting of a Lime Storage Silo,
redundant Vertical Ball Mill Slaking Systems, and redundant Transfer/Storage Tanks and pumps.
• A common Air Compressor System to provide atomizing air for the SDA, dried pulse air for the FF, and instrument air. The compressors are provided with a closed loop cooling system. Waste heat from the compressor is used to preheat the reuse water feed to the SDA Feed Slurry System.
3.5 Turbine Generator and Balance of Plant Systems The Unit 2 Turbine Generator (TG) was upgraded to maximize output and improve turbine heat rate as much as practical. The high pressure/intermediate pressure (HP/IP) rotor, diaphragms, and inner casing

JEA Large-Scale CFB Combustion Demonstration Project
Final Technical Report p-16
B&V Project 140895
were replaced with a General Electric (GE) Dense Pack design, which added four stages to the turbine, and increased turbine efficiency. The normal operating throttle pressure was also increased from 2400 psig to 2500 psig. In addition, the original mechanical linkage type turbine control system was replaced with a state-of-the-art Mark VI electrohydraulic control system, to allow better response to load changes and for complete integrated control, protection, and monitoring of the turbine generator and accessories. A new brushless excitation system was also installed on the generator, and a new turbine lube-oil conditioner was installed. Unit 2 was originally designed to provide power to the JEA grid at 138kV. However, to better interface with present and future grid capabilities, the output from Unit 2 was increased to 230 kV. This required replacement of the generator step-up transformer and associated substation upgrades. The once-through circulating water system was upgraded by replacing the original 90% copper/10% nickel heat-transfer surfaces in the condenser damaged by erosion/corrosion with modular bundles consisting of titanium tubes welded to solid titanium tubesheets. The existing circulating water pumps were replaced with larger capacity pumps. The traveling screens were replaced with those that have man-made basket material to increase their life. Debris filters were added to minimize condenser tube pluggage and possible damage. A sodium hypochlorite shock-treatment system was installed to prevent sea life from adhering to the titanium components of the condenser. Upgrades to the condensate system in Unit 2 included upgrades to the condensate pumps and condensate booster pumps, replacement of the steam packing exhausters, replacement of the low pressure (LP) feedwater heaters, including replacement of the tube bundle in the lowest pressure heater (located in the condenser neck), replacement of the deaerator and storage tank, installation of a new condensate polisher, and installation of new chemical feed systems. The new feedwater heaters included Type 304 N stainless steel tubes (welded to tubesheets), instead of the aluminum brass tubes rolled into the tubesheets of the original heaters. Upgrades to the feedwater system in Unit 2 included replacement of the HP feedwater heaters, upgrades to the boiler feed pumps and fluid drives, and replacement of the boiler feed pump drive motor. Again, the new feedwater heaters included Type 304 N stainless steel tubes (welded to tubesheets), instead of the aluminum brass tubes rolled into the tubesheets of the original heaters. The capability of existing piping systems and components in Unit 2 was reviewed to confirm adequacy for the new operating and design conditions. If necessary, these systems and components were upgraded or replaced. Existing 2-½ inch and larger valves in Unit 2 were either refurbished or replaced. Nearly all 2 inch and smaller piping and valves in Unit 2 were replaced. Essentially all instrumentation in Unit 2 was replaced. The original control systems in Unit 2 were replaced with a new distributed control system (DCS) provided by ABB Inc, to provide control, monitoring, and protection of the boiler, turbine interfaces, and balance of plant systems. FW provided the logic design for the CFB boiler, and B&V provided the logic design for the BOP systems, including provisions for turbine water induction prevention (TWIP). ABB provided the programming to implement the logic design for the boiler and BOP systems. The Unit 2 auxiliary electric system (switchgear and motor control centers) was replaced because of equipment obsolescence. All power and control wiring was replaced due to the age of the wiring and because the existing control wiring was not segregated from the power wiring, thus not meeting the

JEA Large-Scale CFB Combustion Demonstration Project
Final Technical Report p-17
B&V Project 140895
requirements of the new DCS system. Other miscellaneous enhancements included the installation of additional air dryers and screw-type air compressors and the installation of titanium plate-type heat exchangers for the Unit 2 closed cooling water system, similar to those previously installed in Unit 1. 3.6 Fuel Handling System (Coal, Petroleum Coke, and Limestone) The function of the Fuel Handling System is to receive coal, petroleum coke, and limestone from “Panamax” vessels (maximum vessel size which can pass through the Panama Canal) and to convey it to stock-out and storage areas. From there coal and petroleum coke are reclaimed and conveyed to the in-plant fuel silos; limestone is reclaimed and conveyed to the Limestone Preparation System. The major components of the Fuel Handling System are as follows:
• Continuous Ship Unloader • Belt Conveyors and Support Structures • Domes • Radial Stacker/Reclaimers • Traveling Trippers • Belt Feeders • Belt Scales • Magnetic Separators • Metal Detectors • Gates and Chutework • Dust Suppression and Dust Collection Systems • Screw Conveyors • Vacuum Cleaning Systems • Hoppers • Telescopic Chute
3.7 Ash Handling The ash handling system transports bed ash from the outlets of the stripper coolers to the bed ash silos. It also transports fly ash from the economizer and air heater hoppers, as well as the baghouse hoppers, to the fly ash silos. Two sets of ash handling systems and associated equipment are provided, one for Unit 1 and the other for Unit 2. 3.8 Reuse Water Reuse water is domestic wastewater that has been treated and disinfected to a high degree and is reused for beneficial purposes. The reuse water used at NGS is treated wastewater from the District II Water Reclamation Facility. The wastewater is treated through primary, secondary and advanced treatment. During primary treatment, large solids are removed from the wastewater. Secondary treatment uses microorganisms to remove the remaining solids and organic material from the wastewater. After secondary treatment, the wastewater travels through cloth membrane filters, with a pore size of approximately 10 microns, to remove virtually all remaining solids. During advanced or final treatment, the wastewater is disinfected using chlorine or ultraviolet light to destroy bacteria, viruses and

JEA Large-Scale CFB Combustion Demonstration Project
Final Technical Report p-18
B&V Project 140895
other pathogens. Consumption of reuse water at NGS is nearly 1 million gallons per day when all three units are operating. The reuse water is used for circulating water pump seals, boiler/precipitation area drains, polishing scrubbers, ash slurry preparation, and fuel handling dust suppression and wash down. Future uses may include irrigation. 3.9 Ash Processing and Storage Two bed ash silos and two fly ash silos provide for short term (approximately three days) surge capacity and storage of bed ash and fly ash. The bed ash and fly ash from the silos is slurried using reuse water. The bed ash slurry and fly ash slurry are then blended together and pumped to the Byproduct Storage Area (BSA) using positive displacement GEHO pumps. Ash in the BSA sets up to form a low strength aggregate type material, with essentially the only water run-off being precipitation which falls in the area. This aggregate material is suitable for use as fill material for road construction or other applications where fill material is needed. JEA has received an approval letter from FDEP characterizing their CFB byproduct (bed ash and fly ash) as an "industrial byproduct" and allowing it to be used for beneficial purposes such as civil applications and stabilization processes for remedial projects. JEA is actively marketing and selling this material in Florida and Georgia, with the intent of transporting all ash generated to off site locations for beneficial uses.

JEA Large-Scale CFB Combustion Demonstration Project
Final Technical Report p-19
B&V Project 140895
4.0 START-UP
FW was responsible for the commissioning and start-up of the boiler and AQCS systems, and ZCC was responsible for the commissioning and start-up of BOP systems. The JEA Start-up Group was responsible for the overall coordination of plant start-up, as well as commissioning and start-up of the Material Handling Systems (coal, petroleum coke, and limestone), and of the turbine/generator and related auxiliary systems. JEA Operations was responsible for operation of completed and integrated systems after turnover of the various systems for normal operation. Detailed design activities for the project were essentially complete by July 2001. FW began on-site staffing for the commissioning and start-up activities for the FW scope of work for the project in the latter part of 2000. Pre-boiler chemical cleaning of the Unit 2 condensate and feedwater systems (excluding boiler systems) was completed in early June 2001. Chemical cleaning of the Unit 2 boiler was completed in September 2001. First fire of Unit 2 on gas occurred on December 1, 2001, and Unit 2 steam blows were completed on January 15, 2002. Initial synchronization of Unit 2 occurred on February 19, 2002, and full load operation (on coal) was achieved and sustained on May 5, 2002. 4.1 Modifications During Start-up and Initial Operation As indicated above, the detailed design activities for the project were essentially complete by July 2001, but some design changes and scope additions were made during the latter stages of construction and start-up. Many of these changes were issued due to scope increases or changes requested by JEA, field conditions that differed from the design basis (due to missing or incorrect vendor data, incorrect field data, etc), drawing errors, etc. Other changes were identified and implemented during start-up and initial operation of various integrated systems and initial operation of Unit 2 by JEA. After August 2002, JEA initiated a number of modifications and changes that could be implemented quickly, with little or no down time, to improve the operation of the Unit 2 boiler and AQCS systems. Many of these modifications were implemented during the Fall 2002 planned outage. In addition, JEA developed a more comprehensive list of design modifications and changes which could be completed during a scheduled outage in the Spring of 2003, to optimize performance of Unit 2 during the summer peak period. These modifications are referred to as Phase I Completion Modifications. A detailed description of the Unit 2 Start-up, and of the modifications made during start-up and initial operation, can be found in the Start-up Modifications Report for this project, which is available on the DOE website at the following link: http://www.netl.doe.gov/cctc/resources/pdfs/jacks/Start-Up%20Modifications%20Report_final.pdf

JEA Large-Scale CFB Combustion Demonstration Project
Final Technical Report p-20
B&V Project 140895
5.0 OPERATIONS AND MAINTENANCE
Prior to the Repowering Project, Units 1 and 3 fired relatively high cost liquid fuels and natural gas (Unit 2 was not operating). As a result, capacity factor of these units was limited due to economic dispatching practices by JEA. Since Units 1 and Unit 2 have been repowered, they have fired relatively low cost solid fuels (Unit 3 continues to fire liquid fuels and natural gas). As a result, the combined power production of the three units has increased significantly, and at the same time, total plant emissions have been reduced. Significant changes in operations and maintenance (O&M) practices were required by the change of Units 1 and 2 from oil and gas fired boilers to solid fueled boilers, with associated AQCS and ash handling systems. During start-up and testing of the units, JEA dedicated significant efforts and costs to development of O&M procedures and to training of O&M personnel for the new equipment and systems. 5.1 Unit 2 Operations Summary From the time of initial synchronization on February 19, 2002, Unit 2 was in combined start-up, testing, and operational mode of service through the summer of 2002. Initial operation of the boiler on coal and higher ratios of coal/pet coke blends were successful. However, attempts at operation on 100% pet coke resulted in agglomeration of ash in the INTREX’s and cyclones within a week or so of operation, requiring a forced outage to remove the ash build-up. As a result, blending of pet coke and coal was required for reliable operation of the boiler. Initially, the ratio was limited to a maximum of 70% pet coke, but this was increased to 80% pet coke after the 2002 summer peak season. Other significant problems encountered with the boiler operation included limestone drying and feed problems, stripper cooler pluggages, expansion joint failures, and back-sifting into the PA plenum. Problems were also encountered with density control and spray quality in the AQCS system. The issues with limestone feed resulted in an operational practice of overfeeding limestone to the boiler in order to preclude excursions of SO2 emissions from the stack. This resulted in doing most of the SO2 removal in the boiler. A summary of key annual operating and availability data for Unit 2 for calendar year (CY) 2003 and 2004, is provided in Table 5-1.

JEA Large-Scale CFB Combustion Demonstration Project
Final Technical Report p-21
B&V Project 140895
TABLE 5-1 ANNUAL OPERATING AND AVAILABILITY DATA
Parameter CY 2003 CY 2004 Remarks Gross MWH’s Generated
1,791,221 1,459,351 NERC: Gross Actual Generation (GAG)
Net MWH’s 1,673,981 1,357,427 Heat Rate, B/kWh 9,514 9,518 Starts 15 9 Excludes Attempted
Starts Hours on Line 6,843 5,450 NERC: Service Hours
(SH) Load Factor (Gross) 88.0% 90.0% NERC: Gross Output
Factor (GOF) Net Output Factor (NOF), %
87.2% 89.3%
Capacity Factor (Gross)
68.7% 55.8% NERC: Gross Capacity Factor (GCF)
Net Capacity Factor (NCF), %
68.2% 55.6%
Equivalent Availability Factor (EAF)
72.8% 58.7%
A monthly summary of Unit 2 operating data during 2003, and 2004 is provided in Appendix C. For purposes of comparison to the Northside Unit 2 operating data above, Table 5-2 below presents the industry average operating and availability data for coal plants in the United States of capacity between 200 MW and 399 MW, based on data for calendar years 1999 through 2003, as reported in the North American Electric Reliability Council (NERC) Generating Availability Report. While the coal plants of this size in the NERC data base are primarily pulverized coal units with scrubbers, a comparison to Northside Unit 2 (also solid fuel fired with scrubbers) is considered to be indicative, but not directly comparable. It should also be noted that these statistics are from units that have been operating for many years and have worked through startup and early operational issues to achieve a stable O&M mode. This process has not yet been completed on Unit 2. One single issue with a large impact on performance is the failure of superheater tubes. During the time frame of August 2003 through May 2004, the boiler experienced a series of outages due to superheater tube failures (see Section 5.2 below). A detailed discussion of technical issues surrounding these failures can be found in Section 6.1. This single issue resulted in a loss of about 464,100 MWh’s of generation during CY 2003 and 2004. If these tube failures had not occurred, the average EAF during CY 2003 and 2004 would have been nearly 75%, as indicated in the Table 5-2.

JEA Large-Scale CFB Combustion Demonstration Project
Final Technical Report p-22
B&V Project 140895
TABLE 5-2 COMPARISONS TO NERC DATA
Parameter 200 to 399 MW
Unit Size (1) NS Unit 2 Averages
for CY 2003 and 2004
Northside Unit 2 Averages without SH Tube Failures
CY 2003 and 2004 Average Dependable Capacity (Gross), MW
299.5 297.5 297.5
Average Actual Unit Starts per Year
14.73 12 10 (estimated)
Average Service Hours per Year
7,434 6,146.5
Average Service Factor, SF, %
84.85 78.2
Average Net Output Factor, NOF, %
81.21 88.3
Average EAF, % 84.01 65.8 74.7
1. Based on North American Electric Reliability Council, Generating Availability Data System, for coal fired steam units, 1999 thru 2003. A graphical representation of Unit 2 lost generation hours during 2003 and 2004 by NERC cause code is provided on the following pages.

NS2
Los
t MW
H b
y C
ause
for F
Y03
(GA
DS
Dat
a)
145,
545 89
,704
88,1
0264
,622
42,7
6821
,892
11,3
956,
314
4,09
53,
362
2,74
72,
135
1,68
71,
503
958
883
514
470
301
222
168
120
2071
02,
477
020
,000
40,0
0060
,000
80,0
0010
0,00
012
0,00
014
0,00
016
0,00
018
0,00
020
0,00
022
0,00
024
0,00
026
0,00
028
0,00
030
0,00
032
0,00
034
0,00
036
0,00
038
0,00
040
0,00
042
0,00
044
0,00
046
0,00
048
0,00
050
0,00
0
Planne
d Outa
ge: R
efrac
tory R
epair
Cyclon
e Furn
ace P
roblem
s
Strippe
r Coo
ler P
roblem
s
Furnac
e Tub
e Lea
k Rep
air
Intrex
Fin Sprh
tr Tub
e Lea
ks
Expan
sion J
oint P
roblem
s
Conde
nser
Tube L
eaks
Limes
tone P
roblem
s
Scrubb
er Bag
hous
e Rep
air
SA Fan P
roblem
s
Electric
al 6.9
kv Bus
s Trip
ped
Unit P
erform
ance
Test
Conde
nsor
Leak
ing
SO2 Stac
k Emiss
ion H
i Lim
it
Bagho
use H
oppe
rs Clog
ged
EHC Fluid L
eaks
Limes
tone F
eede
r Prob
lems
BFP Suc
tion R
elief
Valve R
epair
BFP Driv
e Oil L
eaks
Boiler
Intern
al Cas
ing P
roblem
s
Bed M
ateria
l Con
veyo
r Prob
lems
Front W
all Fue
l Fee
der
Operat
or Erro
r
HP FW H
eater
Rep
air
Cyclon
e Inle
t Tem
perat
ure P
roblm
Lost MWH

NS2
Los
t MW
H b
y C
ause
for F
Y04
(GA
DS
Dat
a)
496,
529
148,
569
112,
143
50,5
07 25,6
86 21,9
78 19,4
08 18,5
62 14,3
25 12,5
73 6,1
975,
930 4,
549 4,
208 3,
8213,
712
2,75
5 2,07
91,89
6 1,83
71,77
91,72
51,66
3 1,00
7924
825
509
341
332
307
302
294
283
5,98
63,
465
020
,000
40,0
0060
,000
80,0
0010
0,00
012
0,00
014
0,00
016
0,00
018
0,00
020
0,00
022
0,00
024
0,00
026
0,00
028
0,00
030
0,00
032
0,00
034
0,00
036
0,00
038
0,00
040
0,00
042
0,00
044
0,00
046
0,00
048
0,00
050
0,00
0
SUPERHEATER TUBE LEAK (F
,M) 1
050
PLANNED O
UTAGE (PO) 1
800
MAIN TRANSFORMER P
RESS. (F) 3
620
STRIPPER COOLE
R PROBLE
MS (D) 9
30
LOST D
CS/DRUM LE
VEL (F) 1
799
BFP PUMP R
EPAIR (D
,F) 341
0
COAL SUPPLY
PROBLE
M (F,D
) 110
MARK 6 CONTROL F
AILURE (F
) 430
9
HIGH D
RUM LEVEL/E
XHAUST TEMP (F) 1
999
INTREX ASH LE
AKS (F) 8
50
CONDENSER TUBE LEAK (D
) 311
0
OTHER FLUE A
IR/G
AS PROBLE
M (F) 1
530
STRIPPER COOLE
R LOST A
LL (F
) 930
EHC SYSTEM C
ONTAMINATED (F
) 429
9
LIMESTONE TRANSPORT S
YST. (D) 1
55
ELECTRIC
AL PROBLE
MS SWITCHYARD (F
) 361
2
SCRUBBER PROBLE
MS (F) 8
199
TURBINE C
ONTROL STOP VALV
E (SF) 4
260
STACK EMMIS
ION LI
MESTONE FLW (D
) 960
0
STRIPPER COOLE
R EXPANSIO
N JOIN
T (D) 8
47
BOILER C
NTRL BMS M
ODULES (F
) 175
0
REFRACTORY & IN
SULATIO
N (D) 8
40
SDA OUT O
F SERVIC
E (D) 8
110
BAGHOUSE DIFFERENTIA
L PRBLM
(D) 8
80
DUMP VALV
E FLOW P
ROBLEMS (F
) 640
HP HEATER O
UT OF S
ERVICE (D
) 344
1
FUEL FEEDER C
-2 CONV. P
ROBLEM (D
) 111
FUEL FEEDER O
UT OF S
ERVICE (D
) 121
SWIN
G RDAFT, P
LUGGED S
DA (D) 8
299
FW HTR R
ELIEF V
ALVE (D
) 334
3
LIMESTONE FEED P
ROBLEMS (D
) 152
PERFORMANCE TESTING (P
D) 999
9
BED MATERIA
L TRANSPORT (D
) 931
SO2 EMIS
SION E
XCEEDANCE (D) 9
600
CYCLONE FEEDER O
UT (D) 1
11
Lost MWH

JEA Large-Scale CFB Combustion Demonstration Project
Final Technical Report p-23
B&V Project 140895
5.1.1 Water and Wastewater Flows. A water mass balance diagram for the Northside Plant site (Units 1, 2, and 3) is included in Appendix A. A summary of actual average daily flows for some of the key flow streams, based on available monthly flow data for CY 2003, and 2004, is shown in Table 5-3. Applicable permit limits are also indicated.
TABLE 5-3 AVERAGE DAILY WATER FLOWS Average Daily Flow, Gallons per Day (GPD) X 1000 Flow Stream Water
Balance* CY 2003 CY 2004 Permit Limit
Surface Water 827,000 (827,000)
782,173 763,770 827,000
Ground Water 517.6 (1,283.7) 530.4 590.9 571.0 Reuse Water 853.9 (2,299.6) 809.6** 991.9** 928.8 CWTS Influent 431.6 (1,744.7) 497.8 601.3 Perc Ponds to District II
0.0 (250.0) 126.8 132.1
* Flows in parenthesis are 24 hour maximum flows. ** Excludes December 2003 through April 2004 due to broken reuse water pipeline. Monthly water and wastewater flow rates for the Northside site are indicated with the operating data in Appendix C. 5.1.2 Stack Emissions. Stack emissions data for Unit 2 is collected and reported by the Continuous Emissions Monitoring System (CEMS). Table 5-4 below provides a summary of Unit 2 stack emissions data during 2003 and 2004.
TABLE 5-4 STACK EMISSIONS DATA Parameter CY 2003 CY 2004 Permit Limits SO2 Emissions, Tons 1,131.8 1,095.6 SO2 Emissions, lb/MMBtu 0.14 0.17 0.20 (24 hr average)NOx Emissions, Tons 525.5 492.6 NOx Emissions, lb/MMbtu 0.07 0.08 0.09 (30 day average)Particulate Matter, Tons 41.23 29.72 Particulate Matter, lb/MMbtu 0.005 0.005 CO, Tons 297.3 290.6 CO, lb/MMbtu 0.04 0.04 CO, lb/hr 84 100 350 (24 hr average)VOC, Tons 11.92 11.63 VOC, lb/MMbtu 0.001 0.002 VOC, lb/hr 3.4 4.0 Monthly stack emissions data for Unit 2 is included with the operating data in Appendix C.

JEA Large-Scale CFB Combustion Demonstration Project
Final Technical Report p-24
B&V Project 140895
5.1.3 Ash Production. Total bed ash and fly ash production rates for Units 1 and 2 combined are as follows, along with an estimate of the portion of the bed ash and fly ash from Unit 2.
TABLE 5-5 ASH PRODUCTION RATES
Parameter CY 2003 CY 2004 Total Bed Ash, Tons 312,400 195,439 Total Fly Ash, Tons 179,700 153,623 Unit 2 Bed Ash, Tons 153,236 96,515 Unit 2 Fly Ash, Tons 88,145 75,865 Byproduct Sales 0 38,312
Note that some byproduct sales were made in 2004, primarily into Georgia. In late 2004, JEA received an approval letter from FDEP characterizing their CFB byproduct (bed ash and fly ash) as an "industrial byproduct" and allowing it to be used for beneficial purposes such as civil applications and stabilization processes for remedial projects. All byproduct generated is expected to be sold, and the originally planned Cell 2 of the BSA is not being developed. 5.2 Unit 2 Maintenance Summary The level of maintenance required on Unit 2, particularly the boiler, has been relatively high, due to the ash agglomeration problems, limestone feed problems, stripper cooler pluggages, expansion joint failures, and back-sifting into the PA plenum mentioned above. Table 5-6 provides a list of Unit 2 outages of significant duration, through December 2004, which have been required to address many of these problems.
TABLE 5-6 MAJOR UNIT 2 OUTAGES Outage Start
Date Outage End
Date Duration,
Days Primary Purpose of Outage
April 16, 2002 April 30, 2002 14 MFT, Removal of excessive ash build-up May 31, 2002 June 14, 2002 14 Tube Leak Repairs July 7, 2002 July 19, 2002 12 Bed Excursion in Boiler July 27, 2002 August 9, 2002 12 Remove Pluggage in Cyclone October 22, 2002
November 17, 2002
26 Planned Outage for Boiler Modifications
December 21, 2002
January 8, 2003
19 Stripper Cooler Problems
January 28, 2003
February 6, 2003
9 Furnace Wall Tube Repairs
April 1, 2003 April 23, 2003 21 Planned Outage for Boiler Refractory Modifications and Repairs
August 19, 2003
September 8, 2003
20 Cyclone problems, Intrex tube leaks

JEA Large-Scale CFB Combustion Demonstration Project
Final Technical Report p-25
B&V Project 140895
Outage Start Date
Outage End Date
Duration, Days
Primary Purpose of Outage
November 3, 2003
November 25, 2003
22 Boiler Inspection
February 11, 2004
March 4, 2004 22 Superheater Tube Leaks (Intrex)
March 8, 2004 March 19, 2004 11 Superheater Tube Leaks (Intrex) March 30, 2004
April 5, 2004 6 Superheater Tube Leaks (Intrex)
May 1, 2004 May 7, 2004 6 Superheater Tube Leaks (Intrex) June 19, 2004 July 6, 2004 17 Change-out of Generator Step-up Transformer October 26, 2004
November 29, 2004
32 Planned Outage for Boiler Modifications
In addition, there were numerous other load reductions and short unit outages in the above time frame. Note that the monthly Equivalent Availability Factors (EAF’s) for 2003 and 2004 listed in the Operating Data in Appendix C include all unit outages and load reductions. 5.3 O&M Staffing O&M of the three units at the Northside site is handled by a single organization within JEA, which in many cases shares or rotates duties and responsibilities between units. The total O&M staff presently consists of a total of 251 persons for the three units. Units 1 and 2 are each a nominal 300 MW CFB pet coke/coal fired unit, and Unit 3 is a 530 MW heavy oil fired unit. 5.4 O&M Costs During the first two years of operation, Unit 2 encountered significant operating problems (primarily boiler related) and associated forced outages which resulted in high maintenance and repair costs and a low EAF, as described above. As a result, the annual O&M costs for Unit 2, particularly on a per MWh basis, were extremely high during the demonstration period, and are not considered to be representative of future O&M costs for the unit. Refer to Section 6.0 for a description of boiler design modifications and upgrades that have been, or are being, implemented to improve boiler reliability and operation.

JEA Large-Scale CFB Combustion Demonstration Project
Final Technical Report p-26
B&V Project 140895
6.0 MODIFICATIONS AND UPGRADES (PHASE II)
In addition to the Phase I Completion Modifications made during the Spring 2003 outage on Unit 2, JEA has also implemented, or is considering implementing, a number of additional major modifications, referred to as Phase II completion modifications. The intent of these modifications is to further improve the reliability, maintainability, and performance of Unit 2. These modifications include the following:
• Intrex Design Modifications
• Expansion Joint Modifications
• Stripper Cooler Modifications
• Limestone Silo and Feed System Modifications
• Limestone Preparation System Modifications The following paragraphs provide a description of the problems encountered and the modifications being considered to resolve these problems. 6.1 Intrex Design Modifications The intrex is the part of the boiler that contains both the loop seal and the intermediate and finishing superheater surface. The boiler has three intrex boxes, two with intermediate superheat surface and one with finishing superheat surface. There are both mechanical and operational issues with the design of the intrex. The mechanical issues consist of superheater tube support failure and in-service cracking of superheater tubes. The operational issues consist of agglomeration of the hot loop material within the intrex and backing up of material into the cyclone. The superheater tube failures are attributed to a combination of the design of the tube bundle support system coupled with lack of solution annealing of the tube bends. The primary failure is radial cracking of the superheater tube bend at the weld. The problem is found to be the worst in the finishing superheater where the steam temperatures are the highest, and is most prevalent on the bend where the large bundle support lug is installed. The large lug acted as a heat exchange fin and caused the operating temperature of the particular tube bend to be higher than the rest of the bundle, which accelerated the failure. An investigation revealed that at the time of design ASME code did not require solution annealing of the bends for the stresses that were calculated to exist in the bundle. Following the manufacture of these elements the code was changed, and if manufactured today the tube bends would have to be solution annealed. As a temporary measure all of the finishing superheater bends were replaced with solution annealed bends without the large support lug. The support system was re-designed to include only a sliding pad. At the same time the temporary repair was being performed a design was done and material was ordered to install replacement finishing superheater tube bundles. The design called for 50% of the surface area to be replaced, with the balance being eliminated due to installation considerations. The replacement

JEA Large-Scale CFB Combustion Demonstration Project
Final Technical Report p-27
B&V Project 140895
bundles were installed in the fall 04 planned outages and have provided satisfactory performance. The operational issues with the intrex boxes include agglomeration of hot loop material within the boxes while burning high percentages of petroleum coke. This has resulted in pluggage of the boiler cyclone with agglomerated hot loop material. The failure mechanism appears to be agglomeration of the material under conditions of poor fluidization. To mitigate the problem without major modifications it is necessary to burn at least 20% coal with the petroleum coke to reduce the tendency of the hot loop material to agglomerate. JEA is currently evaluating long-term modifications that will mitigate both the agglomeration and tube failure issues. These modifications are expected to be implemented within the next five years. 6.2 Expansion Joint Modifications JEA has experienced failures of the hot loop expansion joints, including the cyclone inlet, cyclone outlet and intrex return leg expansion joints. Minor design modifications have been successfully performed to reduce forced outages due to these expansion joints. It is expected that further modifications will be performed associated with the intrex modifications noted above. 6.3 Stripper Cooler Modifications Bed ash is removed from the boiler through stripper coolers which are designed to remove carbon from the ash and cool the ash. JEA has experienced both mechanical and operational issues with the stripper coolers. The stripper coolers are mounted to the boiler steel and close-coupled to the boiler through a sliding expansion joint. There have been numerous failures and high O&M cost associated with these expansion joints. Modifications have been performed to reduce the forced outages and derates associated with these joints, but further improvements are desired. Operationally, the coolers are not able to operate at design capacity and forced derates sometimes occur due to pluggage or inadequate flow. A considerable amount of O&M is spent attempting to unplug or restart flow through stripper coolers. JEA is currently evaluating a range of changes from modification of the existing coolers all the way through replacement with an alternate design. 6.4 Limestone Silo and Feed System Modifications The original limestone feed system from the bottom of the limestone silos near the boilers for Northside Units 1 and 2 were prone to “rat-holing” and/or bridging, interrupting the flow of limestone to the boilers. Frequent manual rodding of the limestone in the silo and lower hoppers was required to restore the flow of limestone, particularly when the limestone moisture content was high. To eliminate the limestone feed interruptions, Jenike & Johanson (J&J), a company specializing in the design on bulk material handling systems, designed and furnished system modifications to replace the lower conical portion of each limestone silo with a mass flow hopper bottom. In addition, the rotary feed type valves were replaced with hopper outlet slide gate valves, mass flow screw feeders, diverter valves and stainless steel pipe chutes to the inlets of existing rotary air lock valves. On-site construction work was performed by one of the JEA Alliance Contractors during the Fall 2004 outages on Units 1 and 2. Although limestone feed issues have not been eliminated, performance has improved significantly. It is believed that most remaining issues are related to moisture in the finished limestone.

JEA Large-Scale CFB Combustion Demonstration Project
Final Technical Report p-28
B&V Project 140895
6.5 Limestone Preparation System Modifications The limestone preparation system that was supplied was not able to meet the design drying capacity or the design sizing curve. An ongoing program is underway to improve limestone drying and reduce the amount of fines produced by the preparation process. Improvements have been made, and JEA is continuing to perform tests to optimize the process. The final resolution is not yet known.
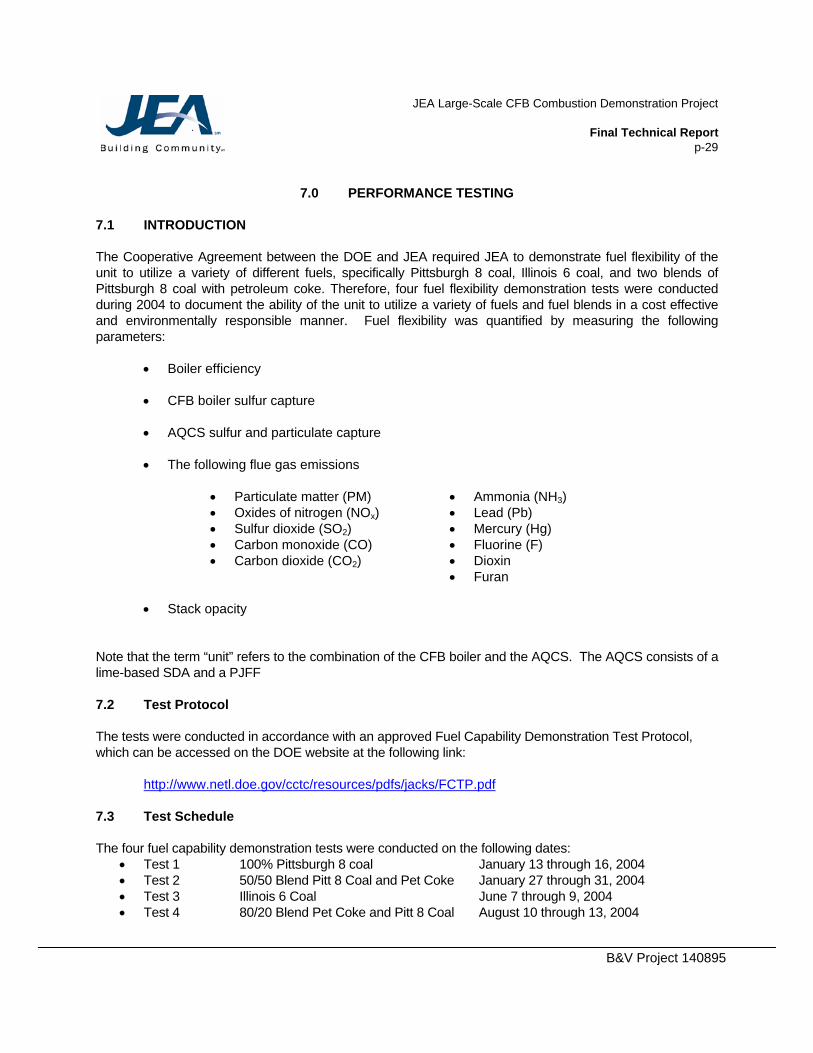
JEA Large-Scale CFB Combustion Demonstration Project
Final Technical Report p-29
B&V Project 140895
7.0 PERFORMANCE TESTING
7.1 INTRODUCTION The Cooperative Agreement between the DOE and JEA required JEA to demonstrate fuel flexibility of the unit to utilize a variety of different fuels, specifically Pittsburgh 8 coal, Illinois 6 coal, and two blends of Pittsburgh 8 coal with petroleum coke. Therefore, four fuel flexibility demonstration tests were conducted during 2004 to document the ability of the unit to utilize a variety of fuels and fuel blends in a cost effective and environmentally responsible manner. Fuel flexibility was quantified by measuring the following parameters:
• Boiler efficiency • CFB boiler sulfur capture • AQCS sulfur and particulate capture • The following flue gas emissions
• Particulate matter (PM) • Ammonia (NH3) • Oxides of nitrogen (NOx) • Lead (Pb) • Sulfur dioxide (SO2) • Mercury (Hg) • Carbon monoxide (CO) • Fluorine (F) • Carbon dioxide (CO2) • Dioxin
• Furan • Stack opacity
Note that the term “unit” refers to the combination of the CFB boiler and the AQCS. The AQCS consists of a lime-based SDA and a PJFF
7.2 Test Protocol The tests were conducted in accordance with an approved Fuel Capability Demonstration Test Protocol, which can be accessed on the DOE website at the following link: http://www.netl.doe.gov/cctc/resources/pdfs/jacks/FCTP.pdf 7.3 Test Schedule The four fuel capability demonstration tests were conducted on the following dates:
• Test 1 100% Pittsburgh 8 coal January 13 through 16, 2004 • Test 2 50/50 Blend Pitt 8 Coal and Pet Coke January 27 through 31, 2004 • Test 3 Illinois 6 Coal June 7 through 9, 2004 • Test 4 80/20 Blend Pet Coke and Pitt 8 Coal August 10 through 13, 2004

JEA Large-Scale CFB Combustion Demonstration Project
Final Technical Report p-30
B&V Project 140895
7.4 Summary of Test Results
7.4.1 Valve Line-Up Requirements
With the exception of isolating the blow down systems, drain and vent systems, and the soot blower system, the boiler was operated normally in the coordinated control mode throughout the boiler efficiency test period. Prior to the start of each testing period, a walk down was conducted to confirm the ‘closed’ position of certain main steam and feedwater system valves.
7.4.2 Test Reports A detailed test report was prepared to document the results of each test. Each report includes commentary on the test results as well as limited part load performance data. These detailed reports can be accessed on the DOE website at the following link:
http://www.netl.doe.gov/cctc/resources/library/bibliography/demonstration/aepg/baepgfb_jackea.html
7.4.3 Full Load Test Results The results of the 100% load tests are summarized in Tables 7-1 through 7-4 on the following pages. The design MCR values indicated are the original design values provided by FW. Corrections to MCR conditions were made in accordance with Section 6.2.1 of the Fuel Capability Demonstration Test Protocol.

JEA Large-Scale CFB Combustion Demonstration Project
Final Technical Report p-31
B&V Project 140895
TABLE 7-1 - 100% PITTBURGH 8 FUEL TESTS RESULTS 100% LOAD
Parameter Design
Maximum-Continuous
Rating (MCR)
January 13, 2004 Test (**corrected to MCR, see Note 4)
January 14, 2004 Test (**corrected to MCR, see Note 4)
Boiler Efficiency (percent) 88.1 90.6** (Note 1) 90.6** (Note 1) Capacity Calculation (percent) NA 97.14 94.55 Main Steam (Turbine Inlet)
Flow (lb/hr) 1,993,591 1,999,572** 2,000,369** Pressure (psig) 2,500 2,400 2400 Temperature (°F) 1,000 997** 996.6**
Reheat Steam (Turbine Inlet) Flow (lb/hr) 1,773,263 1,820,447 1,769,377 Pressure (psig) 547.7 570.9 568.7 Temperature (°F) 1,000 1008.1** 1008.25**
Reheat Steam (HP Turbine Exhaust)
Flow (lb/hr) 1,773,263 1,819,973 1,768,905 Pressure (psig) 608.6 570.5 568.24 Enthalpy (Btu/lb) 1,304.5 1297.3 1,297.3
Feedwater to Economizer
Temperature (°F) 487.5 484.5 484.1 Pittsburgh 8 Coal Constituents (As-Received)
Carbon % 68.6 72.7 72.3 Hydrogen % 4.6 4.84 4.7 Sulfur % 3.3 4.84 4.56 Nitrogen % 1.3 1.37 1.35 Chlorine % 0.09 0.18 0.14 Oxygen % 4.11 2.11 2.54 Ash % 12.8 6.89 7.06 Moisture % 5.2 7.26 7.39 HHV (Btu/lb) 12,690 12,877 12,970
Fuel Flow Rate (lb/hr) NA 207,558 206,906 Limestone Composition (% By Weight)
CaCO3 92.0 90.86 91.81 MgCO3 3.0 3.31 2.95 Inerts 4.0 5.34 4.9 Total Moisture 1.0 0.49 0.34

JEA Large-Scale CFB Combustion Demonstration Project
Final Technical Report p-32
B&V Project 140895
Parameter Design Maximum-
Continuous Rating (MCR)
January 13, 2004 Test (**corrected to MCR, see Note 4)
January 14, 2004 Test (**corrected to MCR, see Note 4)
AQCS Lime Slurry Composition (% By Weight)
CaO 85.0 45.15 46.02 MgO and inerts 15.0 54.85 53.98 AQCS Lime Slurry Density – % Solids
35 5.57
Boiler Limestone Feedrate, lb/hr 66,056 (maximum
value) 57,600 54,625
Flue Gas Emissions
Nitrogen Oxides, NOx, lb/MMBtu (HHV)
0.09 0.074 0.081
Uncontrolled SO2, lb/MMBtu (HHV)
5.20 7.52 7.03
Boiler Outlet SO2, lb/MMBtu (HHV) [See Note 3]
0.78 0.2371 .2902
Stack SO2 lb/MMBtu, (HHV) 0.15 0.102 0.106 Solid Particulate matter, baghouse outlet, lb/MMBtu (HHV)
0.011
0.004
Carbon Monoxide, CO, lb/MMBtu (HHV)
0.22 0.026 0.027
Opacity, percent 10 1.1 1.0 Ammonia (NH3) Slip, ppmvd 2.0 1.17 Ammonia feed rate, gal/hr NA 7.16 8.38 Lead, lb/MMBtu 2.60 x 10⁻⁵ (max) 3.516 x 10⁻⁷ Mercury (fuel and limestone) NA 8.24 x 10⁻⁶ Mercury, lb/MMBtu (at stack) 1.05 x 10⁻⁵ (max) 7.238 x 10⁻⁶ (see Note 2) Total Mercury Removal Efficiency, percent
No requirement 14.0
Fluoride (as HF), lb/MMBtu 1.57 x 10⁻⁴ (max) < 3.09 x 10⁻⁵ Dioxins / Furans No Limit 6.52 x 10⁻¹⁴
NOTE 1: Boiler efficiency includes a value of 0.112 % for unaccounted for losses (from FW
data). NOTE 2: Refer to Section 4.3.4.1 of Test Report 1 for description of mercury testing anomaly. NOTE 3: Design boiler outlet SO2 emission rate based on 85% removal of SO2 in the boiler. NOTE 4: Corrections to design MCR conditions were made in accordance with Section 6.2.1 of
the FUEL CAPABILITY DEMONSTRATION TEST PROTOCOL.
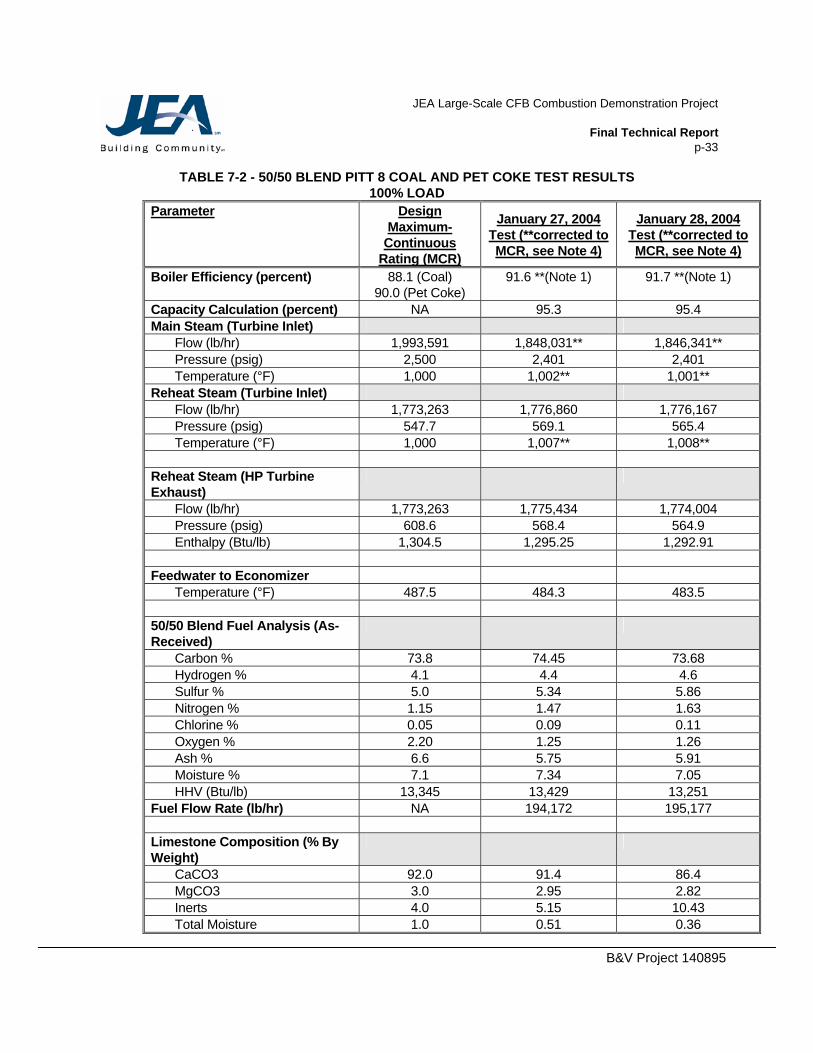
JEA Large-Scale CFB Combustion Demonstration Project
Final Technical Report p-33
B&V Project 140895
TABLE 7-2 - 50/50 BLEND PITT 8 COAL AND PET COKE TEST RESULTS 100% LOAD
Parameter Design Maximum-
Continuous Rating (MCR)
January 27, 2004 Test (**corrected to MCR, see Note 4)
January 28, 2004 Test (**corrected to MCR, see Note 4)
Boiler Efficiency (percent) 88.1 (Coal) 90.0 (Pet Coke)
91.6 **(Note 1) 91.7 **(Note 1)
Capacity Calculation (percent) NA 95.3 95.4 Main Steam (Turbine Inlet)
Flow (lb/hr) 1,993,591 1,848,031** 1,846,341** Pressure (psig) 2,500 2,401 2,401 Temperature (°F) 1,000 1,002** 1,001**
Reheat Steam (Turbine Inlet) Flow (lb/hr) 1,773,263 1,776,860 1,776,167 Pressure (psig) 547.7 569.1 565.4 Temperature (°F) 1,000 1,007** 1,008**
Reheat Steam (HP Turbine Exhaust)
Flow (lb/hr) 1,773,263 1,775,434 1,774,004 Pressure (psig) 608.6 568.4 564.9 Enthalpy (Btu/lb) 1,304.5 1,295.25 1,292.91
Feedwater to Economizer
Temperature (°F) 487.5 484.3 483.5 50/50 Blend Fuel Analysis (As-Received)
Carbon % 73.8 74.45 73.68 Hydrogen % 4.1 4.4 4.6 Sulfur % 5.0 5.34 5.86 Nitrogen % 1.15 1.47 1.63 Chlorine % 0.05 0.09 0.11 Oxygen % 2.20 1.25 1.26 Ash % 6.6 5.75 5.91 Moisture % 7.1 7.34 7.05 HHV (Btu/lb) 13,345 13,429 13,251
Fuel Flow Rate (lb/hr) NA 194,172 195,177 Limestone Composition (% By Weight)
CaCO3 92.0 91.4 86.4 MgCO3 3.0 2.95 2.82 Inerts 4.0 5.15 10.43 Total Moisture 1.0 0.51 0.36

JEA Large-Scale CFB Combustion Demonstration Project
Final Technical Report p-34
B&V Project 140895
Parameter Design Maximum-
Continuous Rating (MCR)
January 27, 2004 Test (**corrected to MCR, see Note 4)
January 28, 2004 Test (**corrected to MCR, see Note 4)
AQCS Lime Slurry Composition (% By Weight)
CaO 85.0 46.77 47.03 MgO and inerts 15.0 53.23 52.97 AQCS Lime Slurry Density – % Solids
35 5.23
Boiler Limestone Feedrate, lb/hr 66,056 (maximum
value) 66,434 73,001
Flue Gas Emissions
Nitrogen Oxides, NOx, lb/MMBtu (HHV)
0.09 0.07 0.07
Uncontrolled SO2, lb/MMBtu (HHV) - based on 50/50 blend
7.49 7.95 8.845
Boiler Outlet SO2, lb/MMBtu (HHV) [See Note 3]
0.78 0.2026 0.2771
Stack SO2 lb/MMBtu, (HHV) 0.15 0.093 0.11 Solid Particulate matter, baghouse outlet, lb/MMBtu (HHV)
0.011
0.0041
Carbon Monoxide, CO, lb/MMBtu (HHV)
0.22 0.015 0.016
Opacity, percent 10 1.01 1.80 Ammonia (NH3) Slip, ppmvd 2.0 0.325 Ammonia feed rate, gal/hr NA 3.73 6.26 Lead, lb/MMBtu 2.60 x 10⁻⁵ (max) 8.22 x 10⁻⁷ Mercury (fuel and limestone), µg/g
NA 3.02 x 10⁻⁷
Mercury, lb/TBtu (at stack) 10.5 (max) < 8.532 (see Note 2) Total Mercury Removal Efficiency, percent
No requirement Not Utilized
Fluoride (as HF), lb/MMBtu 1.57 x 10⁻⁴ (max) 1.69 x 10⁻⁵ Dioxins / Furans No Limit NOT TESTED
NOTE 1: Boiler efficiency includes a value of 0.112 % for unaccounted for losses (from FW
data). NOTE 2: Refer to Section 4.3.4.1 of Test Report 2 for description of mercury testing anomaly. NOTE 3: Design boiler outlet SO2 emission rate based on 85% removal of SO2 in the boiler. NOTE 4: Corrections to design MCR conditions were made in accordance with Section 6.2.1 of
the FUEL CAPABILITY DEMONSTRATION TEST PROTOCOL.

JEA Large-Scale CFB Combustion Demonstration Project
Final Technical Report p-35
B&V Project 140895
TABLE 7-3 - ILLINOIS 6 COAL TEST RESULTS 100% LOAD
Parameter Design
Maximum-Continuous
Rating (MCR)
June 8, 2004 Test (**corrected to
MCR, see Note 4)
June 9, 2004 Test (**corrected to
MCR, see Note 4)
Boiler Efficiency (percent) 88.1 (Pittsburgh 8 Coal)
88.3 (Note 1) 88.0 (Note 1)
Capacity Calculation (percent) NA 101.5 100.0 Main Steam (Turbine Inlet)
Flow (lb/hr) 1,993,591 1,974,013 1,926,677 Pressure (psig) 2,500 2,400 2,400 Temperature (°F) 1,000 998 999
Reheat Steam (Turbine Inlet) Flow (lb/hr) 1,773,263 1,897,211 1,859,959 Pressure (psig) 547.7 571.5 573.0 Temperature (°F) 1,000 1,005 1,011
Reheat Steam (HP Turbine Exhaust)
Flow (lb/hr) 1,773,263 1,897,091 1,851,738 Pressure (psig) 608.6 570.9 572.3 Enthalpy (Btu/lb) 1,304.5 1,293.6 1,285.6
Feedwater to Economizer
Temperature (°F) 487.5 484.1 484.6 Illinois 6 Fuel Analysis (As-Received)
Carbon % 64.48 64.93 64.70 Hydrogen % 4.40 4.31 4.57 Sulfur % 2.71 3.17 3.32 Nitrogen % 1.24 1.27 1.26 Chlorine % 0.15 0.15 0.15 Oxygen % 7.34 7.14 7.37 Ash % 8.57 7.08 6.59 Moisture % 11.11 12.10 12.19 HHV (Btu/lb) 11,603 11,649 11,664
Fuel Flow Rate (lb/hr) NA 232,730 232,535 Limestone Composition (% By Weight)
CaCO3 92.0 96.6 96.77 MgCO3 3.0 1.3 1.39 Inerts 4.0 2.1 1.84 Total Moisture 1.0 0.16 0.22

JEA Large-Scale CFB Combustion Demonstration Project
Final Technical Report p-36
B&V Project 140895
Parameter Design Maximum-
Continuous Rating (MCR)
June 8, 2004 Test (**corrected to
MCR, see Note 4)
June 9, 2004 Test (**corrected to
MCR, see Note 4)
AQCS Lime Slurry Composition (% By Weight)
CaO (See Note 5) 85.0 46.24 46.24 MgO and inerts (See Note 5) 15.0 53.76 53.76 AQCS Lime Slurry Density – % Solids
35 5.23
Boiler Limestone Feedrate, lb/hr 66,056 (maximum value)
64,005 73,001
Flue Gas Emissions
Nitrogen Oxides, NOx, lb/MMBtu (HHV)
0.09 0.086 0.103
Uncontrolled SO2, lb/MMBtu (HHV)
7.49 5.44 5.69
Boiler Outlet SO2, lb/MMBtu (HHV) [See Note 3]
0.78 0.2763 0.2887
Stack SO2 lb/MMBtu, (HHV) 0.15 0.107 0.08 Solid Particulate matter, baghouse outlet, lb/MMBtu (HHV)
0.011
0.0019
Carbon Monoxide, CO, lb/MMBtu (HHV)
0.22 0.0198 0.024
Opacity, percent 10 1.5 1.0 Ammonia (NH3) Slip, ppmvd 2.0 < 0.5206 Ammonia feed rate, gal/hr NA 5.53 6.76 Lead, lb/MMBtu 2.60 x 10⁻⁵ (max) < 4.352 x 10⁻⁷ Mercury (fuel), µg/g NA 0.50 Mercury, lb/TBtu (at stack) 10.5 (max) 0.345 Total Mercury Removal Efficiency, percent
No requirement 95 (see Note 2)
Fluoride (as HF), lb/MMBtu 1.57 x 10⁻⁴ (max) < 4.582 x 10⁻⁵ Dioxins / Furans No Limit NOT TESTED
NOTE 1: Boiler efficiency includes a value of 0.112 % for unaccounted for losses (from FW
data). NOTE 2: Refer to Section 4.3.4.1 of Test Report 3 for basis. NOTE 3: Design boiler outlet SO2 emission rate based on 85% removal of SO2 in the boiler. NOTE 4: Corrections to design MCR conditions were made in accordance with Section 6.2.1 of
the FUEL CAPABILITY DEMONSTRATION TEST PROTOCOL. NOTE 5: These components were not captured for this test - average results from Test #1 and
Test #2 are indicated.

JEA Large-Scale CFB Combustion Demonstration Project
Final Technical Report p-37
B&V Project 140895
TABLE 7-4 - 80/20 BLEND PET COKE AND PITT 8 COAL TEST RESULTS 100% LOAD
Parameter Design
Maximum-Continuous
Rating (MCR)
August 10, 2004 Test (**corrected to MCR, see Note 4)
August 11, 2004 Test (**corrected to MCR, see Note 4)
Boiler Efficiency (percent) 88.1 (Coal) 90.0 (Pet Coke)
91.52 ** (Note 1) 91.62 ** (Note 1)
Capacity Calculation (percent) NA 95.6 96.05 Main Steam (Turbine Inlet)
Flow (lb/hr) 1,993,591 1,901,483 ** 1,910,388 ** Pressure (psig) 2,500 2,401 2,401 Temperature (°F) 1,000 914.5 ** 912.4 **
Reheat Steam (Turbine Inlet) Flow (lb/hr) 1,773,263 1,715,491 1,723,401 Pressure (psig) 547.7 592.6 590.8 Temperature (°F) 1,000 1,001.4 ** 1,000.8 **
Reheat Steam (HP Turbine Exhaust)
Flow (lb/hr) 1,773,263 1,715,448 1,723,361 Pressure (psig) 608.6 593.5 591.6 Enthalpy (Btu/lb) 1,304.5 1,290.1 1,289.97
Feedwater to Economizer
Temperature (°F) 487.5 420.0 419.9 80/20 Blend Fuel Analysis (As-Received)
Carbon % 73.8 81.36 82.14 Hydrogen % 4.1 3.63 3.67 Sulfur % 5.0 3.7 3.74 Nitrogen % 1.15 1.93 1.95 Chlorine % 0.05 0.03 0.03 Oxygen % 2.20 1.72 0.89 Ash % 6.6 2.33 2.41 Moisture % 7.1 5.34 5.20 HHV (Btu/lb) 13,345 14,085 14,081
Fuel Flow Rate (lb/hr) NA 186,885 186,982 Limestone Composition (% By Weight)
CaCO3 92.0 97.55 97.23 MgCO3 3.0 1.18 1.16 Inerts 4.0 1.27 1.61 Total Moisture 1.0 0.3 0.29

JEA Large-Scale CFB Combustion Demonstration Project
Final Technical Report p-38
B&V Project 140895
Parameter Design Maximum-
Continuous Rating (MCR)
August 10, 2004 Test (**corrected to MCR, see Note 4)
August 11, 2004 Test (**corrected to MCR, see Note 4)
AQCS Lime Slurry Composition (% By Weight)
CaO (See Note 5) 85.0 46.24 46.24 MgO and inerts (See Note 5) 15.0 53.76 53.76 AQCS Lime Slurry Density – % Solids
35 1.25 1.41
Boiler Limestone Feedrate, lb/hr 66,056 (maximum
value) 50,892 50,405
Flue Gas Emissions
Nitrogen Oxides, NOx, lb/MMBtu (HHV)
0.09 0.0127 0.0081
Uncontrolled SO2, lb/MMBtu (HHV) - based on 80/20 blend
7.49 5.25 5.312
Boiler Outlet SO2, lb/MMBtu (HHV) [See Note 3]
0.78 0.1150 0.1636
Stack SO2 lb/MMBtu, (HHV) 0.15 0.058 0.07 Solid Particulate matter, baghouse outlet, lb/MMBtu (HHV)
0.011
0.0024
Carbon Monoxide, CO, lb/MMBtu (HHV)
0.22 0.0127 0.0081
Opacity, percent 10 0.07 0.08 Ammonia (NH3) Slip, ppmvd 2.0 0.27 Ammonia feed rate, gal/hr NA 3.42 1.09 Lead, lb/MMBtu 2.60 x 10⁻⁵ (max) 4.424 x 10⁻⁷ Mercury (fuel and limestone), µg/g
NA 0.05
Mercury, lb/TBtu (at stack) 10.5 (max) < 0.07385 Total Mercury Removal Efficiency, percent
No requirement 98 (See Note 2)
Fluoride (as HF), lb/MMBtu 1.57 x 10⁻⁴ (max) < 5.3 x 10⁻⁶ Dioxins / Furans No Limit NOT TESTED
NOTE 1: Boiler efficiency includes a value of 0.112 % for unaccounted for losses (from FW
data). NOTE 2: Refer to Section 4.3.4.1 of Test Report 4 for basis. NOTE 3: Design boiler outlet SO2 emission rate based on 85% removal of SO2 in the boiler. NOTE 4: Corrections to design MCR conditions were made in accordance with Section 6.2.1 of
the FUEL CAPABILITY DEMONSTRATION TEST PROTOCOL. NOTE 5: These components were not captured for this test - average results from Test #1 and
Test #2 are indicated.

JEA Large-Scale CFB Combustion Demonstration Project
Final Technical Report p-39
B&V Project 140895
The boiler and SDA SO2 removal efficiencies at full load for each test are summarized in Tables 7-5 through 7-8 below.
TABLE 7-5 - SO2 REMOVAL EFFICIENCIES - 100% PITT 8 FUEL 100% Load
Parameter Design Basis January 13, 2004
Test January 14, 2004
Test Percent of total SO2 removed by
boiler 85.0 typical, with range of 75 - 90
96.8 95.8
Percent of total SO2 removed by
SDA 12.1 typical, with range 22.1 – 7.1
1.8 2.7
Percent of Total SO2 Removed 97.1 98.6 98.5 Percent of SO2 entering SDA
removed in SDA 81.0 typical with range 90 – 71
56.9 63.5
Boiler Calcium to Sulfur Ratio < 2.88 1.77 1.86
TABLE 7-6 - SO2 REMOVAL EFFICIENCIES - 50/50 BLEND PITT 8 COAL AND PET COKE 100% Load
Parameter Design Basis January 27, 2004
Test January 28, 2004
Test Percent of total SO2 removed by
boiler 85.0 typical, with range of 75 - 90
97.5
96.8
Percent of total SO2 removed by
SDA 12.1 typical, with range 22.1 – 7.1
1.3 1.9
Percent of Total SO2 Removed 97.1 98.8 98.7 Percent of SO2 entering SDA
removed in SDA 81.0 typical with range 90 – 71
54 60.3
Boiler Calcium to Sulfur Ratio < 2.88 1.7 2.25
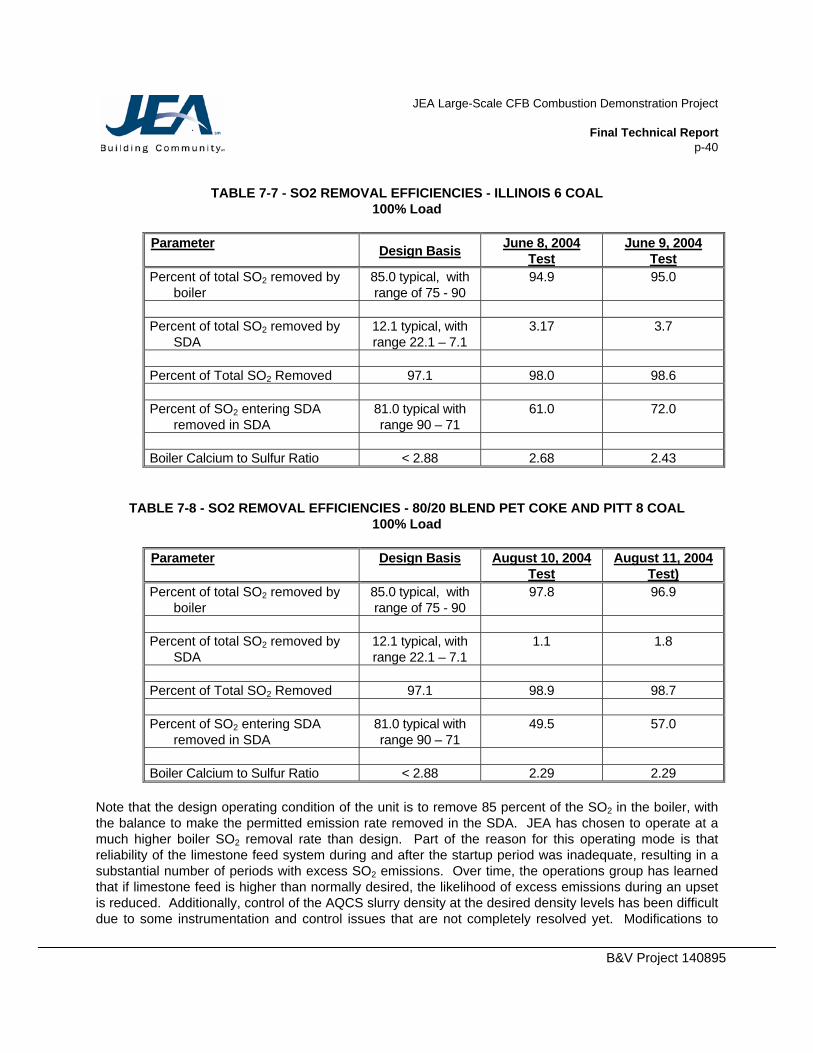
JEA Large-Scale CFB Combustion Demonstration Project
Final Technical Report p-40
B&V Project 140895
TABLE 7-7 - SO2 REMOVAL EFFICIENCIES - ILLINOIS 6 COAL
100% Load
Parameter Design Basis June 8, 2004
Test June 9, 2004
Test Percent of total SO2 removed by
boiler 85.0 typical, with range of 75 - 90
94.9 95.0
Percent of total SO2 removed by
SDA 12.1 typical, with range 22.1 – 7.1
3.17 3.7
Percent of Total SO2 Removed 97.1 98.0 98.6 Percent of SO2 entering SDA
removed in SDA 81.0 typical with range 90 – 71
61.0 72.0
Boiler Calcium to Sulfur Ratio < 2.88 2.68 2.43
TABLE 7-8 - SO2 REMOVAL EFFICIENCIES - 80/20 BLEND PET COKE AND PITT 8 COAL 100% Load
Parameter Design Basis August 10, 2004
Test August 11, 2004
Test) Percent of total SO2 removed by
boiler 85.0 typical, with range of 75 - 90
97.8 96.9
Percent of total SO2 removed by
SDA 12.1 typical, with range 22.1 – 7.1
1.1 1.8
Percent of Total SO2 Removed 97.1 98.9 98.7 Percent of SO2 entering SDA
removed in SDA 81.0 typical with range 90 – 71
49.5 57.0
Boiler Calcium to Sulfur Ratio < 2.88 2.29 2.29
Note that the design operating condition of the unit is to remove 85 percent of the SO2 in the boiler, with the balance to make the permitted emission rate removed in the SDA. JEA has chosen to operate at a much higher boiler SO2 removal rate than design. Part of the reason for this operating mode is that reliability of the limestone feed system during and after the startup period was inadequate, resulting in a substantial number of periods with excess SO2 emissions. Over time, the operations group has learned that if limestone feed is higher than normally desired, the likelihood of excess emissions during an upset is reduced. Additionally, control of the AQCS slurry density at the desired density levels has been difficult due to some instrumentation and control issues that are not completely resolved yet. Modifications to

JEA Large-Scale CFB Combustion Demonstration Project
Final Technical Report p-41
B&V Project 140895
increase the reliability and consistency of limestone feed are scheduled to be complete in late 2005, which should permit a change toward lower boiler SO2 removal and increased SDA SO2 removal. 7.4.4 Partial Load Test Results The results of the part load tests are summarized in Tables 7-9 through 7-12 below.
TABLE 7-9 - PART LOAD TEST RESULTS - 100% PITTSBURGH 8 FUEL Parameter January 15 January 16 Percent Load 80% 60% 40% Unit Capacity (MW) 240 180 120 Total Main Steam Flow, lb/hr 1,435,543 1,070,747 738,397 Main Steam Temperature, deg F 1,003 998 999 Main Steam Pressure, psig 2,400.6 1,800.4 1,300.4 Cold Reheat Steam Temperature,
deg F 576.6 572.7 565.9
Hot Reheat Steam Temperature, deg F
1,005 1,006 1,004
NOx, lb/MMBtu 0.080 0.072 0.082 CO, lb/MMBtu 0.044 0.118 0.053 SO2, lb/MMBtu 0.082 0.081 0.108 Opacity, percent 1.0 1.5 1.4
TABLE 7-10 - PART LOAD TEST RESULTS - 50/50 BLEND PITT 8 COAL AND PET COKE
Parameter January 29 January 30 January 31 Unit Capacity (MW) 240 180 120 Percent MCR Load 80% 60% 40% Capacity Calculation (percent) 76.6 58.0 38.2 Total Main Steam Flow, lb/hr 1,442,226 1,049,633 715,464 Main Steam Temperature, deg F 1,004 993 997 Main Steam Pressure, psig 2,340 1,701 1,062 Cold Reheat Steam Temperature, deg F
577.5 558.02 573.64
Hot Reheat Steam Temperature, deg F
1,006 1,011 999
NOx, lb/MMBtu 0.04 0.043 0.033 CO, lb/MMBtu 0.024 0.0276 0.08 SO2, lb/MMBtu 0.08 0.067 0.109 Opacity, percent 1.4 1.1 0.8

JEA Large-Scale CFB Combustion Demonstration Project
Final Technical Report p-42
B&V Project 140895
TABLE 7-11 - PART LOAD TEST RESULTS - ILLINOIS 6 COAL Parameter June 9 June 8 June 9 Percent Load 80% 60% 40% Unit Capacity (MW) 240 180 120 Capacity Calculation (percent) 82.21 55.50 38.27 Total Main Steam Flow, lb/hr 1,541,871 1,087,192 715,411 Main Steam Temperature, deg F 1,001 1,002 1,001 Main Steam Pressure, psig 2,400 1,700 1,200 Cold Reheat Steam Temperature, deg F
561 575 561
Hot Reheat Steam Temperature, deg F
1,007 966 1,004
NOx, lb/MMBtu 0.064 0.053 0.078 CO, lb/MMBtu 0.031 0.0338 0.138 SO2, lb/MMBtu 0.079 0.144 0.108 Opacity, percent 1.3 1.6 1.4
TABLE 7-12 - PART LOAD TEST RESULTS - 80/20 BLEND PET COKE AND PITT 8 COAL Parameter Aug. 12 Aug. 13 Unit Capacity (MW) 240 180 Percent MCR Load 80% 60% Capacity Calculation (percent) 76.51 54.69 Total Main Steam Flow, lb/hr 1,393,557 1,021,784 Main Steam Temperature, deg F 980.55 980.62 Main Steam Pressure, psig 2,200.14 1,450.21 Cold Reheat Steam Temperature, deg F
579.46 595.45
Hot Reheat Steam Temperature, deg F
984.03 992.10
NOx, lb/MMBtu 0.027 0.018 CO, lb/MMBtu 0.0147 0.0218 SO2, lb/MMBtu 0.054 0.058 Opacity, percent 1 1

JEA Large-Scale CFB Combustion Demonstration Project
Final Technical Report p-43
B&V Project 140895
7.5 Boiler Efficiency Tests
For each test, the unit was operated at a steady turbine load of approximately 300 MW (100% MCR) for two (2) consecutive days as prescribed in the Test Protocol. During these two days, data were recorded via the PI (Plant Information) System and were also collected by independent testing contractors. These data were then used to determine the unit’s boiler efficiency. 7.5.1 Calculation Method The boiler efficiency calculation method was based on a combination of the abbreviated heat loss method as defined in the ASME Power Test Code (PTC) 4.1, 1974, reaffirmed 1991, and the methods described in ASME PTC 4. The method was modified to account for the heat of calcination and sulfation within the CFB boiler SO2 capture mechanism. The methods have also been modified to account for process differences between conventional and fluidized bed boilers to account for the addition of limestone. These modifications account for difference in the dry gas quantity and the additional heat loss/gain due to calcination / sulfation. A complete description of the modified procedures is included in Section 4.2 of the Fuel Capability Demonstration Test Protocol. Some of the heat losses included losses due to the heat in dry flue gas, unburned carbon in the bed ash and the fly ash, and the heat loss due to radiation and convection from the insulated boiler surfaces.
7.5.2 Data and Sample Acquisition
During the tests, permanently installed plant instrumentation was used to measure most of the data which were required to perform the boiler efficiency calculations. The data were collected electronically utilizing JEA’s Plant Information (PI) system. Additional data required for the boiler efficiency calculations were collected by two independent testing contractors, Power Generation Technologies (PGT), and Clean Air Engineering (CAE). The majority of the data utilized in the boiler efficiency calculation and sulfur capture performance, such as combustion air and flue gas temperatures and flue gas oxygen content, were stored and retrieved by the PI system, as noted above. Data for the as-fired fuel, limestone, and resulting bed ash, fly ash, and exiting flue gas constituents were provided via laboratory analyses. Samples were taken in the following locations by PGT and forwarded to a lab for analysis. Lime:
Lime slurry samples were taken from the sample valve located on the discharge of the lime slurry transfer pump. This valve is located in the AQCS Spray Dryer Absorber (SDA) pump room.
Fly ash:
Fly ash samples were taken by two different methods. 1) Flyash was taken by isokinetic sampling at the inlet to the SDA. These samples were taken to
determine ash loading rates and also obtain samples for laboratory analysis of ash constituents. 2) Flyash was also taken by grab sample method in two different locations. One grab sample was
taken every hour at a single air heater outlet hopper and another grab sample at a single bag house fabric filter hopper.
Fuel:

JEA Large-Scale CFB Combustion Demonstration Project
Final Technical Report p-44
B&V Project 140895
Fuel samples were taken from the sample port at the discharge end of each gravimetric fuel feeder. The fuel samples were collected using a coal scoop inserted through the 4 inch test port at each operating fuel conveyor.
Limestone:
Limestone samples were taken from the outlet of each operating limestone rotary feeder. The samples were collected using a scoop passed into the flow stream of the 4 inch test ball valve in the neck of each feeder outlet.
Bed Ash:
Bed ash samples were taken from each of the operating stripper cooler rotary valve outlets. The samples were taken by passing a stainless steel scoop through the 4 inch test port at each operating stripper cooler.
All of the samples were labeled and transferred to a lab for analysis. The average values were determined and used as input data for performing the boiler efficiency calculation.
7.6 AQCS Inlet and Stack Tests 7.6.1 System Description
The Unit 2 AQCS consists of a single, lime-based SDA and a multi-compartment PJFF. The SDA has sixteen independent dual-fluid atomizers. The PJFF has eight isolatable compartments. The AQCS system also uses reagent preparation and byproduct handling subsystems. The SDA byproduct solids/fly ash collected by the PJFF is pneumatically transferred from the PJFF hoppers to either the Unit 2 fly ash silo or the Unit 2 AQCS recycle bin. Flyash from the recycle bin is slurried and reused as the primary reagent by the SDA spray atomizers. The reagent preparation system converts quicklime, which is delivered dry to the station, into a hydrated lime [Ca(OH)2] slurry, which is fed to the atomizers as a supplemental reagent. 7.6.2 Emissions Test Methods
The emissions test methods used for the demonstration test were based upon utilizing 40 CFR 60 based testing methods or the plant CEMS. The emissions tests were conducted by CAE. The following test methods were utilized:
• Particulate Matter at SDA Inlet – USEPA Method 17 • Particulate Matter at Stack – USEPA Method 5 • Oxides of Nitrogen at Stack – Plant CEMS • Sulfur Dioxide at SDA Inlet – USEPA Method 6C • Sulfur Dioxide at Stack – Plant CEMS • Carbon Monoxide at Stack – Plant CEMS • Ammonia at Stack – Conditional Test Method 027 • Lead at Stack – USEPA Method 29 • Mercury at SDA Inlet – Ontario Hydro Method • Fluorine at Stack – USEPA Method 13B • Dioxin/Furans (PCDD/F) – USEPA Method 23

JEA Large-Scale CFB Combustion Demonstration Project
Final Technical Report p-45
B&V Project 140895
7.6.3 Continuous Emission Monitoring System The plant CEMS was utilized for measurement of gaseous emissions as a part of the fuel capability demonstration, as listed above. The CEMS equipment was integrated by KVB-Entertec (now GE Energy Systems). The system is a dilution extractive system consisting of Thermo Environmental NOx, SO2, and CO2 analyzers. The test data from the CEMS originated from the certified Data Acquisition Handling System (DAHS).

JEA Large-Scale CFB Combustion Demonstration Project
Final Technical Report p-46
B&V Project 140895
8.0 CAPITAL COSTS
8.1 Capital Cost History/Overview At the time JEA and the DOE signed the Cooperative Agreement for the Large-Scale CFB Combustion Demonstration Project for Northside Unit 2 in September 1997, the preliminary budget estimate for Repowering Unit 2 with CFB boiler technology, plus one-half of the cost of the associated common facilities, totaled $305, 773,774. This preliminary budget estimate was used as the basis for cost sharing throughout the project life. The preliminary project capital cost estimate increased due to refined scope definitions, improved cost estimates, and scope growth. To identify and quantify the magnitude of this increase, the project “Baseline” estimate was developed in October 2000. The “Baseline” or “Control” estimate was the joint effort by the key principles making up the project team. Estimates, based on firm scope and significant detail design, were developed by JEA, FW, B&V, FGS, and ZCC for their areas of the project. This estimate resulted in a revised budget for Unit 2 and one-half of the common facilities to $328,878,487. At project completion, the actual capital cost for Unit 2 and one-half of the associated common facilities totaled $321,392,624, only about 5% above the original preliminary budget estimate. A breakdown of these costs by DOE Phase and Task is provided in Appendix D. DOE financial support and limitations on DOE funding, as set forth in the Cooperative Agreement, were tied to the preliminary budget estimate. Within that budget of $305,773,774, DOE would share fifty percent (50%) of Phase 1B (Design) cost up to $11,484,482; JEA’s actual portion of Phase 1B at completion totaled $22,549,532. Within Phase 2 (Construction and Start-up), DOE would share at a rate of twenty eight point three percent (28.3%) up to $59,243,317; JEA’s actual portion of Phase 2 at completion totaled $228,115,293. During Phase 3 (Operations), the DOE share would total $2,344,655. The Phase 3 funds were tied to a milestone schedule for final issue of the demonstration test reports. At project completion the DOE cost share in the project is expected to be a total of $73,072,464, with the JEA cost share being $250,664,825. 8.2 Capital Improvement Projects - Phase 1 Problems with Unit 2 reliability and maintainability were encountered early in plant operations. As a result, JEA began targeting capital funds, in addition to O&M funds being expended, to mitigate and resolve many of the problems being experienced. These projects were identified as Phase 1 Completion Modifications, and are described in more detail in the Start-up Modifications Report, which is available on the DOE website at the following link:
http://www.netl.doe.gov/cctc/resources/pdfs/jacks/Start-Up%20Modifications%20Report_final.pdf
These Phase 1 Completion Modifications, hereinafter referred to as Capital Improvement Projects, were executed during FY 02/03 at a capital cost of $5,697,156. A description of these projects and associated costs is provided in Appendix D.

JEA Large-Scale CFB Combustion Demonstration Project
Final Technical Report p-47
B&V Project 140895
8.3 Capital Improvement Projects - Phase 2 Continuing significant operating and reliability issues lead to the identification of additional improvement projects, referred to as Phase 2 Capital Improvement Projects. These projects were implemented during FY 03/04 at a capital cost of $7,138,138. A description of these projects and associated costs is also provided in Appendix D.
8.4 Capital Improvement Projects Going Forward Although the Cooperative Agreement between DOE and JEA is expected to be completed in April 2005, JEA is continuing to proactively investigate and implement (where appropriate) capital outlays to improve EAF and maintainability of the repowered units.
8.5 Commercialization of Large Scale CFB Combustion Technology The JEA Large Scale CFB Combustion Demonstration Project has demonstrated the successful commercial operation of a 300 MW class CFB boiler firing both domestic coals and petroleum coke, and coal/coke blends. The operating data summarized in Section 5 of this report confirms that the Unit 2 CFB boiler is capable of routinely supporting full load operation of Unit 2 while achieving stack emissions below permit limits. The performance test results in Section 7 of this report confirm that the as-tested full load boiler efficiencies on various fuels were at or above the design values developed by FW, and are competitive with the boiler efficiencies achieved by other commercially available boiler technologies of this size. However, the operating data in Section 5 also indicates that the EAF for Unit 2 during the two year demonstration period for the project was significantly lower than industry average values, based on a comparison to NERC/GADS data. The majority of the lost MW hours were caused by boiler related problems, and JEA has spent over 12 million dollars on capital improvement projects during the two year demonstration period to improve the reliability and maintainability of the Unit 2 CFB boiler and AQCS system. Refer to Section 6 of this report for a description of some of the significant modifications that have been made. The associated capital costs are summarized in this Section 8 of the report. In addition, JEA anticipates that significant additional capital expenditures will be required over the next 5 years, primarily on the boilers, to raise the EAF of Units 1 and 2 to near industry average values. The most significant boiler related problem affecting EAF encountered during the demonstration period has been agglomeration and superheater tube failures in the Intrex, as described in Section 6 of this report. Investigations by JEA and FW of the issues involved and long term modifications to mitigate these issues on the Northside CFB boilers are ongoing. Options being considered include removal of the superheater surface from the Intrex. FW has already concluded that the Intrex design is not viable, and is no longer offering this design feature on new CFB boilers.

JEA Large-Scale CFB Combustion Demonstration Project
Final Technical Report p-48
B&V Project 140895
APPENDICES
Appendix A - Drawings Appendix B - Equipment List Appendix C - Unit 2 Operating Data Appendix D - Capital Cost Data

JEA Large-Scale CFB Combustion Demonstration Project
Final Technical Report Appendix A p-1
B&V Project 140895
APPENDIX A - Drawings
OVERALL PLOT PLAN
CMA-S1000 Site Arrangement 4600-1-51-004 Overall plot plan
CFB BOILERS
43-7587-5-51 GENERAL ARRANGEMENT UNIT 2 SIDE ELEVATION 43-7587-5-52 GENERAL ARRANGEMENT UNIT 2 ISO VIEW (FRONT) 43-7587-5-53 GENERAL ARRANGEMENT UNIT 2 ISO VIEW (RIGHT SIDE) 43-7587-5-54 GENERAL ARRANGEMENT UNIT 2 ISO VIEW (LEFT SIDE) 43-7587-5-55 GENERAL ARRANGEMENT UNIT 2 ISO VIEW (REAR) 43-7587-5-20 STEAM GENERATOR GENERAL ARRANGEMENT CROSS SECTION
AIR QUALITY CONTROL SYSTEM 3847-1-100 GEN ARRANGEMENT PLAN 3847-1-101 GEN ARRANGEMENT ELEVATION 3847-1-102 GEN ARRANGEMENT ELEVATION 3847-1-103 GEN ARRANGEMENT ELEVATION
WATER MASS BALANCE DIAGRAM WMB-1 WATER MASS BALANCE, ANNUAL AVERAGE, CELL 1 OF BSA ONLY
JEA Large-Scale CFB Combustion Demonstration Project
Final Technical Report Appendix B p-1
B&V Project 140895
APPENDIX B - Major Equipment List The Equipment List on the following pages lists the major equipment associated with the Repowering Project and is listed by the JEA GEMS (or System) Code. Since the P&ID’s are defined and numbered by their associated GEMS code, the equipment is also listed by P&ID. The quantity, percent capacity, and redundancy is indicated for each item of equipment. This information is indicated for Unit 2, Common, and Unit 1 equipment, since some items of equipment serve as an installed back-up for both units.

JEA
Lar
ge-S
cale
CFB
Com
bust
ion
Dem
onst
ratio
n P
roje
ct
F
inal
Tec
hnic
al R
epor
t
Appe
ndix
B p
-2
B&
V P
roje
ct 1
4089
5
JE
A L
arge
-Sca
le C
FB D
emon
stra
tion
Pro
ject
M
ajor
Equ
ipm
ent L
ist
G
EMS
D
ESC
RIP
TIO
N
QU
AN
TITY
C
APA
CIT
Y R
EMA
RK
S SY
STEM
UN
IT 2
C
OM
MO
NU
NIT
1
AB
IN
STR
UM
EN
T A
IR D
RY
ER
S
3
N
omin
al 5
0% C
apac
ity E
ach
Ser
ve U
nits
1, 2
, and
3
AC
A
IR C
OM
PR
ES
SO
RS
6
Nom
inal
25%
Cap
acity
Eac
h P
rovi
de S
ervi
ce a
nd In
stru
men
t Air
for U
nits
1, 2
, and
3
BB
S
TEA
M G
EN
ER
ATO
R
1
1
BB
S
TEA
M D
RU
M
1
1
BC
S
EC
ON
DA
RY
AIR
TU
BU
LAR
AIR
H
EA
TER
1
1
BC
P
RIM
AR
Y A
IR T
UB
ULA
R A
IR H
EA
TER
1
1
BF
ELB
OW
DU
CT
BU
RN
ER
S
3
3
For S
tart-
up O
nly
BF
AB
OV
E B
ED
BU
RN
ER
S
3
3
100
MM
Btu
per
Hou
r eac
h
BI
SO
OTB
LOW
ER
PR
IMA
RY
S
UP
ER
HE
ATE
R
8
8
BI
SO
OTB
LOW
ER
FIN
AL
RE
HE
ATE
R
6
6
BI
SO
OTB
LOW
ER
RE
HE
ATE
R
6
6
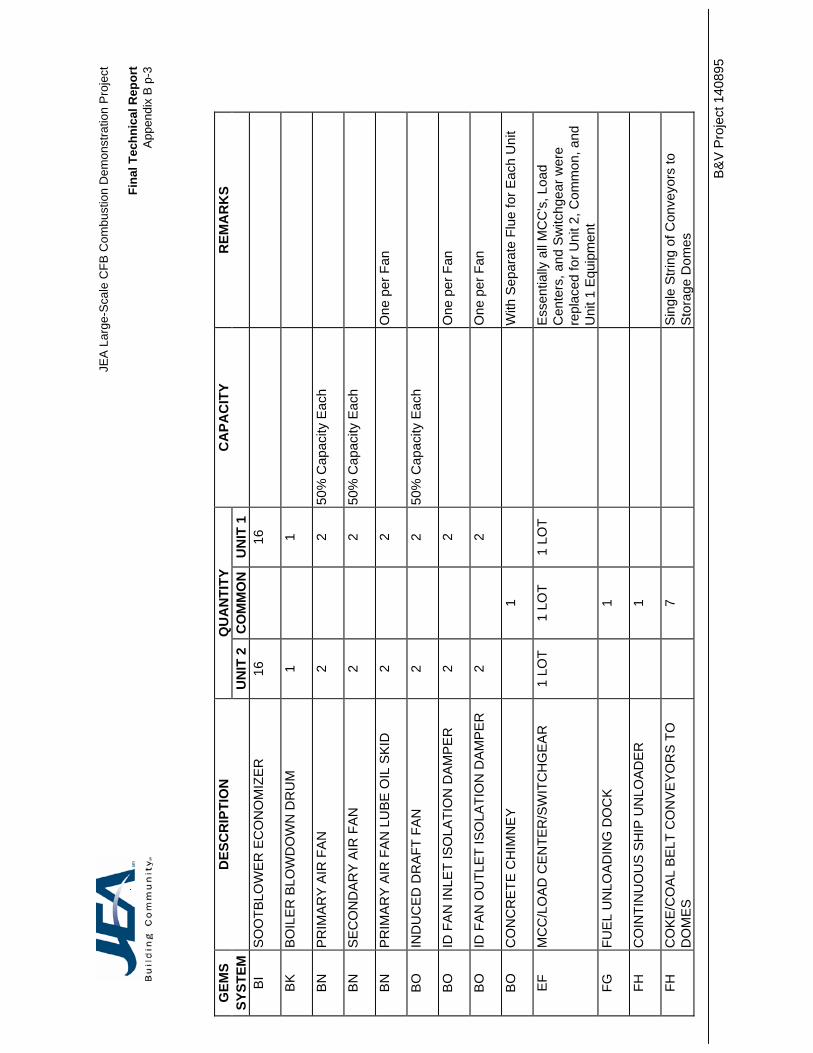
JEA
Lar
ge-S
cale
CFB
Com
bust
ion
Dem
onst
ratio
n P
roje
ct
F
inal
Tec
hnic
al R
epor
t
Appe
ndix
B p
-3
B&
V P
roje
ct 1
4089
5
GEM
S
DES
CR
IPTI
ON
Q
UA
NTI
TY
CA
PAC
ITY
REM
AR
KS
SYST
EM
U
NIT
2
CO
MM
ON
UN
IT 1
B
I S
OO
TBLO
WE
R E
CO
NO
MIZ
ER
16
16
BK
B
OIL
ER
BLO
WD
OW
N D
RU
M
1
1
BN
P
RIM
AR
Y A
IR F
AN
2
2
50%
Cap
acity
Eac
h
BN
S
EC
ON
DA
RY
AIR
FA
N
2
2 50
% C
apac
ity E
ach
BN
P
RIM
AR
Y A
IR F
AN
LU
BE
OIL
SK
ID
2
2
One
per
Fan
BO
IN
DU
CE
D D
RA
FT F
AN
2
2
50%
Cap
acity
Eac
h
BO
ID
FA
N IN
LET
ISO
LATI
ON
DA
MP
ER
2
2
O
ne p
er F
an
BO
ID
FA
N O
UTL
ET
ISO
LATI
ON
DA
MP
ER
2
2
O
ne p
er F
an
BO
C
ON
CR
ETE
CH
IMN
EY
1
W
ith S
epar
ate
Flue
for E
ach
Uni
t
EF
MC
C/L
OA
D C
EN
TER
/SW
ITC
HG
EA
R
1 LO
T 1
LOT
1 LO
T
Ess
entia
lly a
ll M
CC
's, L
oad
Cen
ters
, and
Sw
itchg
ear w
ere
repl
aced
for U
nit 2
, Com
mon
, and
U
nit 1
Equ
ipm
ent
FG
FUE
L U
NLO
AD
ING
DO
CK
1
FH
CO
INTI
NU
OU
S S
HIP
UN
LOA
DE
R
1
FH
CO
KE
/CO
AL
BE
LT C
ON
VE
YO
RS
TO
D
OM
ES
7
S
ingl
e S
tring
of C
onve
yors
to
Sto
rage
Dom
es

JEA
Lar
ge-S
cale
CFB
Com
bust
ion
Dem
onst
ratio
n P
roje
ct
F
inal
Tec
hnic
al R
epor
t
Appe
ndix
B p
-4
B&
V P
roje
ct 1
4089
5
GEM
S
DES
CR
IPTI
ON
Q
UA
NTI
TY
CA
PAC
ITY
REM
AR
KS
SYST
EM
U
NIT
2
CO
MM
ON
UN
IT 1
FH
C
OK
E/C
OA
L S
TOR
AG
E D
OM
ES
2
85,0
00 T
ons
per D
ome
FH
RA
DIA
L S
TAC
KE
R R
EC
LAIM
ER
2
100%
Cap
acity
Eac
h O
ne p
er D
ome
- Ser
ve U
nits
1 a
nd
2 FH
S
ILO
FIL
L C
OK
E/C
OA
L C
ON
VE
YO
RS
8
100%
Cap
acity
Eac
h Tw
o Fu
ll C
apac
ity S
tring
s of
C
onve
yors
- S
erve
Uni
ts 1
and
2
FH
CO
KE
/CO
AL
CR
US
HE
R
2
10
0% C
apac
ity E
ach
Ser
ve U
nits
1 a
nd 2
FH
CO
KE
/CO
ALT
RA
VE
LIN
G T
RIP
PE
R
2
10
0% C
apac
ity E
ach
Ser
ve U
nits
1 a
nd 2
FN
BO
ILE
R C
OA
L/C
OK
E S
ILO
5
5
FN
CO
KE
/CO
AL
DR
AG
CO
NV
EY
OR
2
2
Fo
r Rea
r Wal
l Fee
d
FN
CO
KE
/CO
AL
GR
AV
AM
ETR
IC F
EE
DE
R
8
8
GA
G
EN
ER
ATO
R
1
1
GC
M
AIN
SE
AL
OIL
PU
MP
1
1
GC
E
ME
RG
EN
CY
SE
AL
OIL
PU
MP
1
1
GC
S
EA
L O
IL V
AC
UU
M P
UM
P
1
1
GC
S
EA
L O
IL T
AN
K
1
1
GI
STA
TOR
CO
OLI
NG
WA
TER
PU
MP
2
2
100%
Cap
acity
Eac
h

JEA
Lar
ge-S
cale
CFB
Com
bust
ion
Dem
onst
ratio
n P
roje
ct
F
inal
Tec
hnic
al R
epor
t
Appe
ndix
B p
-5
B&
V P
roje
ct 1
4089
5
GEM
S
DES
CR
IPTI
ON
Q
UA
NTI
TY
CA
PAC
ITY
REM
AR
KS
SYST
EM
U
NIT
2
CO
MM
ON
UN
IT 1
G
I D
EIO
NIZ
ER
1
1
GI
STA
TOR
CO
OLI
NG
WA
TER
STO
RA
GE
TA
NK
1
1
GI
STA
TOR
CO
OLI
NG
WA
TER
CO
OLE
RS
2
2
100%
Cap
acity
Eac
h
HB
N
AS
H V
AC
UU
M P
UM
P
1 1
1 10
0% C
apac
ity E
ach
HD
B
ITTE
R W
ATE
R P
UM
P
1
1
HD
B
OIL
ER
FIL
L P
UM
P
1
Ser
ves
Uni
ts 1
, 2, a
nd 3
HF
CO
ND
EN
SA
TE B
OO
STE
R P
UM
P
2
2 10
0% C
apac
ity E
ach
With
Var
iabl
e S
peed
Flu
id D
rives
HF
BE
D A
SH
CO
OLI
NG
WA
TER
PU
MP
2
2
100%
Cap
acity
Eac
h
HF
DE
AE
RA
TOR
(FW
H 3
) STO
RA
GE
TA
NK
1
1
HF
DE
AE
RA
TOR
(FW
H 3
) HE
ATE
R
SE
CTI
ON
1
1
HF
FEE
D W
ATE
R H
EA
TER
NO
. 4
1
1
HF
FEE
D W
ATE
R H
EA
TER
NO
. 5
1
1
HF
FEE
D W
ATE
R H
EA
TER
NO
. 6
1
1
HK
H
EA
TER
DR
AIN
PU
MP
2
2
100%
Cap
acity
Eac
h

JEA
Lar
ge-S
cale
CFB
Com
bust
ion
Dem
onst
ratio
n P
roje
ct
F
inal
Tec
hnic
al R
epor
t
Appe
ndix
B p
-6
B&
V P
roje
ct 1
4089
5
GEM
S
DES
CR
IPTI
ON
Q
UA
NTI
TY
CA
PAC
ITY
REM
AR
KS
SYST
EM
U
NIT
2
CO
MM
ON
UN
IT 1
H
K
FEE
D W
ATE
R H
EA
TER
NO
. 6
HO
TWE
LL
1
1
HP
S
ULF
UR
IC A
CID
MIX
ING
SK
ID
1
HP
C
AU
STI
C M
IXIN
G S
KID
1
HP
P
OLI
SH
ER
RE
CY
CLE
PU
MP
1
1
HP
P
OLI
SH
ER
SLU
ICE
PU
MP
1
HP
P
OLI
SH
ER
RE
GE
NE
RA
TIO
N W
ATE
R
PU
MP
1
HP
C
AU
STI
C R
EC
YC
LE P
UM
P
1
HP
C
ON
DE
NS
ATE
PO
LIS
HE
R V
ES
SE
L 3
3
50%
Cap
acity
Eac
h
HP
C
ON
DE
NS
ATE
PO
LIS
HE
R
SE
PA
RA
TIO
N A
ND
AN
ION
R
EG
EN
ER
ATI
ON
VE
SS
EL
1
1
HP
C
ON
DE
NS
ATE
PO
LIS
HE
R C
ATI
ON
R
EG
EN
ER
ATI
ON
VE
SS
EL
1
1
HP
C
ON
DE
NS
ATE
PO
LIS
HE
R M
IX A
ND
H
OLD
VE
SS
EL
1
1
HP
C
ON
DE
NS
ATE
PO
LIS
HE
R H
OT
WA
TER
TA
NK
1
1
HP
W
AS
TE IN
SP
EC
TIO
N T
AN
K
1
HP
P
OLI
SH
ER
RE
SIN
TR
AP
3
3
O
ne p
er P
olis
her V
esse
l

JEA
Lar
ge-S
cale
CFB
Com
bust
ion
Dem
onst
ratio
n P
roje
ct
F
inal
Tec
hnic
al R
epor
t
Appe
ndix
B p
-7
B&
V P
roje
ct 1
4089
5
GEM
S
DES
CR
IPTI
ON
Q
UA
NTI
TY
CA
PAC
ITY
REM
AR
KS
SYST
EM
U
NIT
2
CO
MM
ON
UN
IT 1
IB
TR
AV
ELI
NG
WA
TER
SC
RE
EN
S
2
2 50
% C
apac
ity E
ach
IB
SC
RE
EN
WA
SH
PU
MP
S
2
Ser
ve U
nits
1, 2
, and
3
MA
B
OIL
ER
FR
EIG
HT
ELE
VA
TOR
1
1
MJ
BO
ILE
R S
AM
PLE
PA
NE
L C
HIL
LER
1
1
MJ
BO
ILE
R S
AM
PLE
PA
NE
L 1
1
MJ
SA
MP
LE P
AN
EL
1
MJ
SA
MP
LE C
HIL
LER
1
NA
FL
Y A
SH
SIL
O
1
1
Fly
Ash
from
eith
er U
nit 2
or U
nit 1
ca
n be
dire
cted
to e
ither
silo
N
A
FLY
AS
H S
ILO
FIL
TER
/SE
PA
RA
TOR
2
2
100%
Cap
acity
Eac
h Fl
y A
sh fr
om e
ither
Uni
t 2 o
r Uni
t 1
can
be d
irect
ed to
eith
er s
ilo
NA
FL
Y A
SH
SIL
O V
EN
T FI
LTE
R
1
1
NA
A
QC
S R
EC
YC
LE B
IN
FILT
ER
/SE
PA
RA
TOR
1
1
NA
FL
Y A
SH
HE
AD
CIR
CU
LATI
ON
PU
MP
1
1
NA
D
EN
SE
AS
H S
LUR
RY
MIX
ING
TA
NK
FE
ED
PU
MP
2
2
50%
Cap
acity
Eac
h
NA
S
TAN
DB
Y A
IR C
OM
PR
ES
SO
R
1

JEA
Lar
ge-S
cale
CFB
Com
bust
ion
Dem
onst
ratio
n P
roje
ct
F
inal
Tec
hnic
al R
epor
t
Appe
ndix
B p
-8
B&
V P
roje
ct 1
4089
5
GEM
S
DES
CR
IPTI
ON
Q
UA
NTI
TY
CA
PAC
ITY
REM
AR
KS
SYST
EM
U
NIT
2
CO
MM
ON
UN
IT 1
N
A
PR
IMA
RY
AIR
CO
MP
RE
SS
OR
1
NA
FL
Y A
SH
SLU
RR
Y M
IXIN
G T
AN
K
1
1
NA
FL
Y A
SH
VA
CU
UM
EX
HA
US
TER
4
100%
Cap
acity
Eac
h C
ross
tied
to s
erve
eith
er U
nit 2
or
Uni
t 1
NA
B
ED
AS
H C
RO
SS
CO
NV
EY
OR
2
B
etw
een
Uni
t 2 a
nd U
nit 1
Bed
Ash
S
ilo O
utle
ts
NA
B
ED
AS
H C
LIN
KE
R G
RIN
DE
RS
1
1
A
bove
Den
se A
sh S
lurr
y M
ixin
g Ta
nk
NA
D
EN
SE
AS
H S
LUR
RY
MIX
ING
TA
NK
1
1
NA
D
EN
SE
AS
H H
EA
D C
IRC
ULA
TIO
N
PU
MP
1
1
NA
D
EN
SE
AS
H S
LUR
RY
BO
OS
TER
PU
MP
2
2 10
0% C
apac
ity E
ach
NA
D
EN
SE
AS
H S
LUR
RY
PIS
TON
D
IAP
HR
AG
M P
UM
P
2
10
0% C
apac
ity E
ach
NA
E
ME
RG
EN
CY
FLU
SH
PU
MP
1
NB
B
ED
AS
H S
ILO
1
1
B
ed A
sh fr
om e
ither
Uni
t 1 o
r Uni
t 2
can
be d
irect
ed to
eith
er s
ilo
NB
B
ED
AS
H P
RE
SS
UR
E A
IRLO
CK
VE
SSEL
4
4
NB
B
ED
AS
H S
UR
GE
HO
PP
ER
1
1
NB
S
IDE
WA
LL S
TRIP
PE
R/ C
OO
LER
2
2
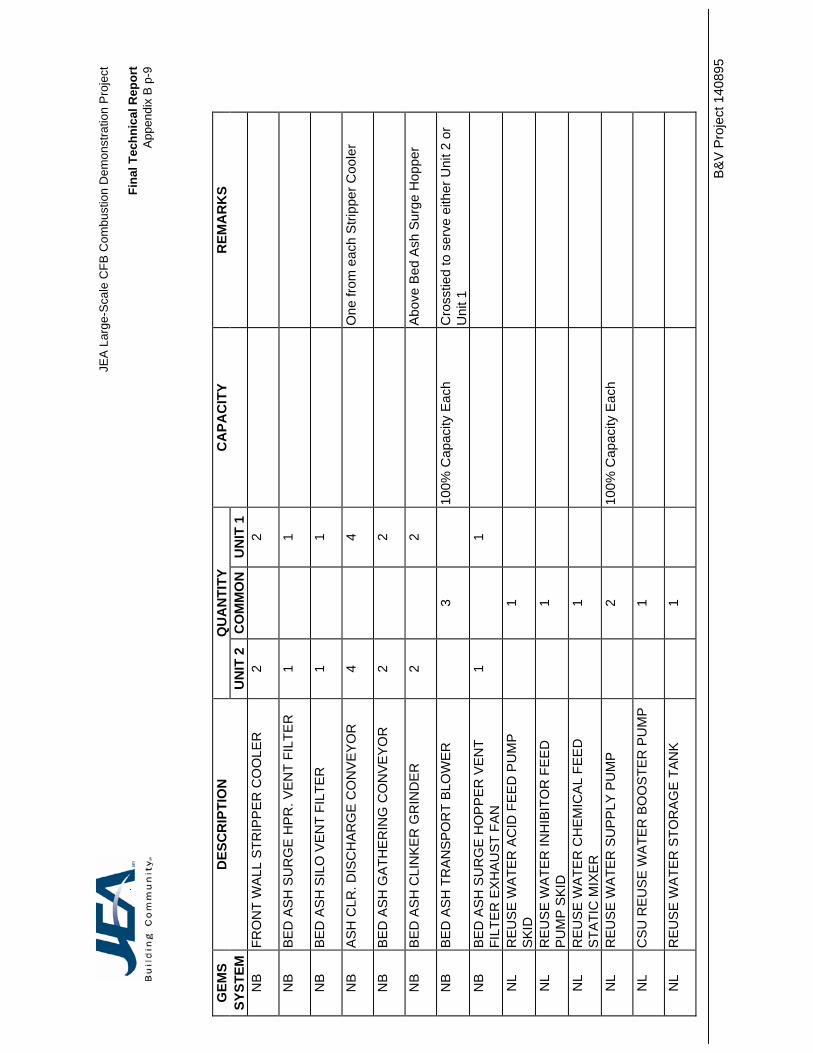
JEA
Lar
ge-S
cale
CFB
Com
bust
ion
Dem
onst
ratio
n P
roje
ct
F
inal
Tec
hnic
al R
epor
t
Appe
ndix
B p
-9
B&
V P
roje
ct 1
4089
5
GEM
S
DES
CR
IPTI
ON
Q
UA
NTI
TY
CA
PAC
ITY
REM
AR
KS
SYST
EM
U
NIT
2
CO
MM
ON
UN
IT 1
N
B
FRO
NT
WA
LL S
TRIP
PE
R C
OO
LER
2
2
NB
B
ED
AS
H S
UR
GE
HP
R. V
EN
T FI
LTE
R
1
1
NB
B
ED
AS
H S
ILO
VE
NT
FILT
ER
1
1
NB
A
SH
CLR
. DIS
CH
AR
GE
CO
NV
EY
OR
4
4
O
ne fr
om e
ach
Stri
pper
Coo
ler
NB
B
ED
AS
H G
ATH
ER
ING
CO
NV
EY
OR
2
2
NB
B
ED
AS
H C
LIN
KE
R G
RIN
DE
R
2
2
Abo
ve B
ed A
sh S
urge
Hop
per
NB
B
ED
AS
H T
RA
NS
PO
RT
BLO
WE
R
3
10
0% C
apac
ity E
ach
Cro
sstie
d to
ser
ve e
ither
Uni
t 2 o
r U
nit 1
N
B
BE
D A
SH
SU
RG
E H
OP
PE
R V
EN
T FI
LTE
R E
XH
AU
ST
FAN
1
1
NL
RE
US
E W
ATE
R A
CID
FE
ED
PU
MP
S
KID
1
NL
RE
US
E W
ATE
R IN
HIB
ITO
R F
EE
D
PU
MP
SK
ID
1
NL
RE
US
E W
ATE
R C
HE
MIC
AL
FEE
D
STA
TIC
MIX
ER
1
NL
RE
US
E W
ATE
R S
UP
PLY
PU
MP
2
100%
Cap
acity
Eac
h
NL
CS
U R
EU
SE
WA
TER
BO
OS
TER
PU
MP
1
NL
RE
US
E W
ATE
R S
TOR
AG
E T
AN
K
1

JEA
Lar
ge-S
cale
CFB
Com
bust
ion
Dem
onst
ratio
n P
roje
ct
F
inal
Tec
hnic
al R
epor
t
Appe
ndix
B p
-10
B&
V P
roje
ct 1
4089
5
GEM
S
DES
CR
IPTI
ON
Q
UA
NTI
TY
CA
PAC
ITY
REM
AR
KS
SYST
EM
U
NIT
2
CO
MM
ON
UN
IT 1
N
N
BS
A S
UM
P
4
NN
B
SA
SU
MP
PU
MP
S
8
Two
Pum
ps p
er S
ump
NN
B
SA
LE
AC
HA
TE D
ETE
CTI
ON
SU
MP
4
NN
B
SA
LE
AC
HA
TE D
ETE
CTI
ON
SU
MP
P
UM
P
8
Two
Pum
ps p
er S
ump
NN
B
SA
PO
ND
EFF
LUE
NT
SU
MP
1
NN
B
SA
PO
ND
EFF
LUE
NT
SU
MP
PU
MP
2
NN
W
AS
TEW
ATE
R C
OLL
EC
TIO
N S
UM
P 1
2
1
NN
W
AS
TEW
ATE
R C
OLL
EC
TIO
N S
UM
P 1
2 S
UM
P P
UM
P
2
NN
FU
EL
STO
RA
GE
DO
ME
SU
MP
13
1
NN
FU
EL
STO
RA
GE
DO
ME
SU
MP
13
SU
MP
PU
MP
2
NN
S
UB
SU
RFA
CE
DR
AIN
SU
MP
3
NN
S
UB
SU
RFA
CE
DR
AIN
SU
MP
PU
MP
6
Tw
o P
umps
per
Sum
p
NN
B
OIL
ER
SU
MP
1
1
NN
B
OIL
ER
SU
MP
PU
MP
2
2

JEA
Lar
ge-S
cale
CFB
Com
bust
ion
Dem
onst
ratio
n P
roje
ct
F
inal
Tec
hnic
al R
epor
t
Appe
ndix
B p
-11
B&
V P
roje
ct 1
4089
5
GEM
S
DES
CR
IPTI
ON
Q
UA
NTI
TY
CA
PAC
ITY
REM
AR
KS
SYST
EM
U
NIT
2
CO
MM
ON
UN
IT 1
N
N
AQ
CS
SU
MP
1
1
NN
A
QC
S S
UM
P P
UM
P
2
2
NN
E
LEV
ATO
R S
HA
FT S
UM
P P
UM
P
1
1
QB
B
OIL
ER
FE
ED
PU
MP
2
2
50%
Cap
acity
Eac
h O
ne m
otor
driv
en, o
ne tu
rbin
e sh
aft
driv
en.
With
var
iabl
e sp
eed
fluid
dr
ives
. Q
B
BO
ILE
R F
EE
D P
UM
P S
EA
L W
ATE
R
LEA
K O
FF R
EC
OV
ER
Y T
AN
K
1
1
QF
FEE
D W
ATE
R H
EA
TER
NO
. 2
1
1
QF
FEE
D W
ATE
R H
EA
TER
NO
. 1
1
1
RA
A
QC
S G
LYC
OL
CIR
CU
LATI
NG
PU
MP
2
100%
Cap
acity
Eac
h S
erve
Uni
t 2 a
nd U
nit 1
RA
A
QC
S A
TOM
IZIN
G A
IR C
OM
PR
ES
SO
R
1 1
1 10
0% C
apac
ity E
ach
RA
A
QC
S A
TOM
IZIN
G A
IR R
EC
EIV
ER
1
S
erve
s U
nit 2
and
Uni
t 1
RA
A
QC
S G
LYC
OL/
WA
TER
SU
RG
E T
AN
K
1
Ser
ves
Uni
t 2 a
nd U
nit 1
RA
A
TOM
IZIN
G A
IR C
OM
PR
ES
SO
R IN
LET
AIR
FIL
TER
/SIL
ER
. 1
1 1
O
ne p
er C
ompr
esso
r
RA
A
TOM
IZIN
G A
IR C
OM
PR
ES
SO
R
UN
LOA
DIN
G S
ILE
R.
1 1
1
One
per
Com
pres
sor
RA
LI
ME
SLU
RR
Y F
EE
D P
UM
P
2
2 10
0% C
apac
ity E
ach

JEA
Lar
ge-S
cale
CFB
Com
bust
ion
Dem
onst
ratio
n P
roje
ct
F
inal
Tec
hnic
al R
epor
t
Appe
ndix
B p
-12
B&
V P
roje
ct 1
4089
5
GEM
S
DES
CR
IPTI
ON
Q
UA
NTI
TY
CA
PAC
ITY
REM
AR
KS
SYST
EM
U
NIT
2
CO
MM
ON
UN
IT 1
R
A
RE
CY
CLE
SLU
RR
Y T
RA
NS
. PU
MP
2
2
100%
Cap
acity
Eac
h
RA
FE
ED
SLU
RR
Y T
RA
NS
. PU
MP
2
2
100%
Cap
acity
Eac
h
RA
FE
ED
SLU
RR
Y P
UM
P
2
2 10
0% C
apac
ity E
ach
RA
A
QC
S F
LUID
IZIN
G A
IR B
LOW
ER
3
3
50%
Cap
acity
Eac
h
RA
A
QC
S F
LUID
IZIN
G A
IR H
EA
TER
3
3
50%
Cap
acity
Eac
h
RA
LI
ME
SLU
RR
Y S
TOR
AG
E T
AN
K
AG
ITA
TOR
1
1
RA
R
EC
Y S
LUR
RY
STO
RA
GE
TA
NK
A
GIT
ATO
R
1
1
RA
R
EC
Y S
LUR
RY
MIX
TA
NK
AG
ITA
TOR
1
1
RA
LI
ME
SLU
RR
Y S
TOR
AG
E T
AN
K
1
1
RA
R
EC
YC
LE S
LUR
RY
MIX
TA
NK
1
1
RA
R
EC
YC
LE S
LUR
RY
STO
RA
GE
TA
NK
1
1
RA
FL
Y A
SH
RE
CY
CLE
STO
RA
GE
BIN
1
1
RA
FE
ED
SLU
RR
Y H
EA
D T
AN
K
1
1
RA
S
DA
BIN
AC
TIV
ATO
R
1
1

JEA
Lar
ge-S
cale
CFB
Com
bust
ion
Dem
onst
ratio
n P
roje
ct
F
inal
Tec
hnic
al R
epor
t
Appe
ndix
B p
-13
B&
V P
roje
ct 1
4089
5
GEM
S
DES
CR
IPTI
ON
Q
UA
NTI
TY
CA
PAC
ITY
REM
AR
KS
SYST
EM
U
NIT
2
CO
MM
ON
UN
IT 1
R
A
FLY
AS
H R
EC
YC
LE F
EE
DE
R
2
2 10
0% C
apac
ity E
ach
RA
S
DA
AS
H C
ON
VE
YO
R
1
1
RA
S
DA
EM
ER
GE
NC
Y D
ISC
HA
RG
E
CO
NV
EY
OR
1
1
RA
S
DA
AS
H D
ELU
MP
ER
1
1
RA
S
DA
IMP
AC
TOR
3
3
RB
FA
BR
IC F
ILTE
R C
OM
PA
RTM
EN
T 8
8
RB
A
QC
S IN
STR
UM
EN
T A
IR D
RY
ER
2
100%
Cap
acity
Eac
h S
erve
Uni
t 2 a
nd U
nit 1
RH
LI
ME
STO
NE
STA
CK
-OU
T C
ON
VE
YO
R
1
RH
LI
ME
STO
NE
FE
ED
CO
NV
EY
OR
S T
O L
S
PR
EP
3
O
ne p
er D
ryer
/Mill
Tra
in
RH
LS
PLA
NT
AIR
CO
MP
RE
SS
OR
2
S
erve
Uni
t 2 a
nd U
nit 1
RH
LS
AIR
HE
ATE
R C
OM
BU
STI
ON
AIR
FA
N
3
One
per
Dry
er/M
ill T
rain
RH
LS
DR
YE
R/M
ILL
DU
ST
CO
LL E
XH
AU
ST
FAN
3
O
ne p
er D
ryer
/Mill
Tra
in
RH
LS
PR
EP
. DU
ST
CO
LLE
CTO
R
EX
HA
US
T FA
N
3
One
per
Dry
er/M
ill T
rain
RH
LS
PR
OD
UC
T P
NE
UM
ATI
C B
LOW
ER
3
O
ne p
er D
ryer
/Mill
Tra
in
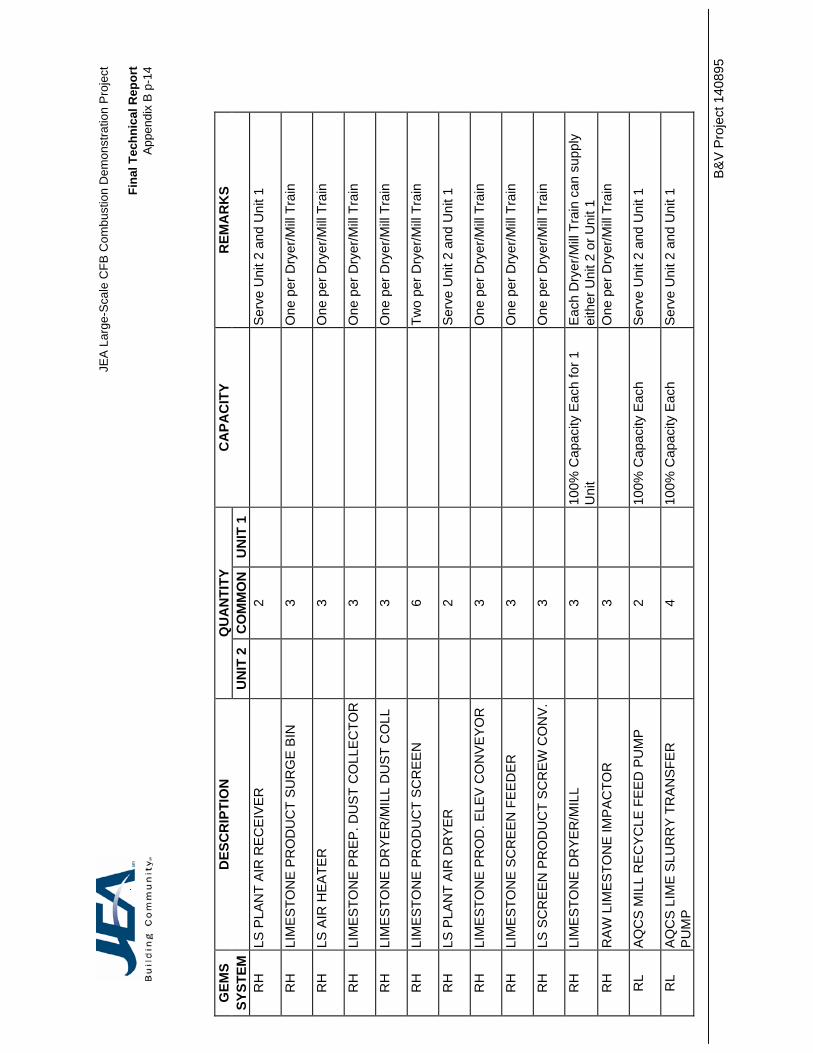
JEA
Lar
ge-S
cale
CFB
Com
bust
ion
Dem
onst
ratio
n P
roje
ct
F
inal
Tec
hnic
al R
epor
t
Appe
ndix
B p
-14
B&
V P
roje
ct 1
4089
5
GEM
S
DES
CR
IPTI
ON
Q
UA
NTI
TY
CA
PAC
ITY
REM
AR
KS
SYST
EM
U
NIT
2
CO
MM
ON
UN
IT 1
R
H
LS P
LAN
T A
IR R
EC
EIV
ER
2
S
erve
Uni
t 2 a
nd U
nit 1
RH
LI
ME
STO
NE
PR
OD
UC
T S
UR
GE
BIN
3
O
ne p
er D
ryer
/Mill
Tra
in
RH
LS
AIR
HE
ATE
R
3
One
per
Dry
er/M
ill T
rain
RH
LI
ME
STO
NE
PR
EP
. DU
ST
CO
LLE
CTO
R
3
O
ne p
er D
ryer
/Mill
Tra
in
RH
LI
ME
STO
NE
DR
YE
R/M
ILL
DU
ST
CO
LL
3
One
per
Dry
er/M
ill T
rain
RH
LI
ME
STO
NE
PR
OD
UC
T S
CR
EE
N
6
Two
per D
ryer
/Mill
Tra
in
RH
LS
PLA
NT
AIR
DR
YE
R
2
Ser
ve U
nit 2
and
Uni
t 1
RH
LI
ME
STO
NE
PR
OD
. ELE
V C
ON
VE
YO
R
3
One
per
Dry
er/M
ill T
rain
RH
LI
ME
STO
NE
SC
RE
EN
FE
ED
ER
3
O
ne p
er D
ryer
/Mill
Tra
in
RH
LS
SC
RE
EN
PR
OD
UC
T S
CR
EW
CO
NV
.
3
O
ne p
er D
ryer
/Mill
Tra
in
RH
LI
ME
STO
NE
DR
YE
R/M
ILL
3
100%
Cap
acity
Eac
h fo
r 1
Uni
t E
ach
Dry
er/M
ill T
rain
can
sup
ply
eith
er U
nit 2
or U
nit 1
R
H
RA
W L
IME
STO
NE
IMP
AC
TOR
3
O
ne p
er D
ryer
/Mill
Tra
in
RL
AQ
CS
MIL
L R
EC
YC
LE F
EE
D P
UM
P
2
10
0% C
apac
ity E
ach
Ser
ve U
nit 2
and
Uni
t 1
RL
AQ
CS
LIM
E S
LUR
RY
TR
AN
SFE
R
PU
MP
4
100%
Cap
acity
Eac
h S
erve
Uni
t 2 a
nd U
nit 1

JEA
Lar
ge-S
cale
CFB
Com
bust
ion
Dem
onst
ratio
n P
roje
ct
F
inal
Tec
hnic
al R
epor
t
Appe
ndix
B p
-15
B&
V P
roje
ct 1
4089
5
GEM
S
DES
CR
IPTI
ON
Q
UA
NTI
TY
CA
PAC
ITY
REM
AR
KS
SYST
EM
U
NIT
2
CO
MM
ON
UN
IT 1
R
L A
QC
S L
IME
SLU
RR
Y T
RA
NS
. TA
NK
A
GIT
ATO
R
2
Ser
ve U
nit 2
and
Uni
t 1
RL
AQ
CS
LIM
E S
TOR
AG
E S
ILO
1
S
erve
s U
nit 2
and
Uni
t 1
RL
AQ
CS
LIM
E S
LUR
RY
TR
AN
SFE
R T
AN
K
2
S
erve
s U
nit 2
and
Uni
t 1
RL
AQ
CS
MIL
L S
EP
AR
ATI
NG
CH
AM
BE
R
2
Ser
ves
Uni
t 2 a
nd U
nit 1
RL
AQ
CS
LIM
E S
TOR
AG
E S
ILO
BIN
A
CTI
VA
TOR
1
S
erve
s U
nit 2
and
Uni
t 1
RL
AQ
CS
LIM
E S
TOR
AG
E S
ILO
DU
ST
CO
LLE
CTO
R
1
Ser
ves
Uni
t 2 a
nd U
nit 1
RL
AQ
CS
MIL
L V
EN
T S
CR
UB
BE
R
2
Ser
ves
Uni
t 2 a
nd U
nit 1
RL
AQ
CS
VE
RTI
CA
L B
ALL
MIL
L S
LAK
ER
2
S
erve
s U
nit 2
and
Uni
t 1
RN
LI
ME
STO
NE
BLO
WE
R
3
3 33
-1/3
% C
apac
ity E
ach
RN
S
TAN
DB
Y L
IME
STO
NE
BLO
WE
R
1
1
RN
LI
ME
STO
NE
SIL
O
1
1
RN
LI
ME
STO
NE
FIL
TER
/RE
CE
IVE
R
3
3
RN
LI
ME
STO
NE
SIL
O V
EN
T FI
LTE
R
1
1
RN
LI
ME
STO
NE
FIL
TER
/RE
C. E
XH
AU
STE
R3
3

JEA
Lar
ge-S
cale
CFB
Com
bust
ion
Dem
onst
ratio
n P
roje
ct
F
inal
Tec
hnic
al R
epor
t
Appe
ndix
B p
-16
B&
V P
roje
ct 1
4089
5
GEM
S
DES
CR
IPTI
ON
Q
UA
NTI
TY
CA
PAC
ITY
REM
AR
KS
SYST
EM
U
NIT
2
CO
MM
ON
UN
IT 1
R
N
LIM
ES
TON
E R
OTA
RY
FE
ED
ER
3
3
RN
LI
ME
STO
NE
RO
TAR
Y A
IRLO
CK
FE
ED
ER
6
6
RN
LI
ME
STO
NE
RO
TAR
Y V
ALV
E
3
3
SI
INTR
EX
TM
3
3
SI
INTR
EX
TM B
LOW
ER
3
3
50%
Cap
acity
Eac
h
SI
SE
AL
PO
T B
LOW
ER
3
3
50%
Cap
acity
Eac
h
SJ
ER
V S
ILE
NC
ER
1
1
SK
C
YC
LON
E
3
3
SL
EC
ON
OM
IZE
R
1
1
TG
STE
AM
TU
RB
INE
- LP
1
1
TH
STE
AM
TU
RB
INE
- H
P/IP
1
1
TI
STE
AM
PA
CK
ING
EX
HA
US
TER
1
1
TJ
TUR
B L
UB
E O
IL H
EA
T E
XC
HA
NG
ER
S
2
2 10
0% C
apac
ity E
ach
TJ
TUR
BIN
E L
UB
E O
IL C
ON
DIT
ION
ER
2
2
O
ne B
owse
r, O
ne T
urbo
-Toc

JEA
Lar
ge-S
cale
CFB
Com
bust
ion
Dem
onst
ratio
n P
roje
ct
F
inal
Tec
hnic
al R
epor
t
Appe
ndix
B p
-17
B&
V P
roje
ct 1
4089
5
GEM
S
DES
CR
IPTI
ON
Q
UA
NTI
TY
CA
PAC
ITY
REM
AR
KS
SYST
EM
U
NIT
2
CO
MM
ON
UN
IT 1
TJ
TU
RB
INE
LU
BE
OIL
TA
NK
2
2
O
ne O
pera
ting
Tank
, One
Sto
rage
Ta
nk
TJ
TUR
BIN
E L
UB
E O
IL P
UM
P
3
3
Two
AC
, One
DC
TN
TUR
BIN
E E
LEC
TRO
-HY
DR
AU
LIC
C
ON
TRO
L U
NIT
1
1
UE
H
YD
RA
ZIN
E F
EE
D P
UM
P
1
1
UE
A
MM
ON
IA F
EE
D P
UM
P
1
1
UE
P
HO
SP
HA
TE F
EE
D P
UM
P
2
2 10
0% C
apac
ity E
ach
UE
P
HO
SP
HA
TE S
TOR
AG
E T
AN
K
1
1
UE
P
HO
SP
HA
TE S
TG. T
AN
K A
GIT
ATO
R
1
1
UR
A
MM
ON
IA P
UM
P
1 1
1 10
0% C
apac
ity E
ach
Com
mon
Sha
red
Spa
re
UR
A
MM
ON
IA S
TOR
AG
E T
AN
K
1
Ser
ves
Uni
ts 2
and
1
WF
DE
MIN
ER
ALI
ZED
WA
TER
TR
AN
SFE
R
PU
MP
S
2
Add
ed D
emin
Wat
er fr
om S
JRP
P
for U
nits
1, 2
, and
3
XE
C
ON
DE
NS
ATE
PU
MP
2
2
100%
Cap
acity
Eac
h
XE
C
ON
DE
NS
ER
1
1
XE
D
EB
RIS
FIL
TER
S
2
2 50
% C
apac
ity E
ach

JEA
Lar
ge-S
cale
CFB
Com
bust
ion
Dem
onst
ratio
n P
roje
ct
F
inal
Tec
hnic
al R
epor
t
Appe
ndix
B p
-18
B&
V P
roje
ct 1
4089
5
GEM
S
DES
CR
IPTI
ON
Q
UA
NTI
TY
CA
PAC
ITY
REM
AR
KS
SYST
EM
U
NIT
2
CO
MM
ON
UN
IT 1
X
J R
IVE
R W
ATE
R B
OO
STE
R P
UM
P
2
2 10
0% C
apac
ity E
ach
XK
C
LOS
ED
CO
OLI
NG
WA
TER
PU
MP
2
2
100%
Cap
acity
Eac
h
XK
C
LOS
ED
CO
OLI
NG
WA
TER
BO
OS
TER
P
UM
P
2
2 10
0% C
apac
ity E
ach
XK
C
LOS
ED
CO
OLI
NG
WA
TER
SU
RG
E
TAN
K
1
1
XK
C
LOS
ED
CO
OLI
NG
WA
TER
PLA
TE
HE
AT
EX
CH
AN
GE
R
2
2 10
0% C
apac
ity E
ach
XL
CIR
CU
LATI
NG
WA
TER
PU
MP
2
2
50%
Cap
acity
Eac
h

JEA Large-Scale CFB Combustion Demonstration Project
Final Technical Report Appendix C p-1
B&V Project 140895
APPENDIX C - Unit 2 Operating Data

JEA
Lar
ge-S
cale
CFB
Com
bust
ion
Dem
onst
ratio
n P
roje
ctFi
nal T
echn
ical
Rep
ort
Nor
thsi
de U
nit 2
Ope
ratin
g D
ata
Oct
ober
200
2 th
ru D
ecem
ber 2
004
||FI
LE: (
0)JE
AD
ATA
DR
AK
E||
||||
||||
||||
CA
LEN
DA
R
2003
CA
LEN
DA
R
2004
||O
ct-0
2N
ov-0
2D
ec-0
2Ja
n-03
Feb-
03M
ar-0
3A
pr-0
3M
ay-0
3Ju
n-03
Jul-0
3A
ug-0
3Se
p-03
Oct
-03
Nov
-03
Dec
-03
||||
||.
..
..
..
..
..
..
..
||FU
EL H
EAT
CO
NTE
NT
||||
..
..
..
..
..
.||
NS
-2P
ETC
OK
EH
EA
T C
ON
TEN
T-B
TU/L
B||
14,1
0713
,949
||14
,133
13,8
9314
,240
14,3
2114
,257
14,1
8214
,042
13,9
3214
,273
14,2
1514
,044
14,2
6314
,002
13,9
7313
,950
||N
S-2
CO
AL
HE
AT
CO
NTE
NT-
BTU
/LB
||12
,827
11,9
07||
13,0
4412
,874
12,9
0112
,985
13,0
1212
,943
13,0
9213
,152
13,0
6413
,077
13,1
2512
,674
12,3
2812
,380
12,1
56||
||||
..
..
..
..
..
.||
NS
-2P
ETC
OK
E%
S||
5.28
4.53
||5.
434.
774.
133.
735.
846.
665.
555.
234.
255.
715.
875.
425.
135.
974.
02||
NS
-2C
OA
L%
S||
2.52
2.62
||2.
652.
822.
762.
422.
392.
442.
542.
482.
652.
732.
632.
302.
362.
572.
69||
||||
..
..
..
..
..
.||
NS
-2P
ETC
OK
E%
ash
||0.
420.
71||
0.36
0.42
0.38
0.34
0.41
0.27
0.41
0.49
0.47
0.34
0.34
0.36
0.63
0.57
0.46
||N
S-2
CO
AL
%as
h||
8.10
8.81
||7.
848.
148.
118.
037.
867.
617.
707.
797.
928.
168.
158.
338.
108.
259.
28||
* * *
* * *
* * *
* * *
* ** *
* * *
* * *
* **
* * *
* * *
* * *
* * *
||* *
* * *
* * *
* * *
* *
* * *
* * *
* * *
||* *
* * *
* * *
* * *
* *
* * *
* * *
* * *
* * *
* * *
* * *
* * *
* * *
* * *
* * *
* * *
* * *
* * *
* * *
* *
* * *
* * *
* * *
* * *
* * *
* * *
* * *
* * *
* * *
* * *
* * *
* * *
* * *
* * *
* *
* * *
* * *
* * *
* * *
* * *
* * *
* * *
* * *
* * *
* * *
* * *
* * *
* * *
* * *
* *
* * *
* * *
* * *
* * *
* * *
* * *
* *
||N
S-2
OPE
R D
ATA
(GR
OS
S C
AP
)29
7.5
||||
297.
529
7.5
297.
529
7.5
297.
529
7.5
297.
529
7.5
297.
529
7.5
297.
529
7.5
297.
529
7.5
297.
5||
GR
OS
S M
WH
GE
NE
RA
TED
||1,
791,
221
1,45
9,35
1||
122,
429
70,5
0511
4,82
213
0,43
114
4,71
918
8,78
050
,944
196,
907
207,
850
195,
162
123,
728
134,
363
164,
859
41,4
1521
2,06
3||
HO
US
E L
OA
D M
WH
(ON
-LIN
E)
||11
7,24
010
1,92
4||
10,4
4410
,570
8,57
79,
595
10,9
2414
,937
4,14
514
,266
11,3
5711
,159
7,54
68,
048
10,5
683,
648
11,0
49||
NE
T M
WH
(ON
-LIN
E)
||1,
673,
981
1,35
7,42
7||
111,
985
59,9
3510
6,24
512
0,83
613
3,79
517
3,84
446
,799
182,
641
196,
493
184,
003
116,
182
126,
315
154,
291
37,7
6720
1,01
4||
GA
S O
N-L
INE
(KC
F)||
17,2
629,
904
||22
175
91,
587
01,
817
174,
378
00
1,71
70
06,
985
1,84
10
||P
ETC
OK
E O
N-L
INE
(TO
NS
)||
437,
099
326,
250
||26
,603
7,38
924
,154
28,9
2935
,520
48,3
0011
,684
45,7
6149
,879
47,9
7232
,720
30,5
0341
,601
10,1
2053
,522
||C
OA
L O
N-L
INE
(TO
NS
)||
139,
343
159,
871
||12
,625
17,5
8012
,101
10,5
6010
,801
12,3
465,
327
16,7
0113
,730
15,1
7610
,162
12,7
6112
,416
4,42
914
,784
||LI
ME
STO
NE
||22
9,52
318
0,33
9||
17,1
086,
365
9,51
012
,341
21,8
3730
,522
6,76
723
,431
19,8
8831
,027
19,7
9315
,303
21,9
807,
229
19,4
43||
HE
AT
CO
NTE
NT
- GA
S||
1,05
71,
034
||1,
051
1,05
41,
054
1,06
01,
058
1,05
41,
057
1,06
11,
063
1,06
41,
058
1,05
81,
054
1,05
01,
047
||H
EA
T C
ON
TEN
T - P
ETC
OK
E||
14,1
0713
,949
||14
,133
13,8
9314
,240
14,3
2114
,257
14,1
8214
,042
13,9
3214
,273
14,2
1514
,044
14,2
6314
,002
13,9
7313
,950
||H
EA
T C
ON
TEN
T - C
OA
L||
12,8
2711
,907
||13
,044
12,8
7412
,901
12,9
8513
,012
12,9
4313
,092
13,1
5213
,064
13,0
7713
,125
12,6
7412
,328
12,3
8012
,156
||H
EA
T R
ATE
(O/L
) (B
TU/K
WH
, NE
T)||
9,51
49,
518
||9,
658
10,9
919,
429
9,12
79,
685
9,71
910
,091
9,38
79,
072
9,57
910
,206
9,44
99,
584
10,4
459,
216
||A
TTE
MP
TED
STA
RTS
||18
31||
59
42
10
80
01
02
12
1||
STA
RTS
||15
9||
14
21
10
70
01
01
12
1||
HO
UR
S O
NLI
NE
||6,
843
5,45
0||
453.
6230
4.20
456.
4749
3.20
535.
4774
4.00
227.
7774
4.00
720.
0072
5.50
441.
9753
7.63
724.
0321
8.72
731.
13||
CO
MB
US
TIO
N H
OU
RS
||7,
057
5,83
9||
498.
5035
9.53
488.
4351
7.08
586.
3374
4.00
264.
4274
4.00
720.
0074
4.00
442.
4556
2.53
744.
0024
3.98
744.
00||
MB
TUs
GA
S||
71,5
7810
0,07
3||
8,54
43,
603
6,74
66,
196
19,0
0118
17,2
210
06,
163
05,
943
7,36
35,
637
4,03
7||
MB
TUs
PE
TCO
KE
||12
,359
,656
9,14
8,22
6||
753,
749
206,
871
692,
649
834,
198
1,01
8,43
91,
369,
951
336,
196
1,27
5,10
61,
423,
873
1,36
3,83
091
9,01
587
2,26
01,
164,
979
287,
891
1,49
3,91
9||
MB
TUs
CO
AL
||3,
584,
539
3,82
7,41
0||
330,
140
456,
087
314,
376
276,
083
282,
654
319,
583
142,
918
439,
302
358,
723
396,
922
266,
762
324,
247
306,
122
111,
618
359,
606
||TO
TAL
MB
TUs
||16
,016
,637
13,0
76,4
71||
1,09
2,46
766
6,56
21,
013,
771
1,11
6,47
61,
320,
094
1,68
9,55
249
6,33
41,
714,
408
1,78
2,59
61,
767,
066
1,18
5,77
71,
202,
591
1,47
8,71
640
5,35
91,
857,
668
||%
GA
S||
0.45
%0.
77%
||0.
78%
0.54
%0.
67%
0.55
%1.
44%
0.00
%3.
47%
0.00
%0.
00%
0.35
%0.
00%
0.49
%0.
50%
1.39
%0.
22%
||%
PE
TCO
KE
||77
.17%
69.9
6%||
69.0
0%31
.04%
68.3
2%74
.72%
77.1
5%81
.08%
67.7
4%74
.38%
79.8
8%77
.18%
77.5
0%72
.53%
78.7
8%71
.02%
80.4
2%||
% C
OA
L||
22.3
8%29
.27%
||30
.22%
68.4
2%31
.01%
24.7
3%21
.41%
18.9
2%28
.79%
25.6
2%20
.12%
22.4
6%22
.50%
26.9
6%20
.70%
27.5
4%19
.36%
||LO
AD
FA
CTO
R (G
RO
SS
)||
88.0
%90
.0%
||90
.7%
77.9
%84
.6%
88.9
%90
.8%
85.3
%75
.2%
89.0
%97
.0%
90.4
%94
.1%
84.0
%76
.5%
63.6
%97
.5%
||C
AP
AC
ITY
FA
CTO
R (G
RO
SS
)||
68.7
%55
.8%
||55
.3%
32.9
%51
.9%
58.9
%72
.4%
85.3
%23
.8%
89.0
%97
.0%
88.2
%55
.9%
62.7
%74
.5%
19.3
%95
.8%
||M
WH
s G
AS
||6,
725
7,74
3||
833
306
664
635
1,83
02
1,48
30
061
20
585
733
427
417
||M
WH
s P
ETC
OK
E||
1,28
1,22
392
8,73
4||
76,9
5818
,391
71,4
2689
,554
102,
734
140,
959
30,3
1313
5,84
115
6,95
114
1,92
787
,099
89,8
8912
1,40
222
,847
161,
708
||M
WH
s C
OA
L||
369,
948
385,
473
||33
,707
40,5
4632
,419
29,6
3828
,513
32,8
8312
,886
46,8
0039
,541
41,3
0625
,282
33,4
1431
,901
8,85
838
,925
||12
mth
rolli
ng C
AP
FA
CTO
R||
||32
.0%
34.7
%39
.1%
44.1
%49
.4%
56.2
%56
.5%
58.4
%62
.7%
67.1
%66
.2%
64.5
%66
.1%
65.0
%68
.7%
||||
||||
* * *
* * *
* * *
* * *
* ** *
* * *
* * *
* **
* * *
* * *
* * *
* * *
||* *
* * *
* * *
* * *
* *
* * *
* * *
* * *
||* *
* * *
* * *
* * *
* *
* * *
* * *
* * *
* * *
* * *
* * *
* * *
* * *
* * *
* * *
* * *
* * *
* * *
* * *
* *
* * *
* * *
* * *
* * *
* * *
* * *
* * *
* * *
* * *
* * *
* * *
* * *
* * *
* * *
* *
* * *
* * *
* * *
* * *
* * *
* * *
* * *
* * *
* * *
* * *
* * *
* * *
* * *
* * *
* *
* * *
* * *
* * *
* * *
* * *
* * *
* *
||ST
AC
K E
MIS
SIO
NS
DA
TA -
UN
IT 2
||||
||S
O2
Em
issi
ons,
Ton
s||
1,13
1.8
1,09
5.6
||12
3.5
131.
411
2.5
94.0
124.
911
7.1
34.4
83.3
82.4
125.
772
.277
.113
1.6
74.3
114.
8||
SO
2 E
mis
sion
s, lb
/MB
tu||
0.14
0.17
||0.
230.
390.
220.
170.
190.
140.
140.
100.
090.
140.
120.
130.
180.
370.
12||
NO
x E
mis
sion
s, T
ons
||52
5.5
492.
6||
30.5
46.7
24.8
38.1
51.9
48.5
27.4
51.8
66.4
43.7
37.3
34.1
29.3
28.4
68.6
||N
Ox
Em
issi
ons,
lb/M
btu
||0.
070.
08||
0.06
0.14
0.05
0.07
0.08
0.06
0.11
0.06
0.07
0.05
0.06
0.06
0.04
0.14
0.07
||P
artic
ulat
e M
atte
r, To
ns||
41.2
329
.72
||2.
191.
332.
035.
957.
012.
530.
762.
572.
674.
422.
963.
013.
701.
014.
64||
Par
ticul
ate
Mat
ter,
lb/M
btu
||0.
005
0.00
5||
0.00
40.
004
0.00
40.
011
0.01
10.
003
0.00
30.
003
0.00
30.
005
0.00
50.
005
0.00
50.
005
0.00
5||
CO
, Ton
s||
297.
329
0.6
||36
.736
.633
.427
.763
.229
.133
.927
.07.
418
.97.
316
.033
.914
.718
.2||
CO
, lb/
Mbt
u||
0.04
0.04
||0.
070.
110.
070.
050.
100.
030.
140.
030.
010.
020.
010.
030.
050.
070.
02||
CO
, lb/
hr||
8410
0||
147
204
137
107
216
7825
673
2151
3357
9112
149
||V
OC
, Ton
s||
11.9
211
.63
||1.
471.
461.
341.
112.
531.
161.
361.
080.
290.
760.
290.
641.
400.
600.
70||
VO
C, l
b/M
btu
||0.
001
0.00
2||
0.00
30.
004
0.00
30.
002
0.00
40.
001
0.00
50.
001
0.00
00.
001
0.00
00.
001
0.00
20.
003
0.00
1||
VO
C, l
b/hr
||3.
44.
0||
5.9
8.1
5.5
4.3
8.6
3.1
10.3
2.9
0.8
2.0
1.3
2.3
3.8
4.9
1.9
||||
||||
||||
||* *
* * *
* * *
* * *
* * *
* * *
* * *
* * *
** *
* * *
* * *
* * *
* *||
* * *
* * *
* * *
* * *
* * *
* * *
* * *
* ||
* * *
* * *
* * *
* * *
* * *
* * *
* * *
* * *
* * *
* * *
* * *
* *
* * *
* * *
* * *
* * *
* * *
* * *
* * *
* * *
* * *
* * *
* * *
* * *
* * *
* * *
* *
* * *
* * *
* * *
* * *
* * *
* * *
* * *
* * *
* * *
* * *
* * *
* * *
* * *
* * *
* *
* * *
* * *
* * *
* * *
* * *
* * *
* * *
* * *
* * *
* * *
* * *
* * *
* * *
* * *
||
GA
DS
DA
TA||
||||
Equ
ival
ent A
vaila
bilit
y Fa
ctor
, EA
F, %
||72
.8%
58.7
%||
Inco
mpl
Dat
aIn
com
pl D
ata
Inco
mpl
Dat
a63
.90%
78.7
0%86
.82%
29.6
5%93
.40%
99.7
6%94
.35%
57.2
2%68
.13%
77.2
4%27
.06%
97.5
8%||
||||
||||
||||
* * *
* * *
* * *
* * *
* ** *
* * *
* * *
* **
* * *
* * *
* * *
* * *
||* *
* * *
* * *
* * *
* *
* * *
* * *
* * *
||* *
* * *
* * *
* * *
* *
* * *
* * *
* * *
* * *
* * *
* * *
* * *
* * *
* * *
* * *
* * *
* * *
* * *
* * *
* *
* * *
* * *
* * *
* * *
* * *
* * *
* * *
* * *
* * *
* * *
* * *
* * *
* * *
* * *
* *
* * *
* * *
* * *
* * *
* * *
* * *
* * *
* * *
* * *
* * *
* * *
* * *
* * *
* * *
* *
* * *
* * *
* * *
* * *
* * *
* * *
* *
NS
2 O
per D
ata
Pag
e 1
of 4
BV
Pro
ject
140
895

JEA
Lar
ge-S
cale
CFB
Com
bust
ion
Dem
onst
ratio
n P
roje
ctFi
nal T
echn
ical
Rep
ort
Nor
thsi
de U
nit 2
Ope
ratin
g D
ata
Oct
ober
200
2 th
ru D
ecem
ber 2
004
||FI
LE: (
0)JE
AD
ATA
DR
AK
E||
||||
||||
||||
CA
LEN
DA
R
2003
CA
LEN
DA
R
2004
||O
ct-0
2N
ov-0
2D
ec-0
2Ja
n-03
Feb-
03M
ar-0
3A
pr-0
3M
ay-0
3Ju
n-03
Jul-0
3A
ug-0
3Se
p-03
Oct
-03
Nov
-03
Dec
-03
||||
||.
..
..
..
..
..
..
..
||W
ATE
R A
ND
WA
STEW
ATE
R F
LOW
S (U
NIT
S 1,
2, A
ND
3)
||||
Sur
face
Wat
er, M
illio
n G
allo
ns||
285,
493
278,
776
||23
,193
21,6
1923
,879
25,1
3015
,194
24,0
1320
,190
22,8
4326
,600
27,3
9625
,980
25,5
0326
,945
21,2
9024
,409
||G
roun
d W
ater
, Mill
ion
Gal
lons
||19
3.6
215.
7||
15.7
17.7
18.3
18.0
15.4
17.8
15.6
14.8
14.0
17.9
17.2
18.2
14.2
15.3
15.2
||R
euse
Wat
er, M
illio
n G
allo
ns||
276.
825
4.5
||14
.72.
413
.919
.422
.119
.822
.930
.336
.71.
10.
015
.152
.450
.76.
4||
CW
TS In
fluen
t, M
illio
n G
allo
ns||
106.
521
9.5
||N
ot A
vaila
ble
Not
Ava
ilabl
eN
ot A
vaila
ble
Not
Ava
ilabl
eN
ot A
vaila
ble
Not
Ava
ilabl
eN
ot A
vaila
ble
Not
Ava
ilabl
e18
.118
.316
.916
.516
.511
.19.
2||
Per
c P
onds
to D
istri
ct II
, Mill
ion
Gal
||46
.348
.2||
Not
Ava
ilabl
eN
ot A
vaila
ble
Not
Ava
ilabl
e8.
18.
18.
90.
30.
33.
44.
34.
92.
51.
21.
23.
0||
||||
||* *
* * *
* * *
* * *
* * *
* * *
* * *
* * *
** *
* * *
* * *
* * *
* *||
* * *
* * *
* * *
* * *
* * *
* * *
* * *
* ||
* * *
* * *
* * *
* * *
* * *
* * *
* * *
* * *
* * *
* * *
* * *
* *
* * *
* * *
* * *
* * *
* * *
* * *
* * *
* * *
* * *
* * *
* * *
* * *
* * *
* * *
* *
* * *
* * *
* * *
* * *
* * *
* * *
* * *
* * *
* * *
* * *
* * *
* * *
* * *
* * *
* *
* * *
* * *
* * *
* * *
* * *
* * *
* * *
* * *
* * *
* * *
* * *
* * *
* * *
* * *
||
ASH
PR
OD
UC
TIO
N R
ATE
S||
||||
Tota
l Bed
Ash
, Ton
s, U
nits
1 a
nd 2
||31
2,40
019
5,43
9||
||To
tal F
ly A
sh, T
ons,
Uni
ts 1
and
2||
179,
700
153,
623
||||
Uni
t 2 P
ortio
n of
Bed
Ash
, Ton
s||
153,
236
96,5
15||
||U
nit 2
Por
tion
of F
ly A
sh, T
ons
||88
,145
75,8
65||
||B
ypro
duct
Sal
es, T
ons
||0
38,3
12||
||||
||||
* * *
* * *
* * *
* * *
* ** *
* * *
* * *
* **
* * *
* * *
* * *
* * *
||* *
* * *
* * *
* * *
* *
* * *
* * *
* * *
||* *
* * *
* * *
* * *
* *
* * *
* * *
* * *
* * *
* * *
* * *
* * *
* * *
* * *
* * *
* * *
* * *
* * *
* * *
* *
* * *
* * *
* * *
* * *
* * *
* * *
* * *
* * *
* * *
* * *
* * *
* * *
* * *
* * *
* *
* * *
* * *
* * *
* * *
* * *
* * *
* * *
* * *
* * *
* * *
* * *
* * *
* * *
* * *
* *
* * *
* * *
* * *
* * *
* * *
* * *
* *
||||
||||
- - -
- - -
- -- -
- - -
- - -
- -
- - -
- - -
- - -
- - -
-- - -
- - -
- - -
- - -
- - -
- -
||- -
- - -
- - -
- - -
- - -
- - -
- - -
- - -
- ||
- - -
- - -
- - -
- - -
- - -
- - -
- - -
- - -
- - -
- - -
- - -
- - -
- - -
- - -
- - -
- - -
- - -
- - -
- - -
- - -
- - -
- - -
- - -
- - -
- - -
- - -
- - -
- - -
- - -
- - -
- - -
- - -
- - -
- - -
- - -
- - -
- - -
- - -
- - -
- - -
- - -
- - -
- - -
- - -
- - -
- - -
- - -
- - -
- - -
- - -
- - -
- - -
- - -
- - -
- - -
- - -
- - -
- - -
- - -
- - -
||FU
EL C
OST
S (n
omin
al) $
/mm
BTU
||||
||G
AS
||6.
236.
66||
4.82
4.81
5.49
6.14
7.80
7.15
6.06
6.55
6.61
5.82
5.75
5.41
5.41
5.13
6.89
||N
S P
ETC
OK
E||
0.71
0.91
||0.
410.
470.
490.
850.
550.
970.
300.
730.
710.
970.
600.
730.
700.
700.
71||
NS
CO
AL
||1.
612.
41||
1.79
1.75
1.66
1.50
1.50
1.46
1.46
1.46
1.67
1.66
1.67
1.60
1.75
1.80
1.83
||N
S L
IME
STO
NE
$/to
n||
||10
.125
10.1
2510
.125
10.1
2510
.125
10.1
2510
.125
10.1
2510
.125
10.1
2510
.125
10.1
2510
.125
10.1
2510
.125
||||
||||
* * *
* * *
* * *
* * *
* ** *
* * *
* * *
* **
* * *
* * *
* * *
* * *
||* *
* * *
* * *
* * *
* *
* * *
* * *
* * *
||* *
* * *
* * *
* * *
* *
* * *
* * *
* * *
* * *
* * *
* * *
* * *
* * *
* * *
* * *
* * *
* * *
* * *
* * *
* *
* * *
* * *
* * *
* * *
* * *
* * *
* * *
* * *
* * *
* * *
* * *
* * *
* * *
* * *
* *
* * *
* * *
* * *
* * *
* * *
* * *
* * *
* * *
* * *
* * *
* * *
* * *
* * *
* * *
* *
* * *
* * *
* * *
* * *
* * *
* * *
* *
NS
2 O
per D
ata
Pag
e 2
of 4
BV
Pro
ject
140
895

JEA
Lar
ge-S
cale
CFB
Com
bust
ion
Dem
onst
ratio
n P
roje
ctFi
nal T
echn
ical
Rep
ort
Nor
thsi
de U
nit 2
Ope
ratin
g D
ata
Oct
ober
200
2 th
ru D
ecem
ber 2
004
||FI
LE: (
0)JE
AD
ATA
DR
AK
E|| || || ||
FUEL
HEA
T C
ON
TEN
T||
NS
-2P
ETC
OK
EH
EA
T C
ON
TEN
T-B
TU/L
B||
NS
-2C
OA
LH
EA
T C
ON
TEN
T-B
TU/L
B|| ||
NS
-2P
ETC
OK
E%
S||
NS
-2C
OA
L%
S|| ||
NS
-2P
ETC
OK
E%
ash
||N
S-2
CO
AL
%as
h||
* * *
* * *
* * *
* * *
* ** *
* * *
* * *
* **
* * *
* * *
* * *
* * *
||N
S-2
OPE
R D
ATA
(GR
OS
S C
AP
)29
7.5
||G
RO
SS
MW
H G
EN
ER
ATE
D||
HO
US
E L
OA
D M
WH
(ON
-LIN
E)
||N
ET
MW
H (O
N-L
INE
)||
GA
S O
N-L
INE
(KC
F)||
PE
TCO
KE
ON
-LIN
E (T
ON
S)
||C
OA
L O
N-L
INE
(TO
NS
)||
LIM
ES
TON
E||
HE
AT
CO
NTE
NT
- GA
S||
HE
AT
CO
NTE
NT
- PE
TCO
KE
||H
EA
T C
ON
TEN
T - C
OA
L||
HE
AT
RA
TE (O
/L) (
BTU
/KW
H, N
ET)
||A
TTE
MP
TED
STA
RTS
||S
TAR
TS||
HO
UR
S O
NLI
NE
||C
OM
BU
STI
ON
HO
UR
S||
MB
TUs
GA
S||
MB
TUs
PE
TCO
KE
||M
BTU
s C
OA
L||
TOTA
L M
BTU
s||
% G
AS
||%
PE
TCO
KE
||%
CO
AL
||LO
AD
FA
CTO
R (G
RO
SS
)||
CA
PA
CIT
Y F
AC
TOR
(GR
OS
S)
||M
WH
s G
AS
||M
WH
s P
ETC
OK
E||
MW
Hs
CO
AL
||12
mth
rolli
ng C
AP
FA
CTO
R|| ||
* * *
* * *
* * *
* * *
* ** *
* * *
* * *
* **
* * *
* * *
* * *
* * *
||ST
AC
K E
MIS
SIO
NS
DA
TA -
UN
IT 2
||S
O2
Em
issi
ons,
Ton
s||
SO
2 E
mis
sion
s, lb
/MB
tu||
NO
x E
mis
sion
s, T
ons
||N
Ox
Em
issi
ons,
lb/M
btu
||P
artic
ulat
e M
atte
r, To
ns||
Par
ticul
ate
Mat
ter,
lb/M
btu
||C
O, T
ons
||C
O, l
b/M
btu
||C
O, l
b/hr
||V
OC
, Ton
s||
VO
C, l
b/M
btu
||V
OC
, lb/
hr|| || ||
* * *
* * *
* * *
* * *
* ** *
* * *
* * *
* **
* * *
* * *
* * *
* * *
||G
AD
S D
ATA
||E
quiv
alen
t Ava
ilabi
lity
Fact
or, E
AF,
%|| || ||
* * *
* * *
* * *
* * *
* ** *
* * *
* * *
* **
* * *
* * *
* * *
* * *
|| ||
Jan-
04Fe
b-04
Mar
-04
Apr
-04
May
-04
Jun-
04Ju
l-04
Aug
-04
Sep-
04O
ct-0
4N
ov-0
4D
ec-0
4||
..
..
..
..
..
.||
..
.||
14,0
5613
,879
14,0
9214
,092
14,1
8914
,182
13,6
3614
,155
13,6
8214
,015
13,8
7413
,874
||12
,143
12,4
7812
,749
12,7
4911
,045
11,6
5512
,211
11,3
2411
,662
12,3
9912
,012
12,1
38||
..
..
..
..
..
..
||3.
753.
914.
044.
043.
675.
364.
454.
946.
143.
826.
144.
03||
2.93
3.23
2.98
2.98
2.77
2.64
2.71
0.62
3.01
2.68
2.26
2.66
||.
..
..
..
..
..
.||
0.17
0.91
0.92
0.92
0.53
0.24
0.45
0.76
1.00
1.43
0.93
0.27
||7.
307.
517.
817.
817.
1713
.11
10.0
67.
358.
958.
8610
.09
9.73
||* *
* * *
* * *
* * *
* *
* * *
* * *
* * *
* * *
* * *
* * *
* * *
* * *
* * *
* * *
* * *
* * *
* * *
* * *
* *
* * *
* * *
* * *
* * *
* * *
* * *
* * *
* * *
* * *
* * *
* * *
* * *
* * *
* * *
* *
* * *
* * *
* * *
* * *
* * *
* * *
* * *
* * *
* * *
* * *
* ||
297.
529
7.5
297.
529
7.5
297.
529
7.5
297.
529
7.5
297.
529
7.5
297.
529
7.5
||19
7,87
454
,281
71,5
950
141,
806
87,4
0516
7,50
620
9,45
819
6,51
915
8,75
047
017
3,68
7||
14,3
604,
381
5,99
10
10,1
137,
305
9,60
914
,151
14,3
3310
,831
1610
,834
||18
3,51
449
,900
65,6
040
131,
693
80,1
0015
7,89
719
5,30
718
2,18
614
7,91
945
416
2,85
3||
029
169
30
3,16
62,
409
00
020
23,
022
0||
27,0
9212
,565
16,1
290
32,9
717,
829
39,4
6753
,336
52,2
8939
,700
305
44,7
31||
39,3
505,
357
7,98
10
11,6
5325
,811
15,3
9114
,239
15,8
4310
,386
322
13,2
70||
24,0
817,
176
8,29
60
14,2
2511
,786
21,0
1526
,451
25,8
4017
,876
492
23,3
06||
1,05
51,
050
1,04
91,
050
1,05
61,
049
1,05
41,
054
1,05
21,
052
1,05
31,
048
||14
,056
13,8
7914
,092
14,0
9214
,189
14,1
8213
,636
14,1
5513
,682
14,0
1513
,874
13,8
74||
12,1
4312
,478
12,7
4912
,749
11,0
4511
,655
12,2
1111
,324
11,6
6212
,399
12,0
1212
,138
||9,
358
9,67
510
,042
09,
085
10,3
169,
197
9,38
29,
882
9,26
642
,696
9,59
9||
24
60
52
51
00
24
||2
00
00
00
10
02
4||
714.
0222
7.15
308.
030.
0050
8.83
383.
0860
4.00
725.
8372
0.00
623.
626.
1362
8.93
||74
4.00
240.
9239
9.12
0.00
586.
2241
7.23
643.
2774
4.00
720.
0062
5.62
70.3
264
8.42
||0
4,78
117
,453
024
,431
13,7
0512
,349
3,07
50
458
17,7
266,
096
||76
1,61
235
6,30
446
0,80
90
940,
229
223,
116
1,08
7,37
11,
511,
364
1,43
0,88
01,
113,
215
12,3
761,
250,
950
||95
5,65
013
6,58
020
6,27
50
258,
681
604,
522
379,
744
322,
809
369,
503
257,
642
11,3
1532
4,69
0||
1,71
7,26
249
7,66
568
4,65
90
1,22
3,61
284
1,49
81,
479,
545
1,83
7,24
71,
800,
383
1,37
1,32
341
,417
1,58
1,86
0||
0.00
%0.
96%
2.55
%0.
00%
2.00
%1.
63%
0.83
%0.
17%
0.00
%0.
03%
42.8
0%0.
39%
||44
.35%
71.6
0%67
.30%
0.00
%76
.84%
26.5
1%73
.49%
82.2
6%79
.48%
81.1
8%29
.88%
79.0
8%||
55.6
5%27
.44%
30.1
3%0.
00%
21.1
4%71
.84%
25.6
7%17
.57%
20.5
2%18
.79%
27.3
2%20
.53%
||93
.2%
80.3
%78
.1%
0.0%
93.7
%76
.7%
93.2
%97
.0%
91.7
%85
.6%
25.8
%92
.8%
||89
.4%
26.2
%32
.3%
0.0%
64.1
%40
.8%
75.7
%94
.6%
91.7
%71
.7%
0.2%
78.5
%||
041
21,
472
02,
463
1,19
01,
250
312
046
059
80
81,2
2732
,143
40,7
03-7
,230
99,2
5820
,290
115,
264
160,
399
144,
795
118,
410
-4,9
7512
8,45
0||
101,
921
12,3
2118
,220
027
,308
54,9
7540
,254
34,2
5937
,391
27,4
05-1
,921
33,3
40||
71.3
%67
.7%
63.2
%0.
0%59
.1%
54.5
%53
.5%
56.7
%59
.1%
58.9
%57
.3%
55.8
%|| ||
* * *
* * *
* * *
* * *
* * *
* * *
* * *
* * *
* * *
* * *
* * *
* *
* * *
* * *
* * *
* * *
* * *
* * *
* * *
* * *
* * *
* * *
* * *
* * *
* * *
* * *
* *
* * *
* * *
* * *
* * *
* * *
* * *
* * *
* * *
* * *
* * *
* * *
* * *
* * *
* * *
* *
* * *
* * *
* * *
|| ||11
6.4
29.4
86.3
0.0
87.7
58.6
93.1
110.
523
4.2
110.
416
.115
2.9
||0.
140.
120.
250.
000.
140.
140.
130.
120.
260.
160.
780.
19||
69.8
26.5
29.5
0.0
46.6
29.9
55.0
68.6
55.7
41.5
4.0
65.5
||0.
080.
110.
090.
000.
080.
070.
070.
070.
060.
060.
190.
08||
4.29
1.00
1.38
0.00
3.06
2.10
3.70
4.59
3.60
2.74
0.09
3.17
||0.
005
0.00
40.
004
0.00
00.
005
0.00
50.
005
0.00
50.
004
0.00
40.
004
0.00
4||
61.6
10.5
41.1
0.0
30.7
39.1
46.5
17.3
7.8
6.4
8.4
21.2
||0.
070.
040.
120.
000.
050.
090.
060.
020.
010.
010.
410.
03||
166
8720
60
105
187
145
4722
2023
965
||2.
460.
421.
640.
001.
231.
571.
860.
690.
310.
260.
340.
85||
0.00
30.
002
0.00
50.
000
0.00
20.
004
0.00
30.
001
0.00
00.
000
0.01
60.
001
||6.
63.
58.
20.
04.
27.
55.
81.
90.
90.
89.
72.
6|| || ||
* * *
* * *
* * *
* * *
* * *
* * *
* * *
* * *
* * *
* * *
* * *
* *
* * *
* * *
* * *
* * *
* * *
* * *
* * *
* * *
* * *
* * *
* * *
* * *
* * *
* * *
* *
* * *
* * *
* * *
* * *
* * *
* * *
* * *
* * *
* * *
* * *
* * *
* * *
* * *
* * *
* *
* * *
* * *
* * *
|| ||94
.73%
27.4
4%38
.55%
0.00
%68
.12%
44.0
9%79
.41%
96.6
5%94
.53%
76.0
7%0.
43%
83.7
9%|| || ||
* * *
* * *
* * *
* * *
* * *
* * *
* * *
* * *
* * *
* * *
* * *
* *
* * *
* * *
* * *
* * *
* * *
* * *
* * *
* * *
* * *
* * *
* * *
* * *
* * *
* * *
* *
* * *
* * *
* * *
* * *
* * *
* * *
* * *
* * *
* * *
* * *
* * *
* * *
* * *
* * *
* *
* * *
* * *
* * *
||
NS
2 O
per D
ata
Pag
e 3
of 4
BV
Pro
ject
140
895

JEA
Lar
ge-S
cale
CFB
Com
bust
ion
Dem
onst
ratio
n P
roje
ctFi
nal T
echn
ical
Rep
ort
Nor
thsi
de U
nit 2
Ope
ratin
g D
ata
Oct
ober
200
2 th
ru D
ecem
ber 2
004
||FI
LE: (
0)JE
AD
ATA
DR
AK
E|| || || ||
WA
TER
AN
D W
AST
EWA
TER
FLO
WS
(UN
ITS
1, 2
, AN
D 3
)||
Sur
face
Wat
er, M
illio
n G
allo
ns||
Gro
und
Wat
er, M
illio
n G
allo
ns||
Reu
se W
ater
, Mill
ion
Gal
lons
||C
WTS
Influ
ent,
Mill
ion
Gal
lons
||P
erc
Pon
ds to
Dis
trict
II, M
illio
n G
al|| ||
* * *
* * *
* * *
* * *
* ** *
* * *
* * *
* **
* * *
* * *
* * *
* * *
||A
SH P
RO
DU
CTI
ON
RA
TES
||To
tal B
ed A
sh, T
ons,
Uni
ts 1
and
2||
Tota
l Fly
Ash
, Ton
s, U
nits
1 a
nd 2
||U
nit 2
Por
tion
of B
ed A
sh, T
ons
||U
nit 2
Por
tion
of F
ly A
sh, T
ons
||B
ypro
duct
Sal
es, T
ons
|| ||* *
* * *
* * *
* * *
* * *
* * *
* * *
* * *
** *
* * *
* * *
* * *
* *|| ||
- - -
- - -
- -- -
- - -
- - -
- -
- - -
- - -
- - -
- - -
-- - -
- - -
- - -
- - -
- - -
- -
||FU
EL C
OST
S (n
omin
al) $
/mm
BTU
||G
AS
||N
S P
ETC
OK
E||
NS
CO
AL
||N
S L
IME
STO
NE
$/to
n|| ||
* * *
* * *
* * *
* * *
* ** *
* * *
* * *
* **
* * *
* * *
* * *
* * *
|| ||
Jan-
04Fe
b-04
Mar
-04
Apr
-04
May
-04
Jun-
04Ju
l-04
Aug
-04
Sep-
04O
ct-0
4N
ov-0
4D
ec-0
4||
..
..
..
..
..
.|| ||
25,4
3022
,265
26,3
0820
,589
24,7
6425
,420
26,9
6426
,827
25,9
3824
,180
12,7
4717
,344
||20
.919
.820
.819
.625
.021
.121
.411
.913
.714
.412
.414
.6||
0.0
0.0
0.0
12.5
27.4
15.6
26.3
39.5
34.0
35.6
31.7
31.9
||12
.612
.814
.315
.019
.019
.614
.618
.722
.530
.920
.019
.3||
1.9
2.8
2.4
1.3
2.2
4.3
5.5
4.2
5.8
6.1
5.8
6.0
|| ||* *
* * *
* * *
* * *
* *
* * *
* * *
* * *
* * *
* * *
* * *
* * *
* * *
* * *
* * *
* * *
* * *
* * *
* * *
* *
* * *
* * *
* * *
* * *
* * *
* * *
* * *
* * *
* * *
* * *
* * *
* * *
* * *
* * *
* *
* * *
* * *
* * *
* * *
* * *
* * *
* * *
* * *
* * *
* * *
* || || || || || || || ||
* * *
* * *
* * *
* * *
* * *
* * *
* * *
* * *
* * *
* * *
* * *
* *
* * *
* * *
* * *
* * *
* * *
* * *
* * *
* * *
* * *
* * *
* * *
* * *
* * *
* * *
* *
* * *
* * *
* * *
* * *
* * *
* * *
* * *
* * *
* * *
* * *
* * *
* * *
* * *
* * *
* *
* * *
* * *
* * *
|| ||- -
- - -
- - -
- - -
- - -
- - -
- - -
- - -
- - -
- - -
- - -
- - -
- - -
- - -
- - -
- - -
- - -
- - -
- - -
- - -
- - -
- - -
- - -
- - -
- - -
- - -
- - -
- - -
- - -
- - -
- - -
- - -
- - -
- - -
- - -
- - -
- - -
- - -
- - -
- - -
- - -
- - -
- - -
- - -
- - -
- - -
- - -
- - -
- || ||
6.81
6.15
6.13
6.49
7.10
7.08
6.76
6.24
5.79
7.15
6.75
7.51
||0.
740.
700.
750.
810.
740.
690.
801.
041.
051.
091.
191.
37||
1.86
2.09
2.36
2.37
2.37
2.37
2.38
2.40
2.66
2.70
2.66
2.70
||10
.125
10.1
2510
.125
10.1
2510
.125
10.1
2510
.125
10.1
2510
.125
10.1
2510
.125
10.1
25|| ||
* * *
* * *
* * *
* * *
* * *
* * *
* * *
* * *
* * *
* * *
* * *
* *
* * *
* * *
* * *
* * *
* * *
* * *
* * *
* * *
* * *
* * *
* * *
* * *
* * *
* * *
* *
* * *
* * *
* * *
* * *
* * *
* * *
* * *
* * *
* * *
* * *
* * *
* * *
* * *
* * *
* *
* * *
* * *
* * *
||
NS
2 O
per D
ata
Pag
e 4
of 4
BV
Pro
ject
140
895

JEA Large-Scale CFB Combustion Demonstration Project
Final Technical Report Appendix D p-1
B&V Project 140895
APPENDIX D - Capital Cost Data

JEA NORTHSIDE REPOWERING PROJECT
Capital Cost Summary by WBS
UNIT 2 DOE Phase Task WBS Actual Costs
1B - DesignProject Management and Support 2.1.11 3,164,454 Permitting 2.1.12 2,390,444 Preliminary Design 2.1.13 2,175,695 Engineering/Detailed Design 2.1.14 23,371,293
Unit 2 - Subtotal 1B Design $31,101,886
2 - Construction and Start-up
Project Management and Support 2.2.21 5,826,510 Environmental Monitoring 2.2.22 29,871 Boiler Equip/AQCS 2.2.23 119,043,822 Balance of Plant Equipment 2.2.24 35,070,257 Turbine/Generator Refurbishment & Upgrade 2.2.26 15,588,735
Unit 2 - Subtotal Construction and Start-up $175,559,195
COMMON DOE Phase Task WBS 50% of Actual
Costs
1B - DesignEngineering/Detailed Design 3.1.14 2,932,126
Common - Subtotal Engineering/Detail Design $2,932,126
2 - Construction and Start-up
Project Management and Support 3.2.21 20,294,905 Environmental Monitoring 3.2.22 115,751 Boiler Equip/AQCS 3.2.23 9,141,358 Balance of Plant Equipment 3.2.24 29,254,424 Fuel Handling Equipment 3.2.25 52,992,980
Common - Subtotal Construction and Start-up $111,799,417
TOTAL CAPITAL COST (Unit 2 Plus 50% of Common) $321,392,624
Unit 2 and 50% of Common
Capital Cost Summary by WBS Page 1 of 1

JEA NORTHSIDE REPOWERING PROJECT
Capital Cost Breakdown by Work PackageUnit 2
Unit 2 DOE Phase/Task Work Package Actual Costs
1B - Design
Project Management and Support PLANT MANAGEMENT 37,331ENGINEERING 845PROJECT MANAGEMENT 1,403,425I S MATERIAL 12,651LEGAL SERVICES 1,129,981FINANCE COSTS 499,676TRAVEL & TRAINING 80,545
3,164,454
Permitting PERMITTING 189,857PERMITTING 2,200,587
2,390,444
Preliminary Design PLANT MANAGEMENT 65,106ENGINEERING 124,447PRELIMINARY TESTING 227,972PLANT SERV. MTL & LABOR 10,835PRELIM. DESIGN 1,747,335
2,175,695
Engineering / Detail Design STRUCT. & IMPVT`S 1,131,857JEA PROVIDED SERVICES 19,150BOILER PLANT EQUIP. 11,493,344PLANT MANAGEMENT 8,724ENGINEERING 74,480TURBOGENERATOR UNITS 1,810,971
Engineering / Detail Design ACCESSORY ELECT. EQUIP. 8,832,76723,371,293
Unit 2 - Subtotal 1B Design $31,101,886
2 - Construction and StartupProject Management and Support PLANT MANAGEMENT 26,465
PROJECT MANAGEMENT 174,078JEA PROVIDED SERVICES 19,874INSURANCE 3,479,225CONST. MGMT 2,099,238TRAVEL & TRAINING 27,630
5,826,510
Environmental Monitoring ENVIRON. MON. 29,87129,871
Boiler Equipment / AQCS PLANT SERV. MTL & LABOR 2,404CONCRETE STACK 1,330,358AQCS 12,928,202ASH HANDLING SYSTEM 2,928,044
Unit 2 Capital Costs Page 1 of 5

JEA NORTHSIDE REPOWERING PROJECT
Capital Cost Breakdown by Work PackageUnit 2
Unit 2 DOE Phase/Task Work Package Actual Costs
C F B BOILER SUPPLY 47,112,999CFB BOILER ERECTION 13,612,635JEA PROVIDED SERVICES 95,348CSA 5,392,566BOP EQUIPMENT (FW) 10,516,441CONSTRUCTION INDIRECTS 15,194,347START-UP SUPPORT 1,990,845ELECTRICAL 5,176,185AUTOMATION & CONTROLS 2,763,448
119,043,822
Balance of Plant Equipment PLANT SERV. MTL & LABOR 3,341FIRE PROTECTION 929,251CONTROL ROOM MOD. 399,372PAINTING 183,114BOILER FEED PUMPS 367,677CONDENSATE POLISHERS 1,476,989CYCLE CHEM FEED EQUIP 169,780DEAERATOR 800,365FEEDWATER HEATERS 1,025,372WATER SAMPLE RACK 32,091BULK INSULATION 609,114JEA PROVIDED SERVICES 21,992BFP FLUID DRIVE 1,166,221CIVIL ZCC #5032 216CSA 680,520EQUIP. INSPECTION 34,750SYSTEM TESTING 114,951CONSTRUCTION INDIRECTS 132,846EQUIPMENT RENTAL 653,109OTHER PROC. & CONST. 51,141CIRC. WATER PUMPS 2,072,940CC WATER HEAT EXCHANGER 19,207CONDENSATE PUMPS 15,197VACUUM PUMPS 146,046CONDENSER 2,761,842CONDENSER CLEANING SYS. 122,346BW PUMP MOTORS 4,423FILL PUMP 4,428GEN. SERVICE PUMPS 271,188PIPING & VALVES 7,249,577TRAVELING SCREENS 540,223VOID GROUTING 39,031COND. BOOSTER PUMPS 97,818COND. BSTR PUMP FLUID DRIVE 11,860CCW SURGE TANK & PIPING 570,744CIRC WATER PUMP STRUCT. 15,491NEW PUMP MTR. PROC. & INST 772,433MED. VOLT. SWITCHGEAR 621,466
Unit 2 Capital Costs Page 2 of 5

JEA NORTHSIDE REPOWERING PROJECT
Capital Cost Breakdown by Work PackageUnit 2
Unit 2 DOE Phase/Task Work Package Actual Costs
5 kV BUS DUCT REFURB. 31,247CATHODIC PROTECTION 470,104DCS 2,129,791LOW VOLTAGE SWITCHGEAR 556,629480V MCC & PWR PANEL REPL 470,525NON-SEG PHASE BUS DUCT 310,272PROTECTION CIRCUIT SYSTEM 5,272TRANSFORMERS 116,507BULK INSTR. & CONTROLS 371,798BATTERIES 10,596UNIT 1&2 ELECT. SEPARATION 190,486CTRL RM PANEL & INSTR. MODS 523,376RACEWAY & CONDUIT 3,037,166POWER & CONTROL CABLE 1,675,222MISCELLANEOUS ELECTRICAL 982,794
35,070,257
Turbine Generator Refurb./Upgrade PLANT SERV. MTL & LABOR 1,931JEA PROVIDED SERVICES 97,974CONSTRUCTION INDIRECTS 167,074TURBINE 15,321,756
15,588,735
Unit 2 - Subtotal Construction and Startup $175,559,195
TOTAL CAPITAL COST (Unit 2) $206,661,081
Unit 2 Capital Costs Page 3 of 5

JEA NORTHSIDE REPOWERING PROJECT
Capital Cost Breakdown by Work Package50% of Common
COMMON DOE Phase/Task Work Package50% of Actual
Costs
1B - Design
Engineering / Detail Design ENGINEERING 191,377STRUCT. & IMPVT`S 172,113BOILER PLANT EQUIP. 1,905,449TURBOGENERATOR UNITS 82
Engineering / Detail Design ACCESSORY ELECT. EQUIP. 663,107
2,932,127
Common - Subtotal Engineering/Detail Design $2,932,127
2 - Construction and Startup
Project Management and Support PLANT MANAGEMENT 5,937CONST. MGMT 10,635,958INSURANCE 1,749,871PROJECT MANAGEMENT 299,202START-UP SUPPORT 7,549,330TRAVEL & TRAINING 54,609
20,294,905
Environmental Monitoring ENVIRON. MON. 114,131ENVIRON. MON. 1,620
115,751
Boiler Equipment / AQCS PLANT SERV. MTL & LABOR 933LIMESTONE PREP SYSTEM 6,535,510CFB BOILER ERECTION 442,793CSA 224,690CONSTRUCTION INDIRECTS 760,917ELECTRICAL 215,675MED. VOLT. SWITCHGEAR 307,524LOW VOLTAGE SWITCHGEAR 179,706480V MCC & PWR PANEL REPL 243,841NON-SEG PHASE BUS DUCT 139,056TRANSFORMERS 90,716
9,141,358
Balance of Plant Equipment PLANT SERV. MTL & LABOR 24,068SPARE PARTS 45,021FIRE PROTECTION 37,277PAINTING 685AIR DRYER 2,823,353ASH HANDLING CONVEYORS 2,884,203ASH STG. & UNLOADING 3,717,055
50% of Common Capital Costs Page 4 of 5

JEA NORTHSIDE REPOWERING PROJECT
Capital Cost Breakdown by Work Package50% of Common
COMMON DOE Phase/Task Work Package50% of Actual
Costs
REUSE WATER TRT`MT SYS. 474,439HYPOCHLORITE PIPING & TKS. 80,008CIVIL ZCC #5032 4,621,165CSA 1,038,510CONSTRUCTION INDIRECTS 8,751,601EQUIPMENT RENTAL 1,091,349OTHER PROC. & CONST. 2,660,811CIRC. WATER PUMPS 4,217FUEL OIL TRF. PUMPS 82,870PIPING & VALVES 835,876MED. VOLT. SWITCHGEAR 123,172LOW VOLTAGE SWITCHGEAR 7,055480V MCC & PWR PANEL REPL 36,593TRANSFORMERS 76,144RACEWAY & CONDUIT -521,146POWER & CONTROL CABLE 266,058MISCELLANEOUS ELECTRICAL 94,045
29,254,424
Fuel Handling Equipment LAND PURCHASES 322,365SHIP UNLOADER 4,573,600UNLOADING DOCK 6,785,740FIRE PROTECTION 582,371MHS CONVEYORS 9,397,439JEA PROVIDED SERVICES 29,949FUEL STORAGE DOMES 4,929,191STACKER/RECLAIMER 2,846,066CSA 126,387MHS TRANSFER TOWERS 6,445,708CONSTRUCTION INDIRECTS 14,676,079OTHER PROC. & CONST. 291,123PIPING & VALVES 2,947MED. VOLT. SWITCHGEAR 556,775DCS 32,220RACEWAY & CONDUIT 32,748POWER & CONTROL CABLE 1,215,400MISCELLANEOUS ELECTRICAL 146,878
52,992,980
Common - Subtotal Construction and Startup $111,799,417
TOTAL CAPITAL COST (50% of Common) $114,731,543
50% of Common Capital Costs Page 5 of 5

JEA
NO
RTH
SID
E R
EPO
WER
ING
PR
OJE
CT
Phas
e 1
Cap
ital I
mpr
ovem
ent P
roje
cts
ITEM
#Pr
ojec
t Des
crip
tion
Act
ual C
osts
1Li
mes
tone
Fee
d S
yste
m M
odifi
catio
ns to
Impr
ove
Flow
and
Sta
biliz
e Fe
ed R
ate
96,1
022
Upg
rade
Lim
esto
ne T
rans
port
to D
esig
n C
apac
ity1,
311,
310
3Im
prov
e R
elia
bilit
y an
d D
ryin
g C
apab
ility
of L
imes
tone
Pre
para
tion
Sys
tem
146,
817
4M
odifi
catio
ns to
Impr
ove
Silo
Flo
w40
,998
5D
istri
bute
d C
ontro
l Sys
tem
Initi
al E
valu
atio
n32
,653
6R
evam
p B
oile
r AQ
CS
Inst
rum
enta
tion
for A
ccur
ate
and
Rel
iabl
e P
roce
ss C
ontro
l39
4,43
6
7P
erfo
rm M
odifi
catio
ns to
Air
Qua
lity
Con
trol S
yste
m P
roce
ss a
nd E
quip
men
t to
Impr
ove
Rel
iabi
lity
of R
ecyc
le M
ix P
roce
ss a
nd S
lurr
y P
umpi
ng S
yste
m52
2,92
78
INTR
EX
Tub
e S
uppo
rt M
odifi
catio
ns a
nd A
sh F
low
Mod
elin
g38
0,48
39
Win
d bo
x R
efra
ctor
y R
epla
cem
ent a
nd D
ampe
r Mod
ifica
tions
152,
419
10R
epla
ce R
ear w
all D
rag
Cha
in S
lide
Gat
es14
4,51
211
Upg
rade
Boo
ster
Blo
wer
Bea
rings
& In
stal
l Sta
rtup
Bur
ner I
nstru
men
ts12
6,08
3
12E
valu
ate,
Mod
ify, a
nd R
epai
r the
Stri
pper
Coo
ler I
nlet
and
Cyc
lone
Inle
t Exp
ansi
on J
oint
s78
1,45
713
Ref
ract
ory
Upg
rade
and
Spr
ay W
ater
Noz
zle
Mod
ifica
tions
to S
tripp
er C
oole
rs23
4,55
414
Upg
rade
Fly
Ash
Val
ves
and
Bed
Ash
Blo
wer
Sol
e P
late
s 18
6,42
015
Rep
lace
Fai
led
Crit
ical
Pip
e S
uppo
rts39
9,93
016
Inst
all B
oile
r Mai
nten
ance
Hoi
st a
nd P
latfo
rms
386,
765
17C
onst
ruct
ion
Pun
chlis
t, Tu
rnov
er D
ocum
enta
tion
359,
290
Tota
l Pha
se 1
Cap
ital I
mpr
ovem
ents
Pro
ject
s$5
,697
,156
Uni
t 2 C
FB B
oile
r and
AQ
CS
Pha
se 1
Cap
ital C
osts
Pag
e 1
of 2

JEA
NO
RTH
SID
E R
EPO
WER
ING
PR
OJE
CT
Phas
e 2
Cap
ital I
mpr
ovem
ent P
roje
cts
Item
#Pr
ojec
t Des
crip
tion
Act
ual C
osts
1A
QC
S P
roce
ss Im
prov
emen
ts72
1,54
52
Impr
ove
Rel
iabi
lity
of B
ed A
sh a
nd F
ly A
sh V
alve
s11
1,70
2
3A
bove
Bed
Bur
ners
, IN
TRE
X T
ubes
and
Fur
nace
Grid
Noz
zle
Rep
lace
men
t; al
so, P
erfo
rm
Inte
rim IN
TRE
X M
odifi
catio
ns to
Miti
gate
Tub
e Fa
ilure
s.3,
513,
713
4D
CS
, BO
P P
roje
cts,
Bla
ck B
elt S
tudy
, and
Tur
nove
r Doc
umen
tatio
n1,
195,
852
5M
odify
Lim
esto
ne S
ilo O
utle
t and
Lim
esto
ne M
eter
ing
Equ
ipm
ent t
o Im
prov
e Fl
ow C
ontro
l and
S
tabi
lity
725,
220
6E
nhan
cem
ent t
o A
sh T
rans
port
and
Ash
Pro
cess
ing
Sys
tem
s87
0,10
6
Tota
l Pha
se 2
Cap
ital I
mpr
ovem
ents
Pro
ject
s$7
,138
,138
Uni
t 2 C
FB B
oile
r and
AQ
CS
Pha
se 2
Cap
ital C
osts
Pag
e 2
of 2